Article

Phase-Type Survival Trees to Model a Delayed Discharge and Its Effect in a Stroke Care Unit

1
Faculty of Information & Communication Technology, University of Malta, MSD 2080 Msida, Malta
2
School of Computing, University of Ulster, Co. Londonderry, Coleraine BT52 1SA, UK
3
Faculty of Computing, Engineering and the Built Environment, University of Ulster, Co. Londonderry, Coleraine BT52 1SA, UK
4
College of Medicine and Health Sciences, Queen’s University, Belfast BT7 1NN, UK
5
Faculty of Health Sciences, University of Malta, MSD 2080 Msida, Malta
6
Faculty of Engineering, University of Malta, MSD 2080 Msida, Malta
*
Author to whom correspondence should be addressed.
Algorithms 2022, 15(11), 414; https://doi.org/10.3390/a15110414
Submission received: 14 July 2022 / Revised: 29 October 2022 / Accepted: 29 October 2022 / Published: 5 November 2022
(This article belongs to the Special Issue Process Mining and Its Applications)

Abstract

:
The problem of hospital patients’ delayed discharge or ‘bed blocking’ has long been a challenge for healthcare managers and policymakers. It negatively affects the hospital performance metrics and has other severe consequences for the healthcare system, such as affecting patients’ health. In our previous work, we proposed the phase-type survival tree (PHTST)-based analysis to cluster patients into clinically meaningful patient groups and an extension of this approach to examine the relationship between the length of stay in hospitals and the destination on discharge. This paper describes how PHTST-based clustering can be used for modelling delayed discharge and its effects in a stroke care unit, especially the extra beds required, additional cost, and bed blocking. The PHTST length of stay distribution of each group of patients (each PHTST node) is modelled separately as a finite state continuous-time Markov chain using Coxian-phase-type distributions. Delayed discharge patients waiting for discharge are modelled as the Markov chain, called the ‘blocking state’ in a special state. We can use the model to recognise the association between demographic factors and discharge delays and their effects and identify groups of patients who require attention to resolve the most common delays and prevent them from happening again. The approach is illustrated using five years of retrospective data of patients admitted to the Belfast City Hospital with a stroke diagnosis.

1. Introduction

The problem of the delayed discharge or ‘bed blocking’ [1,2,3,4,5,6,7,8] of elderly patients in hospitals has long been a challenge for healthcare managers and policymakers [9]. For example, Ref. [10] reported that from 1988–1989, delayed discharge cost the NHS one million pounds per day. The literature considers it in epidemiology due to its detrimental effects on care systems [11]. Delayed discharge negatively affects the hospital performance metrics [5] and has other severe consequences for the healthcare system, such as bed blocking and adversely affecting patients’ health. For example, Ref. [9] found that in the district hospital, which they considered for their study, 36.7% of elderly patients had delayed discharge. Among these delayed discharge patients, a large number of patients (25.9%) experienced delayed discharge because private nursing homes or residential home beds were not available. In 2003, Ref. [12] reported that the single most significant reason for delayed discharge (26% of all delayed discharged patients) was awaiting the availability of a private nursing home or residential home beds. Other reasons for the delayed discharge were waiting for pre-discharge assessments for further therapy needs, additional NHS care, funding, domiciliary care, and other reasons, including transport, rehabilitation, or family reasons [9,12]. Ref. [9] also reported that 8.6% of delayed discharge patients died, and 12% developed a medical condition while awaiting discharge. Patients also have stress and anxiety about their future and feel unsupported when their discharge is delayed [13]. Ref. [14] analyzed the causes of discharge delays and mitigation measures. Many studies demonstrated a direct relationship between discharge delays and increased mortality rates in the UK [15] and EU countries [16,17,18,19]. Prompt recognition of the discharge delays and correctly estimating their impact is challenging [5].
Discharge delay is defined as the inappropriate use of hospital resources by patients medically fit for discharge or transfer [10,20,21,22,23]. The scoping review in [6], define discharge delay as “an instance where a medically-fit patient is needlessly kept in hospital due to internal organisational/operational factors or where a patient is flagged as in need of an alternate level of care and is delayed because of deferred transition of care and/or lack of external transfer-of-care arrangements”. In a survey carried out in six hospitals in the Netherlands, Ref. [24] found that in the average length of stay of 28 days, 36% of durations (10 days) were affected by discharge delays (the common reason was to wait for a nursing home bed). A study among patients from five brain injury treatment centres across England [23] found that one in three beds was occupied by patients whose discharge had been delayed by more than 30 days (the median delay was more than seven months). Among these patients, the discharge of 41% of patients was delayed due to the untimely availability of a suitable placement. For 31% of patients, it was due to the unavailability of post-discharge support. The average cost of a delayed discharge was £18,100 per patient, even after deducting post-discharge (Social services) costs.
Ref. [25] and, more recently, Ref. [26] emphasised determining the association between demographic factors and discharge delay to explain the reasons behind delayed discharge. In their study, Ref. [27] found that stroke patients’ discharge is more likely to get delayed, while other studies, such as [28], found that elderly (those over 75) patients are more likely to have delayed discharge. Elderly patients experience delayed discharge more as an ageing co-morbid population, so medical issues requiring longer in-hospital management will increasingly be an issue in the future. Ref. [29] presented a simple model of delayed discharge developed using the stock and flow structure in the ithink software. Ref. [30] used a logistic regression model to examine the relationship between demographic factors and reasons for delayed discharge. At the same time, Ref. [31] used the multivariate regression method to understand this association. Ref. [4] used a simulation model to understand the effect of delayed discharge in the Critical Care Unit of a large teaching hospital. Refs. [6,22,32,33] reviewed the literature to identify the causes of discharge delay. The reasons for discharge delays include lack of rehab/nursing home space [9,34,35], social isolation/lack of family support [13,17,36,37,38], inadequate social services [18,39], conflict of interest [40,41], procedural delays [41,42], confusion and redundancy [42,43], inadequate discharge planning [44], and patient’s age [1,8].
The impact of discharge delays includes bed blocking [5,35,45,46], overcrowding [1,5,8], and increased costs [42,46,47,48,49].

2. Materials and Methods

The discharge destinations play a crucial role as a factor in discharge delays. Therefore, we also model the discharge delays based on discharge destinations and their impact in terms of the extra beds required, additional cost, and bed blocking (overcrowding).
In our previous work [50,51,52,53,54,55,56,57,58], we proposed and validated the phase-type survival tree (PHTST)-based analysis to cluster patients into clinically meaningful patient groups and, in an extension of this approach, to examine the relationship between the length of stay in hospital and destination on discharge. This paper describes how PHTST-based clustering can be used for modelling delayed discharge and its effects in a stroke care unit. The PHTST length of stay distribution of each patient group (each PHTST node) stratified by demographic factors and their conditions diagnosed is separately modelled as a finite state continuous-time Markov chain using Coxian-phase-type distributions (C-PHDs). Delayed discharge patients waiting for discharge are modelled as a ‘blocking state’, an additional state of the Markov chain. For PHTST construction, we used splitting criteria based on the weighted-average information criterion [53].
We can use this model to recognise the association between demographic and other factors and discharge delays and their effects on the average length of stay, cost of care, etc. We can also utilise the model to identify groups of patients who require attention to resolve the most common delays and prevent them from happening again. Each patient cluster can reveal unique issues. The approach is illustrated using five years of retrospective data [59,60] for 1985 stroke patients (hemorrhagic stroke, cerebral infarction, transient ischaemic attack TIA, and unspecified stroke). The patients were admitted to the Belfast City Hospital between January 2003 and December 2007 and discharged between 9 January 2003 and 11 March 2008. No information that identified individual patients was supplied. Patients were aged between 24 years and 101 years. The length of stay (LOS) range was 0 to 1425 days, the mean LOS was 29.01 days, and the standard deviation was 52.84 days [59,60]. The underpinning phase-type model-based clusters were previously validated for these data using statistical log-rank tests for equality between survival distributions for different discharge clusters [54].
We have used our model to understand the effect of delays in discharge from the stroke unit of the Belfast City Hospital. Patients can be discharged to either private nursing homes or other destinations such as their usual residences. In addition, some patients can eventually die during their treatment. The estimated daily cost of care is calculated using estimates from [61], adjusted from 2005. We attach unit costs of £164.80 per day for stay-in acute care (phase 1) and £114.80 per day for stay-in rehabilitative care or long-stay care (phases 2–4).
The following section describes the methodology used, including the description of the phase-type distributions, phase-type survival trees, and their mathematical foundation. The third section elaborates on the results, followed by a discussion and the conclusion sections.

2.1. Phase Type Survival Tree (PHTST)

Phase-type distributions are a preferred choice to fit the spell length of stay data [62,63], thanks to their memoryless property and ability to provide an intuitive description of the patient flow in a care system. A PHTST is constructed by recursively partitioning patient length of stay data into subgroups (or clusters) based on covariates maximising within-node homogeneity based on splitting criteria [53]. These covariates represent patient’’ characteristics such as gender, age at admission, and disease (diagnosed) available in the dataset used and have previously been identified in the literature and anecdotally as useful [52,54,60,64]. Each cluster is separately fitted to the C-PHDs [62,63]. C-PHDs model a patient’s journey through the care system as an n-state continuous time-absorbing Markov chain (Figure 1) with a single absorbing state. These partially observable states represent stages through the time spent in the hospital before discharge or death. This single absorbing state might cover both death and discharge, making the model focussed on the institution (e.g., capacity, costs) as patient-centred. Therefore, the community care-centred perspectives would consider multiple absorbing states in Section 2.3 (extended PHTST) and Section 2.4.2 (multi-absorbing state). A patient can be admitted to the hospital in the first state and then sequentially move to the next state with a transition rate λi. (i = 1,2,…n), constituting movement from any state i to the absorbing state (representing death or discharge from hospital) n + 1 with transition rate μi. The transition matrix Q for the absorbing Markov chain can be defined as follows:
Q = λ 1 + μ 1 λ 1 0 0 0 μ 1 0 λ 2 + μ 2 λ 2 0 0 μ 2 0 0 0 λ n 1 + μ n 1 λ n 1 μ n 1 0 0 0 0 μ n μ n 0 0 0 0 0 0
The time spent in the hospital before discharge or death has the probability density function:
f t = p exp Q t q
where the row vector p of size (n + 1) is:
p = 1 0 0   0 0
Q represents the initial patient” distribution, and column vector q, representing absorption rates, is defined as follows:
q = μ 1 μ 2 μ n μ n + 1 T .
The log-likelihood function is defined as follows [63]:
Log   likelihood = i = 1 N log p exp Q t i q   .
where N is the total number of patients.
Figure 1. A patient pathway as an n-state absorbing Markov chain.
Algorithms 15 00414 g001
Splitting criteria
A partition maximising within-node homogeneity at each node is selected based on a splitting criterion. There are several splitting criteria available to use [53], such as the criteria based on the maximum likelihood ratio, the criteria based on Akaike Information Criterion [65], the criteria based on Schwartz Bayesian Information Criterion [66], the criteria based on Corrected AIC [67], the criteria based on Corrected BIC [68], and the criteria based on the weighted-average information criterion [69]. Ref. [53] critically assessed each of these splitting criteria. It found that the splitting criteria based on the Weighted-Average Information Criterion (WIC) outperforms other splitting criteria listed here with both small and large sample sizes and also in situations where the sample size is unknown [69,70]. Therefore, we will use WIC-based splitting criteria to construct PHTST. The WIC for the fit of a node can be defined as follows [53,69]:
WIC = 2 Log   likelihood + d f + d f log ( N 1 log ( N ) N d f + 1 ) 2 + 2 N N + d f + 1 2 N + log ( N N d f + 1 ) N d f + 1
where df is the degree of freedom (or the number of free parameters required to be estimated), and df = 2n − 1, with n being the number of phases in the C-PHD model (we have used phase and states interchangeably in the paper). Here, we model the discharge delay unrelated to the patient’s discharge destination, i.e., mainly due to the hospital environment rather than the proposed destination. N is the total number of patients, and Log-likelihood is calculated in (5).

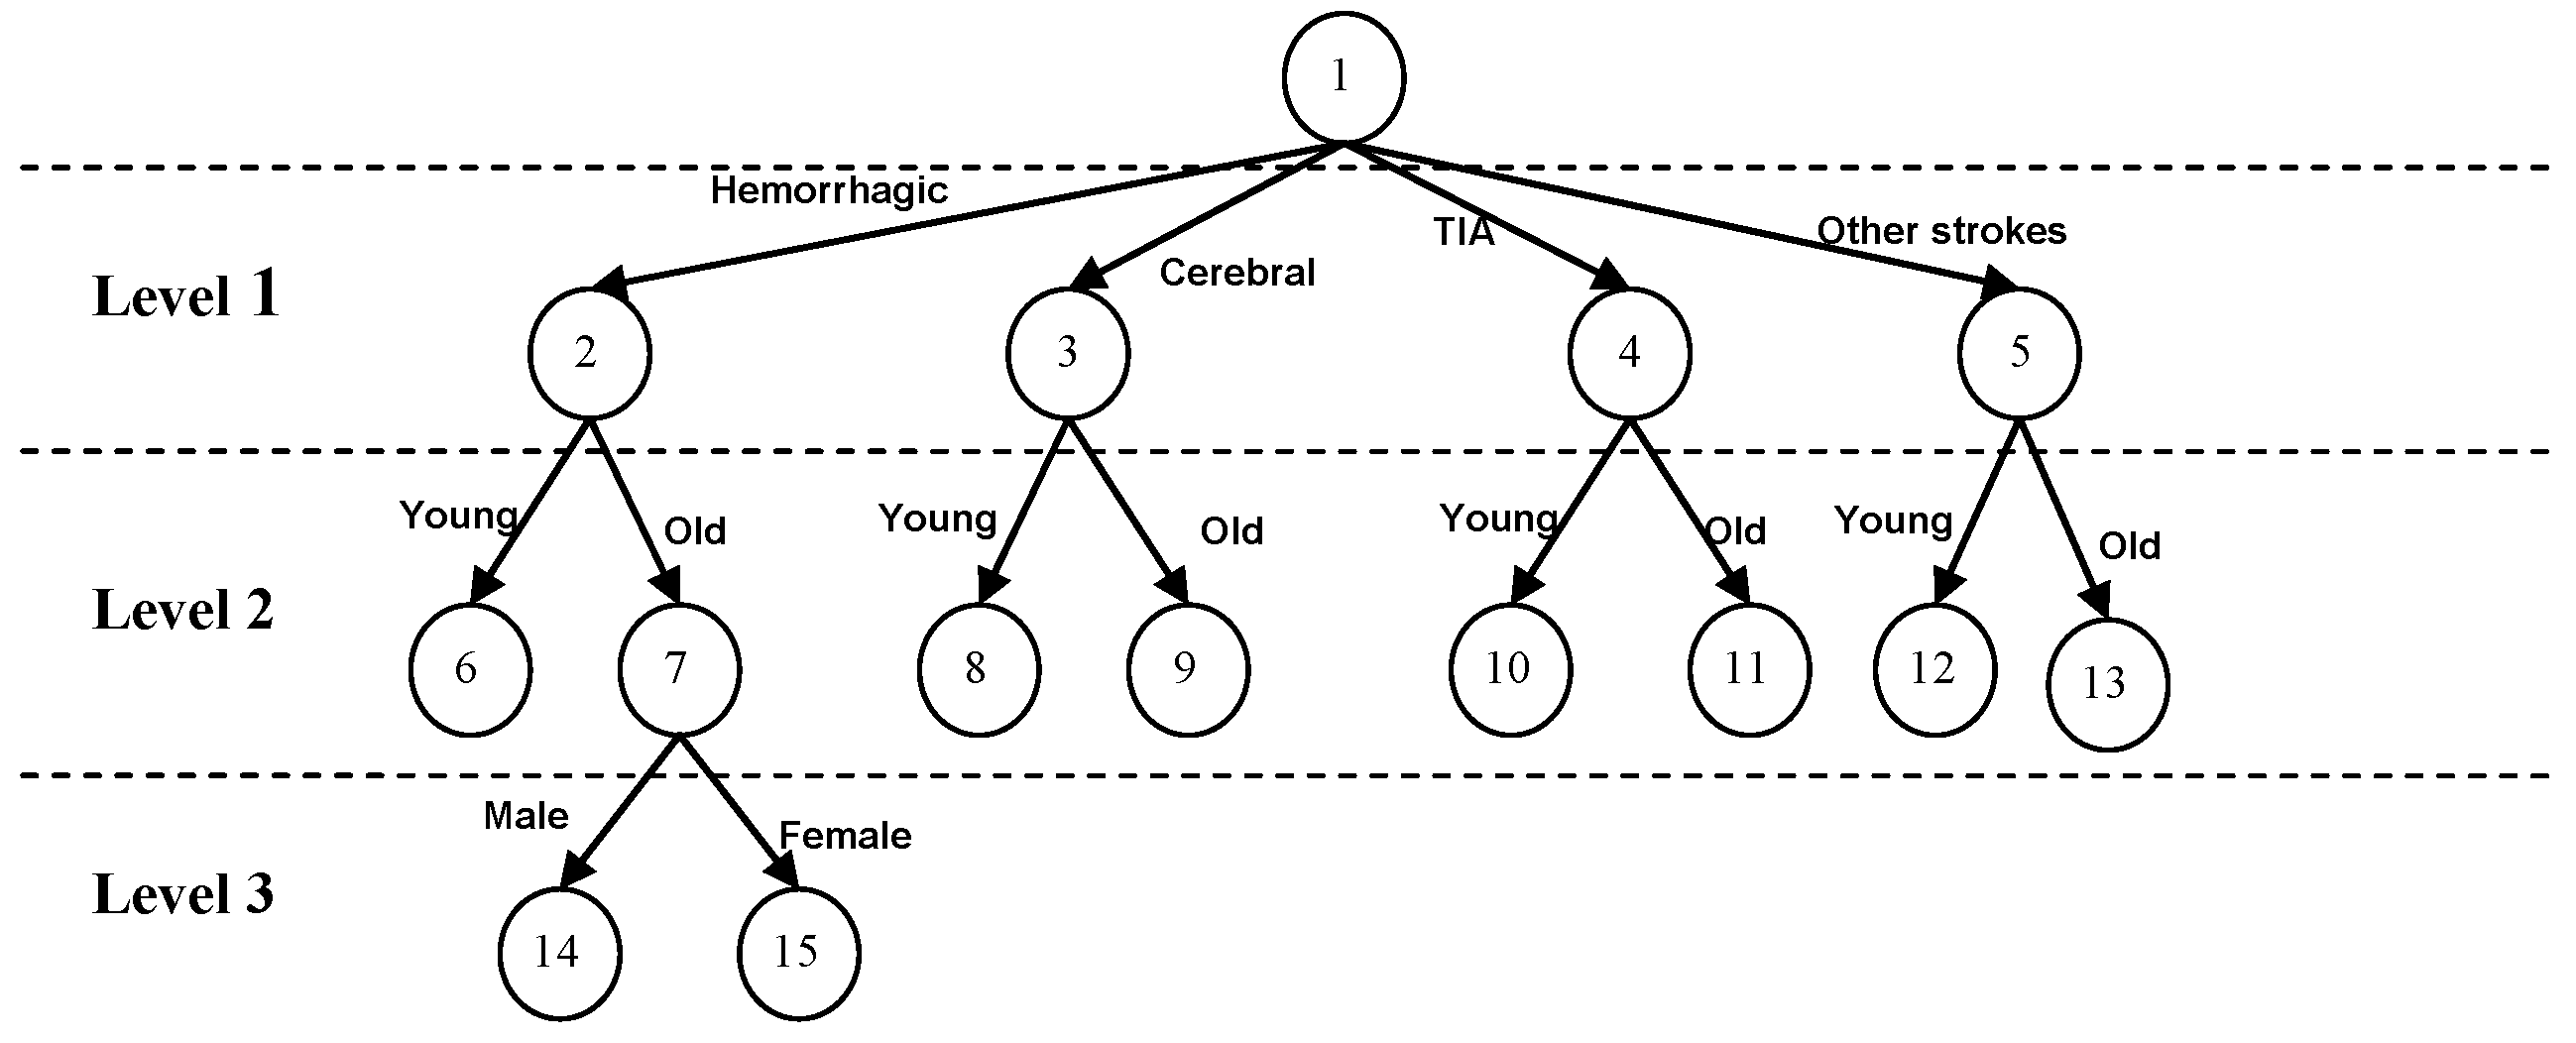
2.2. PHTST Construction
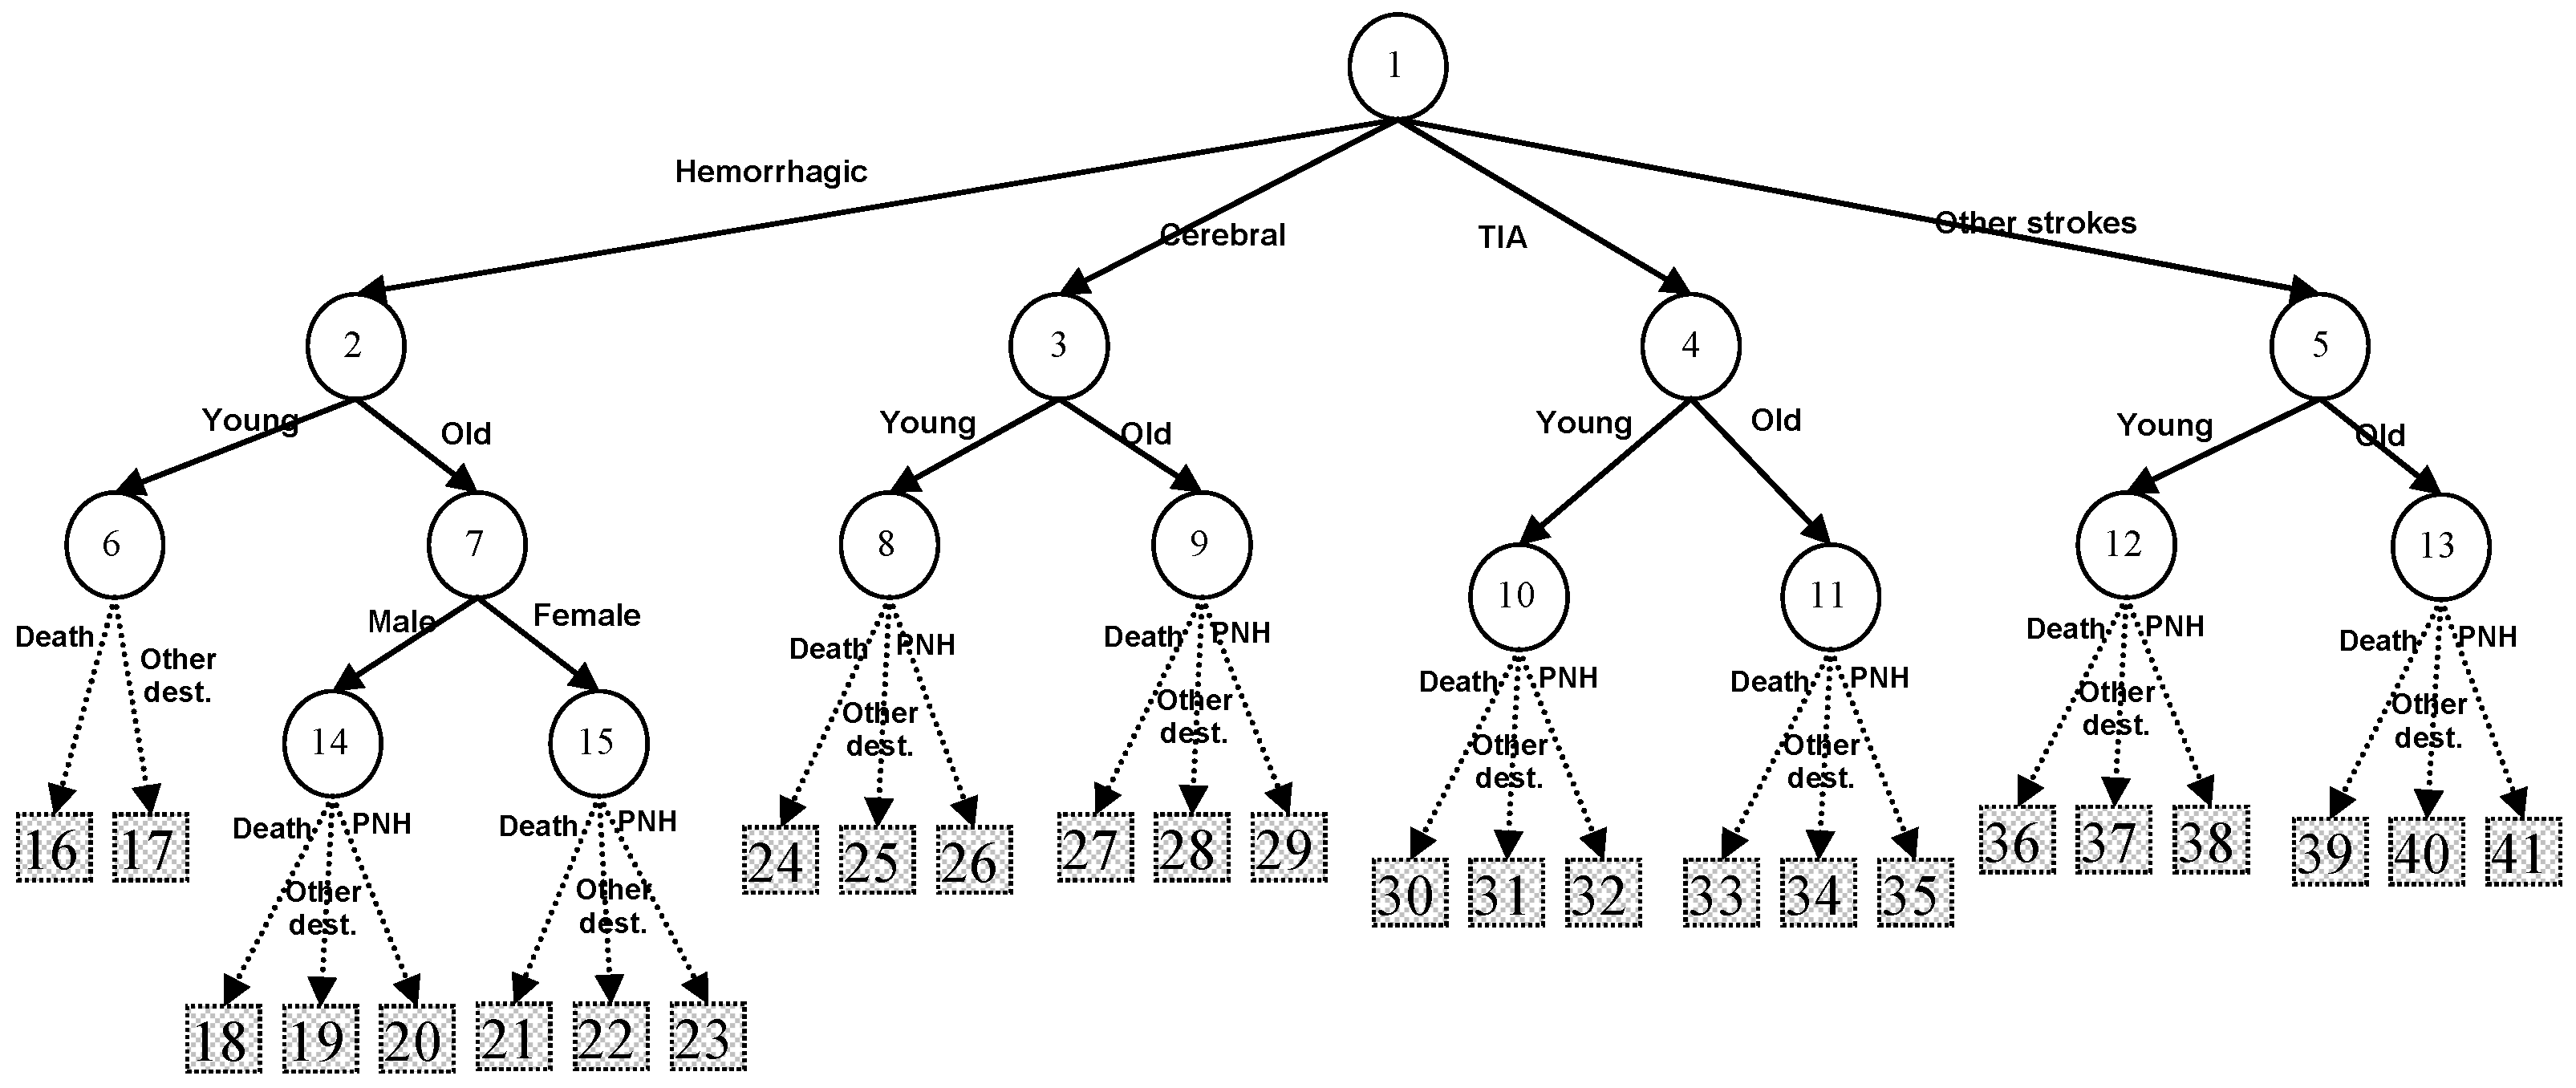
PHTST is constructed by recursively partitioning nodes into more homogeneous subgroups based on covariates representing patient characteristics such as age, gender, and disease diagnosed. A split, minimising WIC is selected to partition the node into child nodes at each branch. If no split improves WIC, the node is designated as a terminal node. Figure 2 is the schematic representation of the phase-type survival tree constructed using the WIC-based splitting criteria for the length of stay data on stroke patients from the Belfast City Hospital. Table 1 lists nodes of the tree and possible splits of these nodes. The total value of WIC for all the terminal nodes of the survival tree is 16,478.75, and the total improvement in the WIC is 368.98. For the root node, WIC is 16,847.73.

2.3. Extended PHTST

To construct extended PHTST (ePHTST), we further grow the PHTST by partitioning the terminal nodes into subgroups with more homogeneous patient pathways based on covariates representing outcome measures such as the discharge destination. Although the discharge destination information is unavailable at the time of admission, we can assign the probability to each discharge destination using cohort analysis. Figure 3 is the schematic representation of the ePHTST for the length of stay data constructed using the WIC-based splitting criteria. The resulting tree now has 26 terminal nodes. Table 2 lists the original terminal nodes of the tree and possible splits of these nodes by the covariate discharge destination. The total improvement in the WIC is 218.943. The total value of the WIC of the extended tree in Figure 3 is 16,259.8, and the total value of the WIC of the survival tree in Figure 2 is 16,478.75.

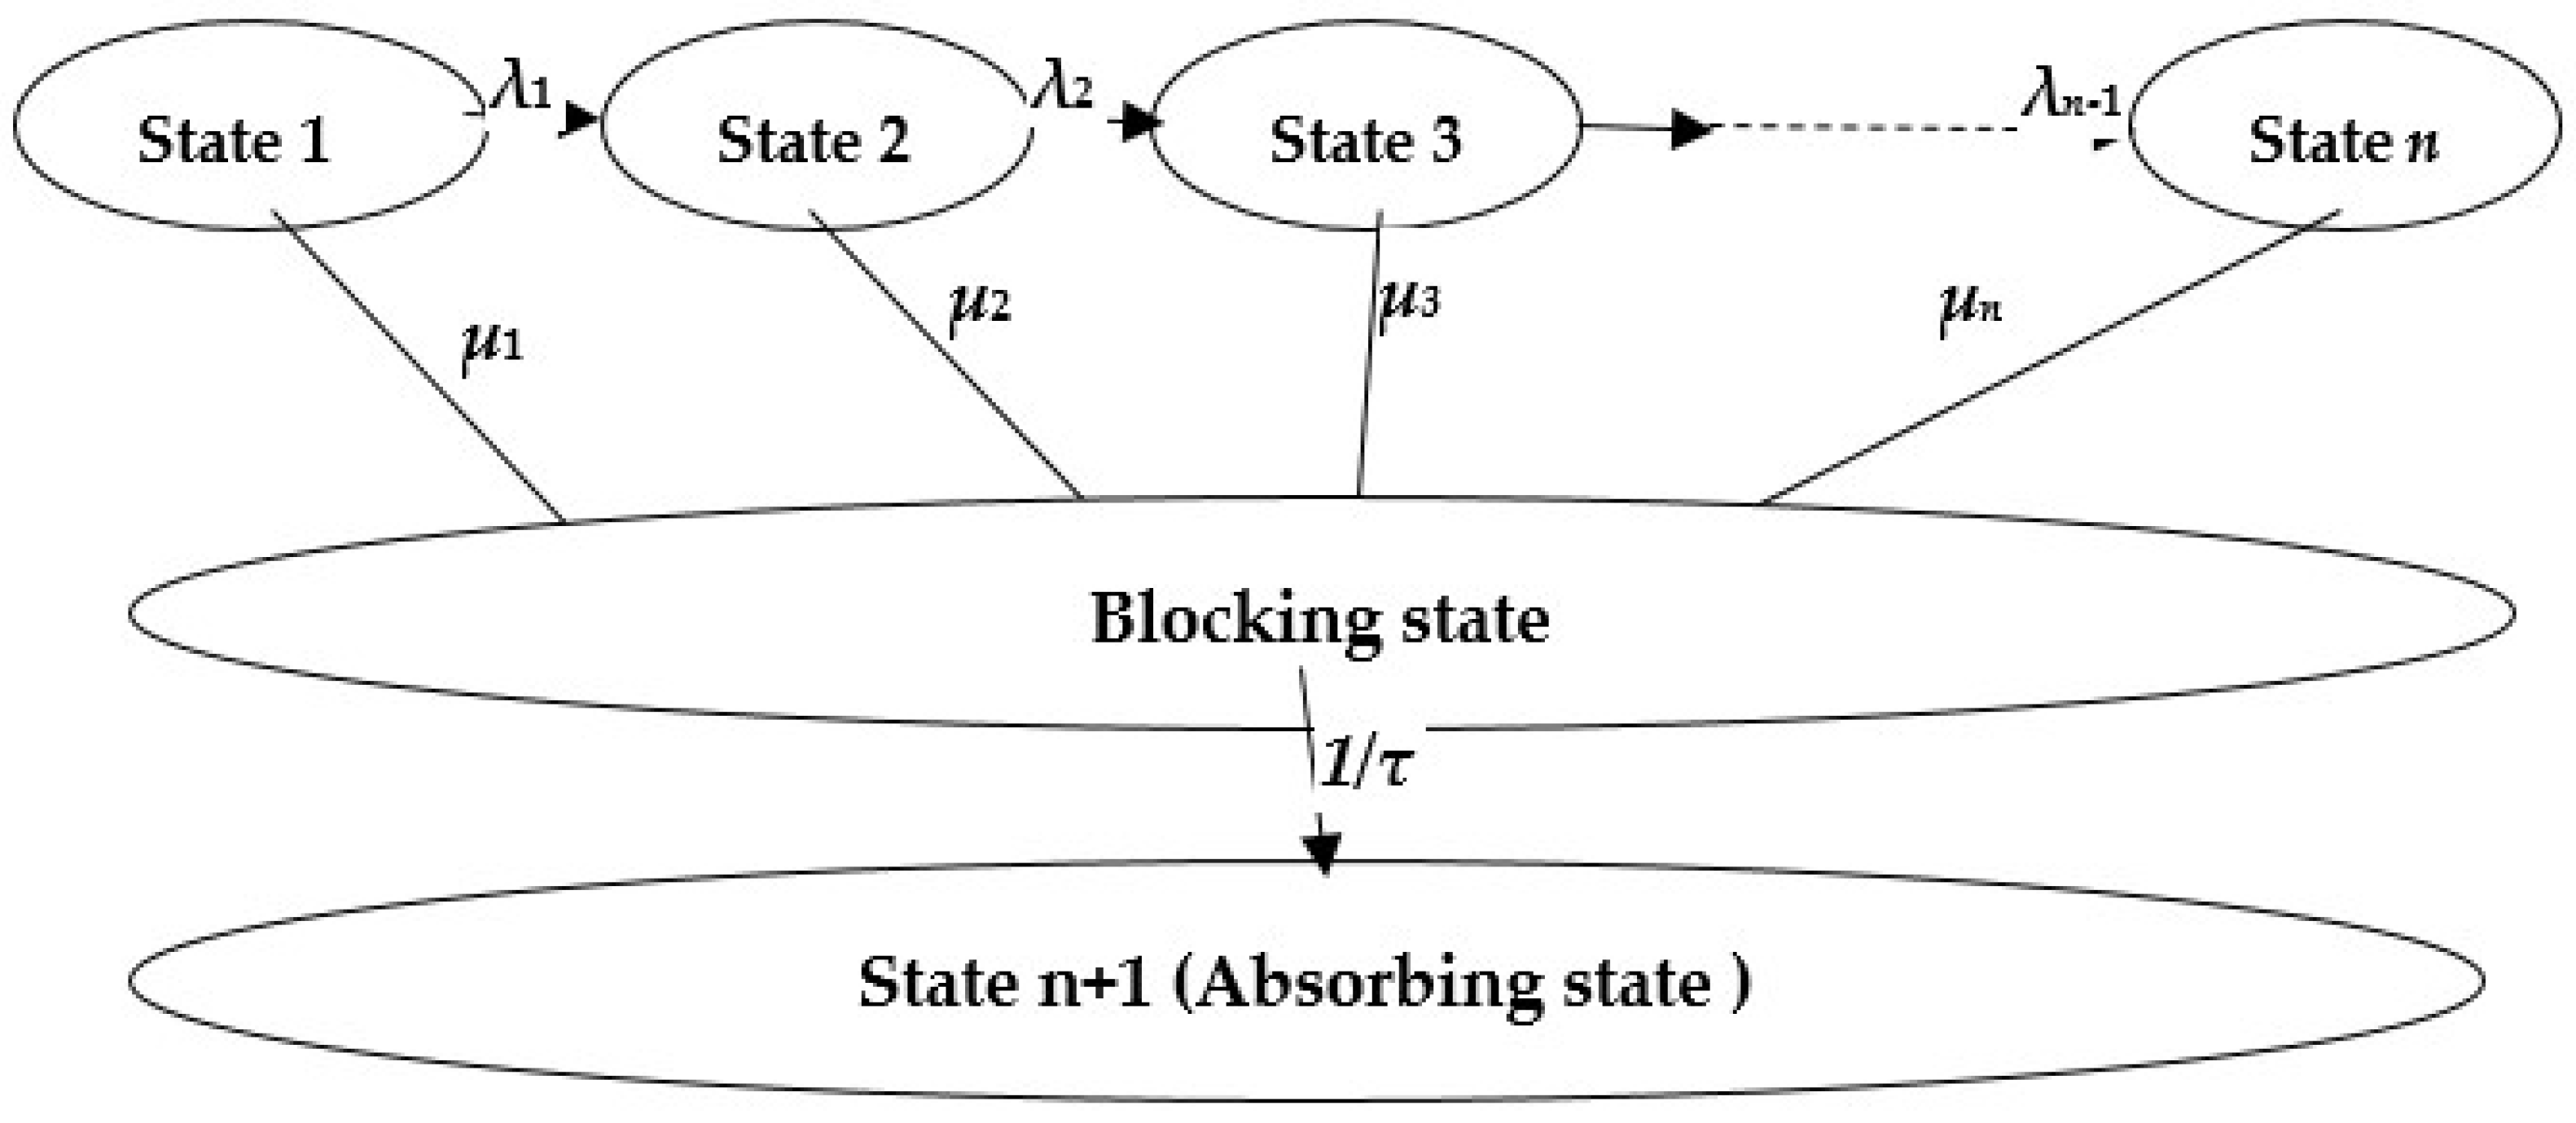
2.4. Modelling Blocking State

Delayed discharge patients waiting for discharge can be modelled as being in a special state of the finite state continuous time absorbing Markov chain modelling the length of stay of the group of patients. This special state is called the ‘blocking stat’, which represents the clinical state of “awaiting” or “ready” for “discharge”. A cluster represented by a terminal node of ePHTST generated as a result of a split of a terminal node of PHTST by the covariate discharge destination is considered a single ‘absorbing state cluster’, as all patients in the cluster are expected to discharge to the same destination. Suppose a cluster represented by a terminal node of ePHTST or a terminal node of PHTST is considered a multi-absorbing state. In that case, cluster patients may expect to be discharged to different destinations. All terminal nodes in the ePHTST of Figure 3 represent single-absorbing state clusters, and no cluster in the ePHTST has multi-absorbing states. In the following section, we will first model the blocking state for single-absorbing state clusters of ePHTST and then extend our model for ePHTST clusters with multi-absorbing states.

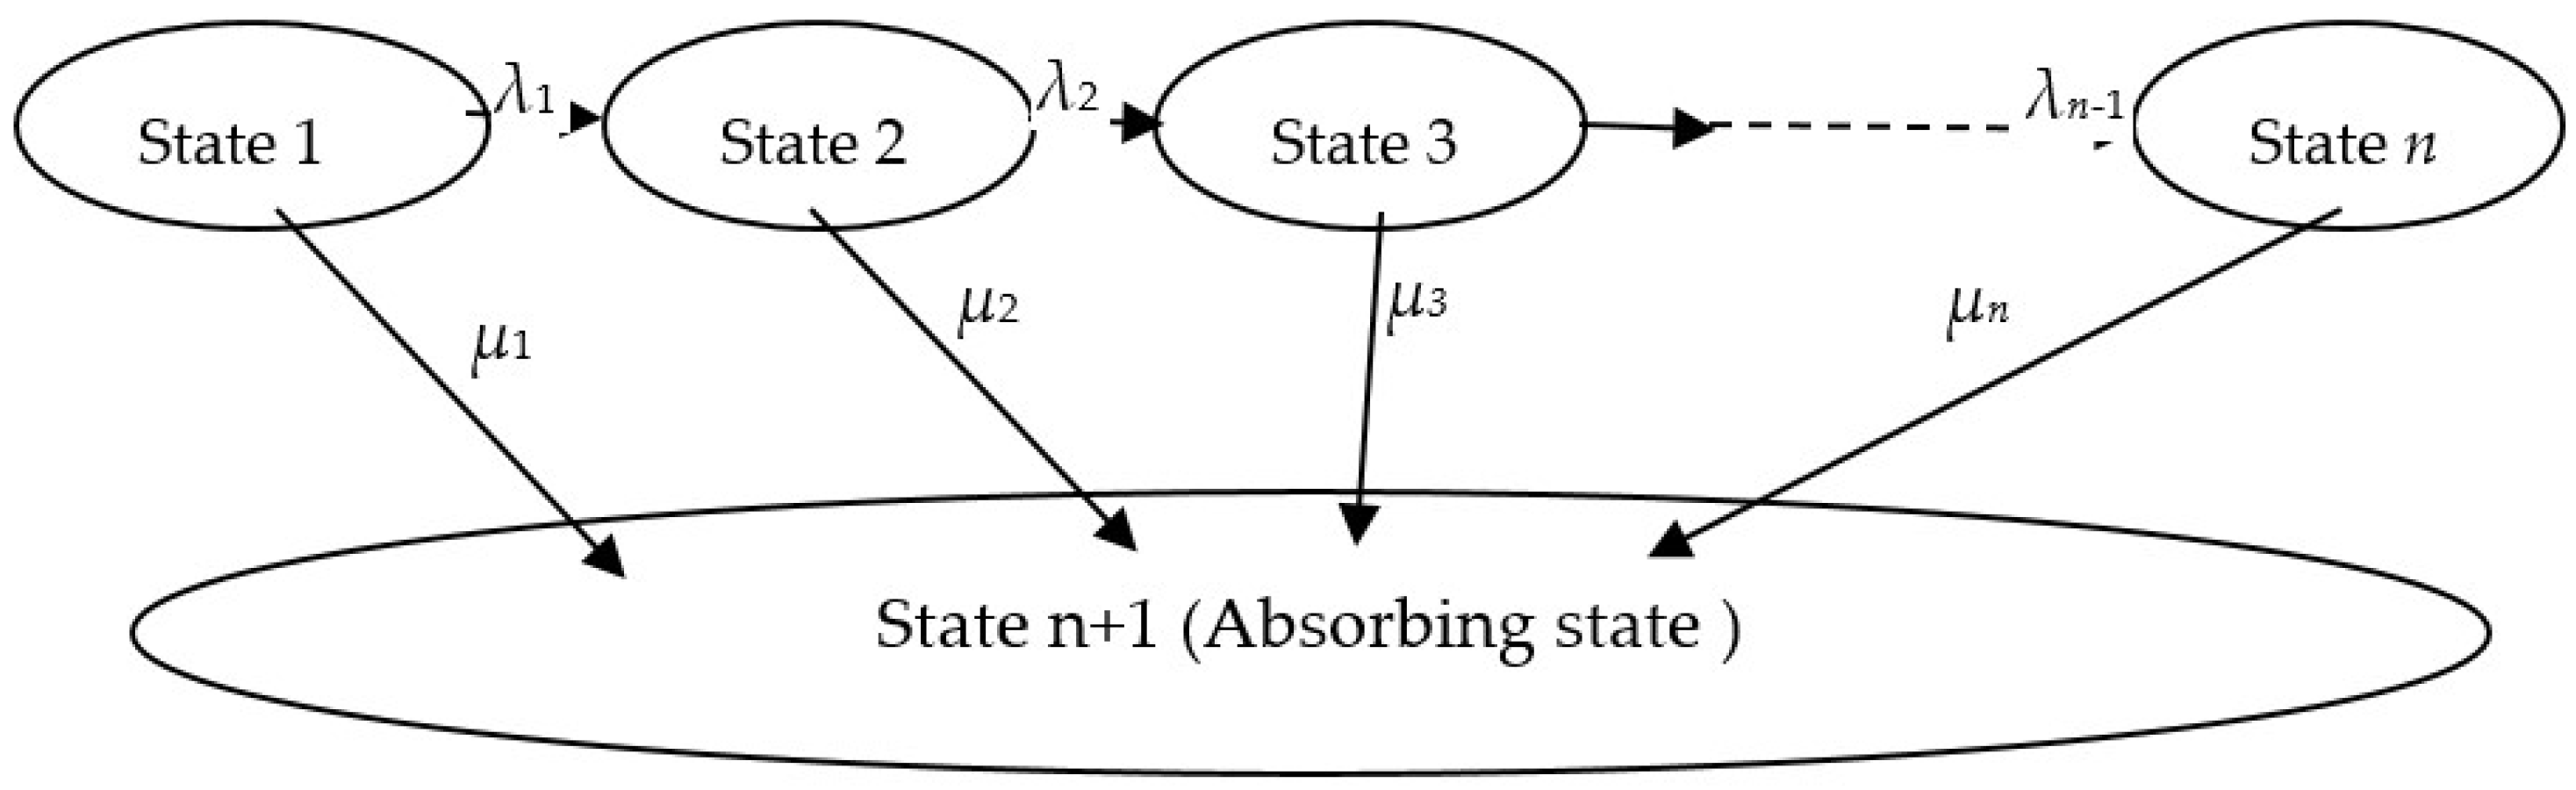
2.4.1. Single-Absorbing State

A patient pathway represented by a cluster of the ePHTST having a blocking state with a single-absorbing state can be modelled as an n + 1 state absorbing Markov chain (See Figure 4). There will be no blocking state for the cluster representing the discharge destination ‘death’. The transition matrix Q for the absorbing Markov chain can be defined as follows:
Q = λ 1 + μ 1 λ 1 0 0 0 μ 1 0 0 λ 2 + μ 2 λ 2 0 0 μ 2 0 0 0 0 λ n 1 + μ n 1 λ n 1 μ n 1 0 0 0 0 0 μ n μ n 0 0 0 0 0 0 1 τ 1 τ 0 0 0 0 0 0 0
Here, μ i is the transition rate from the transient state i (i = 1,2,……, n) to the blocking state, λi represents the transition rate from the transient state i to the next transient state i + 1, and τ is the waiting time in the blocking state.
Figure 4. Schematic representation of single absorbing state process with the blocking state.
Algorithms 15 00414 g004
The initial distribution (at time t = 0) of patients in each state is represented by vector s0 and is defined as follows:
s 0 = s 0 , 1 ,   s 0 , 2 ,   s 0 , 3 , ,   s 0 , n ,   s 0 , n + 1 ,   s 0 , n + 2   .
where s0,i is the initial (at t = 0) number of patients in state i. s0,n+2 represents the initial number of patients in the absorbing state.

2.4.2. Multi-Absorbing State

A cluster representing pathways with more than one absorbing state can have one blocking state if all patients delay by the same duration, and the transition matrix Q for the absorbing Markov chain for such a cluster can then be represented as follows:
Q = λ 1 + i = 1 m μ 1 , i λ 1 0 0 0 i = 1 m 1 μ 1 , i 0 0 μ 1 , m 0 λ 2 + i = 1 m μ 2 , i λ 2 0 0 i = 1 m 1 μ 2 , i 0 0 μ 2 , m 0 0 0 λ n 1 + i = 1 m μ n 1 , i λ n 1 i = 1 m 1 μ n 1 , i 0 0 μ n 1 , m 0 0 0 0 i = 1 m μ n , i i = 1 m 1 μ n , i 0 0 μ n , m 0 0 0 0 0 1 τ j = 1 n μ j , 1 τ j = 1 n i = 1 m 1 μ j , i j = 1 n μ j , 2 τ j = 1 n i = 1 m 1 μ j , i 0 0 0 0 0 0 0 0 0 0 0 0 0 0 0 0 0 0 0 0 0 0 0 0 0 0
where μ i , j is the rate of transition (or absorption) from the transient state i (i = 1,2,……, n) to the absorbing state j (j = 1,2,……, m), assuming there is no blocking state, λi represents the rate of transition from the transient state i to the next transient state i + 1, and τ is the waiting time in the blocking state. A cluster representing pathways with m absorbing states can have m − 1 blocking states if patient delay depends on the discharge destination. Here, we assume that the absorbing state m represents death, and there is no delay and thus no blocking state for patients who die in the hospital. The transition matrix Q for the absorbing Markov chain for such a cluster can then be represented as follows:
Q = λ 1 + i = 1 m μ 1 , i λ 1 0 0 0 μ 1 , 1 μ 1 , 2 μ 1 , m 1 0 0 0 μ 1 , m 0 λ 2 + i = 1 m μ 2 , i λ 2 0 0 μ 2 , 1 μ 2 , 2 μ 2 , m 1 0 0 0 μ 2 , m 0 0 0 λ n 1 + i = 1 m μ n 1 , i λ n 1 μ n 1 , 1 μ n 1 , 2 μ n 1 , m 1 0 0 0 μ n 1 , m 0 0 0 0 i = 1 m μ n , i μ n , 1 μ n , 2 μ n , m 1 0 0 0 μ n , m 0 0 0 0 0 1 τ 1 0 0 1 τ 1 0 0 0 0 0 0 0 0 0 1 τ 2 0 0 1 τ 2 0 0 0 0 0 0 0 0 0 1 τ m 1 0 0 1 τ m 1 0 0 0 0 0 0 0 0 0 0 0 0 0 0 0 0 0 0 0 0 0 0 0 0 0 0 0 0 0 0 0 0 0 0 0 0 0 0 0 0 0 0 0 0 0
where μ i , j is the rate of transition (or absorption) from the transient state i (i = 1,2,……, n) to the absorbing state j (j = 1,2,……, m), assuming there is no blocking state, which is essentially equal to the transition rate to the blocking state j (j = 1,2,……,m − 1). λi represents the transition rate from the transient state i to the next transient state i + 1. τj is the waiting time in the blocking state j. The absorbing state m represents death; thus, there is no blocking state corresponding to the absorbing state m.

3. Results

To evaluate our proposed approach, we applied it to the data collected from the stroke unit of the Belfast City Hospital.

3.1. The Stroke Unit of the Belfast City Hospital

As discussed in the introduction, the primary reasons for discharge delays are related to discharge destinations, such as a lack of rehab/nursing home space, social isolation/lack of family support, and inadequate social services. Therefore, we also model the discharge delays based on the discharge destination. Consequently, we will first model without clustering based on discharge destinations. Then we will model patient clusters based on their discharge destinations: (i) the cluster of patients discharged to the nursing homes and (ii) the cluster of patients discharged to other destinations such as the patient’s usual or family residence. The impact of discharge delays includes bed blocking, overcrowding, and increased costs. Here, the discharge destinations play a crucial role as a factor in discharge delays. Therefore, the impact is measured in terms of extra beds required, additional cost, and bed blocking (overcrowding).

3.1.1. Discharge Delay Distribution without Clustering Based on Discharge Destinations

Here, we model the discharge delay unrelated to the patient’s discharge destination, i.e., mainly due to the hospital environment rather than the proposed destination. In Figure 5, we can see that the estimated blocking state size increases linearly with the increase in the discharge delay if the mean discharge delay is the same for all patients (expected to be discharged to either private nursing homes or other destinations). In addition, the estimated blocking state size grows exponentially with an increasing duration (number of days) since the first patient gets delayed and fast approaches an asymptotic value. Blocking states for both types of patients, expecting to be discharged to a private nursing home or other destinations, follow the same pattern (See Figure 6). Figure 6 shows the proportion of patients in the blocking state expected to be discharged to each destination for the mean discharge delay (τ) of 10 days. This proportion remains constant irrespective of the mean discharge delay. Figure 7 shows the proportion of patients in the blocking state expected to be discharged from each phase of the stroke care unit for the mean discharge delay of 10 days. Again, the proportion remains constant irrespective of the mean discharge delay. The estimated number of additional beds required by the delayed discharge patients increases linearly with the mean discharge delay (See Figure 8) irrespective of the duration (number of days) since the first patient was delayed.
The growth rate of the blocking state size and, therefore, the expected number of additional beds (Figure 9) and expected daily cost required (Figure 10), are different for patients discharged to different destinations. The estimated proportion of beds occupied by delayed discharge patients (with respect to the total bed requirement of the stroke care unit) is shown in Figure 11. The estimated proportion of delayed discharge patient’’ costs follows almost the same pattern as shown in Figure 12. On the other hand, the estimated number of additional beds required by patients discharged from different phases varies (see Figure 13). Therefore, the additional cost incurred by patients discharged from different phases is different (see Figure 14). Figure 15 shows that the estimated daily cost of care of patients in the stroke care unit expected to be discharged to each destination grows in a negative exponential fashion with the increasing number of days since the first patient gets delayed. The estimated cost of care for patients expected to be discharged from each phase also grows exponentially with the increasing number of days since the first patient gets delayed (see Figure 16). The proportion of the estimated cost of care of patients expected to be discharged from each blocking state phase is the same as that of patients in each stroke care unit phase (see Figure 15 and Figure 16).

3.1.2. Discharge Delay for the Patients Expected to Be Discharged to Private Nursing Homes

Figure 17 and Figure 18 show that the estimated number of patients in the blocking state and, therefore, the daily cost of care of patients in the blocking state expected to be discharged to private nursing homes grows exponentially with time. Figure 18 also shows how this cost will be distributed among patients expected to be discharged from each phase of the stroke care unit. Figure 17 and Figure 19 show an almost linear growth in the estimated daily care cost of patients expected to be discharged to private nursing homes, with the increase in the mean discharge delay and the cost distribution among patients expected to be discharged from each phase of the stroke care unit.

3.1.3. Discharge Delay with the Patients Expected to Be Discharged to Other Destinations

Figure 20 and Figure 21 show that the estimated number of patients in the blocking state and, therefore, the daily cost of care of patients in the blocking state expected to be discharged to other destinations grows exponentially with time. Figure 21 shows how this cost will be distributed among patients expected to be discharged from each phase of the stroke care unit. Figure 20, Figure 21 and Figure 22 show that the estimated daily cost of care for patients expected to be discharged to other destinations grows almost linearly with the increase in the mean discharge delay. Figure 21 and Figure 22 also show the cost distribution among patients expected to be discharged from each phase of the stroke care unit.

4. Discussion

The first contribution of this paper is to illustrate a stochastic model of blocking states and delayed discharge and its effects in a care unit. It models the process dynamics of a care system more realistically by representing the patient journey through the care system as a finite state continuous-time Markov chain. It has better explainability to healthcare professionals as the blocking state is modelled as a partially observable state of a continuous Markov chain exhibiting the stochastic nature of discharge delay. Another contribution is the PHTST-based model for analysing the effects of individual clusters and their interactions with the whole stroke care unit. We can also use the model to determine the association between demographic factors and the impact of a discharge delay. This information can identify the reasons for discharge delay and develop better solutions to minimise discharge delay. We can also use it to estimate the effects of demographic change in the patient population on discharge delay and its impact and continually review the trends in discharge delay to resolve these. The model helps recognise groups of patients who require attention by determining the most common delays, identifying the groups with high discharge delays or highly impacted by them and preventing such delays from happening again. The information about the cost of discharge provided by our model helps health managers and policymakers to plan and allocate budgets for alternate solutions. These novel models can estimate discharge delays and their impact, as seen in the results section. They can also help to monitor the healthcare service delivery continuously and promptly recognise discharge delays or changes in the healthcare process dynamics by using the models to identify when such problems are developing. For example, the higher actual length of stay distribution than the distribution estimated by our models indicates a higher discharge delay. However, there is a lack of comparable models in the literature. Most of the delayed discharge analysis is based on the identified delays. It needs a rigorous analysis of medical records. In contrast, we here demonstrate how the model projections, such as those provided in the previous section, can identify when such problems develop and facilitate corrective intervention.
More sophisticated models are needed to analyse more realistic scenarios. For example, if the discharge delay is due to constrained bed availability in private nursing homes and only a fixed number of beds are available in a given duration. Another scenario is constrained resource availability for assessing patients for their suitability for discharge (irrespective of their expected discharge destinations), and a fixed number of patients can be assessed in a given duration. Another possible scenario is constrained resource availability for assessment of care support (i.e., care package) requirements for patients expected to be discharged to their usual homes or other destinations.
These models consider long-term averages (expected values) and incorporate the variability only based on known covariates and representing a realistic scenario. However, in a more sophisticated model, capturing all possible variabilities, estimating their effects, and planning resource availability incorporating them is necessary. More complex analytical models (formulating the variances to estimate the variability and its impact) or simulation models, such as discrete event simulation models proposed by [52,53,54,71], can be used to meet these objectives. Another limitation of these models is that they characterise expected discharge delays. We are presently analysing the medical records of a large cohort of patients to extract the actual delays in each patient care activity and their reason. It will help us to develop more accurate and advanced models. We can forecast the impact of a discharge delay after a given period, such as after 10 or 20 years or as the result of adding more resources, such as extra beds. Furthermore, we can use the Internet of Things (IoT) [72] and blockchain technology [73] for secure health information (medical records) collection and exchange and the tracking of each stage of patient progress through the healthcare system (hospital).

5. Conclusions

In this paper, we demonstrated the use of phase-type survival-tree-based analysis for modelling blocking states and the effect of delayed discharge in a hospital’s stroke unit. Using PHTST-based analysis, we can have more realistic deterministic models for blocking states and better estimate the effect of delayed discharge in a stroke unit by analysing the impact of individual clusters and their interactions with the whole stroke care unit. We can also use our model to monitor the trends in discharge delays continually and promptly resolve these issues. More sophisticated models are required to analyse more realistic scenarios, such as if the discharge delay is due to constrained bed availability in private nursing homes or constrained resource availability for assessing patients for their suitability for discharge. We can forecast the impact of discharge delay after a given period, such as after 10 or 20 years or as the result of adding more resources, such as extra beds. In addition, the effects of variability of expected values can be considered using more complex models (analytically formulating the variances to estimate the variability) or discrete event simulation (DES) models, such as those proposed by [52,54,71].

Author Contributions

Conceptualisation, L.G. and S.M.; methodology, L.G. and S.M.; software, L.G., B.M. and M.B.; validation, L.G., M.B. and A.M.; formal analysis, L.G. and S.M.; investigation, L.G. and S.C.B.; resources, B.M. and K.F.; data curation, K.F. and A.M.; writing—original draft preparation, L.G. and S.M.; writing—review and editing, K.F., S.C.B. and A.M.; visualisation, L.G.; supervision, S.M. and B.M.; project administration, S.M., B.M. and S.C.B.; funding acquisition, S.M., B.M., L.G. and S.C.B. All authors have read and agreed to the published version of the manuscript.

Funding

This research was partially funded by the Engineering and Physical Sciences Research Council (Grant Number EP/E019900/1 and GR/S29874/01) and the University of Malta Internal Research Grants Programme’s Research Excellence Fund (Grant Number NICE-Healthcare). Any views or opinions presented herein are those of the authors and do not necessarily represent those of funders, their associates or their sponsors.

Data Availability Statement

The authors will make the data used in this research available on request.

Acknowledgments

We acknowledge the Belfast City Hospital for providing data for this study.

Conflicts of Interest

The authors declare no conflict of interest. The funders had no role in the design of the study; in the collection, analyses, or interpretation of data; in the writing of the manuscript; or in the decision to publish the results.

References

  1. Brown, L.; Abello, A.; Thurecht, L. Length of Hospital Stay by Older Australians: Bed-Blocking or Not. National Centre for Social and Economic Modelling (NATSEM); University of Canberra: Canberra, Australia, 2011. [Google Scholar]
  2. Gaughan, J.; Gravelle, H.; Siciliani, L. Testing the Bed-Blocking Hypothesis: Does Nursing and Care Home Supply Reduce Delayed Hospital Discharges? Health Econ. 2015, 24, 32–44. [Google Scholar] [CrossRef] [PubMed] [Green Version]
  3. Griffiths, J.D.; Price-Lloyd, N.; Smithies, M.; Williams, J. A queueing model of activities in an intensive care unit. IMA J. Manag. Math. 2006, 17, 277–288. [Google Scholar] [CrossRef]
  4. Griffiths, J.D.; Jones, M.; Read, M.S.; Williams, J.E. A simulation model of bed-occupancy in a critical care unit. J. Simul. 2010, 4, 52–59. [Google Scholar] [CrossRef]
  5. Hendy, P.; Patel, J.; Kordbacheh, T.; Laskar, N.; Harbord, M. In-depth analysis of delays to patient discharge: A metropolitan teaching hospital experience. Clin. Med. 2012, 12, 320–323. [Google Scholar] [CrossRef] [PubMed]
  6. Micallef, A.; Buttigieg, S.C.; Tomaselli, G.; Garg, L. Defining Delayed Discharges of Inpatients and Their Impact in Acute Hospital Care: A Scoping Review. Int. J. Health Policy Manag. 2020, 11, 103. [Google Scholar] [CrossRef] [PubMed]
  7. Price-Lloyd, N.; Griffiths, J.D.; Williams, J.E. Modelling a Critical Care Directorate. In Proceedings of the 31st Meeting of the EURO Working Group on OR Applied to Health Services (ORAHS, 2005), Southampton, UK, 24 July–5 August 2005; p. 8. [Google Scholar]
  8. Swanson, J. Bed Blocking and the City: An Analysis of the Factors Explaining Variation in the Number of Days Associated with Specific Measures Relevant to Patient Discharges One Year after Implementation of the Coordination Reform within the Municipality of Oslo. Master’s Thesis, University of Oslo, Oslo, Norway, 2013. [Google Scholar]
  9. Jasinarachchi, K.H.; Ibrahim, I.R.; Keegan, B.C.; Mathialagan, R.; McGourty, J.C.; Phillips, J.R.; Myint, P.K. Delayed transfer of care from NHS secondary care to primary care in England: Its determinants, effect on hospital bed days, prevalence of acute medical conditions and deaths during delay, in older adults aged 65 years and over. BMC Geriatr. 2009, 9, 4. [Google Scholar] [CrossRef] [PubMed]
  10. National Audit Office 2000. Inpatient Admissions and Bed Management in NHS Acute Hospitals; The Stationery Office: London, UK, 2000; pp. 51–52. Available online: http://nao.org.uk/publications/nao_reports/9900254es.pdf (accessed on 13 July 2022).
  11. Schluep, M.; Bogousslavsky, J.; Regli, F.; Tendon, M.; Prod’Hom, L.; Kleiber, C. Justification of Hospital Days and Epidemiology of Discharge Delays in a Department of Neurology. Neuroepidemiology 1994, 13, 40–49. [Google Scholar] [CrossRef]
  12. National Audit Office 2003. Ensuring the Effective Discharge of Older Patients from NHS Acute Hospitals, The Stationery Office, London 2003. Available online: http://www.publications.parliament.uk/pa/cm200203/cmselect/cmpubacc/459/459.pdf (accessed on 13 July 2022).
  13. Kydd, A. The patient experience of being a delayed discharge. J. Nurs. Manag. 2008, 16, 121–126. [Google Scholar] [CrossRef]
  14. Kuluski, K.; Cadel, L.; Marcinow, M.; Sandercock, J.; Guilcher, S.J. Expanding our understanding of factors impacting delayed hospital discharge: Insights from patients, caregivers, providers and organizational leaders in Ontario, Canada. Health Policy 2022, 126, 310–317. [Google Scholar] [CrossRef]
  15. Green, M.A.; Dorling, D.; Minton, J.; Pickett, K.E. Could the rise in mortality rates since 2015 be explained by changes in the number of delayed discharges of NHS patients? J. Epidemiol. Community Health 2017, 71, 1068–1071. [Google Scholar] [CrossRef]
  16. Baumann, M.; Evans, S.; Perkins, M.; Curtis, L.; Netten, A.; Fernandez, J.-L.; Huxley, P. Organisation and features of hospital, intermediate care and social services in English sites with low rates of delayed discharge. Health Soc. Care Community 2007, 15, 295–305. [Google Scholar] [CrossRef] [PubMed]
  17. Giraldo, D.M.; Navarro, A.; Sánchez-Quijano, A.; Villegas, A.; Asencio, R.; Lissen, E. Impact of delayed discharge for nonmedical reasons in a tertiary hospital internal medicine department. Rev. Clin. Esp. 2012, 212, 229–234. [Google Scholar]
  18. Lenzi, J.; Mongardi, M.; Rucci, P.; Di Ruscio, E.; Vizioli, M.; Randazzo, C.; Toschi, E.; Carradori, T.; Fantini, M.P. Sociodemographic, clinical and organisational factors associated with delayed hospital discharges: A cross-sectional study. BMC Health Serv. Res. 2014, 14, 128. [Google Scholar] [CrossRef] [PubMed] [Green Version]
  19. Tan, E.S.; Bonnett, T.J.; Abdelhafiz, A.H. Delayed discharges due to initiation of warfarin in atrial fibrillation: A prospective audit. Am. J. Geriatr. Pharmacother. 2007, 5, 232–235. [Google Scholar] [CrossRef] [PubMed]
  20. DeCoster, C.; Roos, N.P.; Carrière, K.C.; Peterson, S. Inappropriate hospital use by patients receiving care for medical conditions: Targeting utilization review. Can. Med. Assoc. J. 1997, 157, 889–896. [Google Scholar]
  21. Mohammed, A.; Thomas, B.M.; Hullin, M.G.; McCreath, S.W. Audit of orthopaedic bed utilisation. Health Bull. 2001, 59, 353–355. [Google Scholar]
  22. Vetter, N. Inappropriately delayed discharge from hospital; What do we know? Br. Med. J. 2003, 326, 927–928. [Google Scholar] [CrossRef] [Green Version]
  23. Worthington, A.D.; Oldham, J.B. Delayed discharge from rehabilitation after brain injury. Clin. Rehabil. 2006, 20, 79–82. [Google Scholar] [CrossRef]
  24. Van Straten, A.; van der Meulen, J.H.; van den Bos, G.A.; Limburg, M. Length of hospital stay and discharge delays in stroke patients. Stroke 1997, 28, 137–140. [Google Scholar] [CrossRef]
  25. Hermans, E.; Anten, H.W.; Diederiks, J.P.; Philipsen, H.; Beeren, H.W. Patient characteristics with predictive significance for ‘blocked bed’ problems in the neurological department of a general hospital. Ned. Tijdschr. Voor Geneeskd. 1995, 139, 890–894. [Google Scholar]
  26. Kendrick, S.; Conway, M. Increasing Emergency Hospital Admissions among Older People in Scotland; A Whole System Account, Whole System Working Paper 1; ISD: Edinburgh, UK, 2003. [Google Scholar]
  27. Lewis, H.; Purdie, G. The blocked bed; a prospective study. N. Z. Med. J. 1988, 14, 575–576. [Google Scholar]
  28. Audit Scotland. Moving on? An Overview of Delayed Discharges in Scotland, A Report Prepared on 23 June 23rd 2005 for the Auditor General/Accounts Commission. 2005. Available online: https://www.audit-scotland.gov.uk/docs/health/2005/nr_050623_delayed_discharges.pdf (accessed on 13 July 2022).
  29. Audit Scotland. Moving on? A Handbook on Modelling the Whole System for Delayed Discharge in Tayside. 2005. Available online: http://www.audit-scotland.gov.uk/docs/health/2005/nr_050623_delayed_discharges_hdbook.pdf (accessed on 13 July 2022).
  30. Ou, L.; Young, L.; Chen, J.; Santiano, N.; Baramy, L.-S.; Hillman, K. Discharge delay in acute care: Reasons and determinants of delay in general ward patients. Aust. Health Rev. 2009, 33, 513–521. [Google Scholar] [CrossRef] [PubMed] [Green Version]
  31. Victor, C.R.; Healy, J.; Thomas, A.; Seargeant, J. Older patients and delayed discharge from hospital. Health Soc. Care Community 2000, 8, 443–452. [Google Scholar] [CrossRef] [PubMed]
  32. Glasby, J.; Littlechild, R.; Pryce, K. Show Me the Way to Go Home: A Narrative Review of the Literature on Delayed Hospital Discharges and Older People. Br. J. Soc. Work 2004, 34, 1189–1197. [Google Scholar] [CrossRef]
  33. Hubbard, G.; Huby, G.; Wyke, S.; Themessl-Huber, M. A Research Review on Tackling Delayed Discharge; Scottish Executive Social Research: Edinburgh, UK, 2004; ISBN 0-7559-3825-9. Available online: https://www.webarchive.org.uk/wayback/archive/20150221082009/http://www.gov.scot/Publications/2004/10/20042/44602 (accessed on 13 July 2022).
  34. Feigal, J.; Park, B.; Bramante, C.; Nordgaard, C.; Menk, J.; Song, J. Homelessness and discharge delays from an urban safety net hospital. Public Health 2014, 128, 1033–1035. [Google Scholar] [CrossRef]
  35. Mustafa, F.; Gilligan, P.; Obu, D.; O’Kelly, P.; O’Hea, E.; Lloyd, C.; Kelada, S.; Heffernan, A.; Houlihan, P. ‘Delayed discharges and boarders’: A 2-year study of the relationship between patients experiencing delayed discharges from an acute hospital and boarding of admitted patients in a crowded ED. Emerg. Med. J. 2016, 33, 636–640. [Google Scholar] [CrossRef]
  36. Lim, S.C.; Doshi, V.; Castasus, B.; Lim, J.K.H.; Mamun, K. Factors causing delay in discharge of elderly patients in an acute care hospital. Ann. Acad. Med. Singap. 2006, 35, 27–32. [Google Scholar]
  37. Landeiro, F.; Leal, J.; Gray, A.M. The impact of social isolation on delayed hospital discharges of older hip fracture patients and associated costs. Osteoporos. Int. 2015, 27, 737–745. [Google Scholar] [CrossRef]
  38. Bryan, K.; Gage, H.; Gilbert, K. Delayed transfers of older people from hospital: Causes and policy implications. Health Policy 2006, 76, 194–201. [Google Scholar] [CrossRef] [Green Version]
  39. Benson, R.T.; Drew, J.C.; Galland, R.B. A Waiting List to Go Home: An Analysis of Delayed Discharges from Surgical Beds. Ann. R. Coll. Surg. Engl. 2006, 88, 650–652. [Google Scholar] [CrossRef] [Green Version]
  40. Wong, H.; Wu, R.C.; Tomlinson, G.; Caesar, M.; Abrams, H.; Carter, M.; Morra, D. How much do operational processes affect hospital inpatient discharge rates? J. Public Health 2009, 31, 546–553. [Google Scholar] [CrossRef]
  41. El-Eid, G.R.; Kaddoum, R.; Tamim, H.; Hitti, E.A. Improving hospital discharge time: A successful implementation of six sigma methodology. Medicine 2015, 94, e633. [Google Scholar] [CrossRef]
  42. Majeed, M.U.; Williams, D.T.; Pollock, R.; Amir, F.; Liam, M.; Foong, K.S.; Whitaker, C.J. Delay in discharge and its impact on unnecessary hospital bed occupancy. BMC Health Serv. Res. 2012, 12, 410. [Google Scholar] [CrossRef] [PubMed] [Green Version]
  43. Holland, D.E.; Pacyna, J.E.; Gillard, K.L.; Carter, L.C. Tracking discharge delays: Critical first step toward mitigating process breakdowns and inefficiencies. J. Nurs. Care Qual. 2016, 31, 17–23. [Google Scholar] [CrossRef] [PubMed]
  44. Swinkels, A.; Mitchell, T. Delayed transfer from hospital to community settings: The older person’s perspective. Health Soc. Care Community 2009, 17, 45–53. [Google Scholar] [CrossRef] [PubMed]
  45. Holmås, T.H.; Islam, M.K.; Kjerstad, E. Between two beds: Inappropriately delayed discharges from hospitals. Int. J. Health Care Financ. Econ. 2013, 13, 201–217. [Google Scholar] [CrossRef]
  46. Devapriam, J.; Gangadharan, S.; Pither, J.; Critchfield, M. Delayed discharge from intellectual disability in-patient units. Psychiatr. Bull. 2014, 38, 211–215. [Google Scholar] [CrossRef] [Green Version]
  47. Falcone, D.; Bolda, E.; Leak, S.C. Waiting for placement: An exploratory analysis of determinants of delayed discharges of elderly hospital patients. Health Serv. Res. 1991, 26, 339–374. [Google Scholar]
  48. Venkataraman, R.; Panousis, K.; Deakin, A.H.; Sale, G.; Picard, F. Warfarin—An expensive cause of delay in discharge of elective arthroplasty patients. Eur. Orthop. Traumatol. 2014, 6, 77–82. [Google Scholar] [CrossRef]
  49. Grimmer, K.; Moss, J.; Falco, J. Experiences of elderly patients regarding independent community living after discharge from hospital: A longitudinal study. Int. J. Qual. Health Care 2004, 16, 465–472. [Google Scholar] [CrossRef] [Green Version]
  50. Barton, M.; McClean, S.; Gillespie, J.; Garg, L.; Wilson, D.; Fullerton, K. Is it beneficial to increase the provision of thrombolysis?—A discrete-event simulation model. QJM Int. J. Med. 2012, 105, 665–673. [Google Scholar] [CrossRef] [PubMed] [Green Version]
  51. Garg, L.; McClean, S.; Barton, M.; Meenan, B.; Fullerton, K. An extended phase type survival tree for patient pathway prognostication. In Proceedings of the 2010 IEEE Workshop on Health Care Management (WHCM), Venice, Italy, 18–20 February 2010; pp. 1–6. [Google Scholar] [CrossRef] [Green Version]
  52. Garg, L.; McClean, S.I.; Barton, M.; Meenan, B.J.; Fullerton, K. Intelligent Patient Management and Resource Planning for Complex, Heterogeneous, and Stochastic Healthcare Systems. IEEE Trans. Syst. Man Cybern. Part A Syst. Hum. 2012, 42, 1332–1345. [Google Scholar] [CrossRef]
  53. Garg, L.; McClean, S.I.; Barton, M.; Meenan, B.J.; Fullerton, K.; Kontonatsios, G.; Trovati, M.; Konkontzelos, I.; Xu, X.; Farid, M. Evaluating Different Selection Criteria for Phase Type Survival Tree Construction. Big Data Res. 2021, 25, 100250. [Google Scholar] [CrossRef]
  54. McClean, S.; Barton, M.; Garg, L.; Fullerton, K. A modeling framework that combines markov models and discrete-event simulation for stroke patient care. ACM Trans. Model. Comput. Simul. 2011, 21, 1–26. [Google Scholar] [CrossRef]
  55. McClean, S.; Garg, L.; Gillespie, J.; Fullerton, K. Costing Mixed Coxian Phase-type Systems in a given time interval. In Proceedings of the 26th IEEE International Symposium on Computer-Based Medical Systems, Porto, Portugal, 20–22 June 2013; pp. 369–372. [Google Scholar]
  56. McClean, S.; Gillespie, J.; Garg, L.; Barton, M.; Scotney, B.; Kullerton, K. Using phase-type models to cost stroke patient care across health, social and community services. Eur. J. Oper. Res. 2014, 236, 190–199. [Google Scholar] [CrossRef]
  57. Gillespie, J.; McClean, S.; Scotney, B.; Garg, L.; Barton, M.; Fullerton, K. Costing hospital resources for stroke patients using phase-type models. Health Care Manag. Sci. 2011, 14, 279–291. [Google Scholar] [CrossRef]
  58. Gillespie, J.; McClean, S.; Garg, L.; Barton, M.; Scotney, B.; Fullerton, K. A multi-phase DES modelling framework for patient-centred care. J. Oper. Res. Soc. 2016, 67, 1239–1249. [Google Scholar] [CrossRef]
  59. Barton, M.; McClean, S.I.; Garg, L.; Fullerton, K. Modelling Stroke Patient Pathways using Survival Analysis and Simulation Modelling. In Proceedings of the XIIIth International Conference “Applied Stochastic Models and Data Analysis” (ASMDA-2009), Vilnius, Lithuania, 30 June–3 July 2009; pp. 370–373. [Google Scholar]
  60. McClean, S.; Garg, L.; Barton, M.; Fullerton, K.; Millard, P. Using Markov Systems to Plan Stroke Services. In Intelligent Patient Management; Springer: Berlin/Heidelberg, Germany, 2009; pp. 241–256. [Google Scholar]
  61. Saka, O.; McGuire, A.; Wolfe, C. Cost of stroke in the United Kingdom. Age Ageing 2008, 38, 27–32. [Google Scholar] [CrossRef] [Green Version]
  62. Fackrell, M. Modelling healthcare systems with phase-type distributions. Health Care Manag. Sci. 2008, 12, 11–26. [Google Scholar] [CrossRef]
  63. Marshall, A.H.; McClean, S. Using Coxian Phase-Type Distributions to Identify Patient Characteristics for Duration of Stay in Hospital. Health Care Manag. Sci. 2004, 7, 285–289. [Google Scholar] [CrossRef]
  64. Garg, L.; McClean, S.; Meenan, B.J.; Millard, P. Phase-Type Survival Trees and Mixed Distribution Survival Trees for Clustering Patients’ Hospital Length of Stay. Informatica 2011, 22, 57–72. [Google Scholar] [CrossRef]
  65. Akaike, H. A new look at the statistical model identification. IEEE Trans. Autom. Control 1974, 19, 716–723. [Google Scholar] [CrossRef]
  66. Schwartz, G. Estimating the dimension of a model. Ann. Stat. 1978, 6, 461–464. [Google Scholar] [CrossRef]
  67. Hurvich, C.M.; Tsai, C.L. Regression and time series model selection in small samples. Biometrika 1989, 76, 297–307. [Google Scholar] [CrossRef]
  68. McQuarrie, A.D. A small-sample correction for the Schwarz SIC model selection criterion. Stat. Probab. Lett. 1999, 44, 79–86. [Google Scholar] [CrossRef]
  69. Wu, T.-J.; Sepulveda, A. The weighted average information criterion for order selection in time series and regression models. Stat. Probab. Lett. 1998, 39, 1–10. [Google Scholar] [CrossRef]
  70. Chen, P.; Wu, T.-J.; Yang, J. A comparative study of model selection criteria for the number of signals. IET Radar Sonar Navig. 2008, 2, 180–188. [Google Scholar] [CrossRef]
  71. Barton, M.; McClean, S.; Garg, L.; Fullerton, K. Modelling costs of bed occupancy and delayed discharge of post-stroke patients. In Proceedings of the 2010 IEEE Workshop on Health Care Management (WHCM), Venice, Italy, 18–20 February 2010; pp. 1–6. [Google Scholar] [CrossRef]
  72. Garg, L.; Chukwu, E.; Nasser, N.; Chakraborty, C.; Garg, G. Anonymity preserving IoT-based COVID-19 and other infectious disease contact tracing model. IEEE Access 2020, 8, 159402–159414. [Google Scholar] [CrossRef]
  73. Chukwu, E.; Garg, L. A Systematic Review of Blockchain in Healthcare: Frameworks, Prototypes, and Implementations. IEEE Access 2020, 8, 21196–21214. [Google Scholar] [CrossRef]
Figure 2. The schematic representation of the phase-type survival tree constructed using the WIC-based splitting criteria.
Algorithms 15 00414 g002
Figure 3. EPHTST constructed using the WIC-based splitting criterion.
Algorithms 15 00414 g003
Figure 5. The estimated total number of patients (with respect to the mean discharge delay and the number of days) in the blocking state.
Algorithms 15 00414 g005
Figure 6. The estimated number of patients in the blocking state with each expected discharge destination for a mean discharge delay τ = 10 days.
Algorithms 15 00414 g006
Figure 7. The estimated number of patients in the blocking state from each phase for a mean discharge delay τ = 10 days.
Algorithms 15 00414 g007
Figure 8. The estimated number of additional beds required in the stroke care unit with respect to the discharge delay (after 1000 days).
Algorithms 15 00414 g008
Figure 9. The estimated number of additional beds required for patients with each expected discharge destination in the stroke care unit with respect to the discharge delay (after 1000 days).
Algorithms 15 00414 g009
Figure 10. The estimated daily cost of care for patients in the blocking state expected to be discharged to each destination (after 1000 days since the first patient gets delayed).
Algorithms 15 00414 g010
Figure 11. The estimated proportion of beds occupied by delayed discharge patients (after 1000 days since the first patient gets delayed).
Algorithms 15 00414 g011
Figure 12. The estimated proportion of cost incurred by delayed discharge patients (after 1000 days since the first patient gets delayed).
Algorithms 15 00414 g012
Figure 13. The estimated number of additional beds required in each phase of the stroke care unit with respect to the mean discharge delay (after 1000 days).
Algorithms 15 00414 g013
Figure 14. The estimated daily cost of care for patients in the blocking state from each phase (after 1000 days).
Algorithms 15 00414 g014
Figure 15. The estimated daily cost of care for patients in the blocking state of each phase (for mean discharge delay τ = 10 days).
Algorithms 15 00414 g015
Figure 16. The estimated daily cost of care of patients in each phase of the stroke care unit (for mean discharge delay τ = 10 days).
Algorithms 15 00414 g016
Figure 17. The number of patients (with respect to discharge delay) in the blocking state for discharge to private nursing homes.
Algorithms 15 00414 g017
Figure 18. The estimated daily cost of care for patients in the blocking state of each phase expected to be discharged to private nursing homes (for mean discharge delay τ = 10 days).
Algorithms 15 00414 g018
Figure 19. The estimated daily cost of care for patients in the blocking state from each phase expected to be discharged to private nursing homes (after 1000 days since the first patient gets delayed).
Algorithms 15 00414 g019
Figure 20. The estimated number of patients (with respect to discharge delay) in the blocking state for discharge to other destinations.
Algorithms 15 00414 g020
Figure 21. The estimated daily cost of care for patients in the blocking state of each phase expected to be discharged to other destinations (for mean discharge delay τ = 10 days).
Algorithms 15 00414 g021
Figure 22. The estimated daily cost of care for patients in the blocking state from each phase expected to be discharged to other destinations (after 1000 days since the first patient gets delayed).
Algorithms 15 00414 g022
Table 1. Phase-type survival tree construction using the WIC-based splitting criteria (nodes and possible splits).
NodeCovariateCovariate ValueNumber of PatientsMean LOSStandard Deviation (LOS)Coefficient of VariationWICNumber of PhasesTotal WICGain in
WIC
AllComplete datasetRoot node198529.0152.841.8216,847.73316,847.73-
1
(Root node)
GenderMale93326.5944.061.667736.85216,845.791.94
Female105231.1559.471.919108.943
AgeYoung62419.2639.152.034650.09216,729118.73
Old136133.4857.491.7212,078.93
DiagnosisHemorrhagic15433.656.451.681338.96316,567.05280.68
Cerebral65536.6647.681.35978.782
TIA4259.3119.952.142612.382
Other75132.5465.0526636.922
2
Hemorrhagic
GenderMale8028.252.11.85660.8541332.416.55
Female7439.4560.251.53671.562
AgeYoung5024.5655.122.24370.1341324.7514.21
Old10437.9556.561.49954.632
3
Cerebral
GenderMale30233.7149.881.482694.1925981.96−3.18
Female35339.1945.551.163287.782
AgeYoung19424.0742.451.761586.0225949.1829.61
Old46141.9648.791.164363.162
4
TIA
GenderMale2078.722.682.611229.1722619.64−7.26
Female2189.8916.941.711390.472
AgeYoung1765.8411.161.91924.5822593.0619.32
Old24911.7724.022.041668.482
5
Other strokes
GenderMale34430.7443.411.413014.0226645.27−8.35
Female40734.0778.82.313631.252
AgeYoung20424.9643.761.751662.3826611.9524.97
Old54735.3771.172.014949.572
6
Hemorrhagic Young
GenderMale2930.5269.112.26226.492375.19−5.07
Female2116.3322.811.4148.712
7
Hemorrhagic Old
GenderMale5126.8839.21.46437.872954.430.19
Female5348.667.581.39516.562
8
Cerebral Young
GenderMale10424.6749.272853.3321591.24−5.22
Female9023.3732.941.41737.912
9
Cerebral Old
GenderMale19838.4549.671.291836.5124369.07−5.92
Female26344.647.941.072532.562
10
TIA Young
GenderMale885.7411.331.97460.652933.56−8.98
Female885.93111.85472.912
11
TIA Old
GenderMale11910.8928.082.58767.3521674.19−5.71
Female13012.5819.531.55906.852
12
Other strokes Young
GenderMale11930.1152.771.751006.4731665.64−3.26
Female8517.7524.661.75659.172
13
Other strokes Old
GenderMale22531.0837.521.212000.2224955.54−5.97
Female32238.3787.172.272955.322
Table 2. Tree extension using the WIC-based splitting criteria (nodes and possible splits by the covariate discharge destination).
NodeDestinationNumber of PatientsMean LOSStandard Deviation (LOS)Coefficient of VariationWICNumber of PhasesDegrees of Freedom
( df max )
Total WICGain in WIC
6
Hemorrhagic Young
All5024.5655.122.24370.1347--
Death1716.4140.622.4898.52210369.190.94
Other3328.7660.832.12270.674
14
Hemorrhagic Old Male
All5126.8839.21.46437.8723--
Death2110.914.731.35141.127395.2342.64
Other2731.8938.851.22243.811
PNH393.6767.480.7210.322
15
Hemorrhagic Female
All5348.667.581.39516.5623--
Death2724.1535.471.47223.8227490.6325.93
Other2474.1785.361.15257.481
PNH274.1785.361.159.332
8
Cerebral Young
All19424.0742.451.761586.0223--
Death1421.2935.221.65112.65271585.460.56
Other17422.2840.51.821405.342
PNH682.3363.220.7767.481
9
Cerebral Old
All46141.9648.791.164363.1623--
Death11235.6646.41.31028.5154339.1923.97
Other29636.9443.091.172732.542
PNH5383.3462.020.74578.151
10
TIA Young
All1765.8411.161.91924.5823--
Death257.512.50.228.4727890.8333.75
Other1734.87.771.62873.572
PNH181008.791
11
TIA Old
All24911.7724.022.041668.4823--
Death1133.2730.310.91101.53151655.4213.06
Other23110.5823.322.21497.542
PNH717.2918.011.0456.351
12
Other strokes Young
All20424.9643.761.751662.3823--
Death2220.2727.841.37179.13171638.6623.72
Other17925.1345.481.811454.592
PNH349.3319.480.394.942
13
Other strokes Old
All54735.3771.172.014949.5723--
Death14241.82123.732.961295.562114895.254.37
Other35828.2733.351.183104.343
PNH4770.0250.180.72495.312
Publisher’s Note: MDPI stays neutral with regard to jurisdictional claims in published maps and institutional affiliations.

