
Selective NO2 Detection of CaCu3Ti4O12 Ceramic Prepared by the Sol-Gel Technique and DRIFT Measurements to Elucidate the Gas Sensing Mechanism
 , , ,
, , ,
Abstract
:1. Introduction
2. Materials and Methods
3. Results
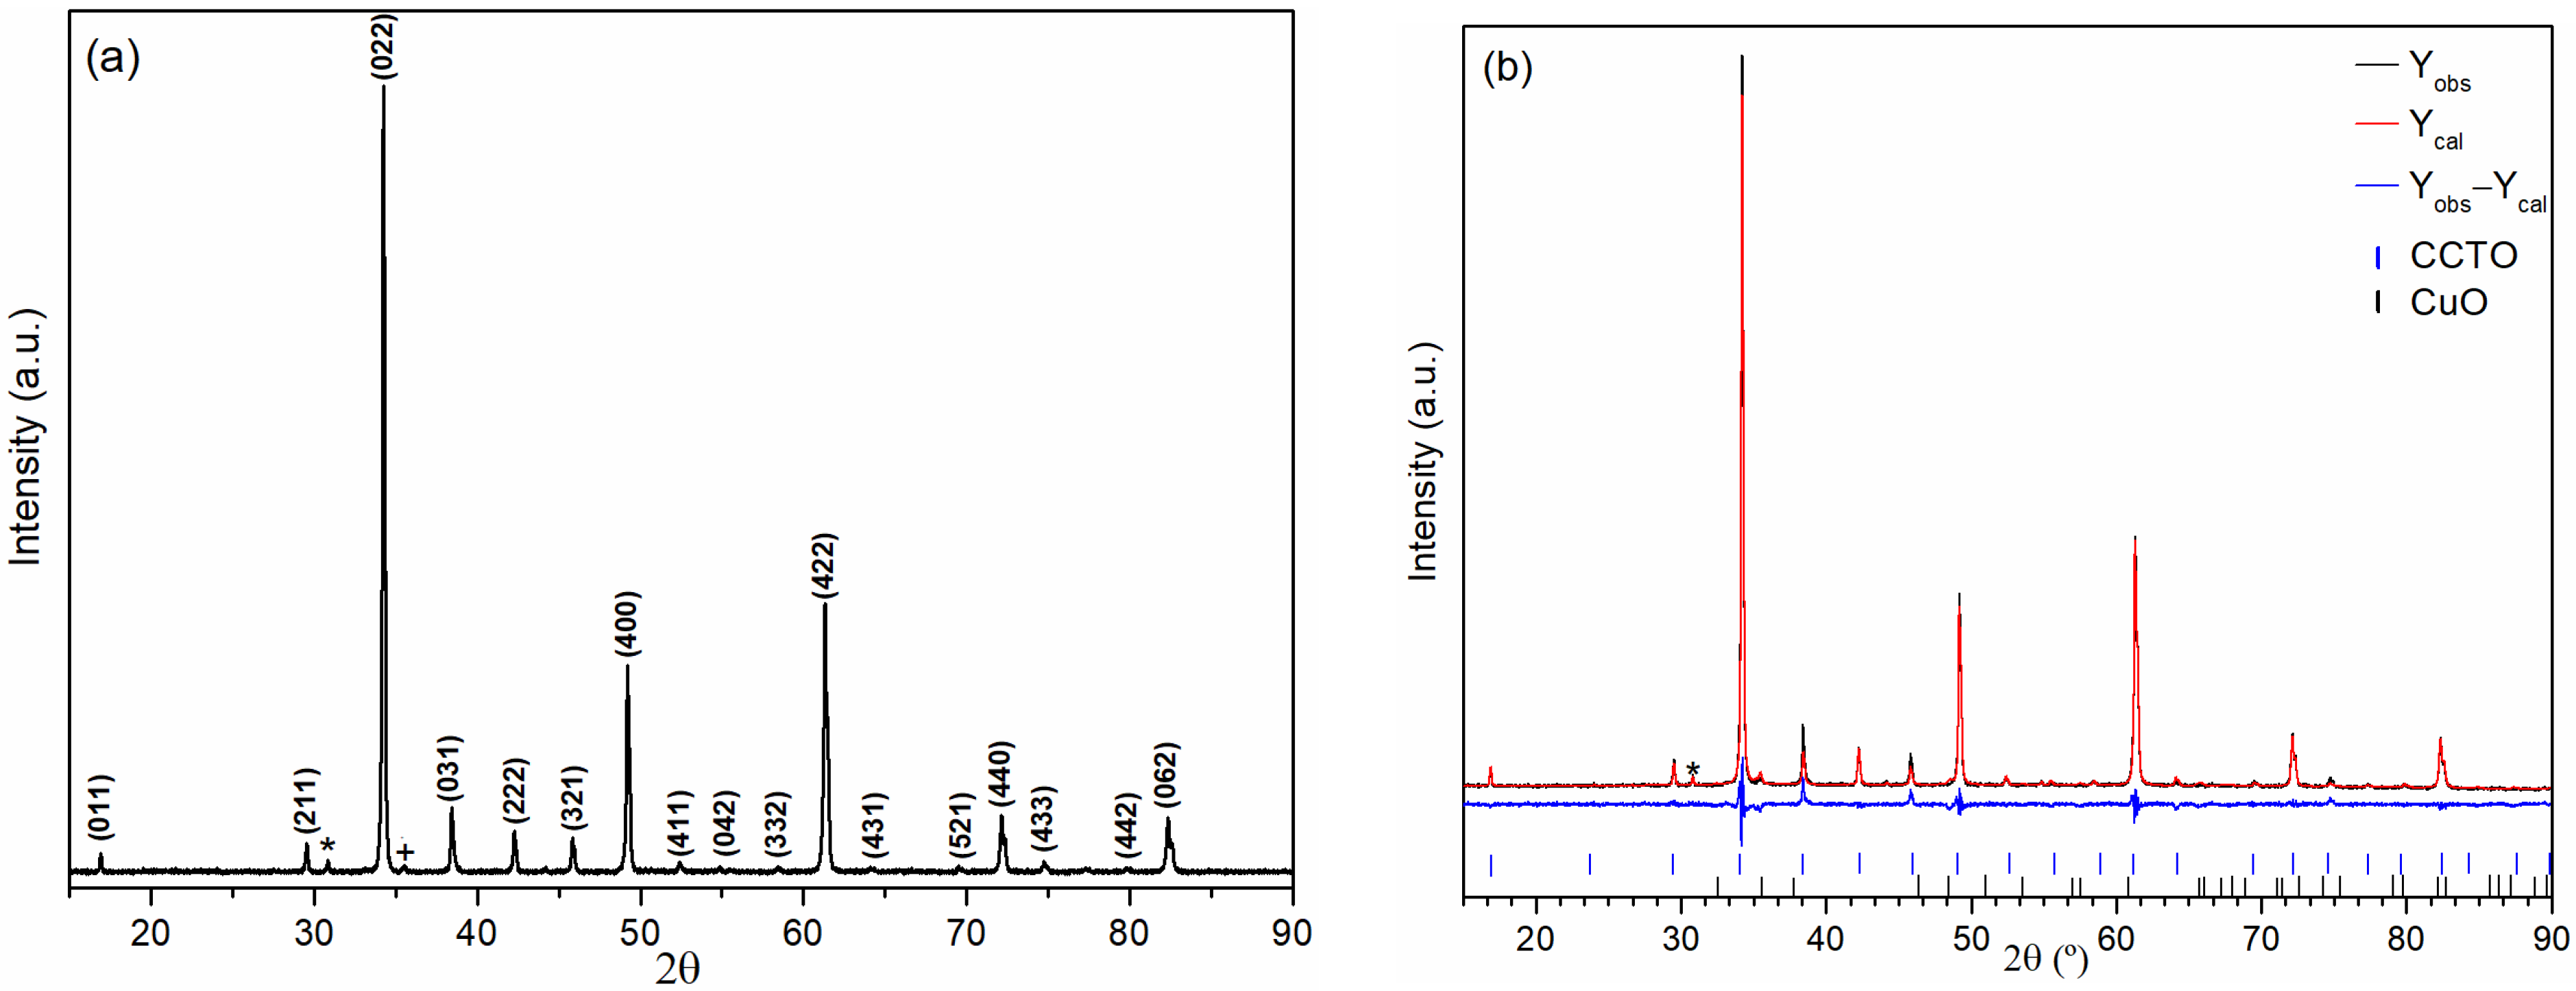
3.1. XRD Characterization
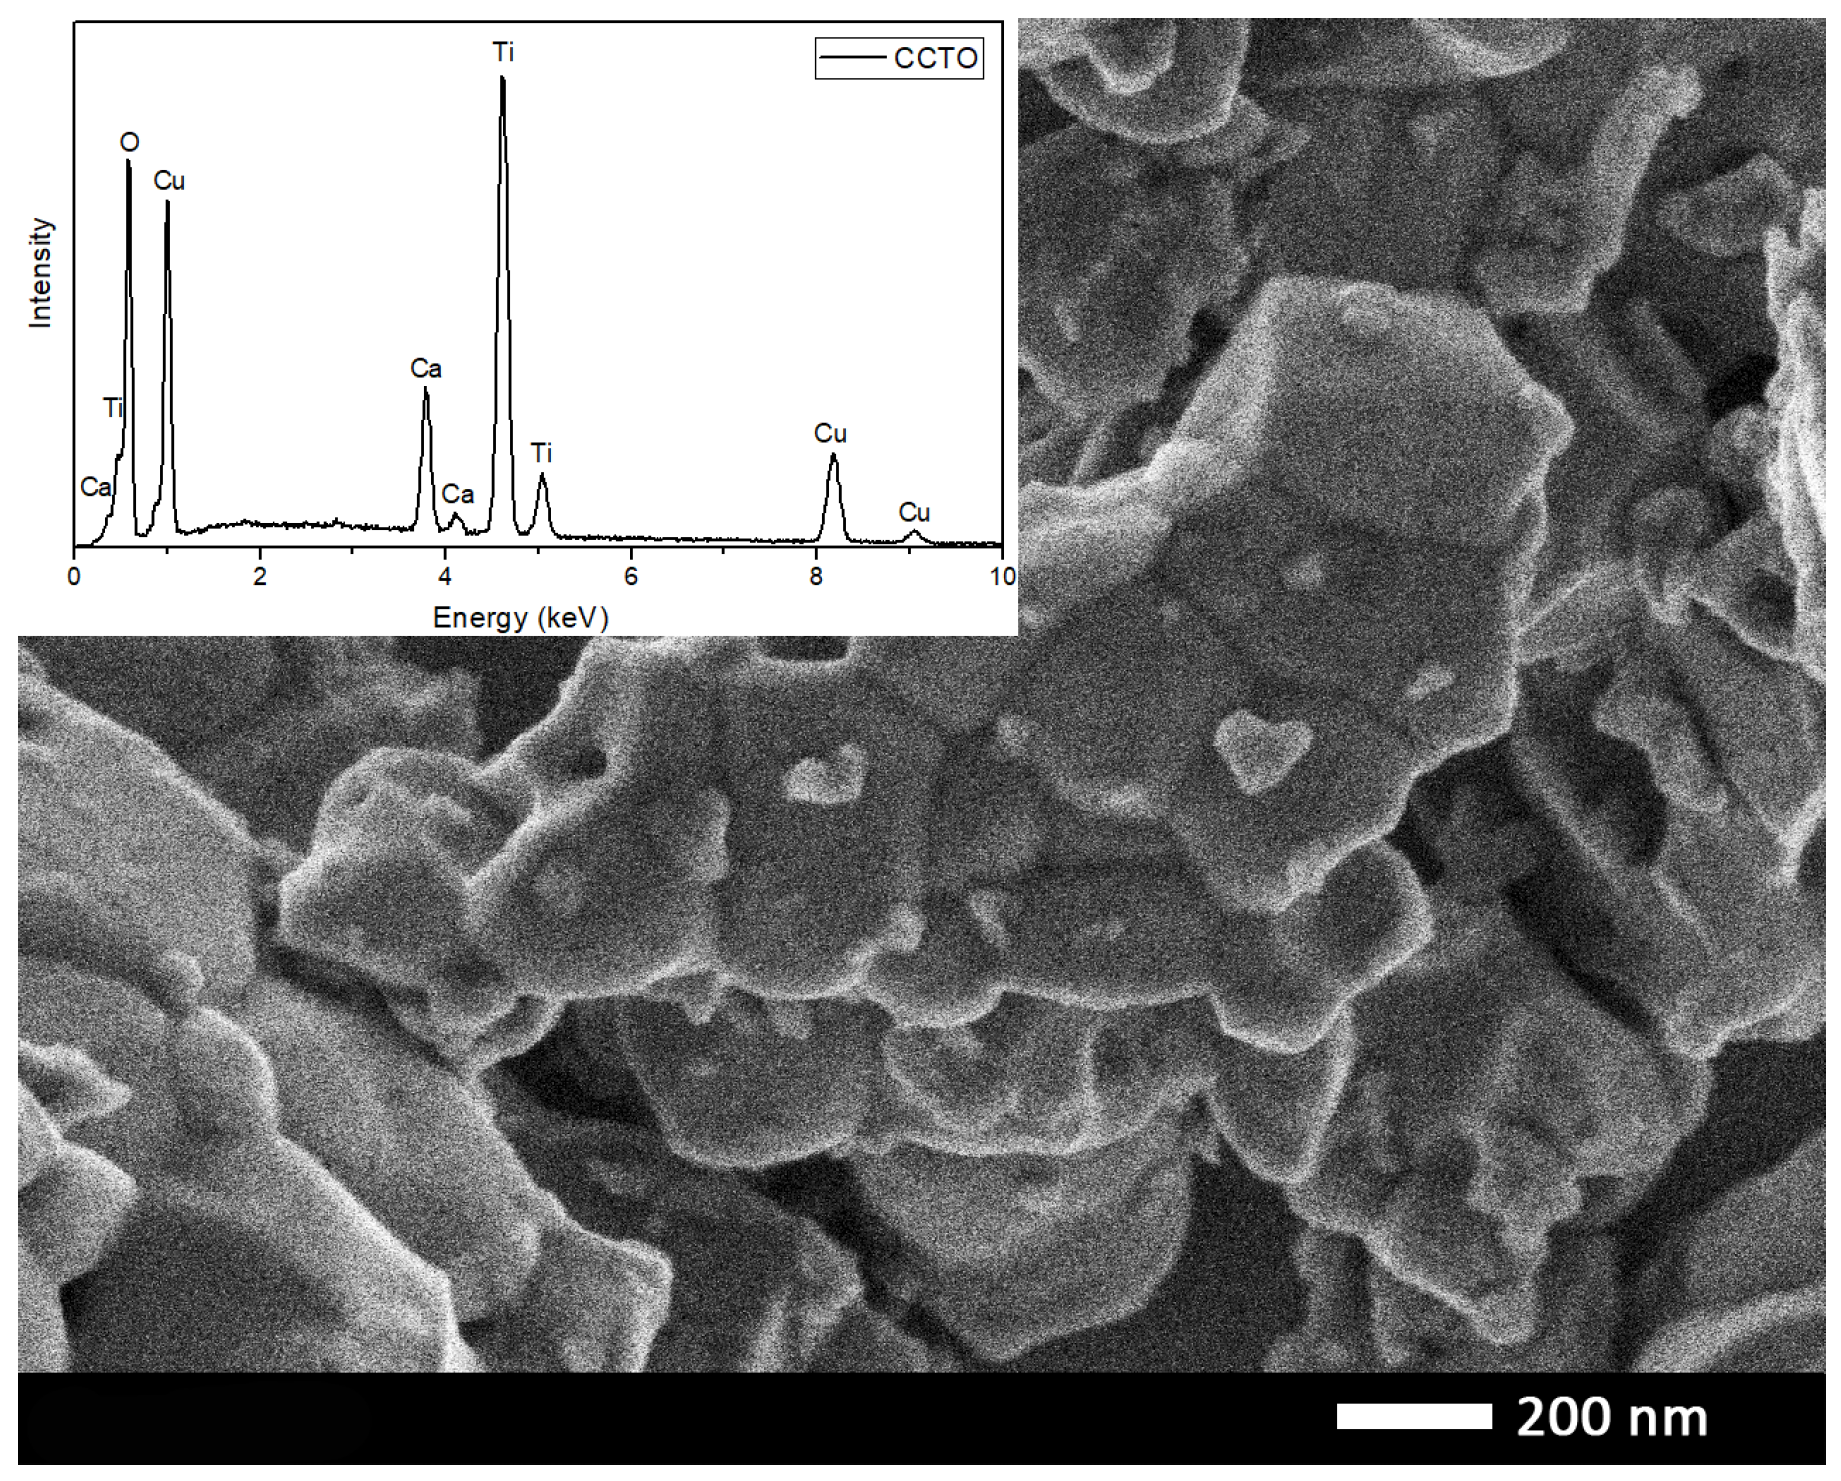
3.2. SEM Results
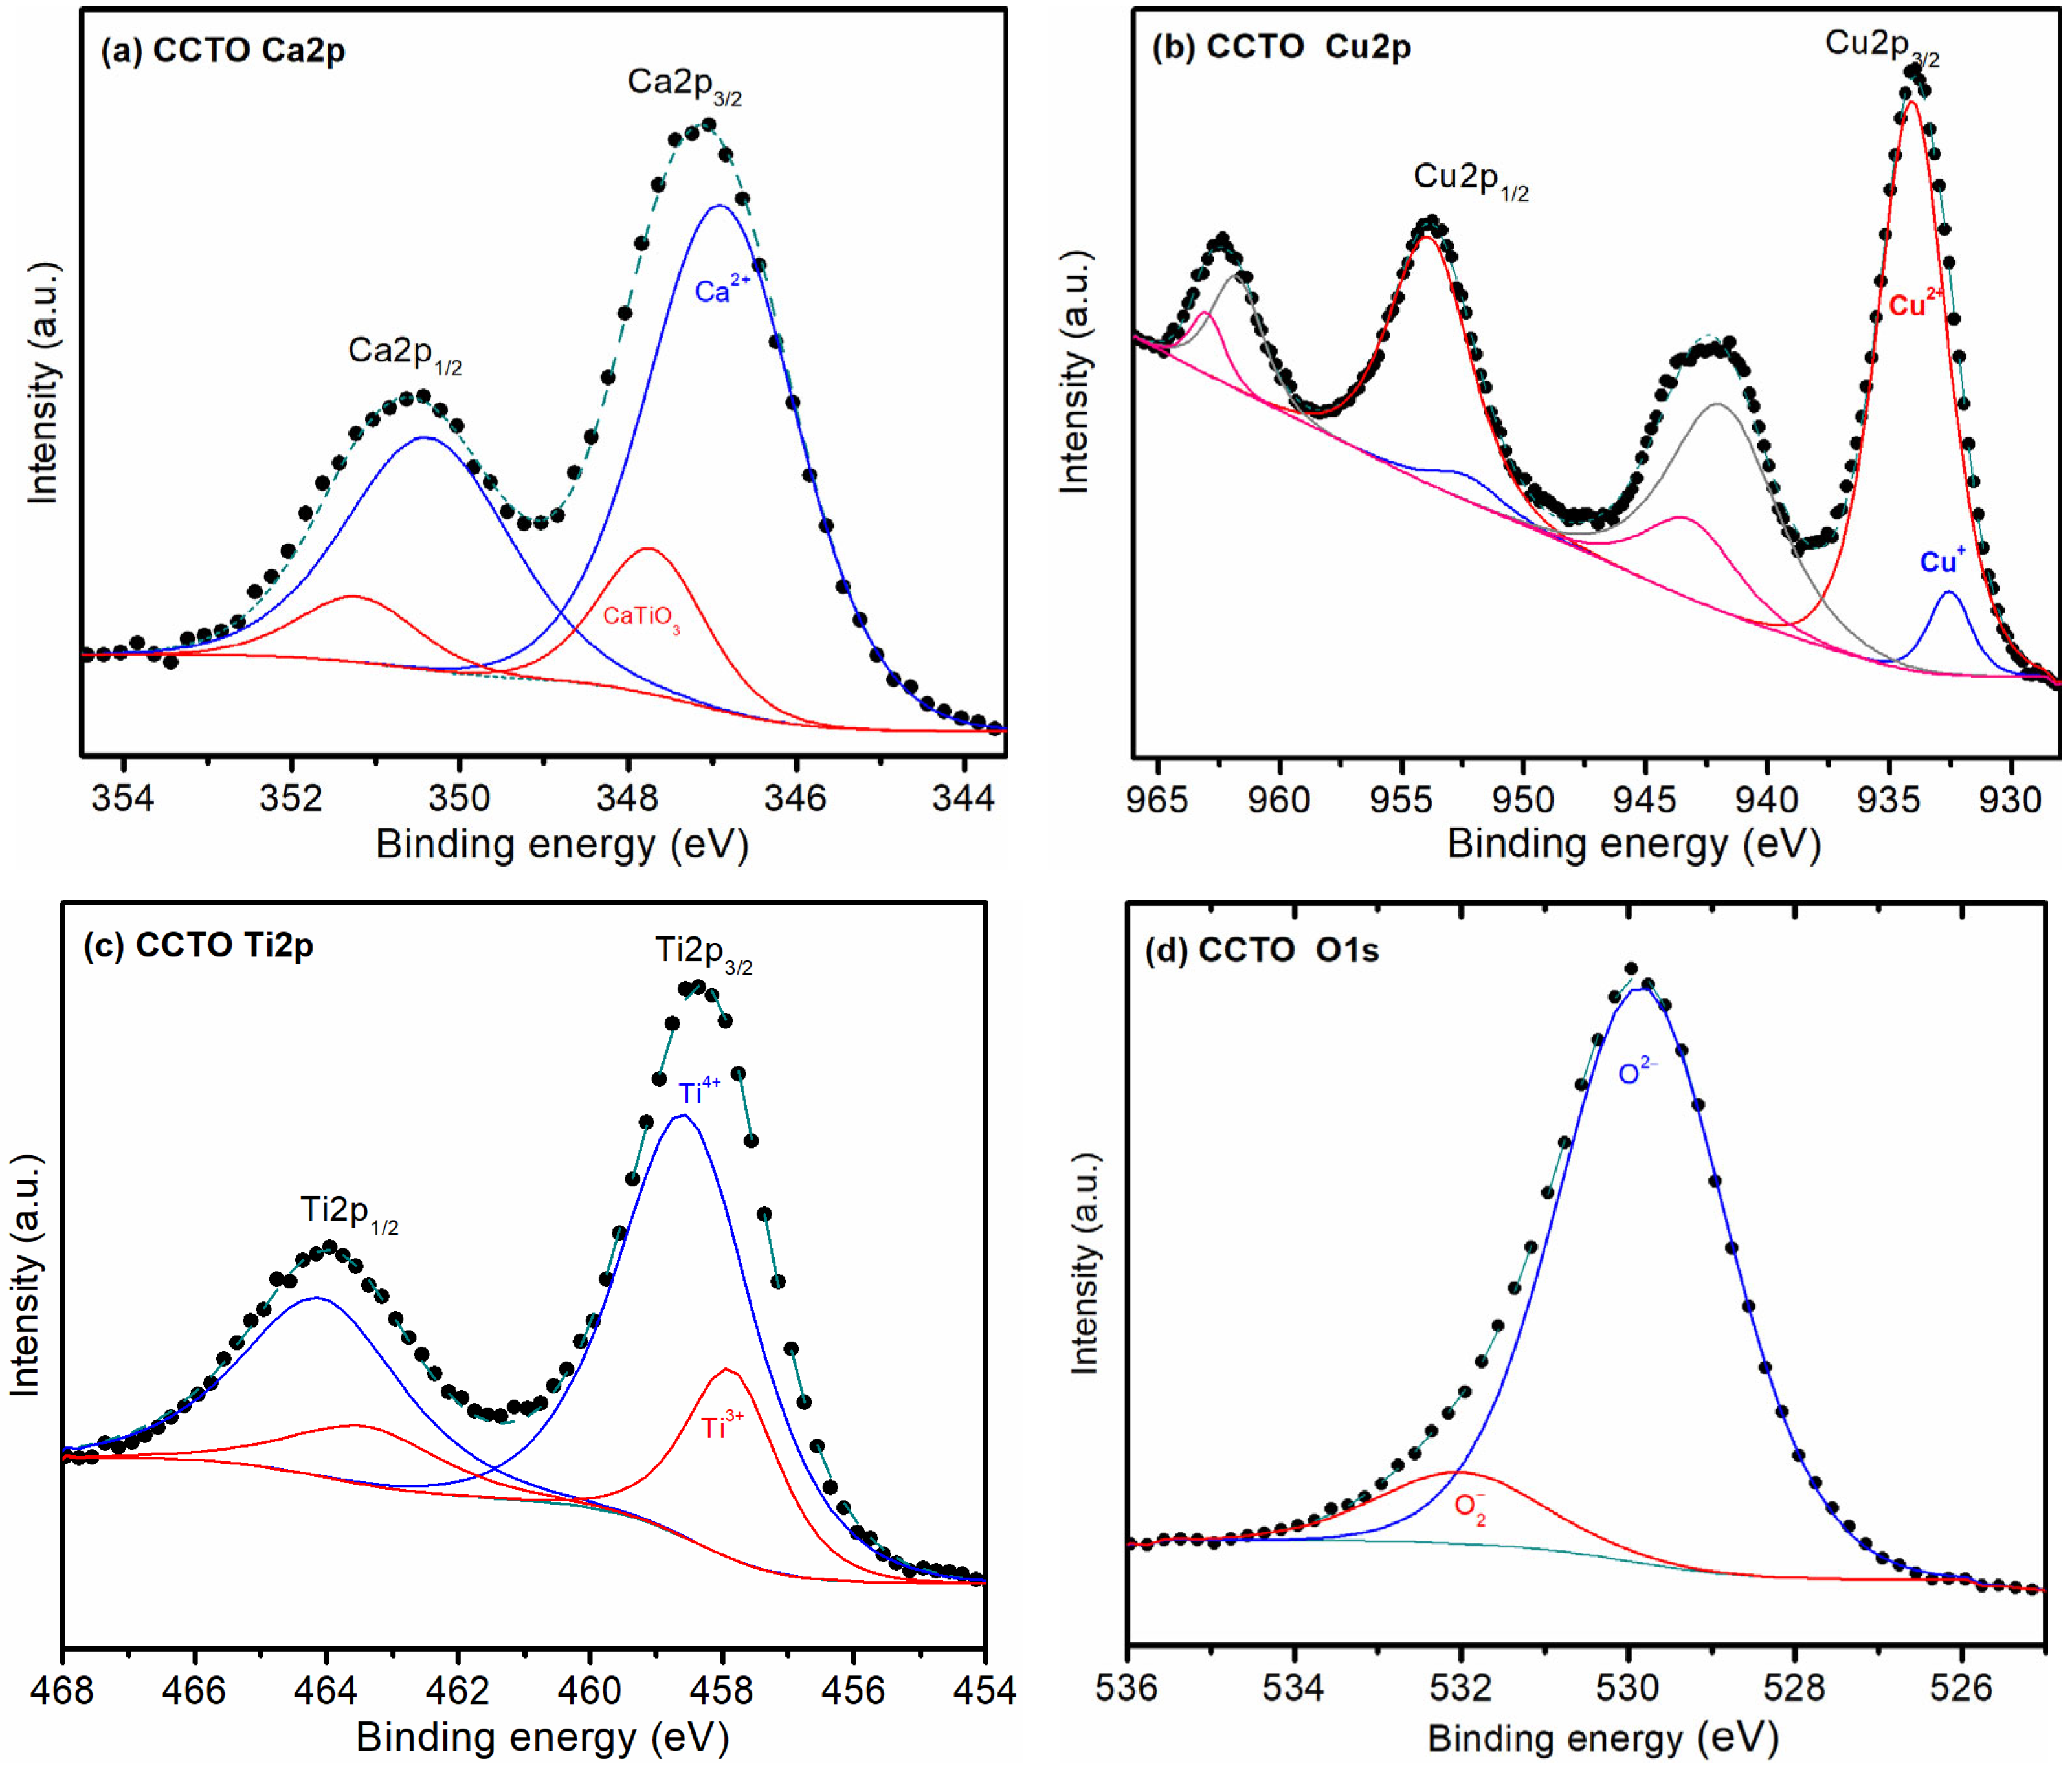
3.3. XPS Results
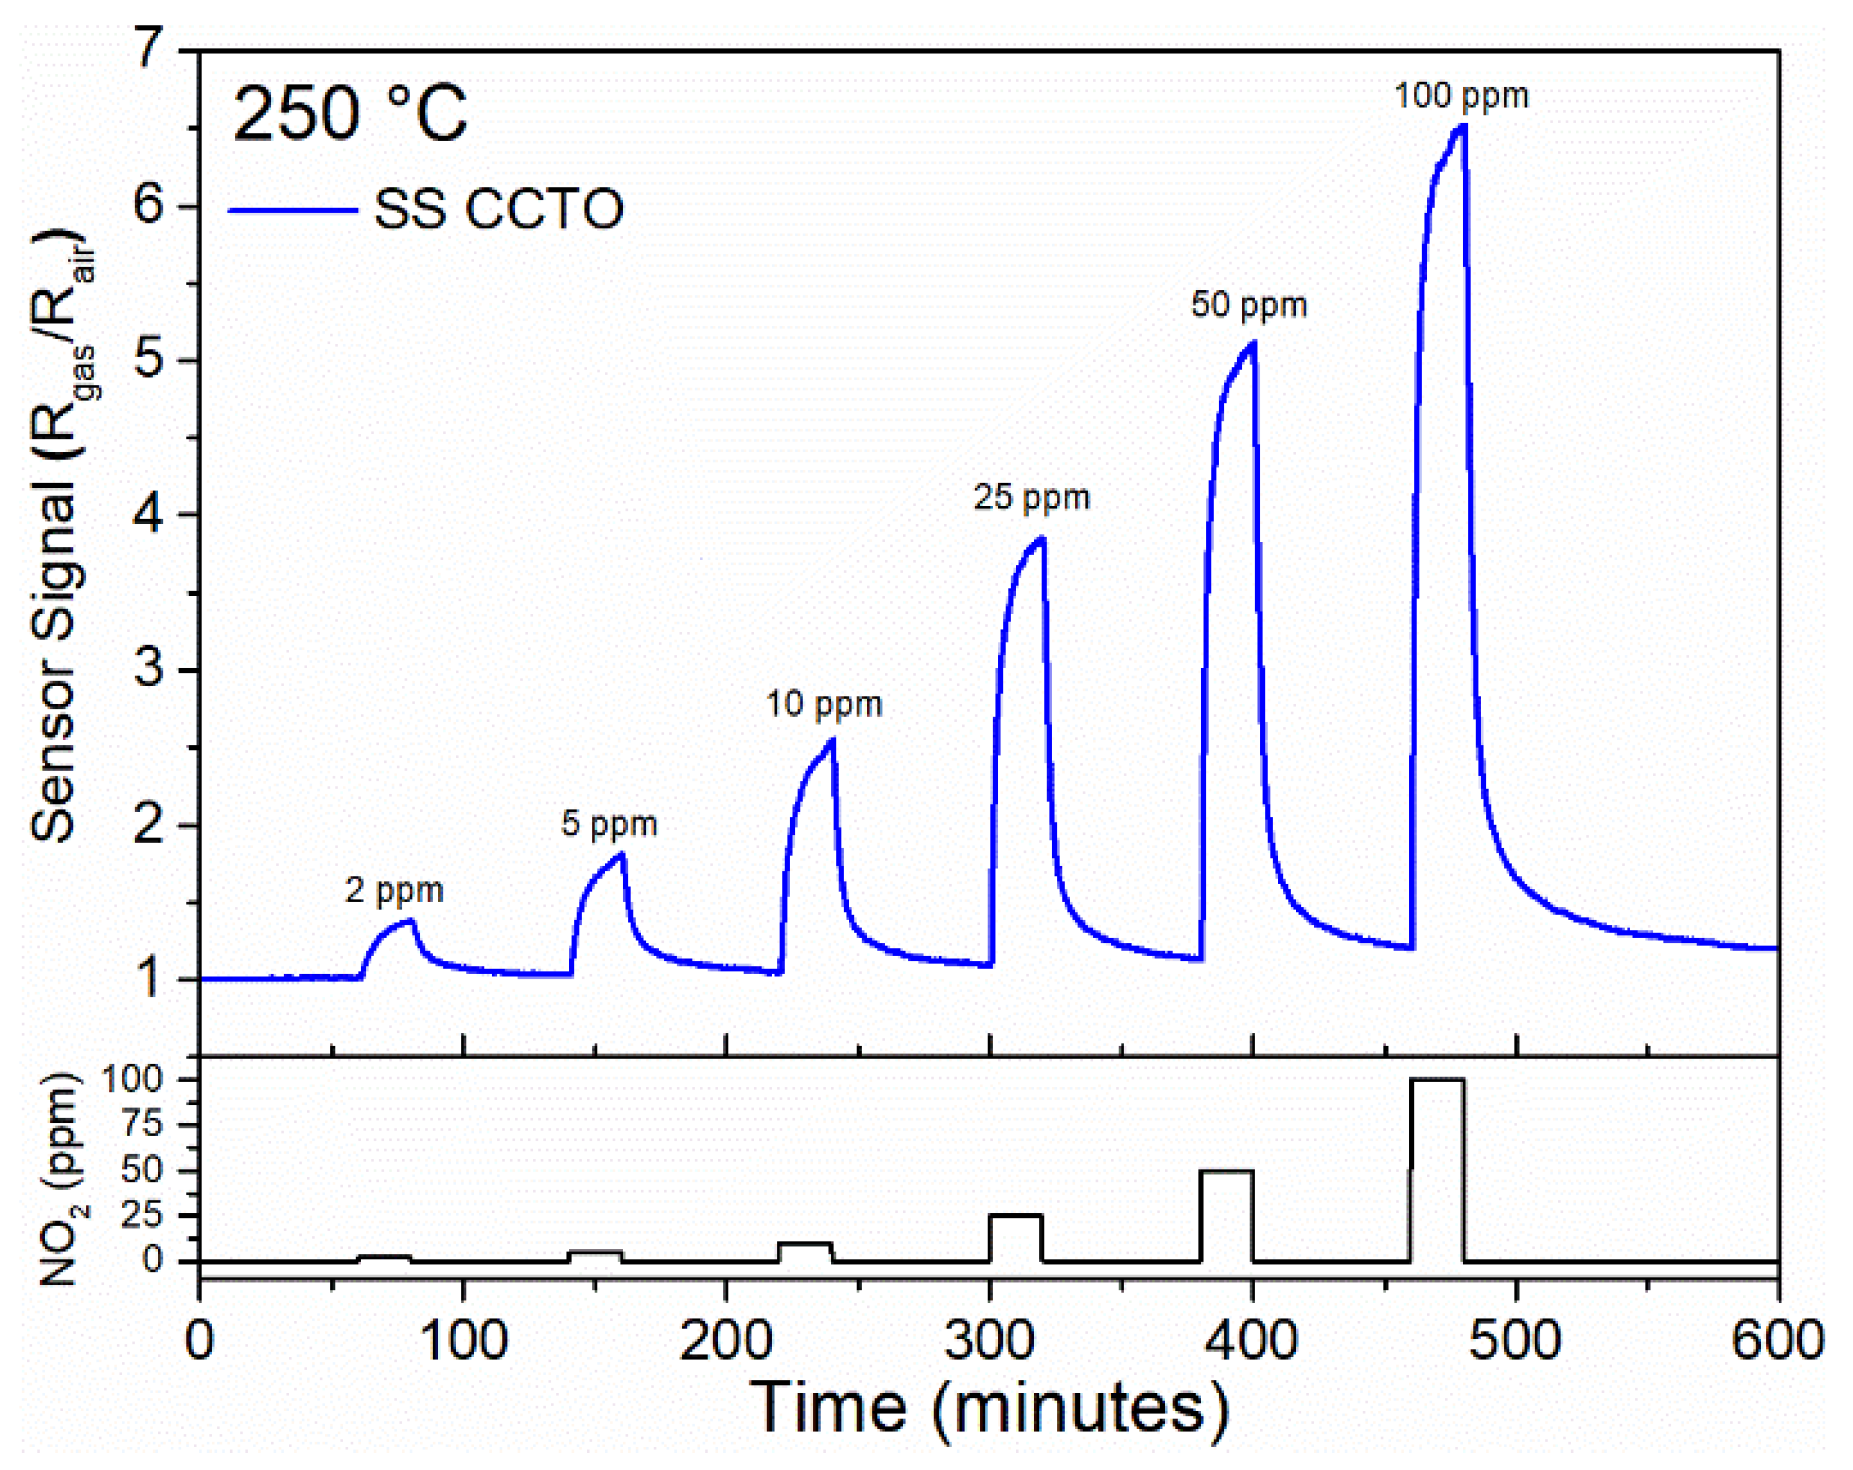
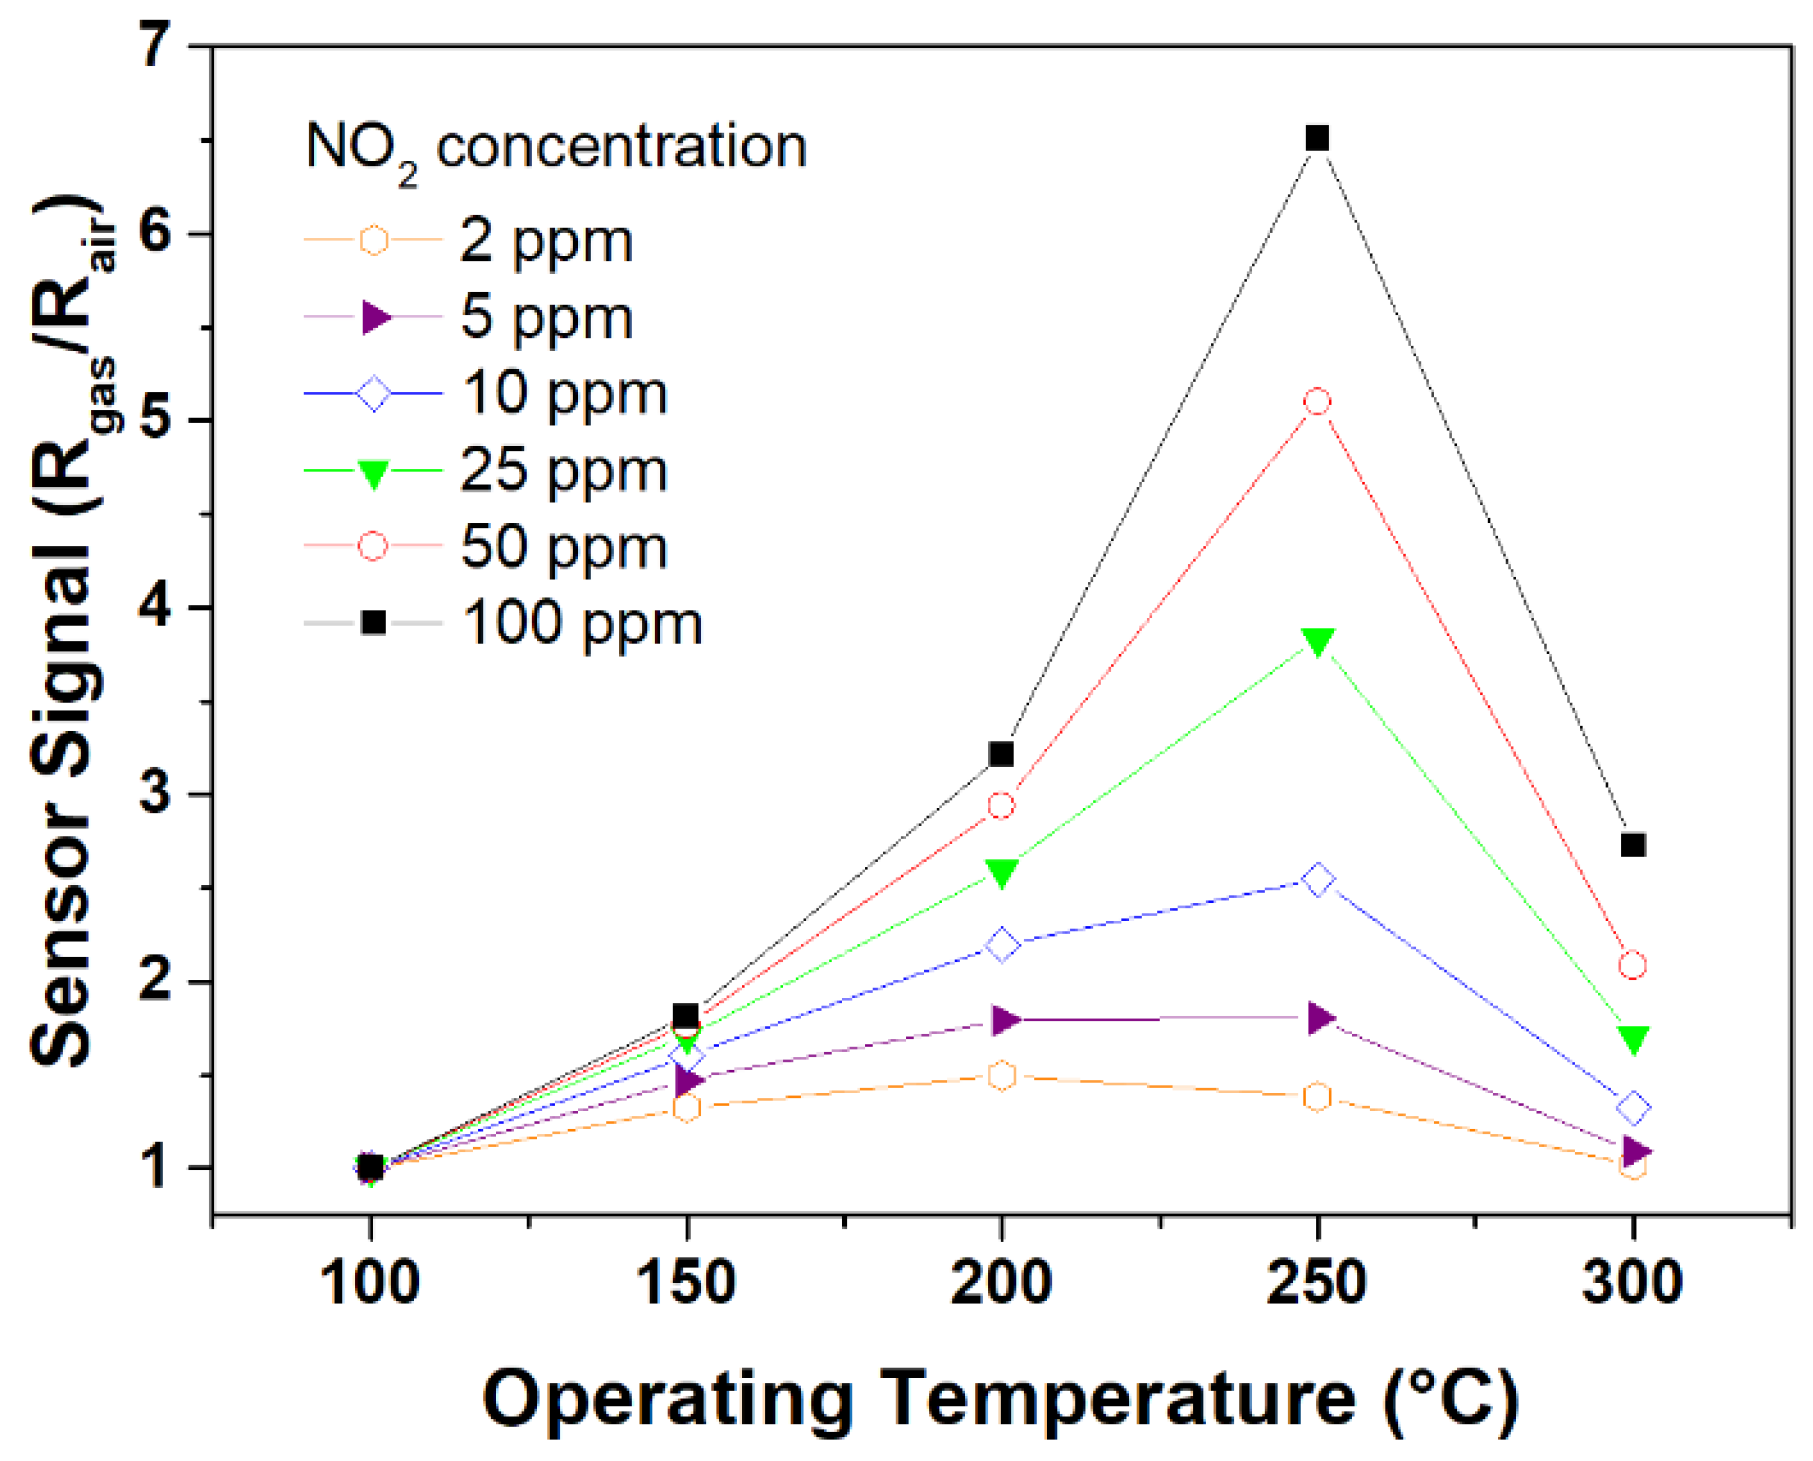
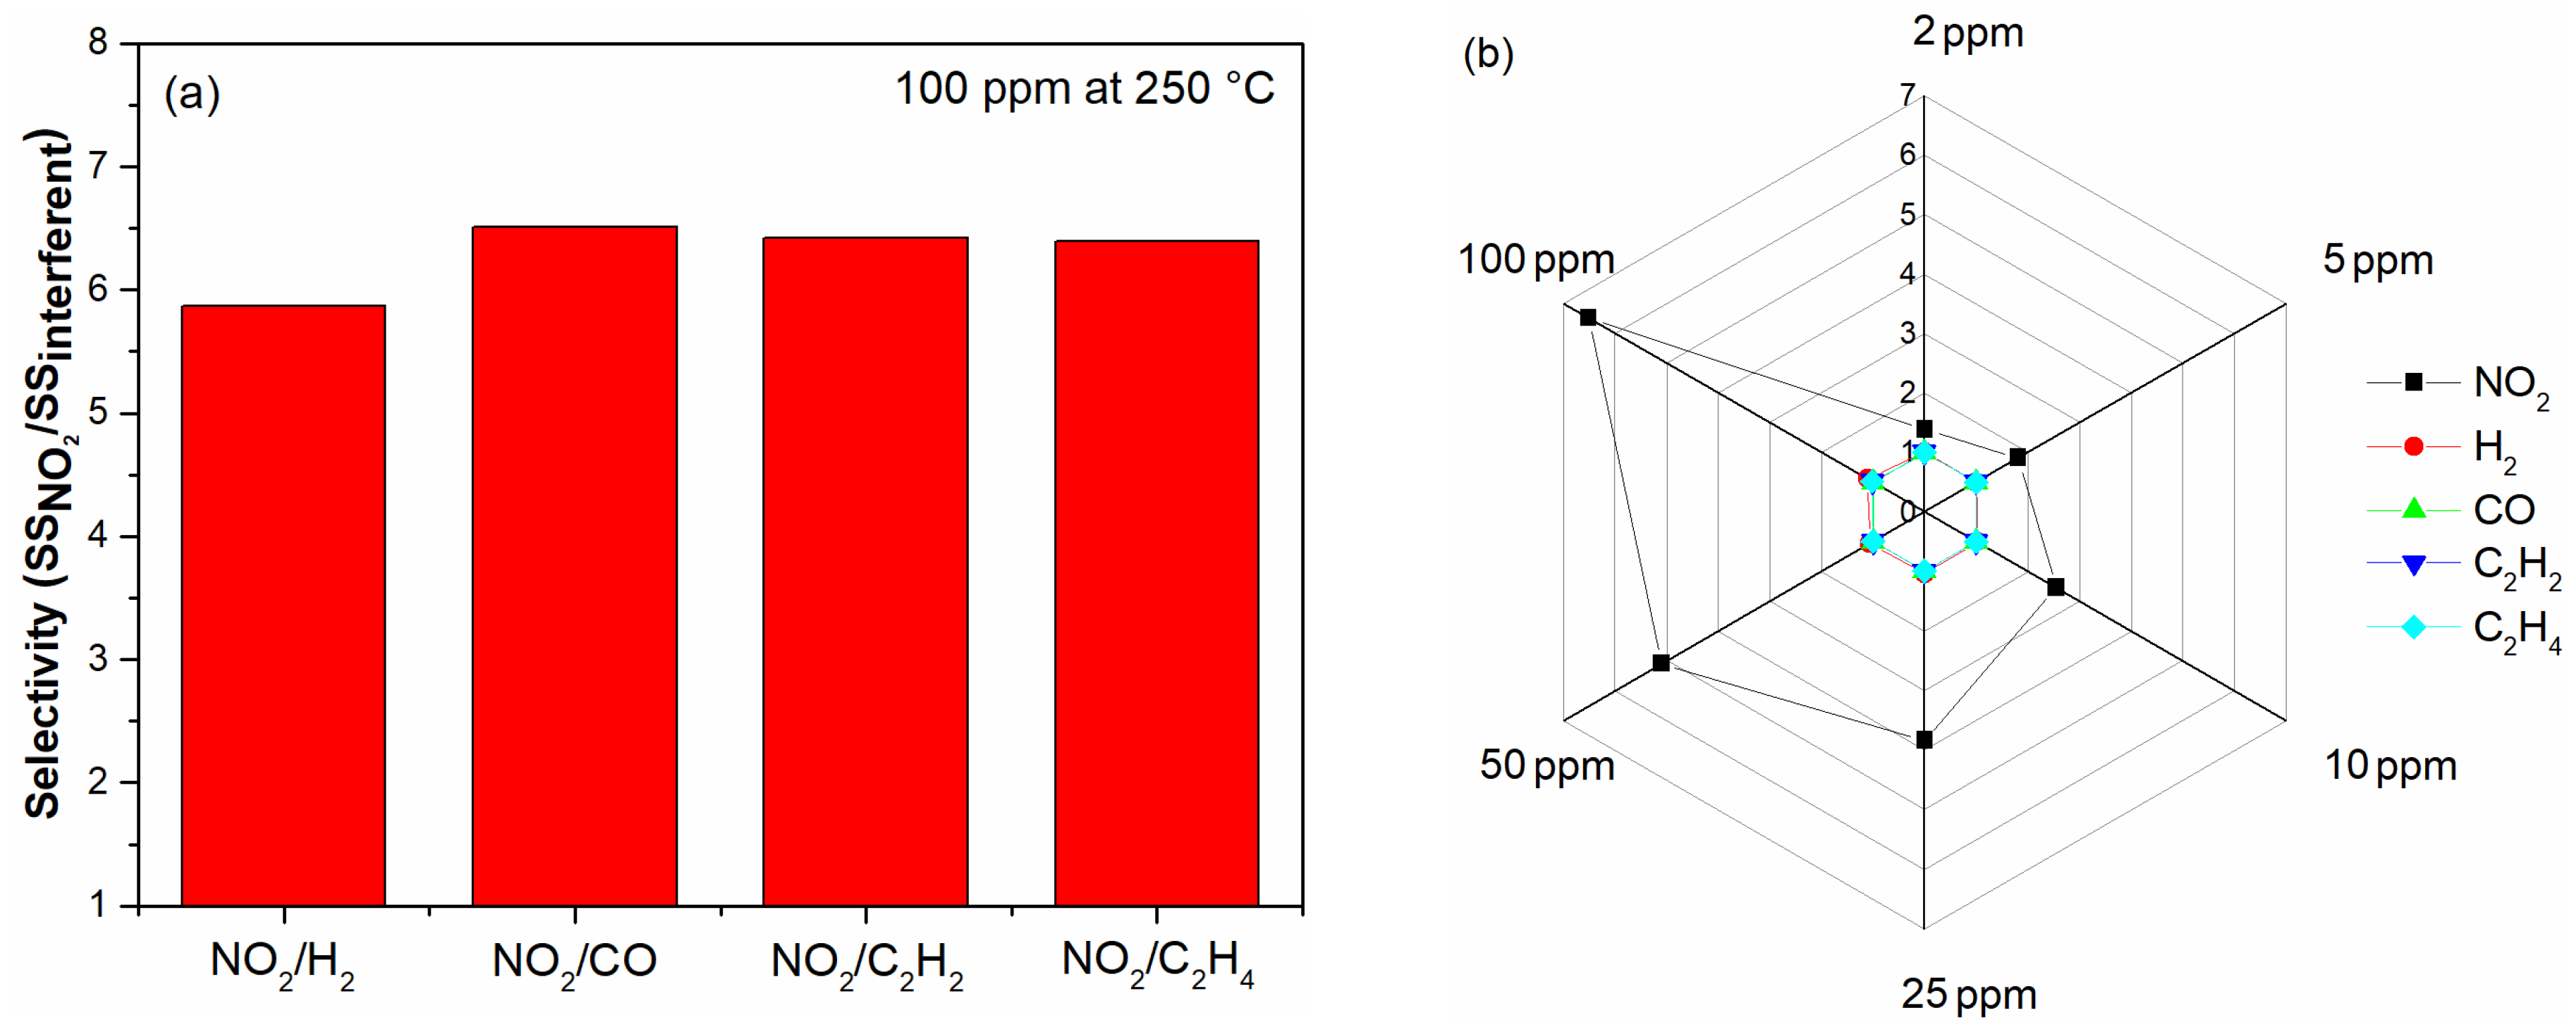
3.4. Gas Sensing Response
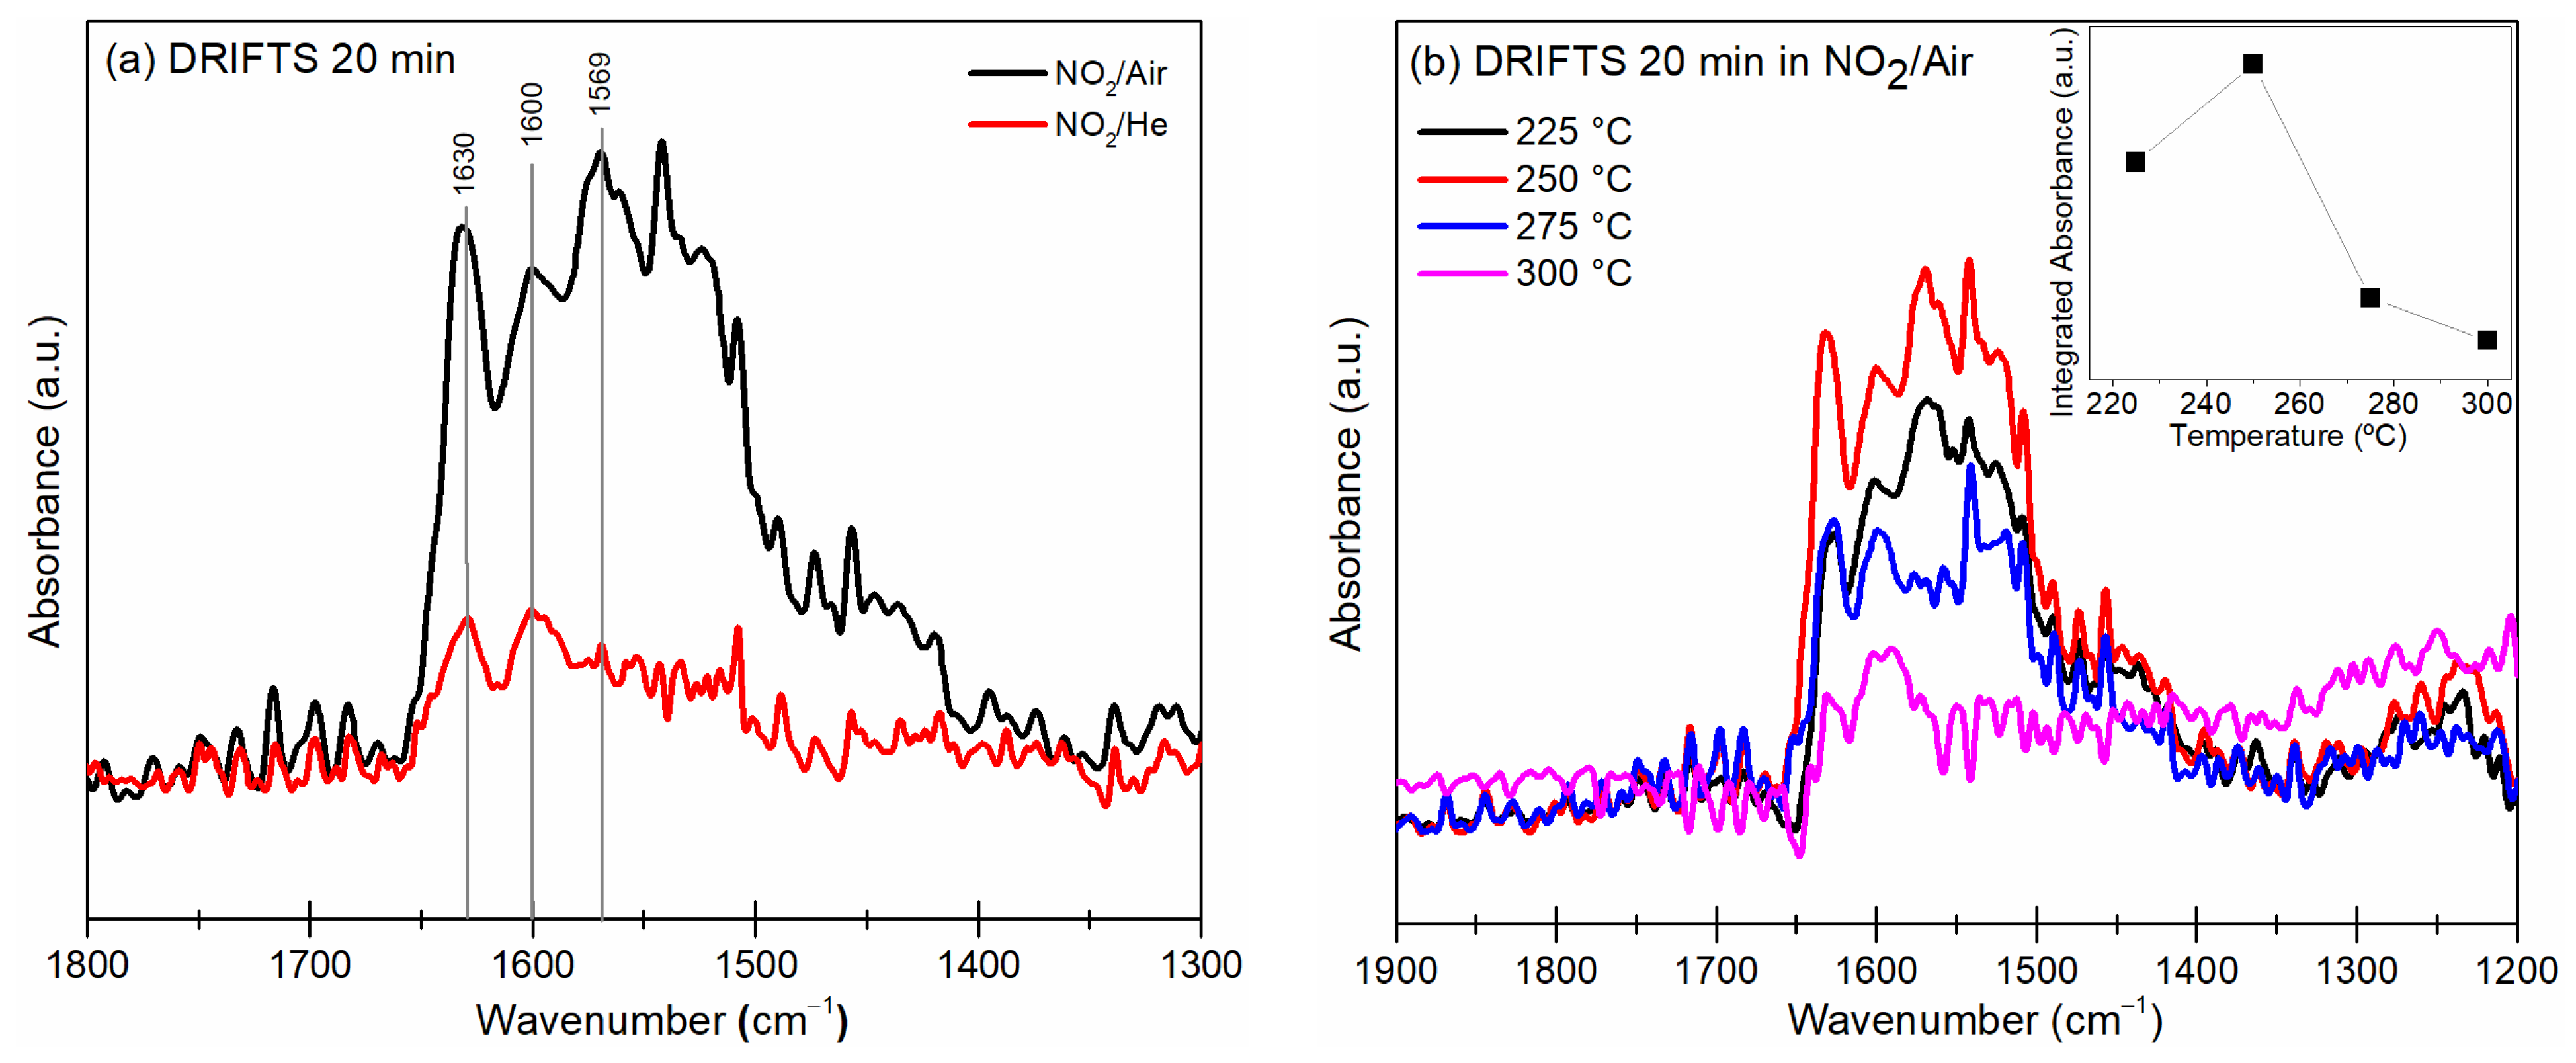
3.5. DRIFTS Measurements
4. Conclusions
Author Contributions
Funding
Institutional Review Board Statement
Informed Consent Statement
Data Availability Statement
Conflicts of Interest
References
- Zhang, J.; Wu, J.; Wang, X.; Zeng, D.; Xie, C. Enhancing room-temperature NO2 sensing properties via forming heterojunction for NiO-rGO composited with SnO2 nanoplates. Sens. Actuators B Chem. 2017, 243, 1010–1019. [Google Scholar] [CrossRef]
- Lim, N.; Lee, J.-S.; Byun, Y.T. Negatively-doped single-walled carbon nanotubes decorated with carbon dots for highly selective NO2 detection. Nanomaterials 2020, 10, 2509. [Google Scholar] [CrossRef] [PubMed]
- Lin, W.-D.; Lin, S.-Y.; Chavali, M. Improvement in NO2 gas sensing properties of semiconductor-type sensors by loading pt into BiVO4 nanocomposites at room temperature. Materials 2021, 14, 5913. [Google Scholar] [CrossRef] [PubMed]
- Gautam, Y.K.; Sharma, K.; Tyagi, S.; Ambedkar, A.K.; Chaudhary, M.; Singh, B.P. Nanostructured metal oxide semiconductor-based sensors for greenhouse gas detection: Progress and challenges. R. Soc. Open Sci. 2021, 8, 201324. [Google Scholar] [CrossRef]
- Precedence Research. Gas Sensors Market. 2022. Available online: https://www.precedenceresearch.com/gas-sensor-market (accessed on 24 February 2022).
- Transparency Market Research. NO2 Sensors Market—Global Industry Analysis, Size, Share, Growth, Trends and Forecast 2017–2025. Available online: https://www.transparencymarketresearch.com/no2-sensors-market.html (accessed on 24 February 2022).
- Bogue, R. The UK Gas Sensor Industry. Sens. Rev. 2001, 21, 98–103. [Google Scholar] [CrossRef]
- Sisman, O.; Kilinc, N.; Akkus, U.O.; Sama, J.; Romano-Rodriguez, A.; Atilla, D.; Gürek, A.G.; Ahsen, V.; Berber, S.; Ozturk, Z.Z. Hybrid liquid crystalline zinc phthalocyanine@Cu2O nanowires for NO2 sensor application. Sens. Actuators B Chem. 2021, 345, 130431. [Google Scholar] [CrossRef]
- Air Quality Standards. 2014. Available online: https://www.eea.europa.eu/themes/air/air-quality-concentrations/air-quality-standards (accessed on 24 February 2022).
- Vijjapu, M.T.; Surya, S.G.; He, J.-H.; Salama, K.N. Highly Selective Self-Powered Organic-Inorganic Hybrid Heterojunction of a Halide Perovskite and InGaZnO NO2Sensor. ACS Appl. Mater. Interfaces 2021, 13, 40460–40470. [Google Scholar] [CrossRef]
- Dai, L.; Ma, L.; Meng, W.; Li, Y.; He, Z.; Wang, L. Impedancemetric NO2 sensor based on Pd doped perovskite oxide sensing electrode conjunction with phase angle response. Electrochim. Acta 2018, 265, 411–418. [Google Scholar] [CrossRef]
- Afzal, A.; Mujahid, A.; Iqbal, N.; Javaid, R.; Qazi, U.Y. Enhanced High-Temperature (600 °C) NO2 Response of ZnFe2O4 Nanoparticle-Based Exhaust Gas Sensors. Nanomaterials 2020, 10, 2133. [Google Scholar] [CrossRef]
- Boehme, I.; Weimar, U.; Barsan, N. Unraveling the Surface Chemistry of CO Sensing with In2O3 Based Gas Sensors. Sens. Actuators B Chem. 2021, 326, 129004. [Google Scholar] [CrossRef]
- Lu, Z.; Lou, C.; Cheng, A.; Zhang, J.; Sun, J. A sensitive and ultrafast FA0.83Cs0.17PbI3 perovskite sensor for NO2 detection at room temperature. J. Alloys Compd. 2022, 919, 165831. [Google Scholar] [CrossRef]
- Urasinska-Wojcik, B.; Vincent, T.A.; Chowdhury, M.F.; Gardner, J.W. Ultrasensitive WO3 gas sensors for NO2 detection in air and low oxygen environment. Sens. Actuators B Chem. 2017, 239, 1051–1059. [Google Scholar] [CrossRef]
- Shendage, S.; Patil, V.; Vanalakar, S.; Patil, S.; Harale, N.; Bhosale, J.; Kim, J.; Patil, P. Sensitive and selective NO2 gas sensor based on WO3 nanoplates. Sens. Actuators B Chem. 2017, 240, 426–433. [Google Scholar] [CrossRef]
- Wang, Z.; Wang, D.; Sun, J. Controlled synthesis of defect-rich ultrathin two-dimensional WO3 nanosheets for NO2 gas detection. Sens. Actuators B Chem. 2017, 245, 828–834. [Google Scholar] [CrossRef]
- Mane, A.A.; Moholkar, A.V. Orthorhombic MoO3 nanobelts based NO2 gas sensor. Appl. Surf. Sci. 2017, 405, 427–440. [Google Scholar] [CrossRef]
- Navale, Y.; Navale, S.; Ramgir, N.; Stadler, F.; Gupta, S.; Aswal, D.; Patil, V. Zinc oxide hierarchical nanostructures as potential NO2 sensors. Sens. Actuators B Chem. 2017, 251, 551–563. [Google Scholar] [CrossRef]
- Barbosa, M.S.; Suman, P.H.; Kim, J.J.; Tuller, H.L.; Varela, J.A.; Orlandi, M.O. Gas sensor properties of Ag- and Pd-decorated SnO micro-disks to NO2, H2 and CO: Catalyst enhanced sensor response and selectivity. Sens. Actuators B Chem. 2017, 239, 253–261. [Google Scholar] [CrossRef]
- Suman, P.; Felix, A.; Tuller, H.; Varela, J.; Orlandi, M. Comparative gas sensor response of SnO2, SnO and Sn3O4 nanobelts to NO2 and potential interferents. Sens. Actuators B Chem. 2015, 208, 122–127. [Google Scholar] [CrossRef]
- Ueda, T.; Boehme, I.; Hyodo, T.; Shimizu, Y.; Weimar, U.; Barsan, N. Effects of Gas Adsorption Properties of an Au-Loaded Porous In2O3 Sensor on NO2-Sensing Properties. ACS Sens. 2021, 6, 4019–4028. [Google Scholar] [CrossRef]
- Barsan, N.; Weimar, U. Conduction model of metal oxide gas sensors. J. Electroceram. 2001, 7, 143–167. [Google Scholar] [CrossRef]
- Felix, A.; Longo, E.; Varela, J.; Orlandi, M. Gas sensing and conductivity relationship on nanoporous thin films: A CaCu3Ti4O12 case study. Thin Solid Films 2016, 604, 69–73. [Google Scholar] [CrossRef]
- Ramirez, A.; Subramanian, M.; Gardel, M.; Blumberg, G.; Li, D.; Vogt, T.; Shapiro, S. Giant dielectric constant response in a copper-titanate. Solid State Commun. 2000, 115, 217–220. [Google Scholar] [CrossRef]
- Chung, S.-Y.; Kim, I.-D.; Kang, S.-J.L. Strong nonlinear current-voltage behaviour in perovskite-derivative calcium copper titanate. Nat. Mater. 2004, 3, 774–778. [Google Scholar] [CrossRef] [PubMed]
- Felix, A.A.; Orlandi, M.O.; Varela, J.A. Schottky-type grain boundaries in CCTO ceramics. Solid State Commun. 2011, 151, 1377–1381. [Google Scholar] [CrossRef]
- Kim, I.-D.; Rothschild, A.; Hyodo, T.; Tuller, H.L. Microsphere templating as means of enhancing surface activity and gas sensitivity of CaCu3Ti4O12 thin films. Nano Lett. 2006, 6, 193–198. [Google Scholar] [CrossRef]
- Parra, R.; Savu, R.; Ramajo, L.; Ponce, M.; Varela, J.; Castro, M.; Bueno, P.; Joanni, E. Sol–gel synthesis of mesoporous CaCu3Ti4O12 thin films and their gas sensing response. J. Solid State Chem. 2010, 183, 1209–1214. [Google Scholar] [CrossRef]
- Oliveira, L.H.; Ramírez, M.A.; Ponce, M.A.; Ramajo, L.A.; Albuquerque, A.R.; Sambrano, J.R.; Longo, E.; Castro, M.S.; La Porta, F.A. Optical and gas-sensing properties, and electronic structure of the mixed-phase CaCu3Ti4O12/CaTiO3 composites. Mater. Res. Bull. 2009, 58, 47–55. [Google Scholar] [CrossRef]
- Pongpaiboonkul, S.; Phokharatkul, D.; Hodak, J.H.; Wisitsoraat, A.; Hodak, S.K. Enhancement of H2S-sensing performances with Fe-doping in CaCu3Ti4O12 thin films prepared by a sol-gel method. Sens. Actuators B Chem. 2016, 224, 118–127. [Google Scholar] [CrossRef]
- Ahmadipour, M.; Ain, M.F.; Ahmad, Z.A. Fabrication of resistance type humidity sensor based on CaCu3Ti4O12 thick film. Measurement 2016, 94, 902–908. [Google Scholar] [CrossRef]
- Li, M. Study of the humidity-sensing mechanism of CaCu3Ti4O12. Sens. Actuators B Chem. 2016, 228, 443–447. [Google Scholar] [CrossRef]
- Felix, A.A.; Silva, R.A.; Orlandi, M.O. Layered α-MoO3nanoplates for gas sensing applications. CrystEngComm 2020, 22, 4640–4649. [Google Scholar] [CrossRef]
- Boontum, A.; Phokharatkul, D.; Hodak, J.H.; Wisitsoraat, A.; Hodak, S.K. H2S sensing characteristics of Ni-doped CaCu3Ti4O12 films synthesized by a sol-gel method. Sens. Actuators B Chem. 2018, 260, 877–887. [Google Scholar] [CrossRef]
- Zhang, L.P.; Li, M.; Diebold, U. Characterization of Ca impurity segregation on the TiO2(110) surface. Surf. Sci. 1998, 412–413, 242–251. [Google Scholar] [CrossRef]
- Bueno, P.R.; Tararan, R.; Parra, R.; Joanni, E.; Ramírez, M.A.; Ribeiro, W.C.; Longo, E.; Varela, J.A. A polaronic stacking fault defect model for CaCu3Ti4O12 material: An approach for the origin of the huge dielectric constant and semiconducting coexistent features. J. Phys. D Appl. Phys. 2009, 42, 055404. [Google Scholar] [CrossRef]
- Deng, G.; Xanthopoulos, N.; Muralt, P. Chemical nature of colossal dielectric constant of CaCu3Ti4O12 thin film by pulsed laser deposition. Appl. Phys. Lett. 2008, 92, 172909. [Google Scholar] [CrossRef]
- Singh, L.; Rai, U.; Mandal, K.; Singh, N. Progress in the growth of CaCu3Ti4O12 and related functional dielectric perovskites. Prog. Cryst. Growth Charact. Mater. 2014, 60, 15–62. [Google Scholar] [CrossRef]
- Gurlo, A.; Barsan, N.; Weimar, U. Gas Sensors Based on Semiconducting Metal Oxides. In Metal Oxides: Chemistry and Applications; Fierro, J.L.G., Ed.; Taylor & Francis Group: Boca Raton, FL, USA, 2006; pp. 683–729. [Google Scholar]
- Russ, T.; Hu, Z.; Li, L.; Zhou, L.; Liu, H.; Weimar, U.; Barsan, N. In Operando Investigation of the Concentration Dependent NO2 Sensing Mechanism of Bi2S3 Nanorods at Low Temperatures and the Interference of O3. ACS Sens. 2022, 7, 3023–3031. [Google Scholar] [CrossRef]
- Pavlovich, M.J.; Ono, T.; Galleher, C.; Curtis, B.; Clark, D.S.; Machala, Z.; Graves, D.B. Air spark-like plasma source for antimicrobial NOx generation. J. Phys. D Appl. Phys. 2014, 47, 505202. [Google Scholar] [CrossRef]
- Isapour, G.; Wang, A.; Han, J.; Feng, Y.; Grönbeck, H.; Creaser, D.; Olsson, L.; Skoglundh, M.; Härelind, H. In situ DRIFT studies on N2O formation over Cu-functionalized zeolites during ammonia-SCR. Catal. Sci. Technol. 2022, 12, 3921–3936. [Google Scholar] [CrossRef]
- Mayerhöfer, T.G.; Pipa, A.V.; Popp, J. Beer’s Law-Why Integrated Absorbance Depends Linearly on Concentration. ChemPhysChem 2019, 20, 2748–2753. [Google Scholar] [CrossRef]
- Chen, H.-Y.; Kollar, M.; Wei, Z.; Gao, F.; Wang, Y.; Szanyi, J.; Peden, C.H. Formation of NO+ and its possible roles during the selective catalytic reduction of NOx with NH3 on Cu-CHA catalysts. Catal. Today 2019, 320, 61–71. [Google Scholar] [CrossRef]
- Wang, D.; Zhang, L.; Kamasamudram, K.; Epling, W.S. In situ-DRIFTS study of selective catalytic reduction of NOx by NH3 over Cu-exchanged SAPO-34. ACS Catal. 2013, 3, 871–881. [Google Scholar] [CrossRef]
- Zhang, J.; Zeng, D.; Zhu, Q.; Wu, J.; Huang, Q.; Xie, C. Effect of Nickel Vacancies on the Room-Temperature NO2 Sensing Properties of Mesoporous NiO Nanosheets. J. Phys. Chem. C 2016, 120, 3936–3945. [Google Scholar] [CrossRef]
- Roso, S.; Degler, D.; Llobet, E.; Barsan, N.; Urakawa, A. Temperature-Dependent NO2 Sensing Mechanisms over Indium Oxide. ACS Sens. 2017, 2, 1272–1277. [Google Scholar] [CrossRef]


| Sample | CCTO | ||
|---|---|---|---|
| Element | Binding Energy 1 | Area 2 | Oxidation State 3 |
| Ca | 346.4 | 79.1% | Ca2+ |
| 347.2 | 20.9% | CaTiO3 | |
| Cu | 932.5 | 8.0% | Cu+ |
| 934.1 | 92.0% | Cu2+ | |
| Ti | 457.9 | 23.3% | Ti3+ |
| 458.6 | 76.7% | Ti4+ | |
| O | 529.8 | 89.2% | O2− |
| 532.0 | 10.8% | ||
Disclaimer/Publisher’s Note: The statements, opinions and data contained in all publications are solely those of the individual author(s) and contributor(s) and not of MDPI and/or the editor(s). MDPI and/or the editor(s) disclaim responsibility for any injury to people or property resulting from any ideas, methods, instructions or products referred to in the content. |
© 2023 by the authors. Licensee MDPI, Basel, Switzerland. This article is an open access article distributed under the terms and conditions of the Creative Commons Attribution (CC BY) license (https://creativecommons.org/licenses/by/4.0/).
Share and Cite
Espinoza-González, R.; Caamaño, J.; Castillo, X.; Orlandi, M.O.; Felix, A.A.; Flores, M.; Blanco, A.; Castro-Castillo, C.; Gracia, F. Selective NO2 Detection of CaCu3Ti4O12 Ceramic Prepared by the Sol-Gel Technique and DRIFT Measurements to Elucidate the Gas Sensing Mechanism. Materials 2023, 16, 3390. https://doi.org/10.3390/ma16093390
Espinoza-González R, Caamaño J, Castillo X, Orlandi MO, Felix AA, Flores M, Blanco A, Castro-Castillo C, Gracia F. Selective NO2 Detection of CaCu3Ti4O12 Ceramic Prepared by the Sol-Gel Technique and DRIFT Measurements to Elucidate the Gas Sensing Mechanism. Materials. 2023; 16(9):3390. https://doi.org/10.3390/ma16093390
Chicago/Turabian StyleEspinoza-González, Rodrigo, Josefa Caamaño, Ximena Castillo, Marcelo O. Orlandi, Anderson A. Felix, Marcos Flores, Adriana Blanco, Carmen Castro-Castillo, and Francisco Gracia. 2023. "Selective NO2 Detection of CaCu3Ti4O12 Ceramic Prepared by the Sol-Gel Technique and DRIFT Measurements to Elucidate the Gas Sensing Mechanism" Materials 16, no. 9: 3390. https://doi.org/10.3390/ma16093390