

Fatigue Behavior of Sandstone Exposed to Cyclic Point-Loading: Implications for Improving Mechanized Rock Breakage Efficiency
 , and
, and
Abstract
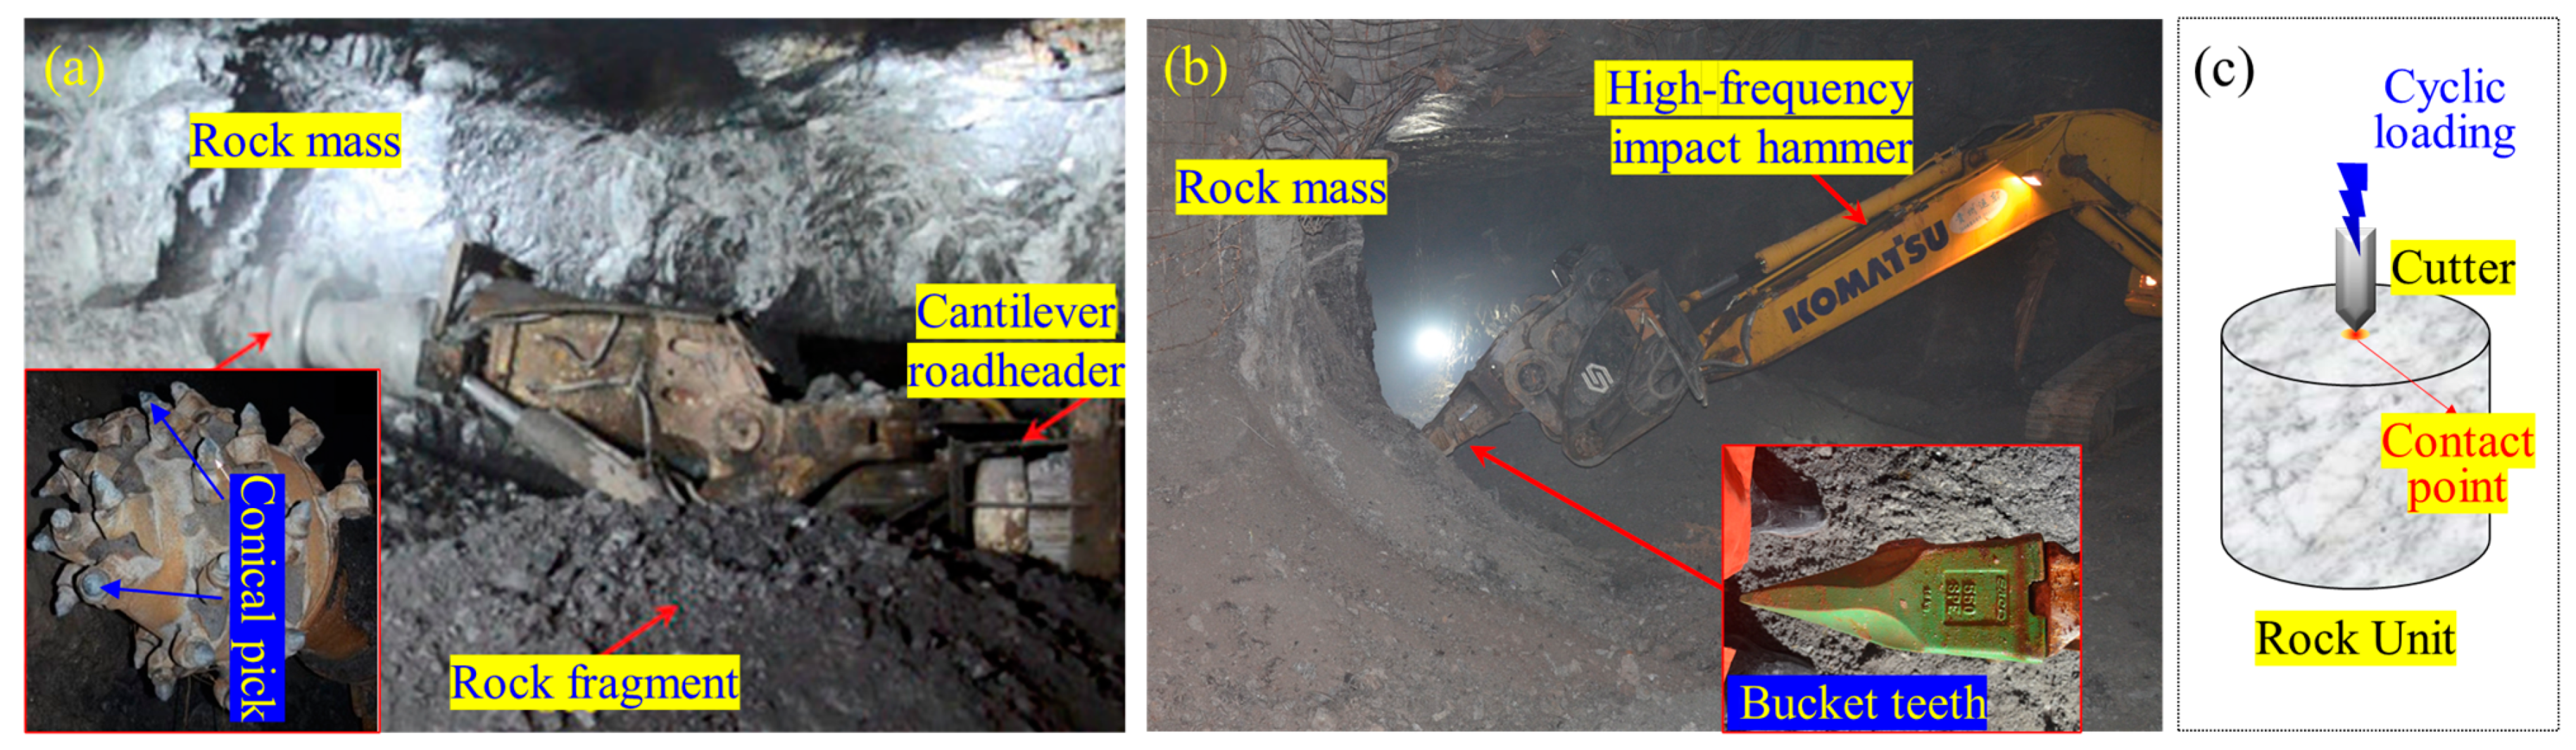
:1. Introduction
2. Apparatus Design and Test Methodology
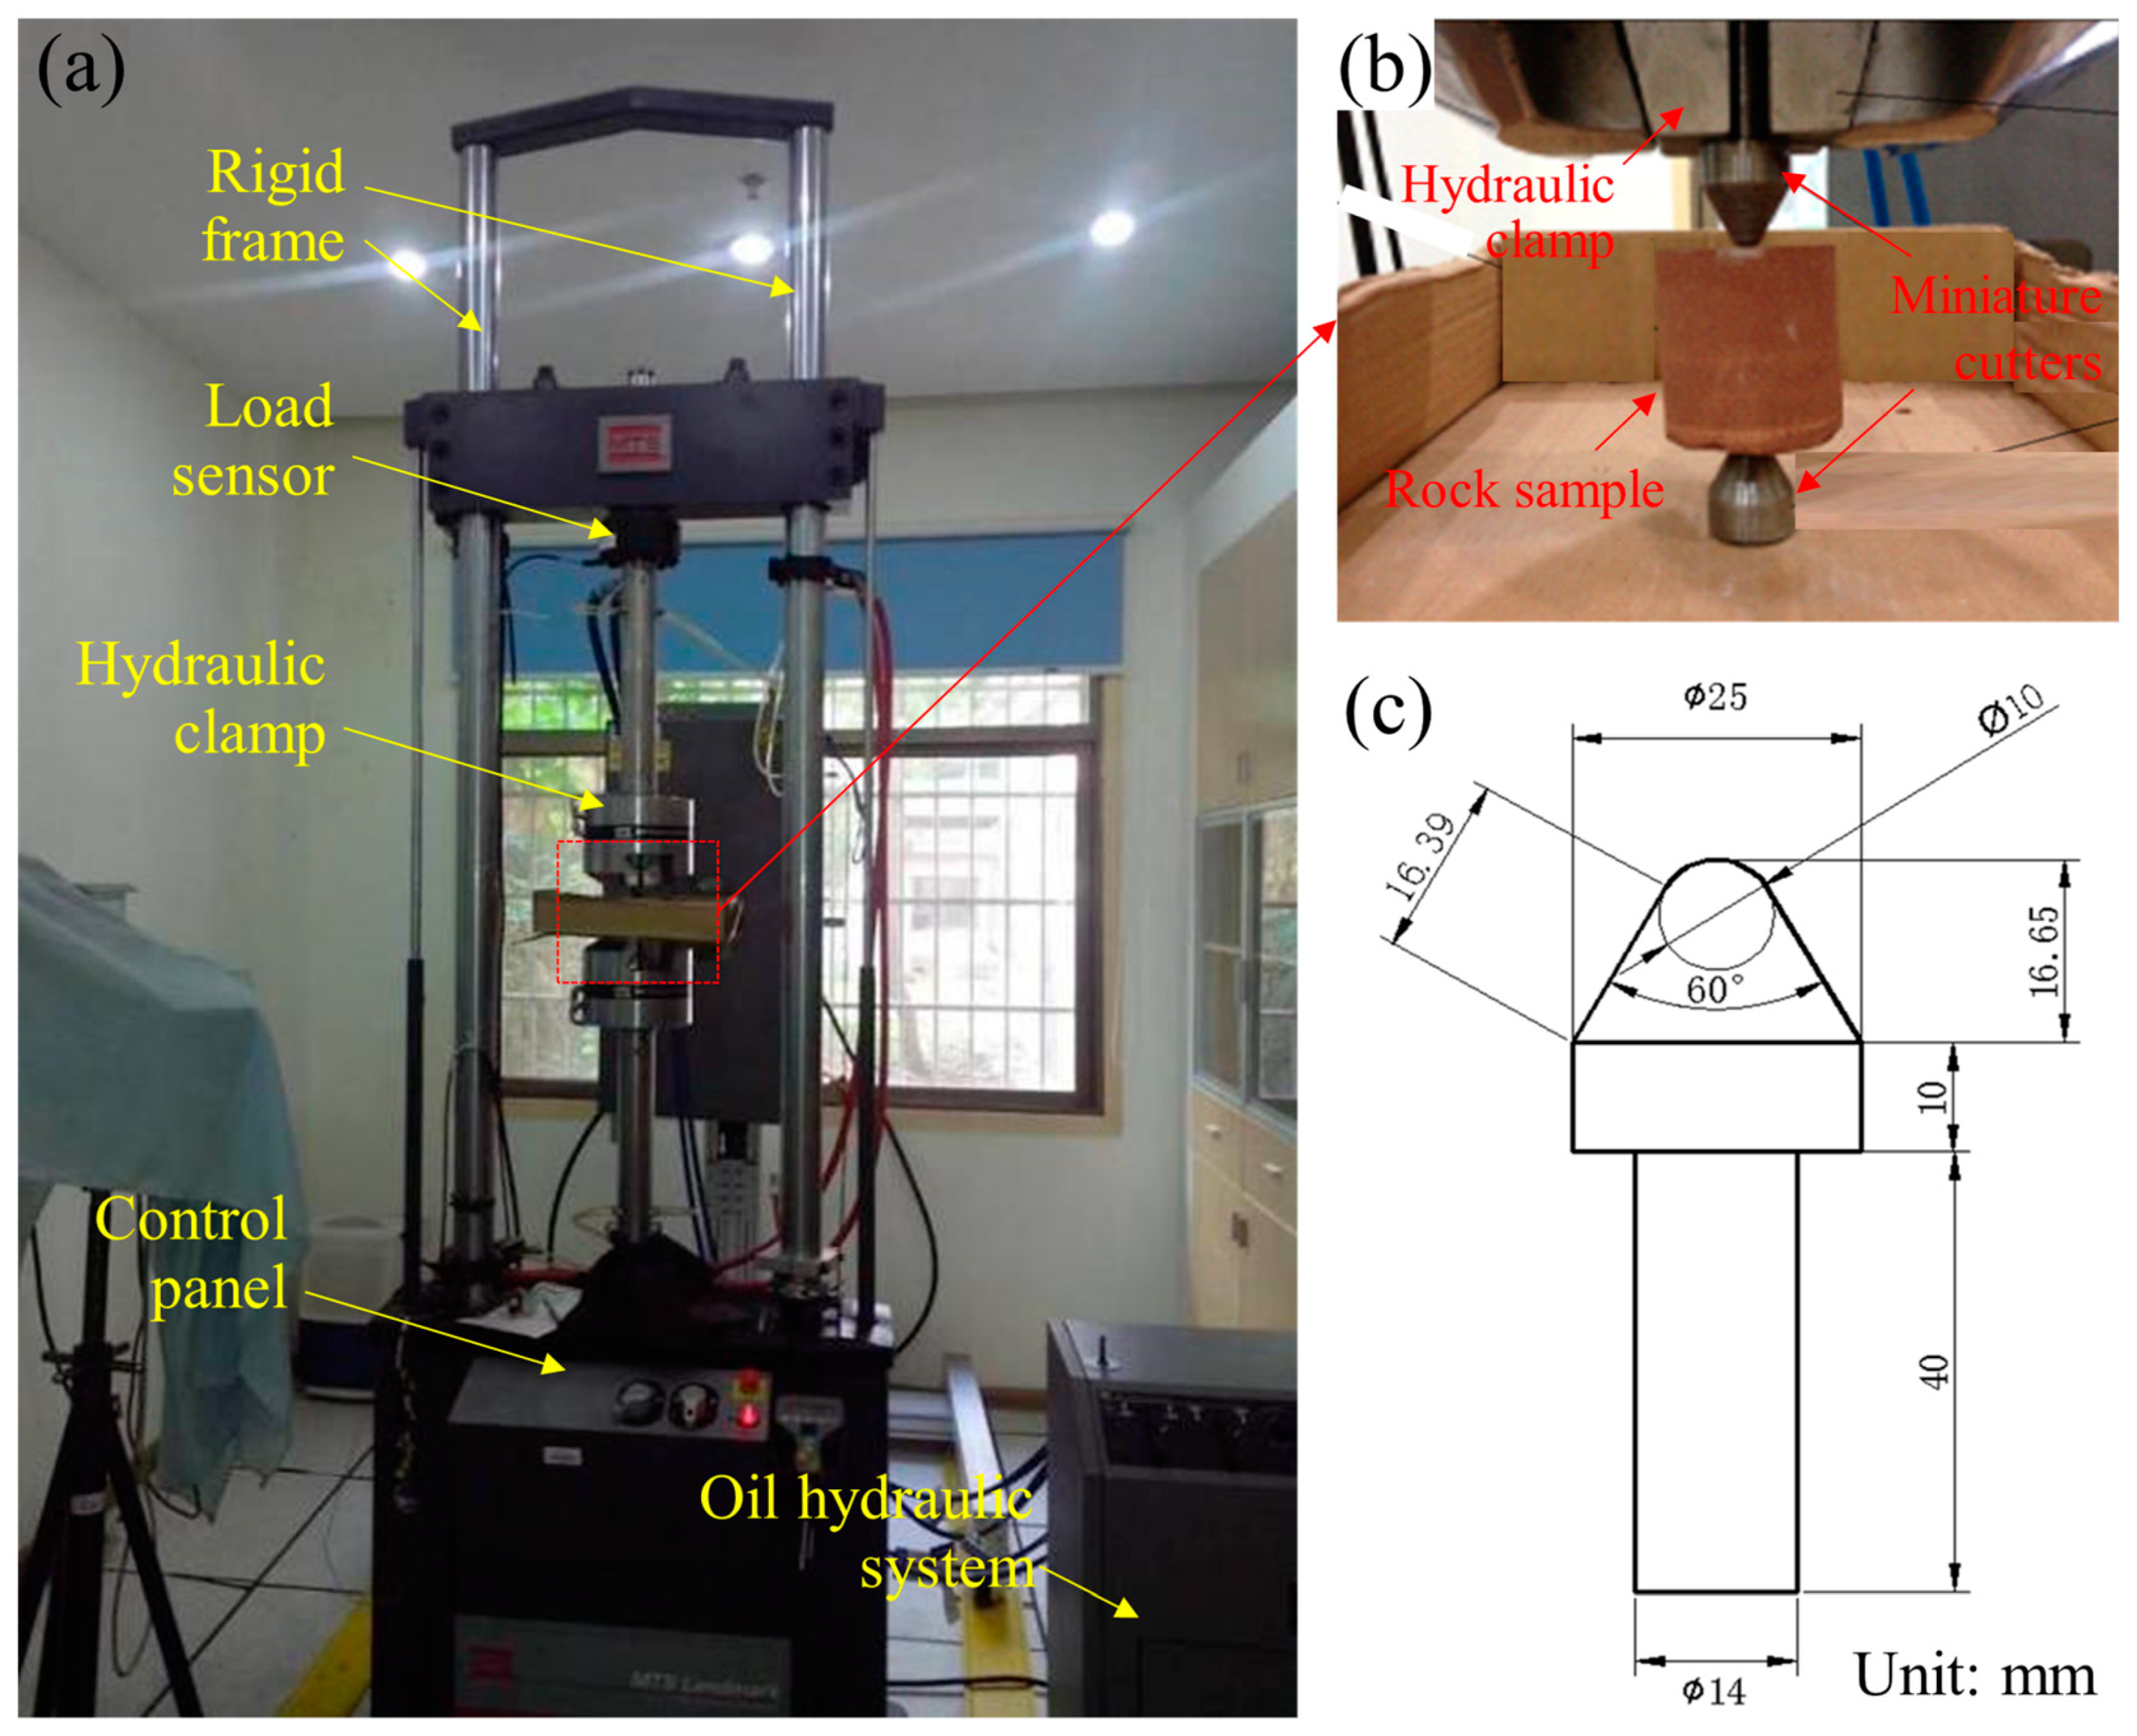
2.1. Apparatus Structure
2.2. Sample Requirements
- (1)
- Rock samples should be retrieved from the rock slate without visible geological weakness to minimize the property dispersion across the samples.
- (2)
- The size of the sample should be at least 10 times greater than the average grain size in the rock.
- (3)
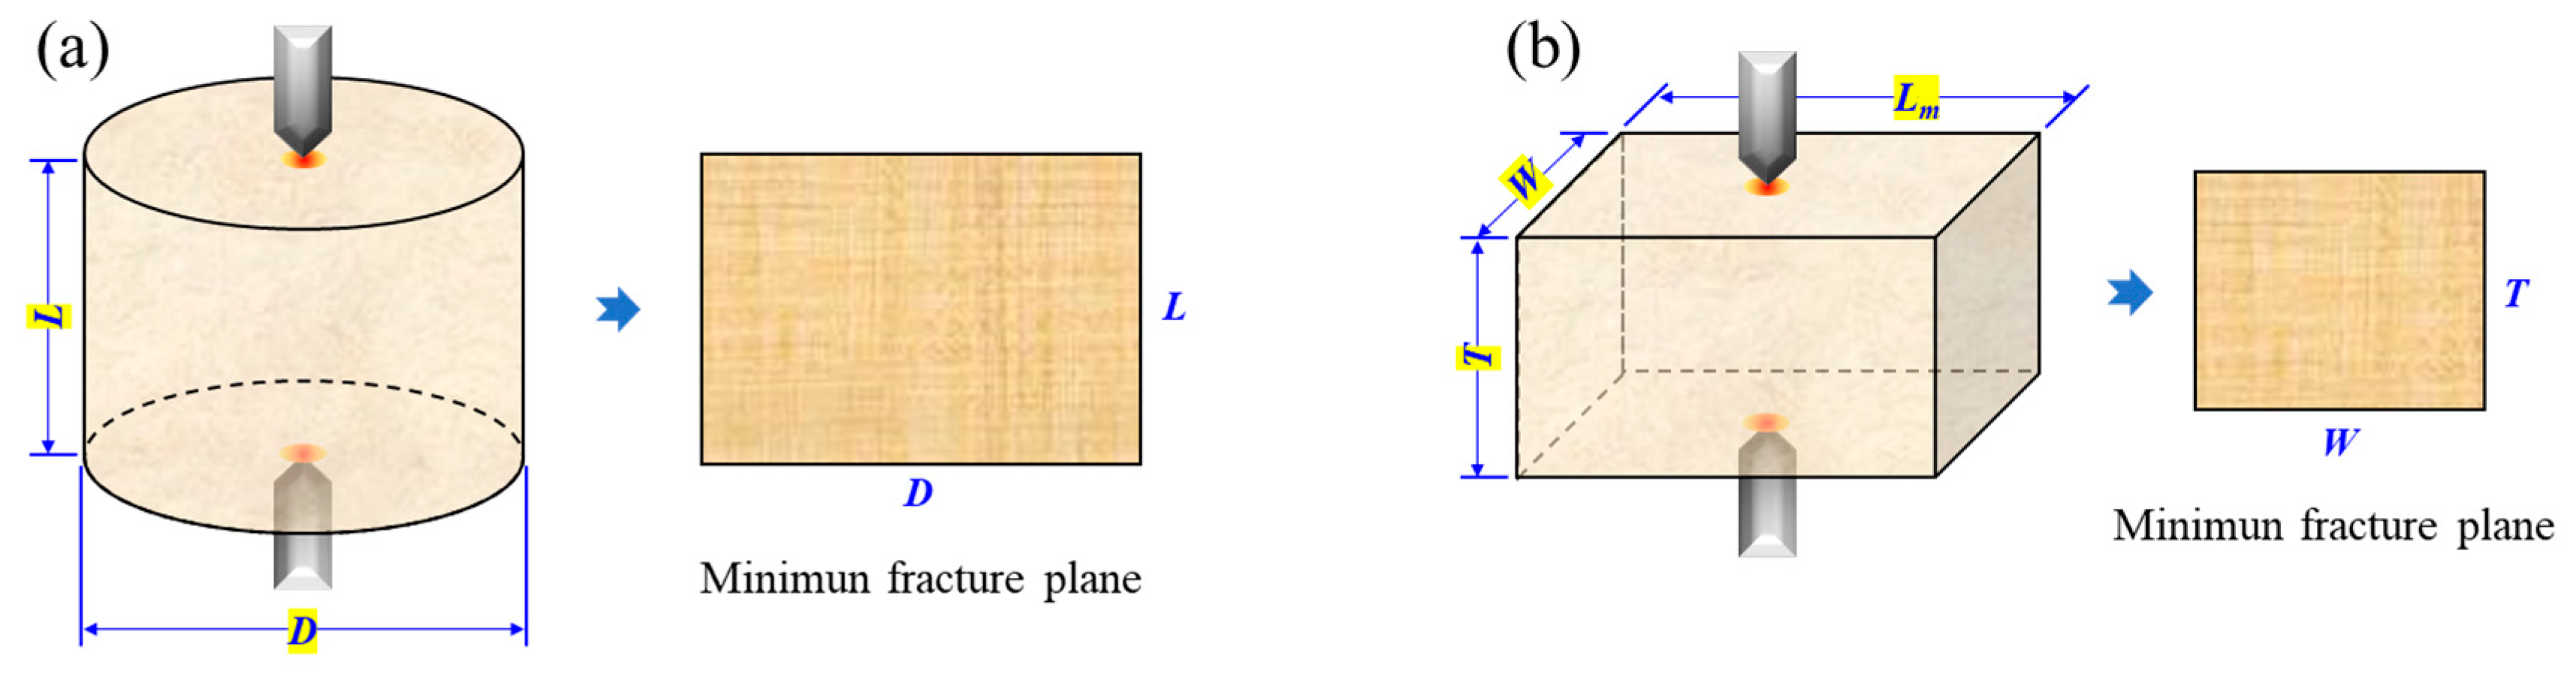
- Cylindrical samples with a length/diameter (L/D) ratio of 0.3–1.0 are preferable (Figure 3a). The ends of the sample should be polished to ensure that the ends are flat to 0.02 mm and depart from perpendicularity to the axis of the sample by less than 0.001 rad.
- (4)
- A rock block is an alternative for the sample shape (Figure 3b). The ratio of thickness (T) to width (W) should be between 0.3 and 1.0. The main side length (Lm) should be at least 0.5 W.
- (5)
- For routine testing, the sample should be dried (naturally dried or oven-dried) before testing to eliminate the moisture effect on the test results.
2.3. Testing Procedures
- (1)
- The selected cutter is tightly installed at the hydraulic clamp.
- (2)
- The sample is inserted between a pair of cutters that are closed to make contact along a line perpendicular to the end surfaces of the sample.
- (3)
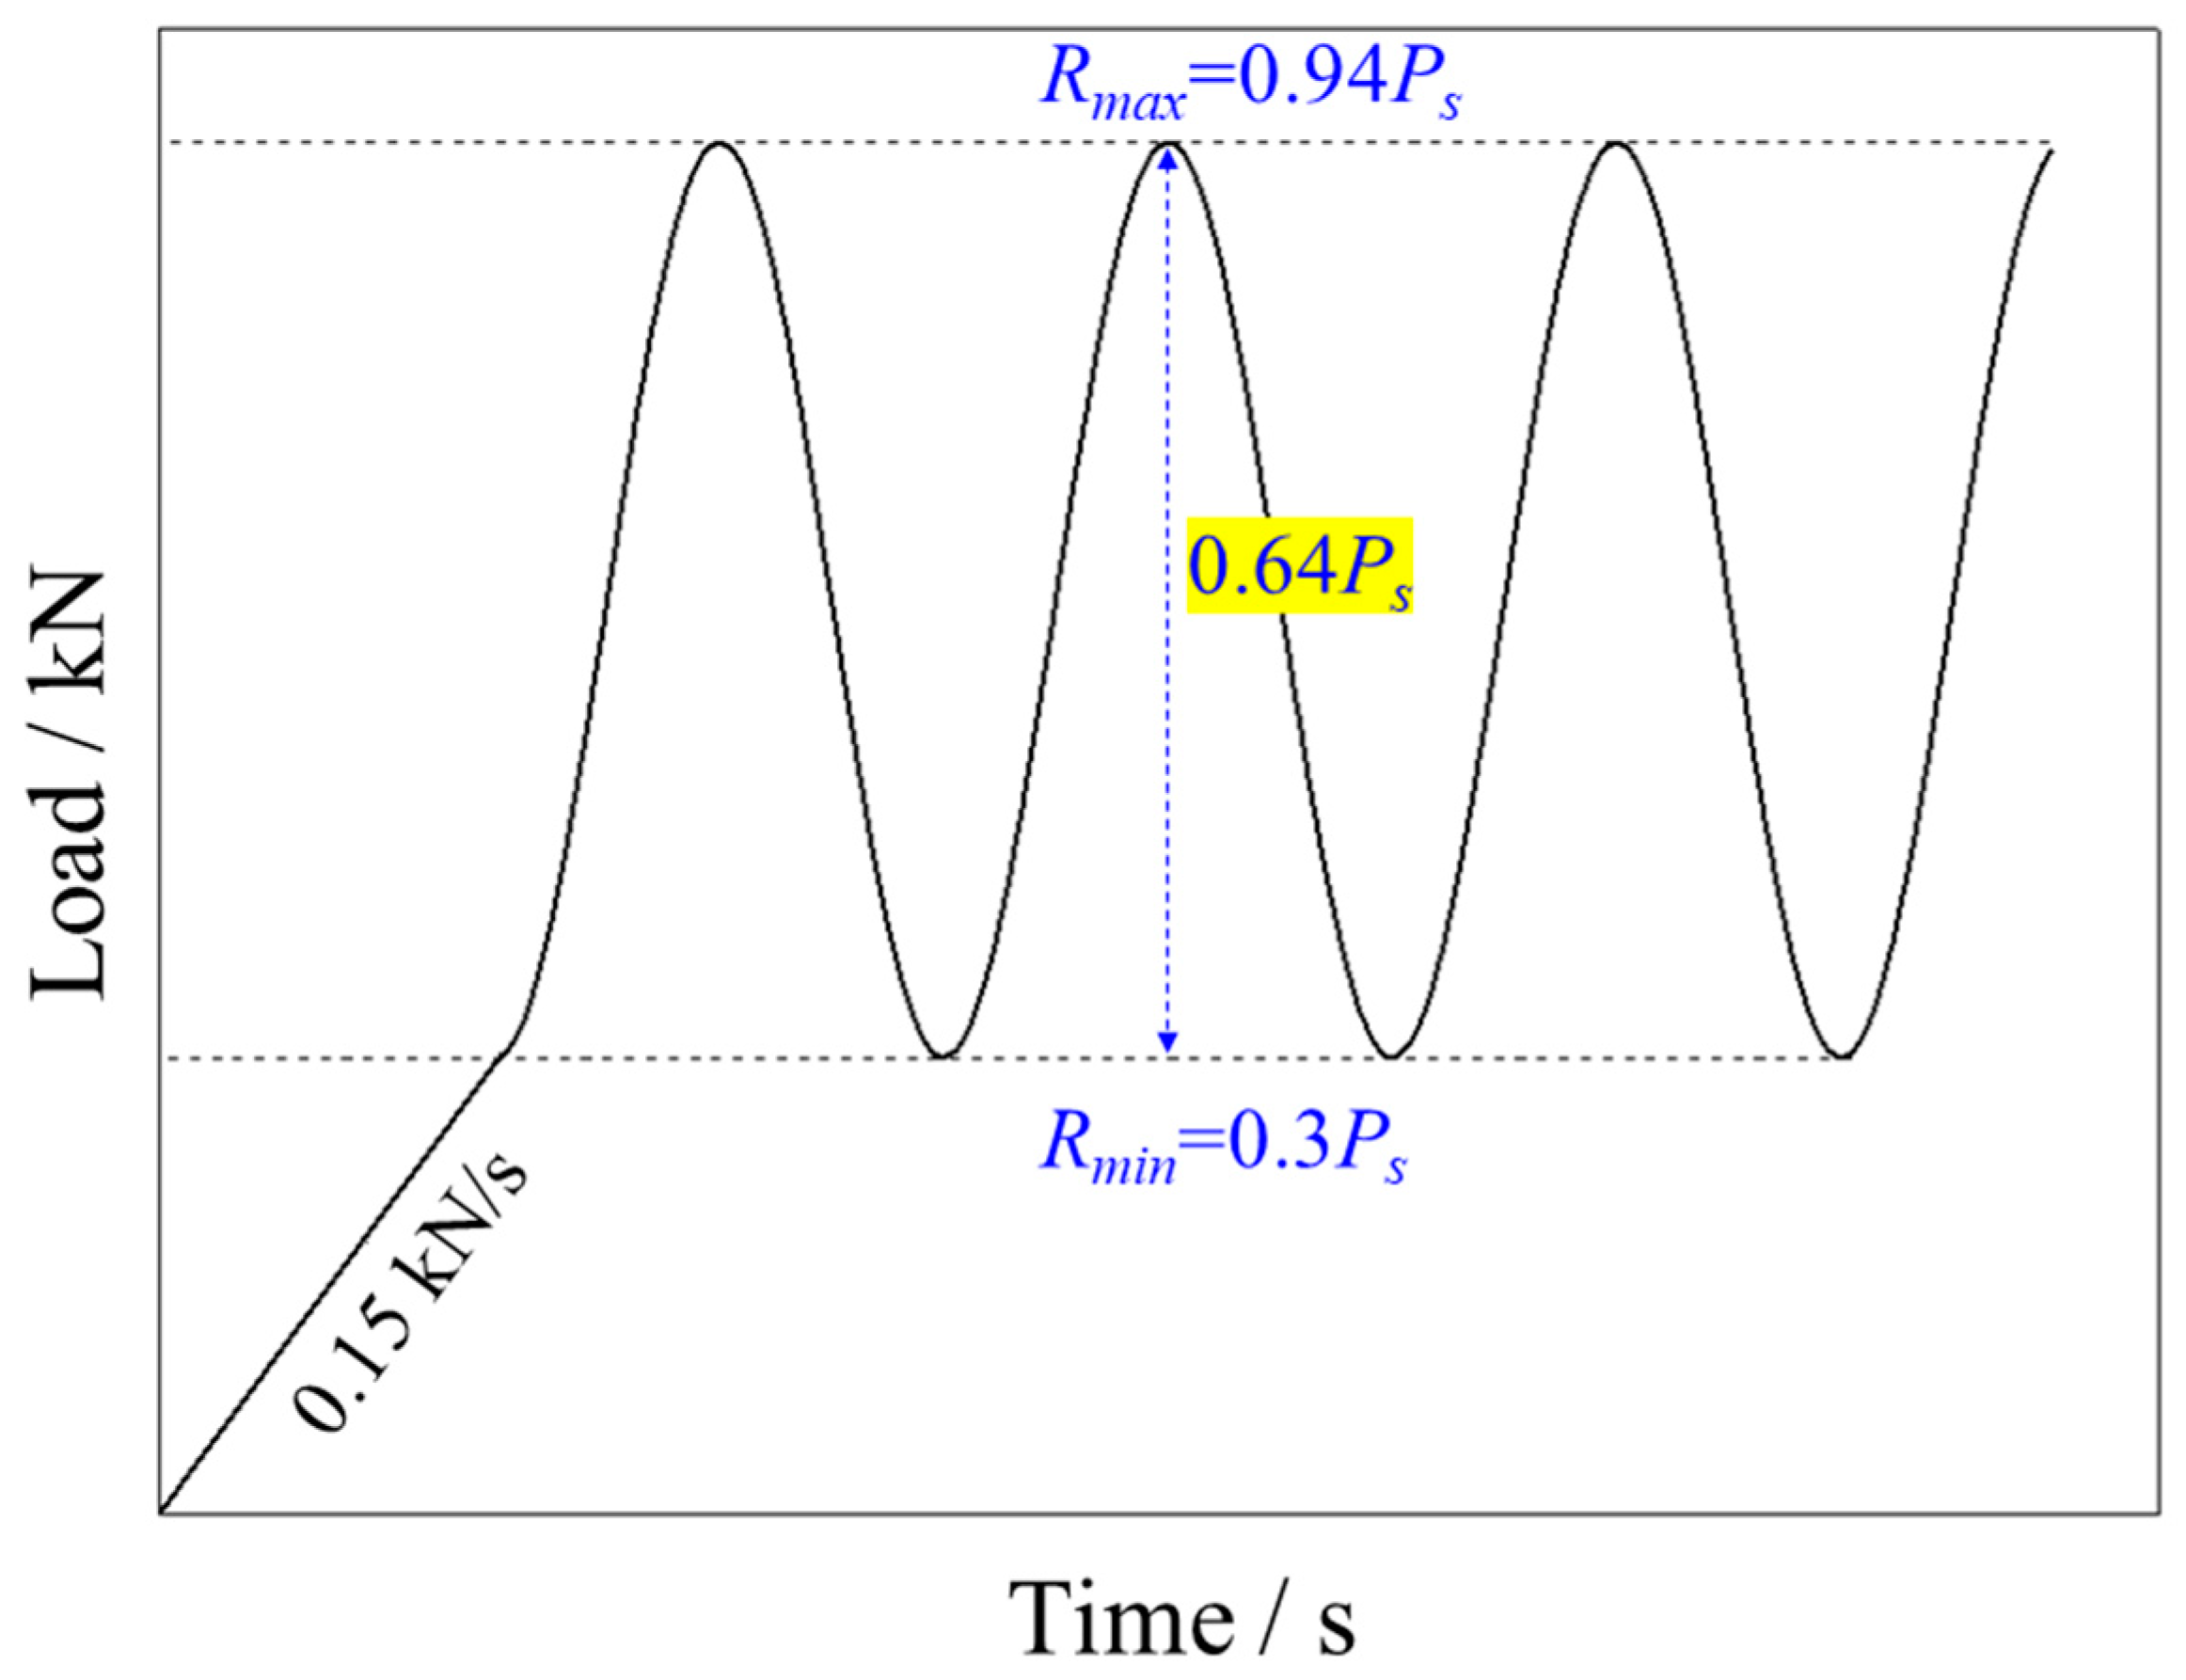
- The cyclic loading path is input into the computer program and then the desired load is applied on the sample until the failure of the sample.
- (4)
- The applied load F and indentation depth δ (i.e., axial displacement) are monitored and recorded by a force sensor in the MTS landmark and a linear variable differential transformer (LVDT), respectively. The curve of F-δ of the rock sample is obtained, and the fatigue behavior of the sample can be determined accordingly. The moment when the force declines to zero is defined as the failure time of the sample.
2.4. Data Reduction
3. Experimental Schemes
3.1. Material Characterization and Sample Preparation
3.2. Loading Schemes
3.2.1. CPL Testing with Different Loading Frequencies
3.2.2. CPL Testing with Different Waveforms
4. Experimental Results and Discussion
4.1. Effects of Loading Frequency on Rock Behavior under Cyclic Point Loading
4.1.1. Failure Pattern
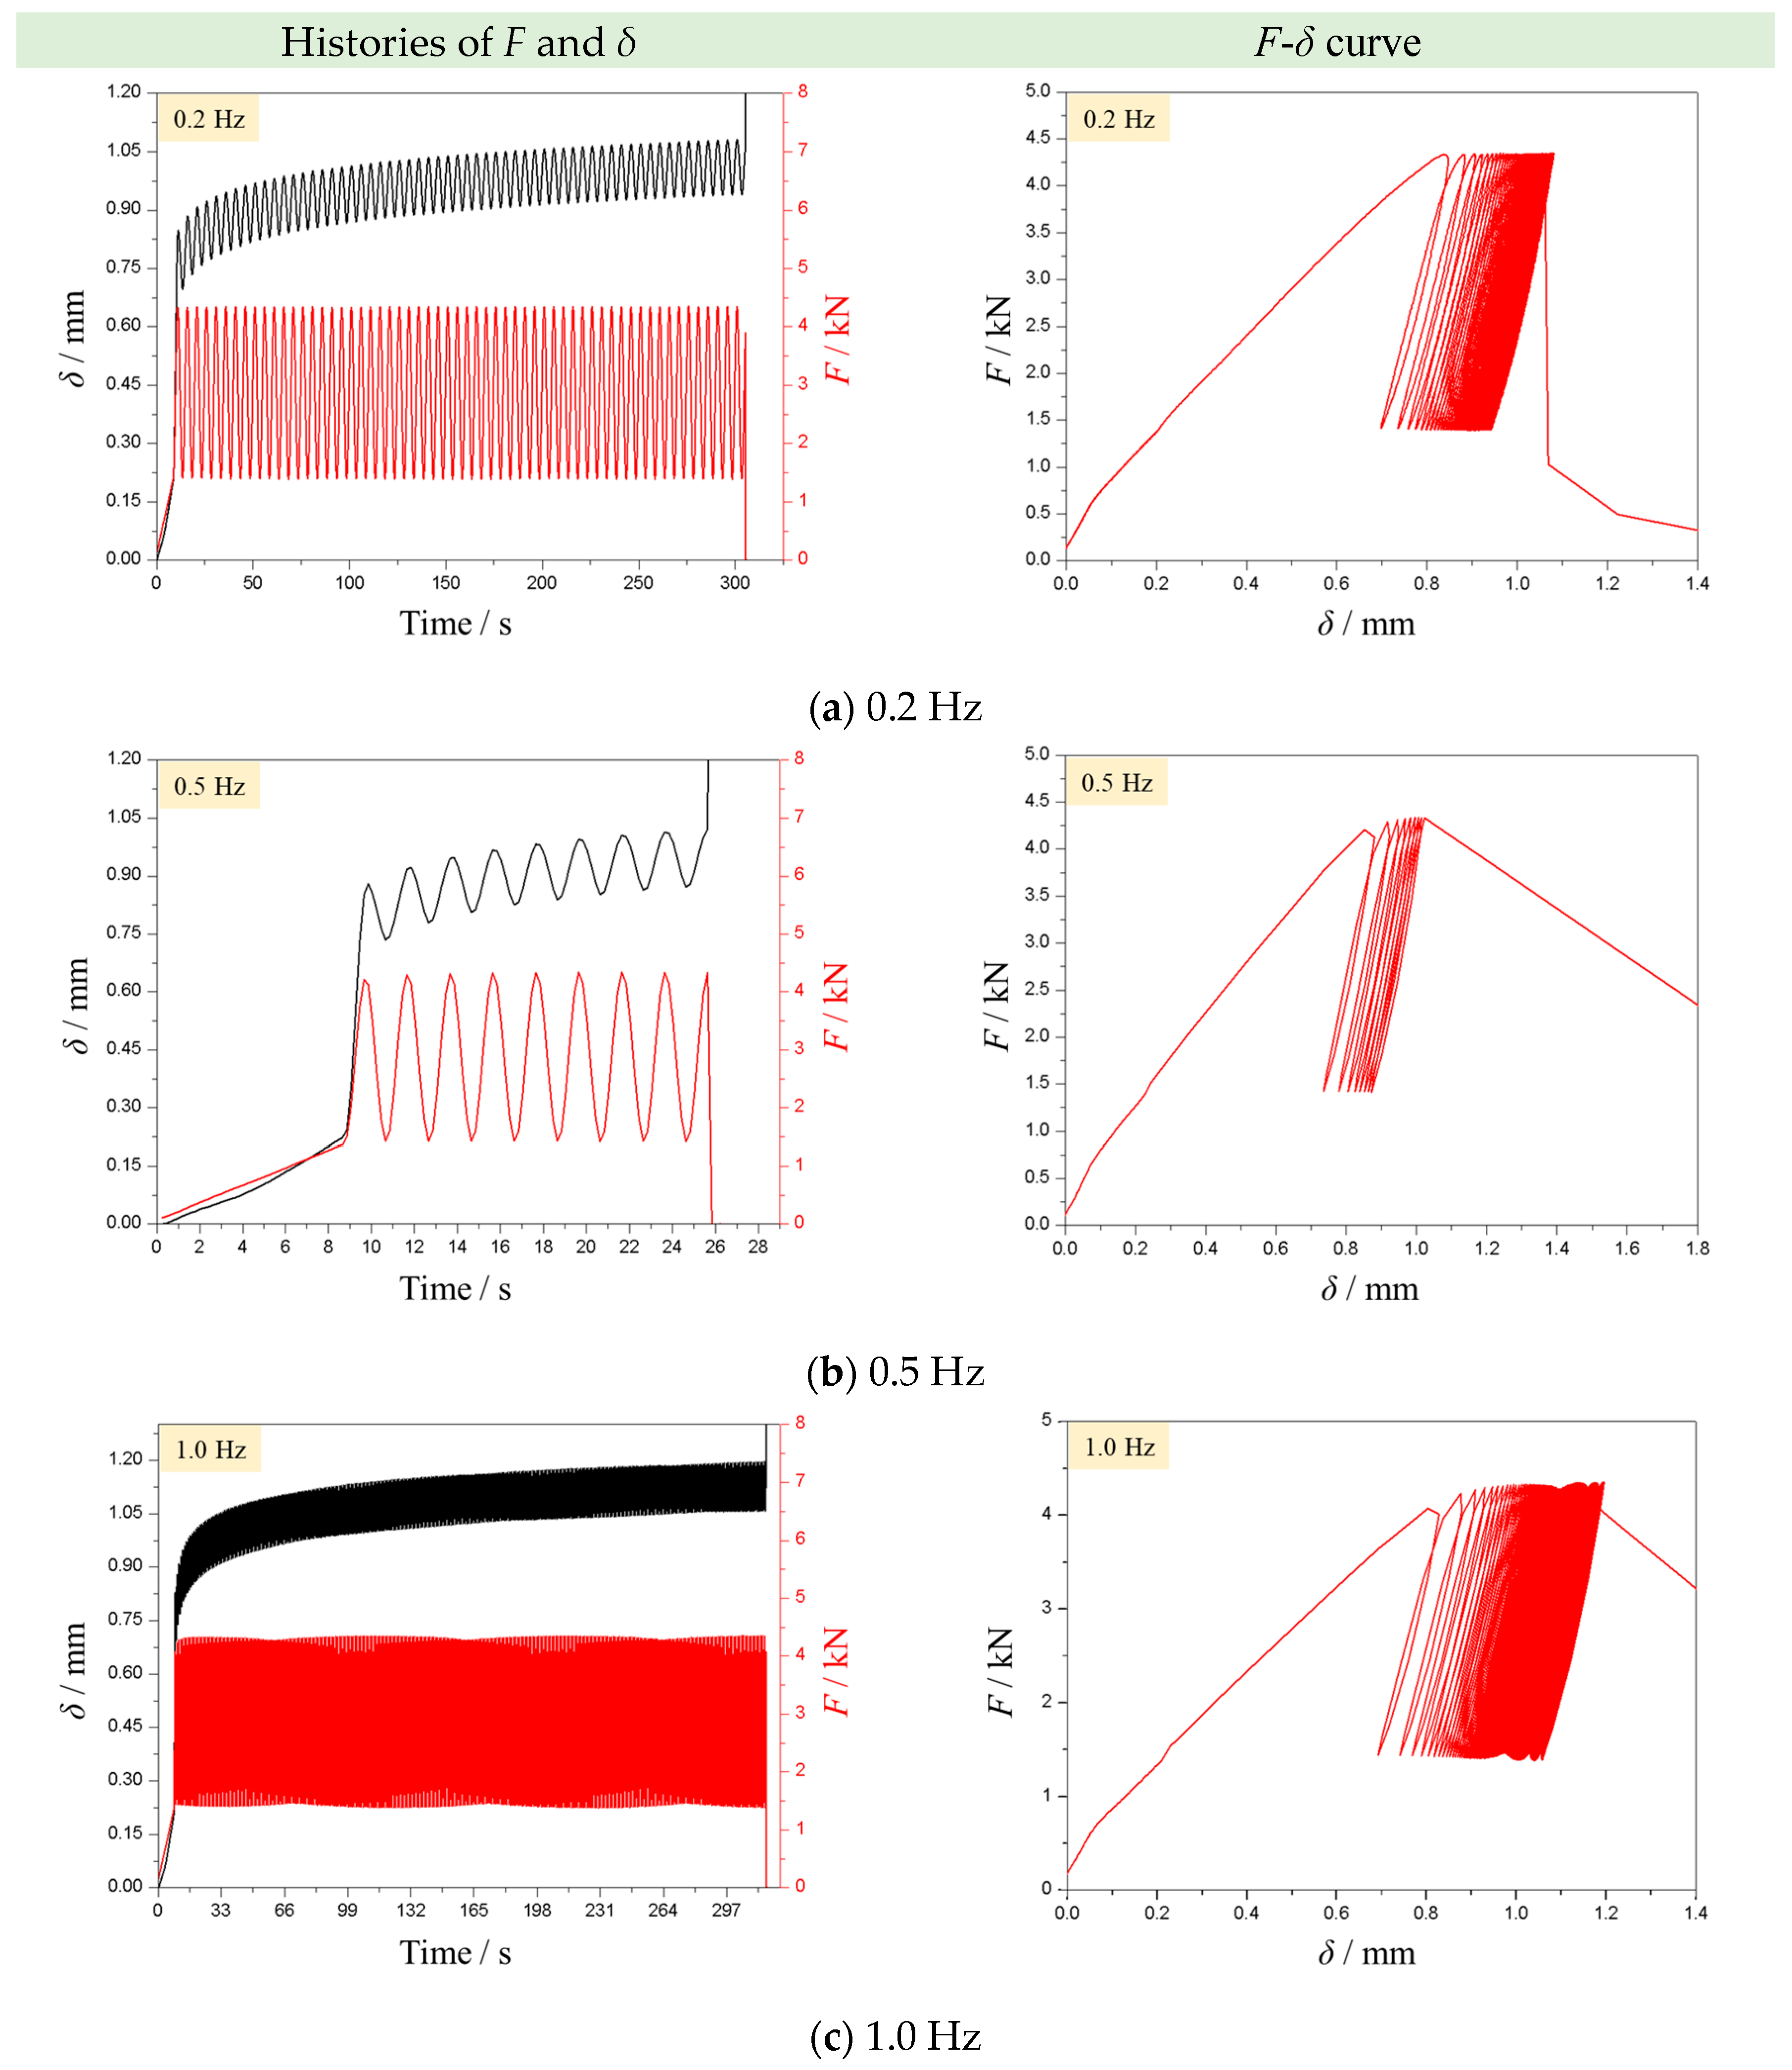
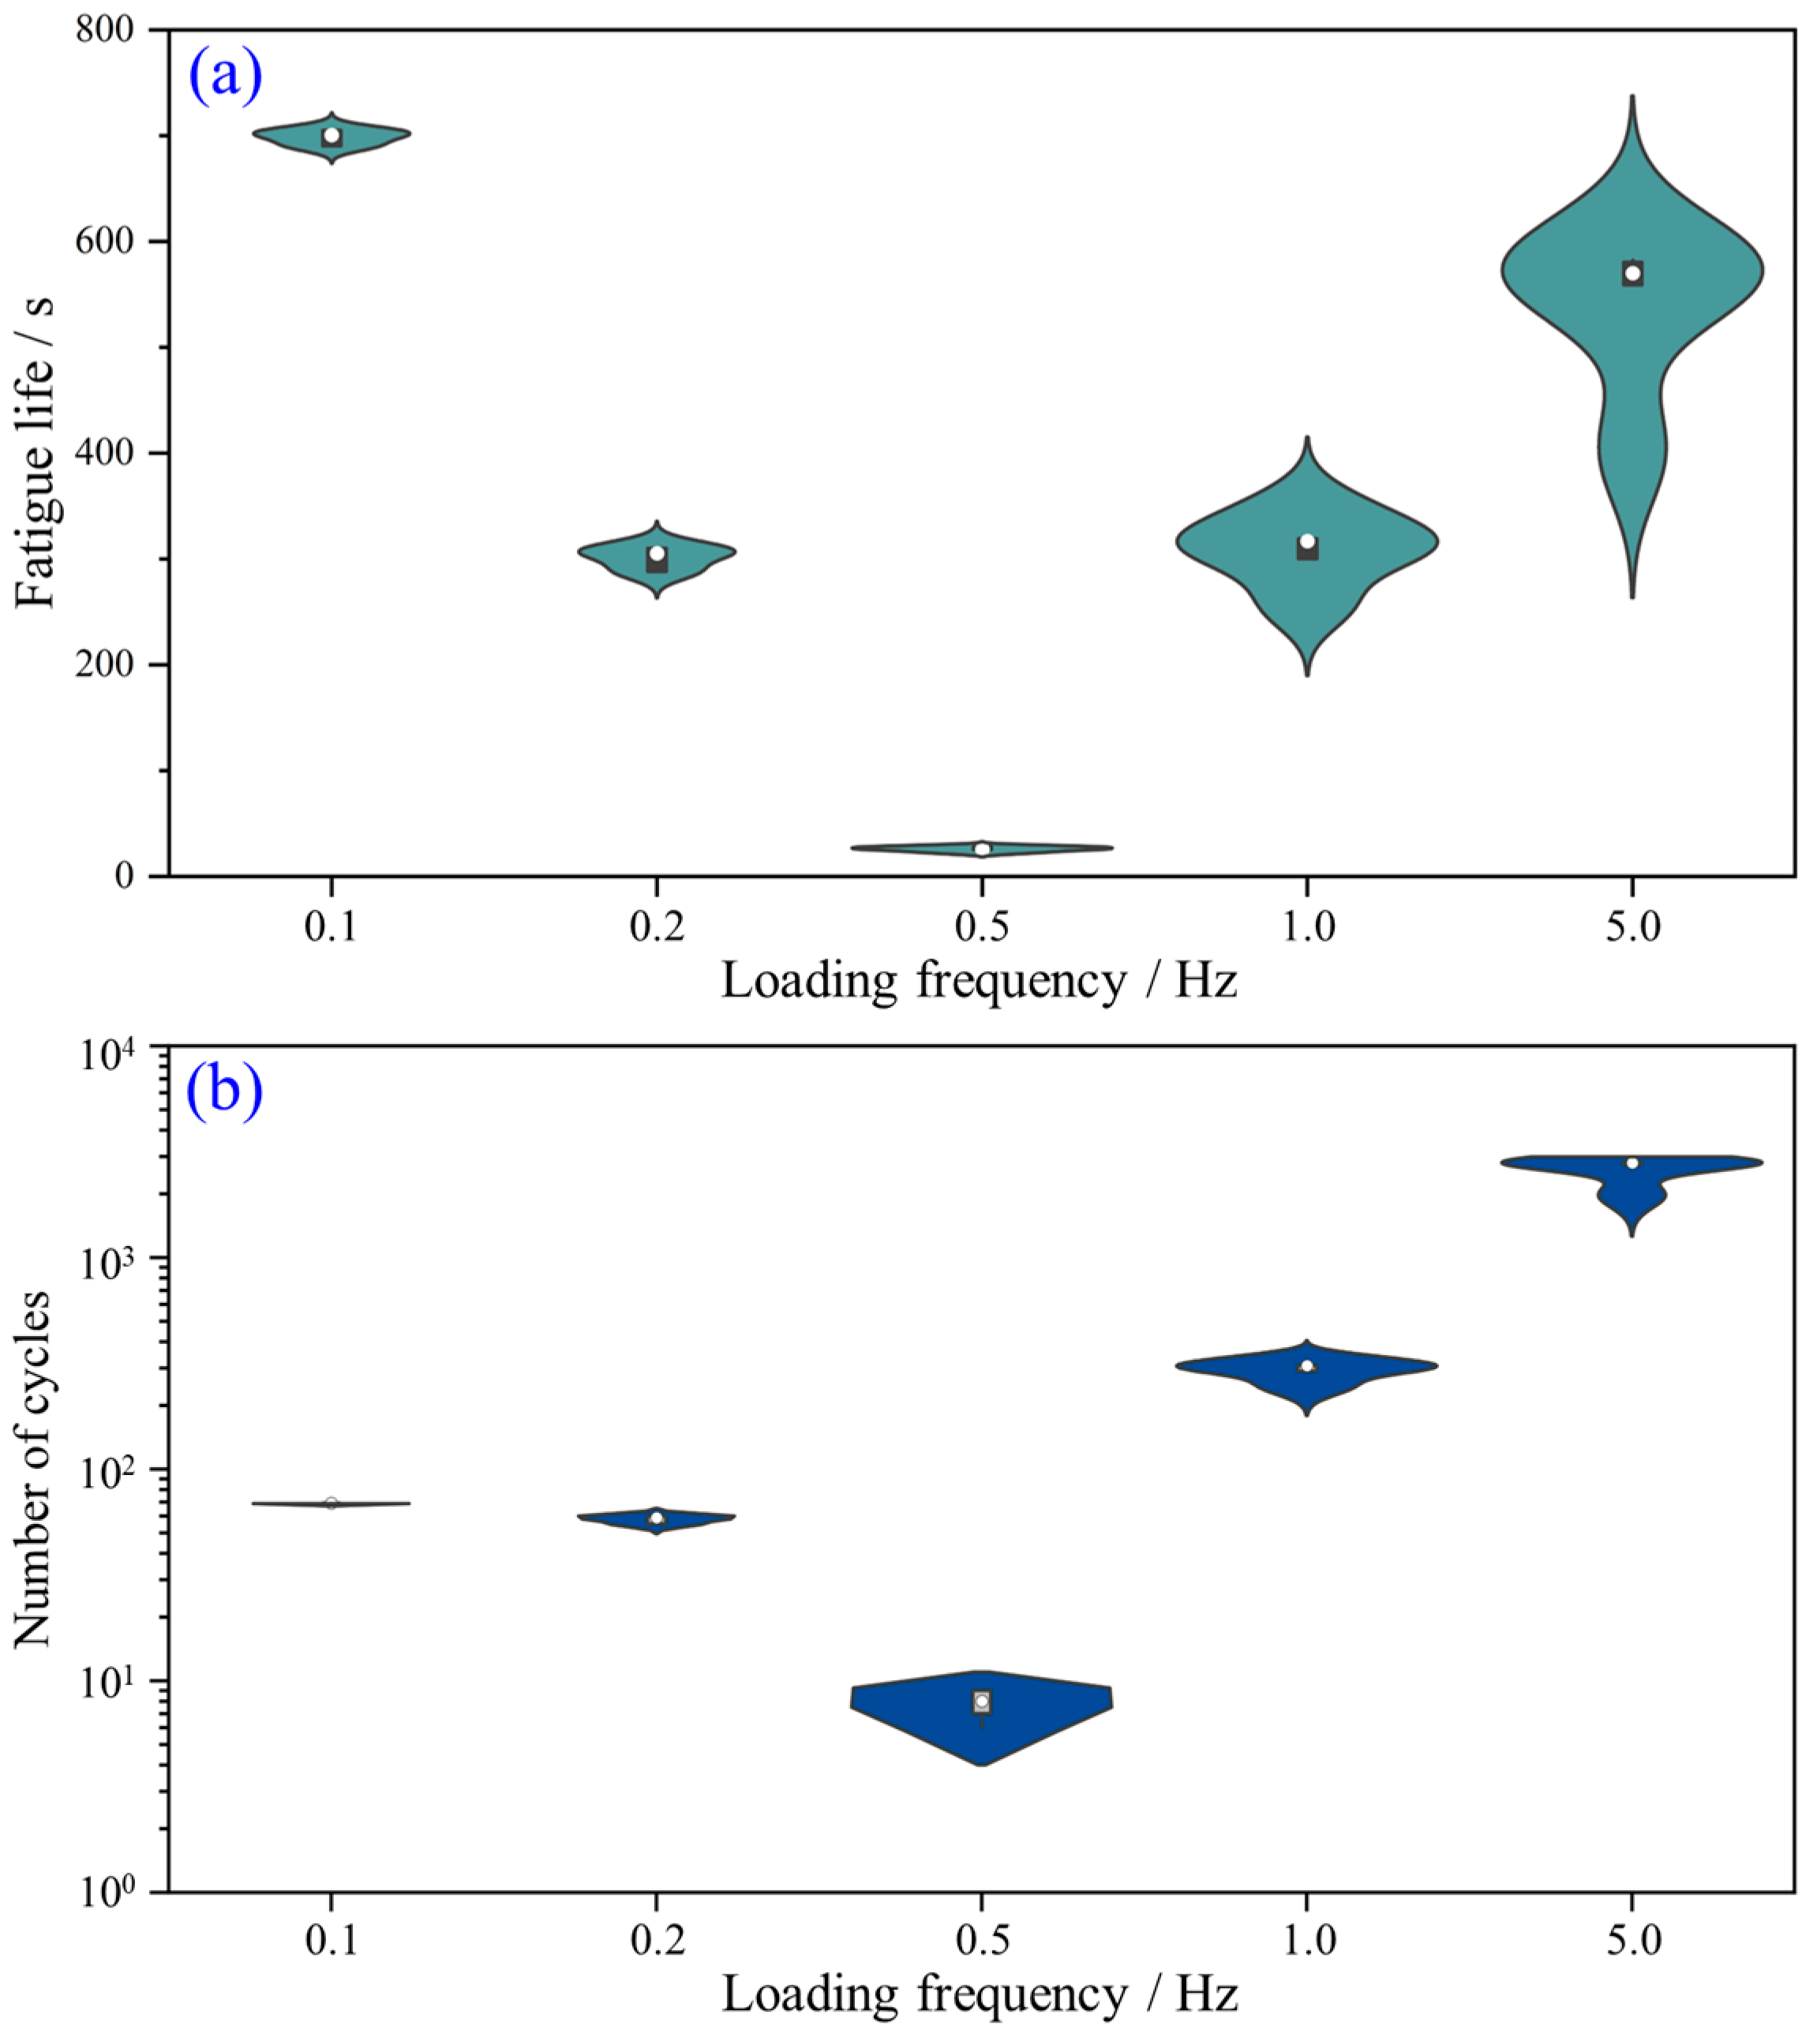
4.1.2. Load-Indentation Depth Curves and Fatigue Life of Sandstone
4.2. Effects of Waveform on Rock Behavior under Cyclic Point Loading
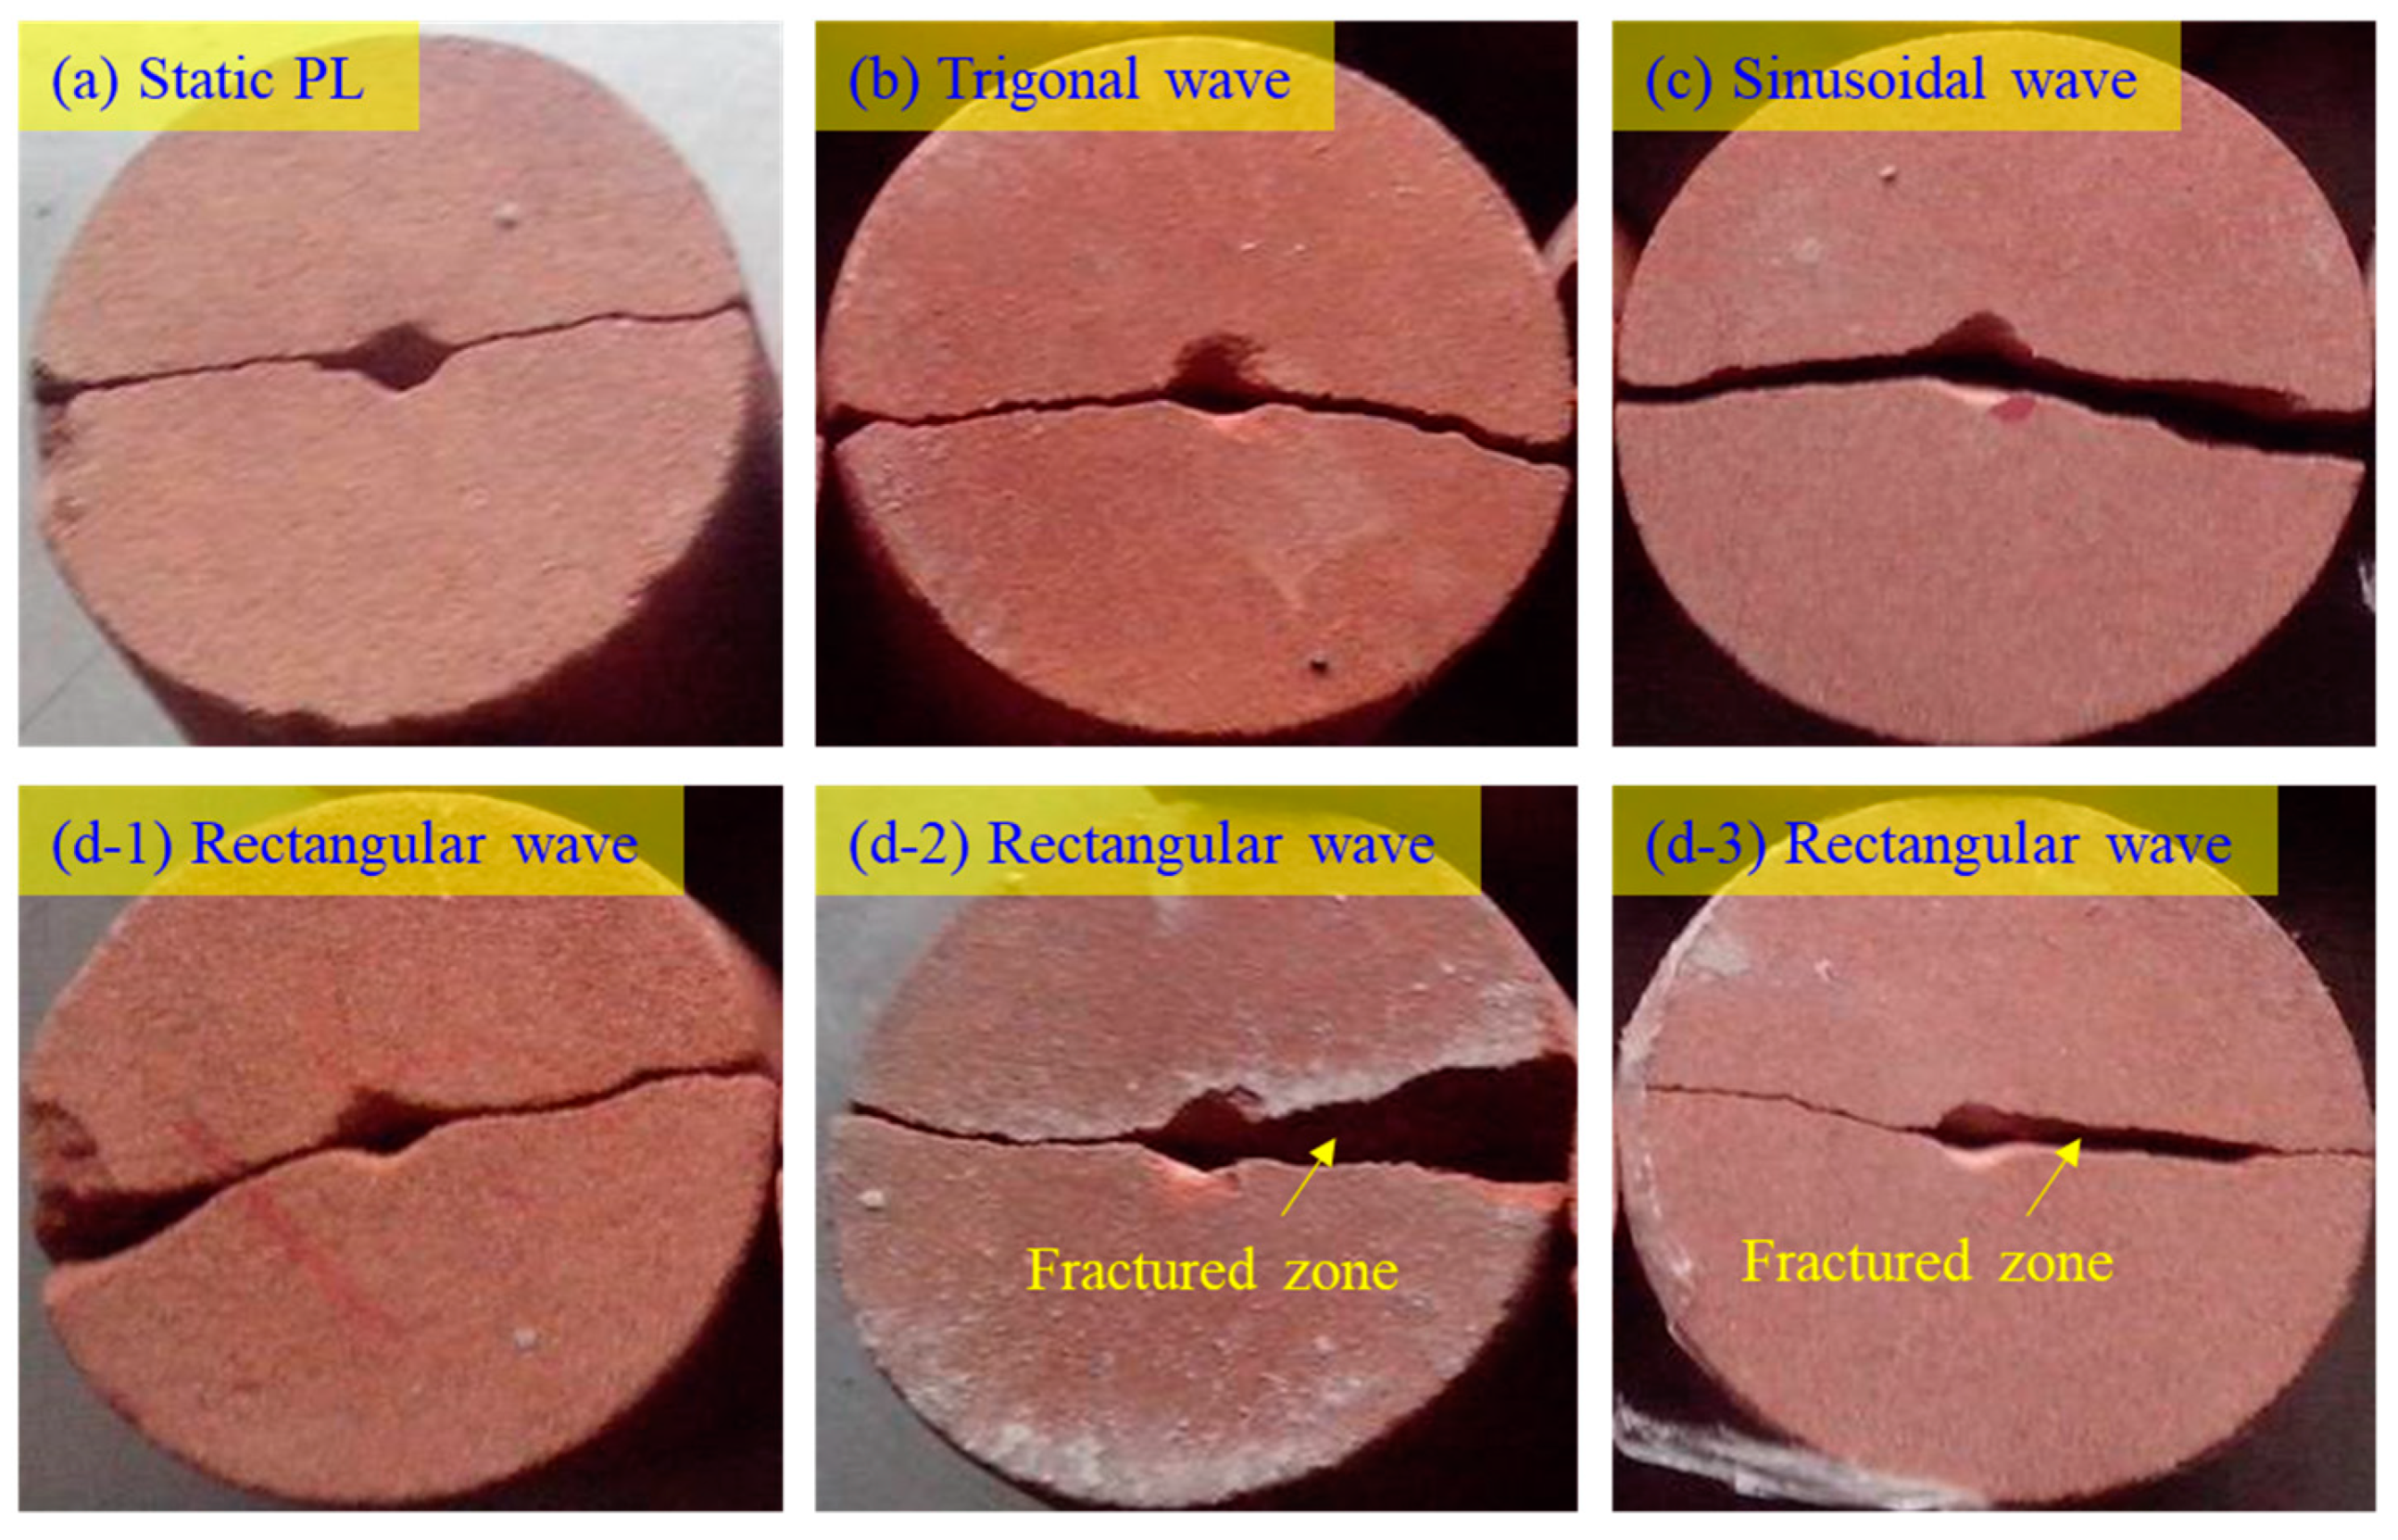
4.2.1. Failure Pattern on Rock Behavior under Cyclic Point Loading
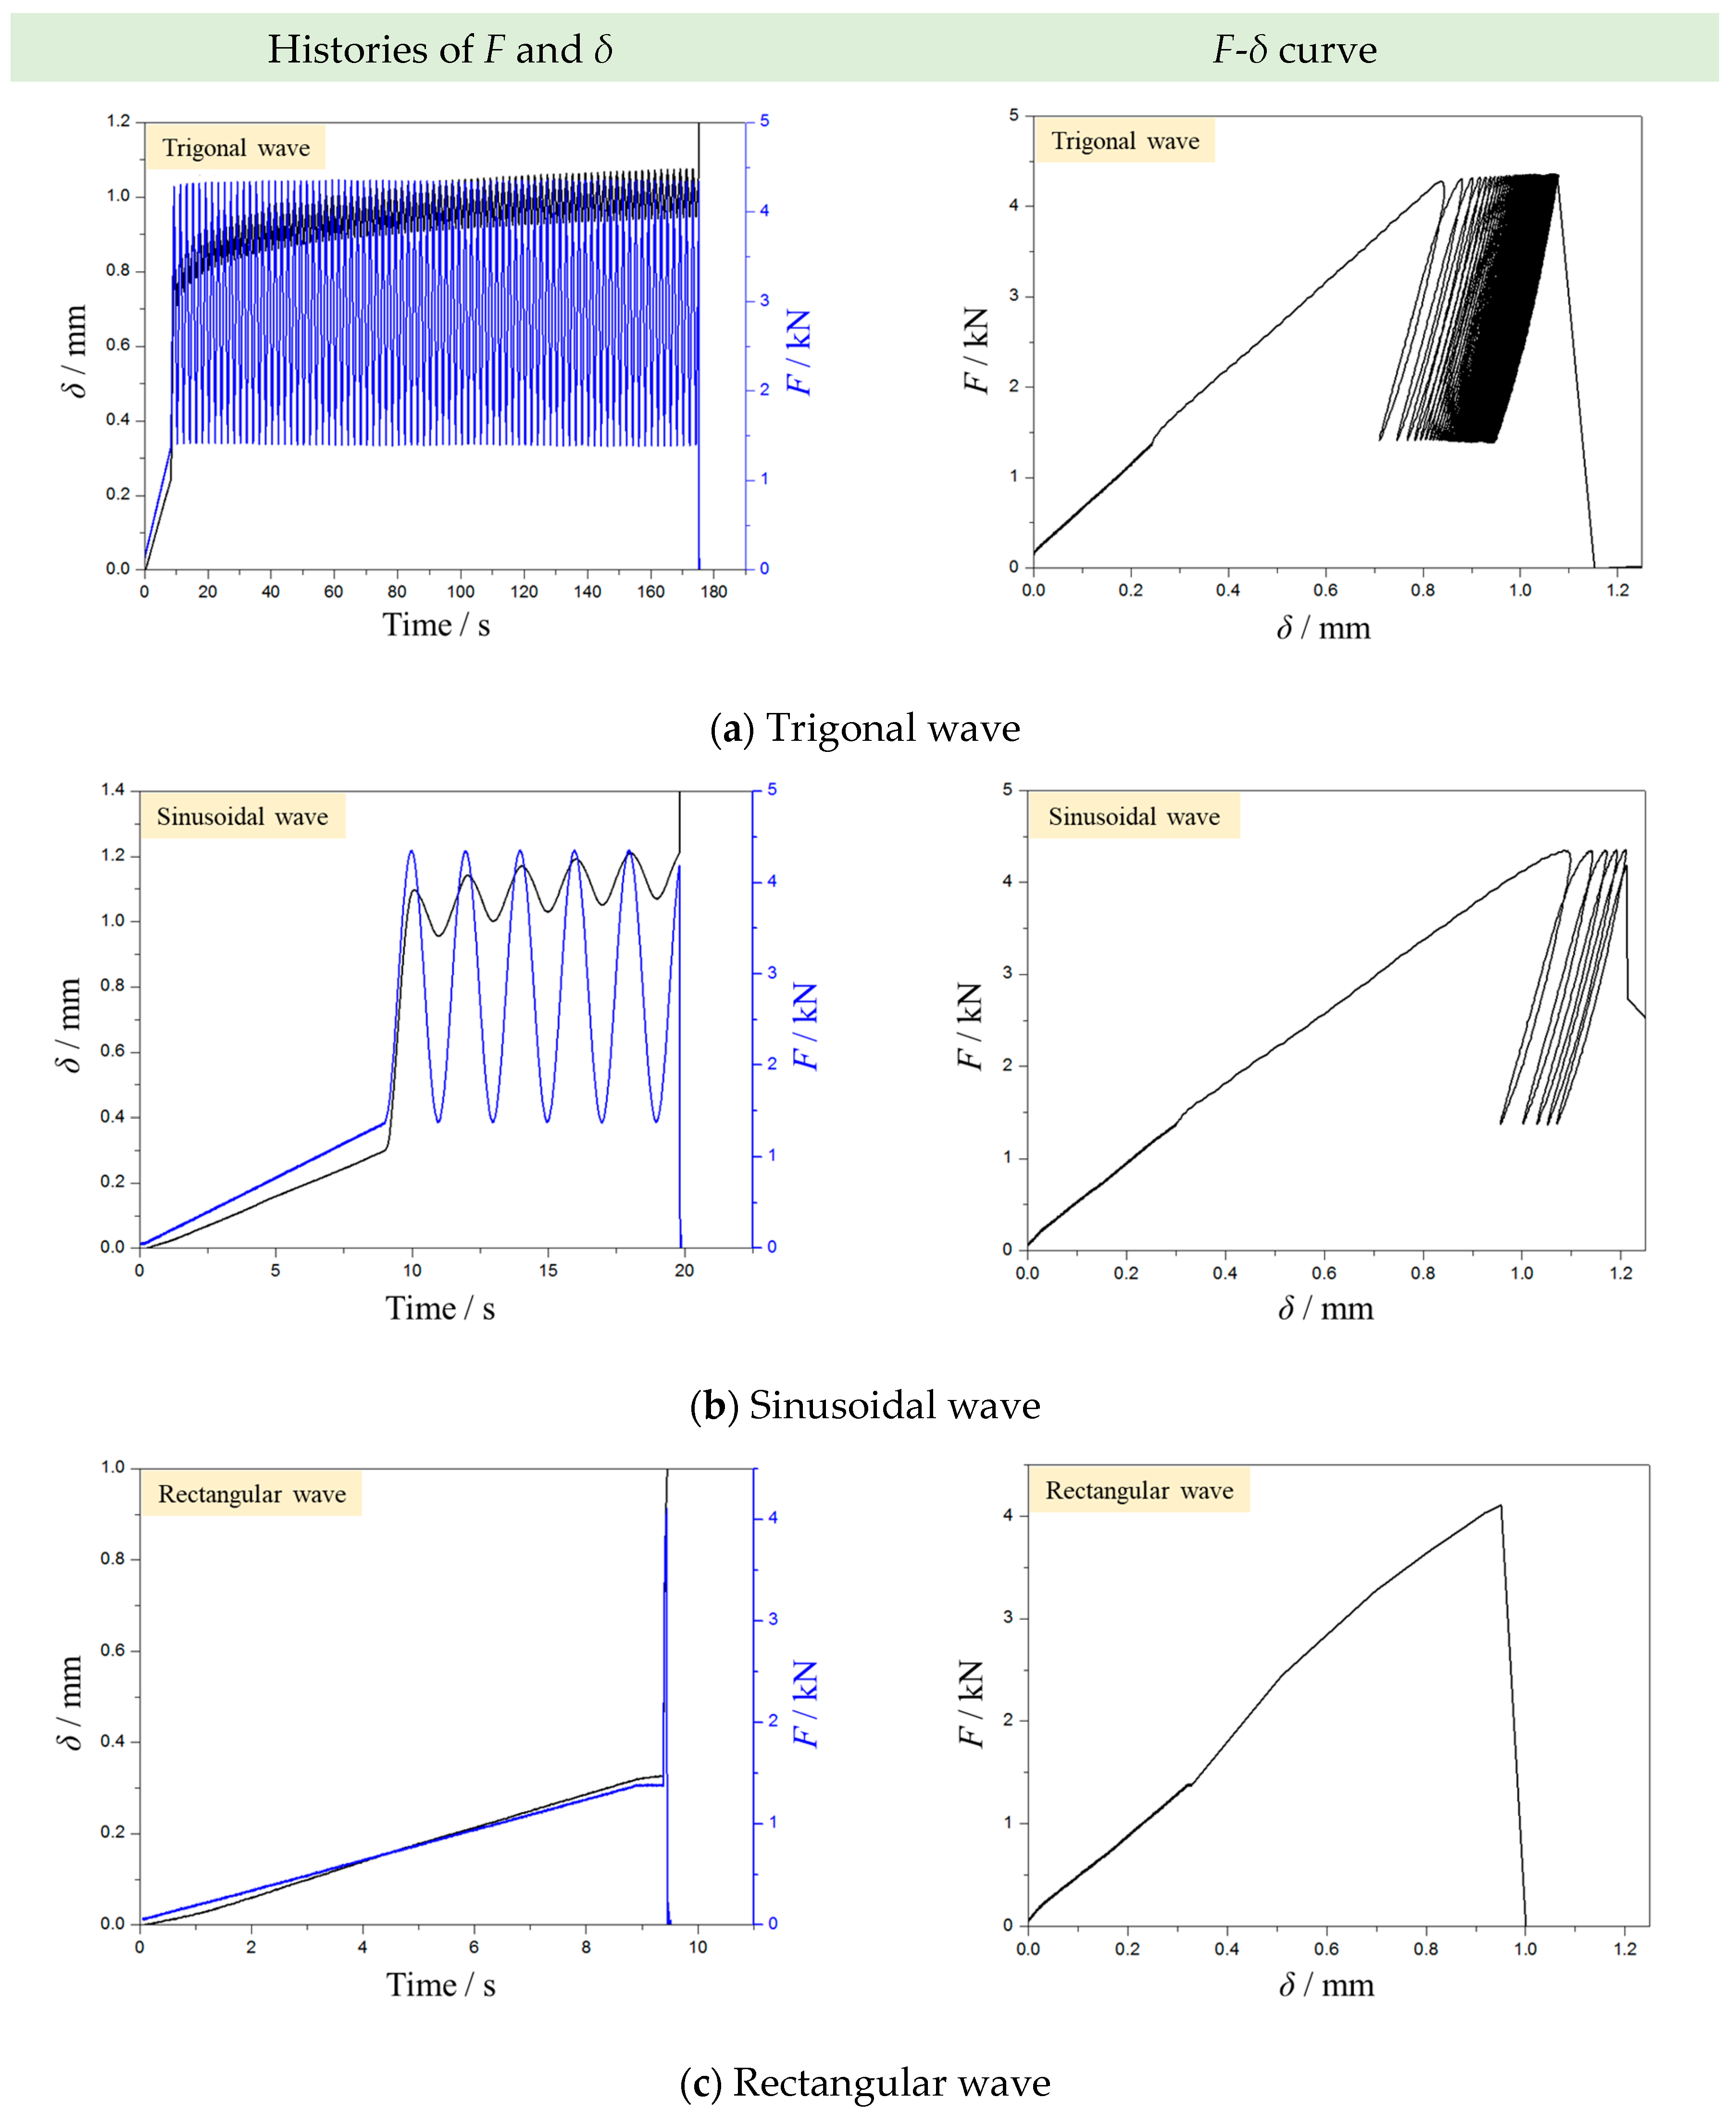
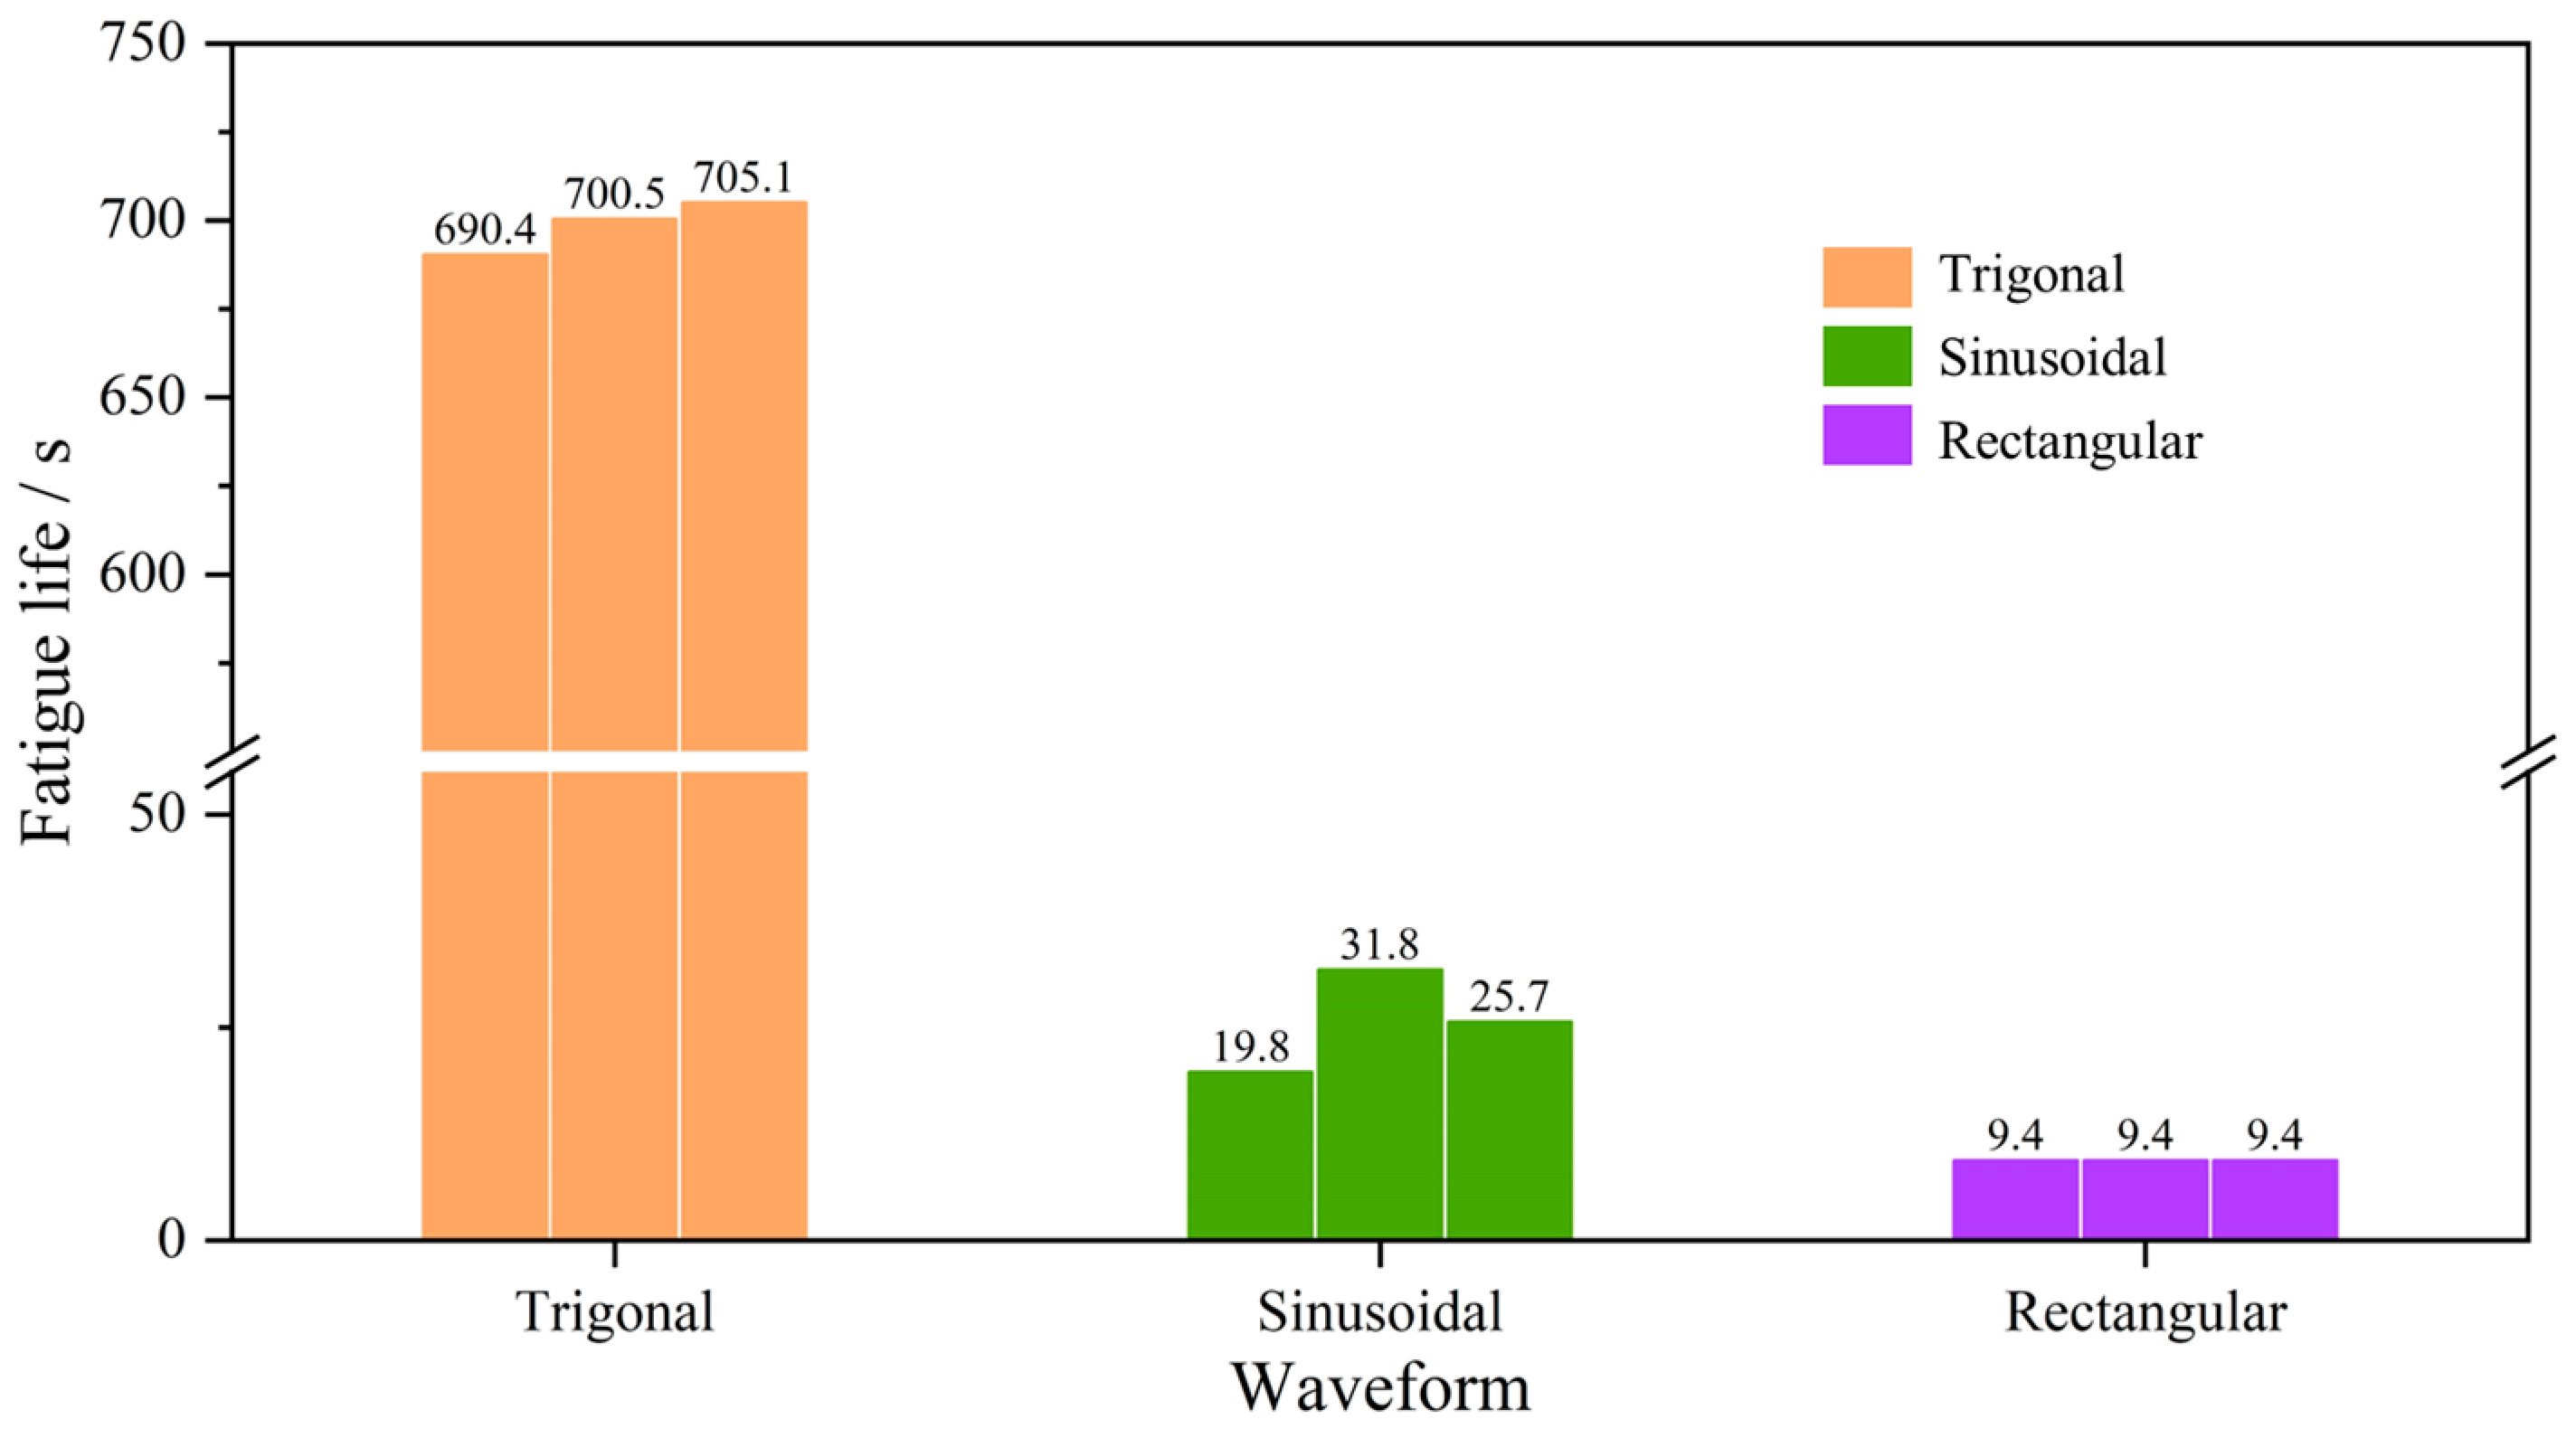
4.2.2. Load-Indentation Depth Curves and Fatigue Life of Sandstone
5. Conclusions and Prospects
- (1)
- The fatigue behavior of rock under CPL conditions is greatly dependent on loading frequency. The fatigue life of the YNS sample shows a trend of “decline followed by rise” with the increase in loading frequency. The minimum value of the YNS sample is 0.5 Hz.
- (2)
- The waveform also plays a controlling role in the fatigue behavior. The order of the fatigue life from largest to least is as follows: trigonal wave > sinusoidal wave > rectangular wave. In addition, when subjected to rectangular waveforms, the fractured zone can be observed on the rock surface. The rectangular waveform has the most severe damage on rock among the three tested waves.
- (3)
- The enlightenment of this work to mechanized excavation is that the efficiency of rock breakage (i.e., fatigue life) is significantly controlled by the parameters of the rock breaking machine, such as loading frequency and waveform. For a given rock type, there is an optimal combination of rock cutting parameters probably including loading frequency, waveform, amplitude, and upper and lower load limits. In rock engineering practice, similar CPL tests should be first conducted on the rock sample gathered from the site to predetermine the optimal combination of rock cutting parameters. Then, the optimal parameters should be applied to the mechanized machine, such that the efficiency of rock breakage can be markedly improved.
Author Contributions
Funding
Conflicts of Interest
References
- Al-Bakri, A.; Hefni, M. A review of some nonexplosive alternative methods to conventional rock blasting. Open Geosci. 2021, 13, 431–442. [Google Scholar] [CrossRef]
- Li, X.F.; Li, H.B.; Zhang, Q.B.; Jiang, J.L.; Zhao, J. Dynamic fragmentation of rock material: Characteristic size, fragment distribution and pulverization law. Eng. Fract. Mech. 2018, 199, 739–759. [Google Scholar] [CrossRef]
- Li, X.; Zhao, Q.; Li, H. Grain-based discrete element method (GB-DEM) modelling of multi-scale fracturing in rocks under dynamic loading. Rock Mech. Rock Eng. 2018, 51, 3785–3817. [Google Scholar] [CrossRef]
- Cheng, R.; Zhou, Z.; Chen, W.; Hao, H. Effects of Axial Air Deck on Blast-Induced Ground Vibration. Rock Mech. Rock Eng. 2022, 55, 1037–1053. [Google Scholar] [CrossRef]
- Zhou, Z.; Cai, X.; Li, X.; Cao, W.; Du, X. Dynamic Response and Energy Evolution of Sandstone Under Coupled Static–Dynamic Compression: Insights from Experimental Study into Deep Rock Engineering Applications. Rock Mech. Rock Eng. 2020, 53, 1305–1331. [Google Scholar] [CrossRef]
- Wang, S.; Li, X.; Yao, J.; Gong, F.; Li, X.; Du, K.; Tao, M.; Huang, L.; Du, S. Experimental investigation of rock breakage by a conical pick and its application to non-explosive mechanized mining in deep hard rock. Int. J. Rock Mech. Min. Sci. 2019, 122, 104063. [Google Scholar] [CrossRef]
- Miao, X.; Zhang, J.; Feng, M. Waste-filling in fully-mechanized coal mining and its application. J. China Univ. Min. Technol. 2008, 18, 479–482. [Google Scholar] [CrossRef]
- He, S.; Song, D.; Li, Z.; He, X.; Chen, J.; Zhong, T.; Lou, Q. Mechanism and Prevention of Rockburst in Steeply Inclined and Extremely Thick Coal Seams for Fully Mechanized Top-Coal Caving Mining and Under Gob Filling Conditions. Energies 2020, 13, 1362. [Google Scholar] [CrossRef] [Green Version]
- Wang, S.; Sun, L.; Tang, Y.; Jing, Y.; Li, X.; Yao, J. Field application of non-blasting mechanized mining using high-frequency impact hammer in deep hard rock mine. Trans. Nonferrous Met. Soc. China 2022, 32, 3051–3064. [Google Scholar] [CrossRef]
- Li, X.; Yao, J.; Du, K. Preliminary study for induced fracture and non-explosive continuous mining in high-geostress hard rock mine-a case study of Kaiyang phosphate mine. Yanshilixue Yu Gongcheng Xuebao/Chin. J. Rock Mech. Eng. 2013, 32, 1001–1111. [Google Scholar]
- Liu, Z.; Li, L.; Fang, X.; Qi, W.; Shen, J.; Zhou, H.; Zhang, Y. Hard-rock tunnel lithology prediction with TBM construction big data using a global-attention-mechanism-based LSTM network. Autom. Constr. 2021, 125, 103647. [Google Scholar] [CrossRef]
- Cerfontaine, B.; Collin, F. Cyclic and Fatigue Behaviour of Rock Materials: Review, Interpretation and Research Perspectives. Rock Mech. Rock Eng. 2018, 51, 391–414. [Google Scholar] [CrossRef]
- Liu, Y.; Dai, F. A review of experimental and theoretical research on the deformation and failure behavior of rocks subjected to cyclic loading. J. Rock Mech. Geotech. Eng. 2021, 13, 1203–1230. [Google Scholar] [CrossRef]
- Fuenkajorn, K.; Phueakphum, D. Effects of cyclic loading on mechanical properties of Maha Sarakham salt. Eng. Geol. 2010, 112, 43–52. [Google Scholar] [CrossRef]
- Song, R.; Yue-Ming, B.; Jing-Peng, Z.; De-Yi, J.; Chun-He, Y. Experimental investigation of the fatigue properties of salt rock. Int. J. Rock Mech. Min. Sci. 2013, 64, 68–72. [Google Scholar] [CrossRef]
- Liu, E.; He, S. Effects of cyclic dynamic loading on the mechanical properties of intact rock samples under confining pressure conditions. Eng. Geol. 2012, 125, 81–91. [Google Scholar] [CrossRef]
- Bagde, M.N.; Petroš, V. Waveform Effect on Fatigue Properties of Intact Sandstone in Uniaxial Cyclical Loading. Rock Mech. Rock Eng. 2005, 38, 169–196. [Google Scholar] [CrossRef]
- Attewell, P.B.; Farmer, I.W. Fatigue behaviour of rock. Int. J. Rock Mech. Min. Sci. Geomech. Abstr. 1973, 10, 1–9. [Google Scholar] [CrossRef]
- Nejati, H.R.; Ghazvinian, A. Brittleness Effect on Rock Fatigue Damage Evolution. Rock Mech. Rock Eng. 2014, 47, 1839–1848. [Google Scholar] [CrossRef]
- Voznesenskii, A.S.; Krasilov, M.N.; Kutkin, Y.O.; Tavostin, M.N.; Osipov, Y.V. Features of interrelations between acoustic quality factor and strength of rock salt during fatigue cyclic loadings. Int. J. Fatigue 2017, 97, 70–78. [Google Scholar] [CrossRef]
- Song, Z.; Wang, Y.; Konietzky, H.; Cai, X. Mechanical behavior of marble exposed to freeze-thaw-fatigue loading. Int. J. Rock Mech. Min. Sci. 2021, 138, 104648. [Google Scholar] [CrossRef]
- Yang, S.-Q.; Tian, W.-L.; Ranjith, P.G. Experimental Investigation on Deformation Failure Characteristics of Crystalline Marble Under Triaxial Cyclic Loading. Rock Mech. Rock Eng. 2017, 50, 2871–2889. [Google Scholar] [CrossRef]
- Song, Z.; Wu, Y.; Yang, Z.; Cai, X.; Jia, Y.; Zhang, M. Mechanical Responses of a Deeply Buried Granite Exposed to Multilevel Uniaxial and Triaxial Cyclic Stresses: Insights into Deformation Behavior, Energy Dissipation, and Hysteresis. Adv. Mater. Sci. Eng. 2021, 2021, 3160968. [Google Scholar] [CrossRef]
- Akesson, U.; Hansson, J.; Stigh, J. Characterisation of microcracks in the Bohus granite, western Sweden, caused by uniaxial cyclic loading. Eng. Geol. 2004, 72, 131–142. [Google Scholar] [CrossRef]
- Momeni, A.; Karakus, M.; Khanlari, G.R.; Heidari, M. Effects of cyclic loading on the mechanical properties of a granite. Int. J. Rock Mech. Min. Sci. 2015, 77, 89–96. [Google Scholar] [CrossRef]
- Erarslan, N.; Alehossein, H.; Williams, D.J. Tensile Fracture Strength of Brisbane Tuff by Static and Cyclic Loading Tests. Rock Mech. Rock Eng. 2014, 47, 1135–1151. [Google Scholar] [CrossRef]
- Ghamgosar, M.; Erarslan, N. Experimental and Numerical Studies on Development of Fracture Process Zone (FPZ) in Rocks under Cyclic and Static Loadings. Rock Mech. Rock Eng. 2016, 49, 893–908. [Google Scholar] [CrossRef]
- Song, Z.; Konietzky, H.; Cai, X. Modulus degradation of concrete exposed to compressive fatigue loading: Insights from lab testing. Struct. Eng. Mech. 2021, 78, 281–296. [Google Scholar] [CrossRef]
- Song, Z.; Frühwirt, T.; Konietzky, H. Inhomogeneous mechanical behaviour of concrete subjected to monotonic and cyclic loading. Int. J. Fatigue 2020, 132, 105383. [Google Scholar] [CrossRef]
- Zhou, Z.; Wu, Z.; Li, X.-B.; Li, X.; Ma, C. Mechanical behavior of red sandstone under cyclic point loading. Trans. Nonferrous Met. Soc. China 2015, 25, 2708–2717. [Google Scholar] [CrossRef]
- Franklin, J.A. Suggested method for determining point load strength. Int. J. Rock Mech. Min. Sci. Geomech. Abstr. 1985, 22, 51–60. [Google Scholar] [CrossRef]
- Ulusay, R. (Ed.) The ISRM Suggested Methods for Rock Characterization, Testing and Monitoring: 2007–2014; Springer International Publishing: Cham, Switzerland, 2015. [Google Scholar] [CrossRef]
- Cai, X.; Zhou, Z.; Zang, H.; Song, Z. Water saturation effects on dynamic behavior and microstructure damage of sandstone: Phenomena and mechanisms. Eng. Geol. 2020, 276, 105760. [Google Scholar] [CrossRef]
- Cai, X.; Zhou, Z.; Du, X. Water-induced variations in dynamic behavior and failure characteristics of sandstone subjected to simulated geo-stress. Int. J. Rock Mech. Min. Sci. 2020, 130, 104339. [Google Scholar] [CrossRef]
- Masoumi, H.; Horne, J.; Timms, W. Establishing Empirical Relationships for the Effects of Water Content on the Mechanical Behavior of Gosford Sandstone. Rock Mech. Rock Eng. 2017, 50, 2235–2242. [Google Scholar] [CrossRef]
- Gong, M.; Smith, I. Effect of Waveform and Loading Sequence on Low-Cycle Compressive Fatigue Life of Spruce. J. Mater. Civ. Eng. 2003, 15, 93–99. [Google Scholar] [CrossRef]


| Sample No. | Upper Limit (kN) | Lower Limit (kN) | f (Hz) | Number of Cycles | Fatigue Life a (s) |
|---|---|---|---|---|---|
| D-1-1 | 0.94 Ps | 0.3 Ps | 0.1 | 68 | 690.4 |
| D-1-2 | 69 | 700.5 | |||
| D-1-3 | 69 | 705.1 | |||
| D-2-1 | 0.94 Ps | 0.3 Ps | 0.2 | 60 | 310.1 |
| D-2-2 | 55 | 288.2 | |||
| D-2-3 | 59 | 305.3 | |||
| D-3-1 | 0.94 Ps | 0.3 Ps | 0.5 | 8 | 25.6 |
| D-3-2 | 9 | 28.3 | |||
| D-3-3 | 6 | 22.5 | |||
| D-3-4 | 7 | 25.6 | |||
| D-3-5 | 9 | 28.1 | |||
| D-4-1 | 0.94 Ps | 0.3 Ps | 1.0 | 244 | 255.1 |
| D-4-2 | 309 | 316.7 | |||
| D-4-3 | 290 | 300.4 | |||
| D-4-4 | 339 | 350.1 | |||
| D-4-5 | 308 | 319.1 | |||
| D-5-1 | 0.94 Ps | 0.3 Ps | 5 | 2846 | 580.3 |
| D-5-2 | 1961 | 403.1 | |||
| D-5-3 | 2741 | 559.1 | |||
| D-5-4 | 2856 | 582.1 | |||
| D-5-5 | 2796 | 570.1 |
| Sample No. | Waveform | Upper Limit (kN) | Lower Limit (kN) | f (Hz) | Number of Cycles | Fatigue Life b (s) |
|---|---|---|---|---|---|---|
| T-1 | Trigonal | 0.94 Ps | 0.3 Ps | 0.5 | 84 | 690.4 |
| T-2 | 80 | 700.5 | ||||
| T-3 | 90 | 705.1 | ||||
| S-1 | Sinusoidal | 0.94 Ps | 0.3 Ps | 0.5 | 5 | 19.8 |
| S-2 | 12 | 31.8 | ||||
| S-3 | 8 | 25.7 | ||||
| R-1 | Rectangular | 0.94 Ps | 0.3 Ps | 0.5 | <1 a | 9.4 |
| R-2 | <1 a | 9.4 | ||||
| R-3 | <1 a | 9.4 |
Disclaimer/Publisher’s Note: The statements, opinions and data contained in all publications are solely those of the individual author(s) and contributor(s) and not of MDPI and/or the editor(s). MDPI and/or the editor(s) disclaim responsibility for any injury to people or property resulting from any ideas, methods, instructions or products referred to in the content. |
© 2023 by the authors. Licensee MDPI, Basel, Switzerland. This article is an open access article distributed under the terms and conditions of the Creative Commons Attribution (CC BY) license (https://creativecommons.org/licenses/by/4.0/).
Share and Cite
Cai, X.; Yuan, J.; Zhou, Z.; Wu, Z.; Liu, J.; Ullah, B.; Wang, S. Fatigue Behavior of Sandstone Exposed to Cyclic Point-Loading: Implications for Improving Mechanized Rock Breakage Efficiency. Materials 2023, 16, 2918. https://doi.org/10.3390/ma16072918
Cai X, Yuan J, Zhou Z, Wu Z, Liu J, Ullah B, Wang S. Fatigue Behavior of Sandstone Exposed to Cyclic Point-Loading: Implications for Improving Mechanized Rock Breakage Efficiency. Materials. 2023; 16(7):2918. https://doi.org/10.3390/ma16072918
Chicago/Turabian StyleCai, Xin, Jifeng Yuan, Zilong Zhou, Zhibo Wu, Jianmin Liu, Barkat Ullah, and Shaofeng Wang. 2023. "Fatigue Behavior of Sandstone Exposed to Cyclic Point-Loading: Implications for Improving Mechanized Rock Breakage Efficiency" Materials 16, no. 7: 2918. https://doi.org/10.3390/ma16072918