
Vibration Serviceability of the Aberfeldy Footbridge under Various Human-Induced Loadings

Abstract
:1. Introduction
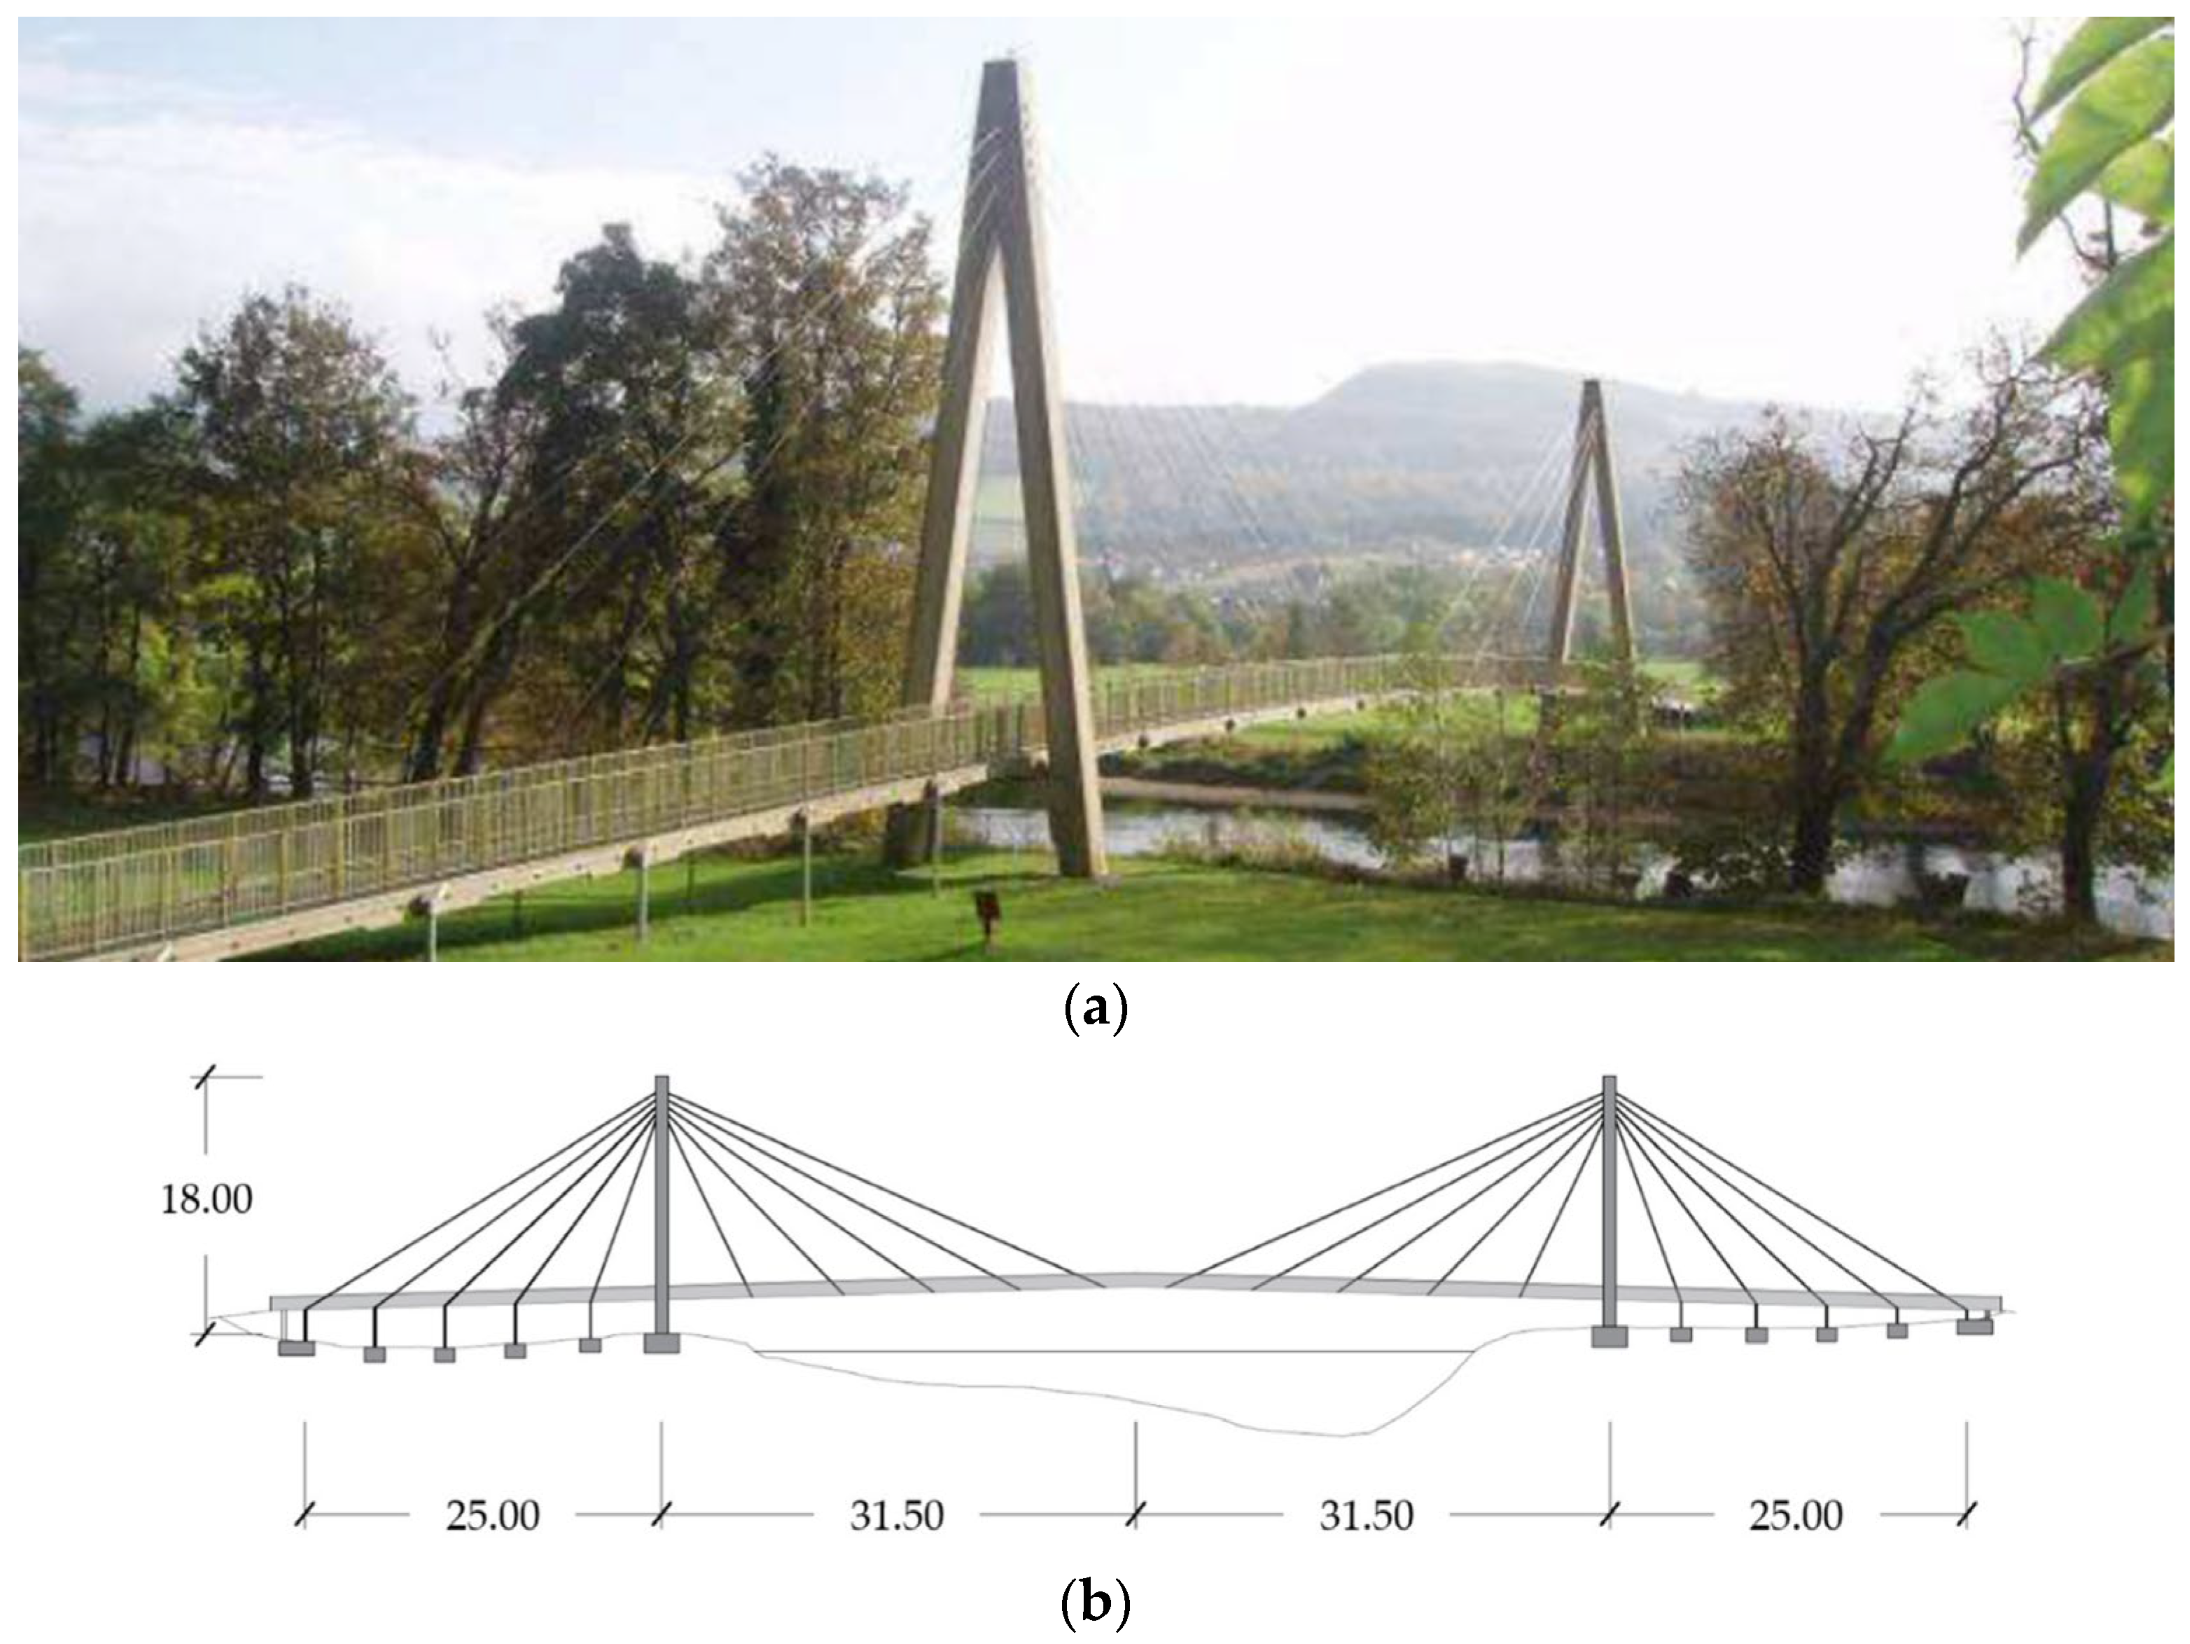
2. Aberfeldy Footbridge
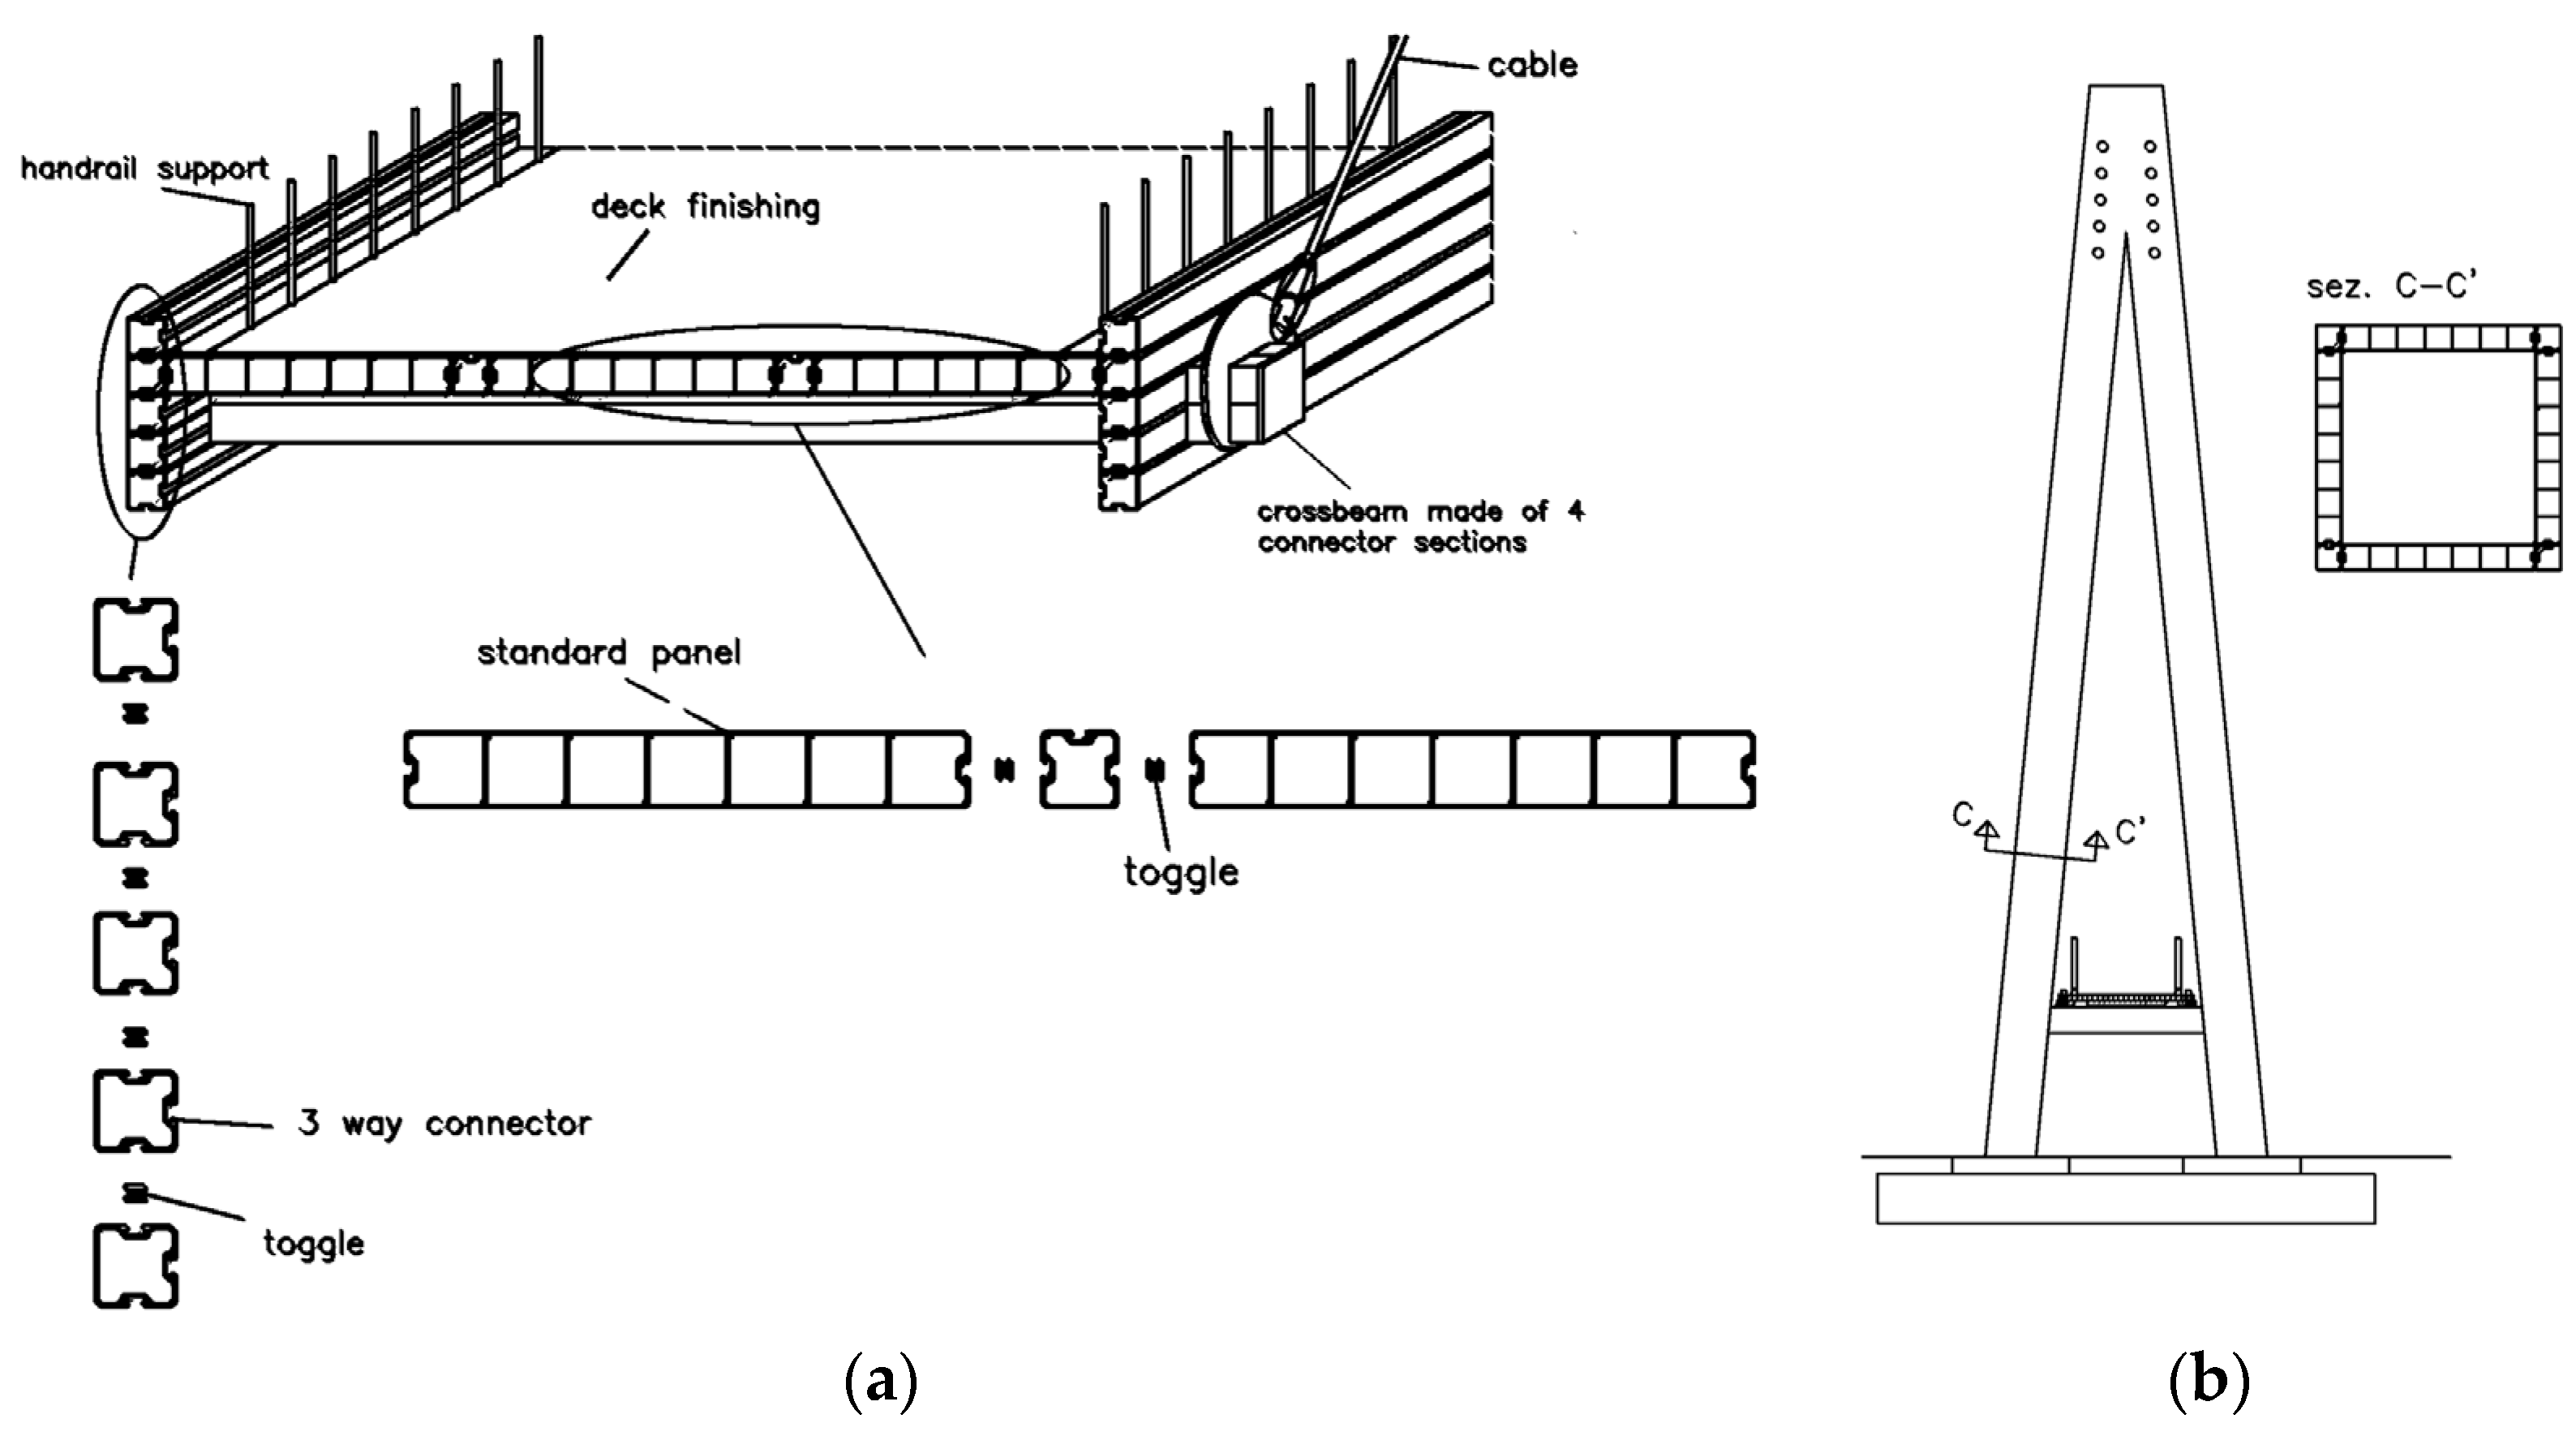
2.1. Structural Layout
2.2. Frequencies and Damping Properties
3. Materials and Methods
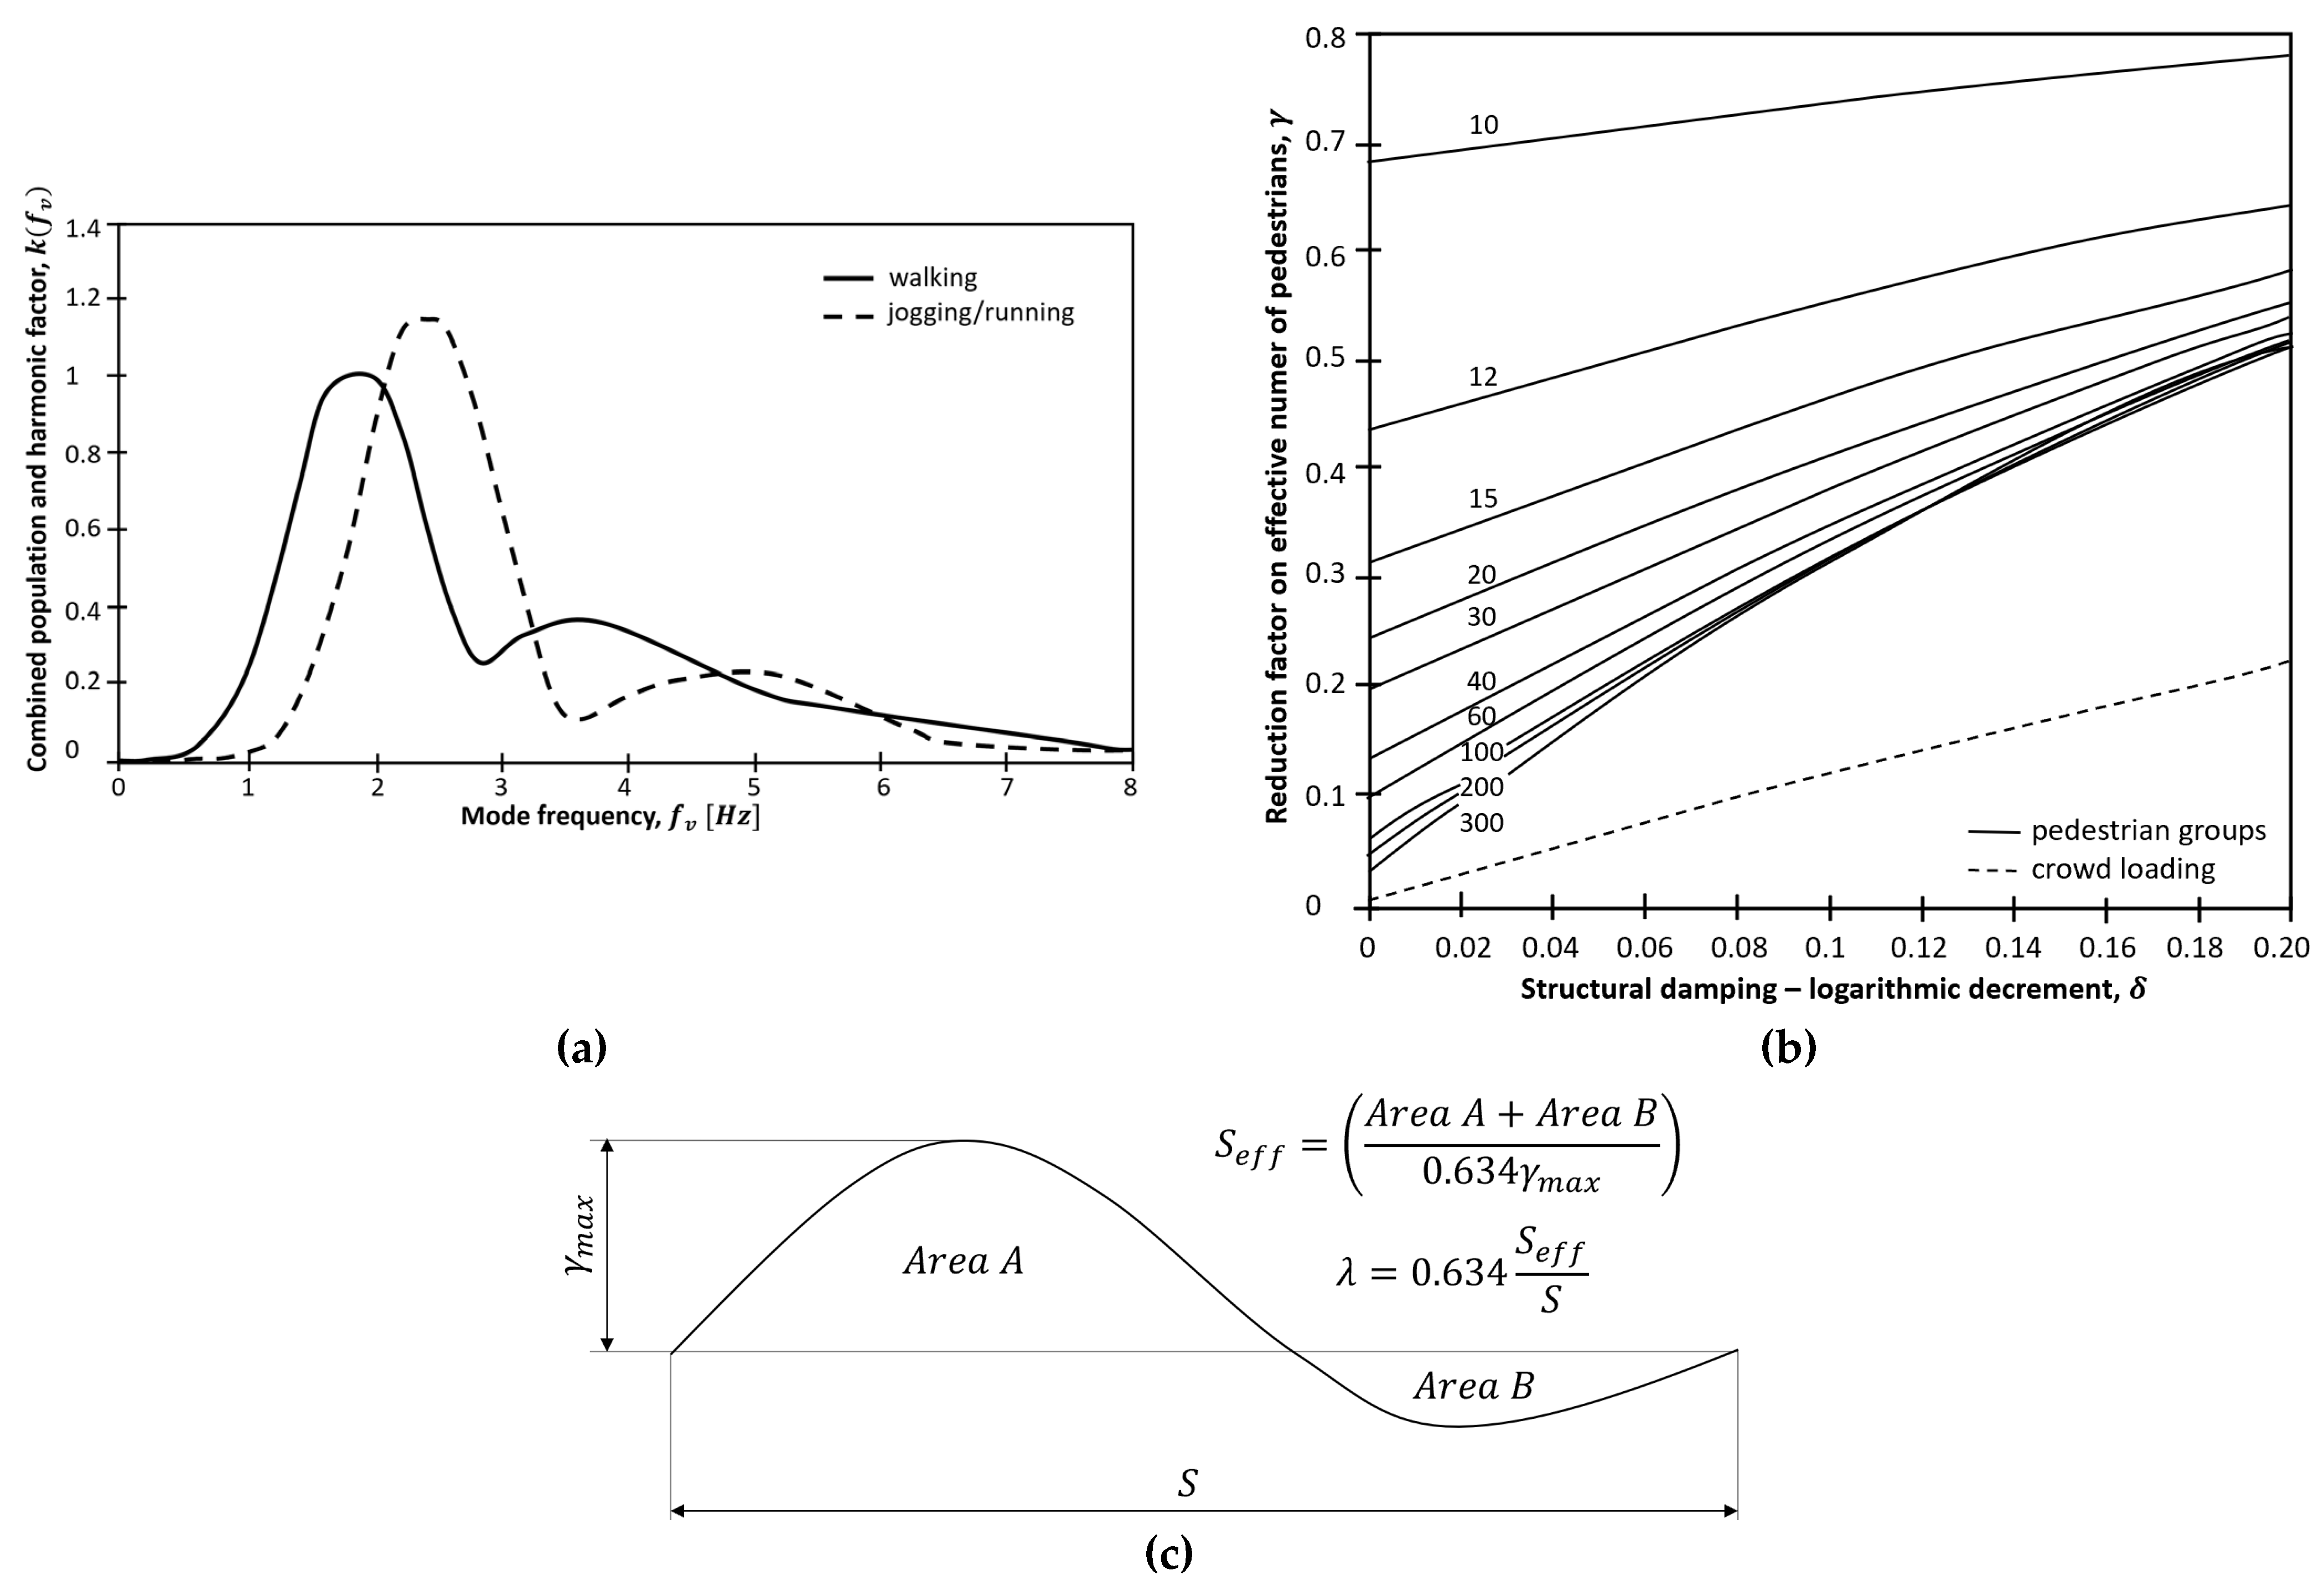
3.1. The Resonance Risk Evaluation
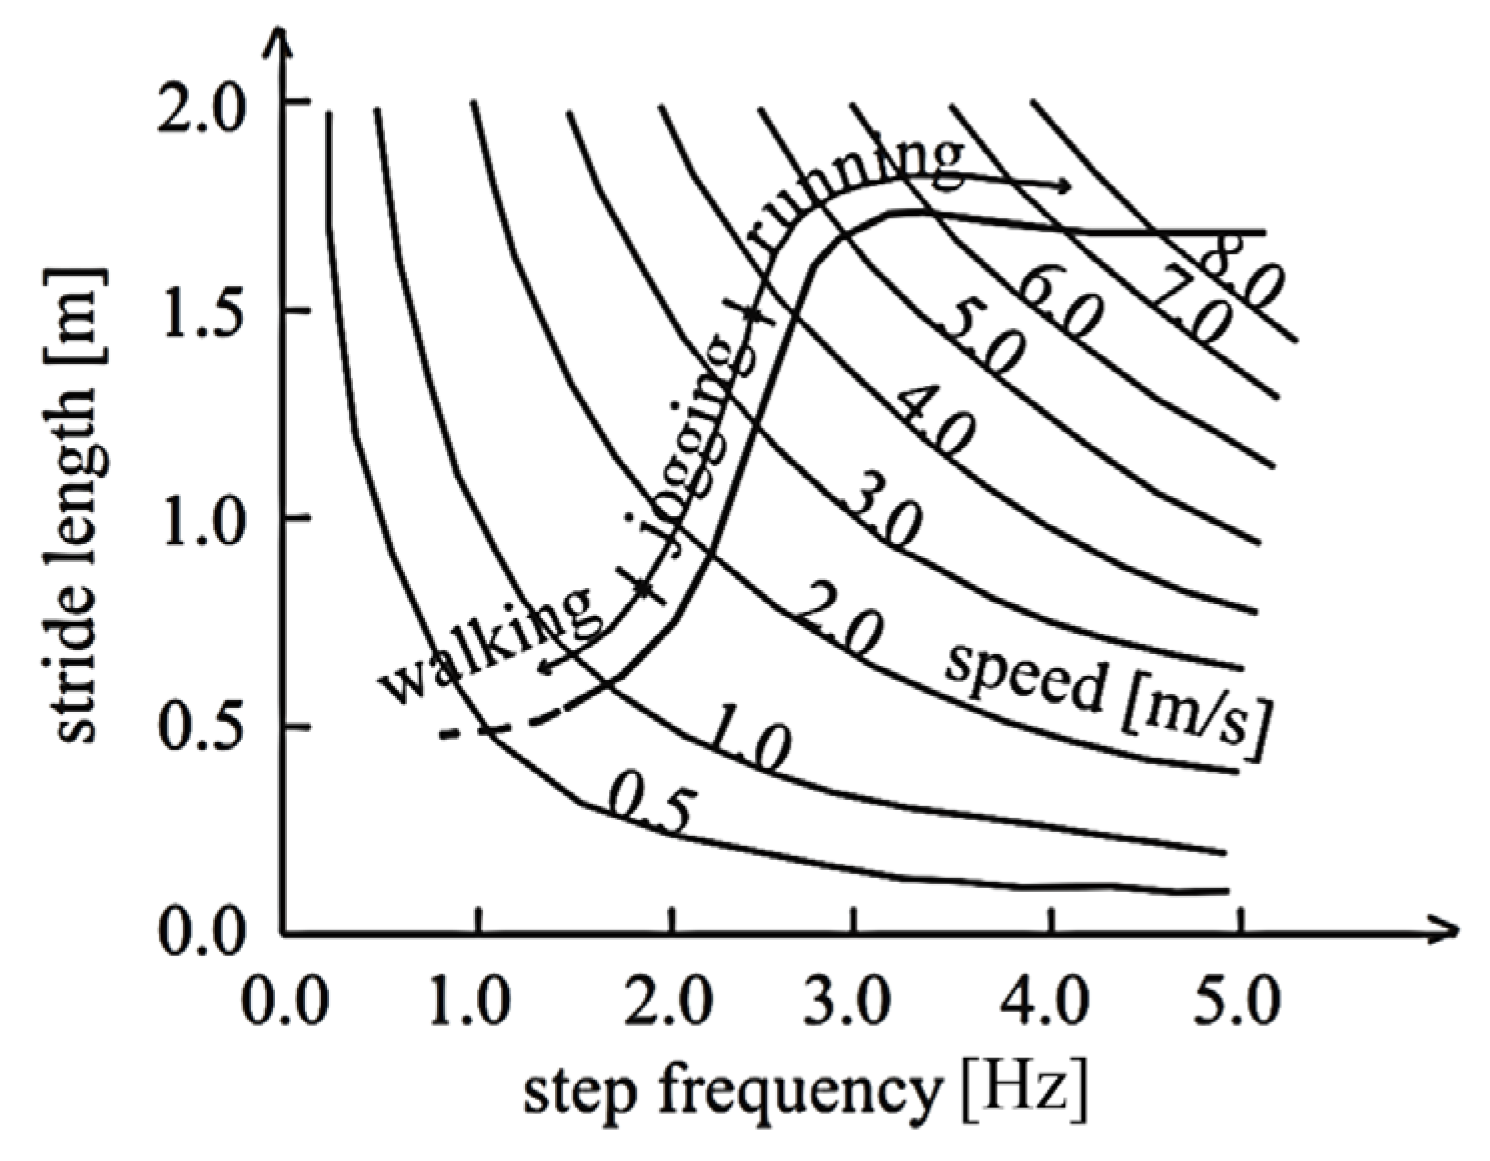
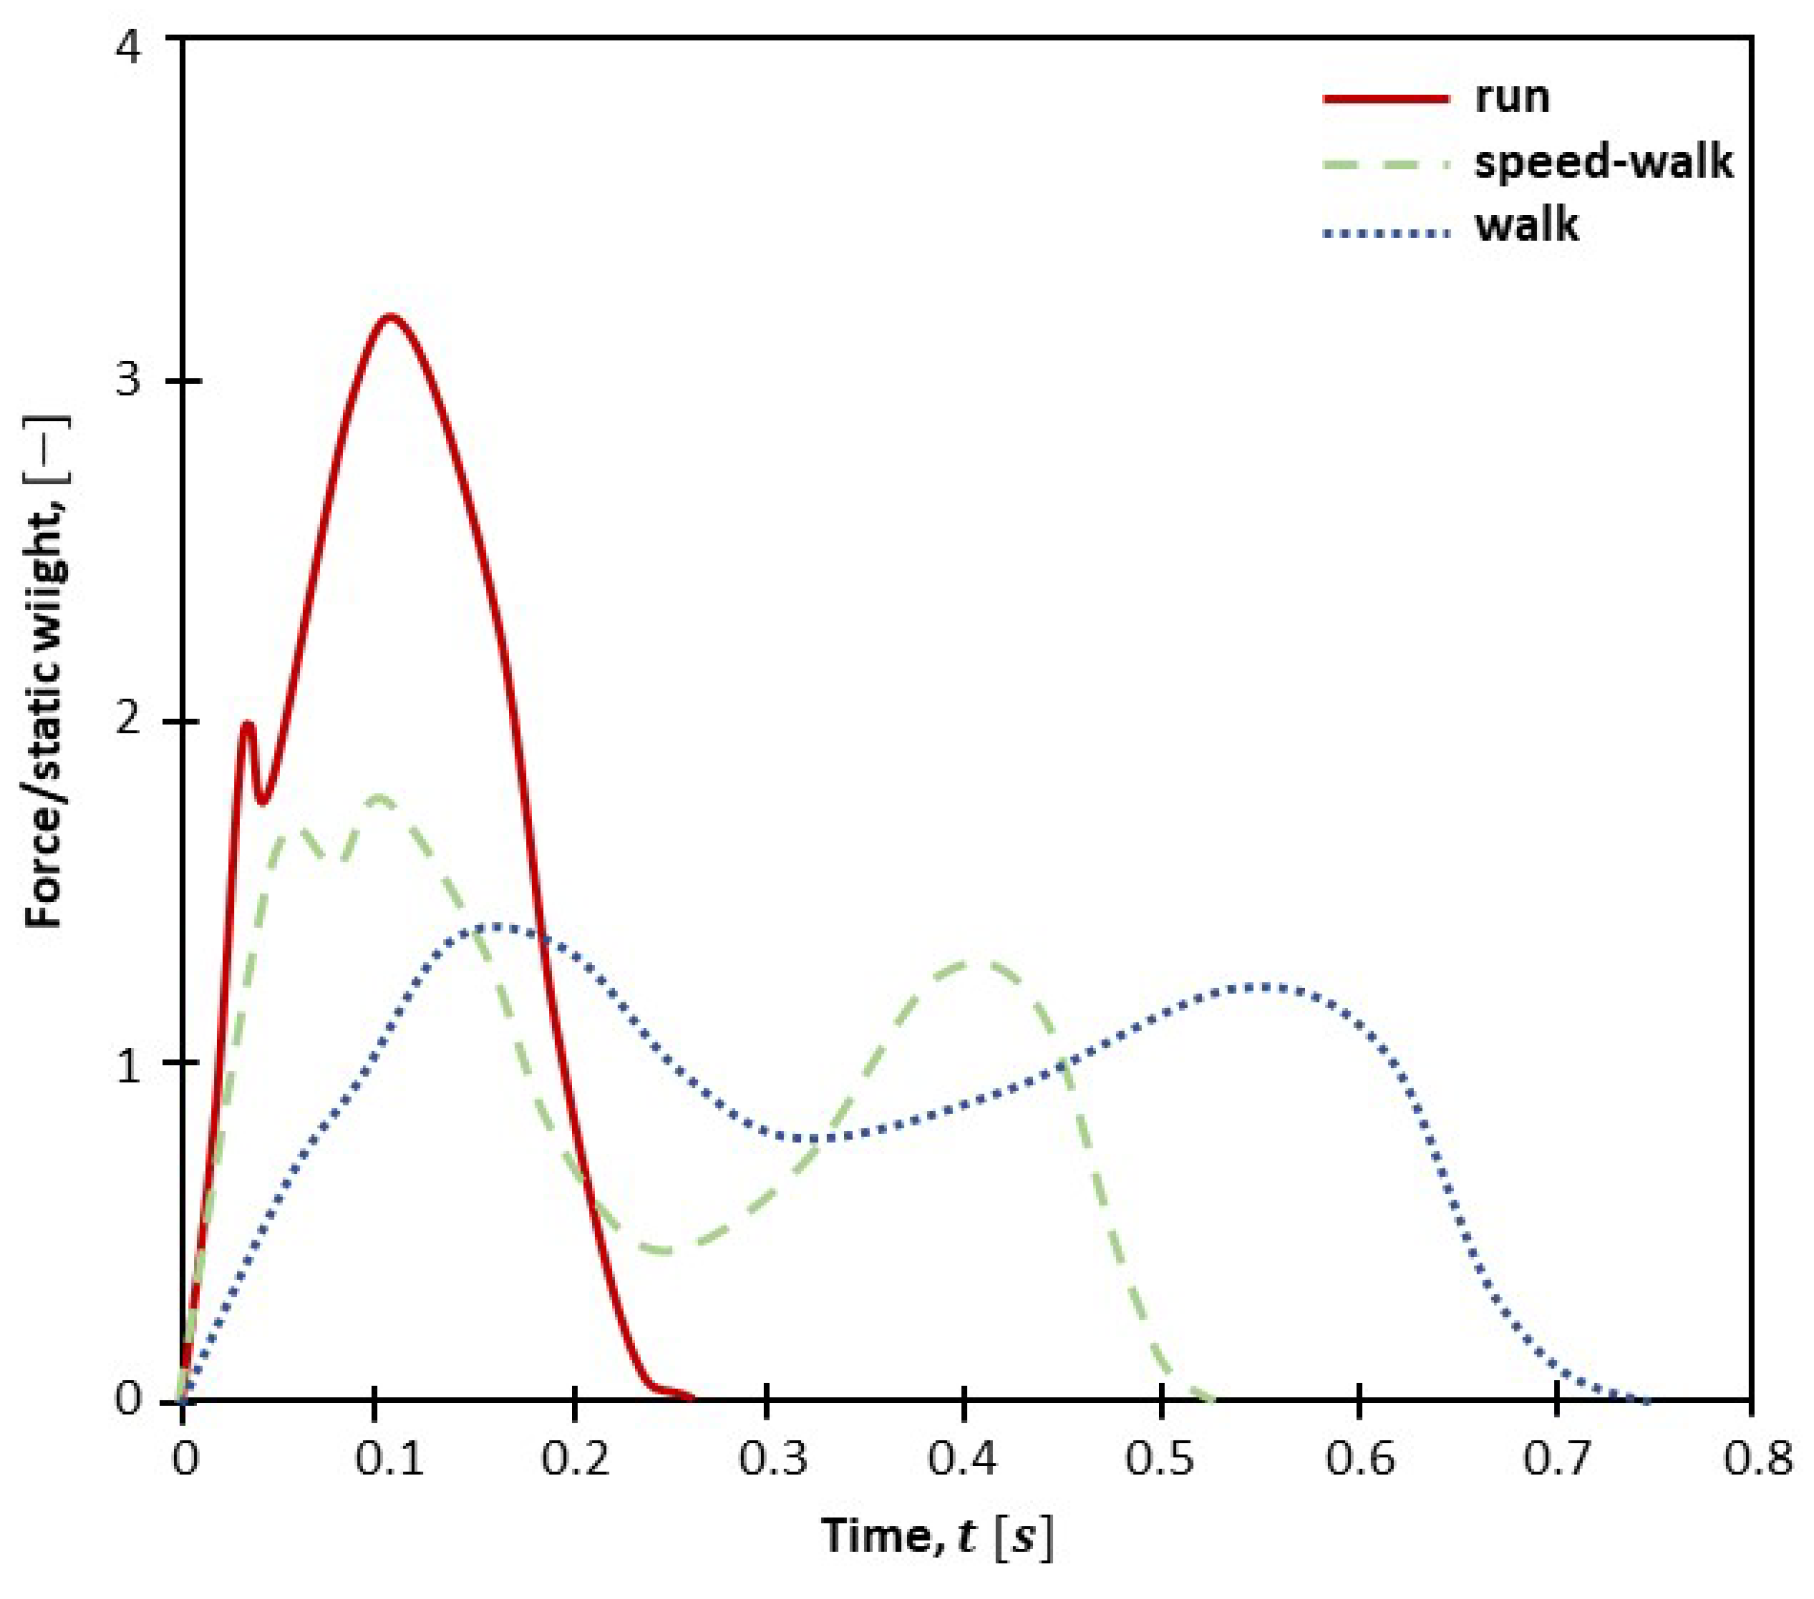
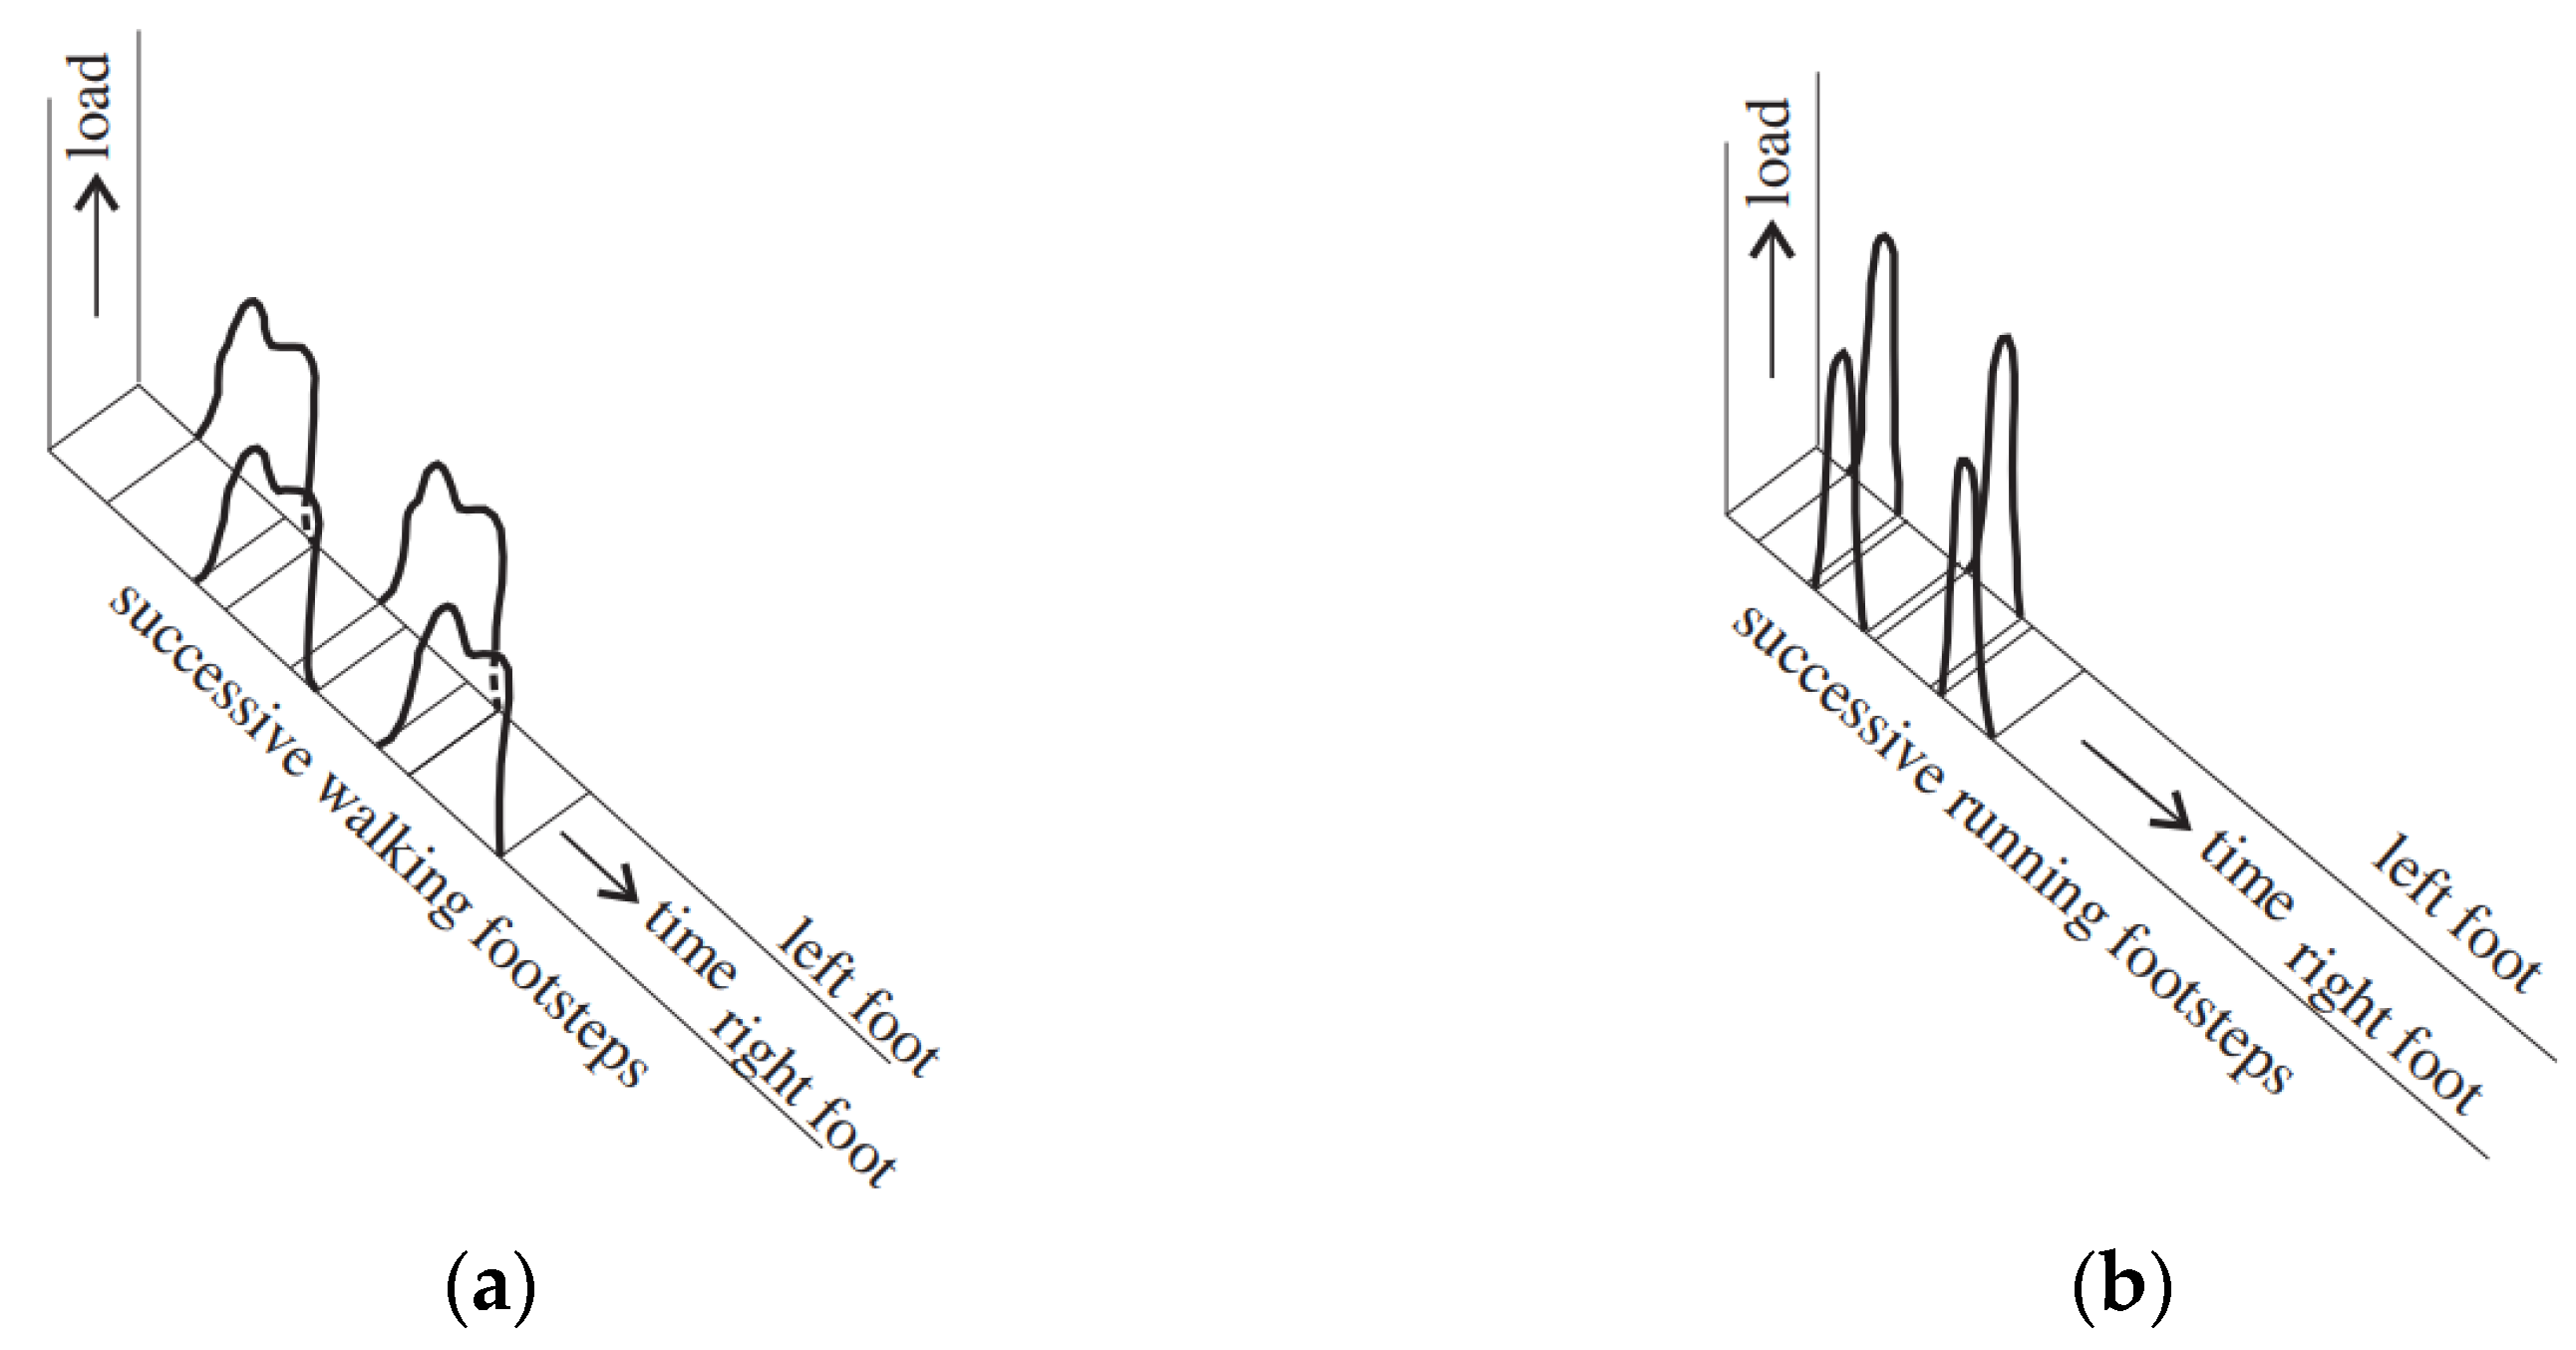
3.2. Human Walking and Running: Equivalent Forces
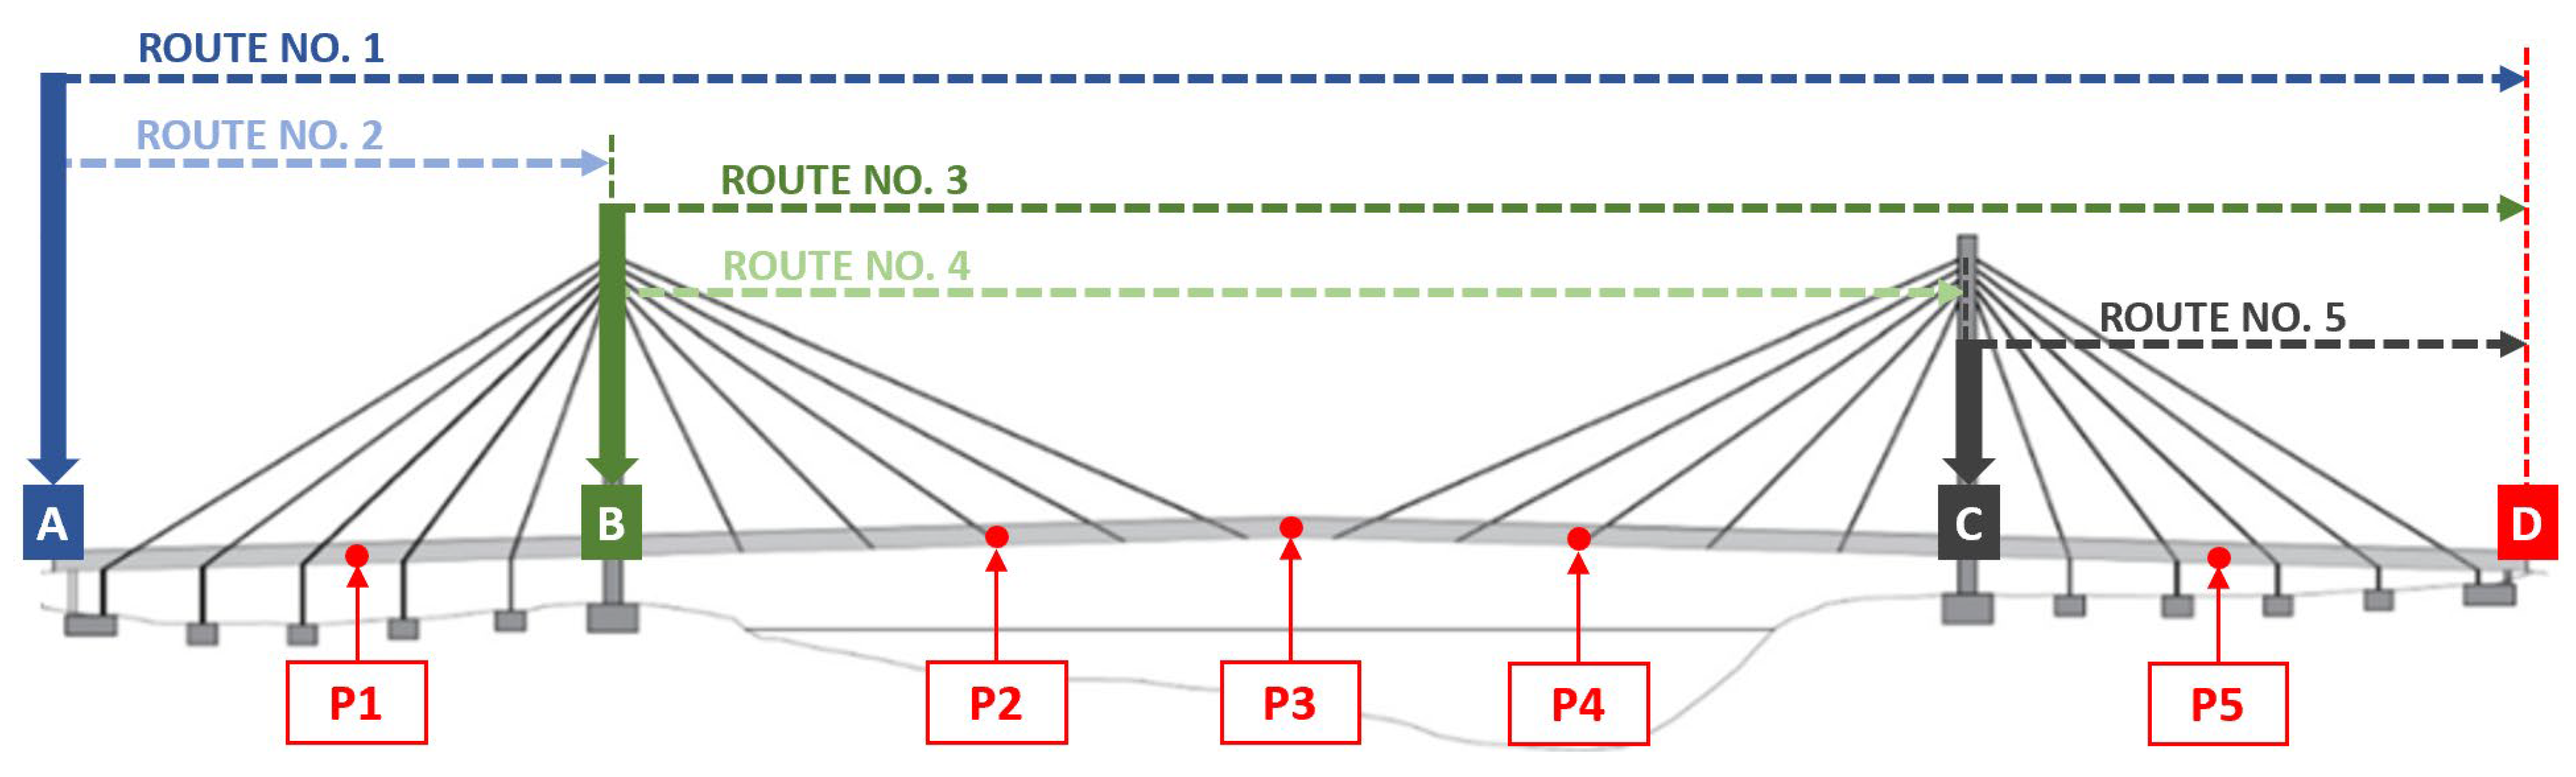
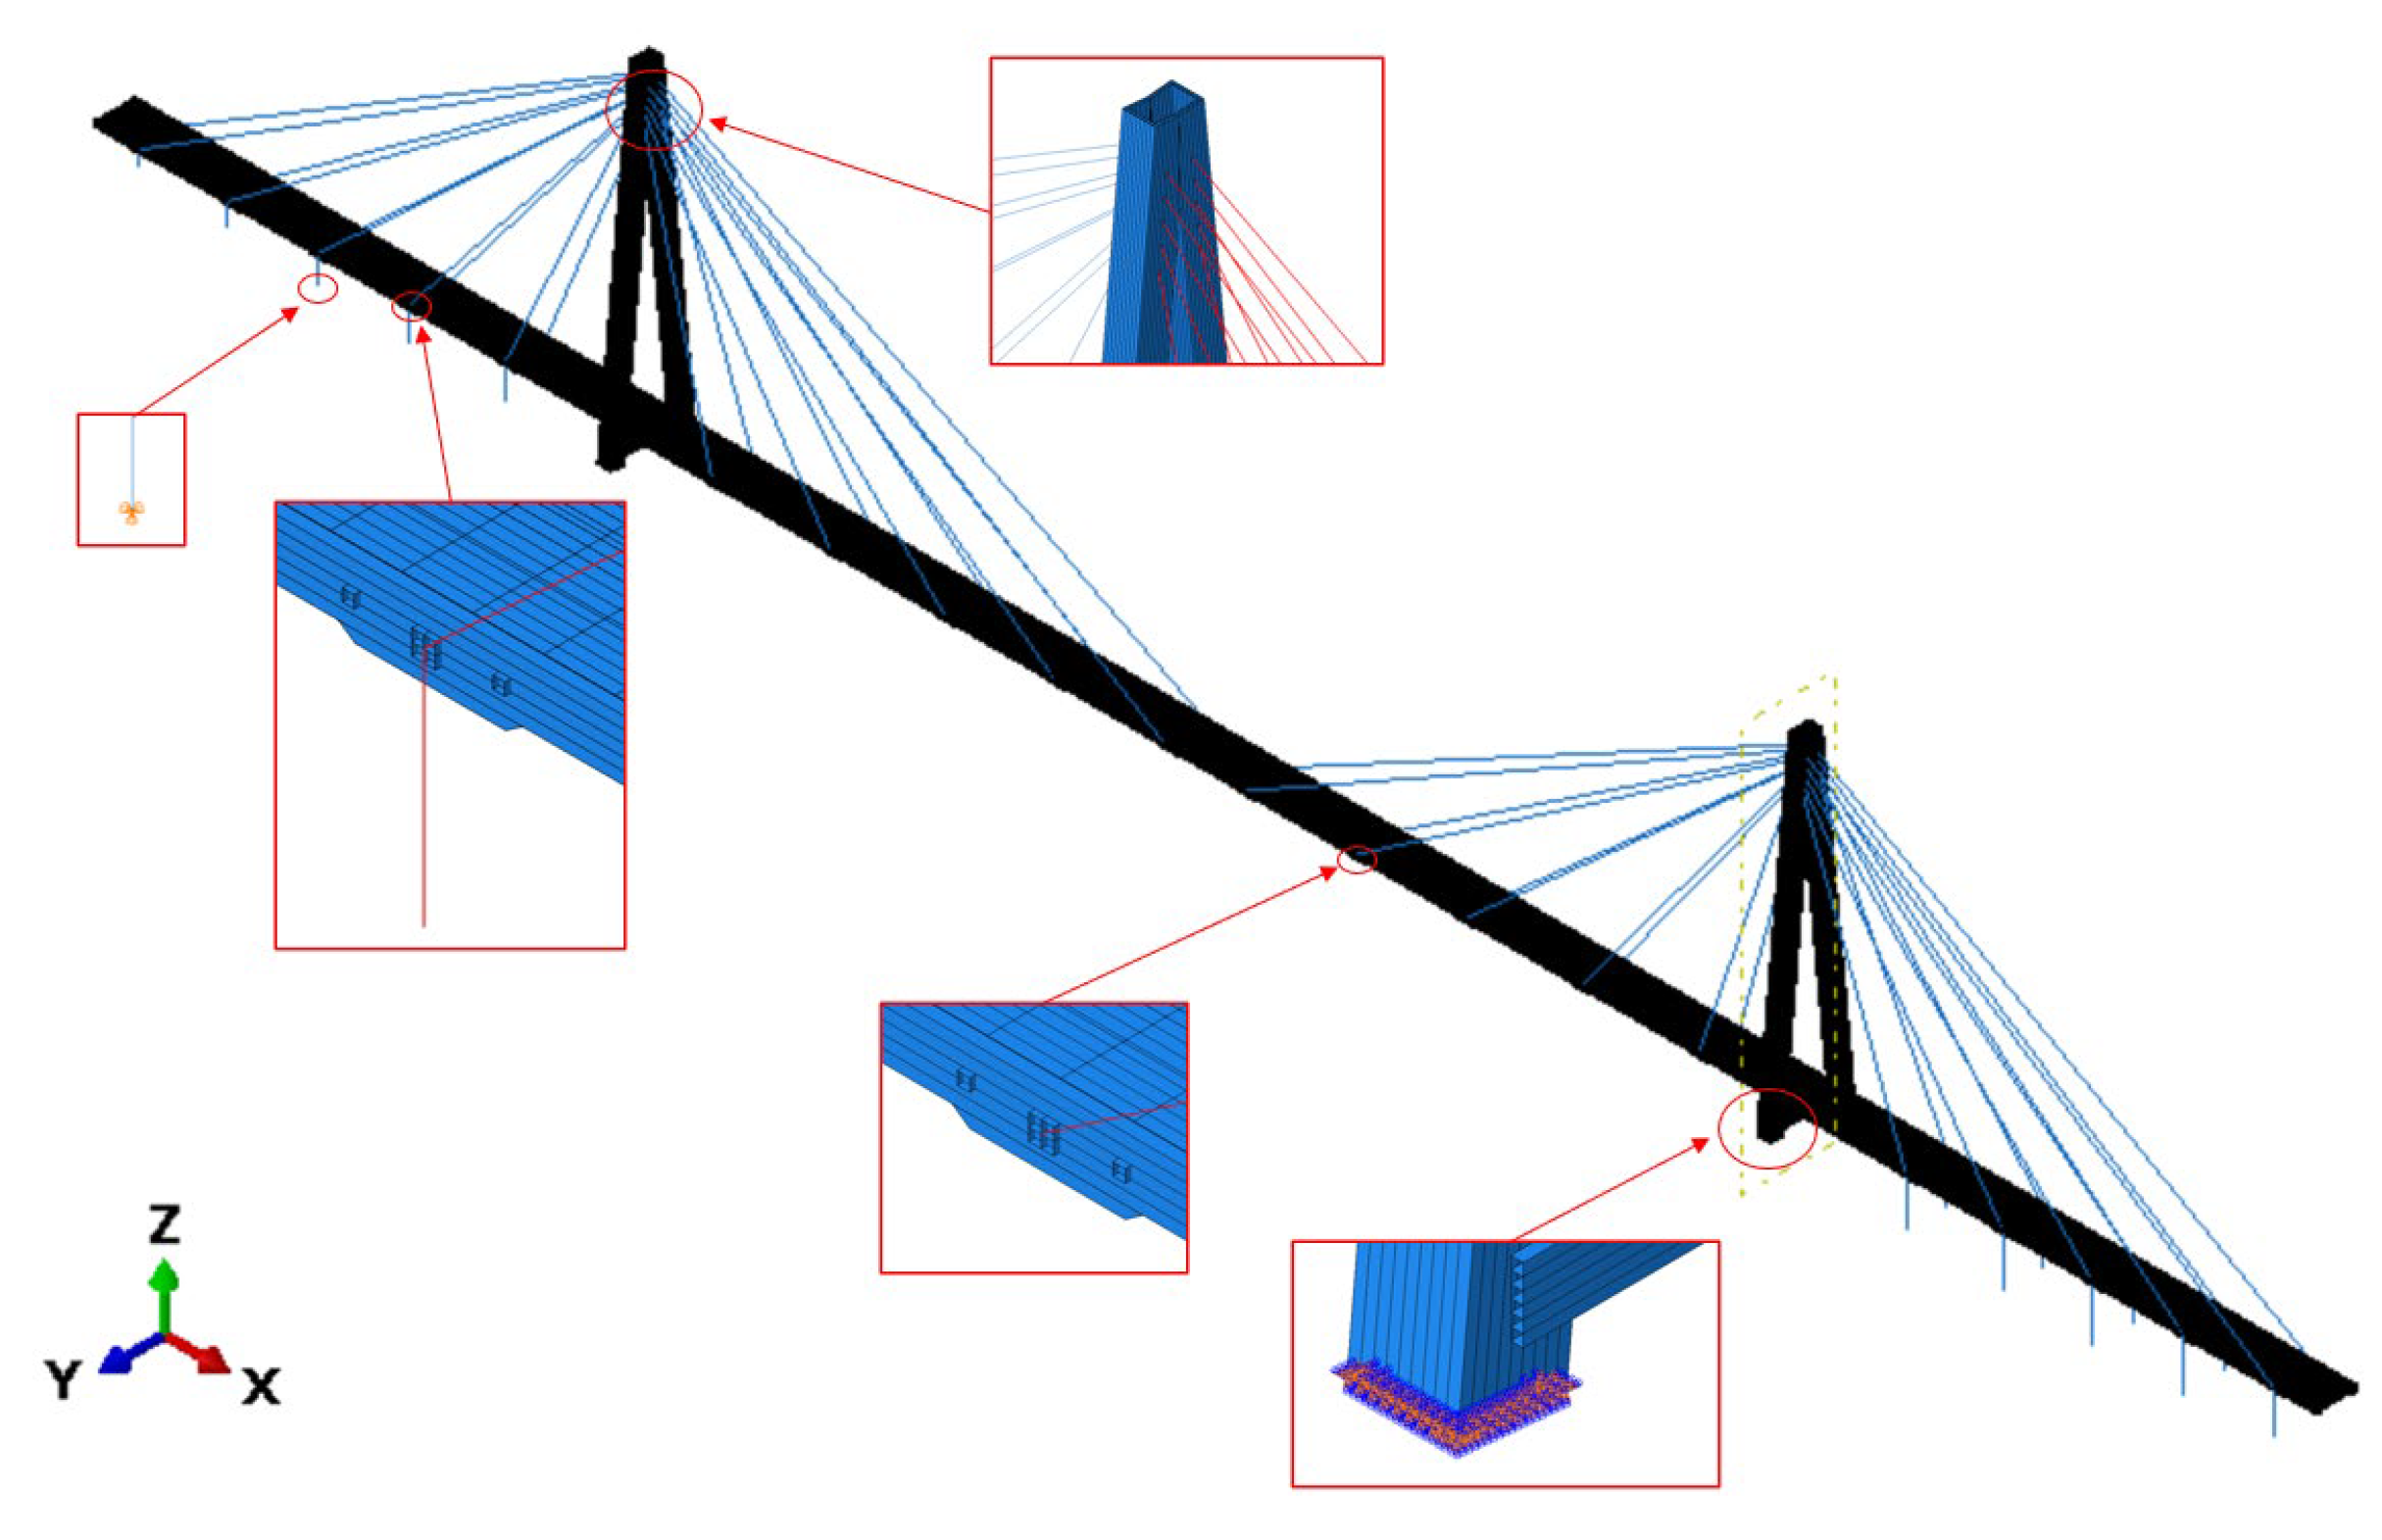
3.3. Human Traveling: The FEM Model and Path Scenarios
3.4. Comfort Criteria Assessment
4. Results and Discussion
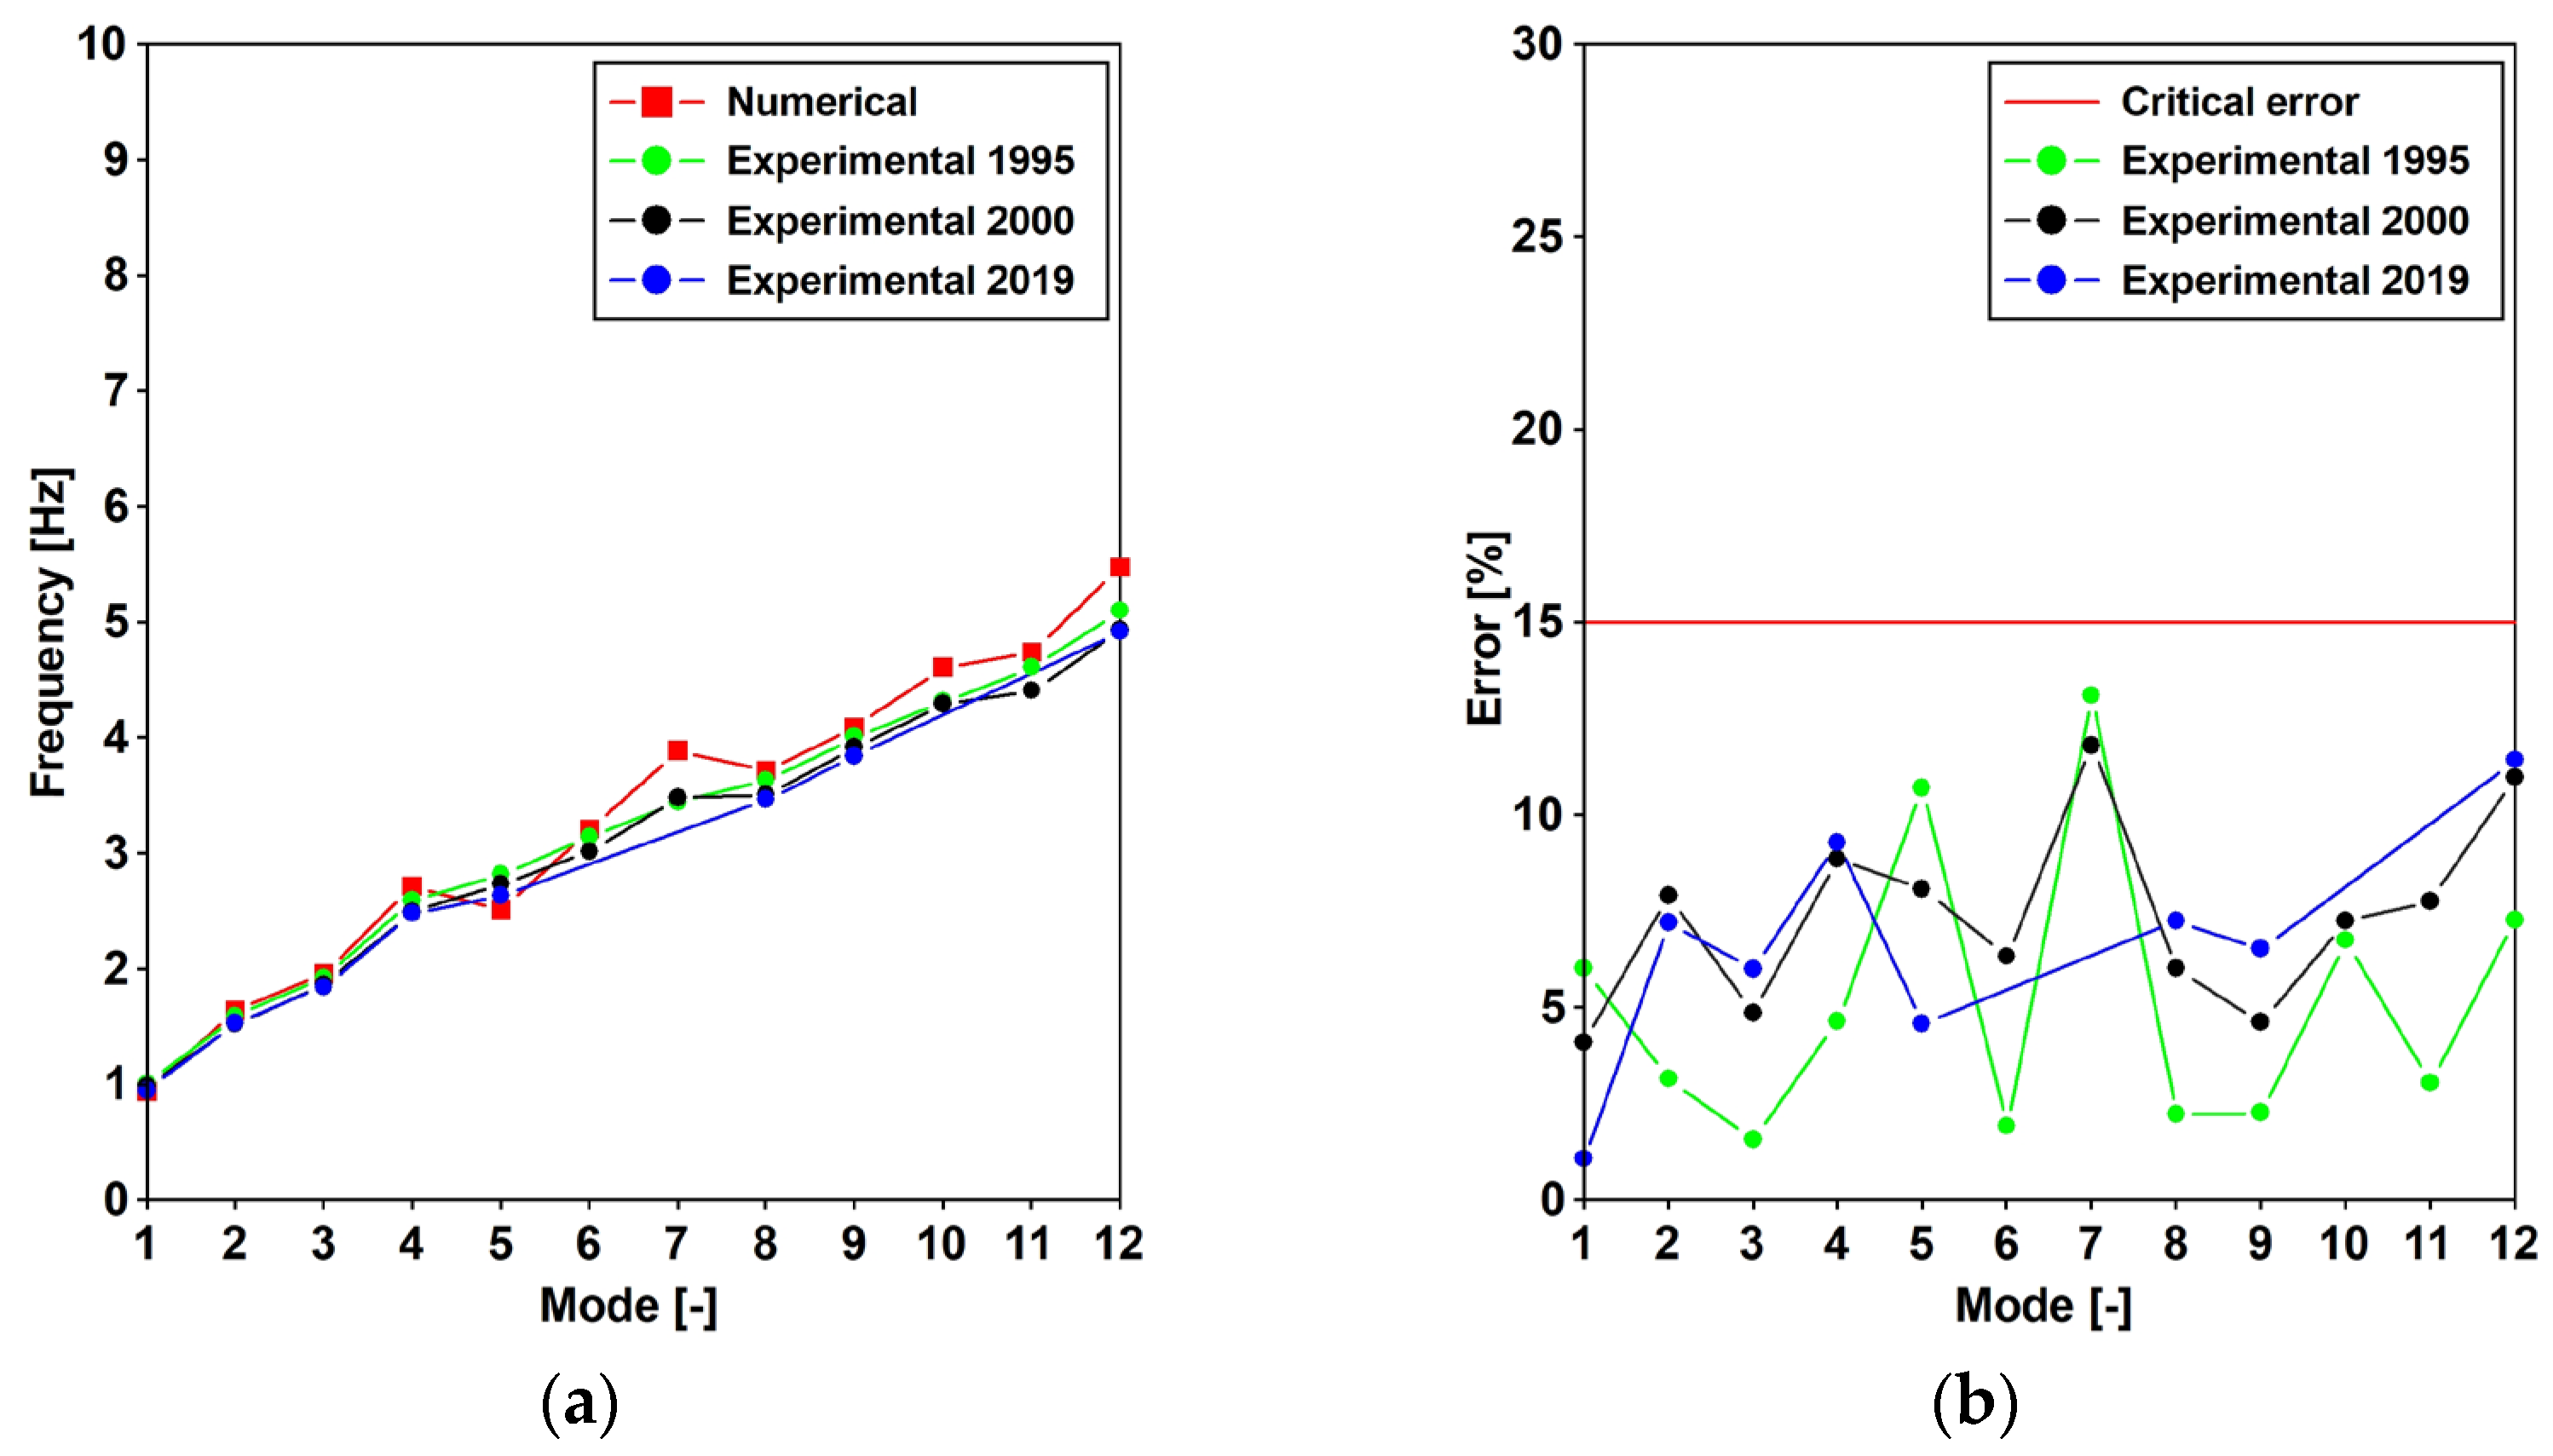
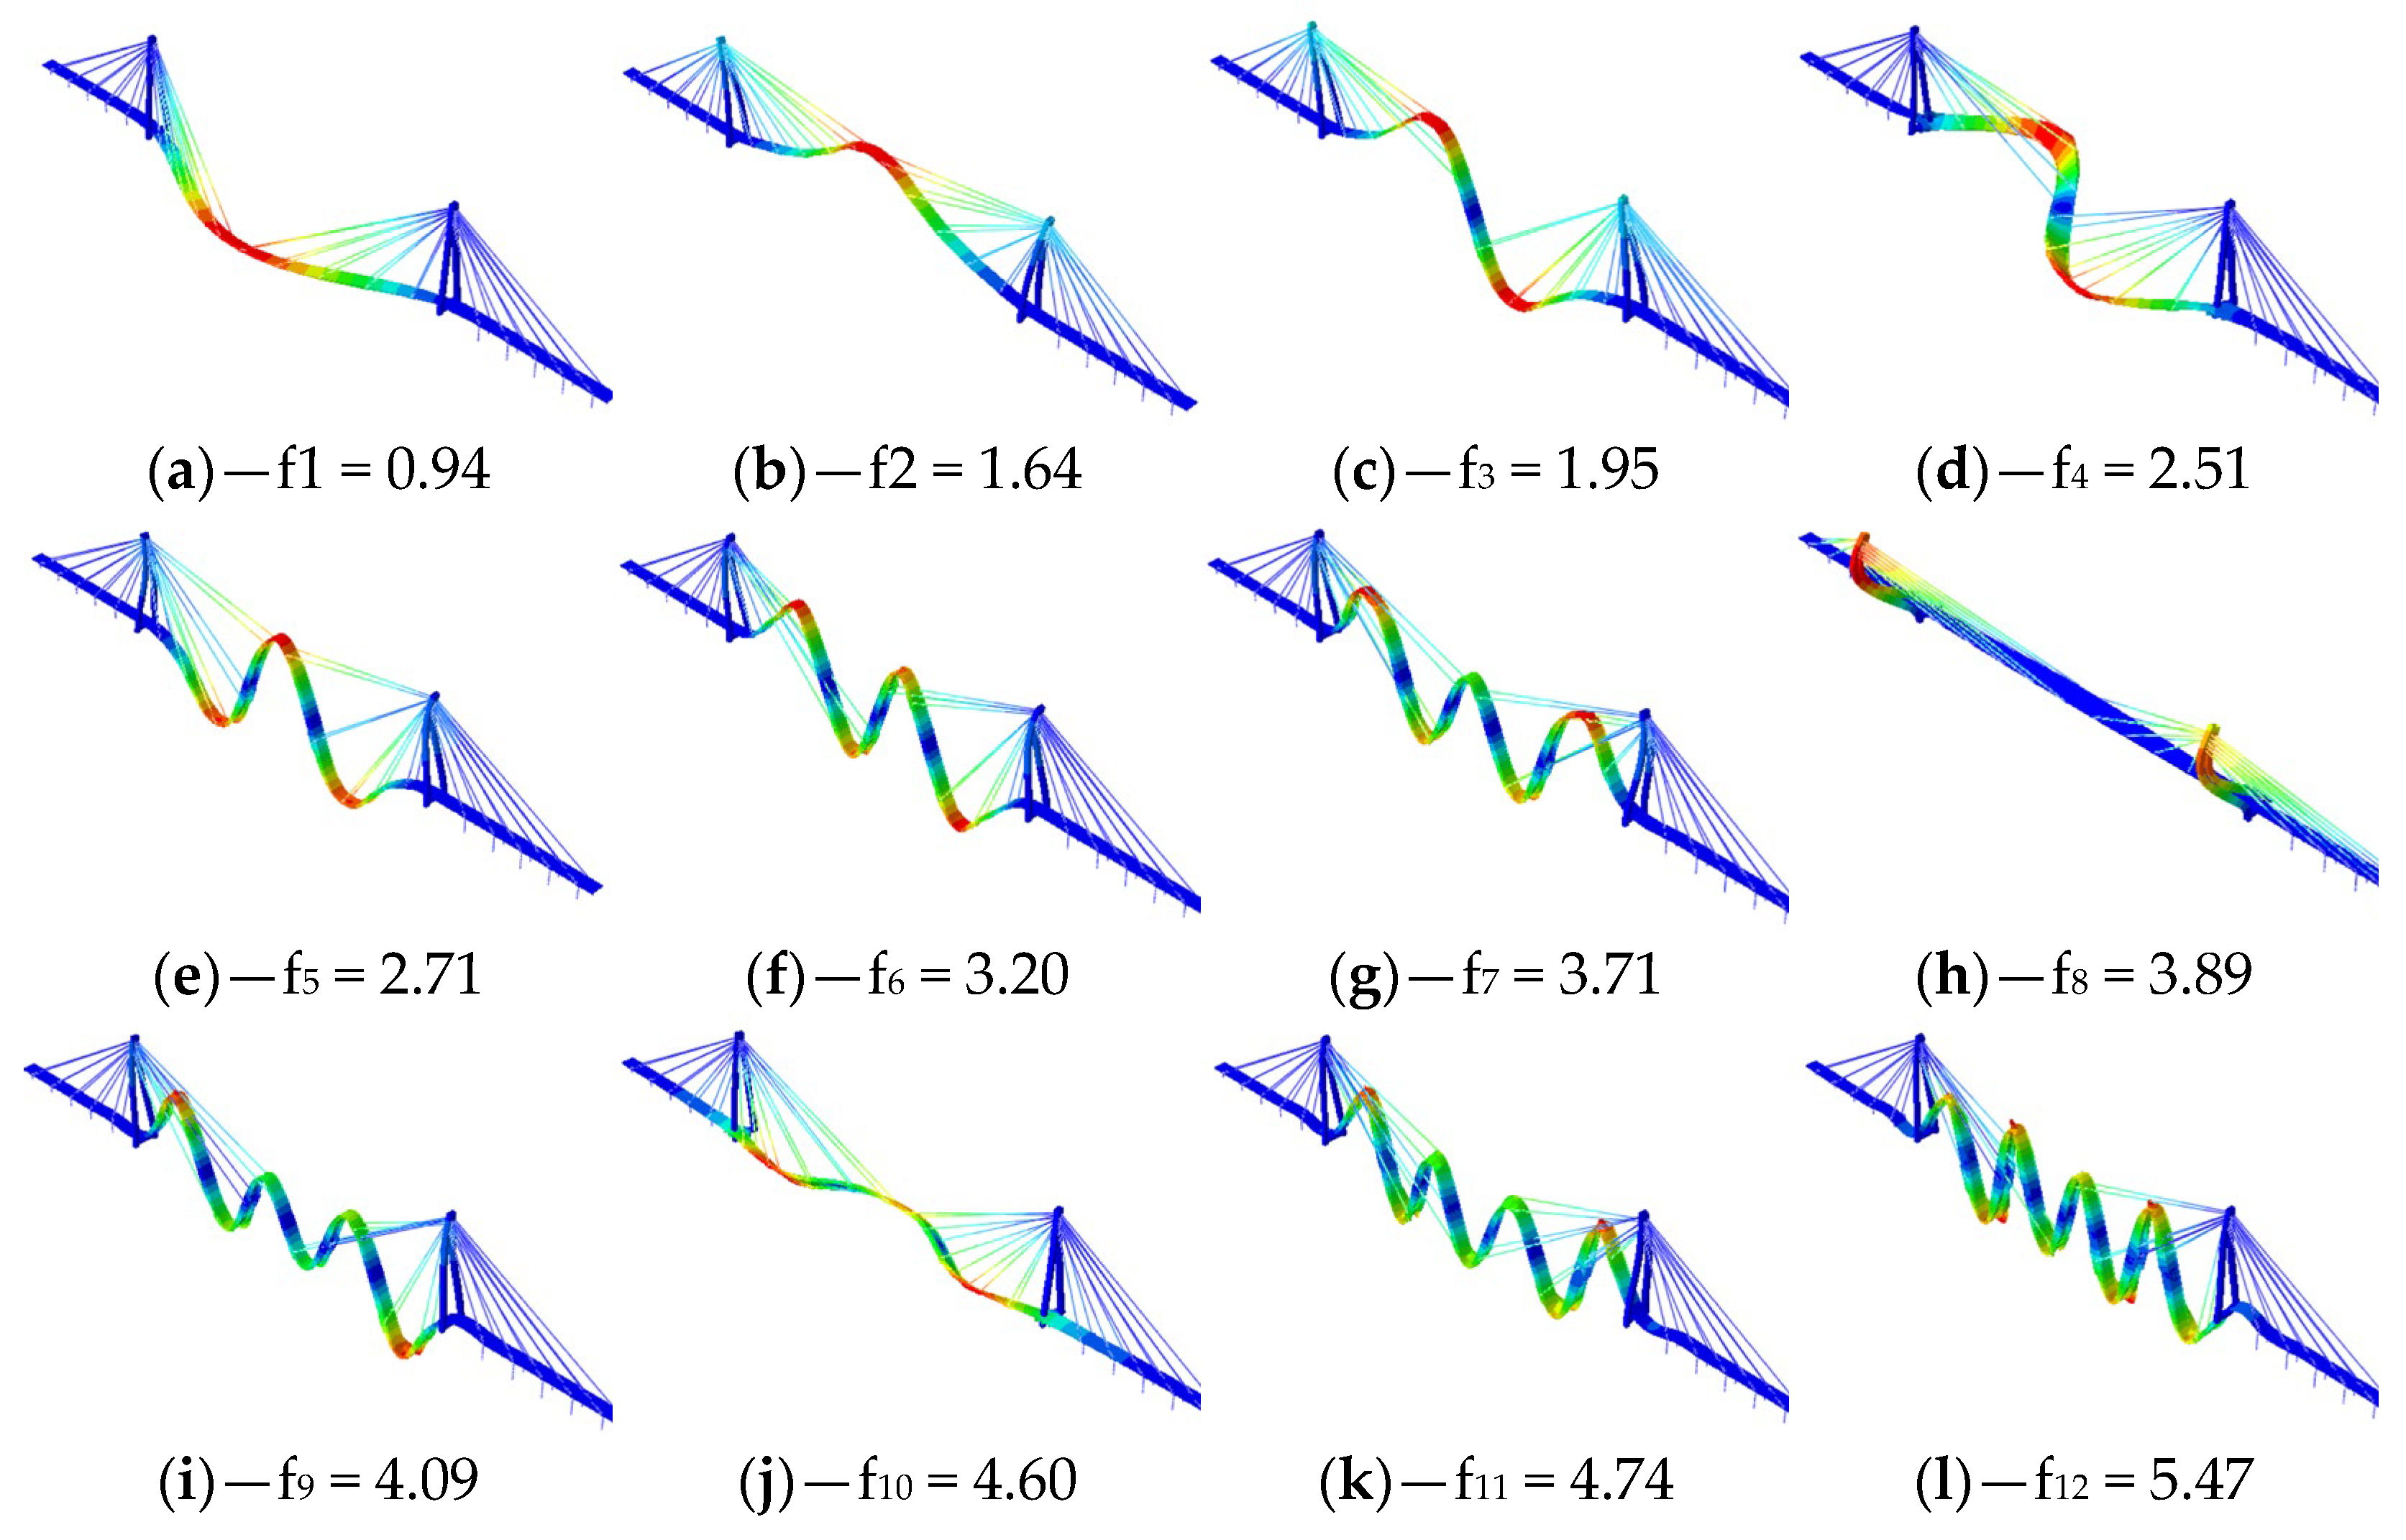
4.1. Modal Parameters of the Footbridge
4.2. Pedestrian-Induced Accelerations vs. Structural Performance
4.3. Pedestrian Frequency Selection
4.4. Pedestrian Frequency Dependence
4.4.1. Multiple-Path Dependence
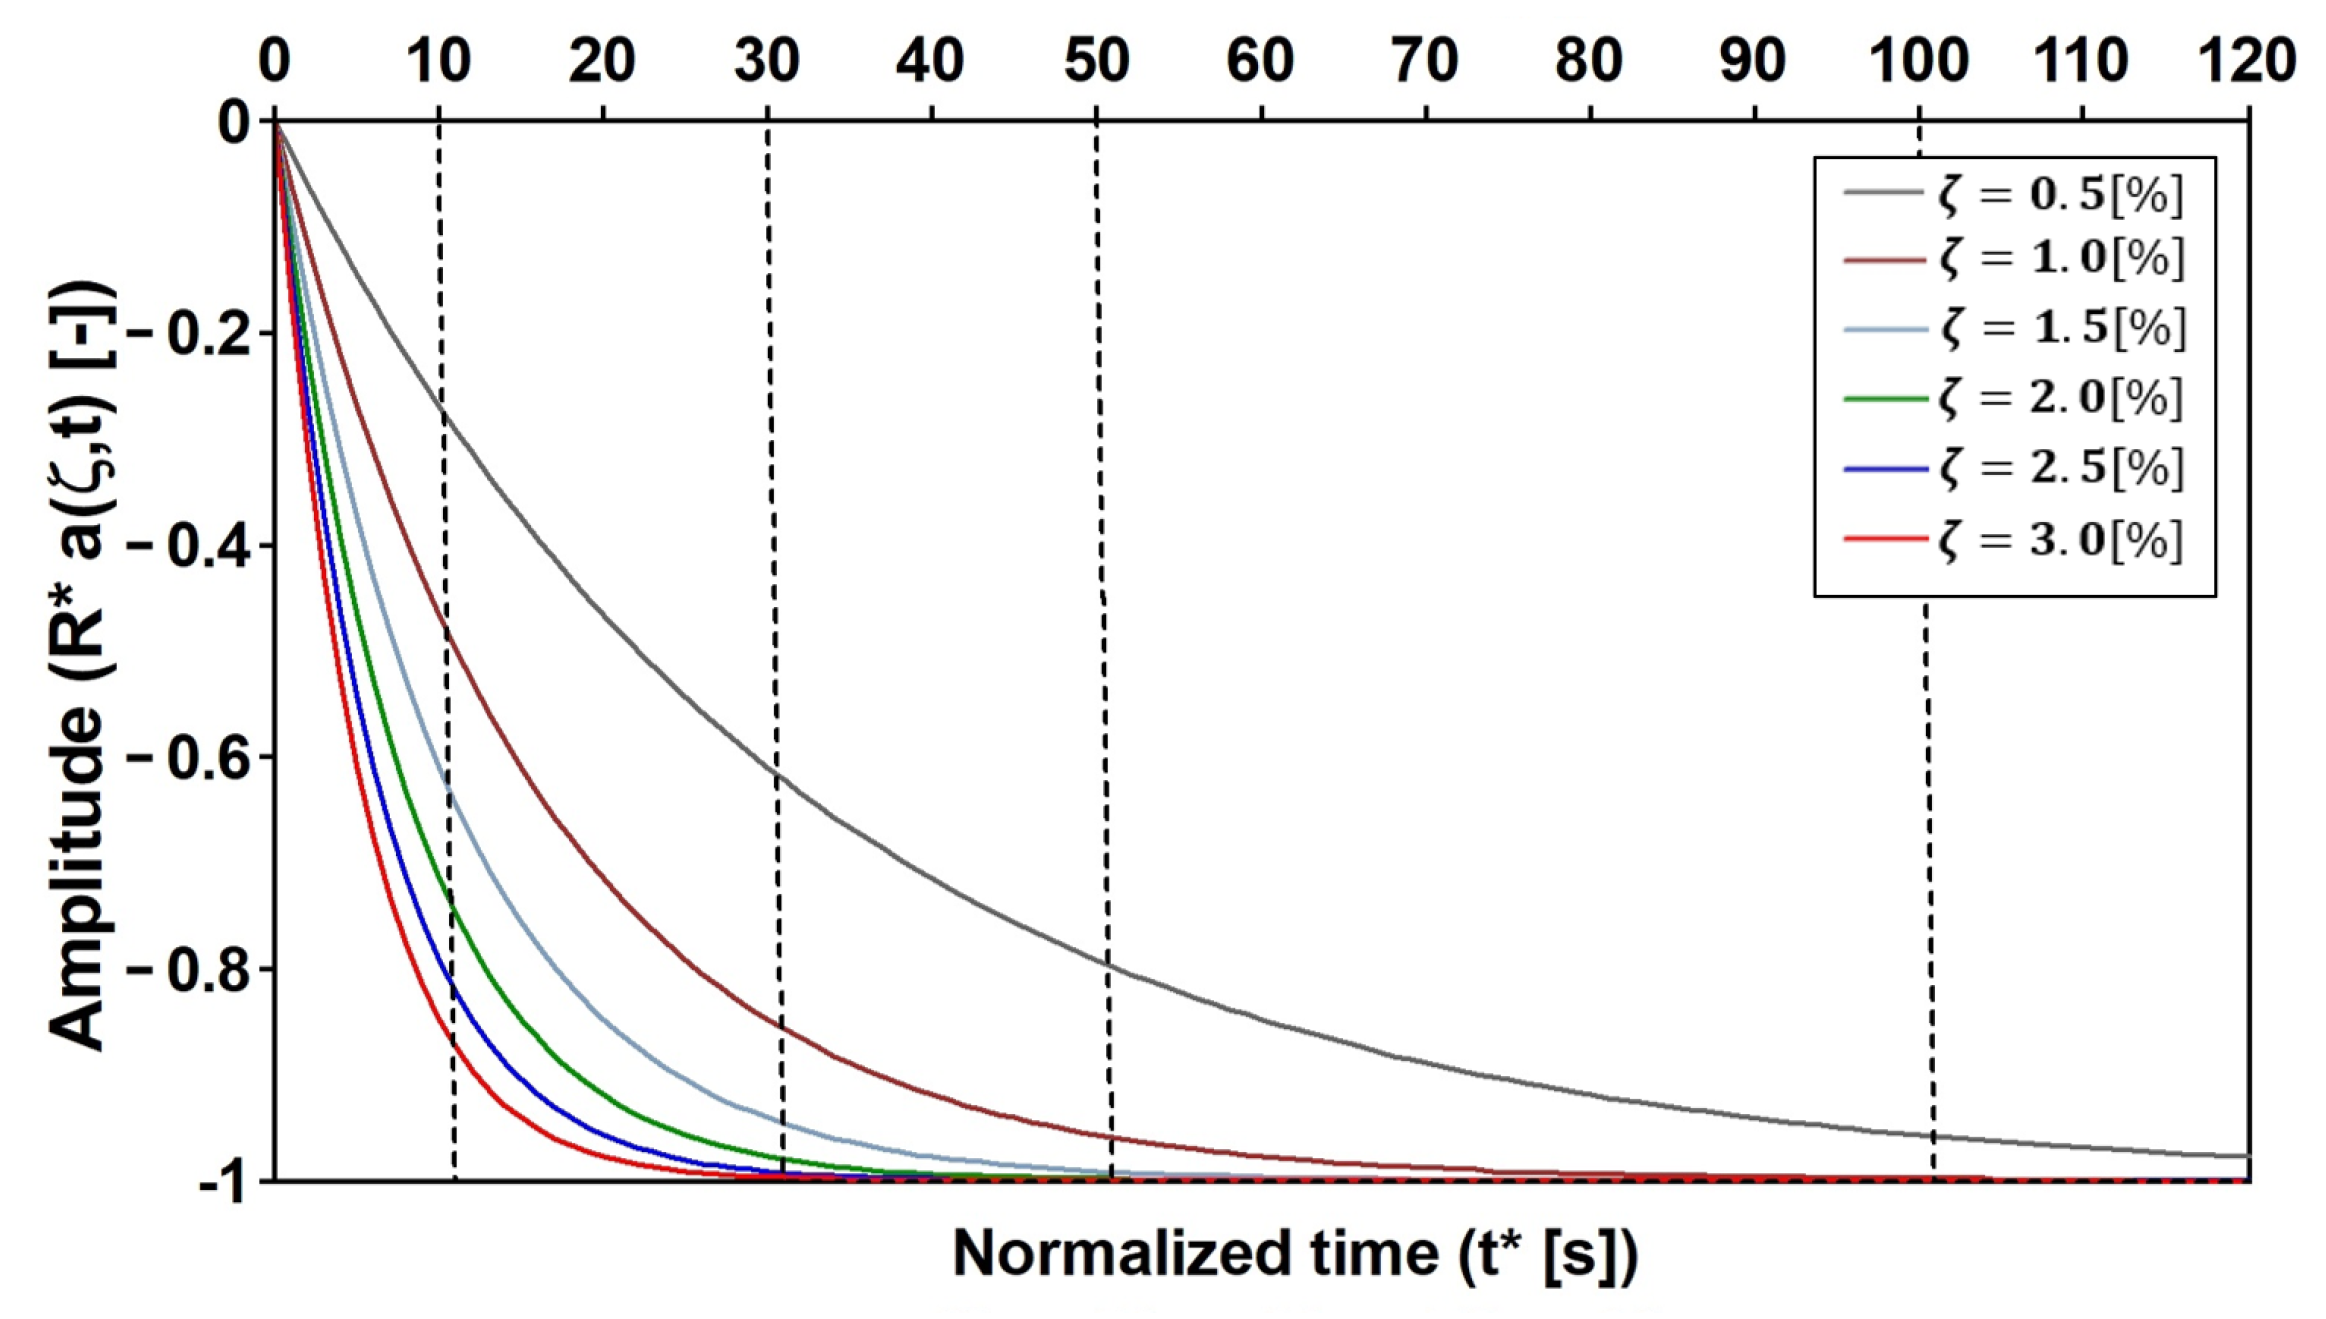
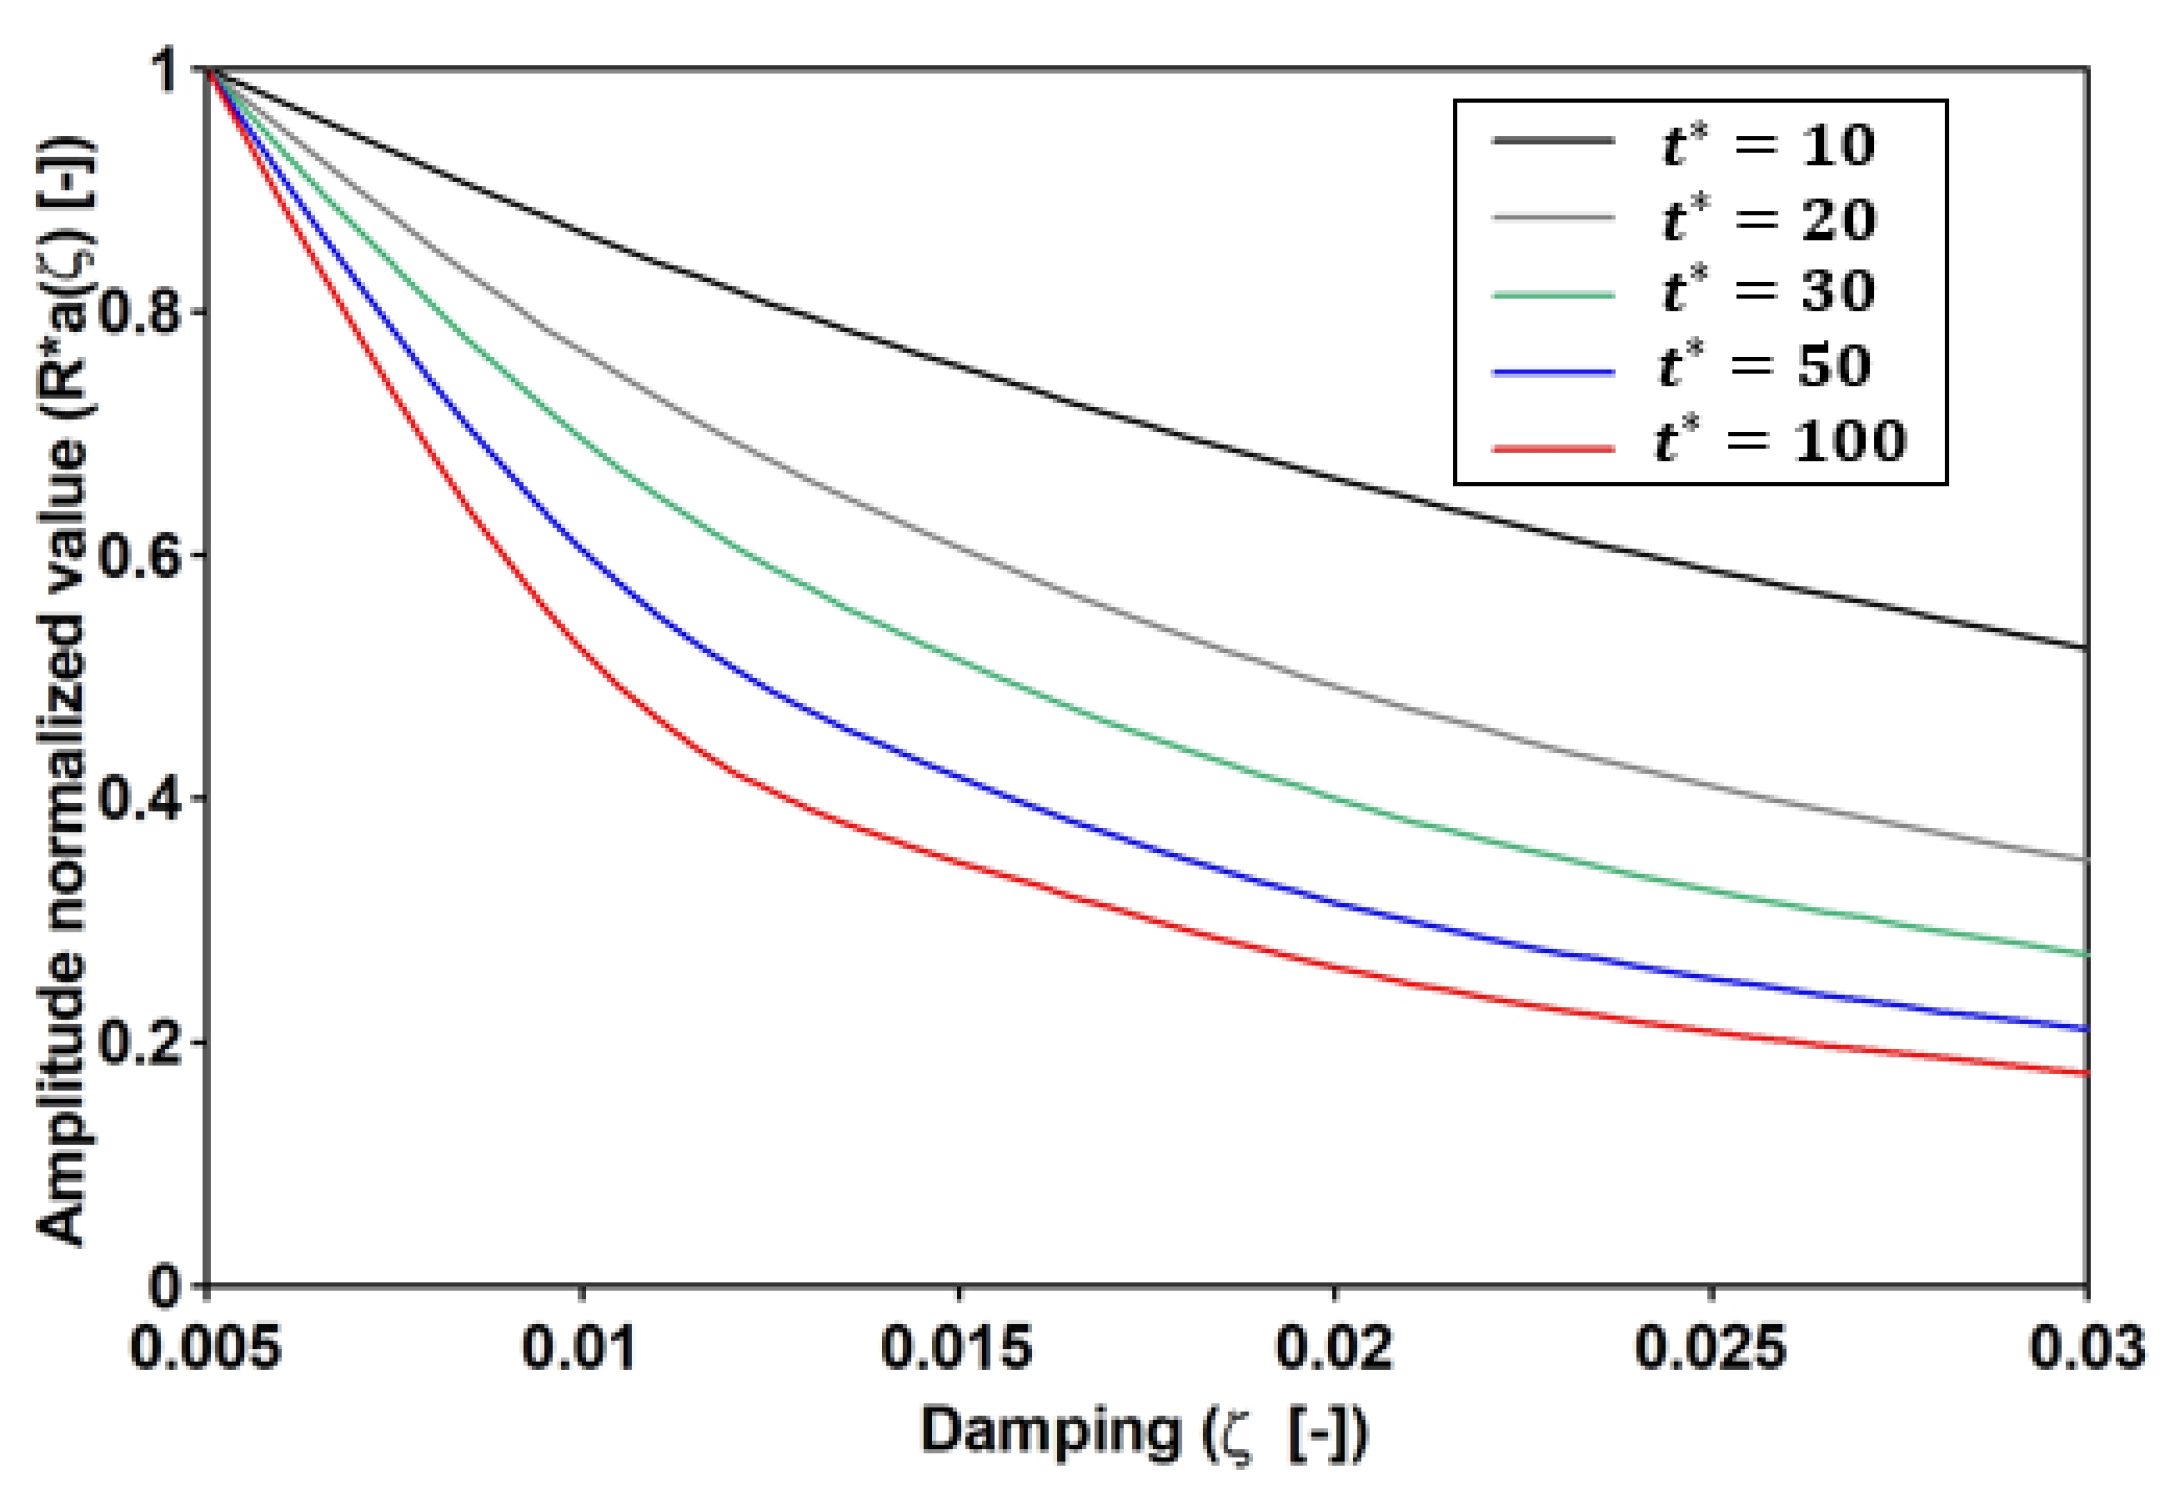
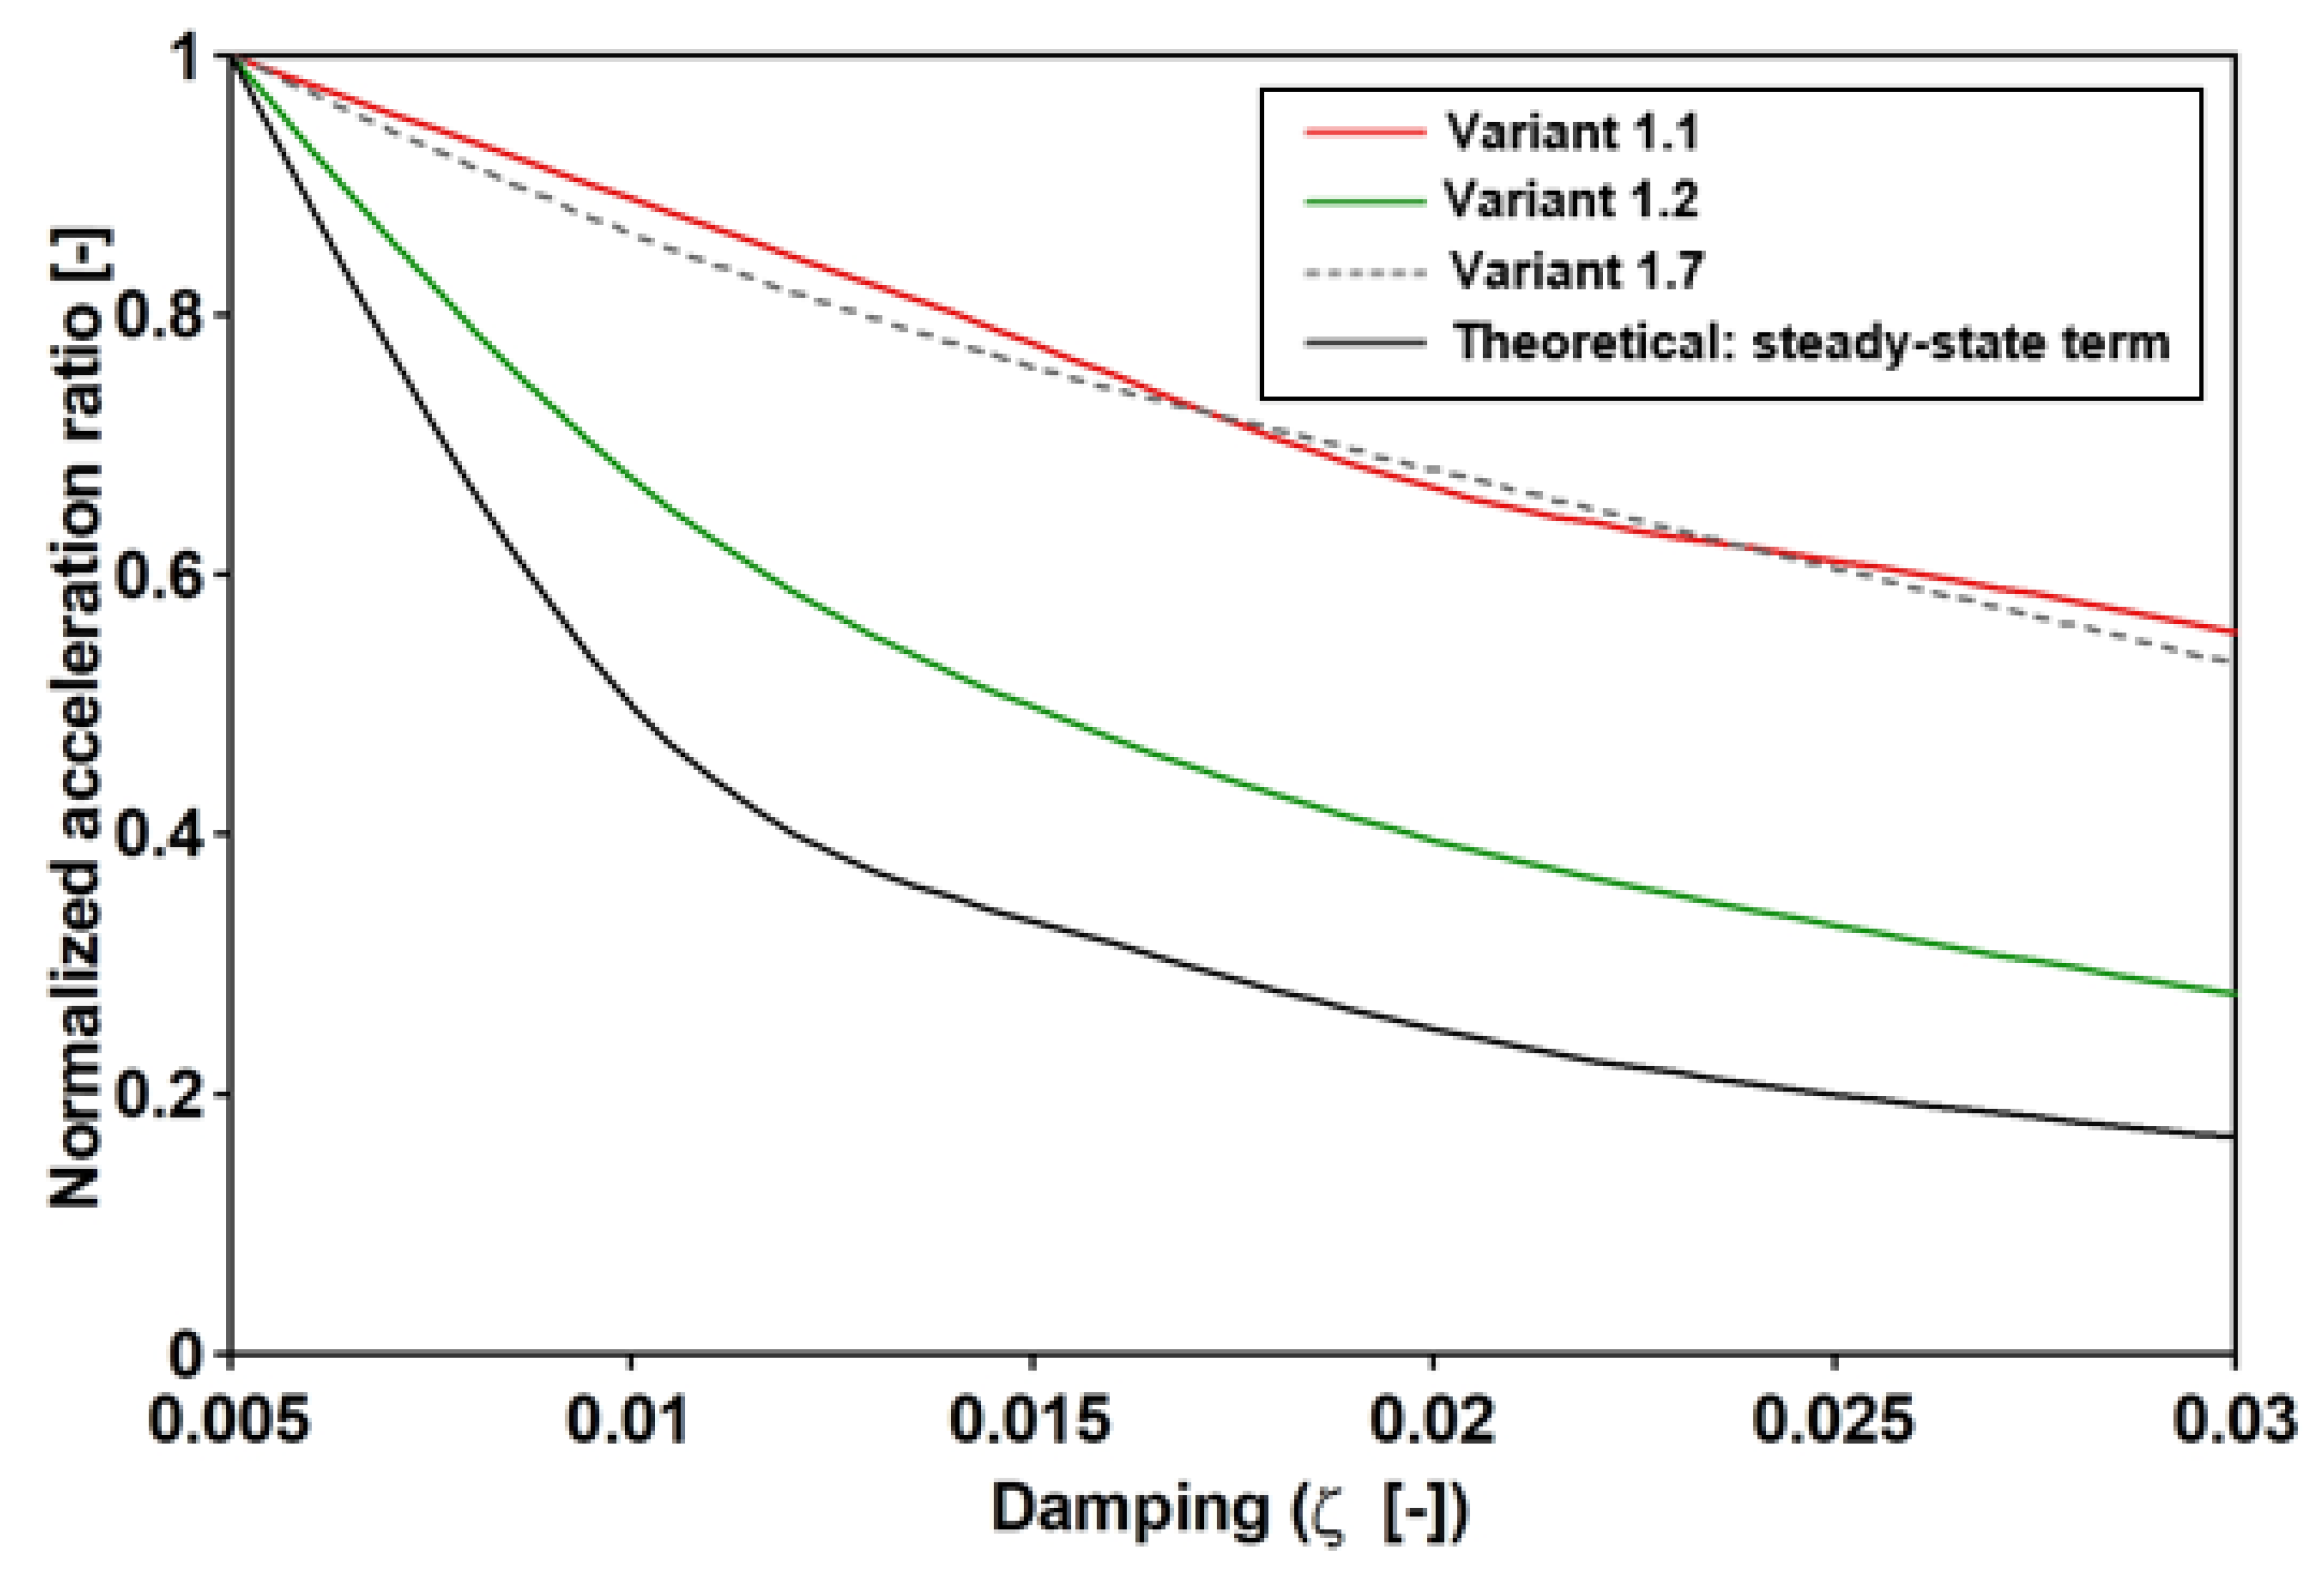
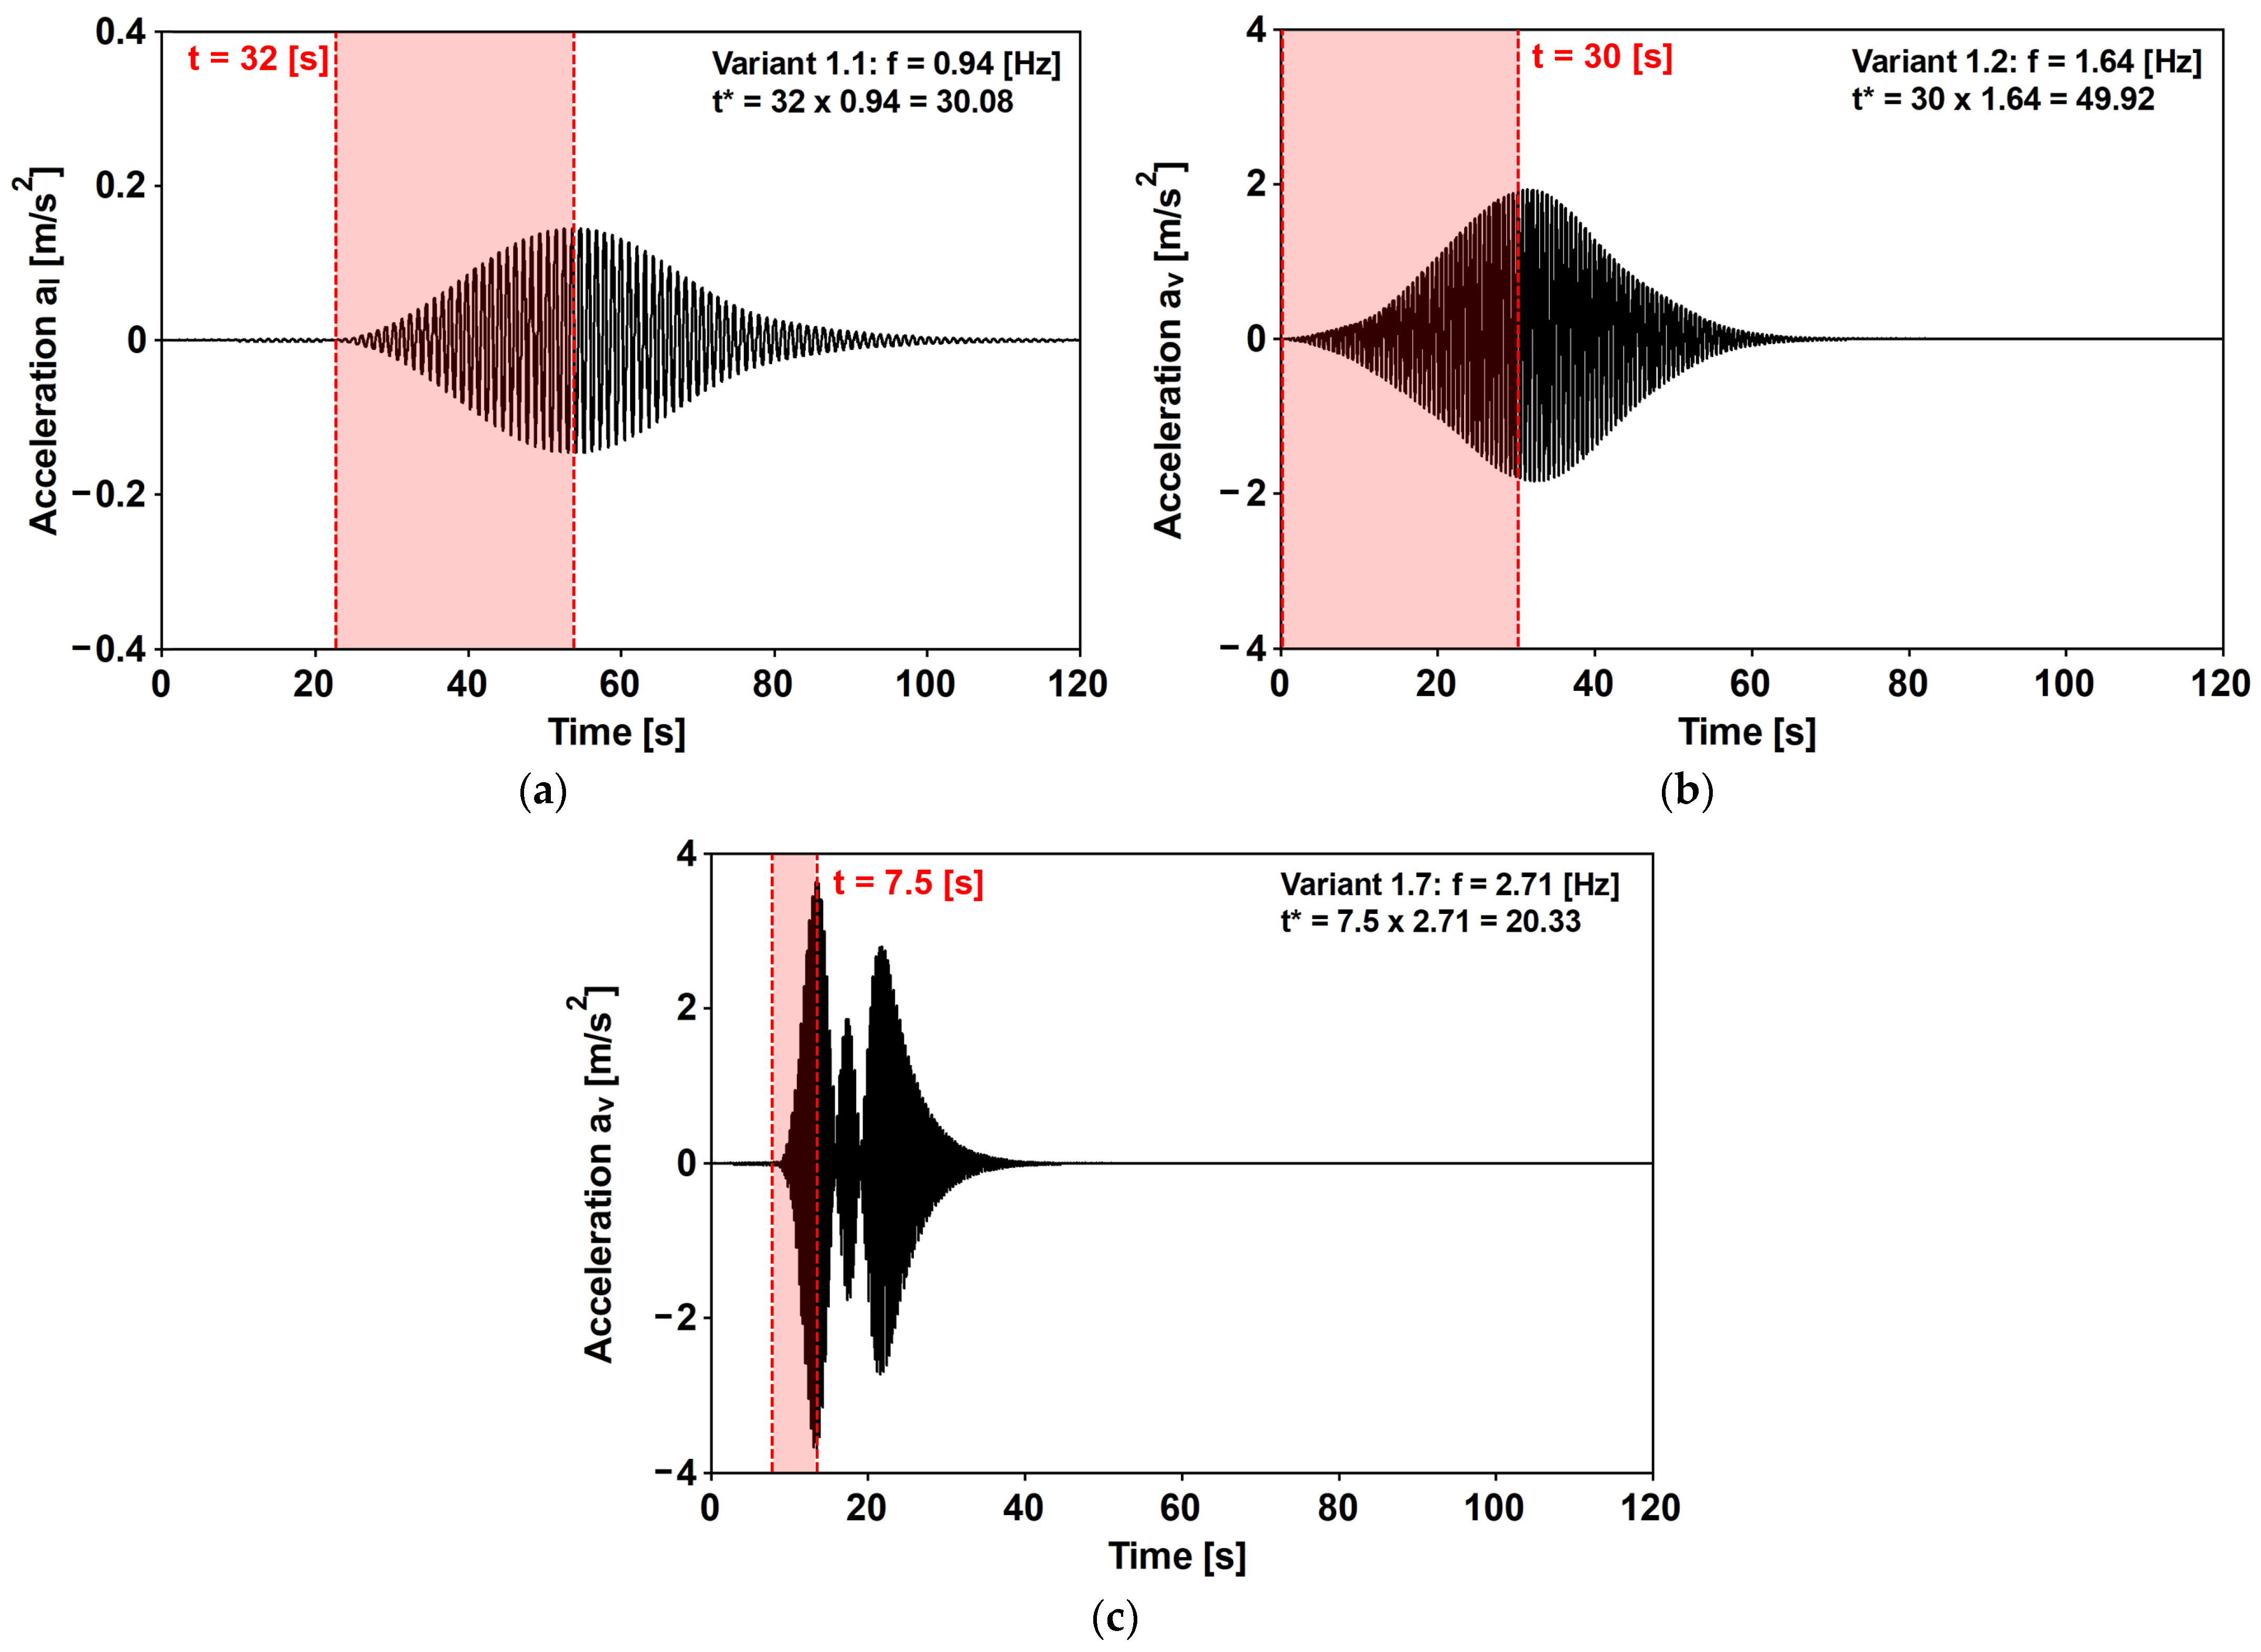
4.4.2. The Dynamic Response vs. the Damping Ratio
4.5. Comfort Criteria Assessment vs. the Definition of a New Comfort Parameter
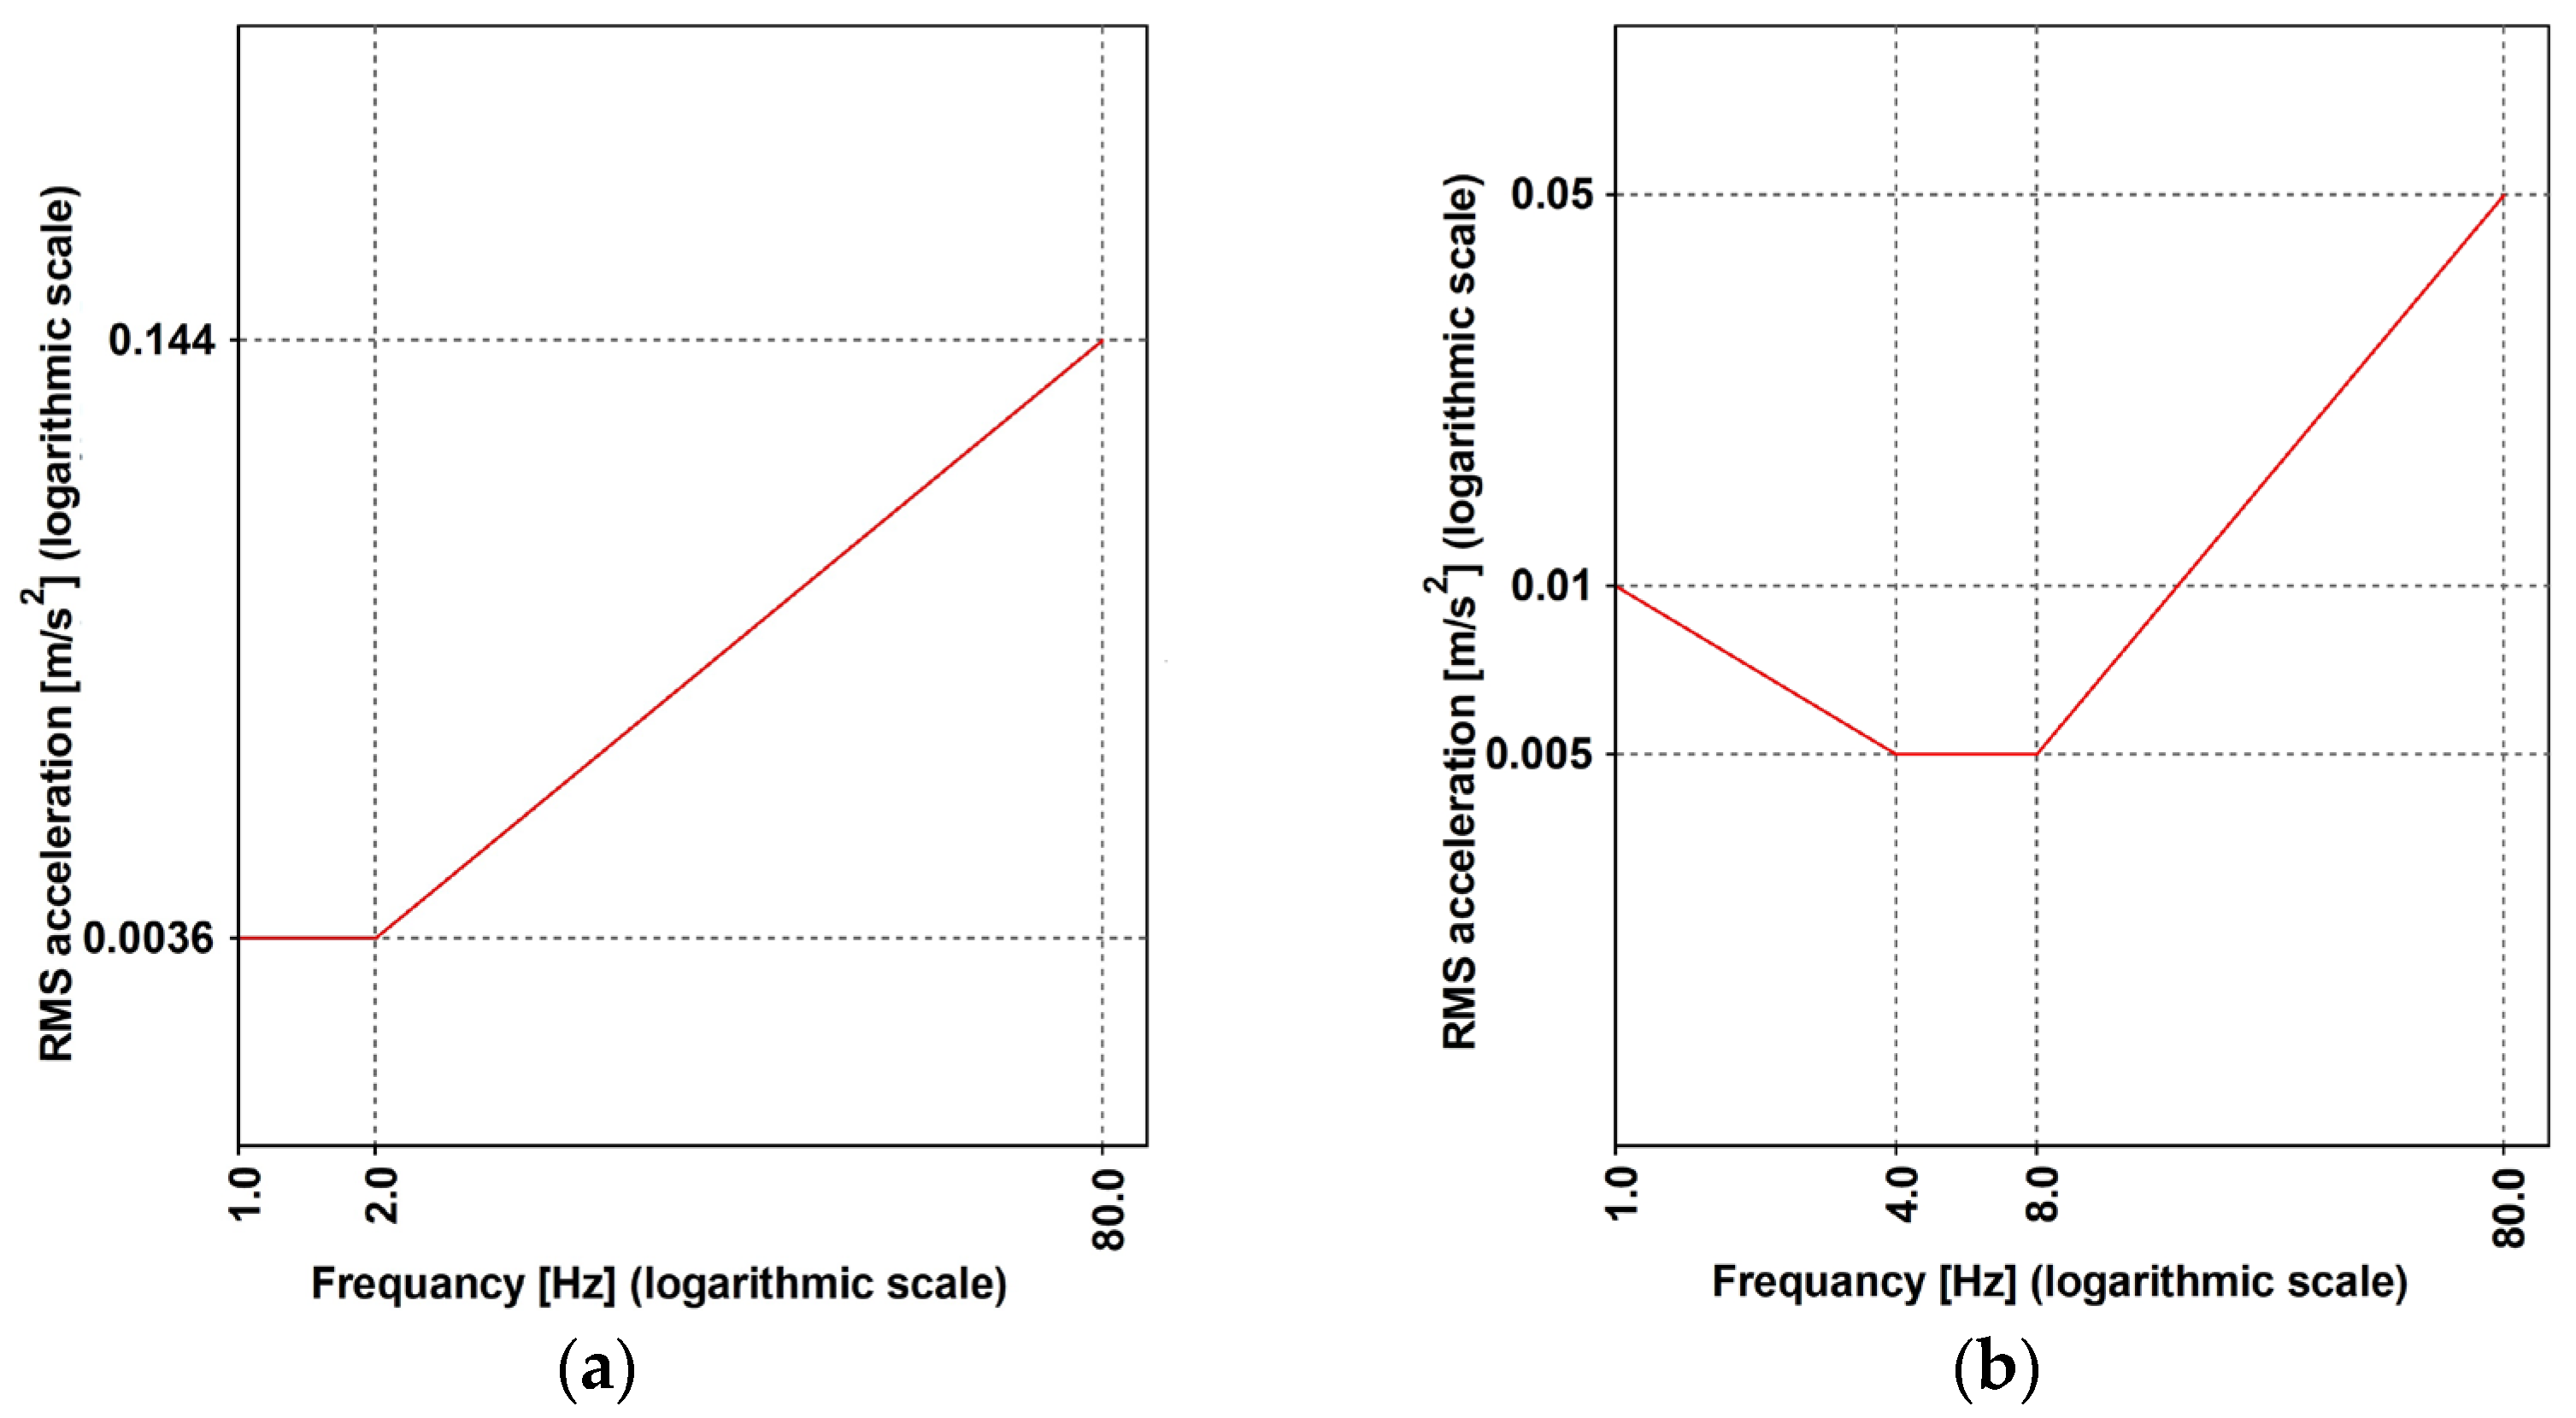
4.5.1. ISO 10137:2007(E) [42]
4.5.2. EN 1990:2002+A1 [37] and BS EN 1991-2:2003 [43]
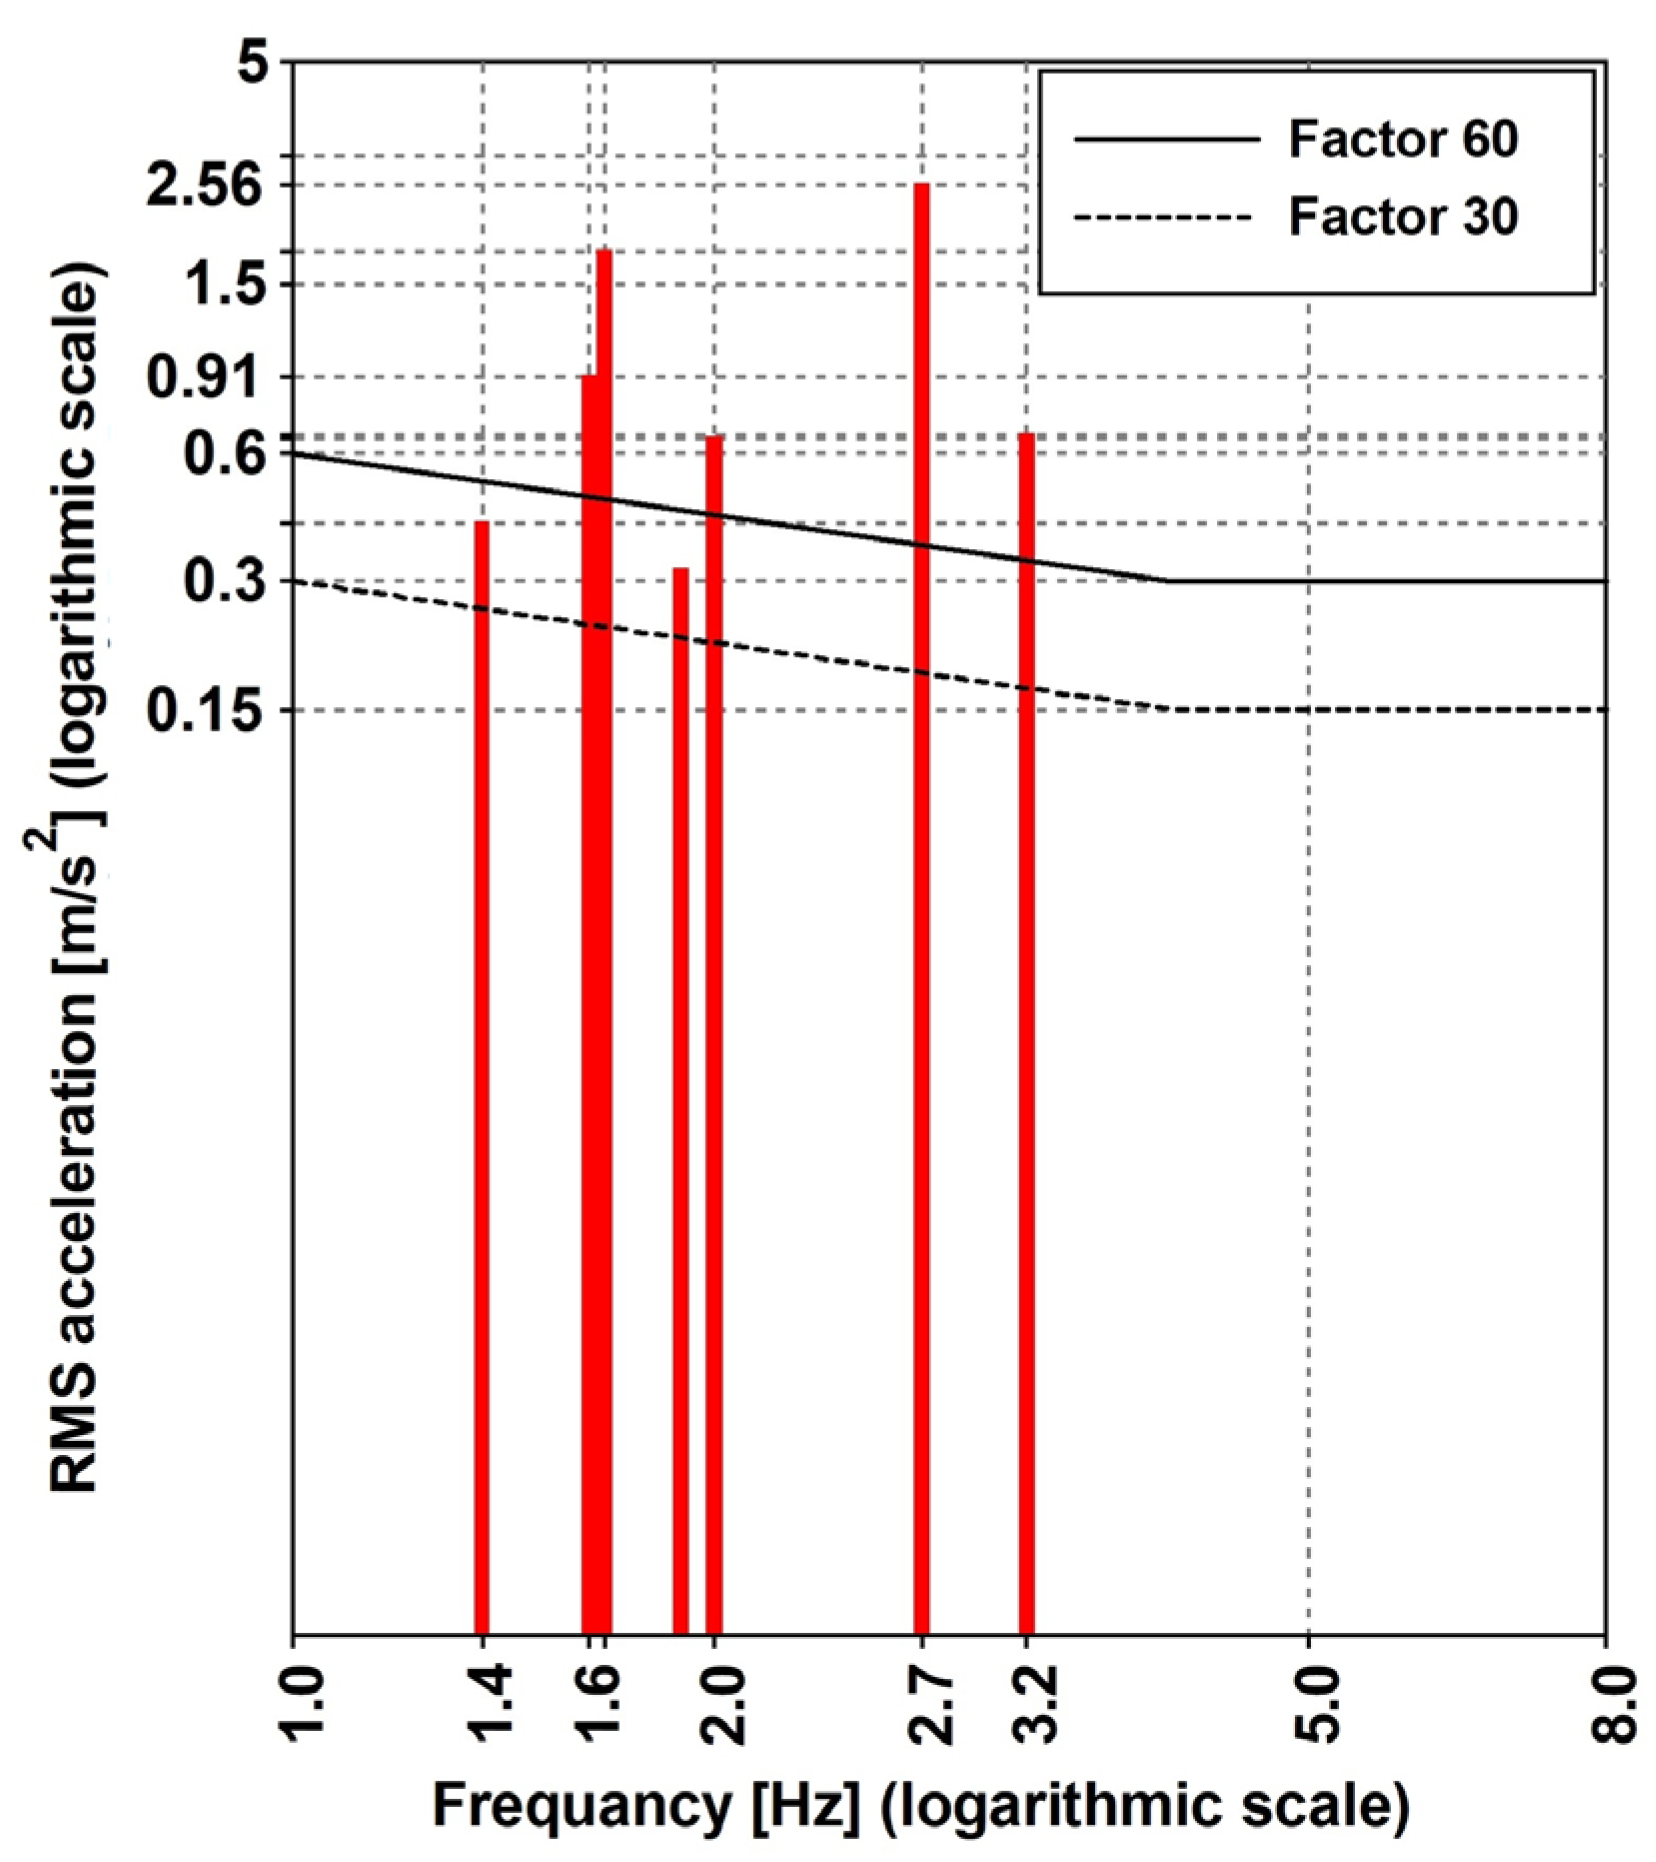
4.5.3. SÉTRA [38] Technical Guide
5. Conclusions
- The numerical modal evaluation showed that the two fundamental natural frequencies of the Aberfeldy footbridge were in a range that corresponds with a maximum risk of resonance. It is worth noting that the risk of resonance for the investigated footbridge, in terms of the human-induced dynamic loading, could be more significant than for other types of composite material footbridges, i.e., double-tied or U-beam structures [21];
- The response of this structure to pedestrian-induced dynamic loading with the frequency around eigenvalues was evaluated. For the lateral direction, comfort criteria passed the criteria of the SÉTRA document [38], EN 1990:2002+A1 [37], BS EN 1991-2:2003 [43], and ISO 10137:2007 (E) [42]. Meanwhile, for the vertical direction, the limits that were exceeded were identified;
- The second harmonic of the dynamic forces that were generated by a typical pedestrian walking across the bridge affects the comfortable use of the footbridge. The recommendation that the frequency limits for light footbridges should be extended to account for excitation by higher harmonics [24] has found justification in respect of the Aberfeldy footbridge;
- Since the Aberfeldy footbridge has three spans, multiple-path dependence was considered. It was concluded that the part of the structure most susceptible to human-induced dynamic excitation was the middle span of the bridge;
- It appears that an additional procedure to assess the comfort criteria assessment for light footbridges is required to quantify the time that a pedestrian spends at a given level of discomfort.
Author Contributions
Funding
Institutional Review Board Statement
Informed Consent Statement
Data Availability Statement
Conflicts of Interest
References
- Capozucca, R.; Magagnini, E.; Bettucci, E. Delamination buckling of GFRP-strips in strengthened RC beams. Compos. Struct. 2022, 300, 116183. [Google Scholar] [CrossRef]
- Purwanto, E.; Adri, P.A.; Kristiawan, S.A.; Sangadji, S.; Halwan, S.H. Strengthening of non-engineered building beam-column joint to increase seismic performance with variation of steel plate width. In Lecture Notes in Civil Engineering, Proceedings of the 5th International Conference on Rehabilitation and Maintenance in Civil Engineering: ICRMCE 2021, Surakarta, Indonesia, 8–9 July 2021; Springer: Singapore, 2022; Volume 225, pp. 215–224. [Google Scholar] [CrossRef]
- Gatesco, N. New Materials for the Rehabilitation of Cultural Heritage; České Vysoké Učení Technické v Praze: Prague, Czech Republic, 2011. [Google Scholar]
- Bank, L.C. Application of FRP composites to bridges in the USA. In Proceedings of the International Colloquium on Application of FRP to Bridges; Japan Society of Civil Engineers (JSCE): Tokyo, Japan, 2006; pp. 9–16. [Google Scholar]
- Hollaway, L.C. A review of the present and the future utilization of FRP composites in the civil infrastructure with reference to their important in-service properties. Constr. Build Mater. 2010, 24, 2419–2445. [Google Scholar] [CrossRef]
- Pyrzkowski, Ł.; Misiewicz, M. Modern GFRP Composite Footbridges. In Proceedings of the 10th International Conference “Environmental Engineering”, Vilnius, Lithuania, 27–28 April 2017. [Google Scholar]
- Smits, J. Fiber-Reinforced Polymer Bridge Design in the Netherlands: Architectural Challenges toward Innovative, Sustainable, and Durable Bridges. Engineering 2016, 2, 518–527. [Google Scholar] [CrossRef]
- Alper, H.; Barton, F.W.; McCormick, F.C. Optimum design of a reinforced plastic bridge girder. Comput. Struct. 1977, 7, 249–256. [Google Scholar] [CrossRef]
- Gao, H.; Sun, Y.; Jian, J.; Dong, Y.; Liu, H. Study on mechanical properties and application in communication pole line engineering of glass fiber reinforced polyurethane composites (GFRP). Case Stud. Constr. Mater. 2023, 18, 1–19. [Google Scholar] [CrossRef]
- Stankiewicz, B.; Tatara, M. Applications of glass and glass fiber retrofit polymer in modern footbridges. J. Civil Eng. Archit. 2015, 9, 791–797. [Google Scholar] [CrossRef]
- Quadrino, A.; Damiani, M.; Penna, R.; Feo, L.; Nisticò, N. Lecture Notes in Civil Engineering; Springer: Berlin/Heidelberg, Germany, 2022; Volume 198, pp. 46–62. [Google Scholar]
- Areiza-Hurtado, M.; Bansal, A.; Paulotto, C.; Primi, S. FRP girder bridges: Lessons learned in Spain in the last decade. In Proceedings of the 6th International Conference on FRP Composites in Civil Engineering (CICE), Rome, Italy, 13–15 June 2012. [Google Scholar]
- Górriz, P.; Bansal, A.; Paulotto, C.; Primi, S.; Calvo, I. Composite Solutions for Construction Sector. In Case Study of Innovative Projects—Successful Real Cases; Intech Open: London, UK, 2017; pp. 39–57. [Google Scholar]
- Stankiewicz, B. Bridge structures with GFRP composite deck. Open J. Civ. Eng. 2015, 5, 53–62. [Google Scholar] [CrossRef] [Green Version]
- Burgoyne, C.J.; Head, P.R. Aberfeldy Bridge—An advanced textile reinforced footbridge. In Proceedings of the Techtextil Symposium, Frankfurt, Germany, 4 February 1993; pp. 1–9. [Google Scholar]
- Sobrino, J.A.; Pulido, M.D.G. Towards Advanced Composite Material Footbridges. Struct. Eng. Int. 2002, 12, 84–86. [Google Scholar] [CrossRef]
- Keller, T.; Bai, Y.; Vallée, T. Long-Term Performance of a Glass Fiber-Reinforced Polymer Truss Bridge. J. Compos. Constr. 2007, 11, 99–108. [Google Scholar] [CrossRef]
- Adilardi, A.; Frasconi, L. Design of a pedestrian bridge made with pultruded profiles of fibreglass-reinforced plastics in Prato. In Proceedings of the 3rd International Conference on Footbridges, Porto, Portugal, 2–4 July 2008; pp. 2–4. [Google Scholar]
- Votsis, R.A.; Stratford, T.J.; Chryssanthopoulos, M.K.; Tantele, E.A. Dynamic assessment of a FRP suspension footbridge through field testing and finite element modelling. Steel Compos. Struct. 2017, 23, 205–215. [Google Scholar] [CrossRef] [Green Version]
- Górski, P.; Stankiewicz, B.; Tatara, M. Modal parameter identification of all-GFRP composite cable-stayed footbridge in Denmark Case. In Proceedings of the Dynamics of Civil Engineering and Transport Structures and Wind Engineering—DYN-WIND’2017, MATEC Web of Conferences, Trstená, Slovakia, 21–25 May 2017; EDP Sciences: Les Ulis, France, 2017; Volume 107, p. 00005. [Google Scholar]
- Wei, X.; Boscato, G.; Russell, J.; Adilardi, A.; Russo, S.; Živanović, S. Experimental Characterisation of Dynamic Properties of an All-FRP Truss Bridge. In Dynamics of Civil Structures, Volume 2: Proceedings of the 36th IMAC, A Conference and Exposition on Structural Dynamics 2018; Springer: Cham, Germany, 2019; Volume 2, pp. 35–37. ISBN 978-3-319-74420-9. [Google Scholar]
- Drygala, I.J.; Polak, M.A.; Dulinska, J.M. Vibration serviceability assessment of GFRP pedestrian bridges. Eng. Struct. 2019, 184, 176–185. [Google Scholar] [CrossRef]
- Drygala, I.J.; Dulinska, J.M.; Ciura, R.; Lachawiec, K. Vibration Serviceability of Footbridges: Classical vs. Innovative Material Solutions for Deck Slabs. Materials 2020, 13, 3009. [Google Scholar] [CrossRef]
- Wei, X.; Russell, J.; Živanović, S.; Mottram, J.T. Measured dynamic properties for FRP footbridges and their critical comparison against structures made of conventional construction materials. Compos. Struct. 2019, 223, 110956. [Google Scholar] [CrossRef]
- Russell, J.M.; Wei, X.; Živanović, S.; Kruger, C. Vibration serviceability of a GFRP railway crossing due to pedestrians and train excitation. Eng. Struct. 2020, 219, 110756. [Google Scholar] [CrossRef]
- Gallegos-Calderón, C.; Renedo, C.M.; Pulido, M.D.G.; Díaz, I.M. A frequency-domain procedure to design TMDs for lively pedestrian structures considering Human–Structure Interaction. Structure 2022, 43, 1187–1199. [Google Scholar] [CrossRef]
- Pimentel, R.L.; Waldron, P.; Harvey, W.J. Assessment of the dynamic behaviour of Aberfeldy GRP plastic cable-stayed footbridge. In Proceedings of the Analysis & Testing of Bridges: Papers Presented at A One Day Seminar, London, UK; 1995; pp. 38–40. [Google Scholar]
- Pavic, A.; Reynolds, P.; Cooper, P.; Harvey, W.J. Dynamic Testing and Analysis of Aberfeldy Footbridge; Report by Department of Civil & Structural Engineering, Vibration Engineering Research Section, Final Report. Ref, CCC/00/79A; The University of Sheffield: Sheffield, UK, 2000. [Google Scholar]
- Cadei, J.; Stratford, T. The design, construction and in-service performance of the all-composite Aberfeldy footbridge. In Advanced Polymer Composites for Structural Applications in Construction: Proceedings of the First International Conference, Held at Southampton University, Southampton, UK, 15–17 April 2002; Thomas Telford Publishing: London, UK, 2002; pp. 445–455. [Google Scholar]
- Stratford, T. The condition of the Aberfeldy Footbridge after 20 years of service. In Proceedings of the Structural Faults and Repair 2012, Edinburgh, Scotland, 3–5 July 2012. [Google Scholar]
- Skinner, J.M. A Critical Analysis of the Aberfeldy Footbridge, Scotland. In Proceedings of the Bridge Engineering 2 Conference, Bath, UK, 16–23 April 2009. [Google Scholar]
- Wynne, Z.; Stratford, T.; Reynolds, T.P.S. Operational Modal Analysis of a Historic GRP Structure. In Lecture Notes in Civil Engineering, Civil Structural Health Monitoring, Proceedings of CSHM-8 Workshop, Naples, Italy, 31 March–2 April 2021; Springer: Cham, UK, 2021; pp. 57–68. [Google Scholar] [CrossRef]
- Burgoyne, C.J. Structural use of Parafil ropes. Constr. Build. Mater. 1987, 1, 3–13. [Google Scholar] [CrossRef]
- Burgoyne, C.J. Parafil ropes for prestressing applications. In Fiber-Reinforced-Plastic (FRP) Reinforcement for Concrete Structures: Properties and Applications; Elsevier: Amsterdam, The Netherlands, 1993; Volume 1, pp. 333–351. [Google Scholar]
- Damiani, M.; Quadrino, A.; Nisticò, N. FRP Cables to Prestress RC Beams: State of the Art vs. a Split Wedge Anchorage System. Buildings 2021, 11, 1–29. [Google Scholar] [CrossRef]
- Wheeler, J.E. Prediction and control of pedestrian induced vibration in footbridges. J. Struct. Div-ASCE. 1982, 108, 2045–2065. [Google Scholar] [CrossRef]
- Zivanovic, S.; Pavic, A.; Reynolds, P. Vibration serviceability of footbridges under human-induced excitation: A literature review. J. Sound Vib. 2005, 279, 1–74. [Google Scholar] [CrossRef] [Green Version]
- 1990:2002/Al (2005); Eurocode—Basis of Structural Design. CEN: Brussels, Belgium, 2005.
- Sétra, F. Assessment of Vibrational Behaviour of Footbridges under Pedestrian Loading, Technical Guide; Technical Department for Transport, Roads and Bridges Engineering and Road Safety: Paris, France, 2006. [Google Scholar]
- Tongen, A.; Wunderlich, R.E. Biomechanics of running and walking. Clin. Sport. Med. 1994, 13, 843–863. [Google Scholar]
- Bachmann, H.; Ammann, W.; Deischl, F.; Eisenmann, J.; Floegl, I.; Hirsch, G.H.; Klein, G.K.; Lande, G.J.; Mahrenholtz, O.; Natke, H.G.; et al. Vibration Problems in Structures: Practical Guideline; Birkhäuser Verlag: Basel, Switzerland, 1995. [Google Scholar]
- Bachmann, H.; Pretlove, A.J.; Rainer, H. Dynamic forces from rhythmical human body motions. In Vibration Problems in Structures: Practical Guidelines, Appendix G.; Birkhäuser: Basel, Switzerland, 1995. [Google Scholar]
- ISO 10137:2007(E); Bases for design of structures—Serviceability of buildings and walkways against vibrations. International Organization for Standardization: Geneva, Switzerland, 2007.
- BS NA EN 1991-2; UK National Annex to Eurocode 1, Actions on structures, Traffic loads on bridges. British Standards Institution: London, UK, 2003.
- Occhiuzzi, A.; Spizzuoco, M.; Ricciardelli, F. Loading models and response control of footbridges excited by running pedestrians. Struct. Control Health Monit. 2008, 15, 349–368. [Google Scholar] [CrossRef]
- Marecik, K.; Pańtak, M. A comparative analysis of selected models of pedestrian-generated dynamic loads on footbridges-vertical loads. In Proceedings of the 3rd International Workshop on Flexibility in Sustainable Construction (ORSDCE 2018), MATEC Web of Conferences, Poznan, Poland, 20 April 2018; EDP Sciences: Les Ulis, France, 2018; Volume 222, p. 01009. [Google Scholar]
- Pańtak, M. Ground Reaction Forces Generated by Runners—Harmonic Analyses and Modelling. Appl. Sci. 2020, 10, 1575. [Google Scholar] [CrossRef] [Green Version]
- Abaqus, S. Users’ Manual Version 6.13 Documentation, c2013–2015; Dassault Systemes: Velizy-Villacoublay, France, 2015. [Google Scholar]
- Jones, R.B. Mechanics of Composite Materials; Taylor & Francis: Milton Part, UK, 2018. [Google Scholar]


| Mode * | Frequency [Hz] | Damping Ratio [%] | ||||
|---|---|---|---|---|---|---|
| 1995 [26] | 2000 [27] | 2019 [31] | 1995 [26] | 2000 [27] | 2019 [31] | |
| H1 | 1.00 | 0.98 | 0.95 | - | 1.0 | 1.56 |
| V1 | 1.59 | 1.52 | 1.53 | 0.84 | 0.4 | 1.83 |
| V2 | 1.92 | 1.86 | 1.84 | 0.94 | 0.7 | 2.33 |
| V3 | 2.59 | 2.49 | 2.48 | 1.20 | 0.7 | 1.50 |
| H2 | 2.81 | 2.73 | 2.63 | - | 1.2 | 2.14 |
| V4 | 3.14 | 3.01 | - | - | 0.8 | - |
| T1 | 3.44 | 3.48 | - | - | 5.5 | - |
| V5 | 3.63 | 3.50 | 3.46 | - | 0.6 | 2.37 |
| V6 | 4.00 | 3.91 | 3.84 | - | 0.9 | 4.63 |
| T2 | 4.31 | 4.29 | - | - | 3.2 | - |
| V7 | 4.60 | 4.40 | - | - | 0.8 | - |
| V8 | 5.10 | 4.93 | 4.91 | - | 1.8 | 2.40 |
| Type of Motion | Frequency Ranges [Hz] | Velocity [m/s] | Stride Length [m] |
|---|---|---|---|
| Slow walking | ~1.7 | 1.1 | 0.60 |
| Normal walking | ~2.0 | 1.5 | 0.75 |
| Fast walking | ~2.3 | 2.2 | 1.00 |
| Slow running | ~2.5 | 3.3 | 1.30 |
| Fast running | >2.3 | 5.5 | 1.75 |
| Risk of Resonance | Frequency Ranges Hz | |
|---|---|---|
| Vertical | Horizontal | |
| Maximum | 1.7–2.1 | 0.5–1.1 |
| Medium | 1.0–1.7; 2.1–2.6 | 0.3–0.5; 1.1–1.3 |
| Low | 2.6–5.0 | 1.3–2.5 |
| Negligible | 0–1.0; >5.0 | 0–0.3; >2.5 |
| Paths | No. of Pedestrians |
|---|---|
| I—Route no. 1 | 1 |
| II—Route no. 2 | 1 |
| III—Route no. 3 | 1 |
| IV—Route no. 4 | 1 |
| V—Routes no. 2 and 5 | 1 + 1 |
| VI—Routes no. 2, 4, and 5, in phase | 1 + 1 + 1 |
| VII—Routes no. 2, 4, and 5, counterphase | 1 + 1 + 1 |
| Comfort Level | Ranges of Comfort [] | |
|---|---|---|
| Vertical | Horizontal | |
| Maximum | 0.0–0.5 | 0.00–0.15 |
| Mean | 0.5–1.0 | 0.15–0.30 |
| Minimum | 1.0–2.5 | 0.30–0.80 |
| Uncomfortable | >2.5 | >0.8 |
| Parameters | Assumable Values | Recommended Serviceability Limits for Acceleration (Equation (10)) |
|---|---|---|
| Bridge function | —for rural environments | |
| Route redundancy | —for alternative routes readily available | |
| Bridge height | —for structural heights > 8 m | |
| Exposure | —for normal exposure |
| Direction of Vibration | Pedestrian Scenario | Multiplying Factor |
|---|---|---|
| Vertical | Standing | 30 |
| Vertical | Walking | 60 |
| Horizontal | Standing or walking | 60 |
| 22.00 | 6.77 | 2.72 | 1.67 | 0.19 | 0.058 |
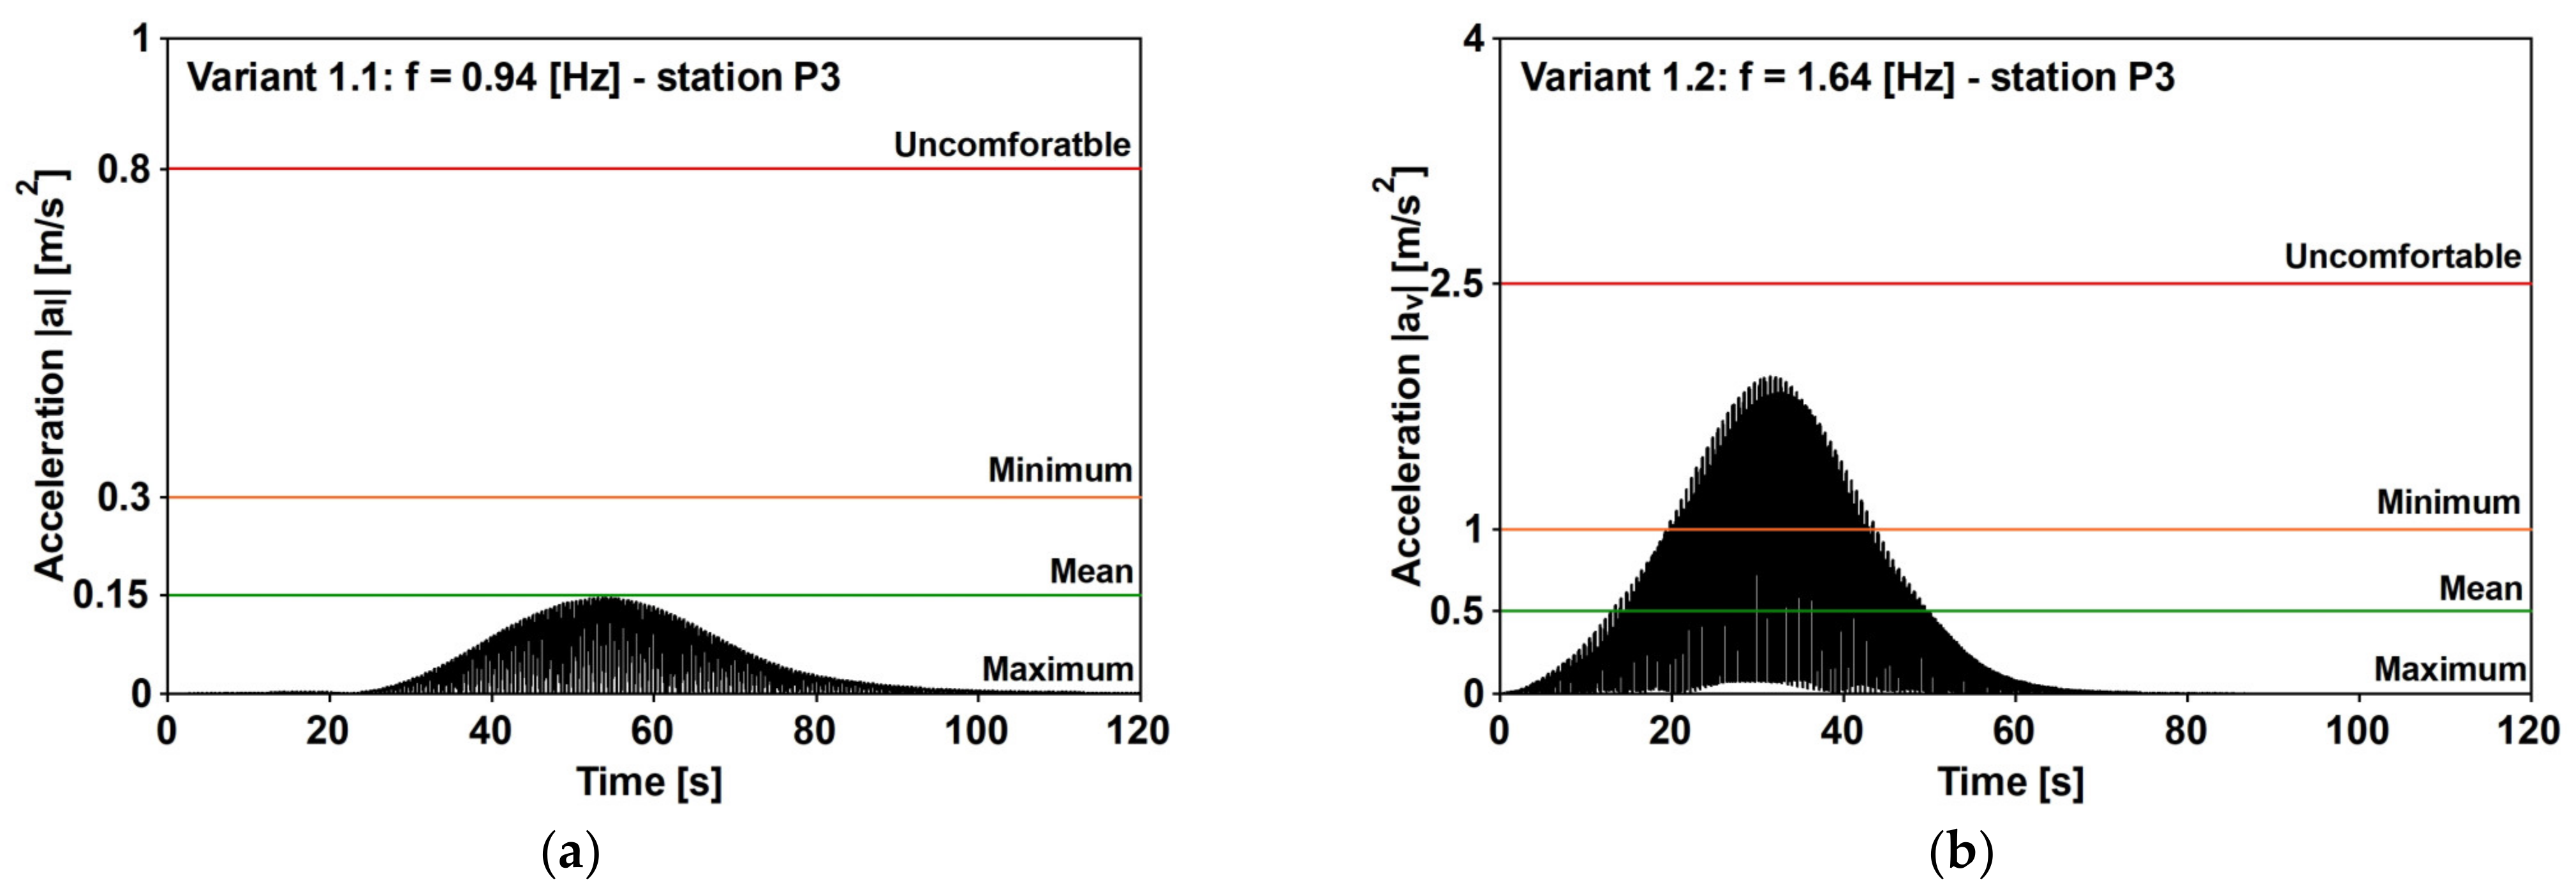
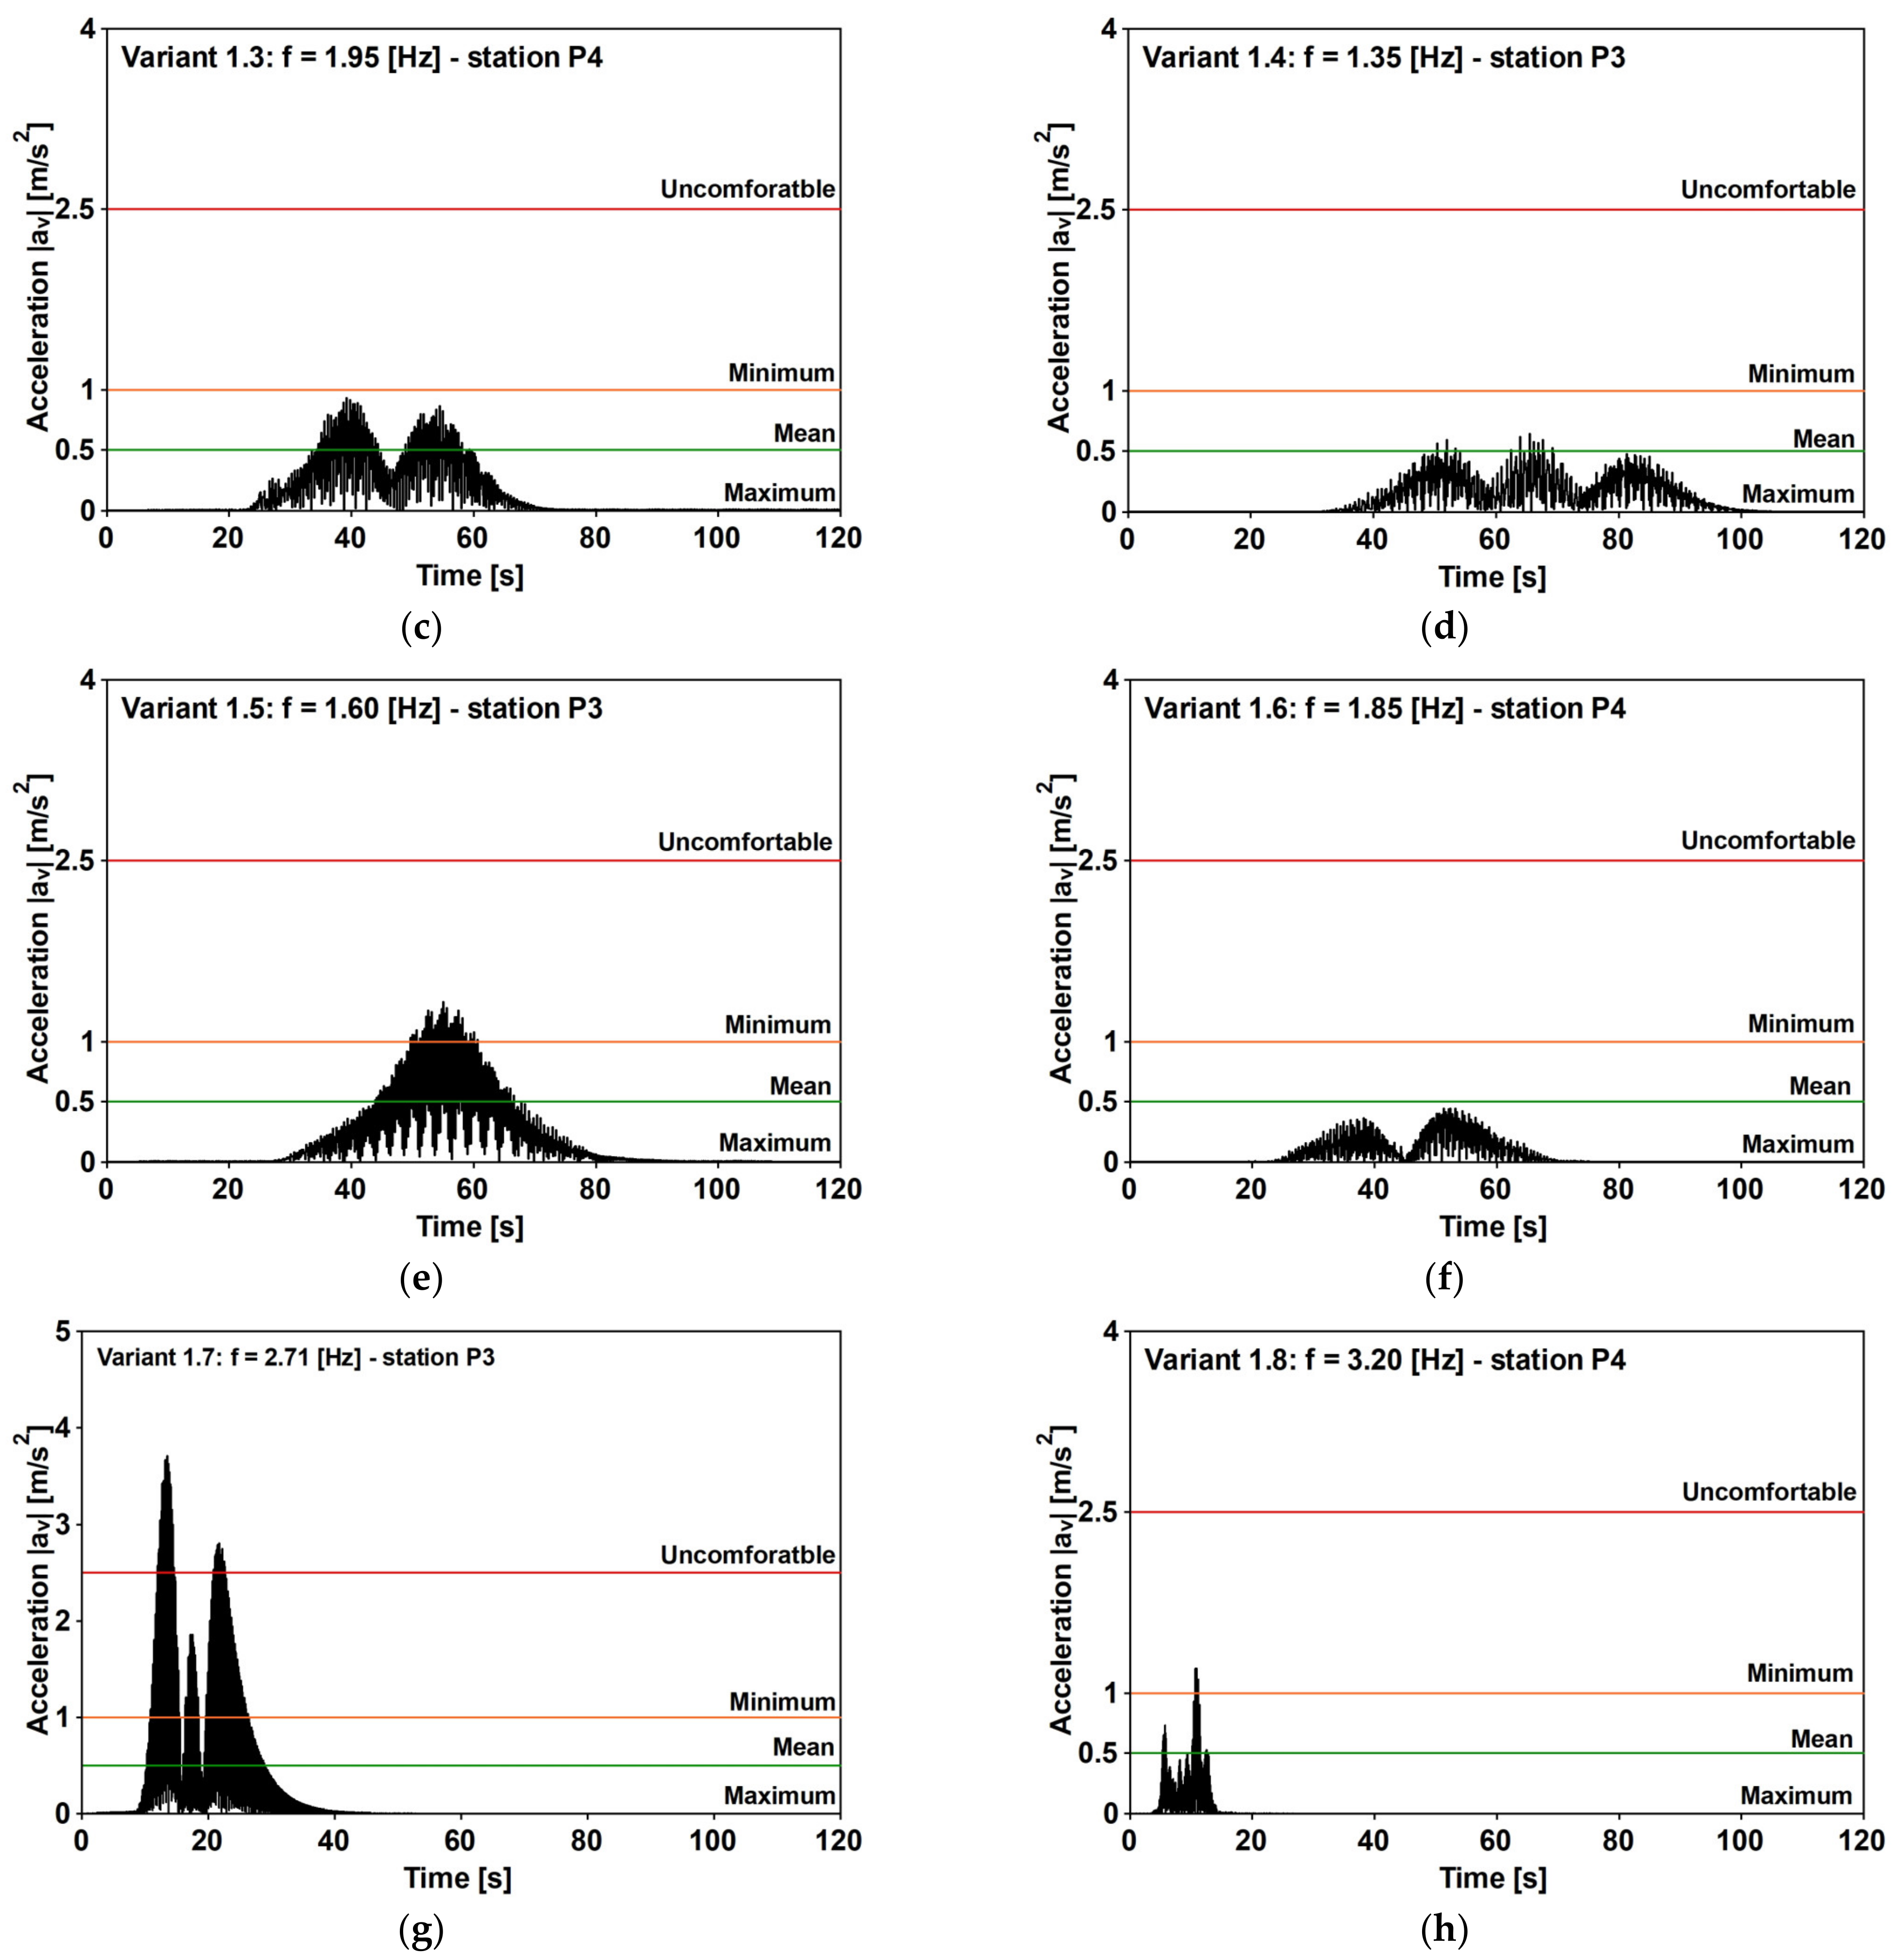
| No. of Load Variant | FE Natural Frequency of Footbridge [Hz] | Mode | Damping [%] | Frequency of Loading [Hz] | Step Length | Type of Motion |
|---|---|---|---|---|---|---|
| 1.1 | 0.94 | H1 | 1.56 | 0.94 | 0.70 | Walking |
| 1.2 | 1.64 | V1 | 1.83 | 1.64 | 0.60 | |
| 1.3 | 1.95 | V2 | 2.33 | 1.95 | 0.70 | |
| 1.4 | 2.71 | V3 | 1.50 | 1.35 | 0.60 | |
| 1.5 | 3.20 | V4 | - | 1.60 | 0.60 | |
| 1.6 | 3.71 | V5 | 2.37 | 1.85 | 0.70 | |
| 1.7 | 2.71 | V3 | 1.50 | 2.71 | 1.20 | Running |
| 1.8 | 3.20 | V4 | - | 3.20 | 1.40 |
| Type of Motion | Direction | Parameter (Equations (2) and (3)) | ||||||
|---|---|---|---|---|---|---|---|---|
| Walking | Vertical | 0.70 | 0.10 | 0 | ||||
| Lateral | 0.70 | 0.0 | 0 | |||||
| Running* | Vertical | 700 | 0.15 | 0 | 0 | 0 | ||
| Direction | Parameter (Equation (2)) | Parameter (Equation (3)) | ||||
|---|---|---|---|---|---|---|
| Vertical | 0.28 | 1 | 0.225 | 0.70 | 0.23 | 0.21 |
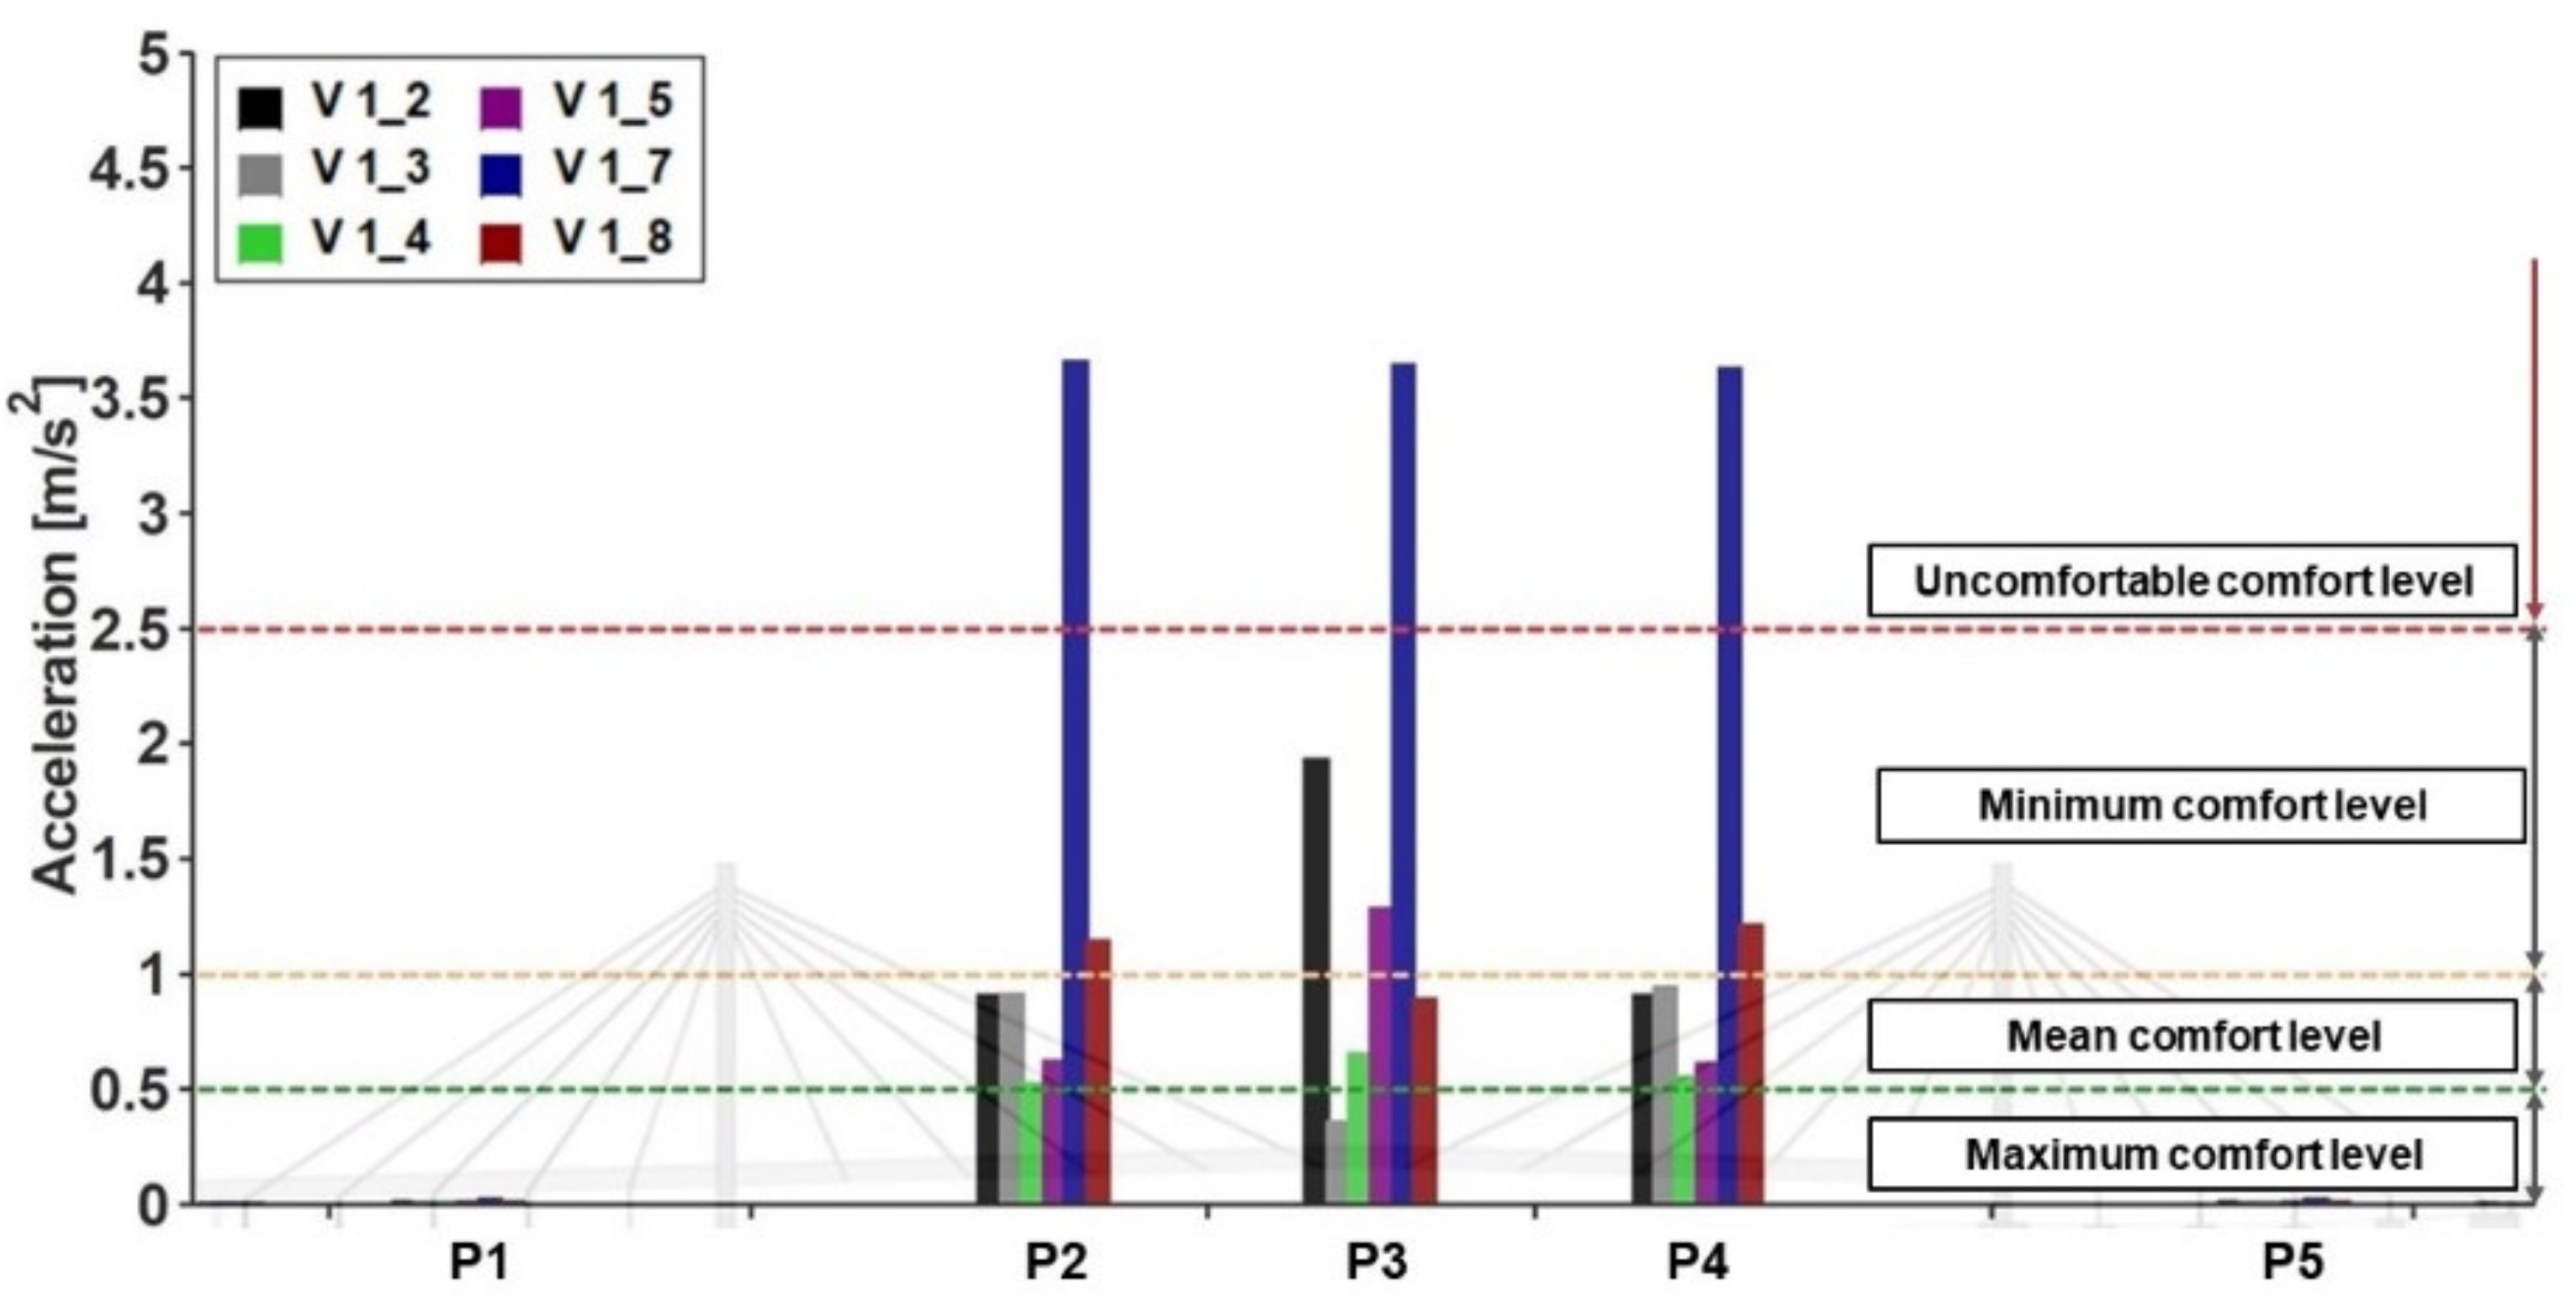
| Load Variant | Scenario | |||||
|---|---|---|---|---|---|---|
| P1 | P2 | P3 | P4 | P5 | ||
| 1.1 (lateral) | Walking () | 0.00 | 0.08 | 0.14 | 0.08 | 0.00 |
| 1.2 (vertical) | Walking () | 0.01 | 0.90 | 1.93 | 0.90 | 0.01 |
| 1.3 (vertical) | Walking () | 0.01 | 0.91 | 0.36 | 0.94 | 0.01 |
| 1.4 (vertical) | Walking () | 0.01 | 0.52 | 0.65 | 0.55 | 0.01 |
| 1.5 (vertical) | Walking () | 0.01 | 0.62 | 1.28 | 0.61 | 0.01 |
| 1.6 (vertical) | Walking () | 0.01 | 0.45 | 0.39 | 0.46 | 0.01 |
| 1.7 (vertical) | Running () | 0.02 | 3.66 | 3.64 | 3.63 | 0.02 |
| 1.8 (vertical) | Running () | 0.01 | 1.14 | 0.89 | 1.21 | 0.01 |
| Scenario | |||||
|---|---|---|---|---|---|
| P1 | P2 | P3 | P4 | P5 | |
| No. of pedestrians: 1; Route no. 1 | 0.01 | 0.90 | 1.93 | 0.90 | 0.01 |
| No. of pedestrians: 1; Route no. 2 | 0.00 | 0.01 | 0.02 | 0.01 | 0.00 |
| No. of pedestrians: 1; Route no. 3 | 0.01 | 0.90 | 1.93 | 0.90 | 0.01 |
| No. of pedestrians: 1; Route no. 4 | 0.01 | 0.89 | 1.92 | 0.88 | 0.01 |
| No. of pedestrians: 2; Routes 2 and 5 | 0.00 | 0.02 | 0.03 | 0.02 | 0.00 |
| No. of pedestrians: 3; Routes 2, 4, and 5; in phase | 0.01 | 0.88 | 1.91 | 0.89 | 0.01 |
| No. of pedestrians: 3; Routes 2 and 5, as well as 4 in counterphase | 0.02 | 0.90 | 1.94 | 0.91 | 0.02 |
| Variant 1.1 | Variant 1.2 | Variant 1.7 | |||||||
|---|---|---|---|---|---|---|---|---|---|
| 2019 [31] | 0.94 | 1.56 | 0.14 | 1.64 | 1.83 | 1.93 | 2.7 | 1.50% | 3.64 |
| 2000 [27] | 1.00 | 0.16 | 0.40 | 5.01 | 0.70 | 3.95 | |||
| 1.56 | 4.57 | 2.14 | |||||||
| 1.14 | 2.64 | 1.08 | |||||||
| 1.37 | 1.73 | 1.98 | |||||||
| Damping | at Point P3 vs. Damping [%] | |||||
|---|---|---|---|---|---|---|
| 0.5 | 1.0 | 1.5 | 2.0 | 2.5 | 3.0 | |
| PAV: Variant 1.1 | 0.18 | 0.16 | 0.14 | 0.12 | 0.11 | 0.10 |
| PAV: Variant 1.2 | 4.52 | 3.05 | 2.25 | 1.79 | 1.49 | 1.25 |
| PAV: Variant 1.7 | 4.88 | 4.21 | 3.71 | 3.32 | 2.95 | 2.59 |
Disclaimer/Publisher’s Note: The statements, opinions and data contained in all publications are solely those of the individual author(s) and contributor(s) and not of MDPI and/or the editor(s). MDPI and/or the editor(s) disclaim responsibility for any injury to people or property resulting from any ideas, methods, instructions or products referred to in the content. |
© 2023 by the authors. Licensee MDPI, Basel, Switzerland. This article is an open access article distributed under the terms and conditions of the Creative Commons Attribution (CC BY) license (https://creativecommons.org/licenses/by/4.0/).
Share and Cite
Drygala, I.J.; Dulińska, J.M.; Nisticò, N. Vibration Serviceability of the Aberfeldy Footbridge under Various Human-Induced Loadings. Materials 2023, 16, 2890. https://doi.org/10.3390/ma16072890
Drygala IJ, Dulińska JM, Nisticò N. Vibration Serviceability of the Aberfeldy Footbridge under Various Human-Induced Loadings. Materials. 2023; 16(7):2890. https://doi.org/10.3390/ma16072890
Chicago/Turabian StyleDrygala, Izabela Joanna, Joanna Maria Dulińska, and Nicola Nisticò. 2023. "Vibration Serviceability of the Aberfeldy Footbridge under Various Human-Induced Loadings" Materials 16, no. 7: 2890. https://doi.org/10.3390/ma16072890