
Investigation into the Effect of Interlock Volume on SPR Strength


Abstract
:1. Introduction
Current Research
2. Materials and Methods
2.1. Materials
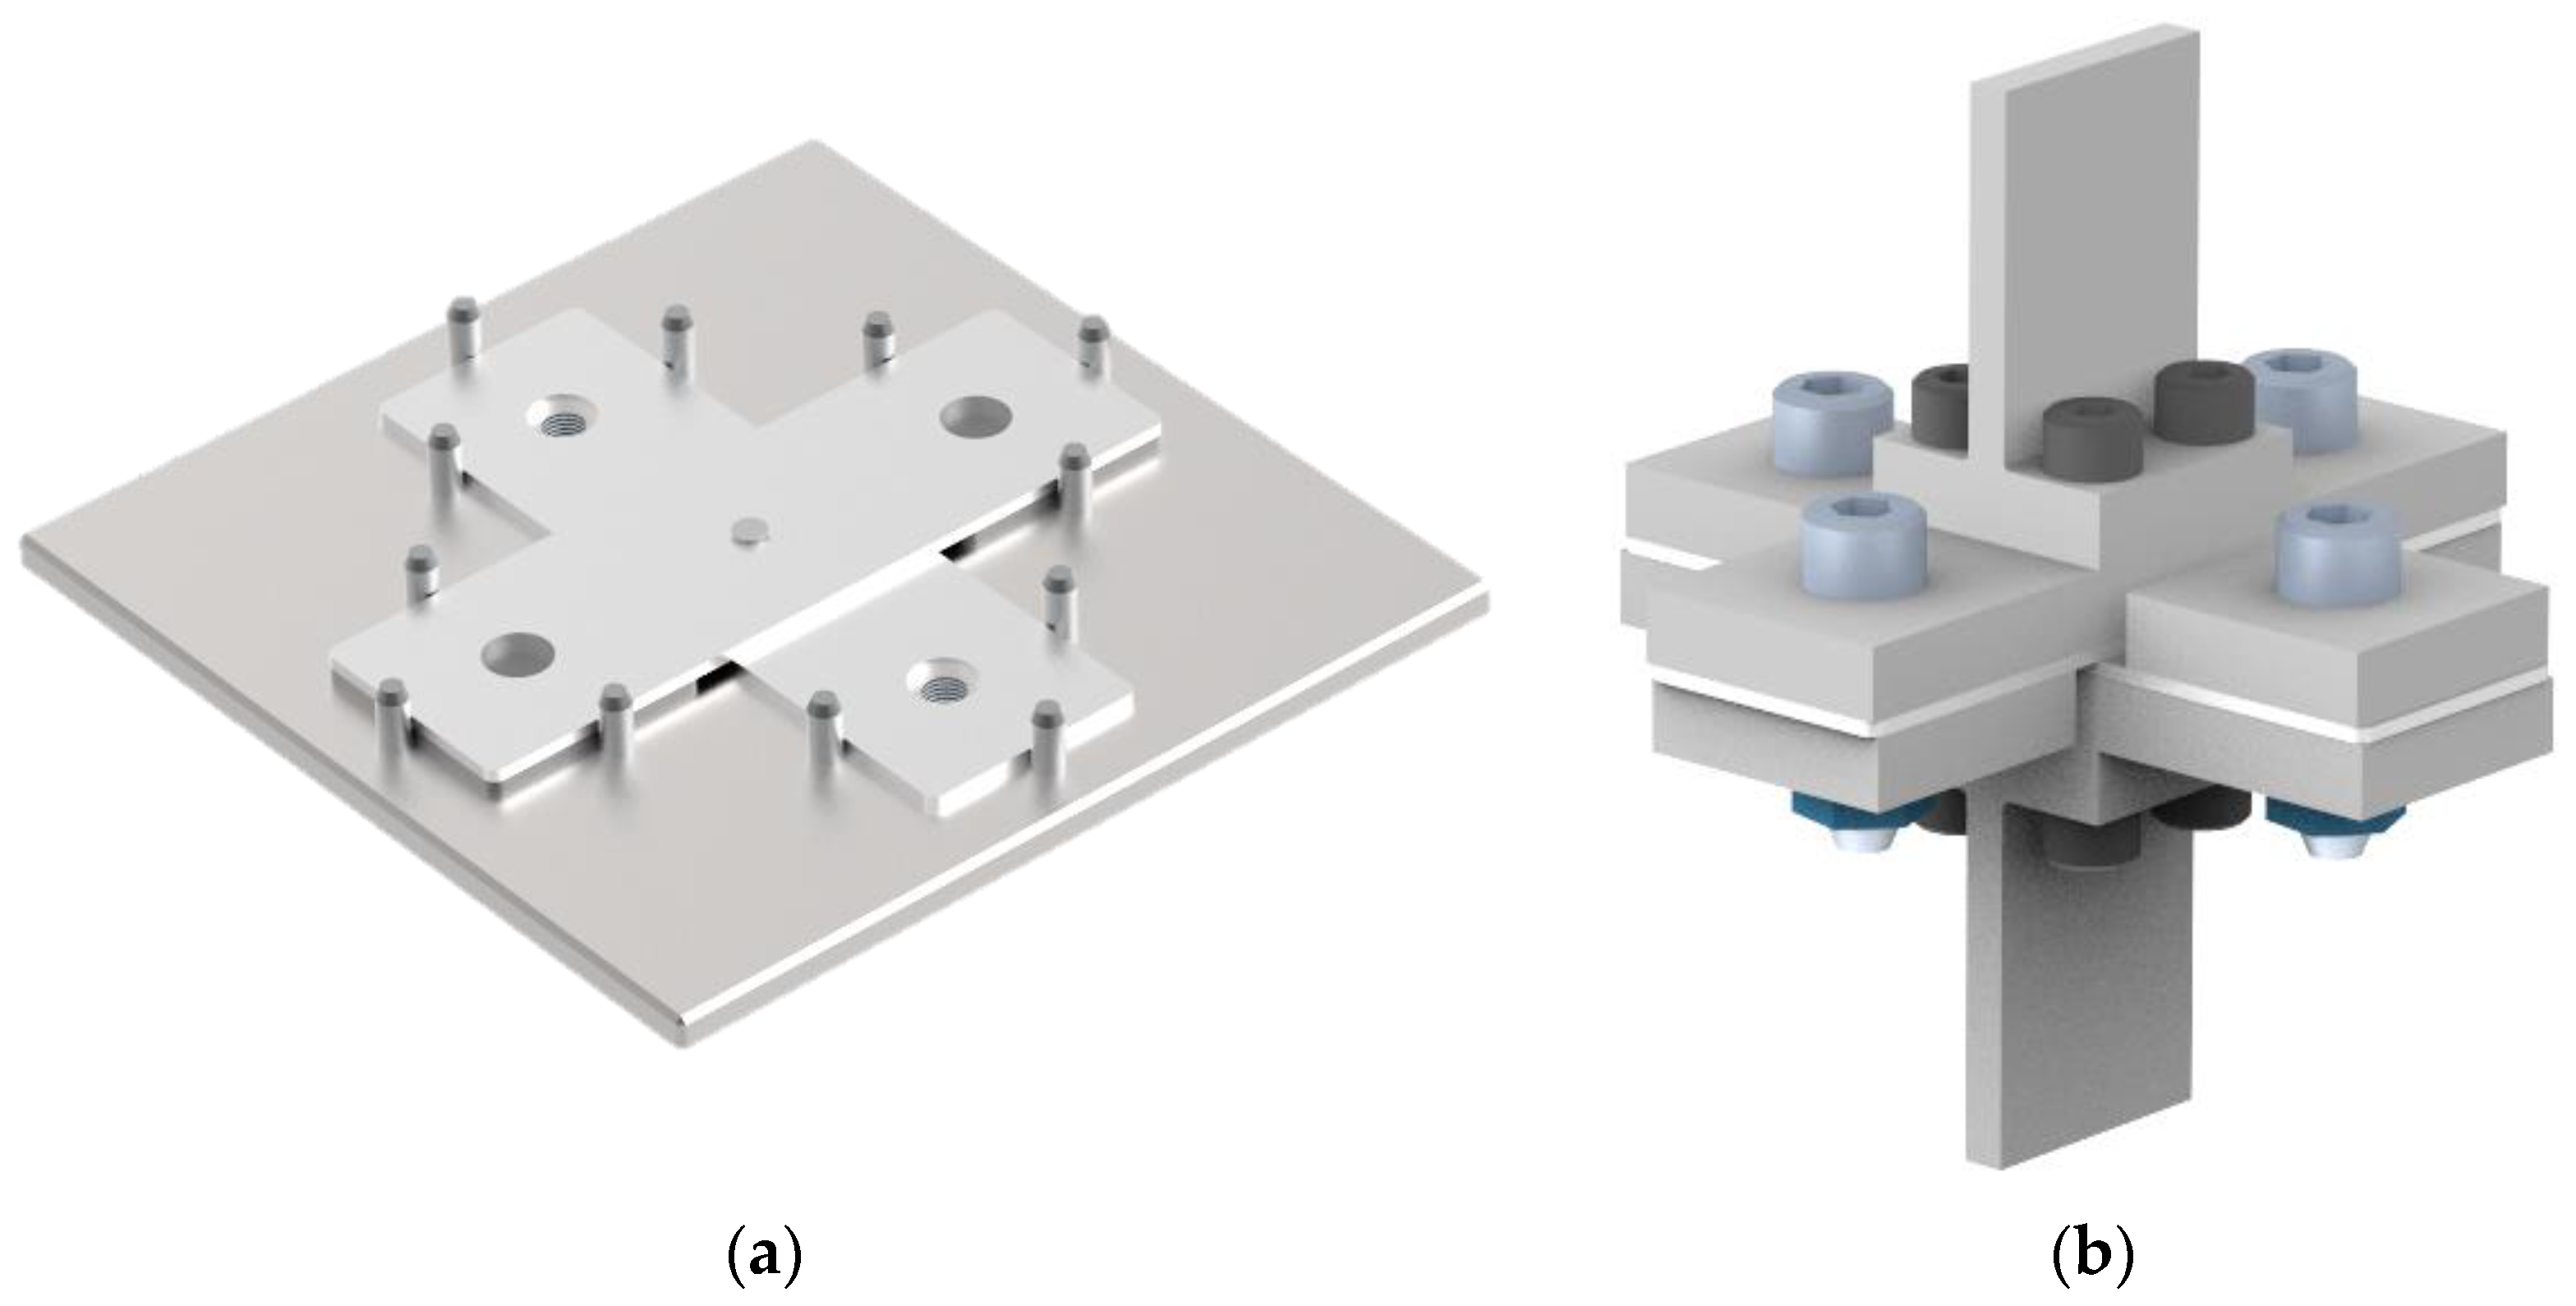
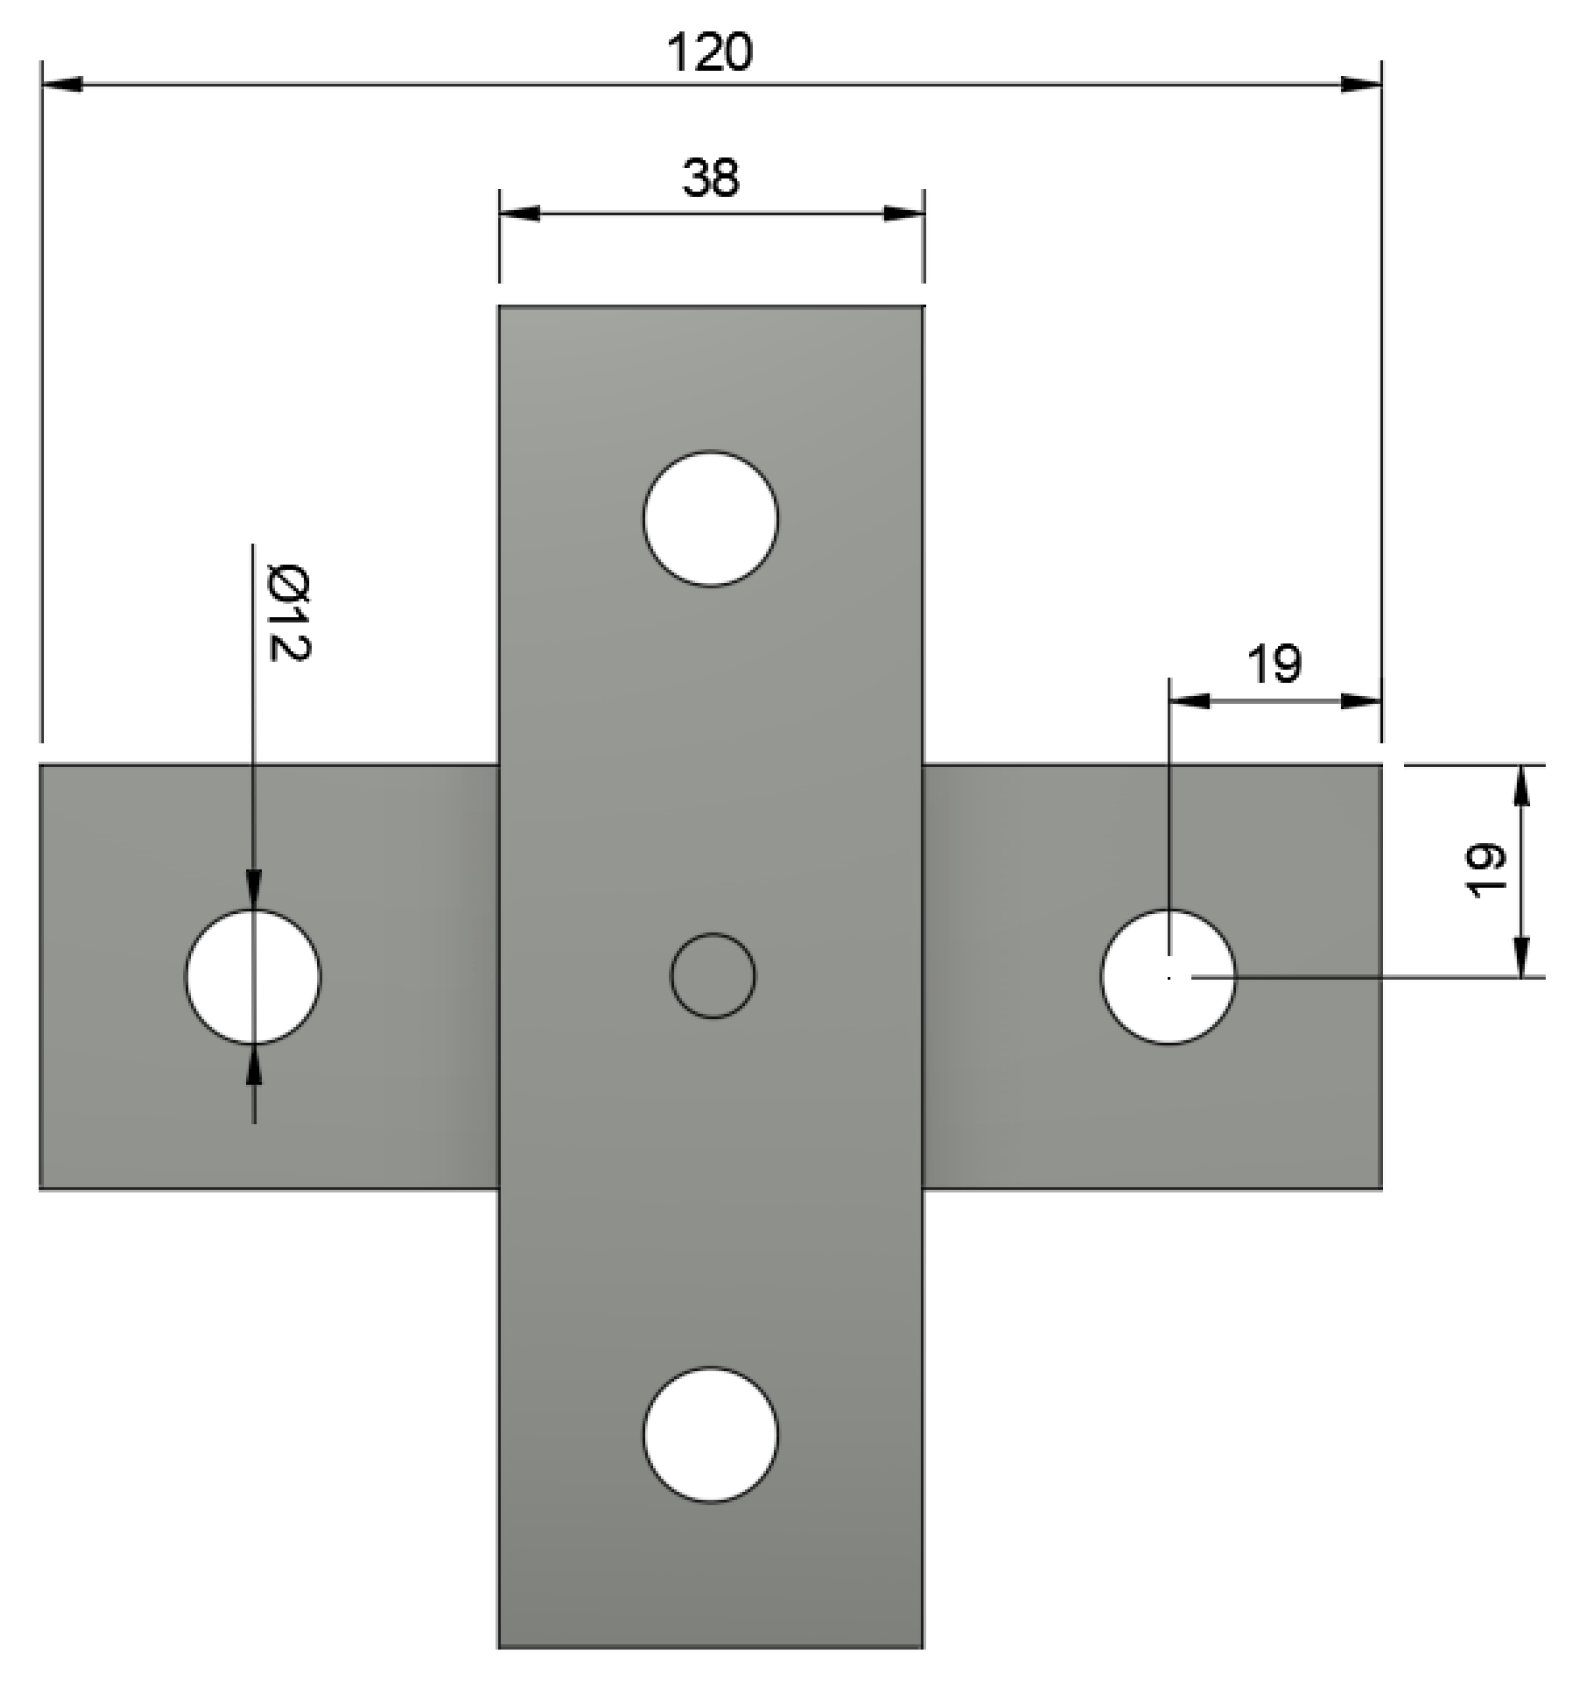
2.2. Methods
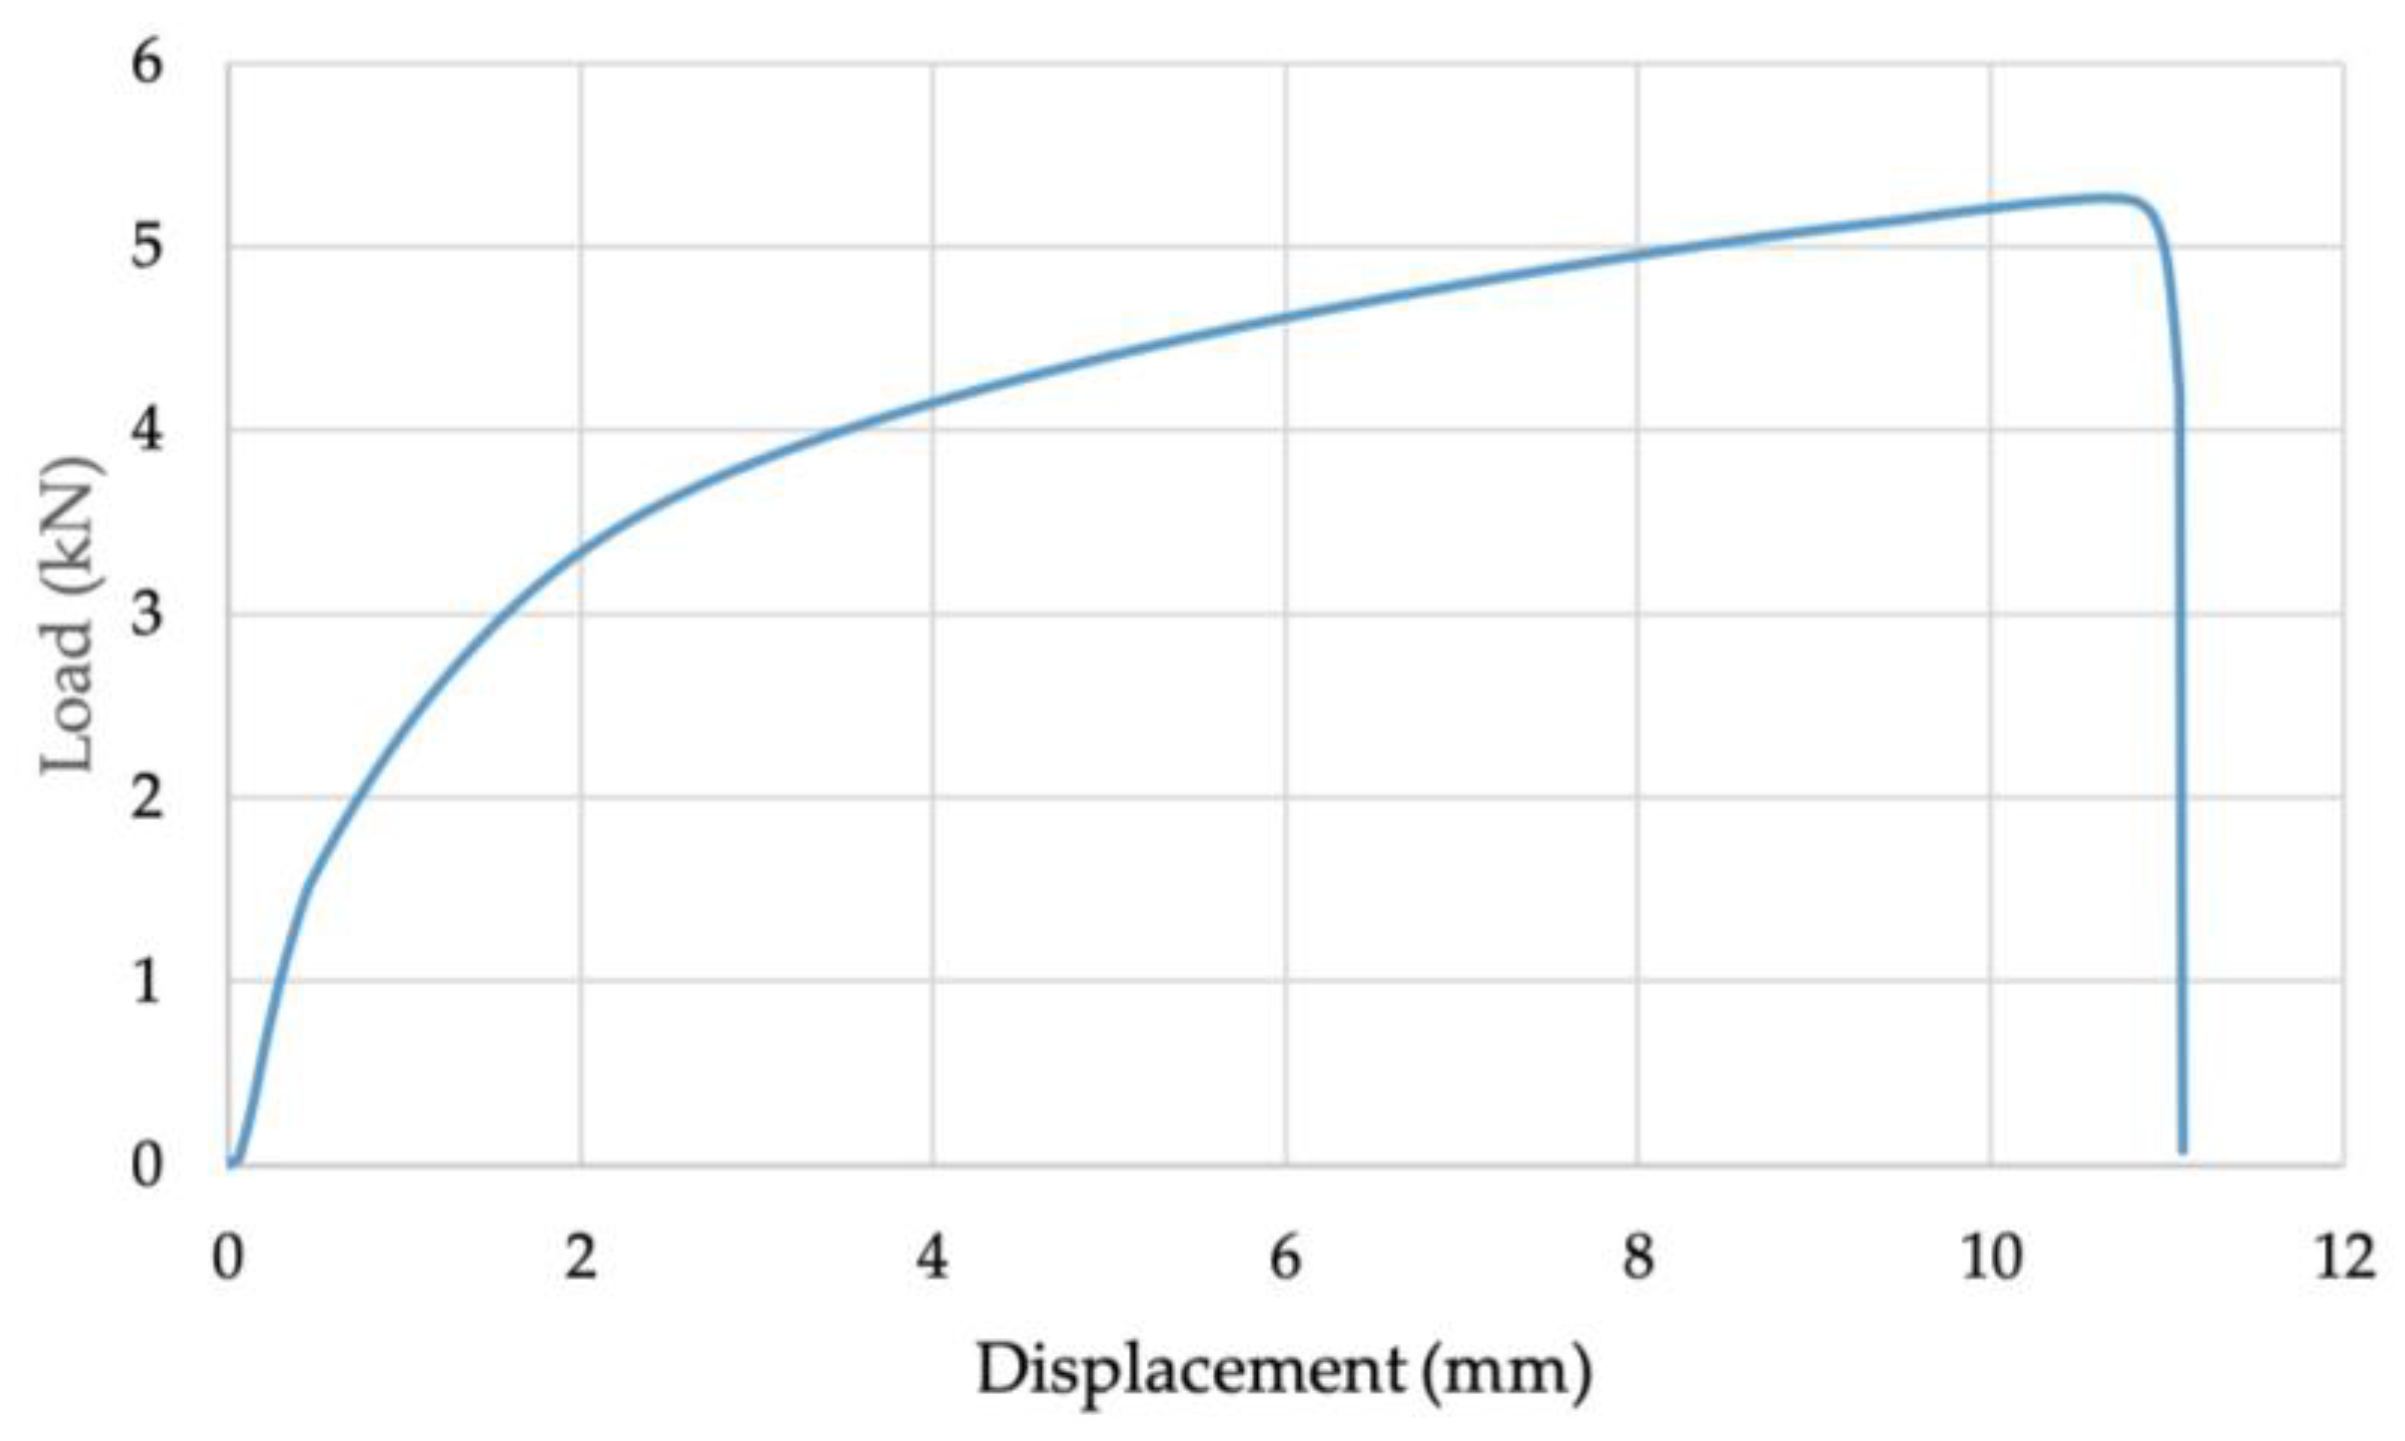
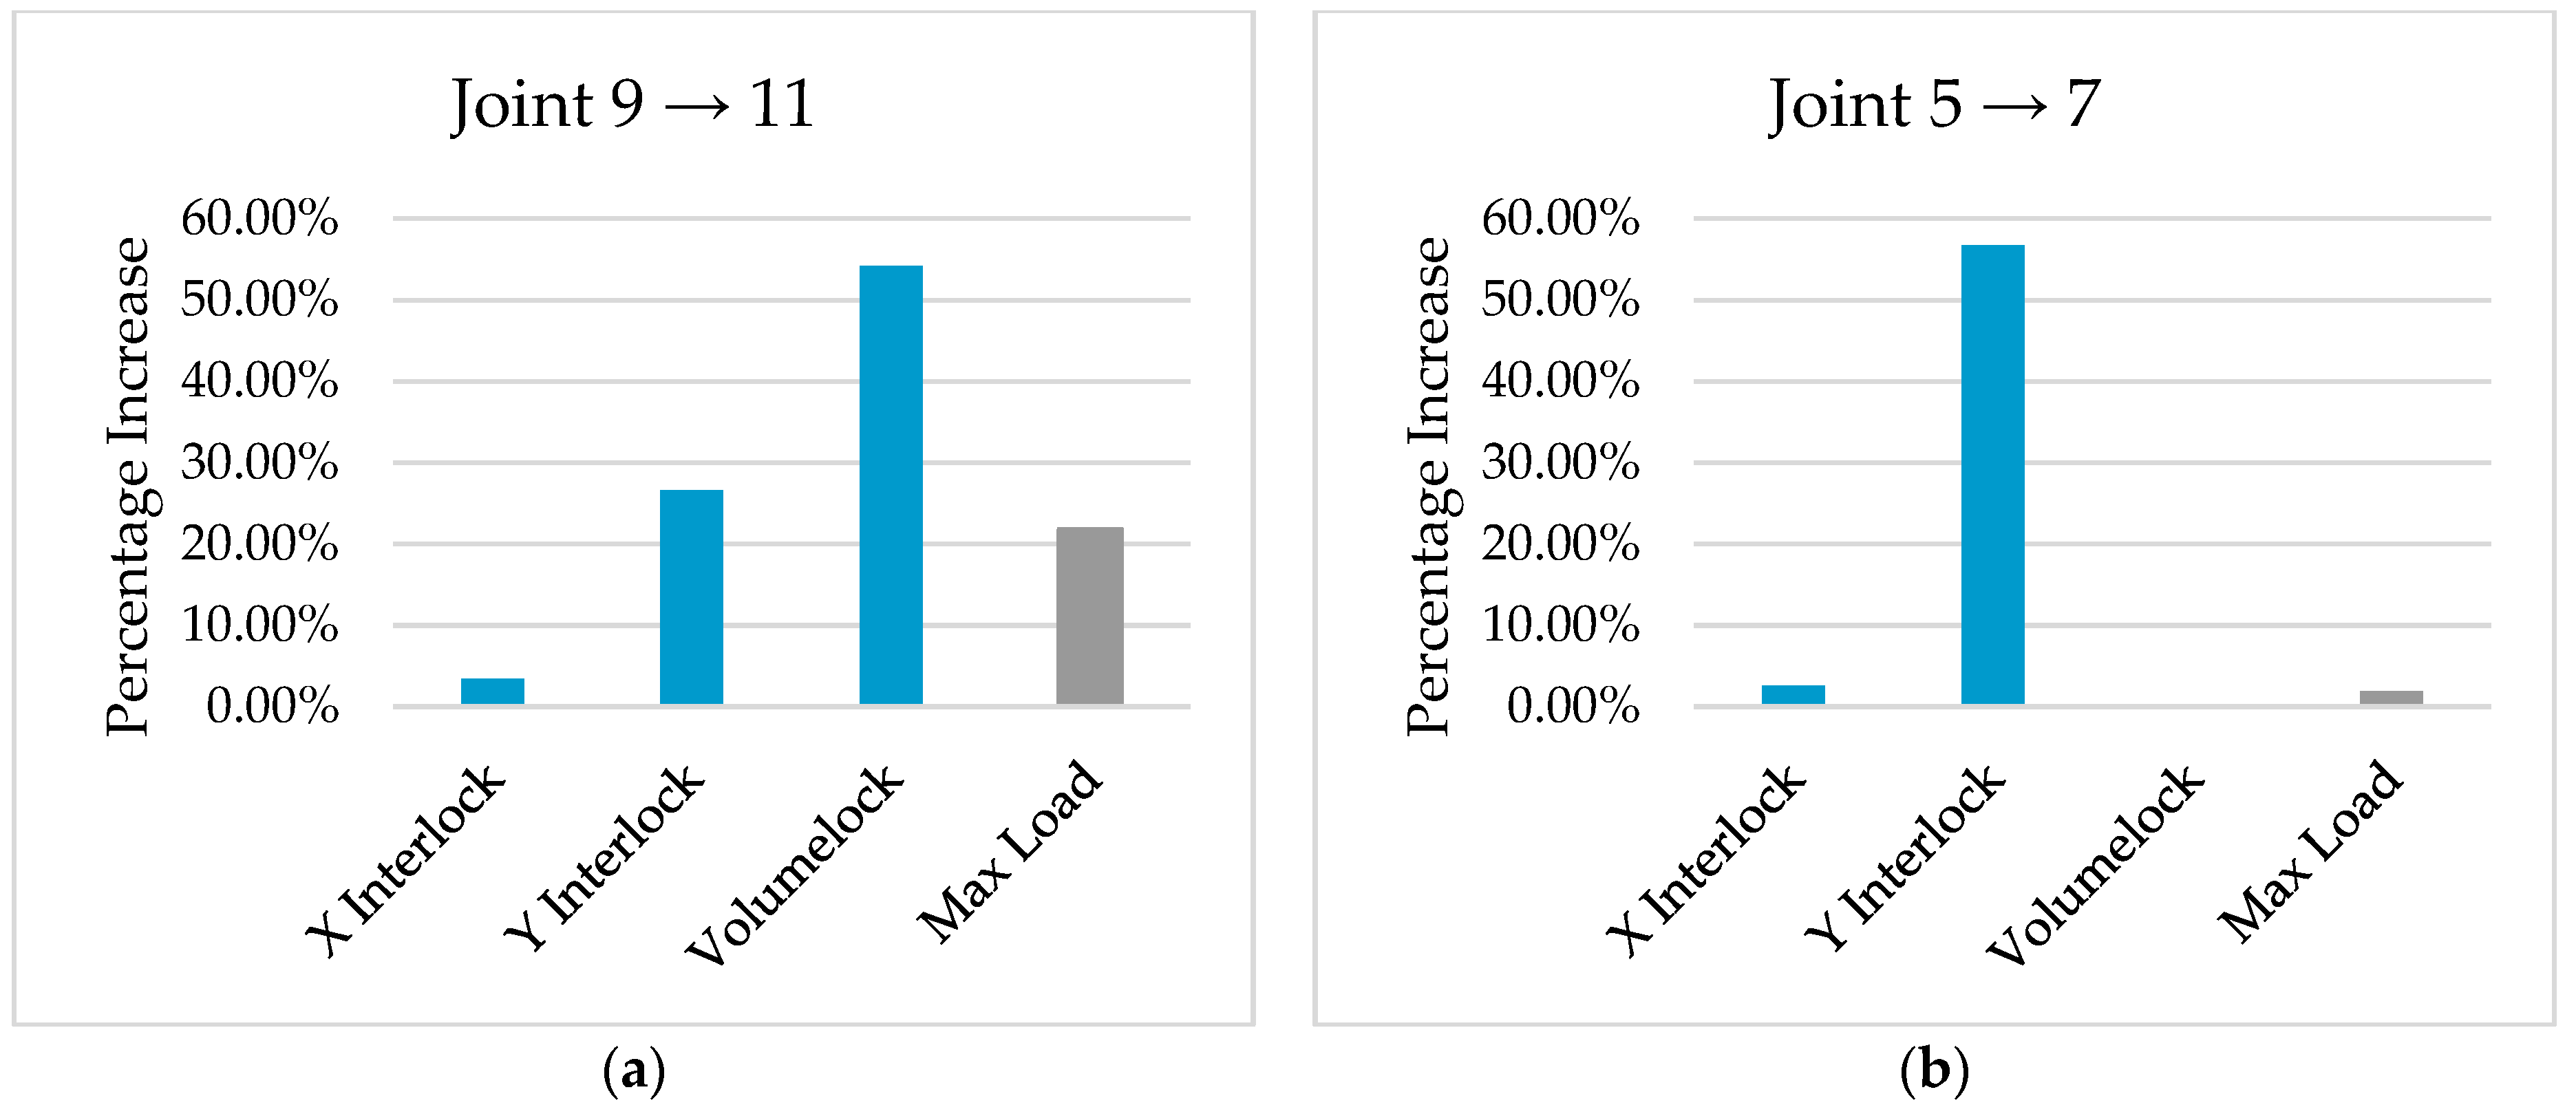
3. Results and Discussion
4. Conclusions
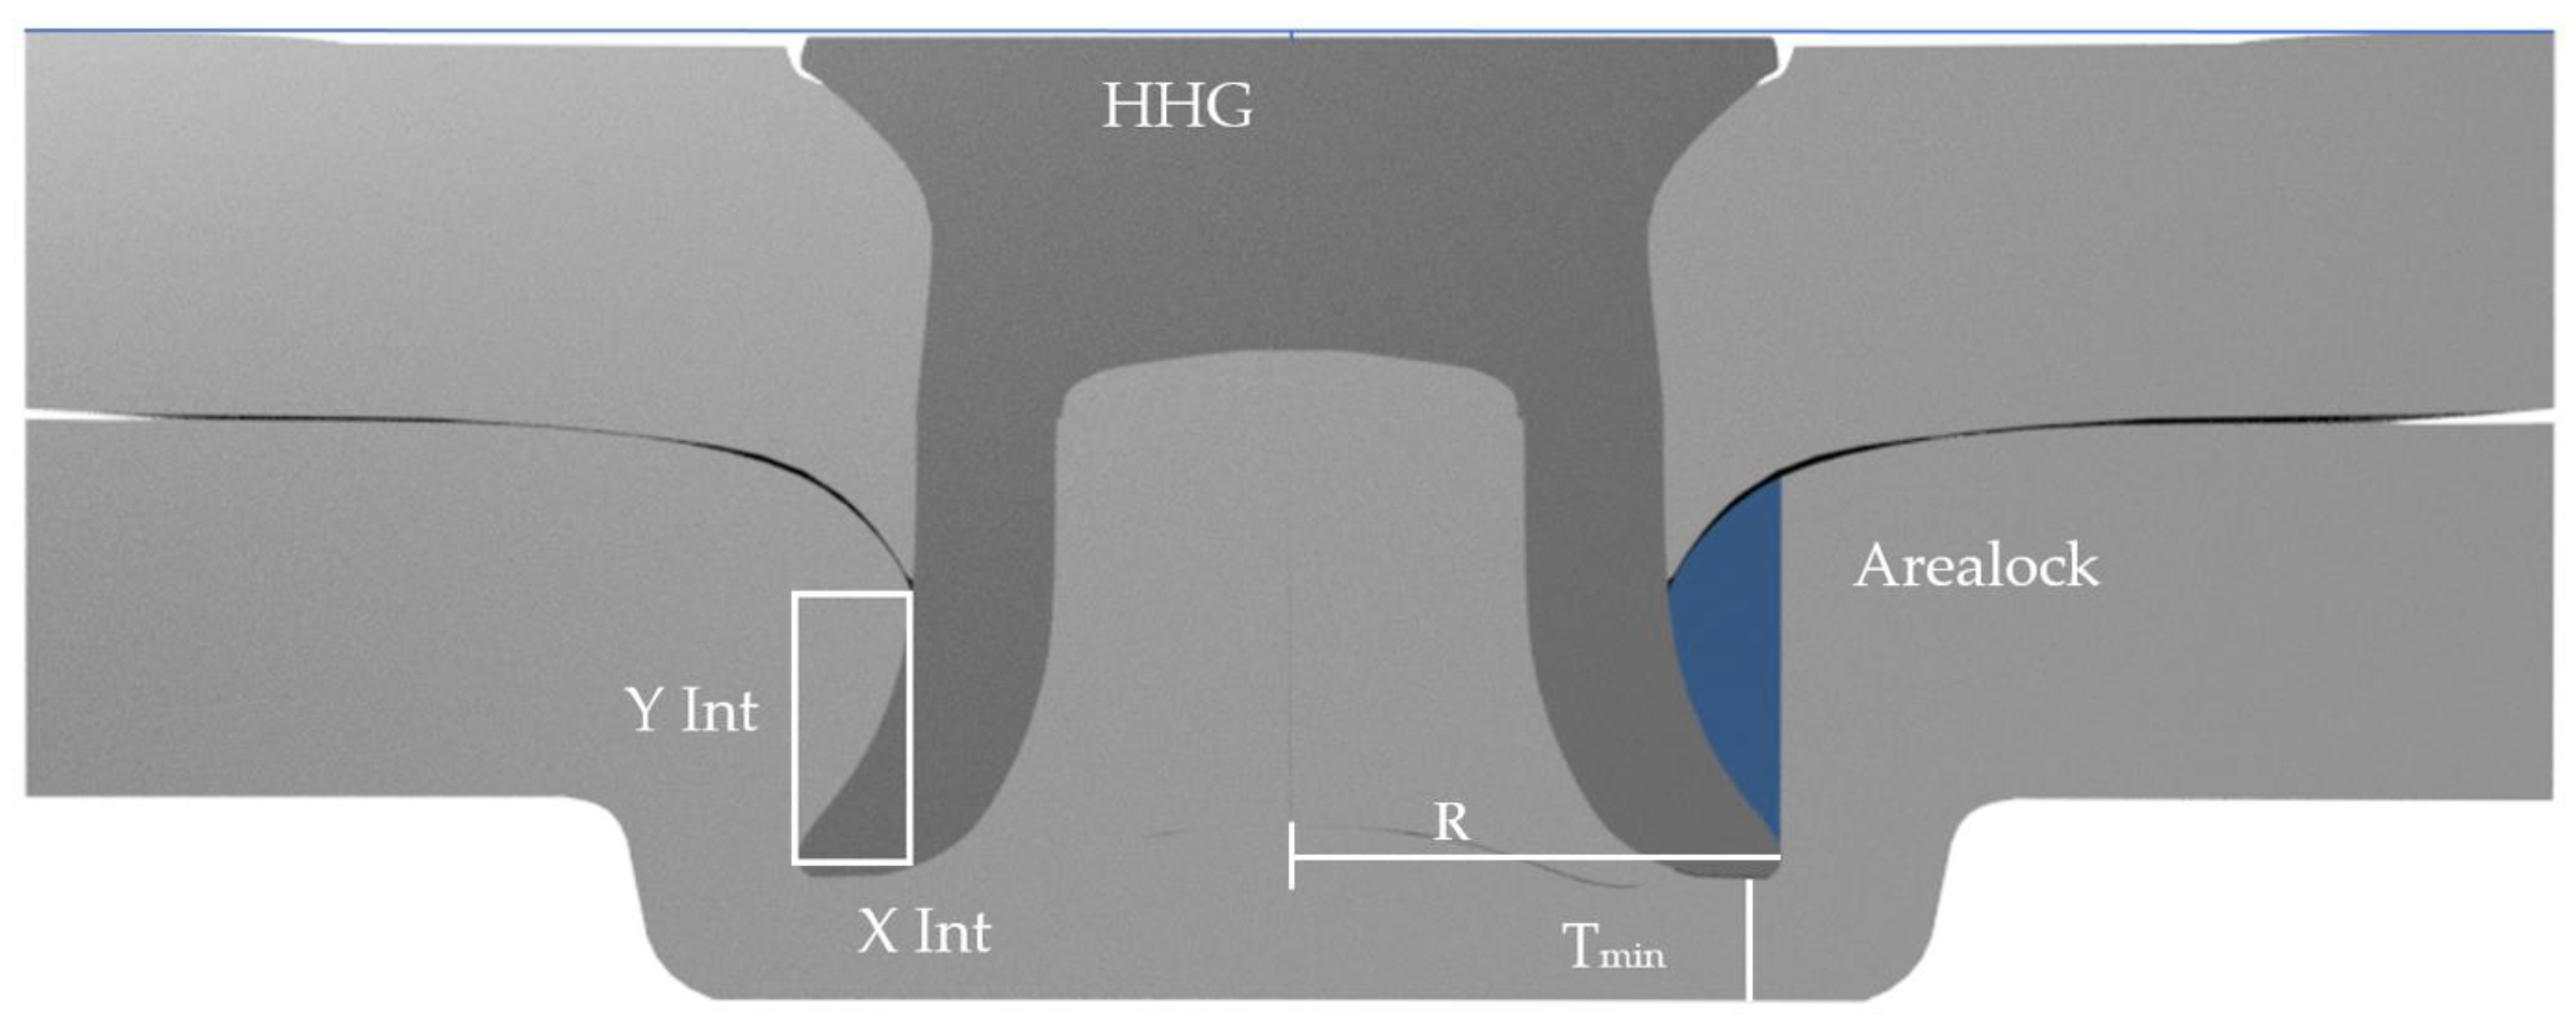
- This study resulted in a new measurement method for cross-section analysis that is potentially capable of predicting tensile test joint strength with enough accuracy to remove the need for conducting extensive physical tensile testing.
- The measurement technique represents a new way of optimising joint parameter choice through a single measurement, improving on current measurement and prediction techniques in terms of accuracy and precision.
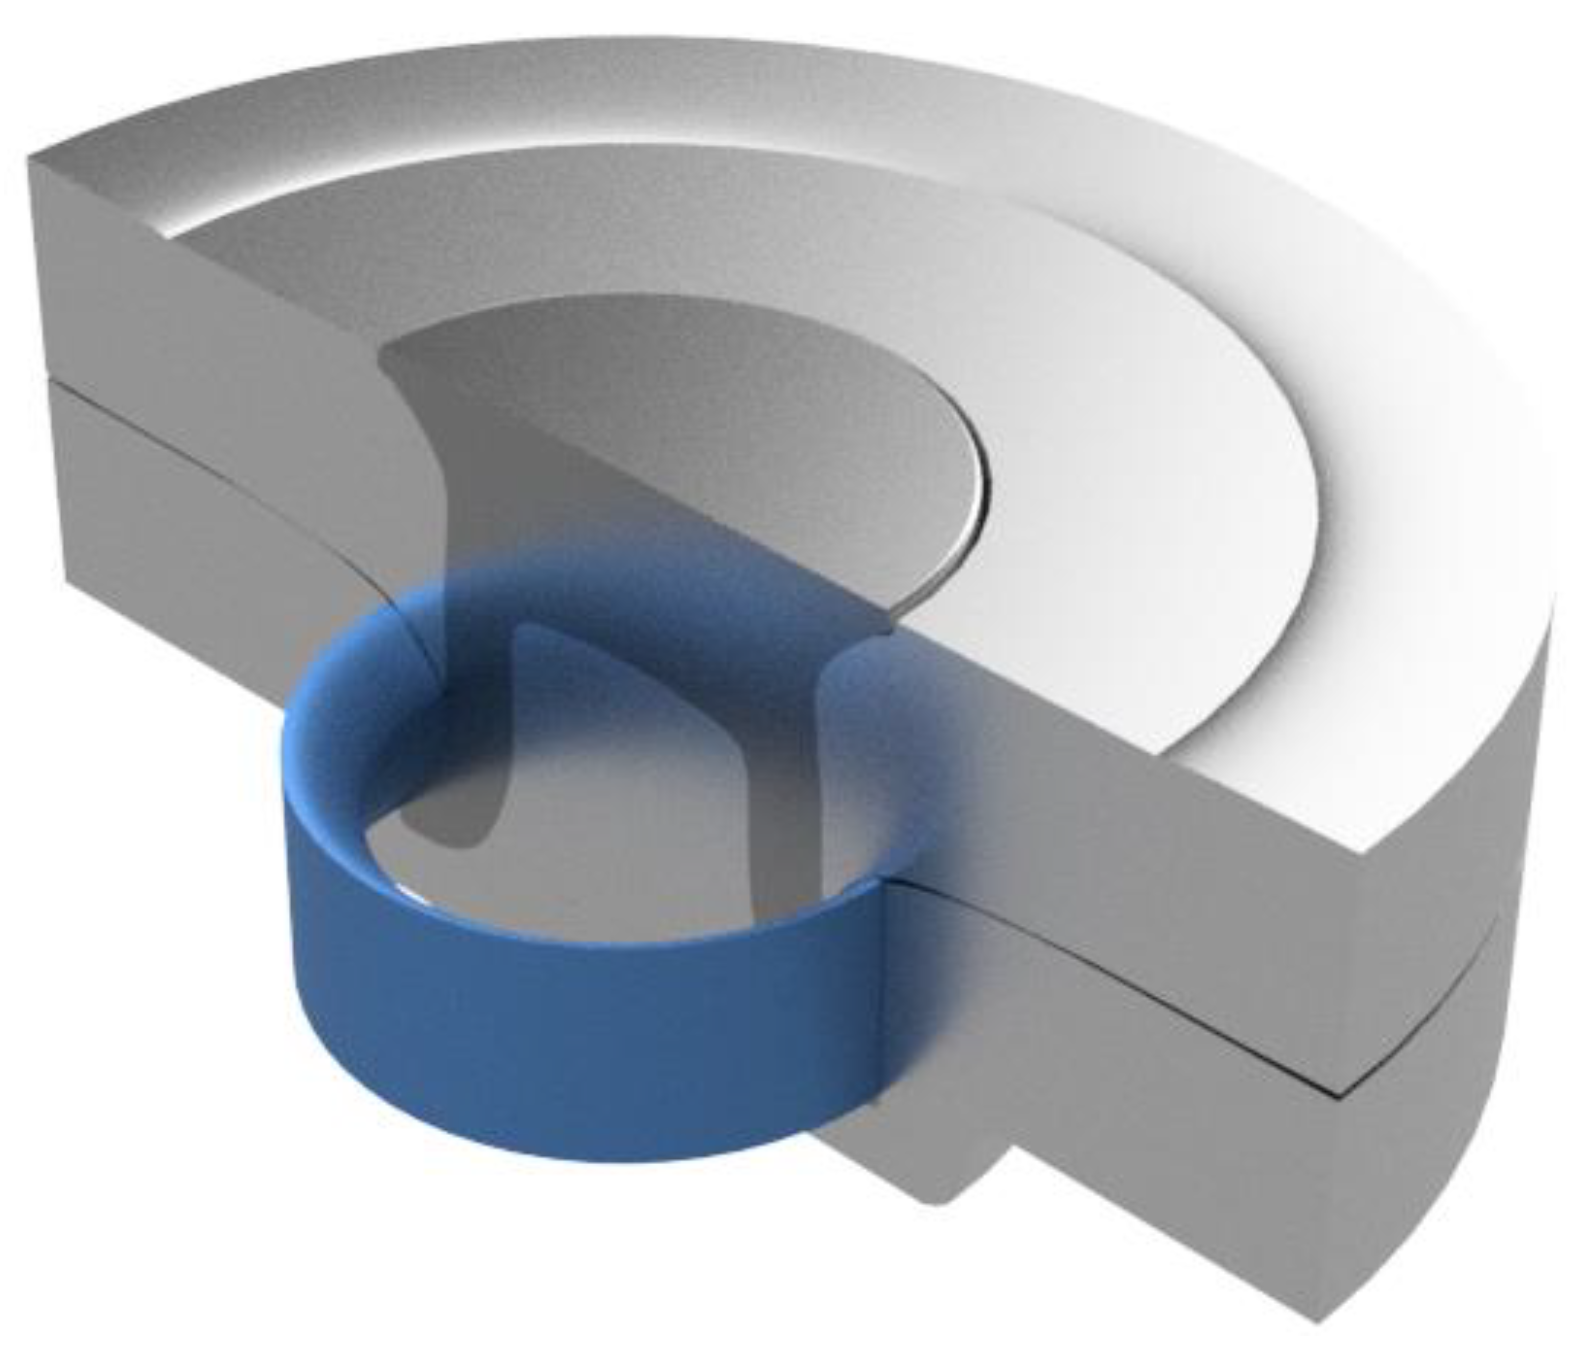
- The relationships between joint performance and Volumelock measurement were investigated and found to be a function of specific energy absorption, which in turn is a function of the material and geometry constants of the tested samples. This opens up the possibility for future work to calculate values useful to car body designers and joining engineers without the need for extensive physical strength testing.
- Further work should be conducted to fully understand the effect of geometry and material on the relationship between Volumelock and joint strength.
- In this initial work we have only begun to explore what might be achieved using this new approach, and we encourage other researchers to help us further develop this interesting new method for the wider benefit of the joining community.
Author Contributions
Funding
Institutional Review Board Statement
Informed Consent Statement
Data Availability Statement
Acknowledgments
Conflicts of Interest
Appendix A

| Test ID | Rivet | Nominal Rivet Length (mm) | Die | Die Depth (mm) | Avg X Interlock (mm) | Standard Deviation X interlock | Avg Y Interlock (mm) | Standard Deviation Y Interlock | Avg Volumelock (mm3) | Standard Deviation Volumelock | Avg Max Load (kN) | Standard Deviation Max Load | Avg Total Energy Absorbed (J) | Standard Deviation Energy Absorbed | Calculated Shear Punch Force (kN) |
|---|---|---|---|---|---|---|---|---|---|---|---|---|---|---|---|
| 1 | K50A42AH00 | 8.5 | DG10-100 | 1 | 0.719 | 0.0572 | 1.11 | 0.079 | 25.3 | 1.80 | 5.10 | 0.131 | 44.9 | 2.29 | 3.74 |
| 2 | K50A42AH00 | 8.5 | DG10-120 | 1.2 | 0.620 | 0.0560 | 1.27 | 0.029 | 26.2 | 2.11 | 5.21 | 0.115 | 54.4 | 2.66 | 4.17 |
| 3 | K50A42AH00 | 8.5 | DG10-140 | 1.4 | 0.620 | 0.0231 | 1.33 | 0.178 | 27.7 | 1.30 | 5.37 | 0.109 | 60.0 | 2.62 | 4.37 |
| 4 | C50D42AH00 | 8.5 | DG10-160 | 1.6 | 0.680 | 0.0862 | 1.47 | 0.211 | 31.6 | 3.45 | 5.77 | 0.241 | 76.5 | 6.07 | 4.92 |
| 5 | K50M42AH00 | 8.5 | DG10-180 | 1.8 | 0.780 | 0.0578 | 1.57 | 0.301 | 38.0 | 2.19 | 5.93 | 0.241 | 80.5 | 3.98 | 5.41 |
| 6 | K50742AH00 | 8.5 | DG10-200 | 2 | 0.790 | 0.1467 | 1.95 | 0.640 | 40.7 | 4.47 | 5.89 | 0.136 | 76.6 | 3.26 | 6.74 |
| 7 | K50842AH00 | 8.5 | DG10-220 | 2.2 | 0.800 | 0.0374 | 2.46 | 0.283 | 38.1 | 1.10 | 6.04 | 0.109 | 80.2 | 3.34 | 8.53 |
| 8 | K50A42AH00 | 6.5 | DG10-200 | 2 | 0.537 | 0.0612 | 1.07 | 0.119 | 11.8 | 1.15 | 3.85 | 0.079 | 16.3 | 0.61 | 3.44 |
| 9 | K50A42AH00 | 7 | DG10-200 | 2 | 0.590 | 0.0762 | 1.24 | 0.187 | 17.5 | 1.67 | 4.51 | 0.069 | 32.4 | 0.75 | 4.04 |
| 10 | K50A42AH00 | 7.5 | DG10-200 | 2 | 0.420 | 0.0967 | 1.22 | 0.172 | 15.3 | 3.20 | 4.85 | 0.179 | 40.9 | 3.87 | 3.76 |
| 11 | K50A42AH00 | 8 | DG10-200 | 2 | 0.610 | 0.0581 | 1.57 | 0.224 | 27.0 | 1.78 | 5.50 | 0.168 | 65.2 | 0.86 | 5.14 |
Appendix B

References
- Haque, R. Quality of self-piercing riveting (SPR) joints from cross-sectional perspective: A review. Arch. Civ. Mech. Eng. 2018, 18, 83–93. [Google Scholar] [CrossRef]
- Li, D.; Han, L.; Thornton, M.; Shergold, M. An evaluation of quality and performance of self-piercing riveted high strength aluminium alloy AA6008 for automotive applications. SAE Tech. Pap. 2010, 2010, 11. [Google Scholar] [CrossRef]
- Madasamy, C.; Faruque, O.; Tyan, T.; Thomas, R. Static and Impact Behavior of Self-Pierced Rivet Connections in Aluminum. In Crashworthiness of Composites and Lightweight Structures; American Society of Mechanical Engineers: New York, NY, USA, 2001; pp. 73–79. [Google Scholar] [CrossRef]
- Li, D.; Chrysanthou, A.; Patel, I.; Williams, G. Self-piercing riveting-a review. Int. J. Adv. Manuf. Technol. 2017, 92, 1777–1824. [Google Scholar] [CrossRef] [Green Version]
- Chao, Y.J. Ultimate strength and failure mechanism of resistance spot weld subjected to tensile, shear, or combined tensile/shear loads. J. Eng. Mater. Technol. Trans. ASME 2003, 125, 125–132. [Google Scholar] [CrossRef]
- Liu, Y.; Li, H.; Zhao, H.; Liu, X. Effects of the die parameters on the self-piercing riveting process. Int. J. Adv. Manuf. Technol. 2019, 105, 3353–3368. [Google Scholar] [CrossRef]
- Wang, J.W.; Liu, Z.X.; Shang, Y.; Liu, A.L.; Wang, M.X.; Sun, R.N.; Wang, P.-C. Self-piercing riveting of wrought magnesium AZ31 sheets. J. Manuf. Sci. Eng. Trans. ASME 2011, 133, 031009. [Google Scholar] [CrossRef]
- Mori, K.I.; Bay, N.; Fratini, L.; Micari, F.; Tekkaya, A.E. Joining by plastic deformation. CIRP Ann.-Manuf. Technol. 2013, 62, 673–694. [Google Scholar] [CrossRef]
- Ma, Y.; Xian, X.; Lou, M.; Li, Y.; Lin, Z. Friction Self-Piercing Riveting (F-SPR) of Dissimilar Materials. Procedia Eng. 2017, 207, 950–955. [Google Scholar] [CrossRef]
- Xian, X.; Ma, Y.; Shan, H.; Niu, S.; Li, Y. Single-sided joining of aluminum alloys using friction self-piercing riveting (F-SPR) process. J. Manuf. Process. 2019, 38, 319–327. [Google Scholar] [CrossRef]
- Grimm, T.; Drossel, W.G. Process development for self-pierce riveting with solid formable rivet of boron steel in multi-material design. Procedia Manuf. 2019, 29, 271–279. [Google Scholar] [CrossRef]
- Varela, S.; Mangas, Á.; Kotercova, Z.; Briskham, P.; Giménez, M.; Muñoz, C.; Molina, R.; Santos, M. Insertion behavior study of multi-material self-piercing rivet joints by means of finite element simulation. AIP Conf. Proc. 2019, 2113, 050028. [Google Scholar] [CrossRef]
- Porcaro, R.; Hanssen, A.G.; Langseth, M.; Aalberg, A. The behaviour of a self-piercing riveted connection under quasi-static loading conditions. Int. J. Solids Struct. 2006, 43, 5110–5131. [Google Scholar] [CrossRef] [Green Version]
- Ying, L.; Gao, T.; Dai, M.; Hu, P.; Dai, J. Towards joinability of thermal self-piercing riveting for AA7075-T6 aluminum alloy sheets under quasi-static loading conditions. Int. J. Mech. Sci. 2020, 189, 105978. [Google Scholar] [CrossRef]
- Testa, G.; Bonora, N.; Iannitti, G.; Ruggiero, A.; Gentile, D. Numerical simulation of self-piercing riveting process (SRP) using continuum damage mechanics modelling. Frat. Ed Integrità Strutt. 2018, 12, 161–172. [Google Scholar] [CrossRef] [Green Version]
- Bouchard, P.O.; Laurent, T.; Tollier, L. Numerical modeling of self-pierce riveting-From riveting process modeling down to structural analysis. J. Mater. Process. Technol. 2008, 202, 290–300. [Google Scholar] [CrossRef]
- Kim, C.; Min, K.M.; Choi, H.; Kim, H.J.; Lee, M.G. Development of analytical strength estimator for self-piercing rivet joints through observation of finite element simulations. Int. J. Mech. Sci. 2021, 202–203, 106499. [Google Scholar] [CrossRef]
- Jäckel, M.; Falk, T.; Drossel, W. Algorithm-based design of mechanical joining processes. Prod. Eng. 2022, 16, 285–293. [Google Scholar] [CrossRef]
- Lin, J.; Qi, C.; Wan, H.; Min, J.; Chen, J.; Zhang, K.; Zhang, L. Prediction of Cross-Tension Strength of Self-Piercing Riveted Joints Using Finite Element Simulation and XGBoost Algorithm. Chin. J. Mech. Eng. 2021, 34, 36. [Google Scholar] [CrossRef]
- Haque, R.; Durandet, Y. Strength prediction of self-pierce riveted joint in cross-tension and lap-shear. Mater. Des. 2016, 108, 666–678. [Google Scholar] [CrossRef]
- Ma, Y.; Shan, H.; Niu, S.; Li, Y.; Lin, Z.; Ma, N. A Comparative Study of Friction Self-Piercing Riveting and Self-Piercing Riveting of Aluminum Alloy AA5182-O. Engineering 2020, 7, 1741–1750. [Google Scholar] [CrossRef]
- Haque, R.; Williams, N.S.; Blacket, S.E.; Durandet, Y. A simple but effective model for characterizing SPR joints in steel sheet. J. Mater. Process. Technol. 2015, 223, 225–231. [Google Scholar] [CrossRef]


| Top Sheet | Bottom Sheet | |||
|---|---|---|---|---|
| Alloy | Thickness (mm) | Alloy | Thickness (mm) | |
| Stack 1 | AA5754 H111 | 3.0 | AA5754 H111 | 3.0 |
| Test ID | Rivet Type | Rivet Length (mm) | DG Die Cavity (Diameter ) | DG Die Cavity (Depth) | Insertion Force (kN) | Insertion Velocity (mm/s) |
|---|---|---|---|---|---|---|
| 1 | K50A42AH00 | 8.5 | 10 | 100 | 70.96 | 340 |
| 2 | K50A42AH00 | 8.5 | 10 | 120 | 72.40 | 340 |
| 3 | K50A42AH00 | 8.5 | 10 | 140 | 73.80 | 340 |
| 4 | K50A42AH00 | 8.5 | 10 | 160 | 72.28 | 330 |
| 5 | K50A42AH00 | 8.5 | 10 | 180 | 64.14 | 300 |
| 6 | K50A42AH00 | 8.5 | 10 | 200 | 53.62 | 270 |
| 7 | K50A42AH00 | 8.5 | 10 | 220 | 50.30 | 260 |
| 8 | C50D42AH00 | 6.5 | 10 | 200 | 46.7 | 230 |
| 9 | K50742AH00 | 7.0 | 10 | 200 | 50.66 | 250 |
| 10 | K50M42AH00 | 7.5 | 10 | 200 | 52.38 | 260 |
| 11 | K50842AH00 | 8.0 | 10 | 200 | 53.80 | 270 |
Disclaimer/Publisher’s Note: The statements, opinions and data contained in all publications are solely those of the individual author(s) and contributor(s) and not of MDPI and/or the editor(s). MDPI and/or the editor(s) disclaim responsibility for any injury to people or property resulting from any ideas, methods, instructions or products referred to in the content. |
© 2023 by the authors. Licensee MDPI, Basel, Switzerland. This article is an open access article distributed under the terms and conditions of the Creative Commons Attribution (CC BY) license (https://creativecommons.org/licenses/by/4.0/).
Share and Cite
Jepps, L.; Briskham, P.; Sims, N.; Susmel, L. Investigation into the Effect of Interlock Volume on SPR Strength. Materials 2023, 16, 2747. https://doi.org/10.3390/ma16072747
Jepps L, Briskham P, Sims N, Susmel L. Investigation into the Effect of Interlock Volume on SPR Strength. Materials. 2023; 16(7):2747. https://doi.org/10.3390/ma16072747
Chicago/Turabian StyleJepps, Lewis, Paul Briskham, Neil Sims, and Luca Susmel. 2023. "Investigation into the Effect of Interlock Volume on SPR Strength" Materials 16, no. 7: 2747. https://doi.org/10.3390/ma16072747