
Effect of Zn Addition on the Microstructure, Mechanical Properties, and Fracture Behavior of As-Cast Mg-Gd-Y-Zr Alloys
Abstract
:1. Introduction
2. Materials and Methods
3. Results
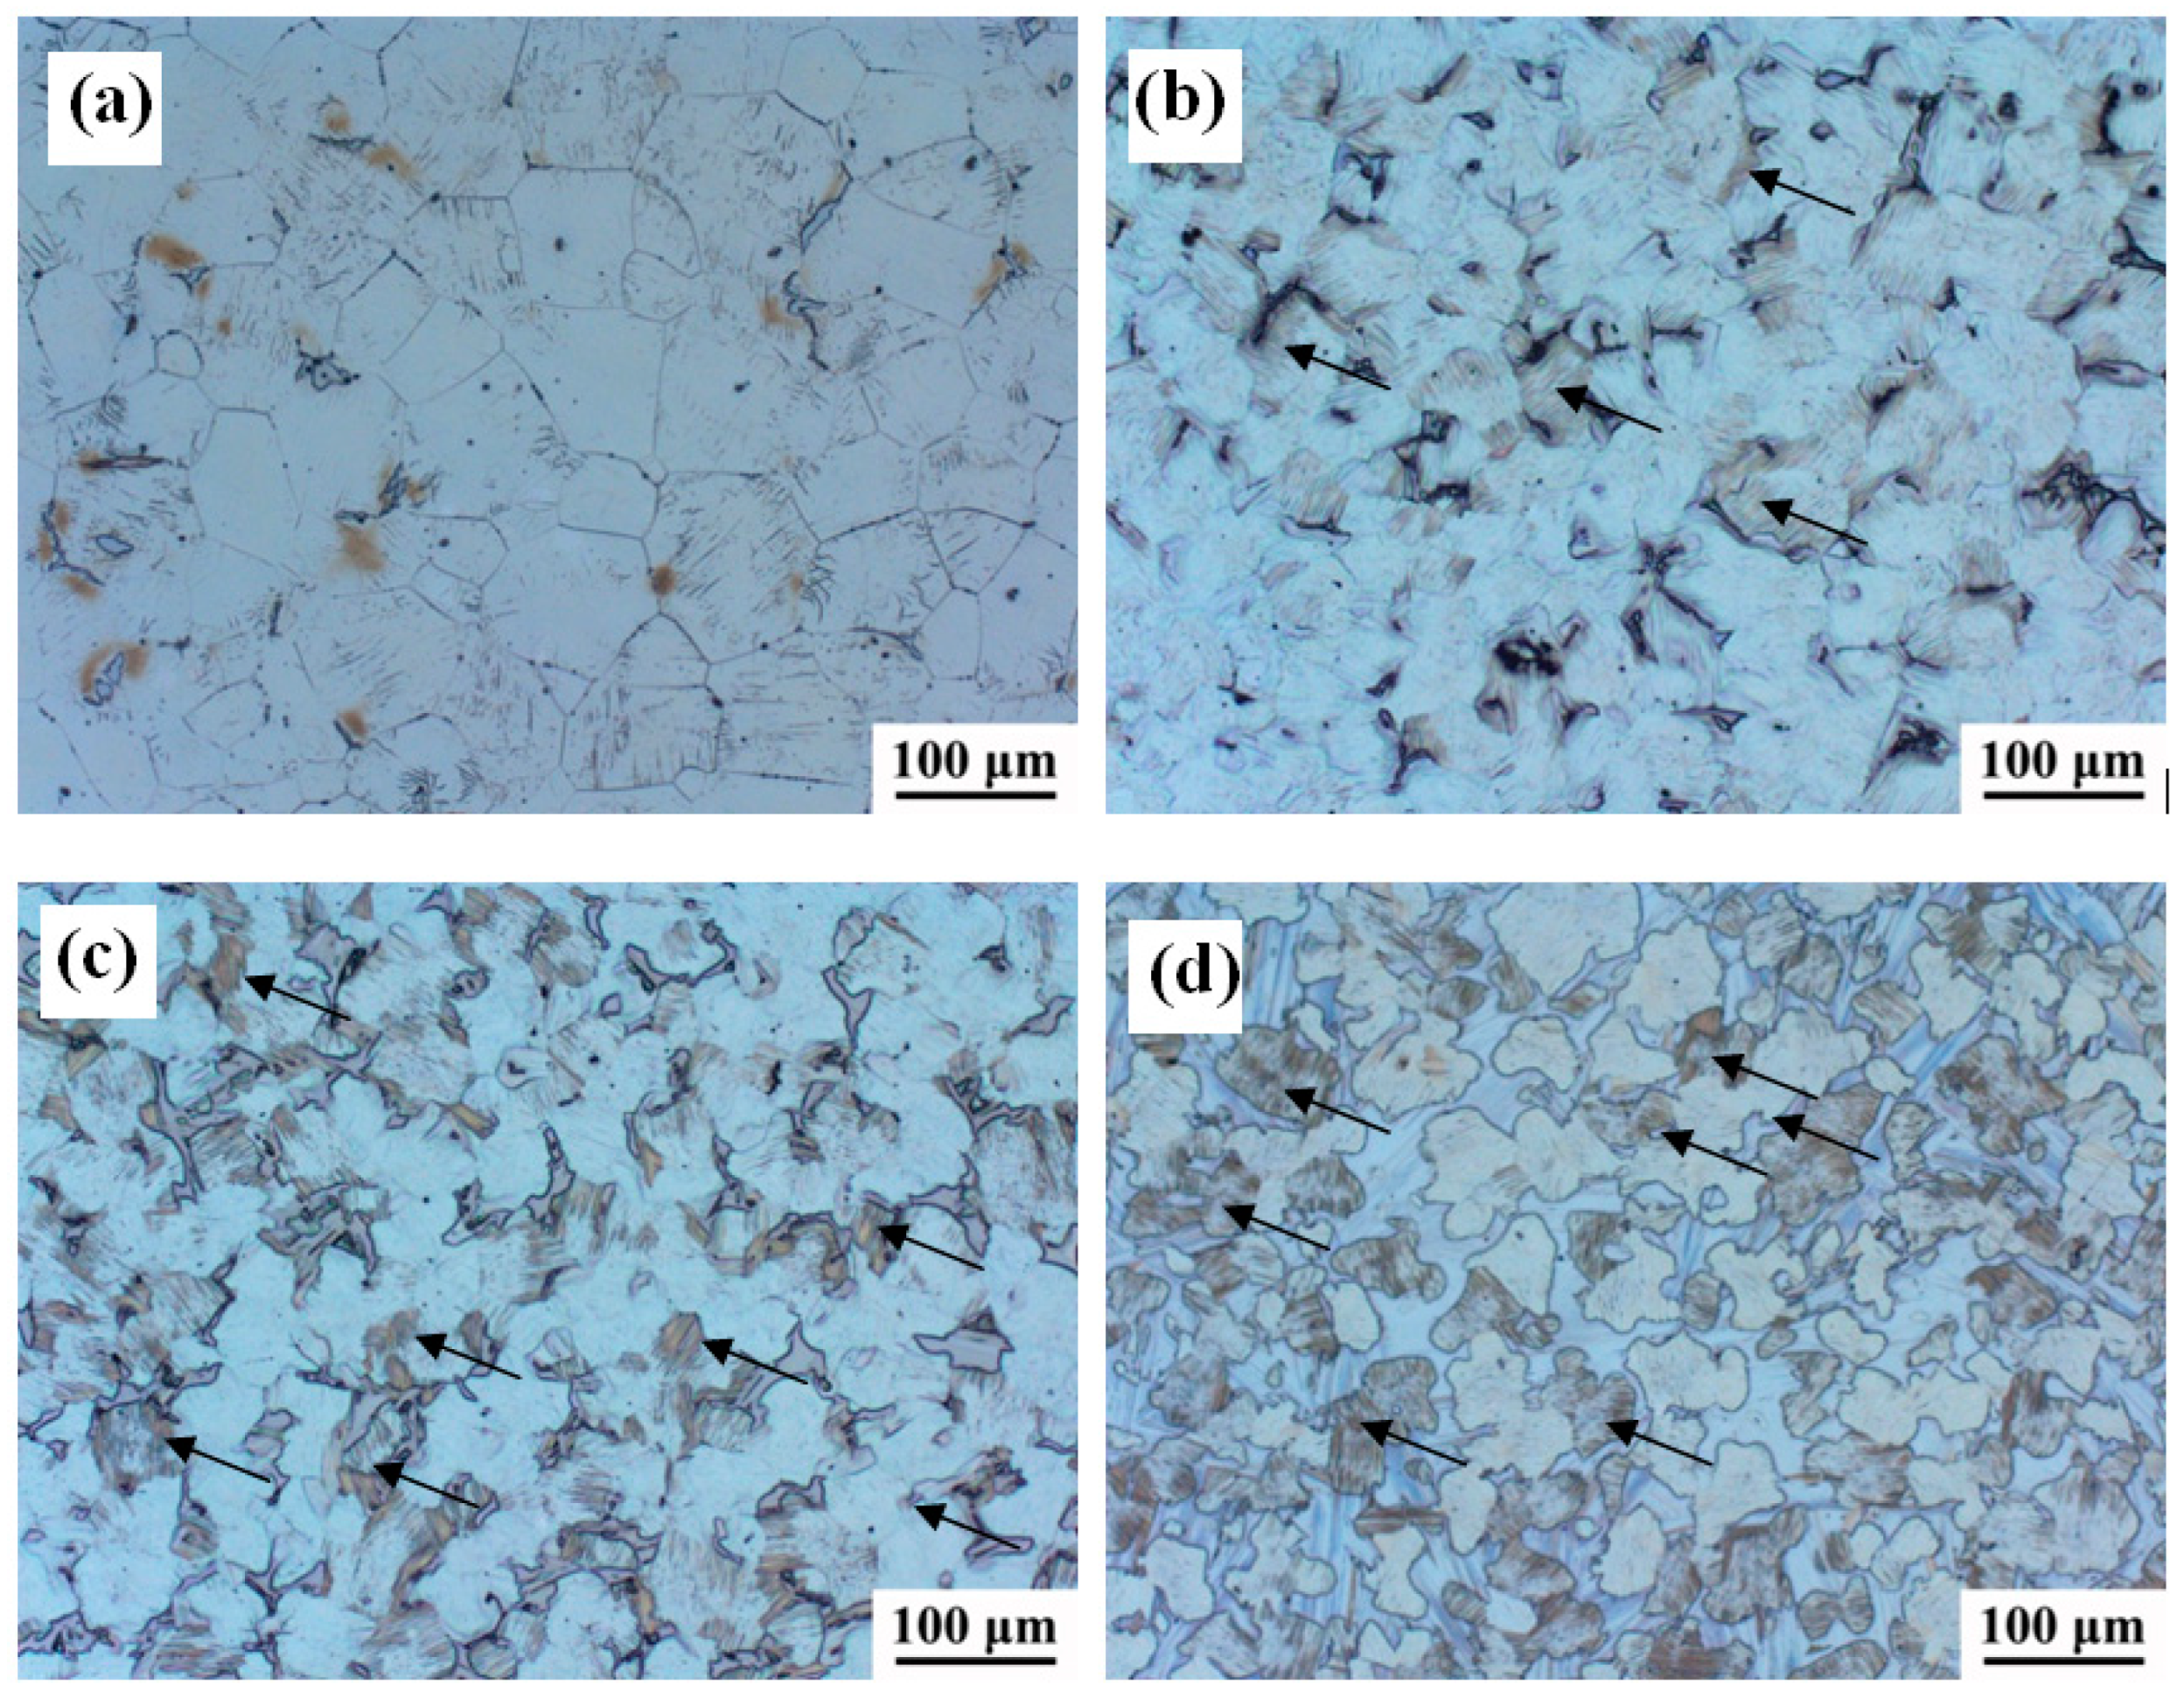
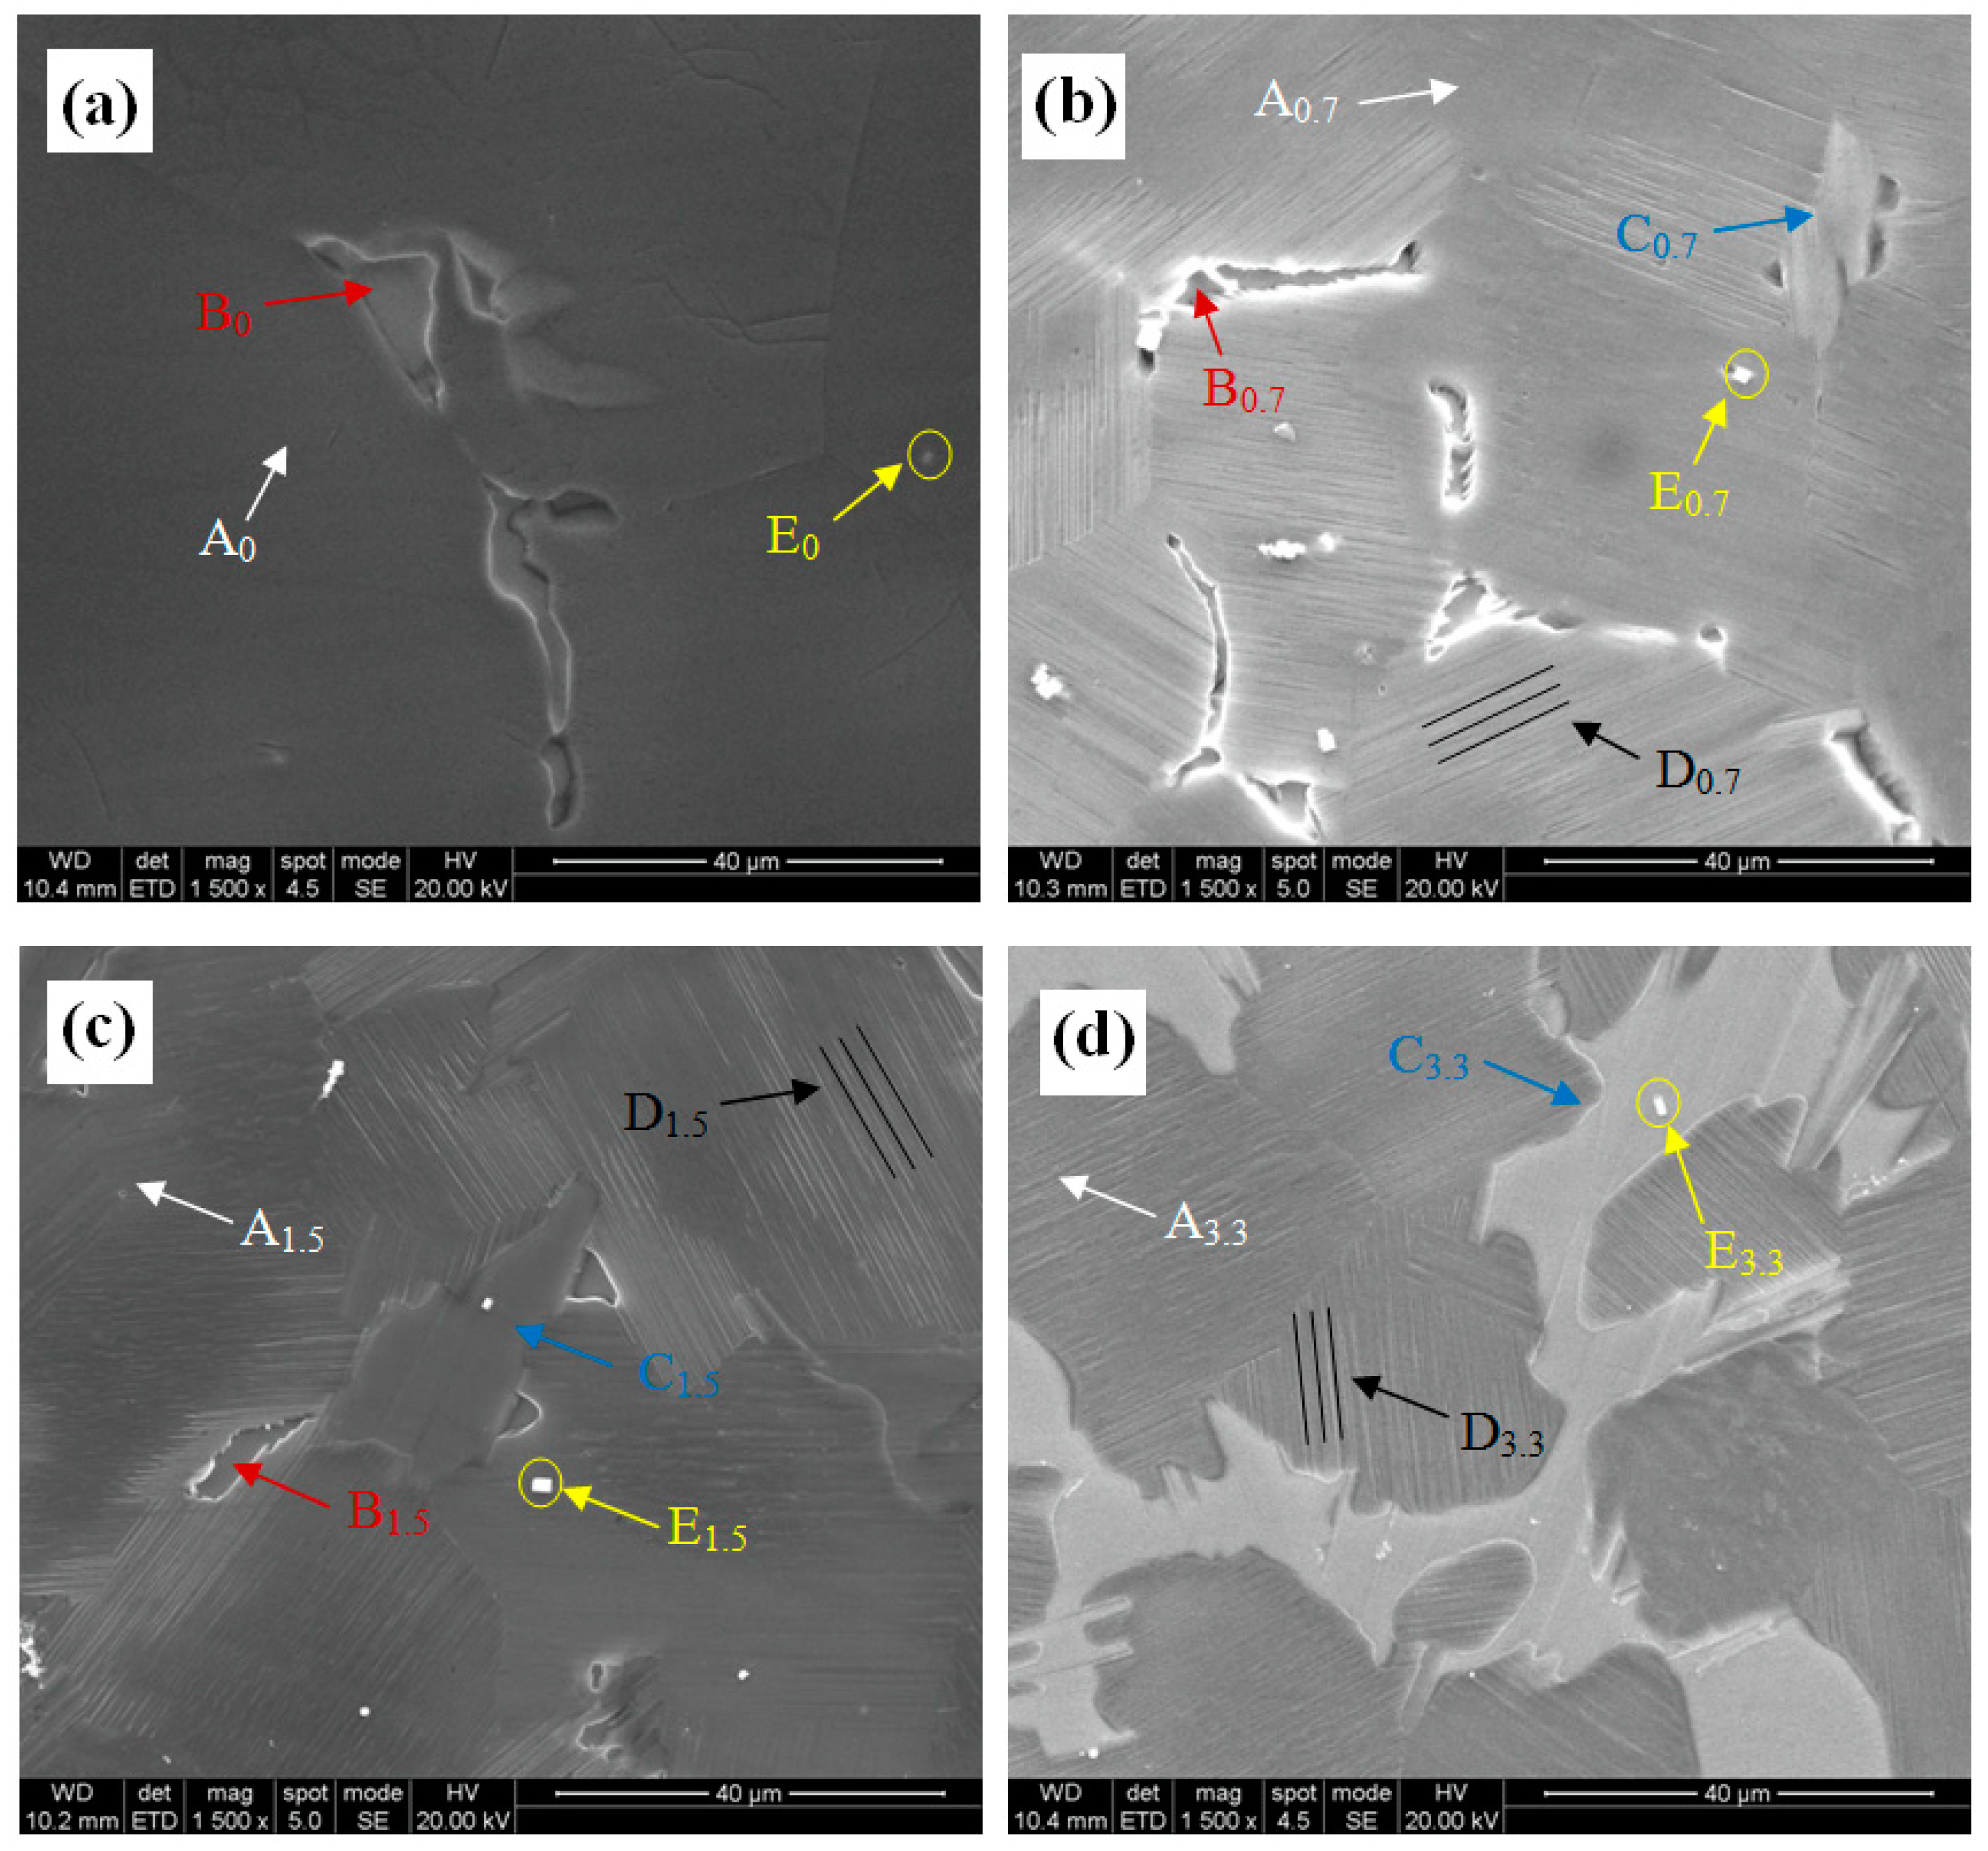
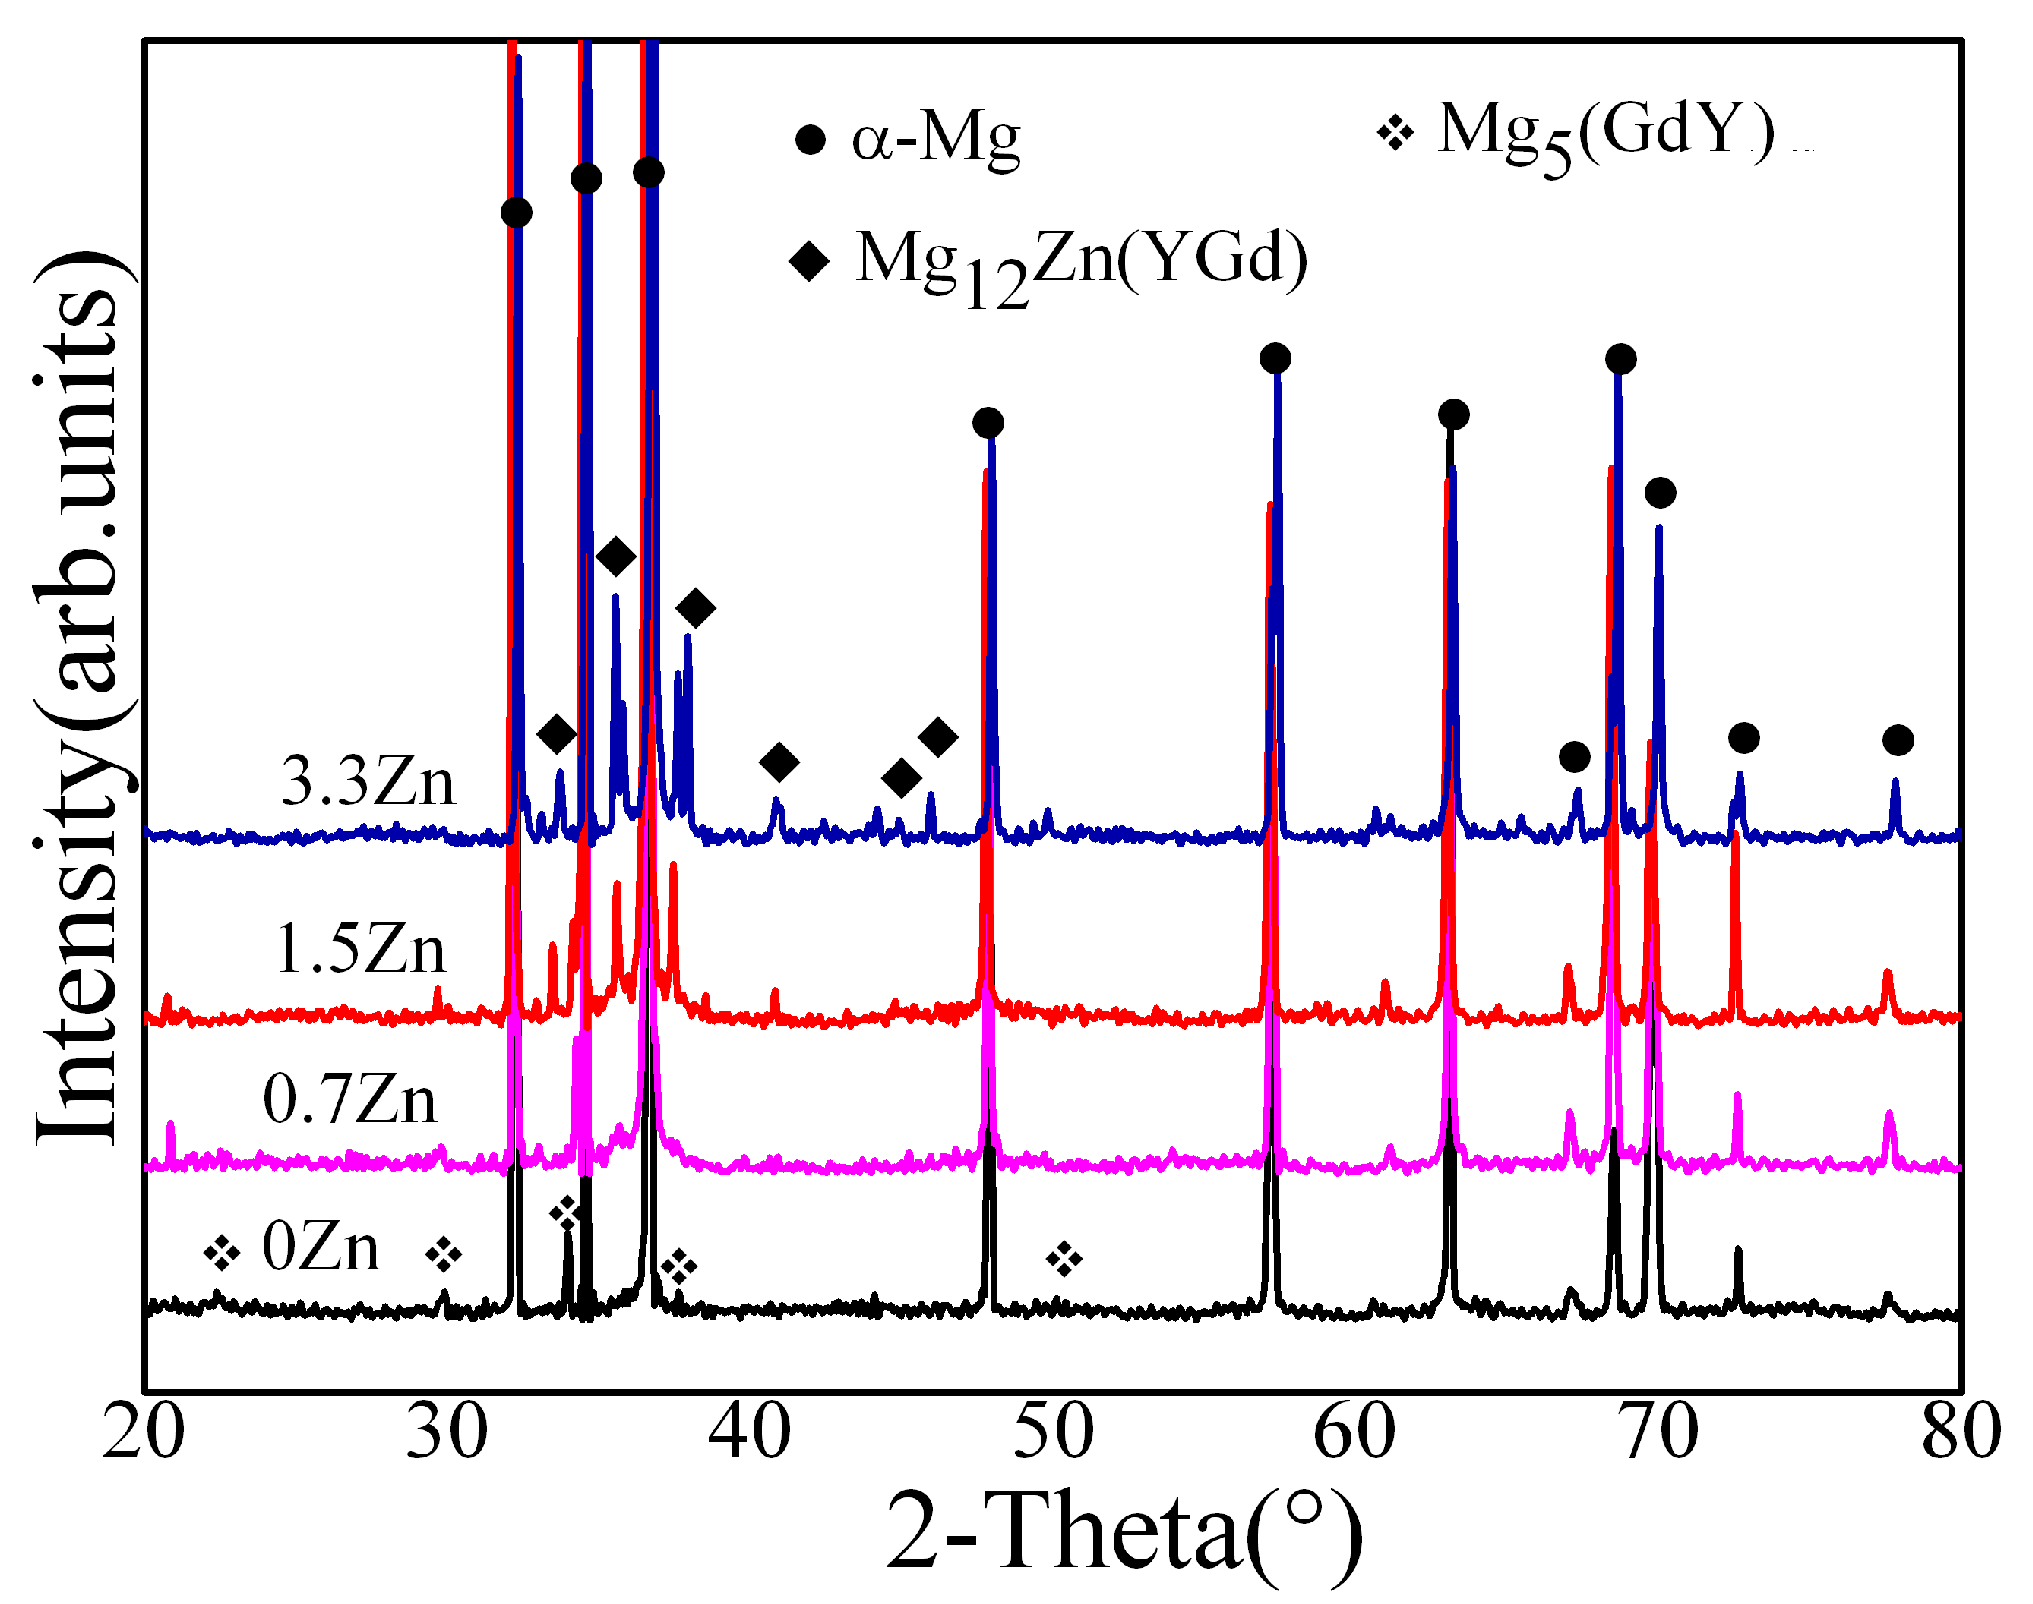
3.1. Microstructure
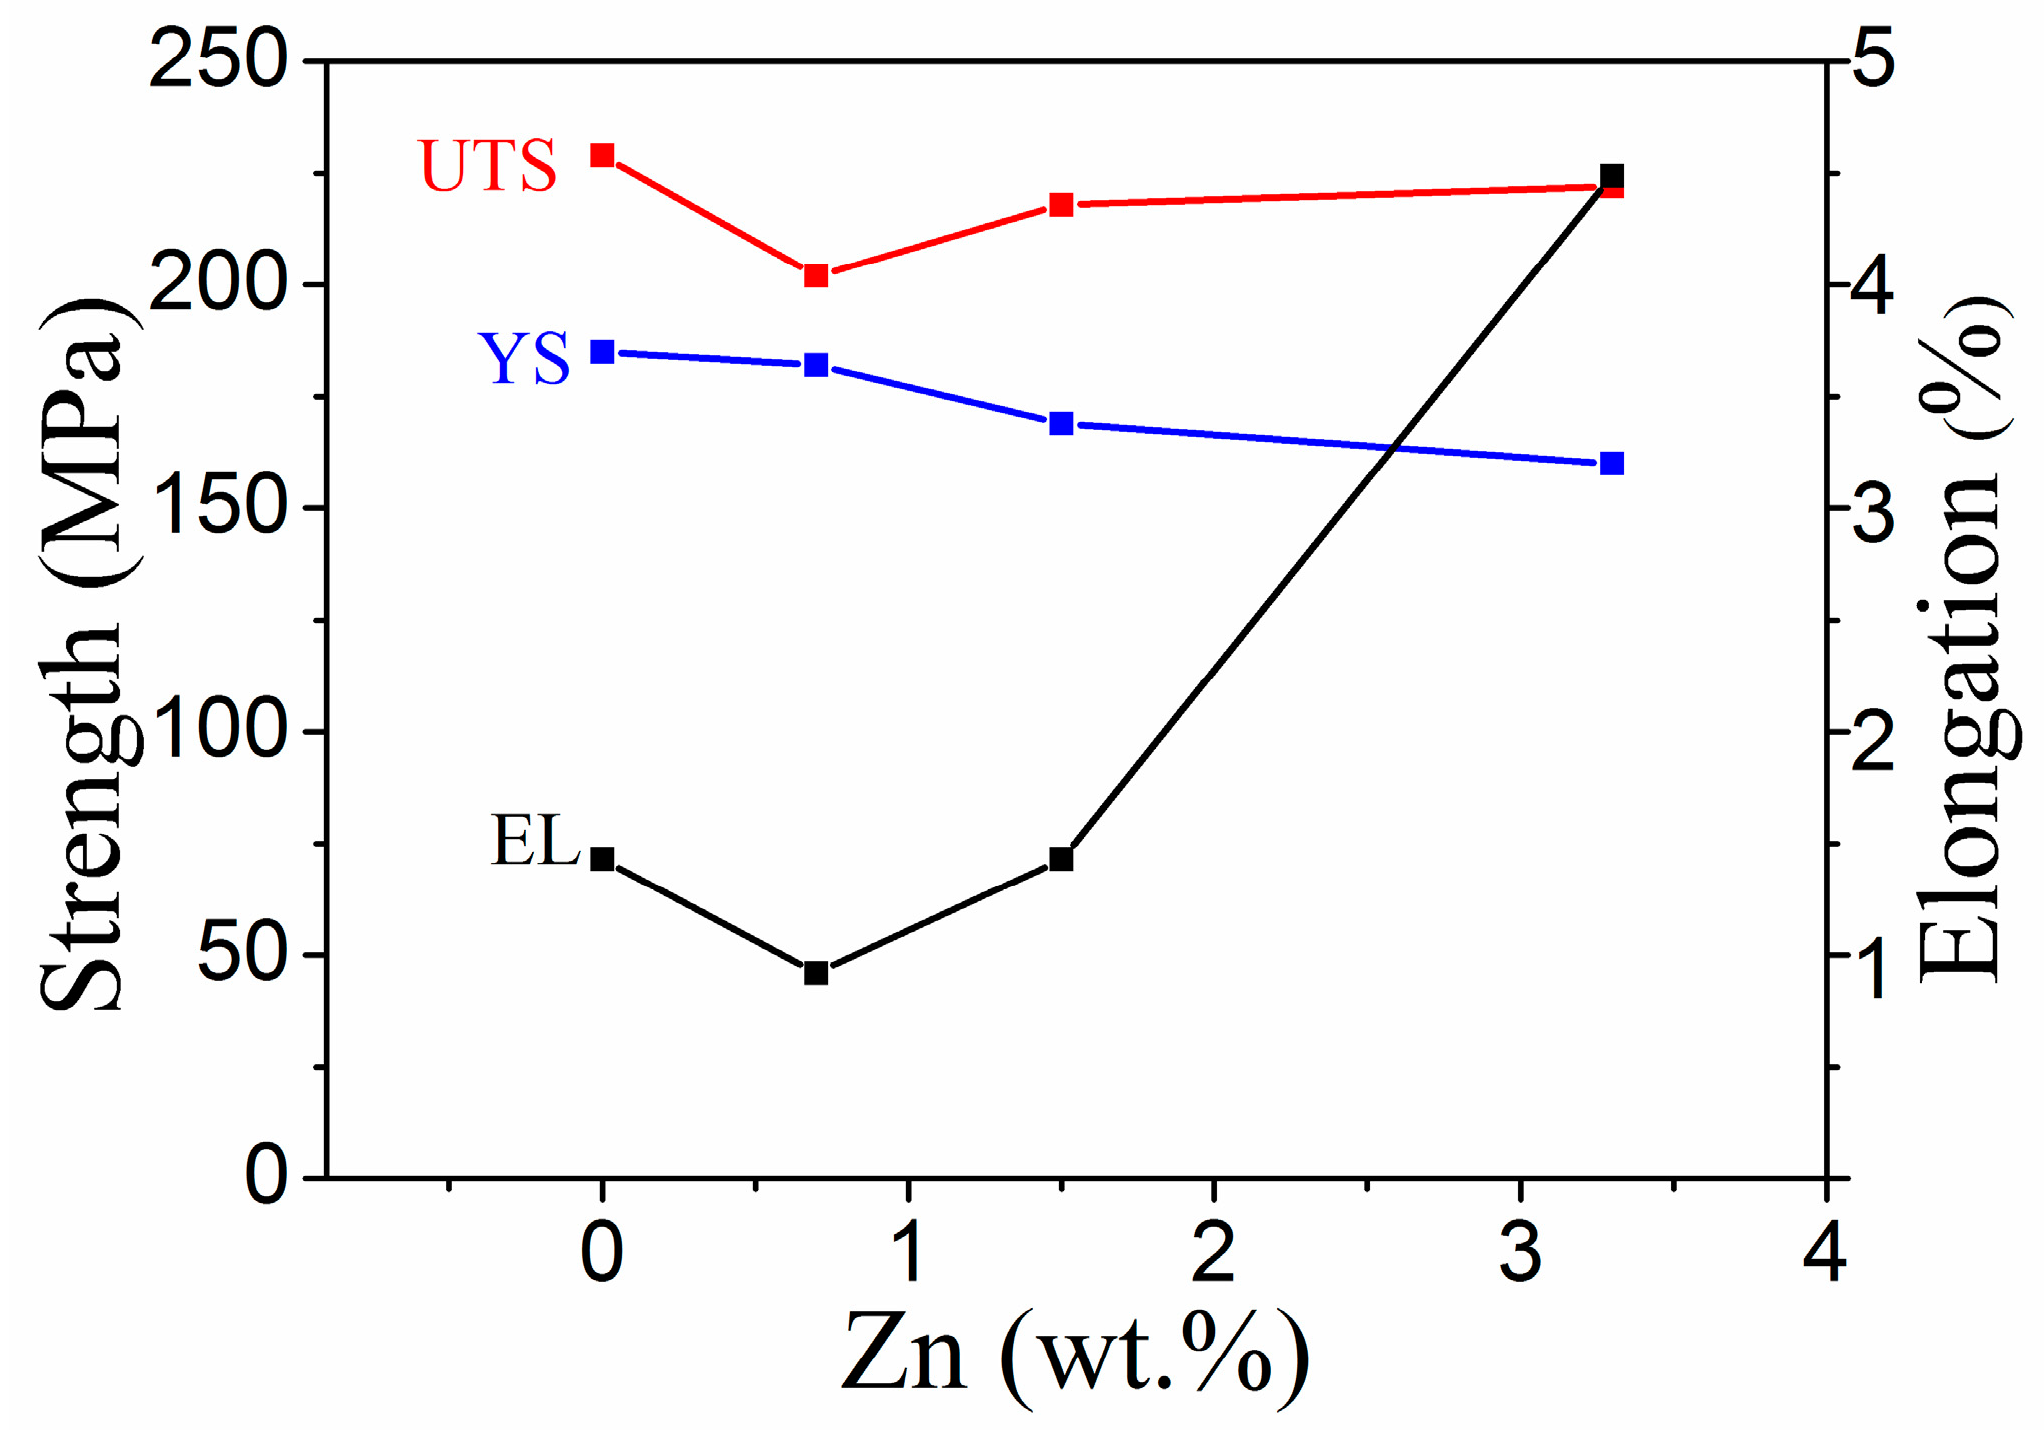
3.2. Mechanical Properties
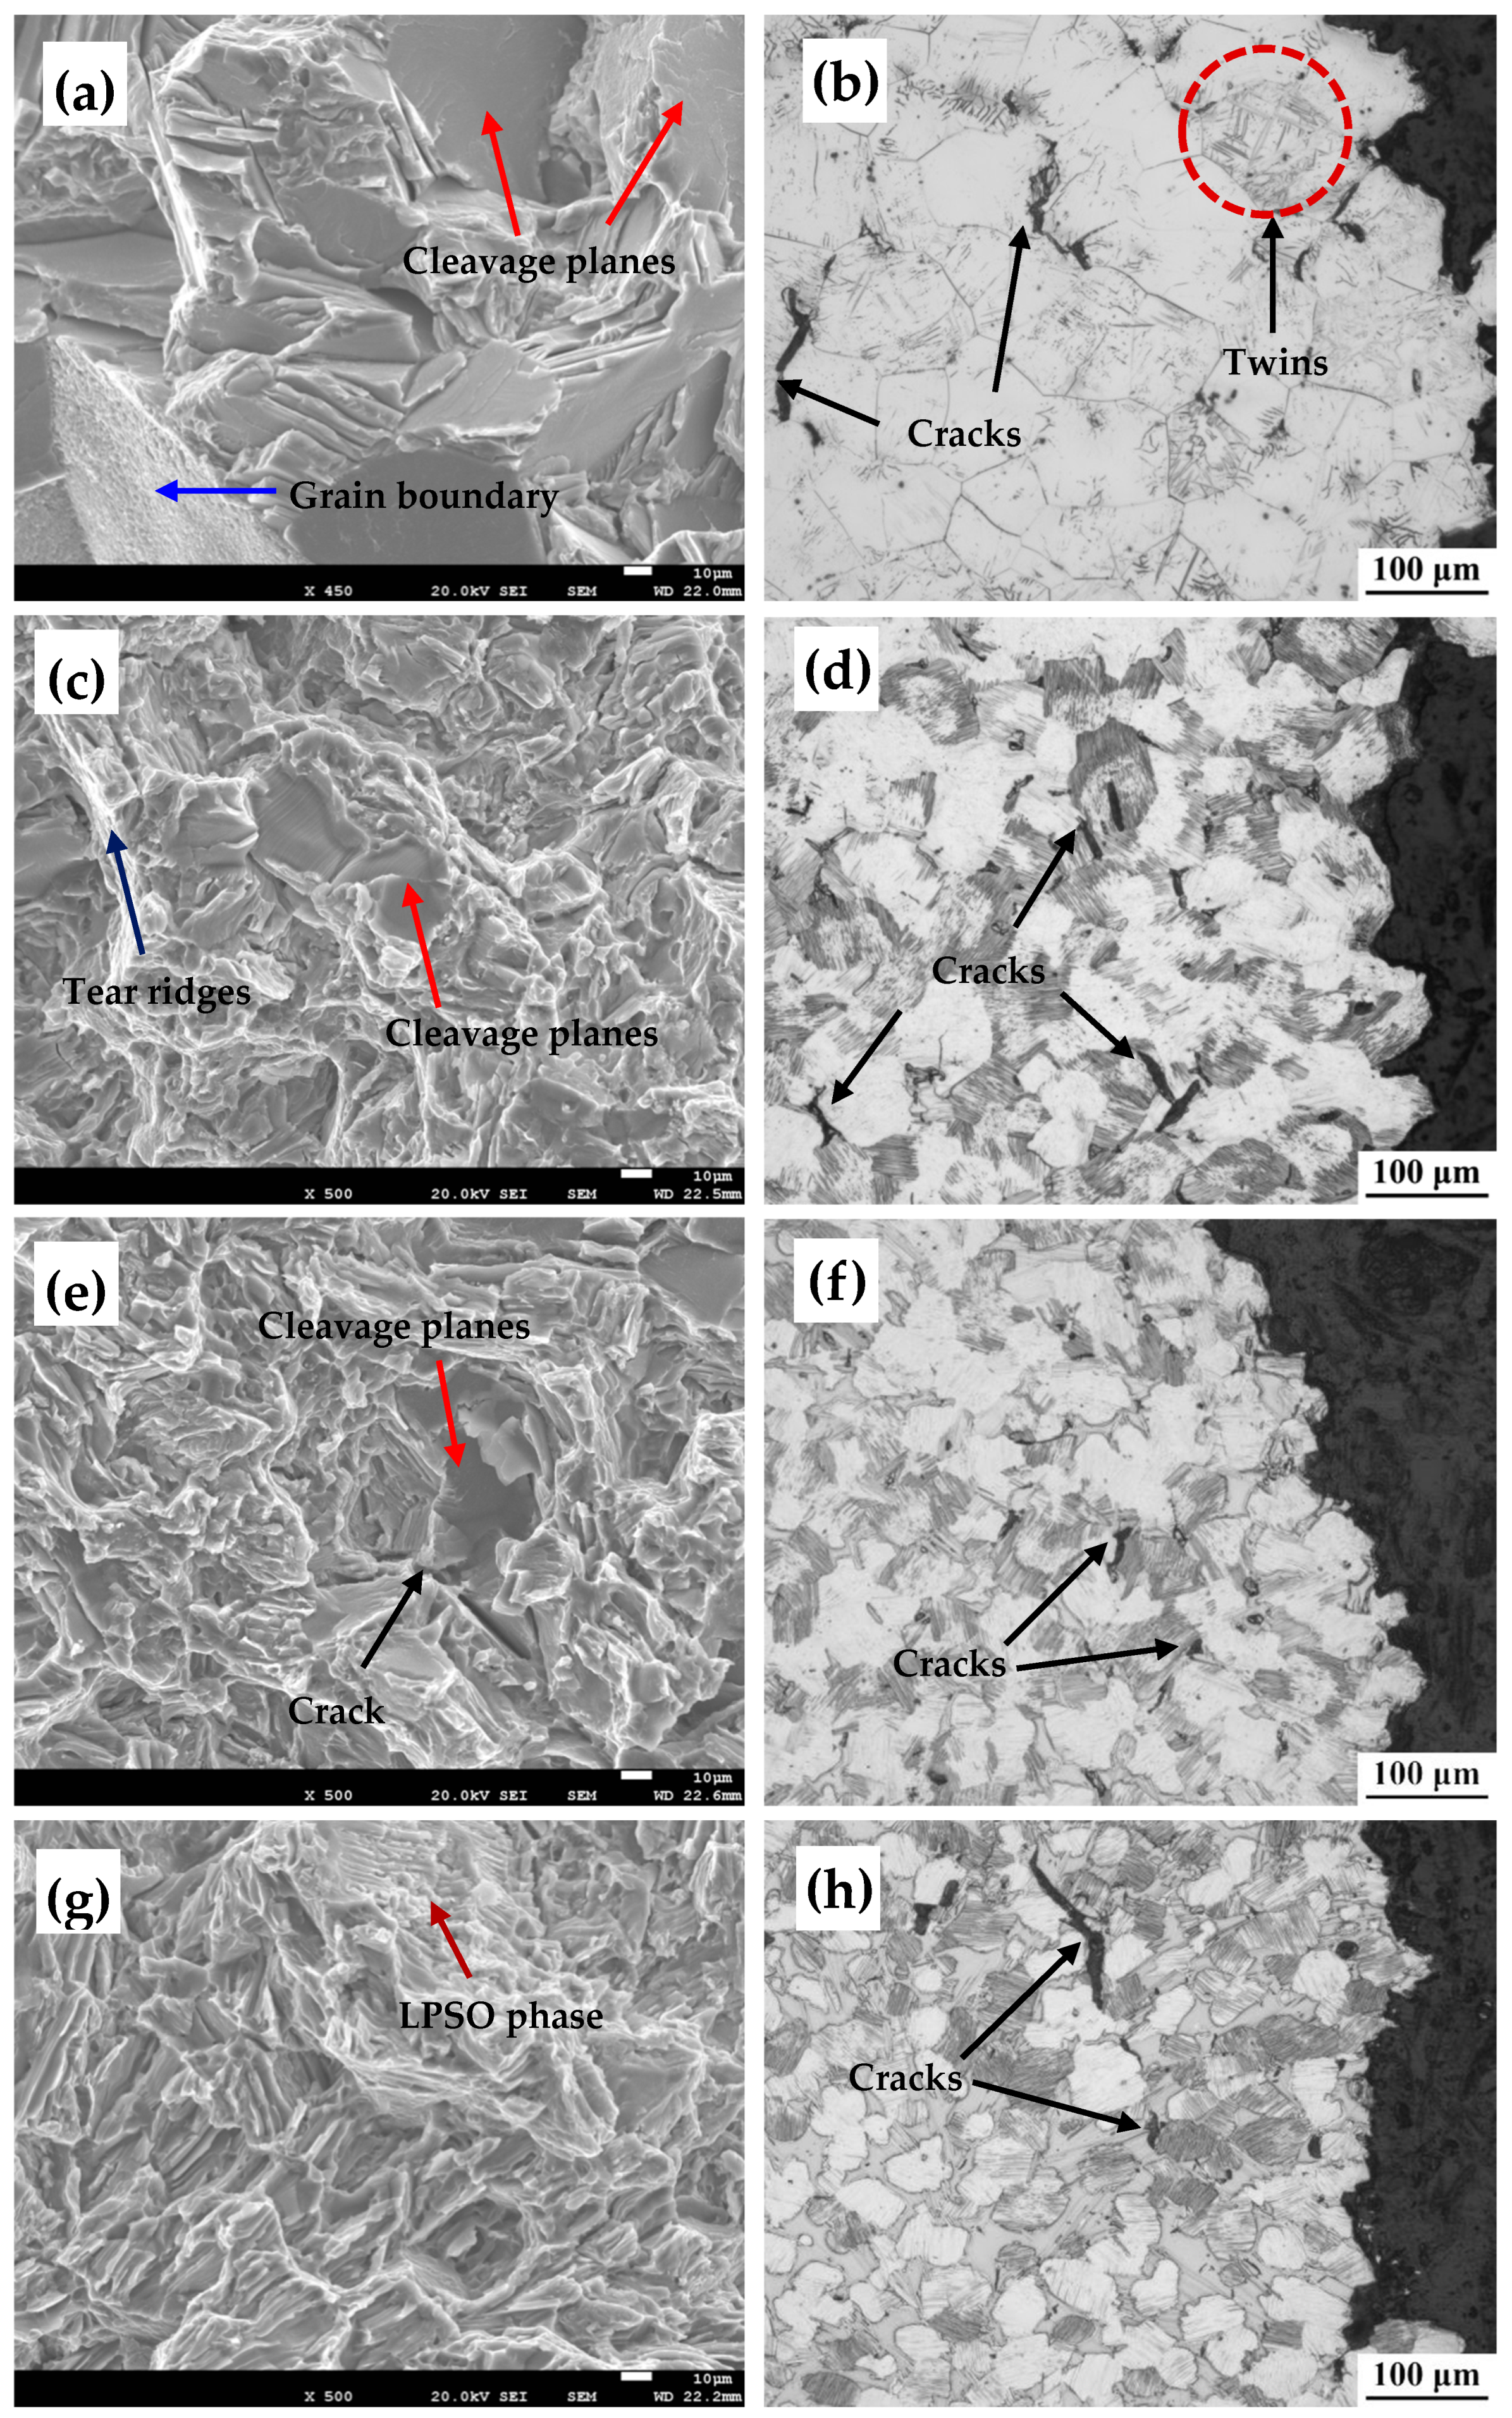
3.3. Fracture Behaviors
4. Discussions
4.1. Effect of Zn Content on the Microstructure of the As-Cast Alloy
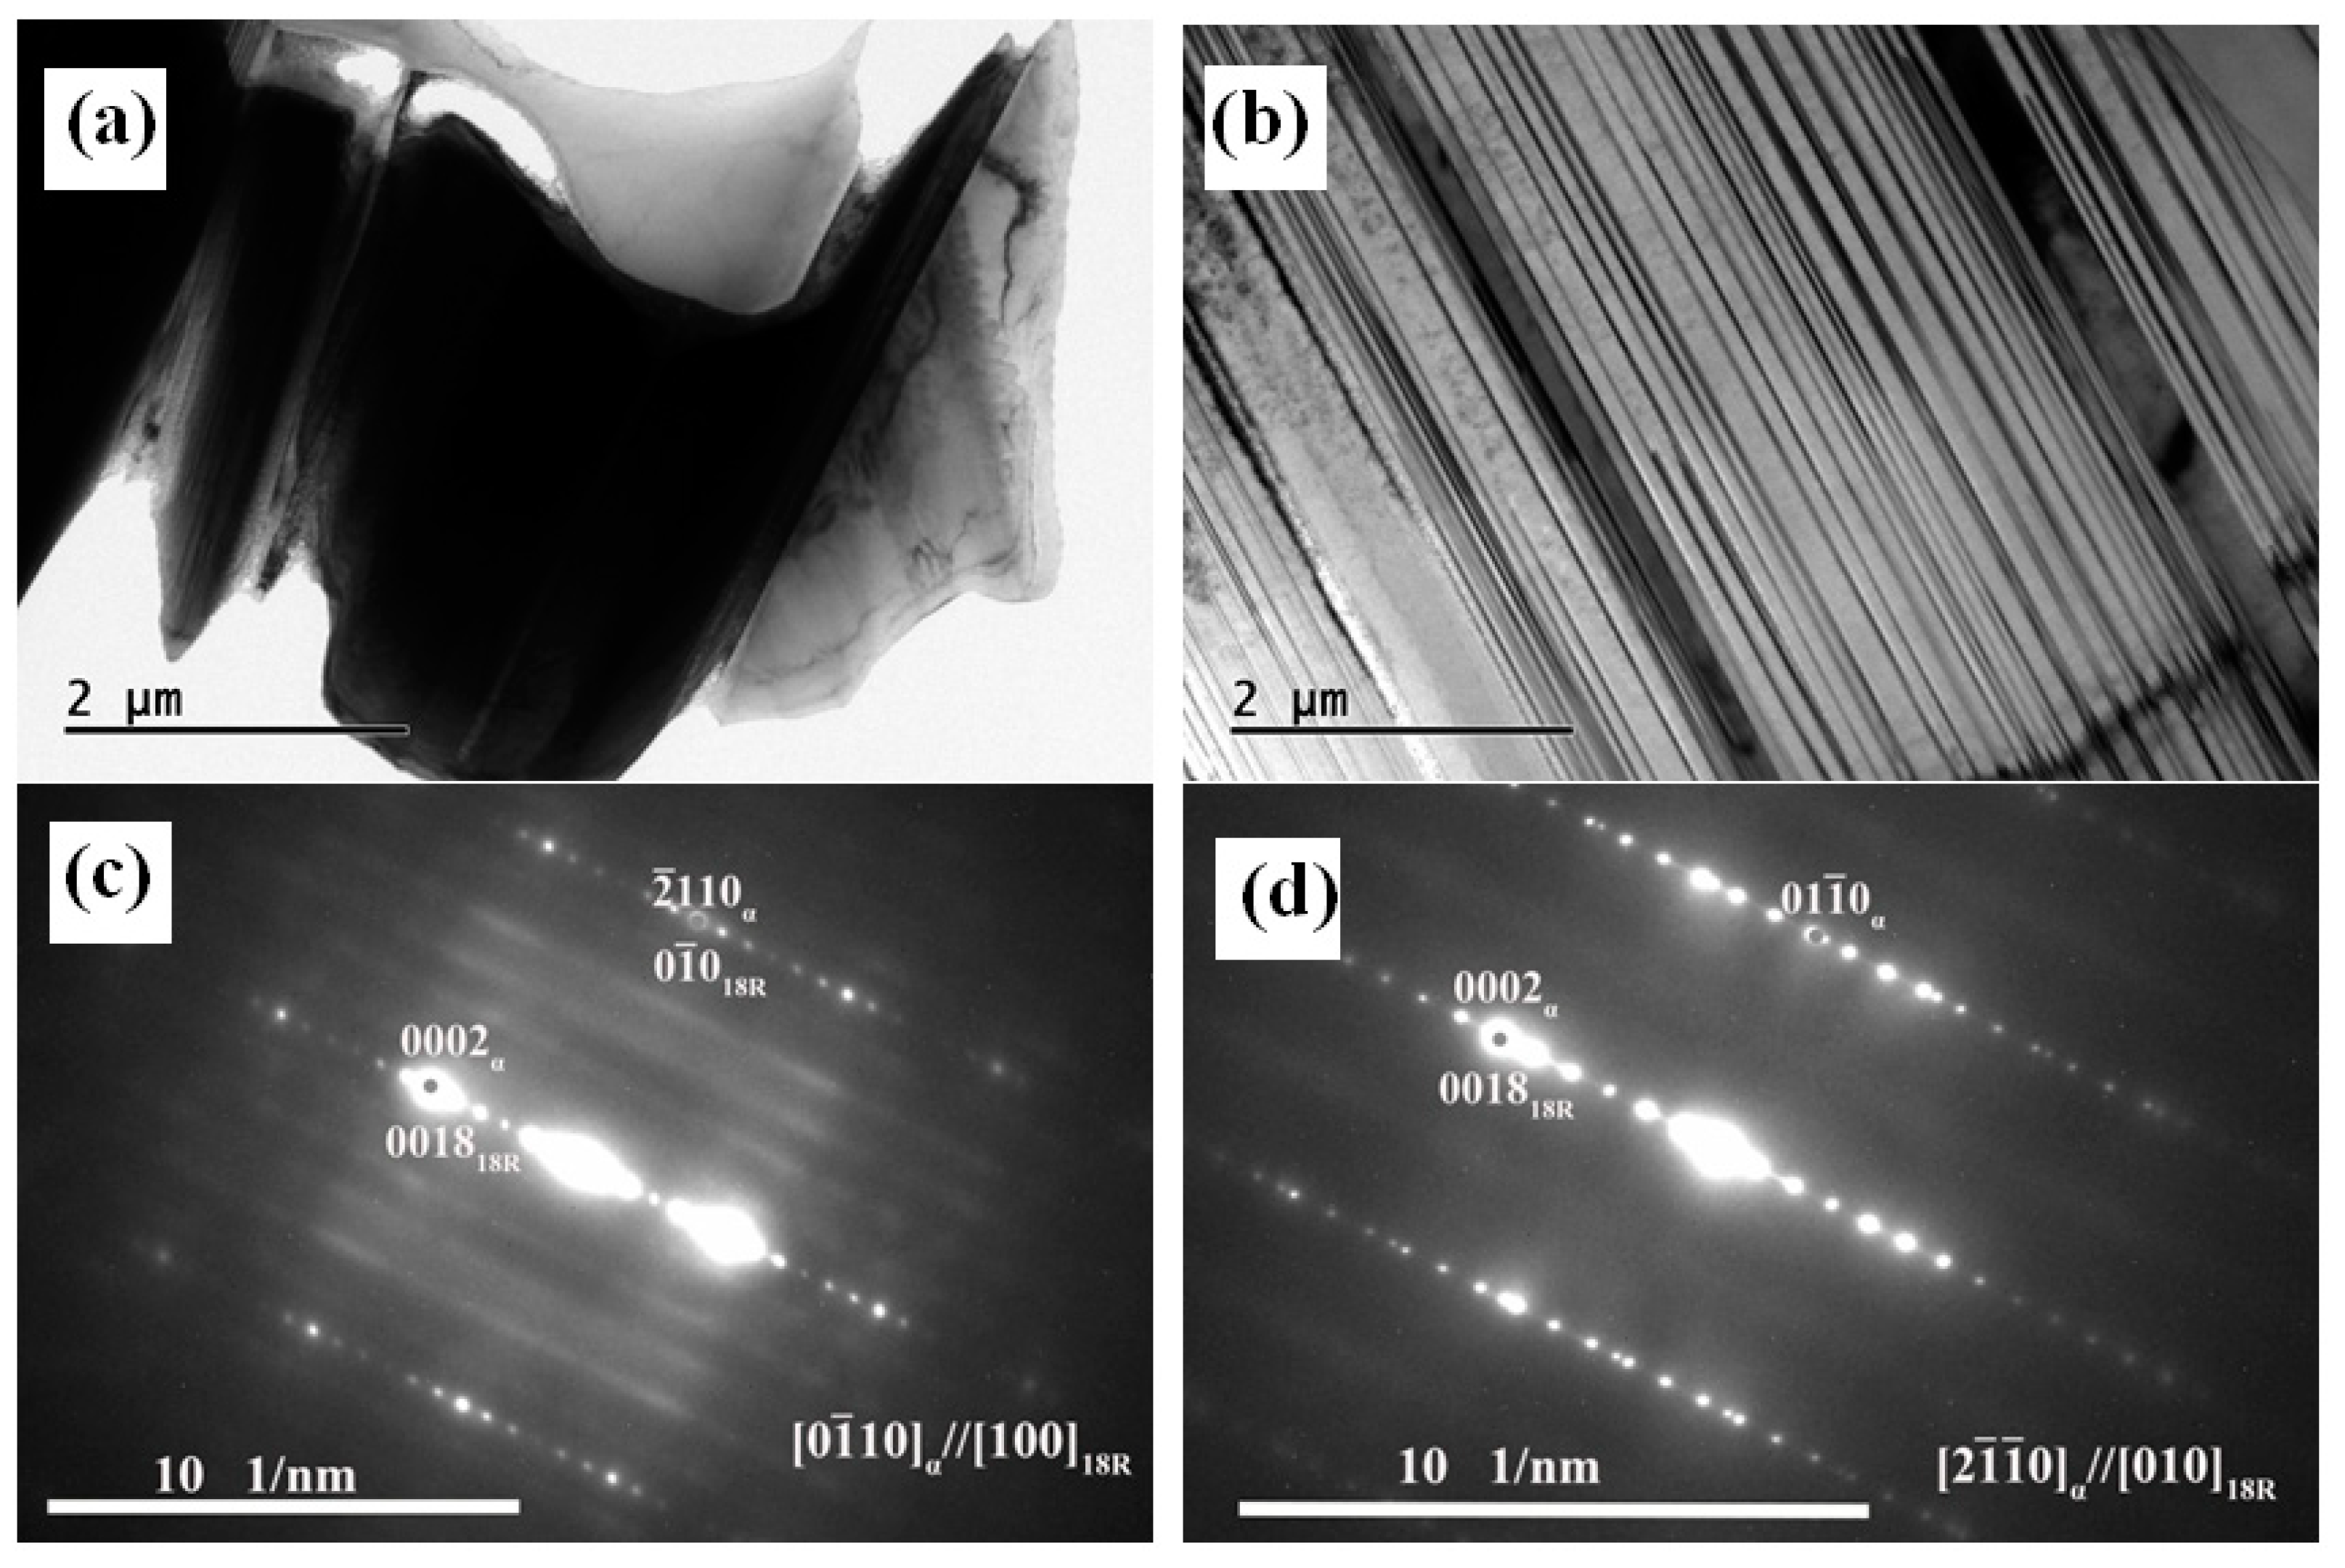
4.2. Effect of the LPSO Phase on the Fracture Mechanism
5. Conclusions
- (1)
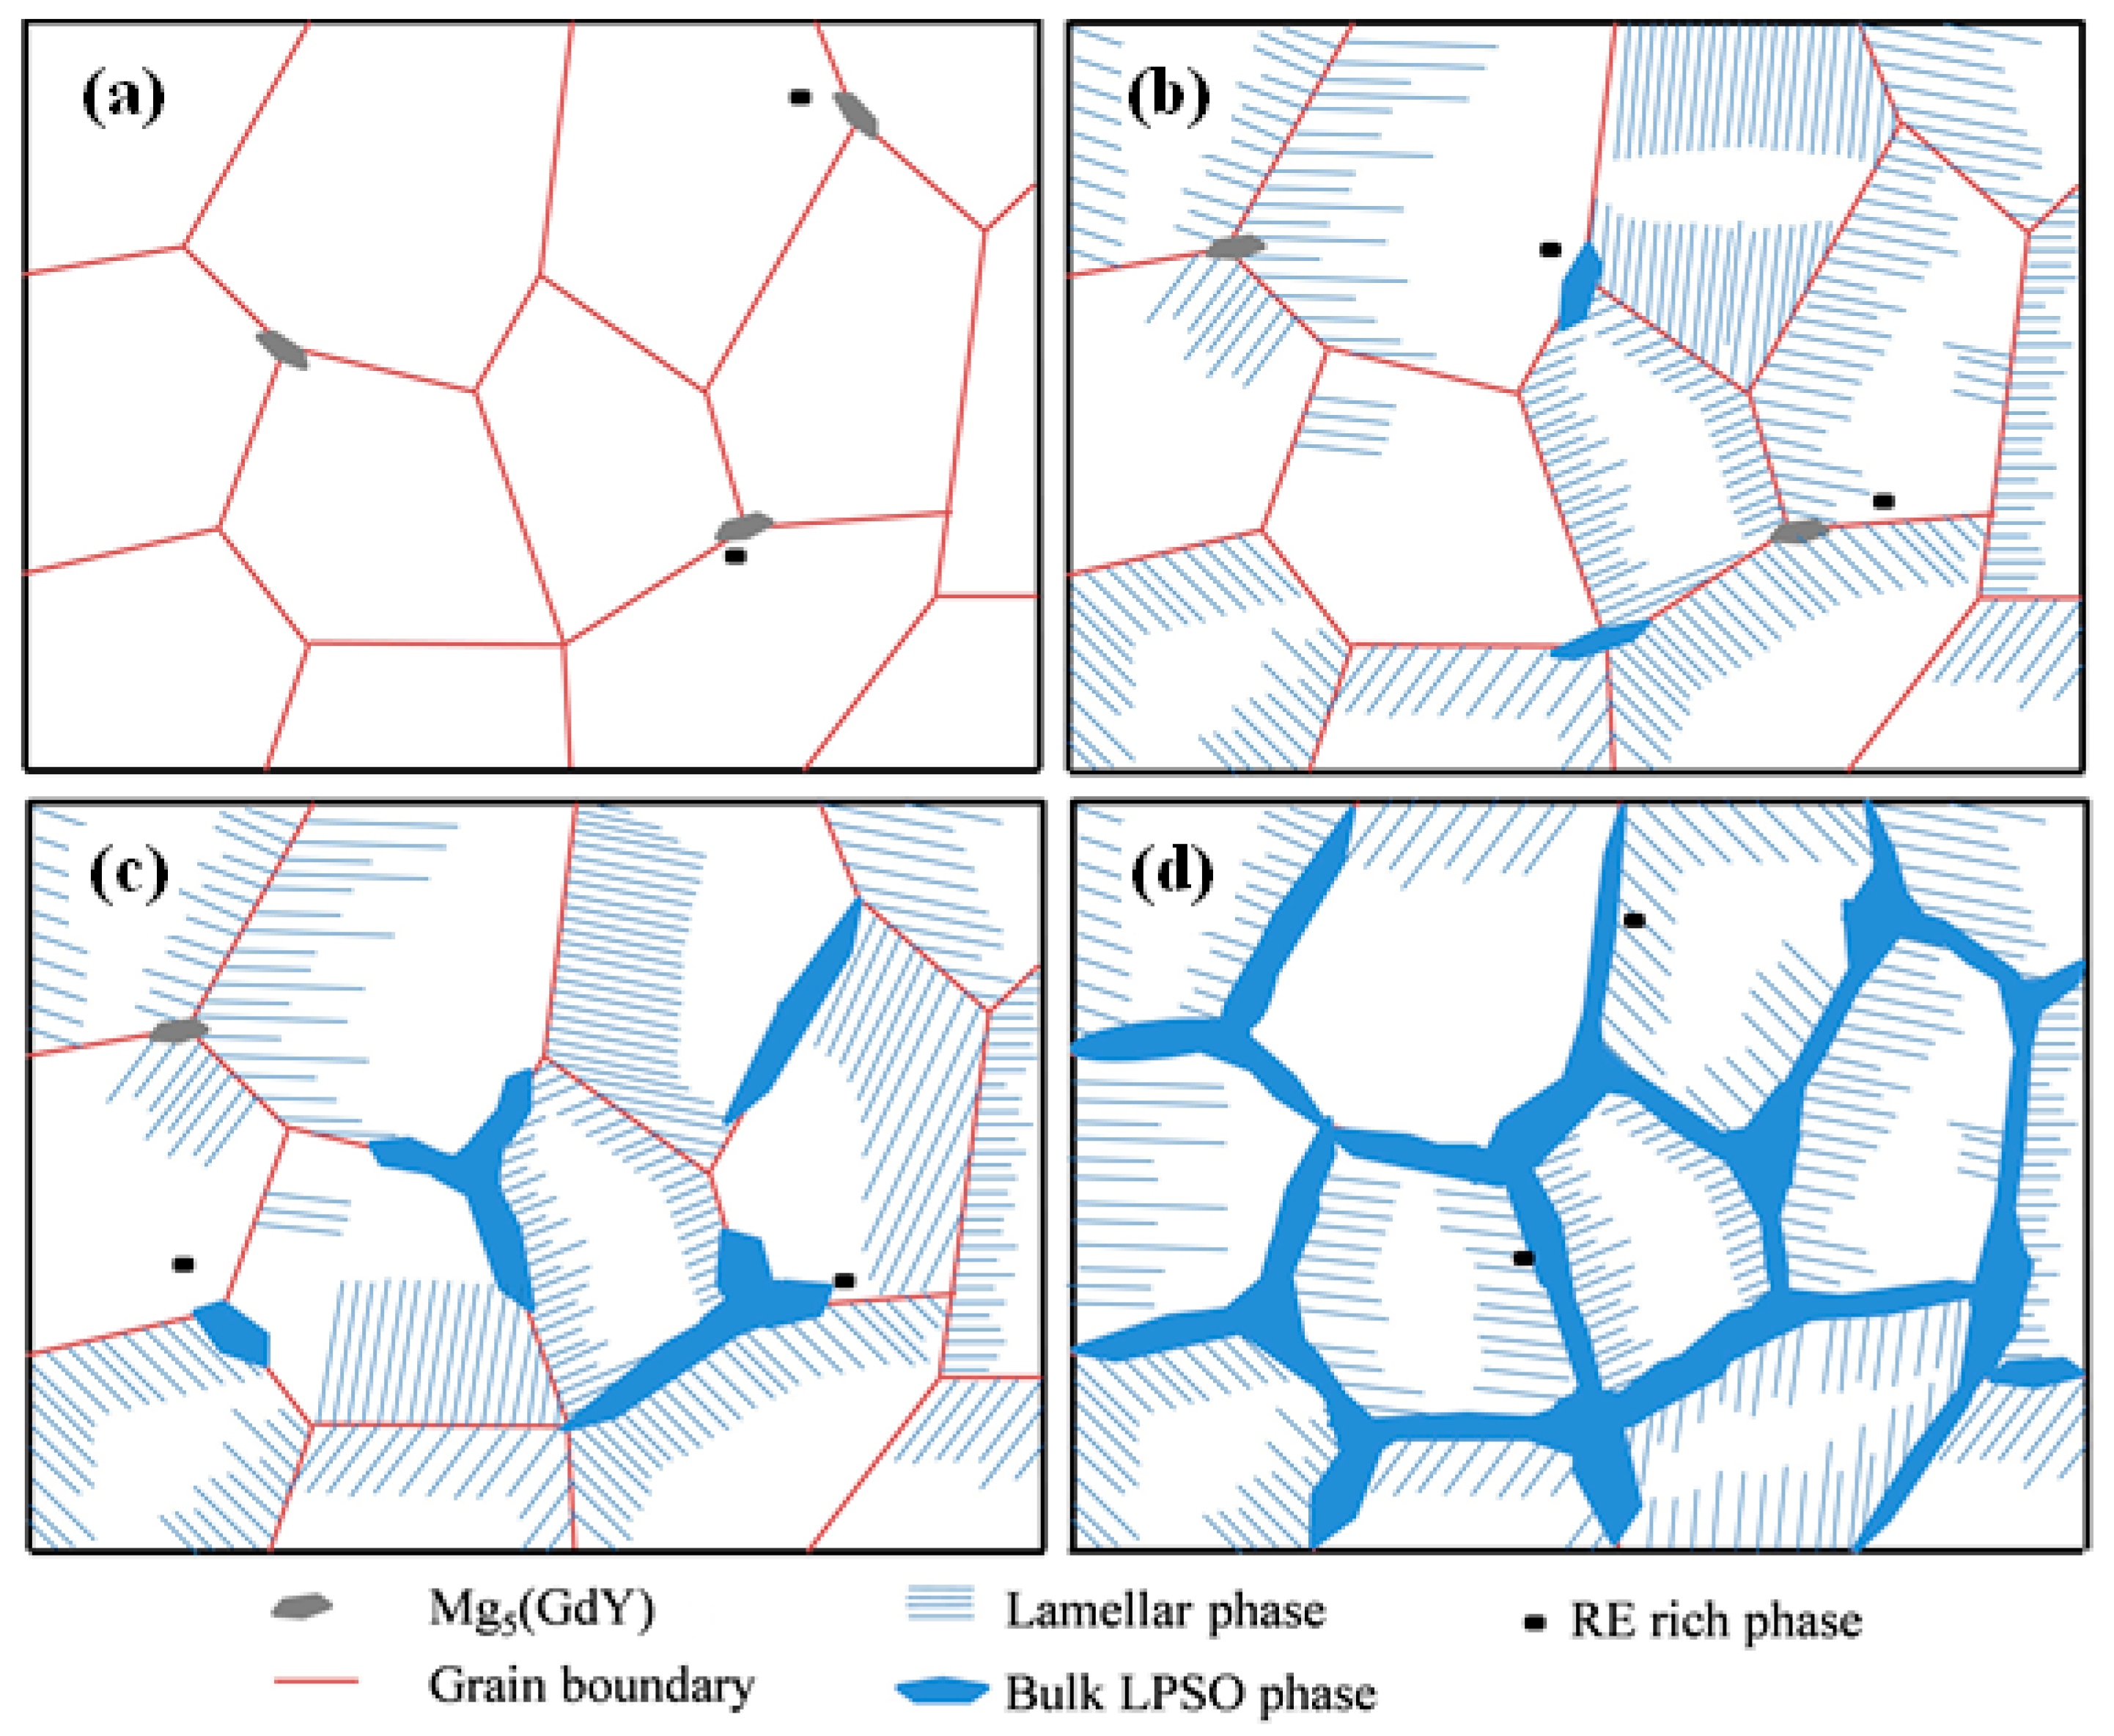
- An increase in Zn content resulted in a gradual refinement of the grain size; as the Zn content increased from 0.7 wt% to 3.3 wt%, the average grain size of alloy decreased from 60.3 to 46.6 µm. In addition, the volume fraction of the second phase gradually was increased.
- (2)
- The microstructure of the 0Zn alloy mainly consisted of an α-Mg matrix and the Mg5(GdY) phase; the microstructure of the 0.7Zn alloy mainly consisted of an α-Mg matrix, the Mg5(GdY) phase, and the LPSO phase. An increase in the Zn content resulted in a decrease in the Mg5(GdY) phase volume fraction and an increase in the LPSO phase volume fraction. The microstructure of the 3.3Zn alloy mainly consisted of an α-Mg matrix and the LPSO phase.
- (3)
- The alloy without any added Zn showed an optimal ultimate tensile strength and yield strength of 229 MPa and 185 MPa, respectively, while the alloy with 3.3 wt% Zn showed an excellent elongation of 4.5% after fracture.
- (4)
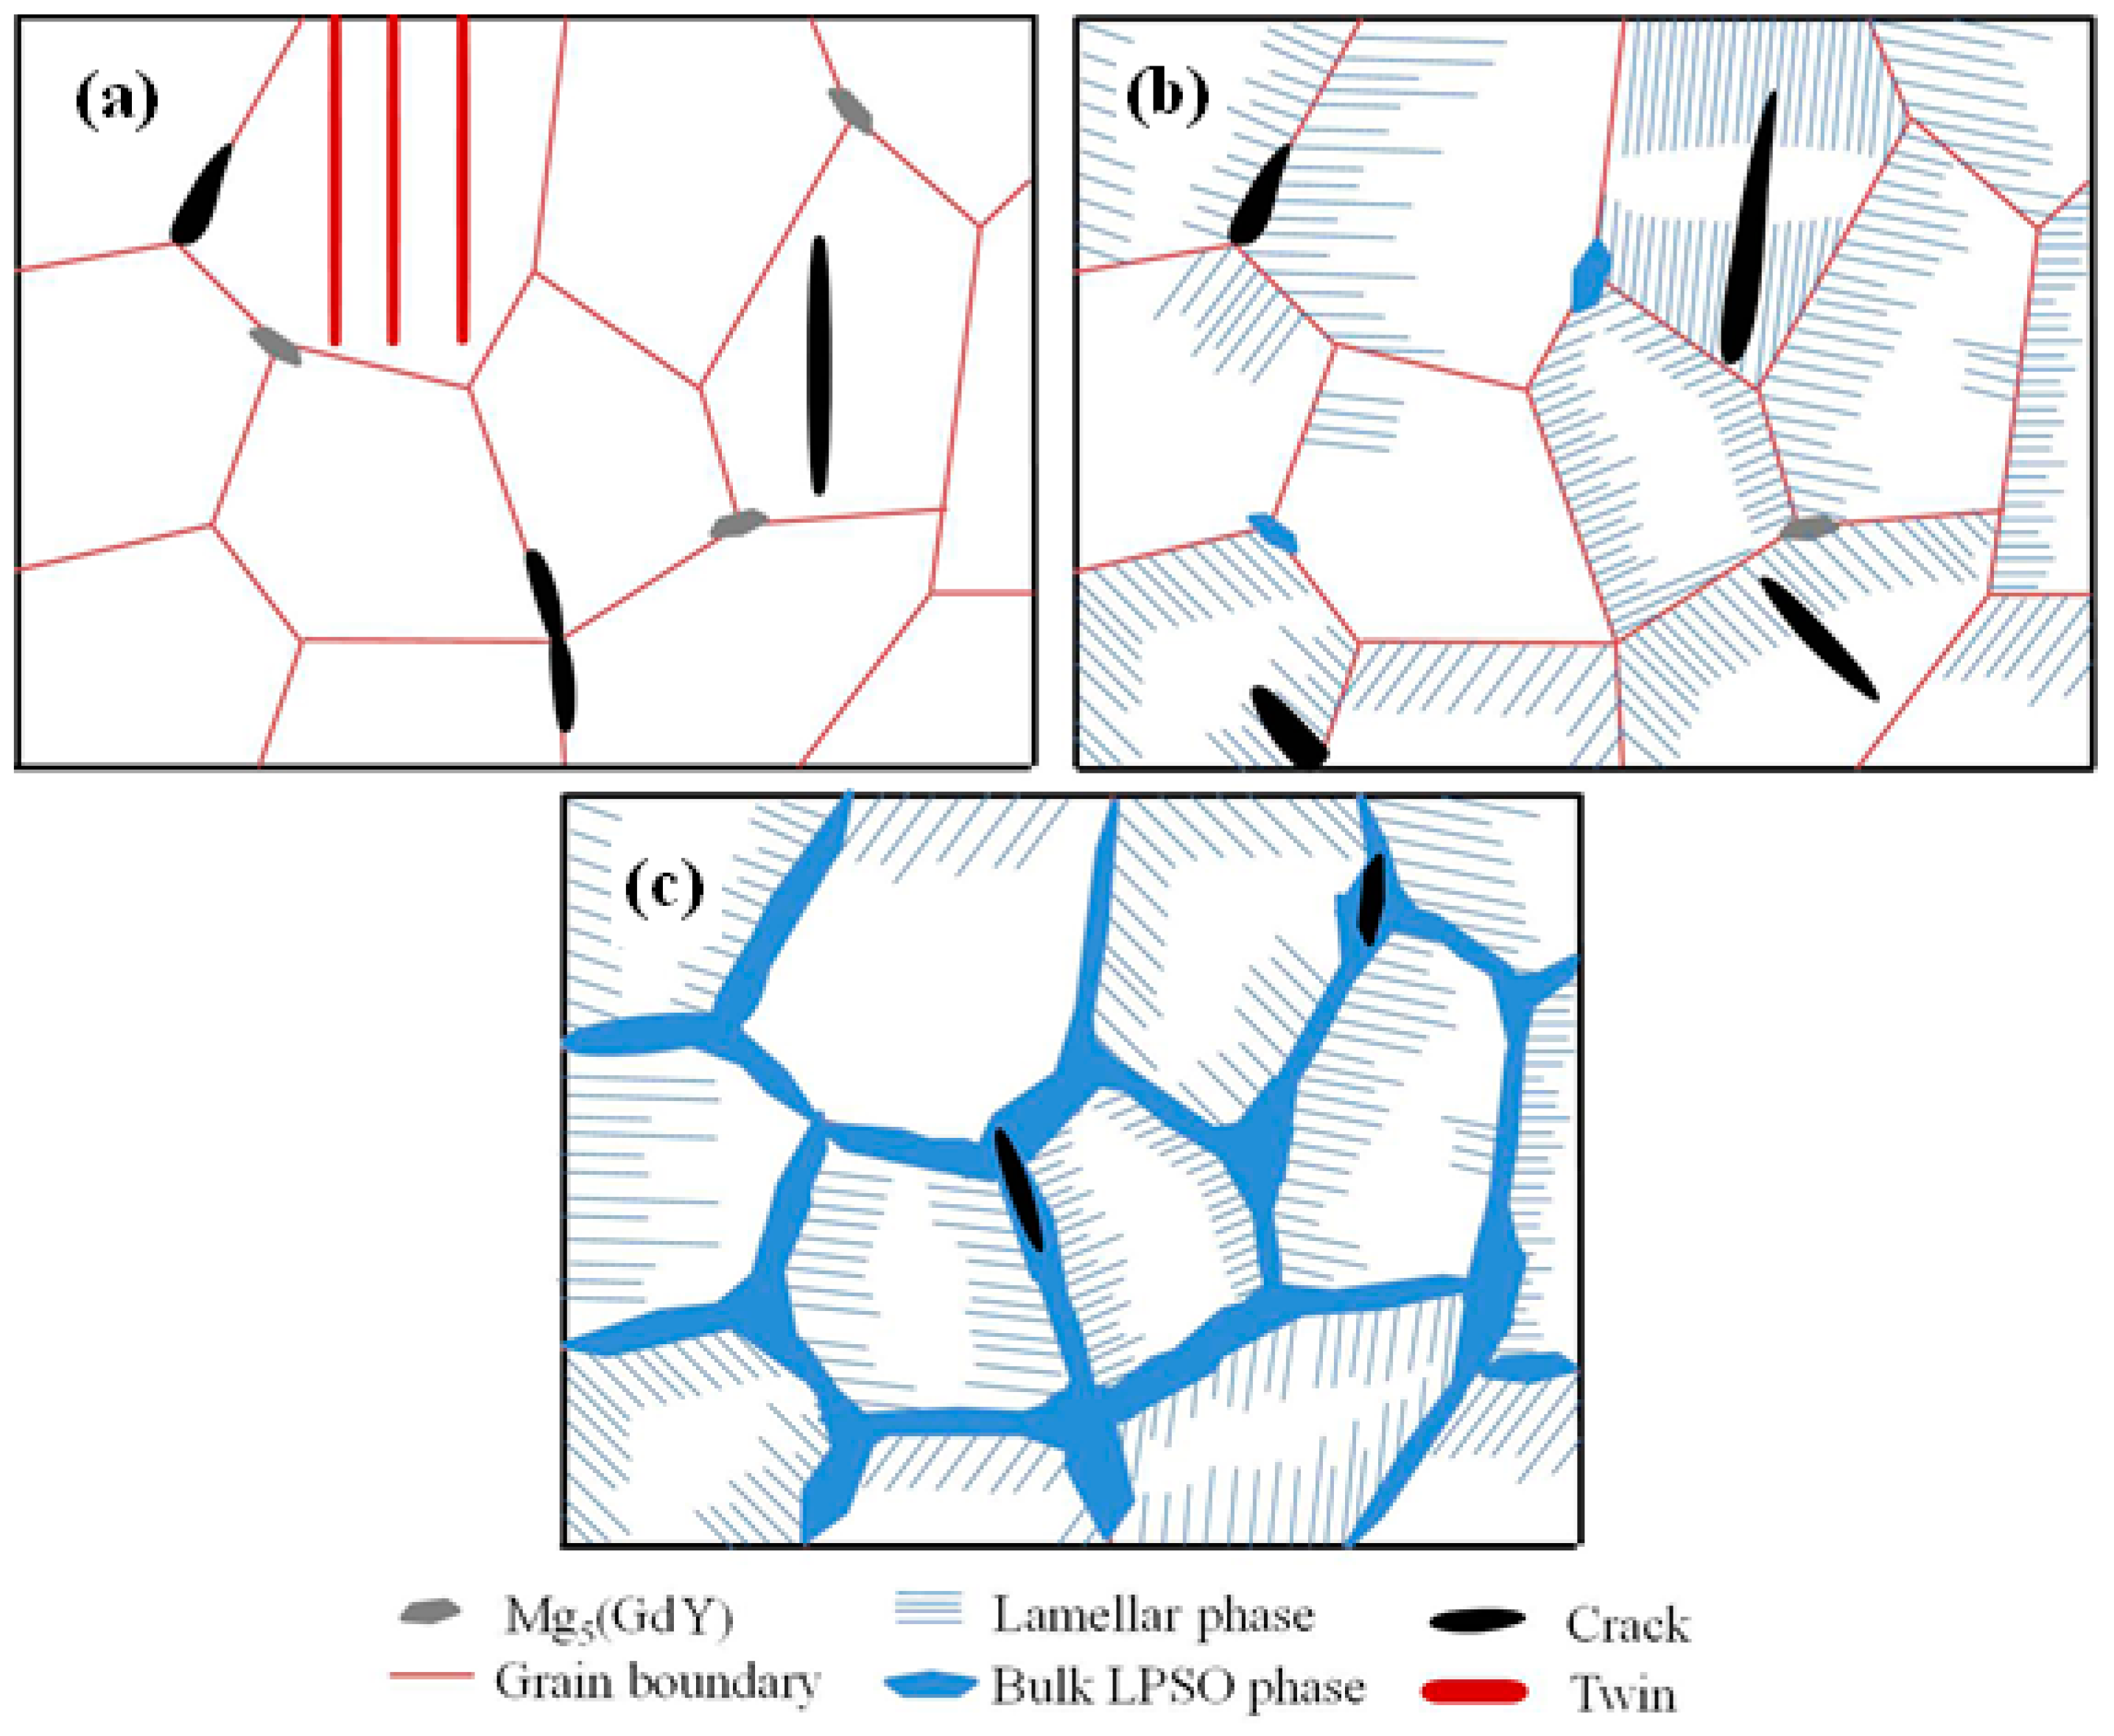
- Cracks in the 0Zn alloy mainly originated at the trigeminal junction of the grain boundary, whereas cracks in the 0.7Zn and 1.5Zn alloys mainly originated at the interface of the Mg/lamellar LPSO phase. In comparison, cracks in the 3.3Zn alloy mainly originated at the bulk LPSO phase at the grain boundary and then propagated along the bulk LPSO phase.
Author Contributions
Funding
Institutional Review Board Statement
Informed Consent Statement
Data Availability Statement
Conflicts of Interest
References
- Šašek, S.; Minárik, P.; Stráská, J.; Hosová, K.; Veselý, J.; Kubásek, J.; Král, R.; Krajňák, T.; Vojtěch, D. Novel Ultrafine-Grain Mg-Gd/Nd-Y-Ca Alloys with an Increased Ignition Temperature. Materials 2023, 16, 1299. [Google Scholar] [CrossRef] [PubMed]
- Li, B.B.; Zhang, K.; Shi, G.L.; Li, X.; Ma, M.; Yuan, J.; Wang, K. Abnormal creep behavior of Mg–12Gd–1MM–0.6Zr (wt.%) alloy at 300 °C. Mater. Lett. 2021, 295, 129861. [Google Scholar] [CrossRef]
- Xia, X.S.; Zhang, K.; Ma, M.L.; Li, T. Constitutive modeling of flow behavior and processing maps of Mg–8.1Gd–4.5Y–0.3Zr alloy. J. Magnes. Alloy. 2020, 8, 917–928. [Google Scholar] [CrossRef]
- Yu, H.-S.; Guo, X.-F.; Cui, H.-B. Microstructures and tensile properties of as-cast Mg-5Sn-1Si magnesium alloy modified with trace elements of Y, Bi, Sb and Sr. China Foundary 2021, 18, 9–17. [Google Scholar] [CrossRef]
- Najafi, S.; Mahmudi, R. Enhanced microstructural stability and mechanical properties of the Ag-containing Mg–Gd–Y alloys. J. Magnes. Alloy. 2020, 8, 1109–1119. [Google Scholar] [CrossRef]
- Li, M.; Wang, X.; Liu, Y.; Xiao, Z.; Huang, Y. Heterogeneous bimodal microstructure and its formation mechanism of Mg-Gd-Y-Zn-Zr alloy during isothermal compression. J. Alloys Compd. 2023, 947, 169523. [Google Scholar] [CrossRef]
- Shao, J.B.; Chen, Z.Y.; Chen, T.; Wang, R.K.; Liu, Y.L.; Liu, C.M. Texture evolution, deformation mechanism and mechanical properties of the hot rolled Mg-Gd-Y-Zn-Zr alloy containing LPSO phase. Mater. Sci. Eng. A 2018, 731, 479–486. [Google Scholar] [CrossRef]
- Joost, W.J.; Krajewski, P.E. Towards magnesium alloys for high-volume auto-motive applications. Scr. Mater. 2017, 128, 107–112. [Google Scholar] [CrossRef]
- Kula, A.; Jia, X.; Mishra, R.K.; Niewczas, M. Strain rate sensitivity of binary Mg–Gd and Mg–Y solid solutions. Int. J. Plast. 2022, 155, 103321. [Google Scholar] [CrossRef]
- Peng, Q.M.; Dong, H.W.; Tian, Y.J.; Zhang, H. Effect of backward extrusion on microstructure and mechanical properties of Mg–Gd based alloy. Mater. Sci. Eng. A 2012, 532, 443–448. [Google Scholar] [CrossRef]
- Xu, W.F.; Zhang, Y.; TerBush, J.R.; Peng, L.M.; Ding, W.J.; Nie, J.F. Effects of alloying elements on creep properties of Mg-Gd-Zr alloys. Metall. Mater. Trans. A 2014, 45, 4103–4116. [Google Scholar] [CrossRef]
- Xu, C.; Nakata, T.; Qiao, X.G.; Zheng, M.Y.; Wu, K.; Kamado, S. Effect of LPSO and SFs on microstructure evolution and mechanical properties of Mg–Gd–Y–Zn–Zr alloy. Sci. Rep. 2017, 7, 40846–40856. [Google Scholar] [CrossRef] [PubMed] [Green Version]
- Li, B.; Teng, B.G.; Chen, G.X. Microstructure evolution and mechanical properties of Mg-Gd-Y-Zn-Zr alloy during equal channel angular pressing. Mater. Sci. Eng. A 2019, 744, 396–405. [Google Scholar] [CrossRef]
- Homma, T.; Kunito, N.; Kamado, S. Fabrication of extraordinary high-strength magnesium alloy by hot extrusion. Scr. Mater. 2009, 61, 644–647. [Google Scholar] [CrossRef]
- Xu, C.; Zheng, M.Y.; Xu, S.W.; Wu, K.; Wang, E.D.; Kamado, S.; Wang, G.J.; Lv, X.Y. Ultra high-strength Mg–Gd–Y–Zn–Zr alloy sheets processed by large-strain hot rolling and ageing. Mater. Sci. Eng. A 2012, 547, 93–98. [Google Scholar] [CrossRef]
- Wang, K.; Wang, J.; Huang, S.; Gao, S.; Guo, S.; Liu, S.; Chen, X.; Pan, F. Enhanced mechanical properties of Mg–Gd–Y–Zn–Mn alloy by tailoring the morphology of long period stacking ordered phase. Mater. Sci. Eng. A 2018, 733, 267–275. [Google Scholar] [CrossRef]
- Meier, J.M.; Miao, J.S.; Liang, S.M.; Zhu, J.; Zhang, C.; Caris, J.; Luo, A.A. Phase equiliia and microstructure investigation of Mg-Gd-Y-Zn alloy system. J. Magnes. Alloy. 2022, 10, 689–696. [Google Scholar] [CrossRef]
- Yu, Z.; Xu, C.; Meng, J.; Zhang, X.; Kamado, S. Effect of pre–annealing on microstructure and mechanical properties of as-extruded Mg–Gd–Y–Zn–Zr alloy. J. Alloys Compd. 2017, 729, 627–637. [Google Scholar] [CrossRef]
- Li, D.J.; Zeng, X.Q.; Dong, J.; Zhai, C.Q.; Ding, W.J. Microstructure evolution of Mg–10Gd–3Y–1.2Zn–0.4Zr alloy during heat-treatment at 773 K. J. Alloys Compd. 2009, 468, 164–169. [Google Scholar] [CrossRef]
- Chen, D.J.; Zhang, K.; Li, T.; Li, X.G.; Li, Y.J.; Ma, M.L.; Shi, G.L.; Yuan, J.W. Weak strengthening effect of the precipitated lamellar phase in the homogenized Mg–8Gd–4Y–1.6Zn–0.5Zr (wt%) alloy followed by furnace cooling. Mater. Sci. Eng. A 2019, 744, 1–9. [Google Scholar] [CrossRef]
- Zhang, D.; Tan, Z.; Huo, Q.; Xiao, Z.; Fang, Z.; Yang, X. Dynamic recrystallization behaviors of Mg–Gd–Y–Zn–Zr alloy with different mor-phologies and distributions of LPSO phases. Mater. Sci. Eng. A 2018, 715, 389–403. [Google Scholar] [CrossRef]
- Liu, K.; Zhang, J.; Rokhlin, L.L.; Elkin, F.M.; Tang, D.; Meng, J. Microstructures and mechanical properties of extruded Mg–8Gd–0.4Zr alloys con-taining Zn. Mater. Sci. Eng. A 2009, 505, 13–19. [Google Scholar] [CrossRef]
- Yu, Z.; Xu, C.; Meng, J.; Liu, K.; Fu, J.; Kamado, S. Effects of extrusion ratio and temperature on the mechanical properties and microstructure of as-extruded Mg-Gd-Y-(Nd/Zn)-Zr alloys. Mater. Sci. Eng. A 2019, 762, 138080. [Google Scholar] [CrossRef]
- Datta, A.; Waghmare, U.V.; Ramamurty, U. Structure and stacking faults in layered Mg–Zn–Y alloys: A first-principles study. Acta Mater. 2008, 56, 2531–2539. [Google Scholar] [CrossRef]
- Zheng, J.; Chen, Z.; Yan, Z.; Zhang, Z.; Wang, Q.; Xue, Y. Preparation of ultra-high strength Mg-Gd-Y-Zn-Zr alloy by pre-ageing treatment prior to extrusion. J. Alloys Compd. 2022, 894, 162490. [Google Scholar] [CrossRef]


| Alloy | Gd | Y | Zn | Zr | Mg |
|---|---|---|---|---|---|
| 0Zn | 8.1 | 4.5 | 0.0 | 0.3 | Bal. |
| 0.7Zn | 8.5 | 4.5 | 0.7 | 0.4 | Bal. |
| 1.5Zn | 8.2 | 4.6 | 1.5 | 0.4 | Bal. |
| 3.3Zn | 8.2 | 4.5 | 3.3 | 0.4 | Bal. |
Disclaimer/Publisher’s Note: The statements, opinions and data contained in all publications are solely those of the individual author(s) and contributor(s) and not of MDPI and/or the editor(s). MDPI and/or the editor(s) disclaim responsibility for any injury to people or property resulting from any ideas, methods, instructions or products referred to in the content. |
© 2023 by the authors. Licensee MDPI, Basel, Switzerland. This article is an open access article distributed under the terms and conditions of the Creative Commons Attribution (CC BY) license (https://creativecommons.org/licenses/by/4.0/).
Share and Cite
Xia, X.; Yang, E. Effect of Zn Addition on the Microstructure, Mechanical Properties, and Fracture Behavior of As-Cast Mg-Gd-Y-Zr Alloys. Materials 2023, 16, 2720. https://doi.org/10.3390/ma16072720
Xia X, Yang E. Effect of Zn Addition on the Microstructure, Mechanical Properties, and Fracture Behavior of As-Cast Mg-Gd-Y-Zr Alloys. Materials. 2023; 16(7):2720. https://doi.org/10.3390/ma16072720
Chicago/Turabian StyleXia, Xiangsheng, and Echuan Yang. 2023. "Effect of Zn Addition on the Microstructure, Mechanical Properties, and Fracture Behavior of As-Cast Mg-Gd-Y-Zr Alloys" Materials 16, no. 7: 2720. https://doi.org/10.3390/ma16072720