
Modification of Anodic Titanium Oxide Bandgap Energy by Incorporation of Tungsten, Molybdenum, and Manganese In Situ during Anodization


Abstract
:
1. Introduction
2. Materials and Methods
3. Results and Discussion
3.1. Characterization of Electrolytes
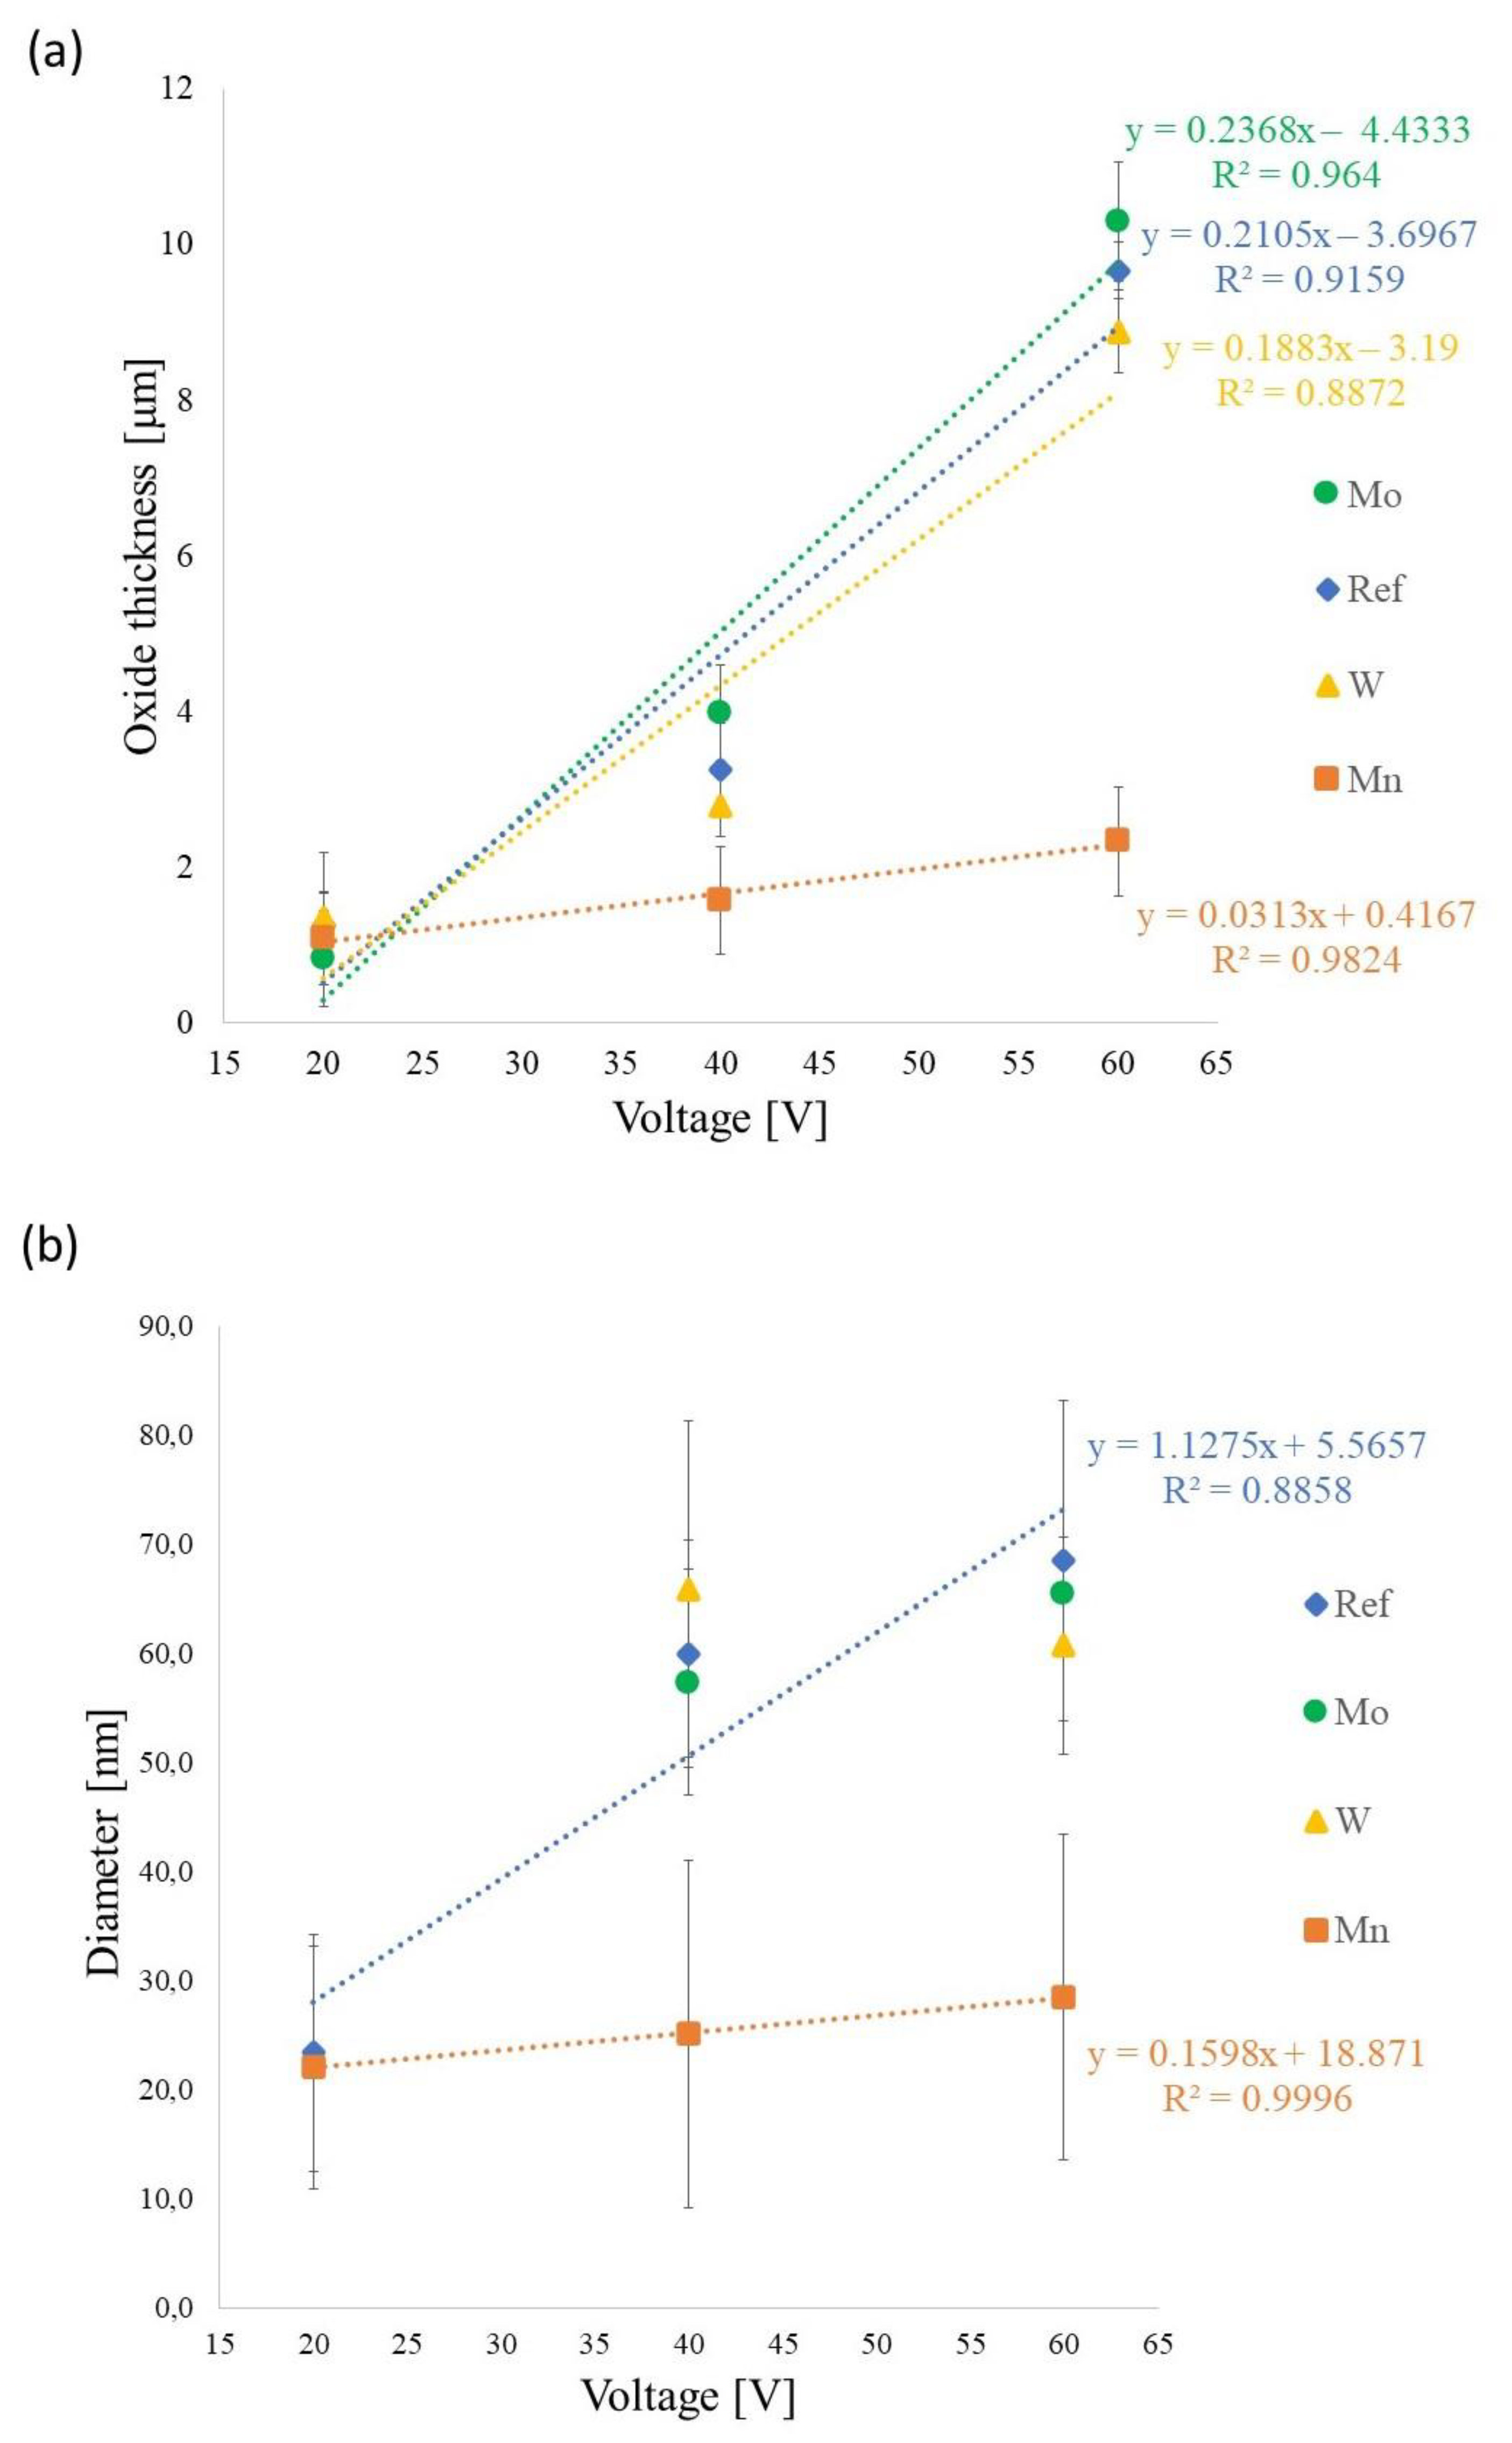
3.2. Characterization of Anodic Oxides
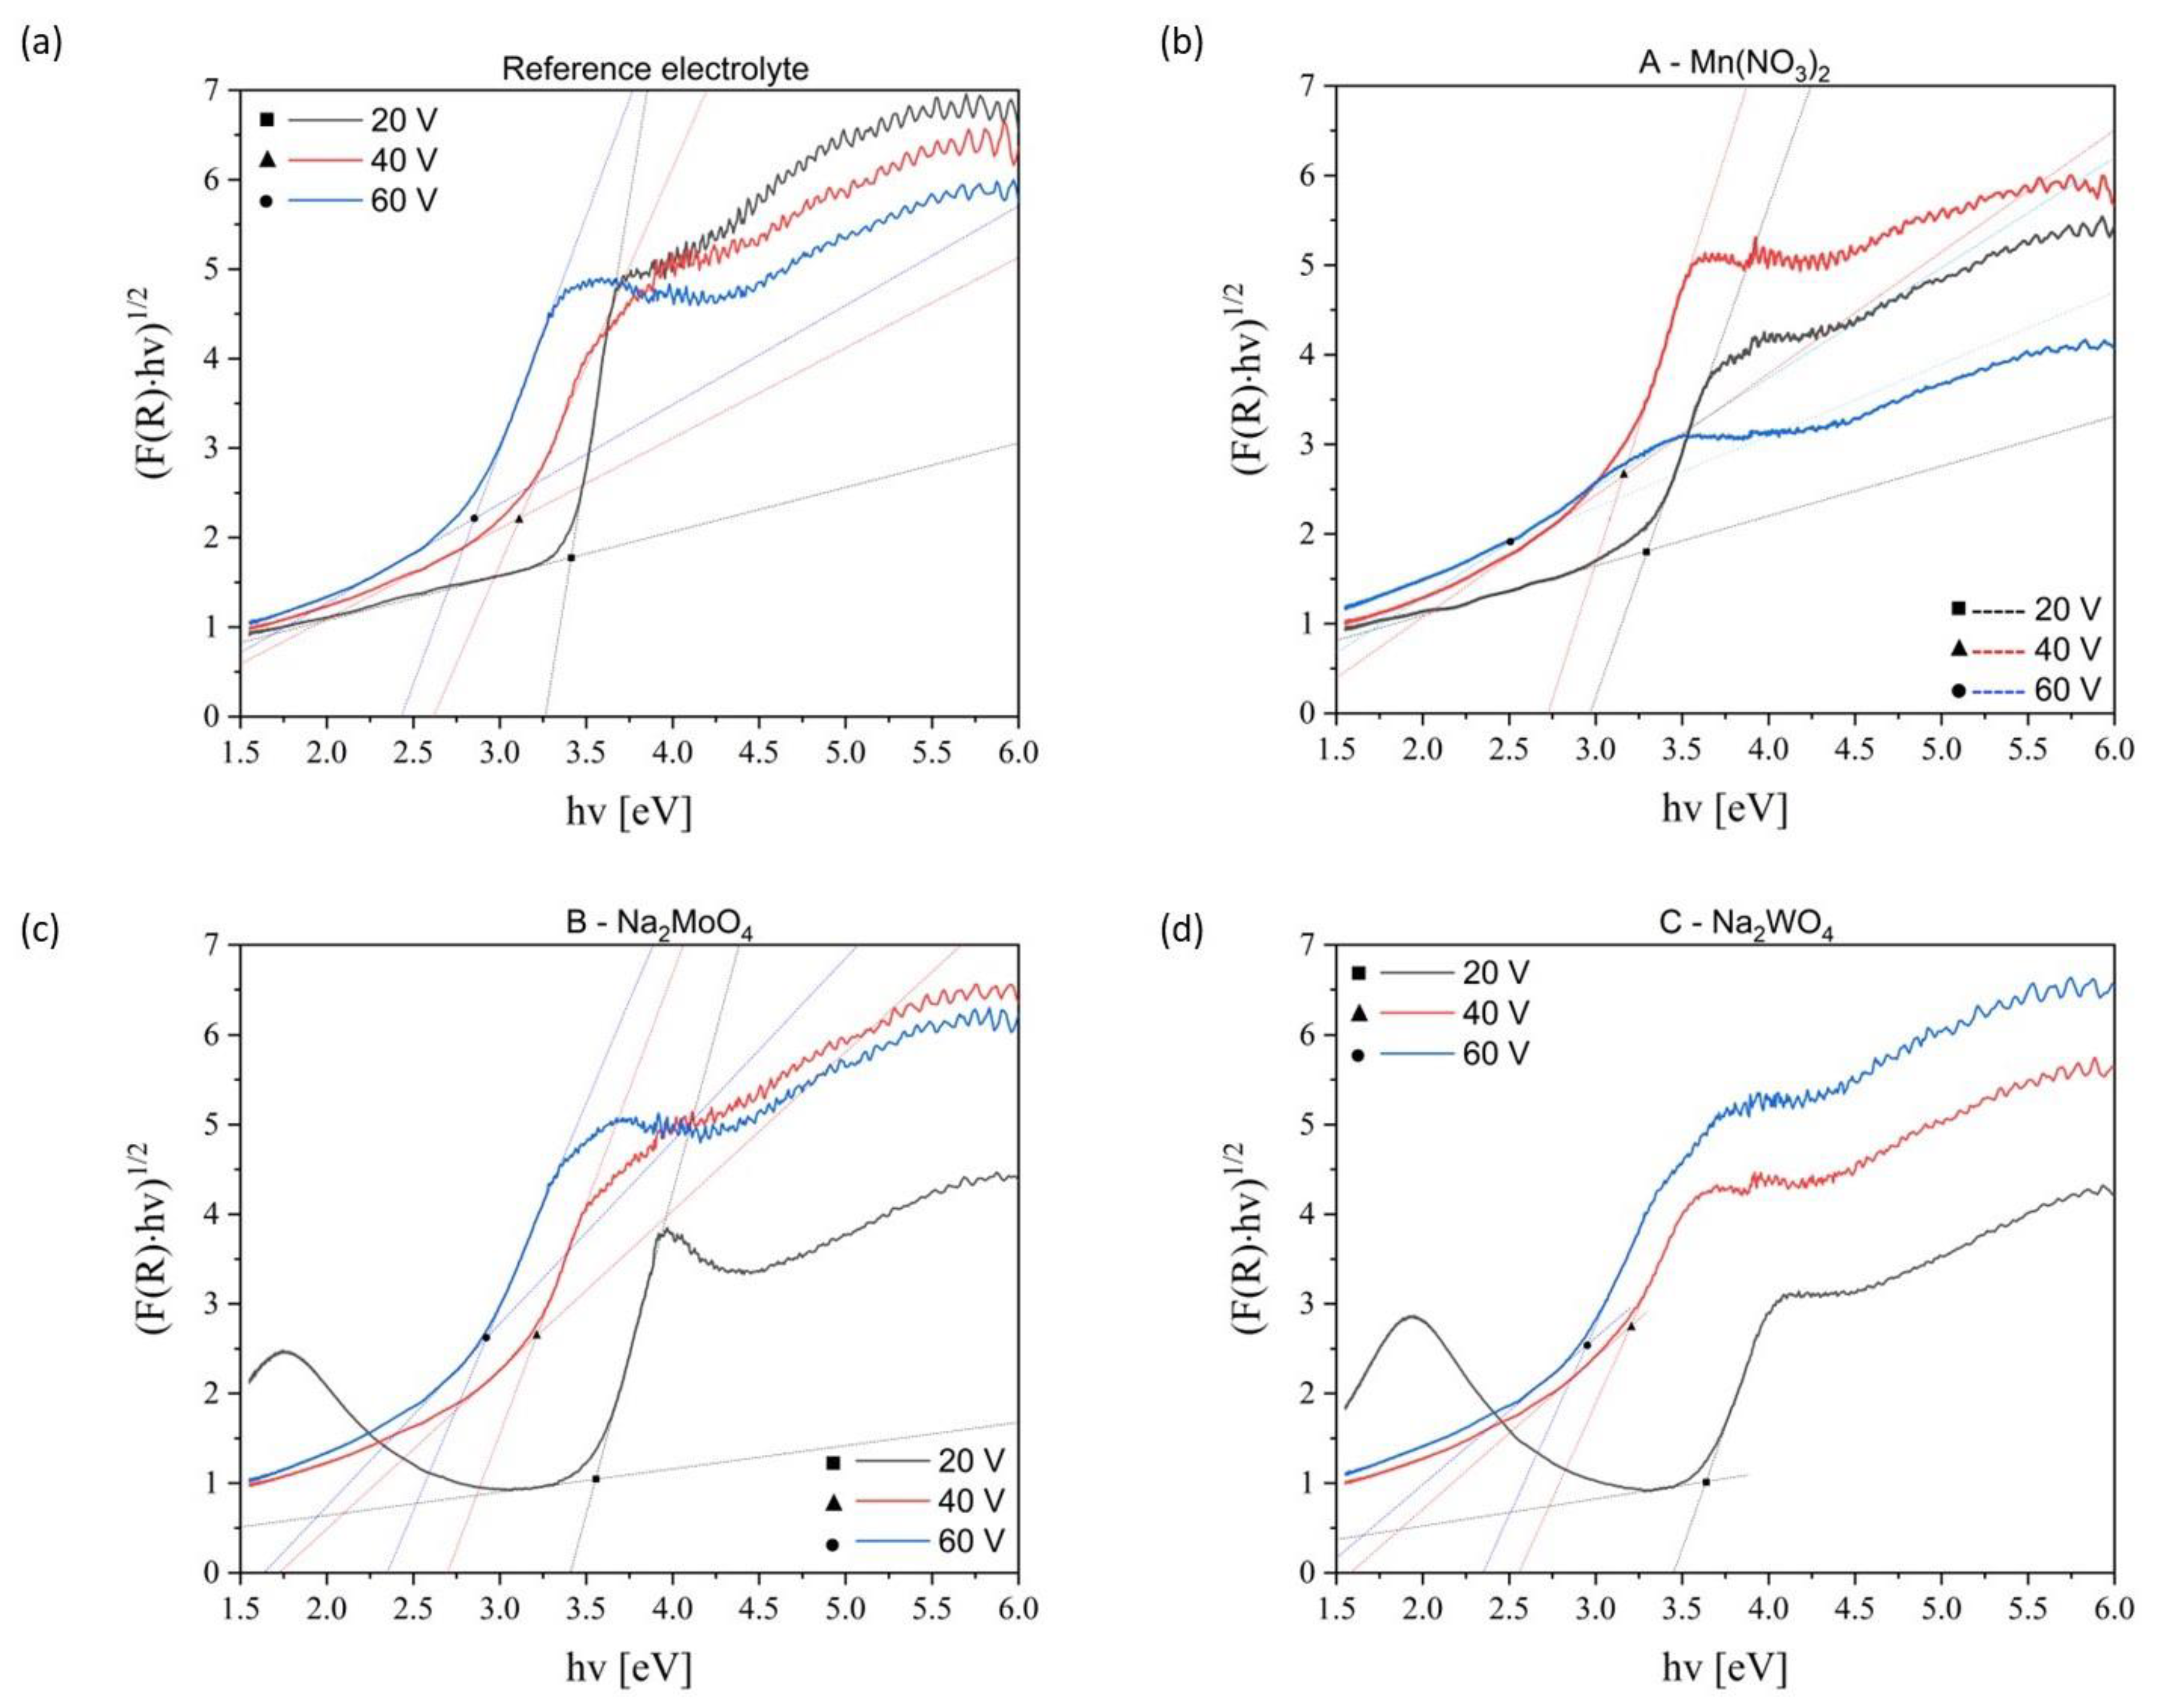
3.3. Bandgap Investigation
4. Conclusions
- (1)
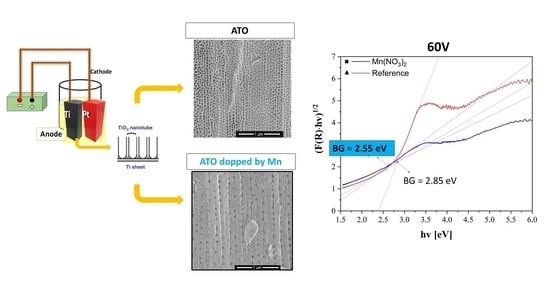
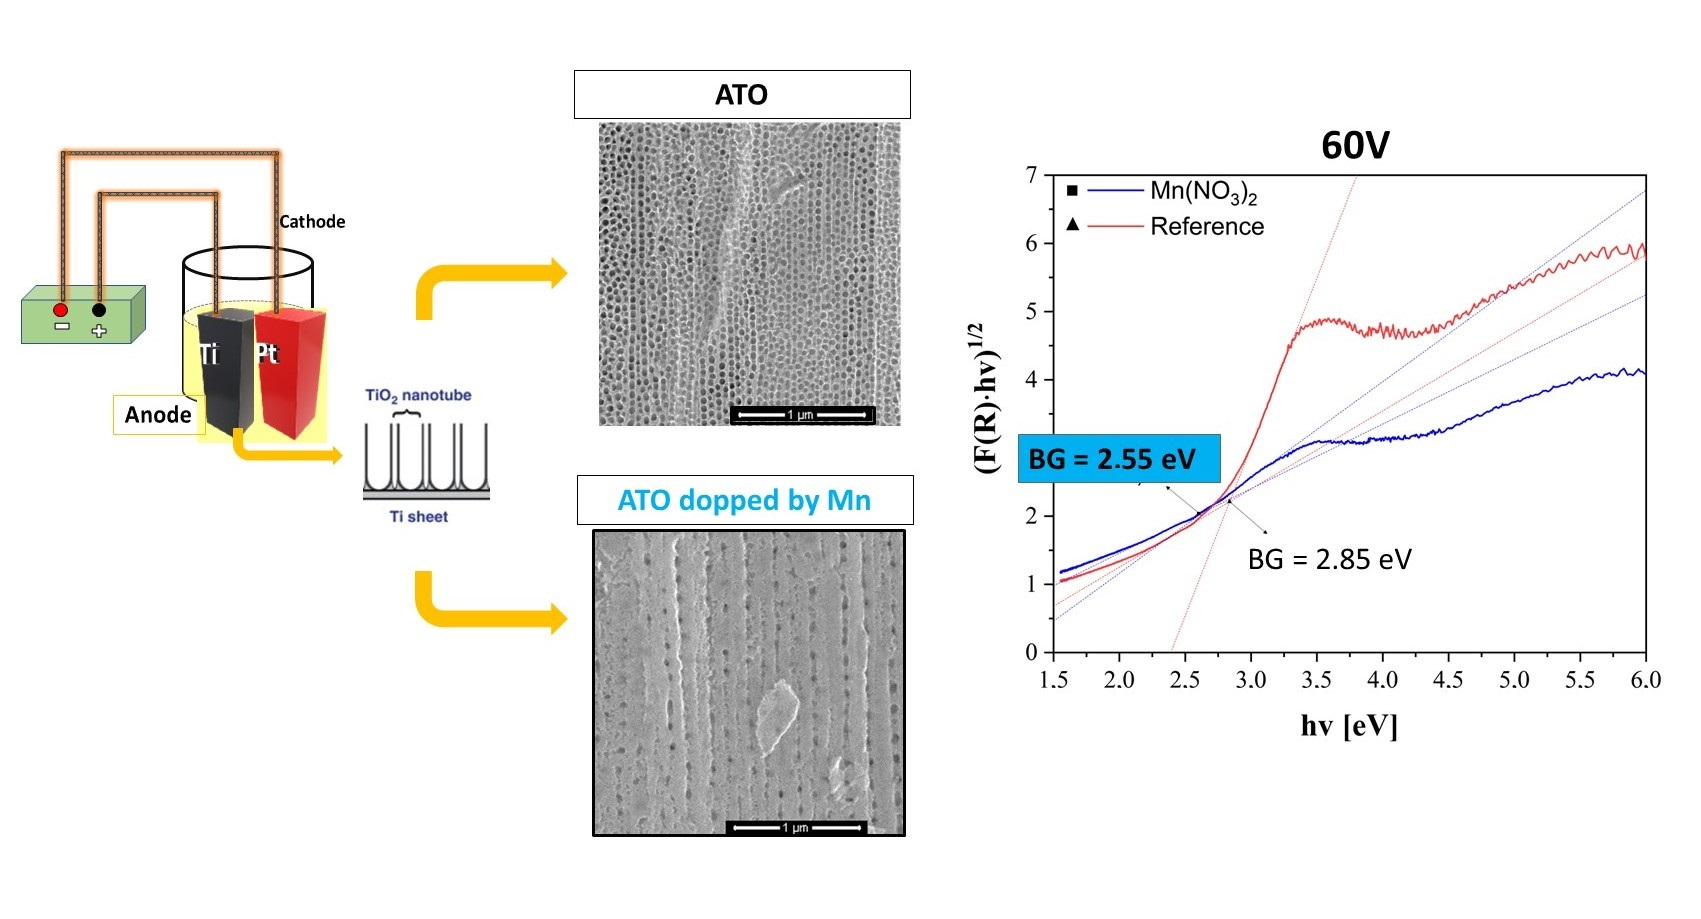
- Incorporation of Mn, Mo, and W into the anodic titanium oxide in situ during anodization was confirmed.
- (2)
- The incorporation of the selected elements changes the bandgap of the anodic titanium oxide. The BG level was similar between samples made in corresponding conditions in all electrolytes.
- (3)
- For all tested dopants, the BG values of samples prepared at voltages of 20 V and 40 V are in the UV region, while BG values of oxides made at 60 V are in the Vis region of sunlight.
- (4)
- The smallest bandgap value was obtained for anodic titanium oxide made at 60 V modified by manganese (Mn), at 2.55 eV, which corresponds to a wavelength of 486.89 nm from the Vis region of sunlight (blue color).
- (5)
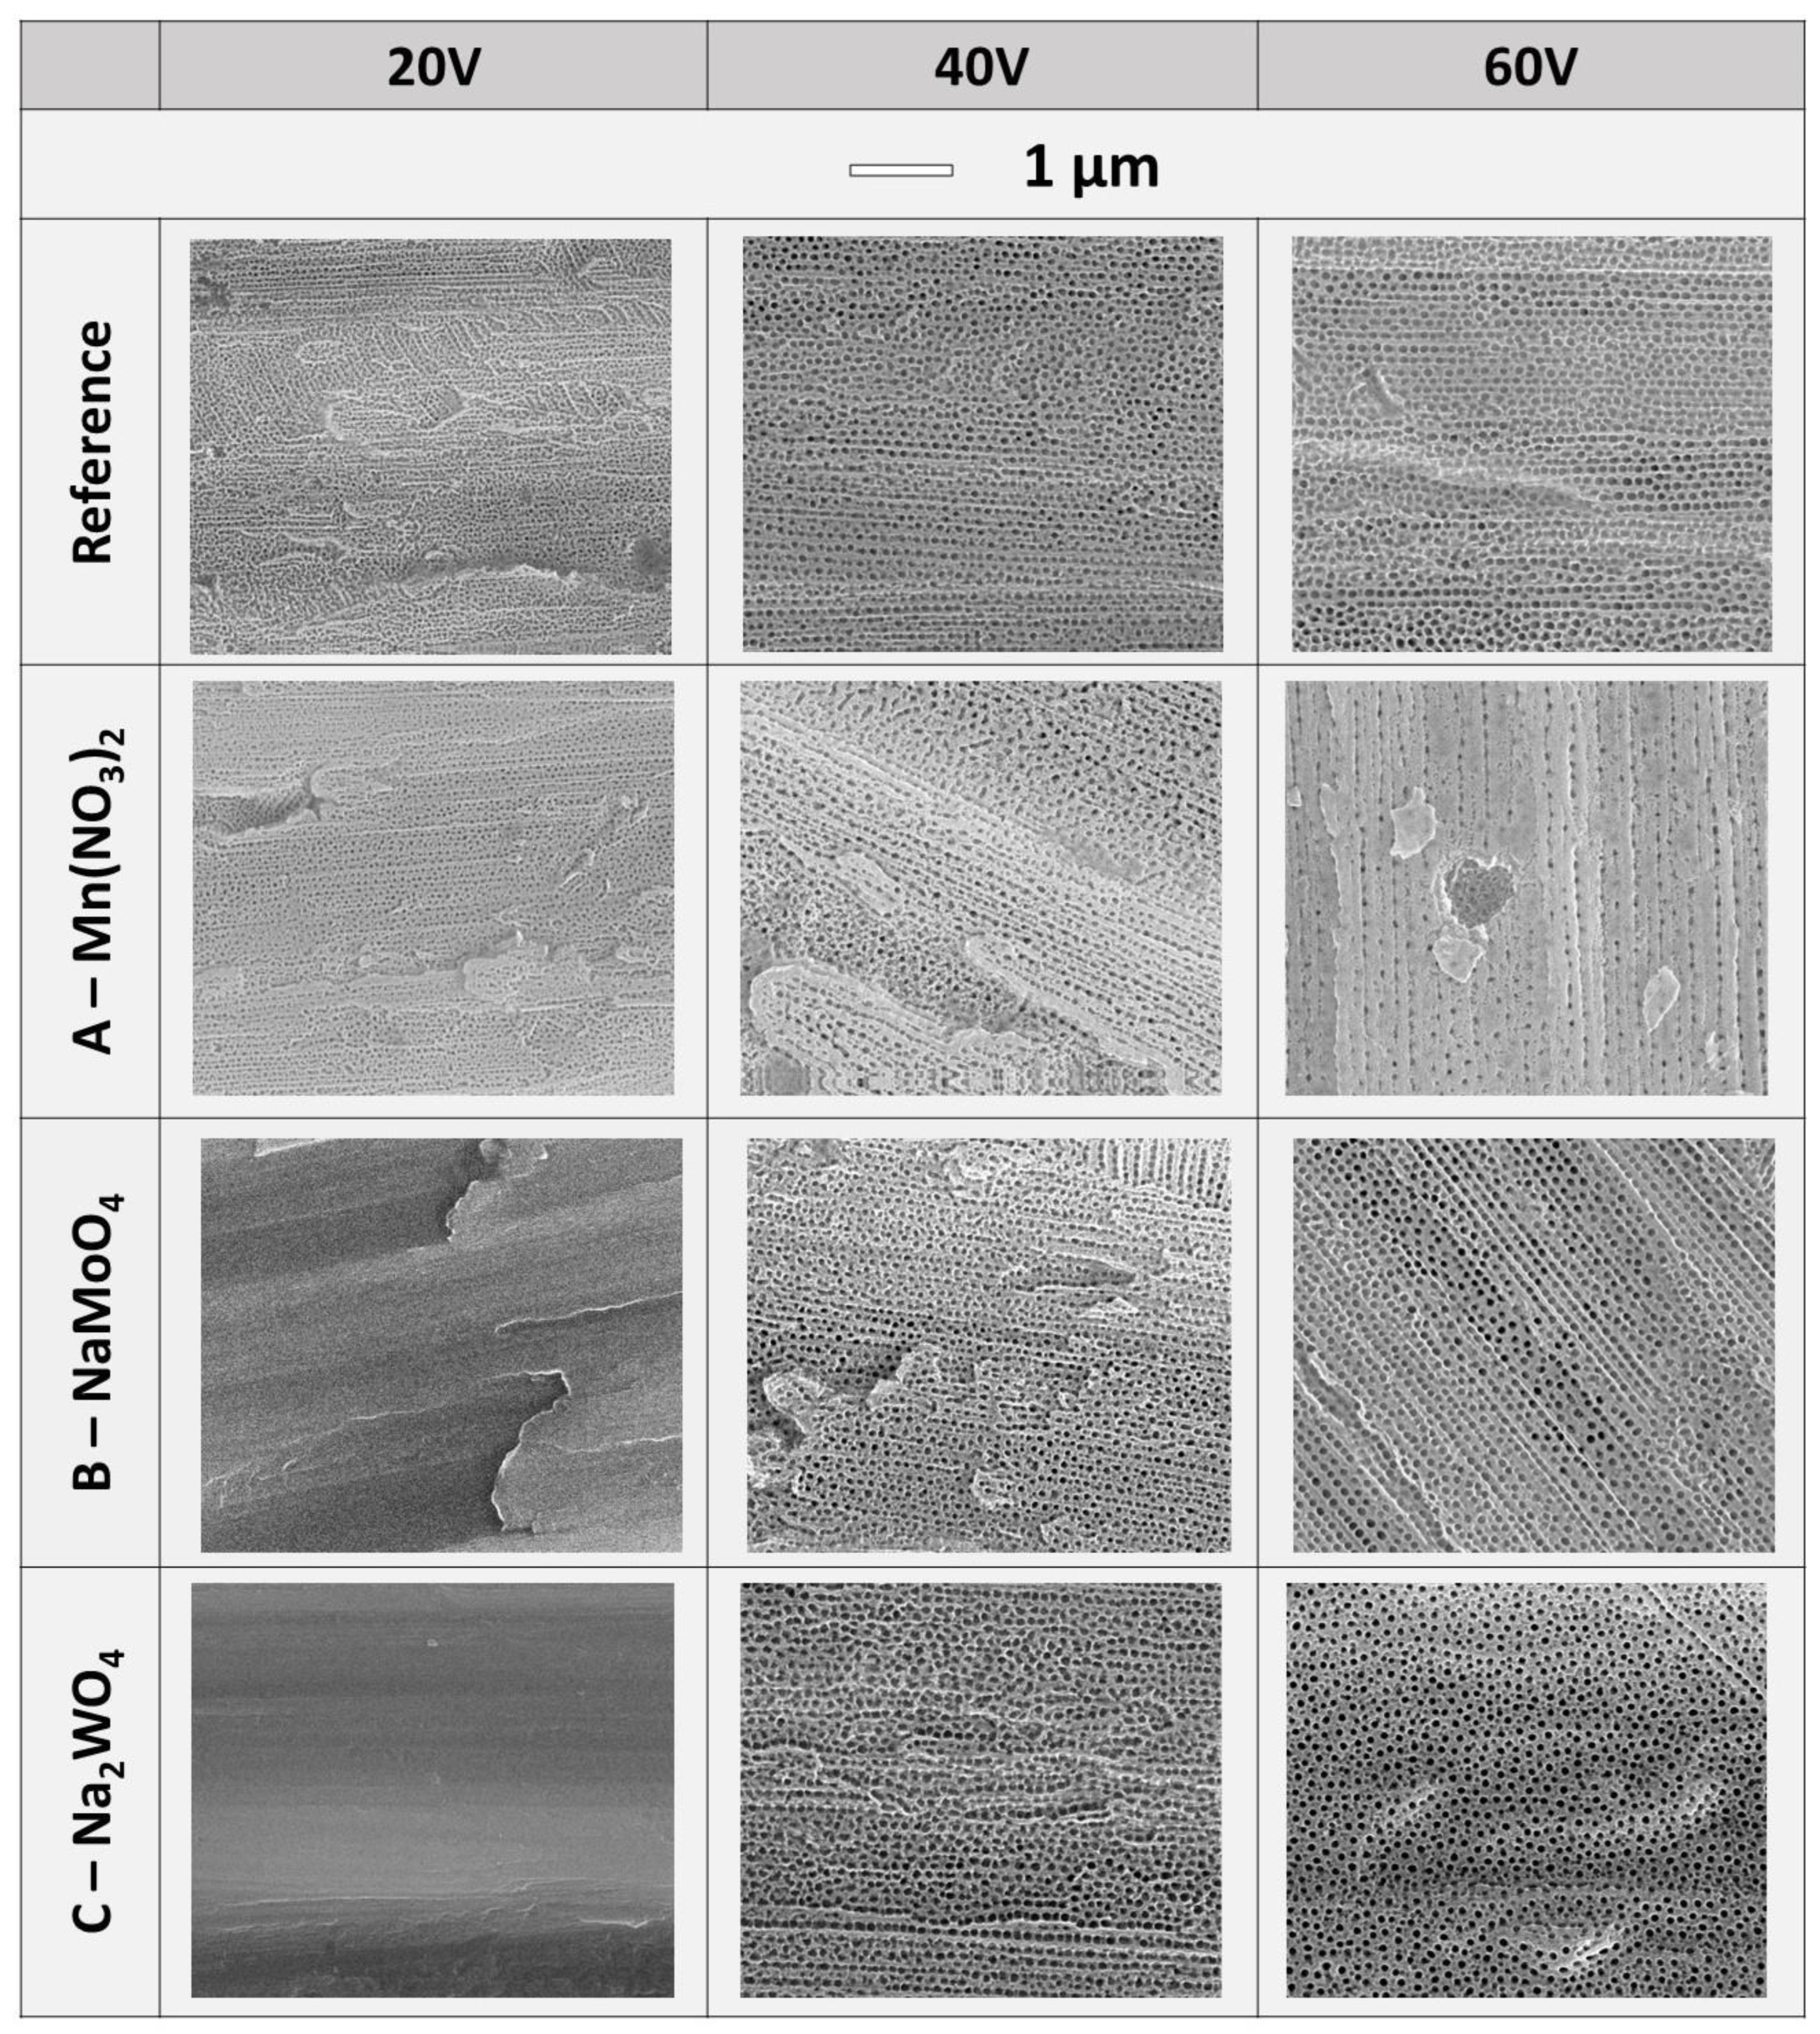
- The pH of the electrolyte solution significantly affects the growth of the anodic titanium oxide layer. In an electrolyte with neutral pH, it is possible to obtain the thickest oxide.
- (6)
- For the first time, barrier-type oxides made on a Ti surface at 20 V in electrolytes B—Na₂MoO₄ and C—Na₂WO₄, showing an extremely high content of nitrogen, are reported. The observed compositions of the oxides are similar to the compositions of coatings made in nitriding processes, but the anodization conditions during their preparation are significantly more gentle than during nitriding.
Author Contributions
Funding
Institutional Review Board Statement
Informed Consent Statement
Data Availability Statement
Conflicts of Interest
References
- Michalska-Domańska, M.; Dhoble, S.J. Quantum dots made with using of anodic aluminum oxide template: Fabrication and application. In Quantum Dots; Elsevier: Amsterdam, The Netherlands, 2023; pp. 215–233. [Google Scholar] [CrossRef]
- Akinci, Z.B.; Urgen, M. A Simple Method for the Production of AAO Templates for DC Electrodeposition of Nanostructures. ECS Electrochem. Lett. 2014, 3, D46–D49. [Google Scholar] [CrossRef]
- Negishi, N.; Takeuchi, K.; Ibusuki, T. Surface structure of the TiO2 thin film photocatalyst. J. Mater. Sci. 1998, 33, 5789–5794. [Google Scholar] [CrossRef]
- Sopha, H.; Krbal, M.; Ng, S.; Prikryl, J.; Zazpe, R.; Yam, F.K.; Macak, J.M. Highly efficient photoelectrochemical and photocatalytic anodic TiO2 nanotube layers with additional TiO2 coating. Appl. Mater. Today 2017, 9, 104–110. [Google Scholar] [CrossRef]
- Hanif, M.B.; Sihor, M.; Liapun, V.; Makarov, H.; Monfort, O.; Motola, M. Porous vs. Nanotubular Anodic TiO2: Does the Morphology Really Matters for the Photodegradation of Caffeine? Coatings 2022, 12, 1002. [Google Scholar] [CrossRef]
- Haring, A.; Morris, A.; Hu, M. Controlling morphological parameters of anodized titania nanotubes for optimized solar energy applications. Materials 2012, 5, 1890–1909. [Google Scholar] [CrossRef] [Green Version]
- Michalska-Domańska, M.; Nyga, P.; Czerwiński, M. Ethanol-based electrolyte for nanotubular anodic TiO2 formation. Corros. Sci. 2018, 134, 99–102. [Google Scholar] [CrossRef]
- Yoriya, S. Effect of inter-electrode spacing on electrolyte properties and morphologies of anodic TiO2 nanotube array films. Int. J. Electrochem. Sci. 2012, 7, 9454–9464. [Google Scholar]
- Macak, J.M.; Tsuchiya, H.; Taveira, L.; Aldabergerova, S.; Schmuki, P. Smooth Anodic TiO2 Nanotubes. Angew. Chem. Int. Ed. 2005, 44, 7463–7465. [Google Scholar] [CrossRef]
- Macak, J.M.; Schmuki, P. Anodic growth of self-organized anodic TiO2 nanotubes in viscous electrolytes. Electrochim. Acta 2006, 52, 1258–1264. [Google Scholar] [CrossRef]
- Regonini, D.; Bowen, C.R.; Jaroenworaluck, A.; Stevens, R. A review of growth mechanism, structure and crystallinity of anodized TiO2 nanotubes. Mater. Sci. Eng. R Rep. 2013, 74, 377–406. [Google Scholar] [CrossRef] [Green Version]
- Fan, R.; Wan, J. Electrode distance regulates the anodic growth of titanium dioxide (TiO2) nanotubes. Nanotechnology 2017, 28, 25LT01. [Google Scholar] [CrossRef] [Green Version]
- Michalska-Domańska, M.; Stępniowski, W.J.; Salerno, M. Effect of inter-electrode separation in the fabrication of nanoporous alumina by anodization. J. Electroanal. Chem. 2018, 823, 47–53. [Google Scholar] [CrossRef]
- Syrek, K.; Kapusta-Kołodziej, J.; Jarosz, M.; Sulka, G.D. Effect of electrolyte agitation on anodic titanium dioxide (ATO) growth and its photoelectrochemical properties. Electrochim. Acta 2015, 180, 801–810. [Google Scholar] [CrossRef]
- Gulati, K.; Martinez, R.D.O.; Czerwiński, M.; Michalska-Domańska, M. Understanding the influence of electrolyte aging in electrochemical anodization of titanium. Adv. Colloid Interface Sci. 2022, 302, 102615. [Google Scholar] [CrossRef]
- Jarosz, M.; Pawlik, A.; Kapusta-Kołodziej, J.; Jaskuła, M.; Sulka, G.D. Effect of the previous usage of electrolyte on growth of anodic titanium dioxide (ATO) in a glycerol-based electrolyte. Electrochim. Acta 2014, 136, 412–421. [Google Scholar] [CrossRef]
- Munirathinam, B.; Neelakantan, L. Role of crystallinity on the nanomechanical and electrochemical properties of TiO2 nanotubes. J. Electroanal. Chem. 2016, 770, 73–83. [Google Scholar] [CrossRef]
- Rojviroon, T.; Rojviroon, O.; Sirivithayapakorn, S.; Angthong, S. Application of TiO2 nanotubes as photocatalysts for decolorization of synthetic dye wastewater. Water Resour. Ind. 2021, 26, 100163. [Google Scholar] [CrossRef]
- Smith, Y.R.; Ray, R.S.; Carlson, K.; Sarma, B.; Misra, M. Self-Ordered titanium dioxide nanotube arrays: Anodic synthesis and their photo/electro-catalytic applications. Materials 2013, 6, 2892–2957. [Google Scholar] [CrossRef]
- Chahrour, K.M.; Yam, F.K.; Samuel, J.J.; Abdalrheem, R.; Beh, K.P.; Lim, H.S. Controlled synthesis of vertically aligned honeycomb TiO2 nanotube arrays: Effect of high-temperature annealing on physical properties. Appl. Phys. A 2019, 125, 440. [Google Scholar] [CrossRef]
- Mizukoshi, Y.; Ohtsu, N.; Masahashi, N. Structural and characteristic variation of anodic oxide on pure Ti with anodization duration. Appl. Surf. Sci. 2013, 283, 1018–1023. [Google Scholar] [CrossRef]
- Masahashi, N.; Mizukoshi, Y.; Semboshi, S.; Ohtsu, N. Enhanced photocatalytic activity of rutile TiO2 prepared by anodic oxidation in a high concentration sulfuric acid electrolyte. Appl. Catal. B Environ. 2009, 90, 255–261. [Google Scholar] [CrossRef]
- Taib, M.A.A.; Kawamura, G.; Matsuda, A.; Jaafar, M.; Razak, K.A.; Lockman, Z. Synthesis of TiO2 Nanotube Arrays in NaOH Added Ethylene Glycol Electrolyte and the Effect of Annealing Temperature on the Nanotube Arrays to their Photocurrent Performance. Key Eng. Mater. 2016, 701, 28–32. [Google Scholar] [CrossRef]
- Zeenat; Javed, S.M.; Ahmad, Z.; Ahmed, S.; Iqbal, S.; Naqvi, I.J.; Usman, M.; Ashiq, M.N.; Elnaggar, A.Y.; El-Bahy, Z.M. Highly dispersed active sites of Ni nanoparticles onto hierarchical reduced graphene oxide architecture towards efficient water oxidation. Fuel 2022, 312, 122926. [Google Scholar] [CrossRef]
- Kuang, C.; Tan, P.; Javed, M.; Khushi, H.H.; Nadeem, S.; Iqbal, S.; Alshammari, F.H.; Alqahtani, M.D.; Alsaab, H.O.; Awwad, N.S.; et al. Boosting photocatalytic interaction of sulphur doped reduced graphene oxide-based S@rGO/NiS2 nanocomposite for destruction of pathogens and organic pollutant degradation caused by visible light. Inorg. Chem. Commun. 2022, 141, 109575. [Google Scholar] [CrossRef]
- Atkins, P.; de Paula, J.; Keeler, J. Physical Chemistry, 11th ed.; Oxford University Press: Oxford, UK, 2017. [Google Scholar]
- Zaraska, L.; Gawlak, K.; Wiercigroch, E.; Malek, K.; Kozieł, M.; Andrzejczuk, M.; Marzec, M.M.; Jarosz, M. The effect of anodizing potential and annealing conditions on the morphology, composition and photoelectrochemical activity of porous anodic tin oxide films. Electrochim. Acta 2019, 319, 18–30. [Google Scholar] [CrossRef]
- Leary, R.; Westwood, A. Carbonaceous nanomaterials for the enhancement of TiO2 photocatalysis. Carbon N. Y. 2011, 49, 741–772. [Google Scholar] [CrossRef]
- Jain, A.; Vaya, D. Photocatalytic Activity of TiO2 Nanomaterial. J. Chil. Chem. Soc. 2017, 62, 3683–3690. [Google Scholar] [CrossRef] [Green Version]
- Naldoni, A.; Altomare, M.; Zoppellaro, G.; Liu, N.; Kment, Š.; Zbořil, R.; Schmuki, P. Photocatalysis with Reduced TiO2: From Black TiO2 to Cocatalyst-Free Hydrogen Production. ACS Catal. 2019, 9, 345–364. [Google Scholar] [CrossRef] [Green Version]
- Hua, Z.; Dai, Z.; Bai, X.; Ye, Z.; Gu, H.; Huang, X. A facile one-step electrochemical strategy of doping iron, nitrogen, and fluorine into titania nanotube arrays with enhanced visible light photoactivity. J. Hazard. Mater. 2015, 293, 112–121. [Google Scholar] [CrossRef]
- Luo, J.; Ma, Y.; Wang, H.; Chen, J. Preparation of polypyrrole sensitized TiO2 nanotube arrays hybrids for efficient photoelectrochemical water splitting. Electrochim. Acta 2015, 167, 119–125. [Google Scholar] [CrossRef]
- Wang, J.; Liu, K.; Zhang, B.; Qiu, Y.; Xiang, Y.; Lin, W.; Yang, B.; Li, B.; Ma, G. Doping rh into TiO2 as a visible-light-responsive photocatalyst: The difference between rutile and anatase. Appl. Phys. Lett. 2021, 119, 213901. [Google Scholar] [CrossRef]
- Michalska-Domańska, M.; Łazińska, M.; Łukasiewicz, J.; Mol, J.M.C.; Durejko, T. Self-Organized Anodic Oxides on Titanium Alloys Prepared from Glycol- and Glycerol-Based Electrolytes. Materials 2020, 13, 4743. [Google Scholar] [CrossRef]
- Michalska-Domańska, M.; Czerwiński, M.; Łazińska, M.; Dubey, V.; Jakubaszek, M.; Zawadzki, Z.; Kostecki, J. Morphological and Optical Characterization of Colored Nanotubular Anodic Titanium Oxide Made in an Ethanol-Based Electrolyte. Materials 2021, 14, 6992. [Google Scholar] [CrossRef]
- Stȩpniowski, W.J.; Norek, M.; Michalska-Domańska, M.; Nowak-Stępniowska, A.; Bombalska, A.; Włodarski, M.; Bojar, Z. Incorporation of copper chelate ions into anodic alumina walls. Mater. Lett. 2013, 106, 242–245. [Google Scholar] [CrossRef]
- Stępniowski, W.J.; Norek, M.; Michalska-Domańska, M.; Bombalska, A.; Nowak-Stępniowska, A.; Kwaśny, M.; Bojar, Z. Fabrication of anodic aluminum oxide with incorporated chromate ions. Appl. Surf. Sci. 2012, 259, 324–330. [Google Scholar] [CrossRef]
- Stępniowski, W.J.; Norek, M.; Budner, B.; Michalska-Domańska, M.; Nowak-Stępniowska, A.; Bombalska, A.; Kaliszewski, M.; Mostek, A.; Thorat, S.; Salerno, M.; et al. In-situ electrochemical doping of nanoporous anodic aluminum oxide with indigo carmine organic dye. Thin Solid Films 2016, 598, 60–64. [Google Scholar] [CrossRef]
- Abd-Elnaiem, A.M.; Rashad, M. Morphology of anodic aluminum oxide anodized in a mixture of phosphoric acid and lithium phosphate monobasic. Mater. Res. Express 2018, 6, 016412. [Google Scholar] [CrossRef]
- Mínguez-Bacho, I.; Rodríguez-López, S.; Climent, A.; Fichou, D.; Vázquez, M.; Hernández-Vélez, M. Influence of Sulfur Incorporation into Nanoporous Anodic Alumina on the Volume Expansion and Self-Ordering Degree. J. Phys. Chem. C 2015, 119, 27392–27400. [Google Scholar] [CrossRef]
- Feng, S.; Ji, W. Advanced Nanoporous Anodic Alumina-Based Optical Sensors for Biomedical Applications. Front. Nanotechnol. 2021, 3, 36. [Google Scholar] [CrossRef]
- Brudzisz, A.M.; Giziński, D.; Stępniowski, W.J. Incorporation of Ions into Nanostructured Anodic Oxides—Mechanism and Functionalities. Molecules 2021, 26, 6378. [Google Scholar] [CrossRef]
- Wang, W.; Zhang, J.; Liang, D.; Li, Y.; Xie, Y.; Wang, Y.; Li, J. Anodic oxidation growth of lanthanum/manganese-doped TiO2 nanotube arrays for photocatalytic degradation of various organic dyes. J. Mater. Sci. Mater. Electron. 2020, 31, 8844–8851. [Google Scholar] [CrossRef]
- Mazierski, P.; Nischk, M.; Gołkowska, M.; Lisowski, W.; Gazda, M.; Winiarski, M.J.; Klimczuk, T.; Zaleska-Medynska, A. Photocatalytic activity of nitrogen doped TiO2 nanotubes prepared by anodic oxidation: The effect of applied voltage, anodization time and amount of nitrogen dopant. Appl. Catal. B Environ. 2016, 196, 77–88. [Google Scholar] [CrossRef]
- Shin, S.; Kim, K.; Choi, J. Fabrication of ruthenium-doped TiO2 electrodes by one-step anodization for electrolysis applications. Electrochem. Commun. 2013, 36, 88–91. [Google Scholar] [CrossRef]
- Luz, A.R.; Santos, L.S.; Lepienski, C.M.; Kuroda, P.B.; Kuromoto, N.K. Characterization of the morphology, structure and wettability of phase dependent lamellar and nanotube oxides on anodized Ti-10Nb alloy. Appl. Surf. Sci. 2018, 448, 30–40. [Google Scholar] [CrossRef] [Green Version]
- Majchrowicz, A.; Roguska, A.; Pisarek, M.; Lewandowska, M. Tailoring the morphology of nanotubular oxide layers on Ti-24Nb-4Zr-8Sn β-phase titanium alloy. Thin Solid Films 2019, 679, 15–21. [Google Scholar] [CrossRef]
- Parnicka, P.; Mazierski, P.; Lisowski, W.; Klimczuk, T.; Nadolna, J.; Zaleska-Medynska, A. A new simple approach to prepare rare-earth metals-modified TiO2 nanotube arrays photoactive under visible light: Surface properties and mechanism investigation. Results Phys. 2019, 12, 412–423. [Google Scholar] [CrossRef]
- Capellato, P.; Smith, B.S.; Popat, K.C.; Claro, A.P.R.A. Fibroblast functionality on novel Ti 30Ta nanotube array. Mater. Sci. Eng. C 2012, 32, 2060–2067. [Google Scholar] [CrossRef]
- Chaves, J.M.; Escada, A.L.A.; Rodrigues, A.D.; Alves Claro, A.P.R. Characterization of the structure, thermal stability and wettability of the TiO2 nanotubes growth on the Ti–7.5Mo alloy surface. Appl. Surf. Sci. 2016, 370, 76–82. [Google Scholar] [CrossRef] [Green Version]
- Rangel, A.L.R.; Chaves, J.A.M.; Escada, A.L.A.; Konatu, R.T.; Popat, K.C.; Alves Claro, A.P.R. Modification of the Ti15Mo alloy surface through TiO2 nanotube growth—An in vitro study. J. Appl. Biomater. Funct. Mater. 2018, 16, 222–229. [Google Scholar] [CrossRef] [Green Version]
- Verissimo, N.C.; Geilich, B.M.; Oliveira, H.G.; Caram, R.; Webster, T.J. Reducing S taphylococcus aureus growth on Ti alloy nanostructured surfaces through the addition of Sn. J. Biomed. Mater. Res. Part A 2015, 103, 3757–3763. [Google Scholar] [CrossRef]
- Zhang, W.; Chen, X.; Wang, Y.; Wu, L.; Hu, Y. Experimental and Modeling of Conductivity for Electrolyte Solution Systems. ACS Omega 2020, 5, 22465–22474. [Google Scholar] [CrossRef]
- Roy, P.; Berger, S.; Schmuki, P. TiO2 Nanotubes: Synthesis and Applications. Angew. Chem. Int. Ed. 2011, 50, 2904–2939. [Google Scholar] [CrossRef]
- Michalska-Domańska, M.; Norek, M.; Stępniowski, W.J.; Budner, B. Fabrication of high quality anodic aluminum oxide (AAO) on low purity aluminum—A comparative study with the AAO produced on high purity aluminum. Electrochim. Acta 2013, 105, 424–432. [Google Scholar] [CrossRef]
- Otto, T.N.; Habicht, W.; Dinjus, E.; Zimmerm, M. Catalyst Characterization with FESEM/EDX by the Example of Silver-Catalyzed Epoxidation of 1,3-Butadiene. In Scanning Electron Microscopy; InTech: London, UK, 2012. [Google Scholar] [CrossRef] [Green Version]
- Friel, J.J.; Lyman, C.E. Tutorial Review: X-ray Mapping in Electron-Beam Instruments. Microsc. Microanal. 2006, 12, 2–25. [Google Scholar] [CrossRef] [Green Version]
- Dong, H. Surface engineering in sport. In Materials in Sports Equipment; Elsevier: Amsterdam, The Netherlands, 2003; pp. 160–195. [Google Scholar] [CrossRef]
- Akhtar, S.S.; Arif, A.F.M.; Yilbas, B.S. 3.11 Gas Nitriding of H13 Tool Steel Used for Extrusion Dies: Numerical and Experimental Investigation. In Comprehensive Materials Finishing; Elsevier: Amsterdam, The Netherlands, 2017; pp. 158–177. [Google Scholar] [CrossRef]
- Baker, B.A. Types of Environments. In Shreir’s Corrosion; Elsevier: Amsterdam, The Netherlands, 2010; pp. 399–406. [Google Scholar] [CrossRef]
- Haryński, Ł.; Olejnik, A.; Grochowska, K.; Siuzdak, K. A facile method for Tauc exponent and corresponding electronic transitions determination in semiconductors directly from UV–Vis spectroscopy data. Opt. Mater. 2022, 127, 112205. [Google Scholar] [CrossRef]


| Electrolyte Name | Base | Concentration | |||
|---|---|---|---|---|---|
| 0.1 M | 0.01 M | 0.02 M | 2 vol% | ||
| Reference electrolyte | Ethylene glycol | NH4F | - | - | H2O |
| A—Mn(NO3)2 | Mn(NO3)2 | C4H6O6 | |||
| B—NaMoO4 | Na2MoO4 | - | |||
| C—Na2WO4 | Na2WO3 | ||||
| Electrolyte Name | pH | Conductivity (μS/cm) |
|---|---|---|
| A—Mn(NO3)2 | 5.35 | 408.5 |
| Reference | 6.61 | 607.6 |
| C—Na2WO4 | 7.59 | 622.7 |
| B—Na2MoO4 | 7.84 | 599.5 |
| Electrolyte Name | Applied Voltage (V) | Average Current Density (mA/cm2) | Maximum Current Density (mA/cm2) |
|---|---|---|---|
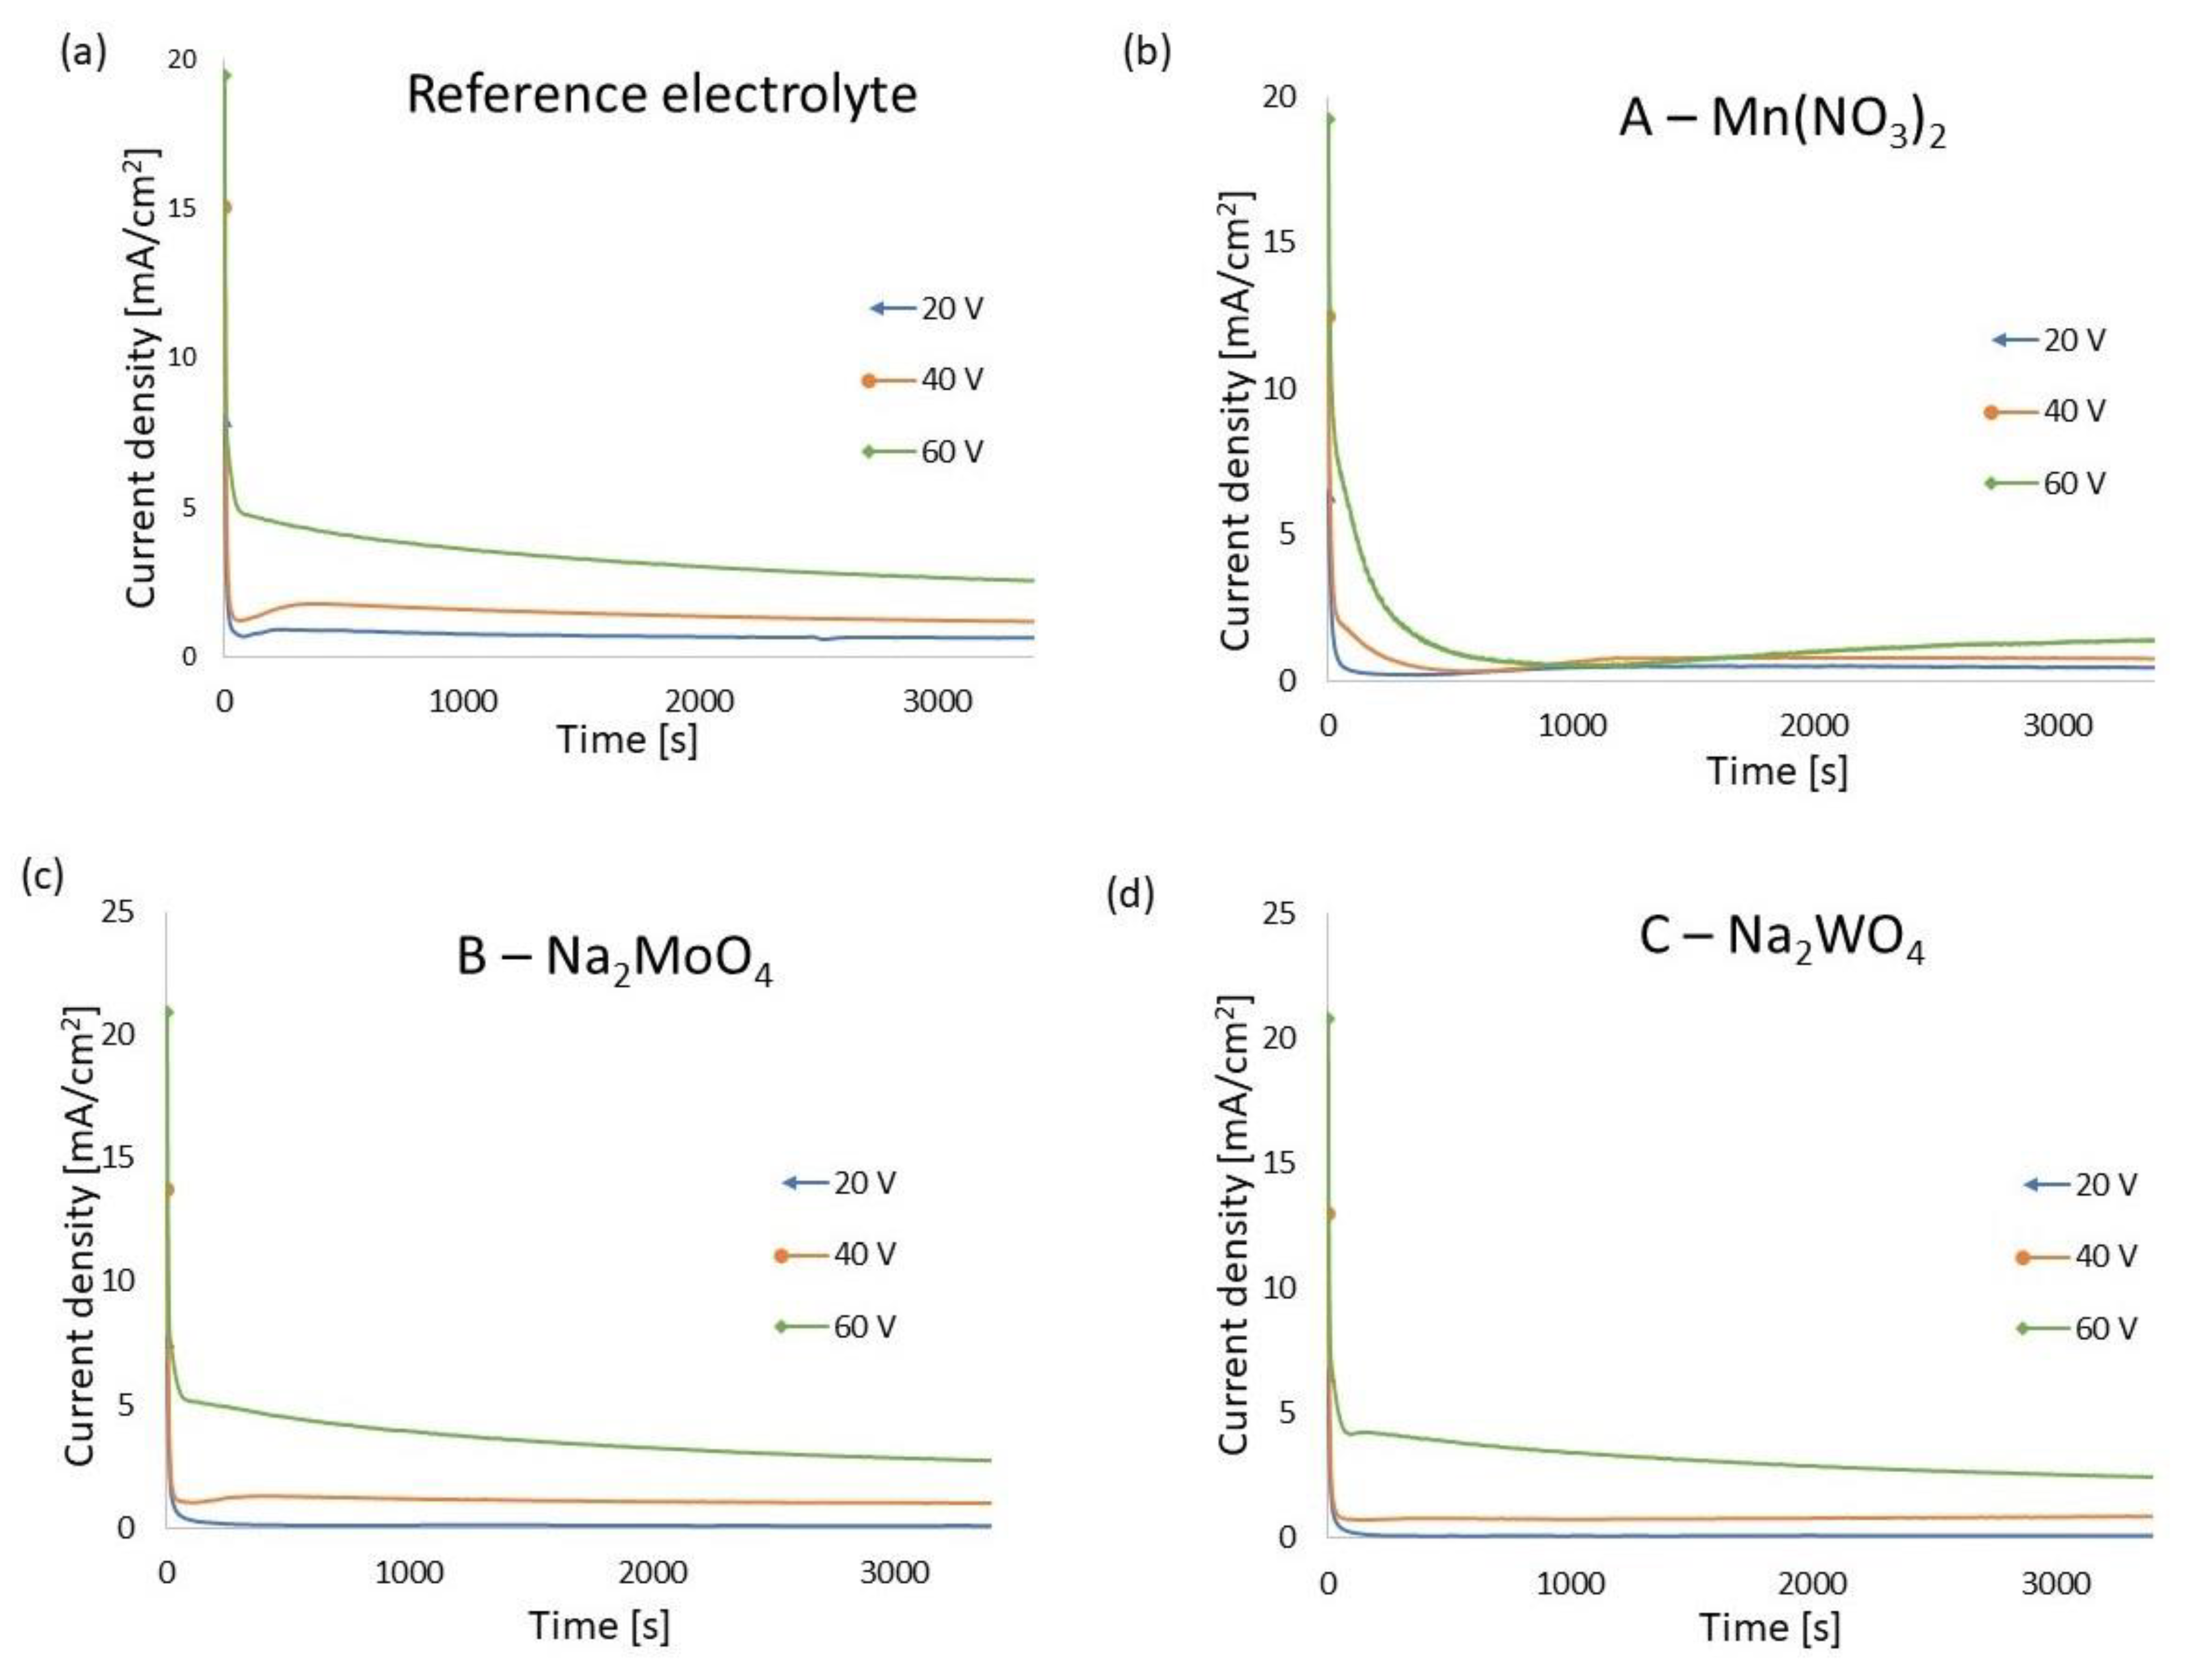
| Reference | 20 | 0.73 | 8.20 |
| 40 | 1.44 | 15.06 | |
| 60 | 3.31 | 19.46 | |
| A—Mn(NO3)2 | 20 | 0.44 | 6.61 |
| 40 | 0.76 | 12.46 | |
| 60 | 1.31 | 19.23 | |
| B—Na2MoO4 | 20 | 0.13 | 7.91 |
| 40 | 1.12 | 13.73 | |
| 60 | 3.57 | 20.92 | |
| C—Na2WO4 | 20 | 0.12 | 6.85 |
| 40 | 0.82 | 12.97 | |
| 60 | 3.14 | 20.78 |
| Electrolyte Name | Element (at %) | Ti | C | N | O | F | Mn | Mo | W | |
|---|---|---|---|---|---|---|---|---|---|---|
| Voltage (V) | ||||||||||
| Reference electrolyte | 20 V | 37.40 ± 0.15 | 12.62 ± 0.32 | 13.52 ± 1.42 | 30.67 ± 0.67 | 5.80 ± 0.13 | - | - | - | |
| 40 V | 32.58 ± 0.18 | 13.61 ± 0.14 | 11.70 ± 1.05 | 35.68 ± 0.84 | 6.44 ± 0.17 | - | - | - | ||
| 60 V | 24.64 ± 0.47 | 14.06 ± 0.52 | 12.69 ± 0.57 | 40.44 ± 0.38 | 8.19 ± 1.18 | - | - | - | ||
| A—Mn(NO3)2 | 20 V | 36.76 ± 0.46 | 10.06 ± 0.49 | 11.40 ± 2.50 | 36.91 ± 2.36 | 4.65 ± 1.05 | 0.23 ± 0.04 | - | - | |
| 40 V | 35.29 ± 073 | 10.36 ± 0.43 | 12.48 ± 0.64 | 35.44 ± 1.10 | 6.27 ± 0.69 | 0.17 ± 0.01 | - | - | ||
| 60 V | 31.95 ± 0.18 | 10.92 ± 1.15 | 12.83 ± 0.23 | 38.52 ± 0.92 | 5.65 ± 0.28 | 0.13 ± 0.01 | - | - | ||
| B—Na2MoO4 | 20 V | 48.55 ± 3.78 | 9.70 ± 1.12 | 26.35 ± 2.56 | 12.88 ± 6.77 | 2.24 ± 0.72 | - | 0.29 ± 0.03 | - | |
| 40 V | 33.04 ± 0.55 | 12.86 ± 1.12 | 12.77 ± 2.00 | 35.46 ± 3.13 | 5.69 ± 0.58 | - | 0.18 ± 0.05 | - | ||
| 60 V | 26.14 ± 2.64 | 15.61 ± 1.40 | 11.73 ± 1.74 | 40.85 ± 0.86 | 5.39 ± 1.48 | - | 0.29 ± 0.04 | - | ||
| C—Na2WO4 | 20 V | 47.78 ± 7.84 | 6.90 ± 0.40 | 24.35 ± 3.46 | 17.57 ± 11.52 | 3.15 ± 0.48 | - | - | 0.27 ±> 0.01 | |
| 40 V | 30.83 ± 1.26 | 11.90 ± 1.62 | 13.03 ± 0.21 | 37.53 ± 0.42 | 6.49 ± 0.92 | - | - | 0.23 ±> 0.01 | ||
| 60 V | 21.84 ± 2.69 | 16.73 ± 0.82 | 15.81 ± 0.05 | 38.72 ± 7.30 | 6.79 ± 0.01 | - | - | 0.11 ±> 0.01 | ||
| Electrolyte Name | Voltage (V) | BG (eV) | Corresponding Wavelength (nm) | Range of Sunlight |
|---|---|---|---|---|
| Reference electrolyte | 20 V | 3.42 | 363.03 | UV |
| 40 V | 3.14 | 395.41 | UV | |
| 60 V | 2.85 | 435.64 | Vis | |
| A—Mn(NO3)2 | 20 V | 3.30 | 376.23 | UV |
| 40 V | 3.16 | 392.90 | UV | |
| 60 V | 2.55 | 486.89 | Vis | |
| B—Na2MoO4 | 20 V | 3.55 | 349.74 | UV |
| 40 V | 3.21 | 386.78 | UV | |
| 60 V | 2.92 | 425.20 | Vis | |
| C—Na2WO4 | 20 V | 3.61 | 343.93 | UV |
| 40 V | 3.15 | 394.15 | UV | |
| 60 V | 2.95 | 420.87 | Vis |
Disclaimer/Publisher’s Note: The statements, opinions and data contained in all publications are solely those of the individual author(s) and contributor(s) and not of MDPI and/or the editor(s). MDPI and/or the editor(s) disclaim responsibility for any injury to people or property resulting from any ideas, methods, instructions or products referred to in the content. |
© 2023 by the authors. Licensee MDPI, Basel, Switzerland. This article is an open access article distributed under the terms and conditions of the Creative Commons Attribution (CC BY) license (https://creativecommons.org/licenses/by/4.0/).
Share and Cite
Michalska-Domańska, M.; Prabucka, K.; Czerwiński, M. Modification of Anodic Titanium Oxide Bandgap Energy by Incorporation of Tungsten, Molybdenum, and Manganese In Situ during Anodization. Materials 2023, 16, 2707. https://doi.org/10.3390/ma16072707
Michalska-Domańska M, Prabucka K, Czerwiński M. Modification of Anodic Titanium Oxide Bandgap Energy by Incorporation of Tungsten, Molybdenum, and Manganese In Situ during Anodization. Materials. 2023; 16(7):2707. https://doi.org/10.3390/ma16072707
Chicago/Turabian StyleMichalska-Domańska, Marta, Katarzyna Prabucka, and Mateusz Czerwiński. 2023. "Modification of Anodic Titanium Oxide Bandgap Energy by Incorporation of Tungsten, Molybdenum, and Manganese In Situ during Anodization" Materials 16, no. 7: 2707. https://doi.org/10.3390/ma16072707