
High-Cycle Fatigue Behaviour of the Aluminium Alloy 5083-H111

Abstract
:1. Introduction
2. Materials and Methods
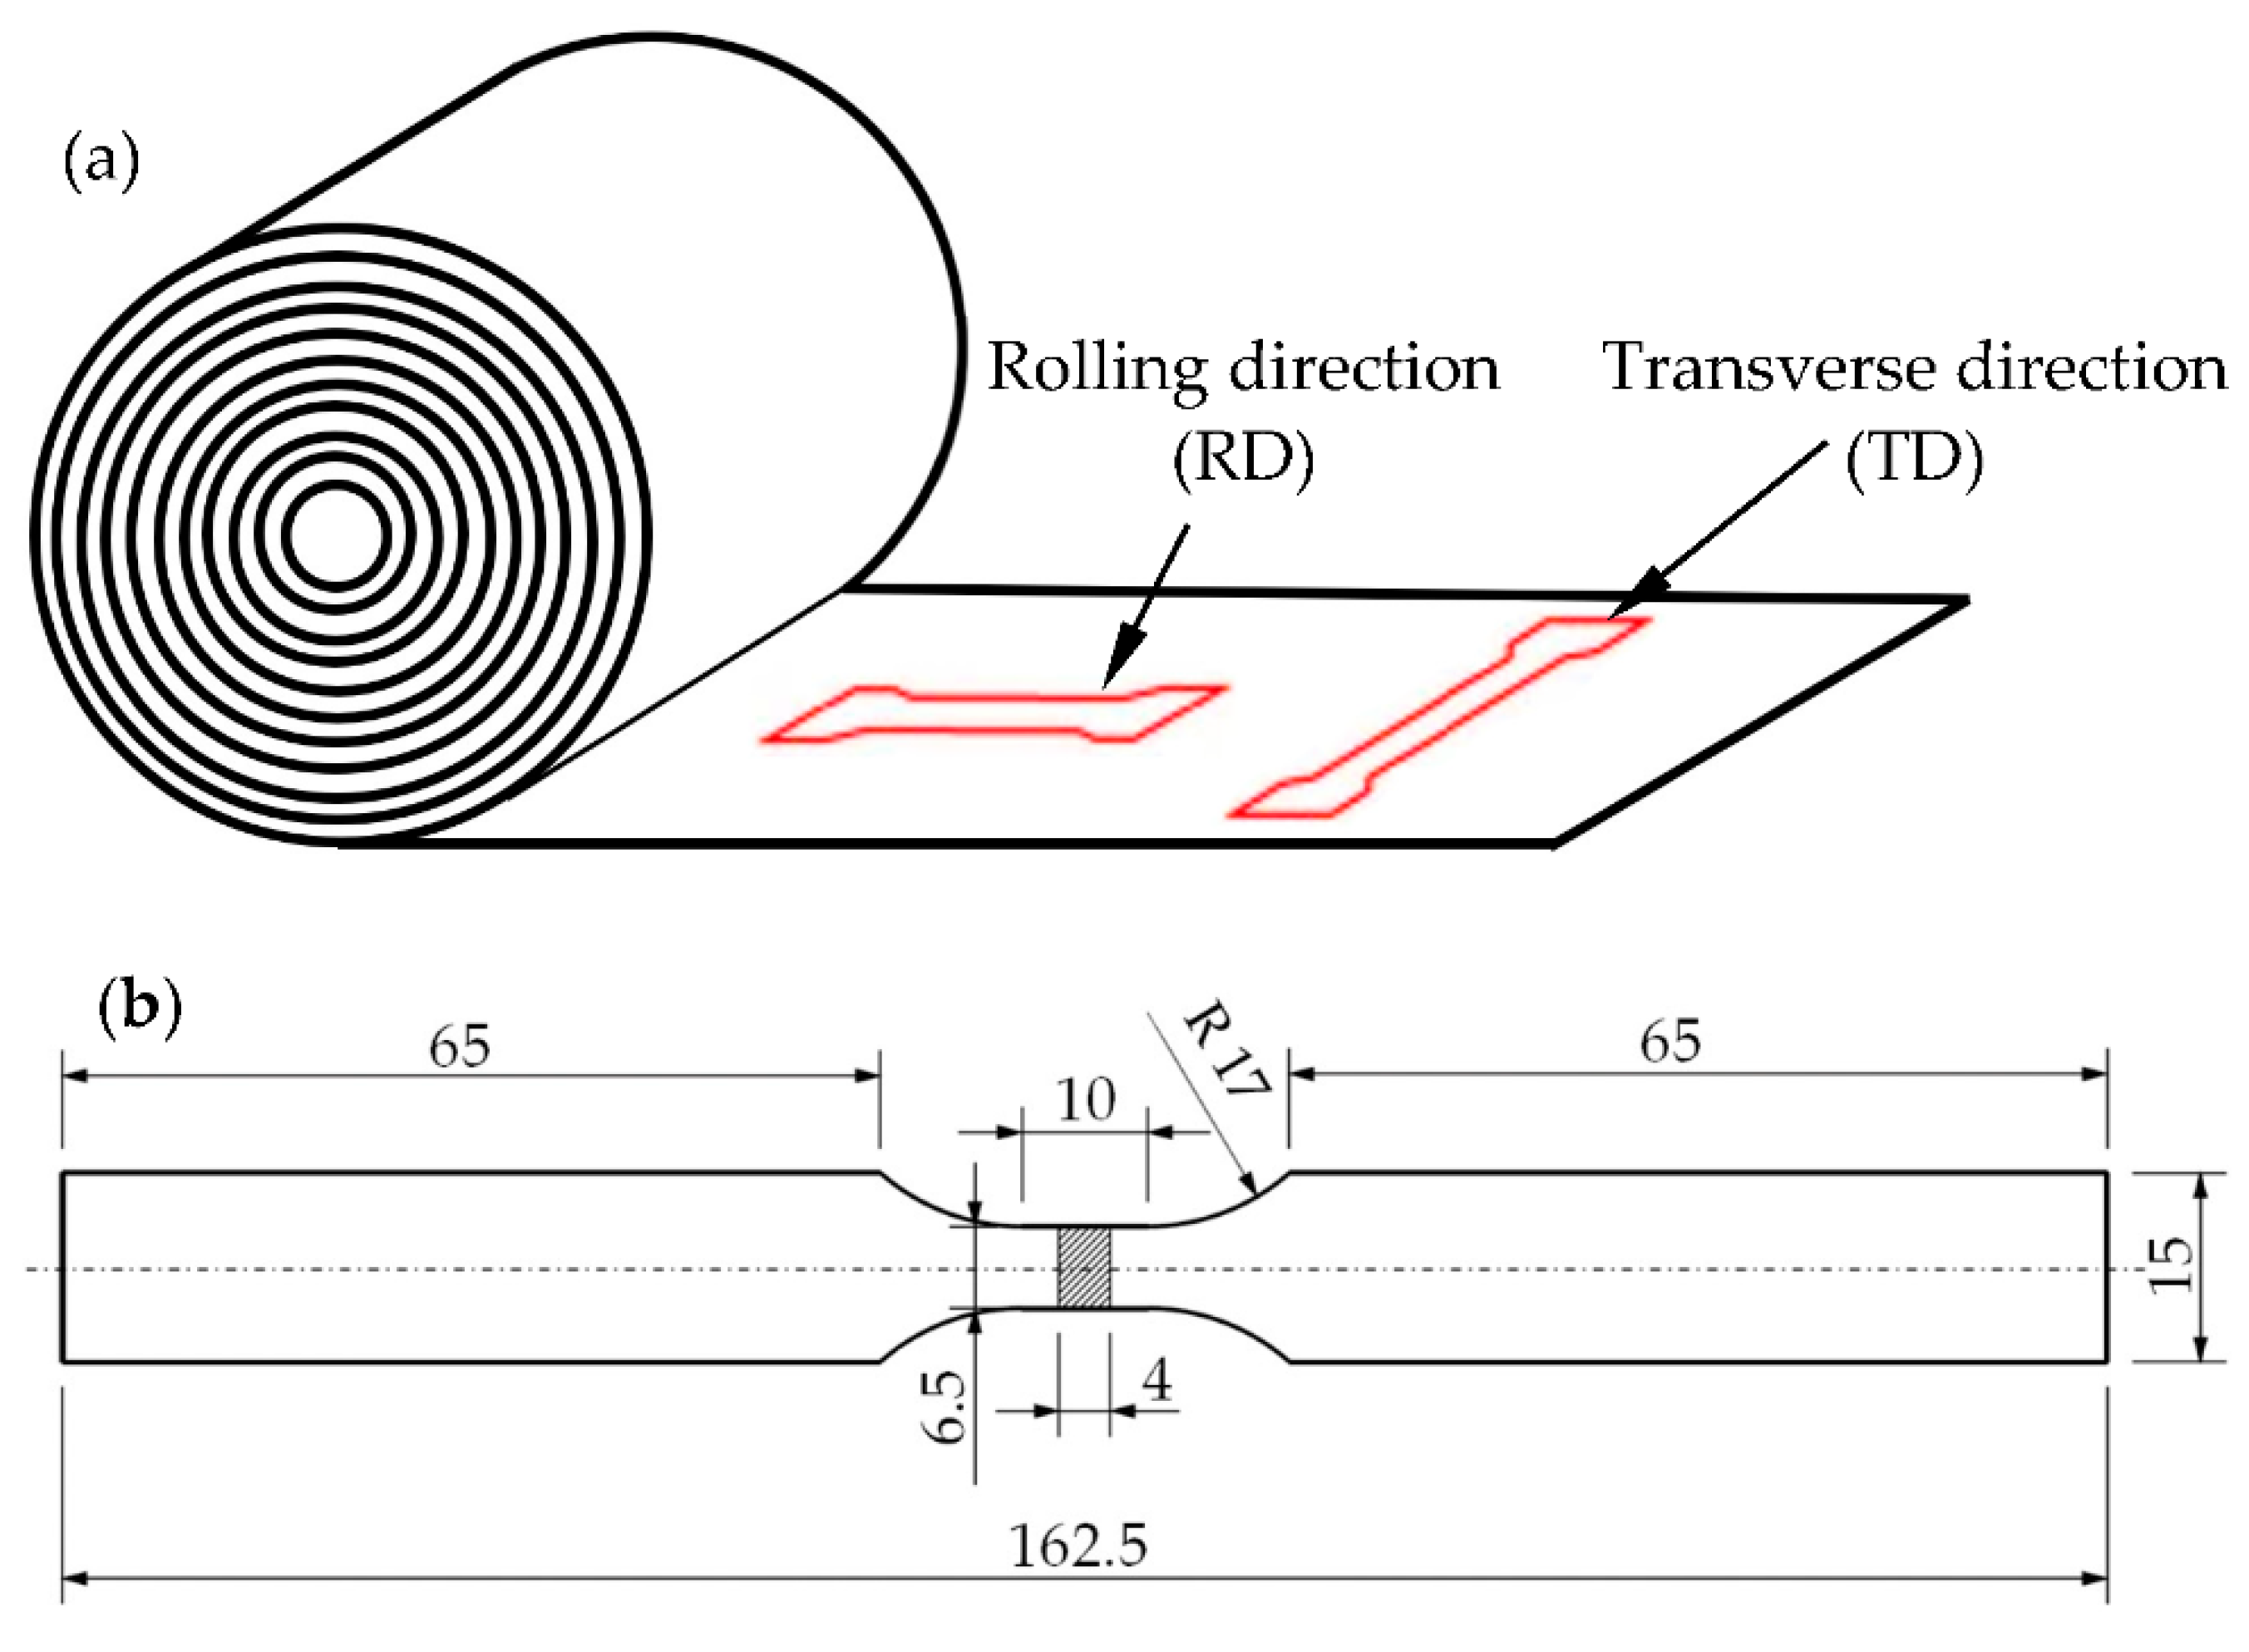
2.1. Material and Specimen Geometry
2.2. Experimental Methods
3. Results and Discussion
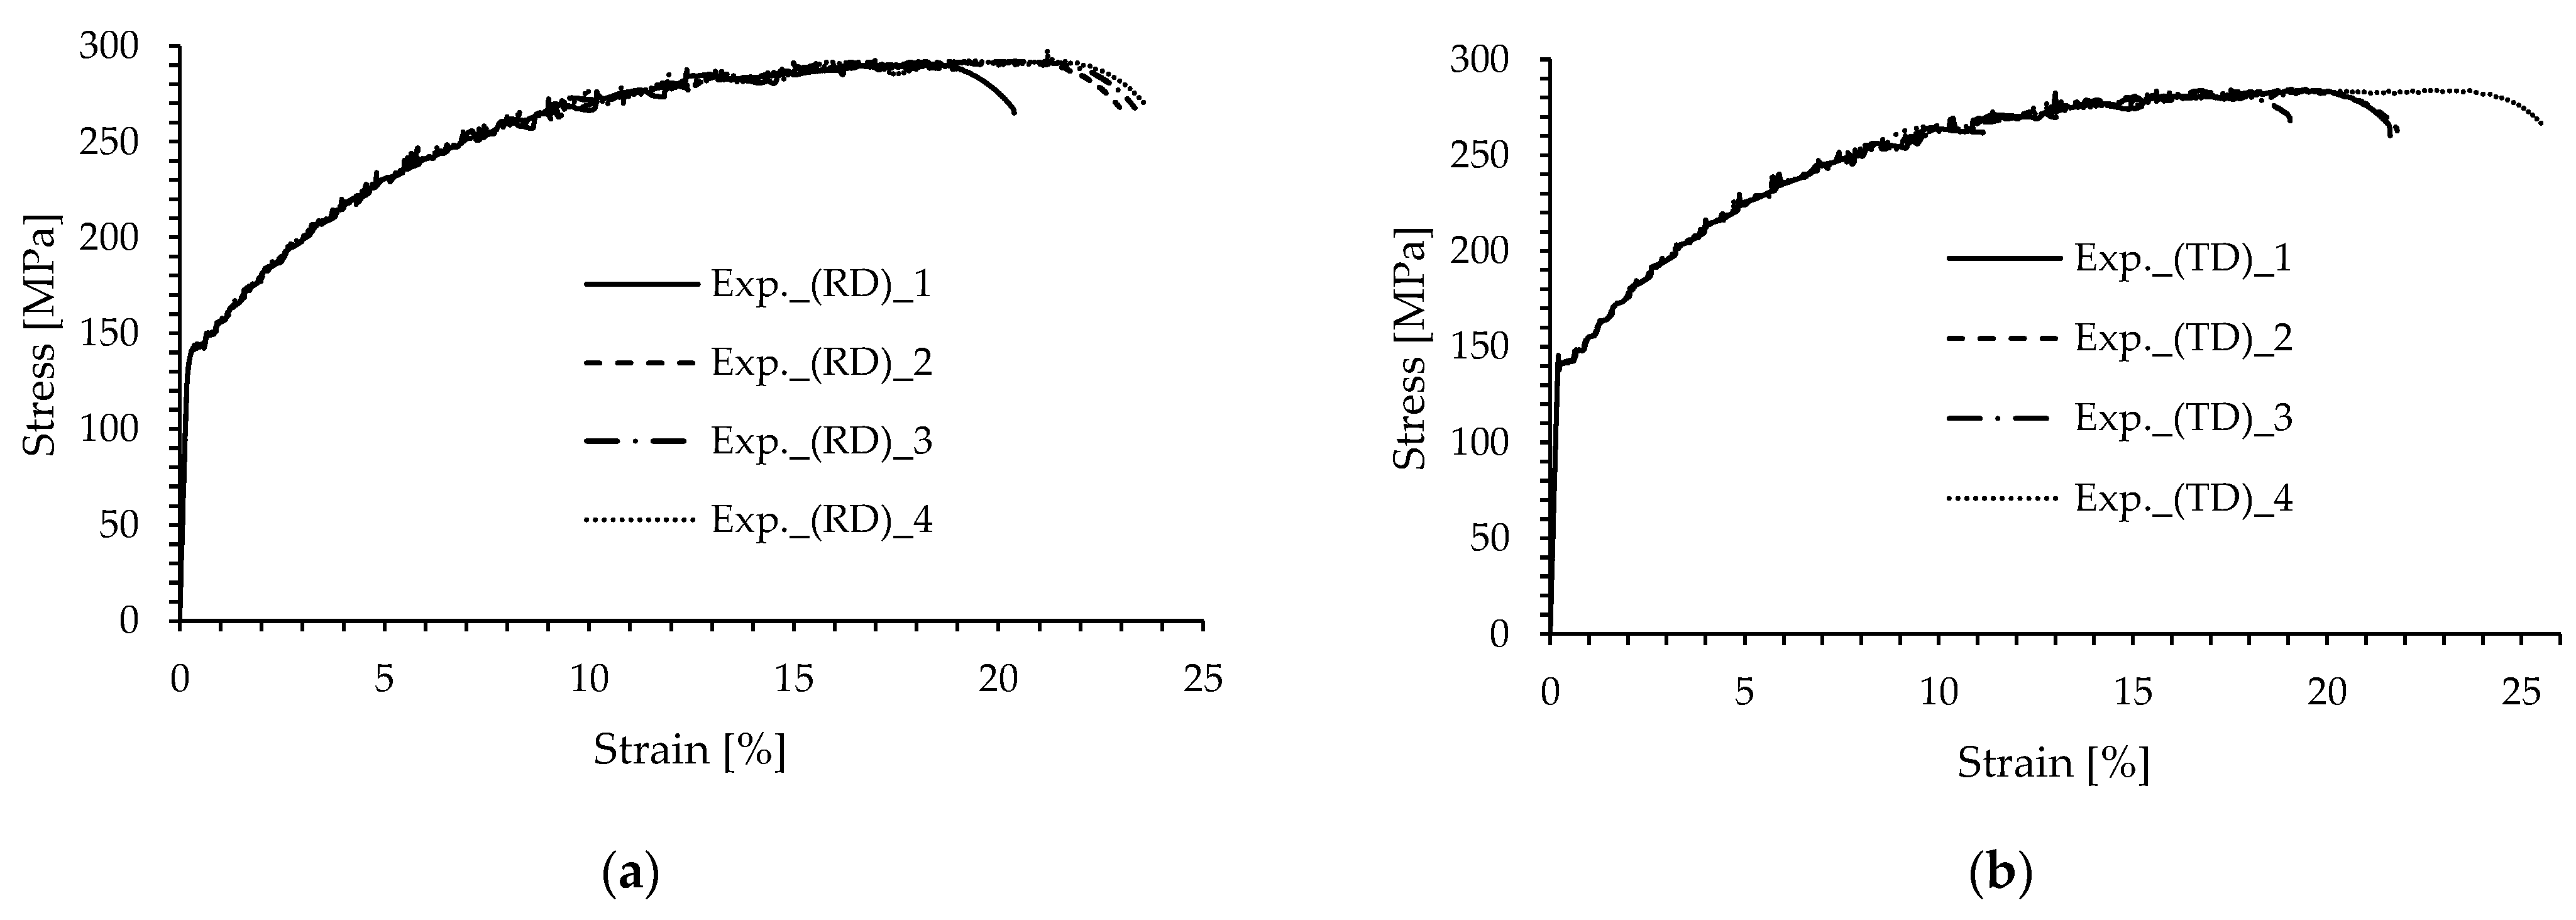
3.1. Quasi-Static Tensile Tests
3.2. High-Cycle Fatigue Tests
4. Conclusions
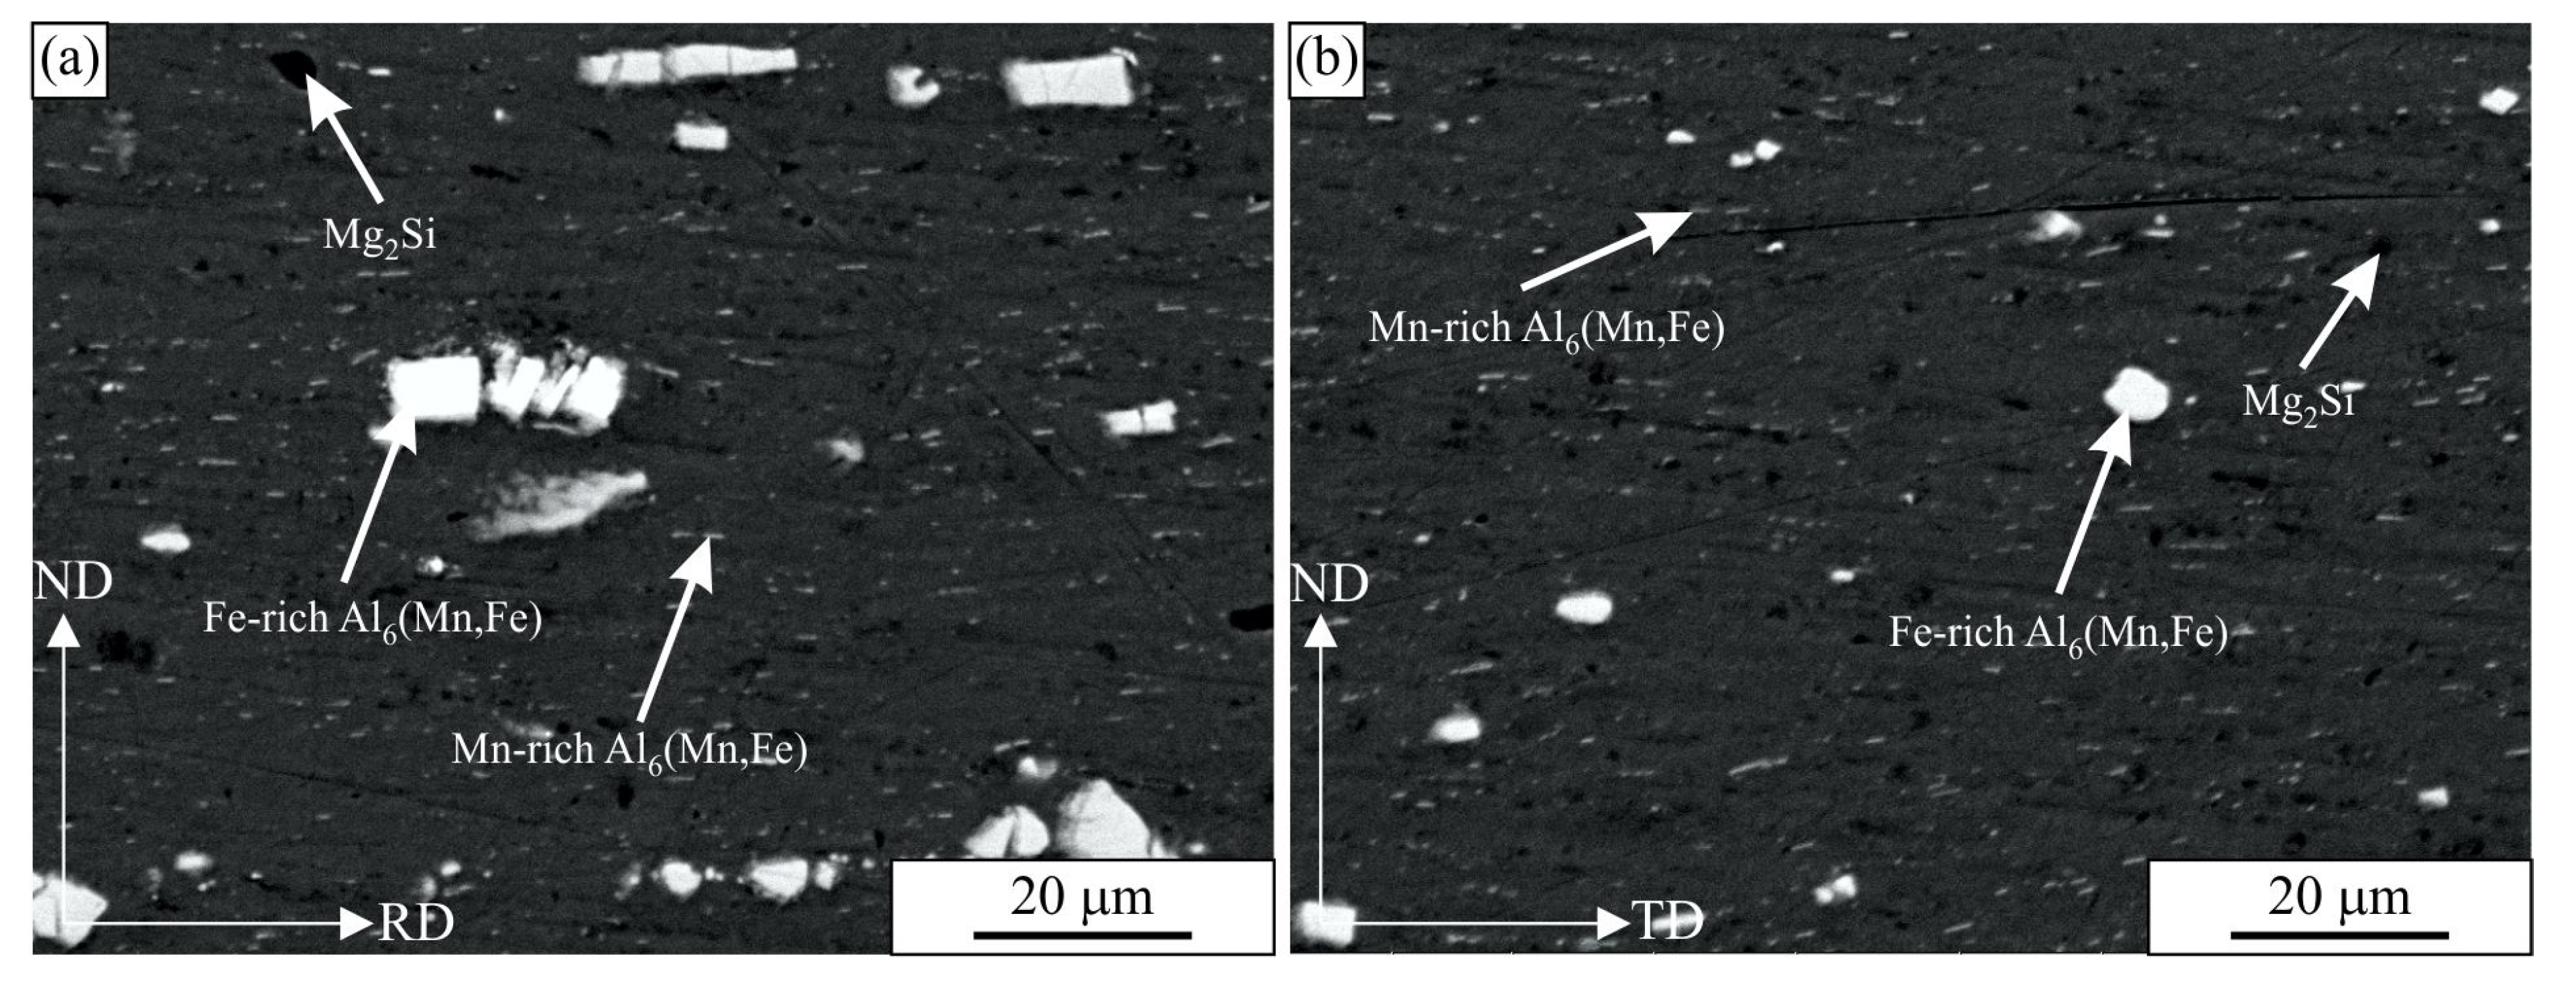
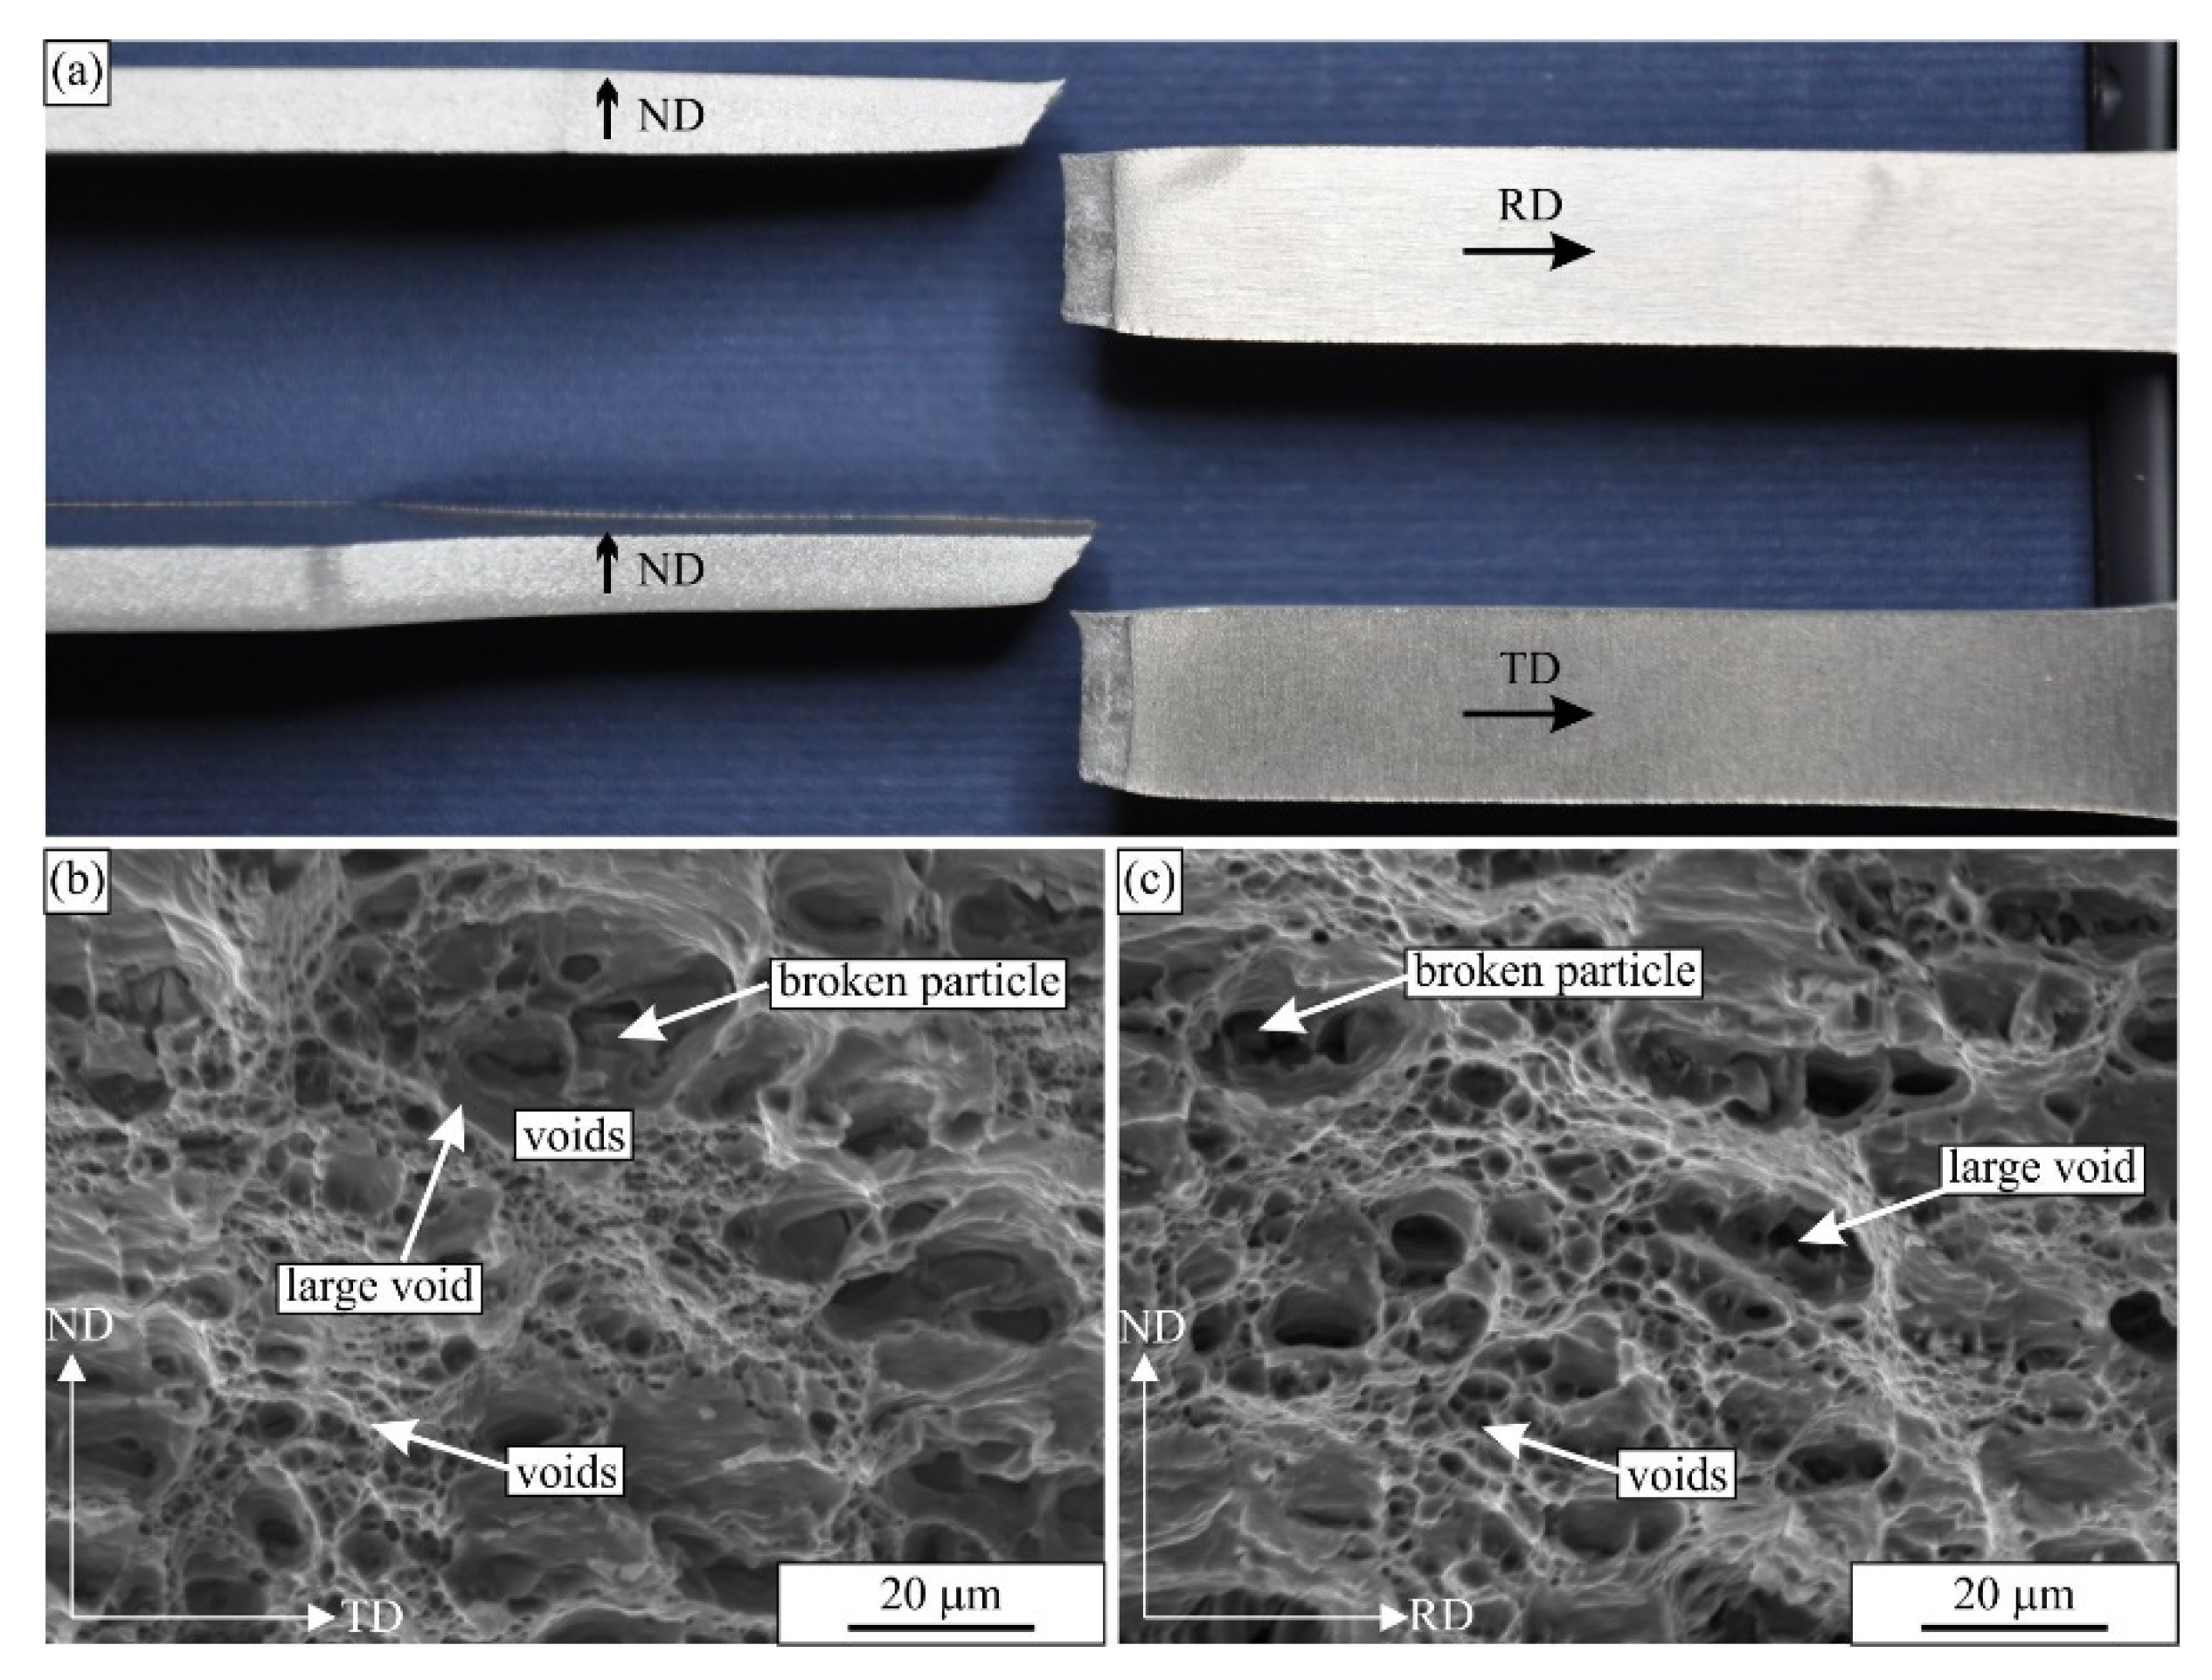
- The analysed AA 5083-H111 alloy is composed of an Al-rich solid solution, alpha-Al, dark Mg2Si particles, large bright iron-rich Al6(Fe, Mn) particles, and smaller, plate-like Mn-rich Al6(Fe, Mn) particles. The microstructures in both the longitudinal/rolling (RD) and transversal (TD) directions were found to be very similar. However, the dimensions of the Fe-rich Al6(Fe, Mn) particles were longer in the longitudinal/rolling direction.
- The mechanical properties (yield stress, ultimate tensile strength, elongation at fracture) were quite similar for both specimens. However, the specimens manufactured in the longitudinal/rolling direction demonstrated slightly better properties (except for Young’s modulus, E) if compared to the specimens manufactured perpendicular to the rolling direction (transverse direction).
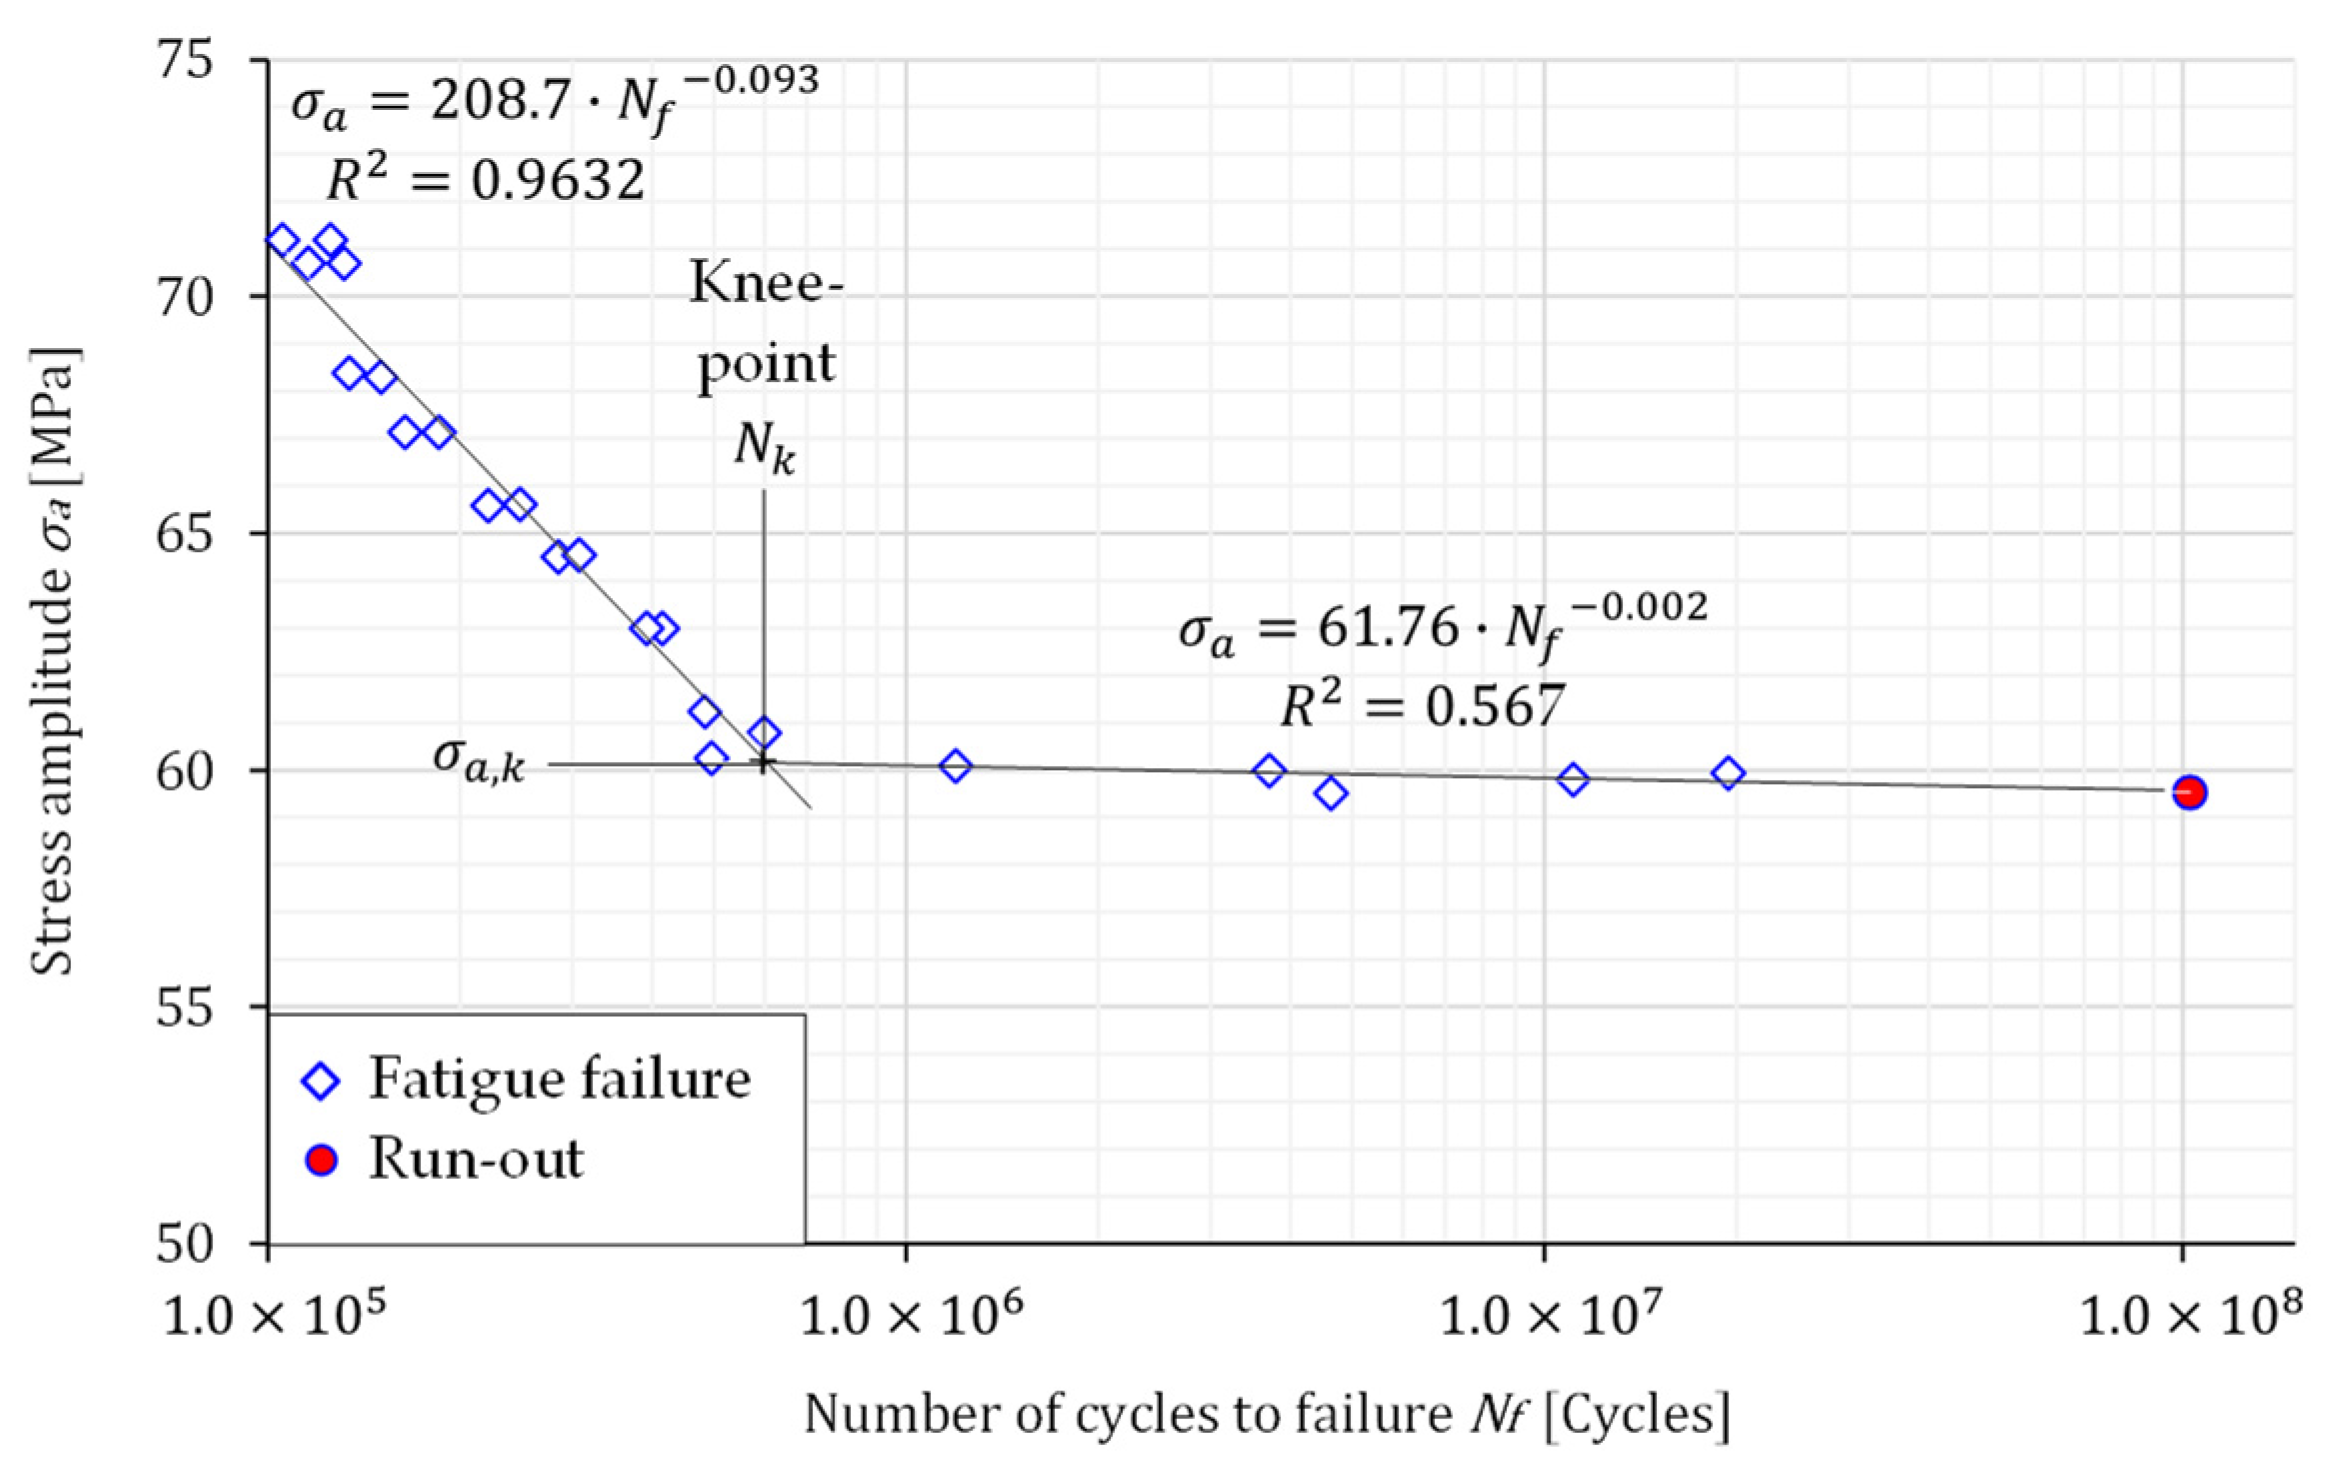
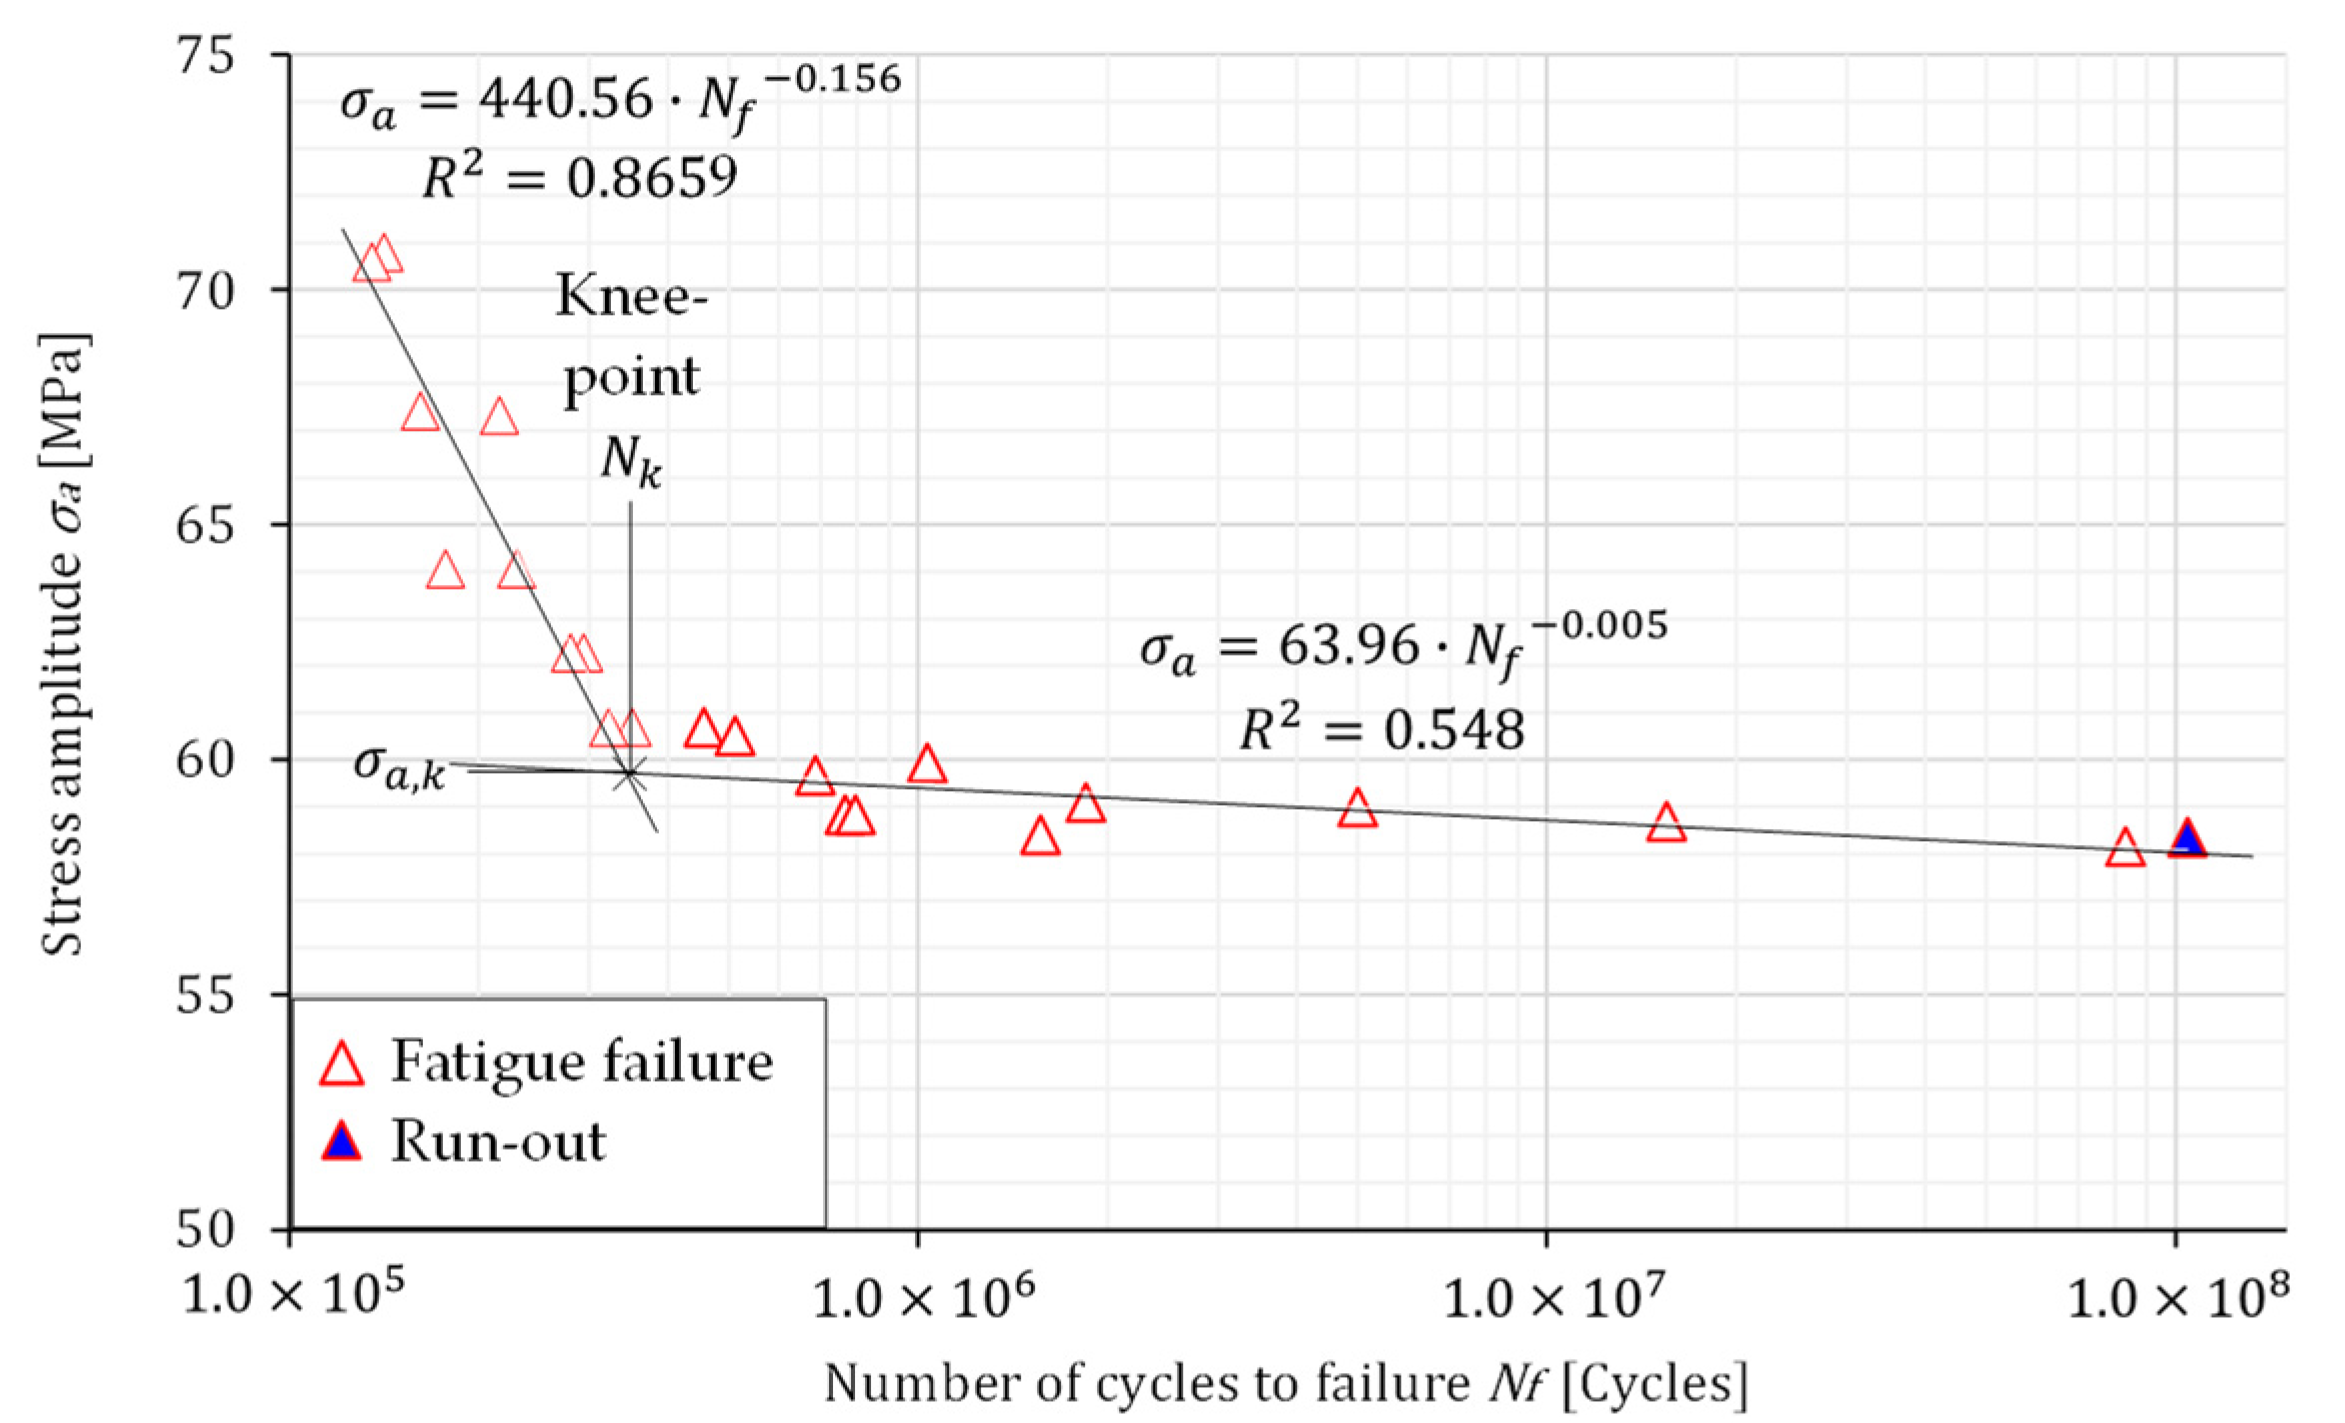
- The experimental results have shown that the S–N curves of the analysed Al-alloy consist of two linear curves with different slopes, which intersect at the knee point Nk. The corresponding amplitude stress at the knee point, σa,k, was found to be almost the same for both specimen layouts, while the number of cycles at the knee point, Nk, was found to be higher for the specimens oriented longitudinally to the rolling direction. The difference can be caused by large, in the rolling direction elongated Al6(Mn, Fe) particles, which cause higher stress concentrations when tested in the TD. Furthermore, the main part of the larger particles has a cuboidal shape, with a larger axis approximately parallel to the rolling direction. Thus, in the RD orientation, the larger axis of particles lay in the direction of the load and in the TD orientation perpendicular to the load. It could be expected that at TD orientation, higher stress concentrations occurred at the particle–matrix interface and that this leads to slightly worse fatigue resistance in the TD direction.
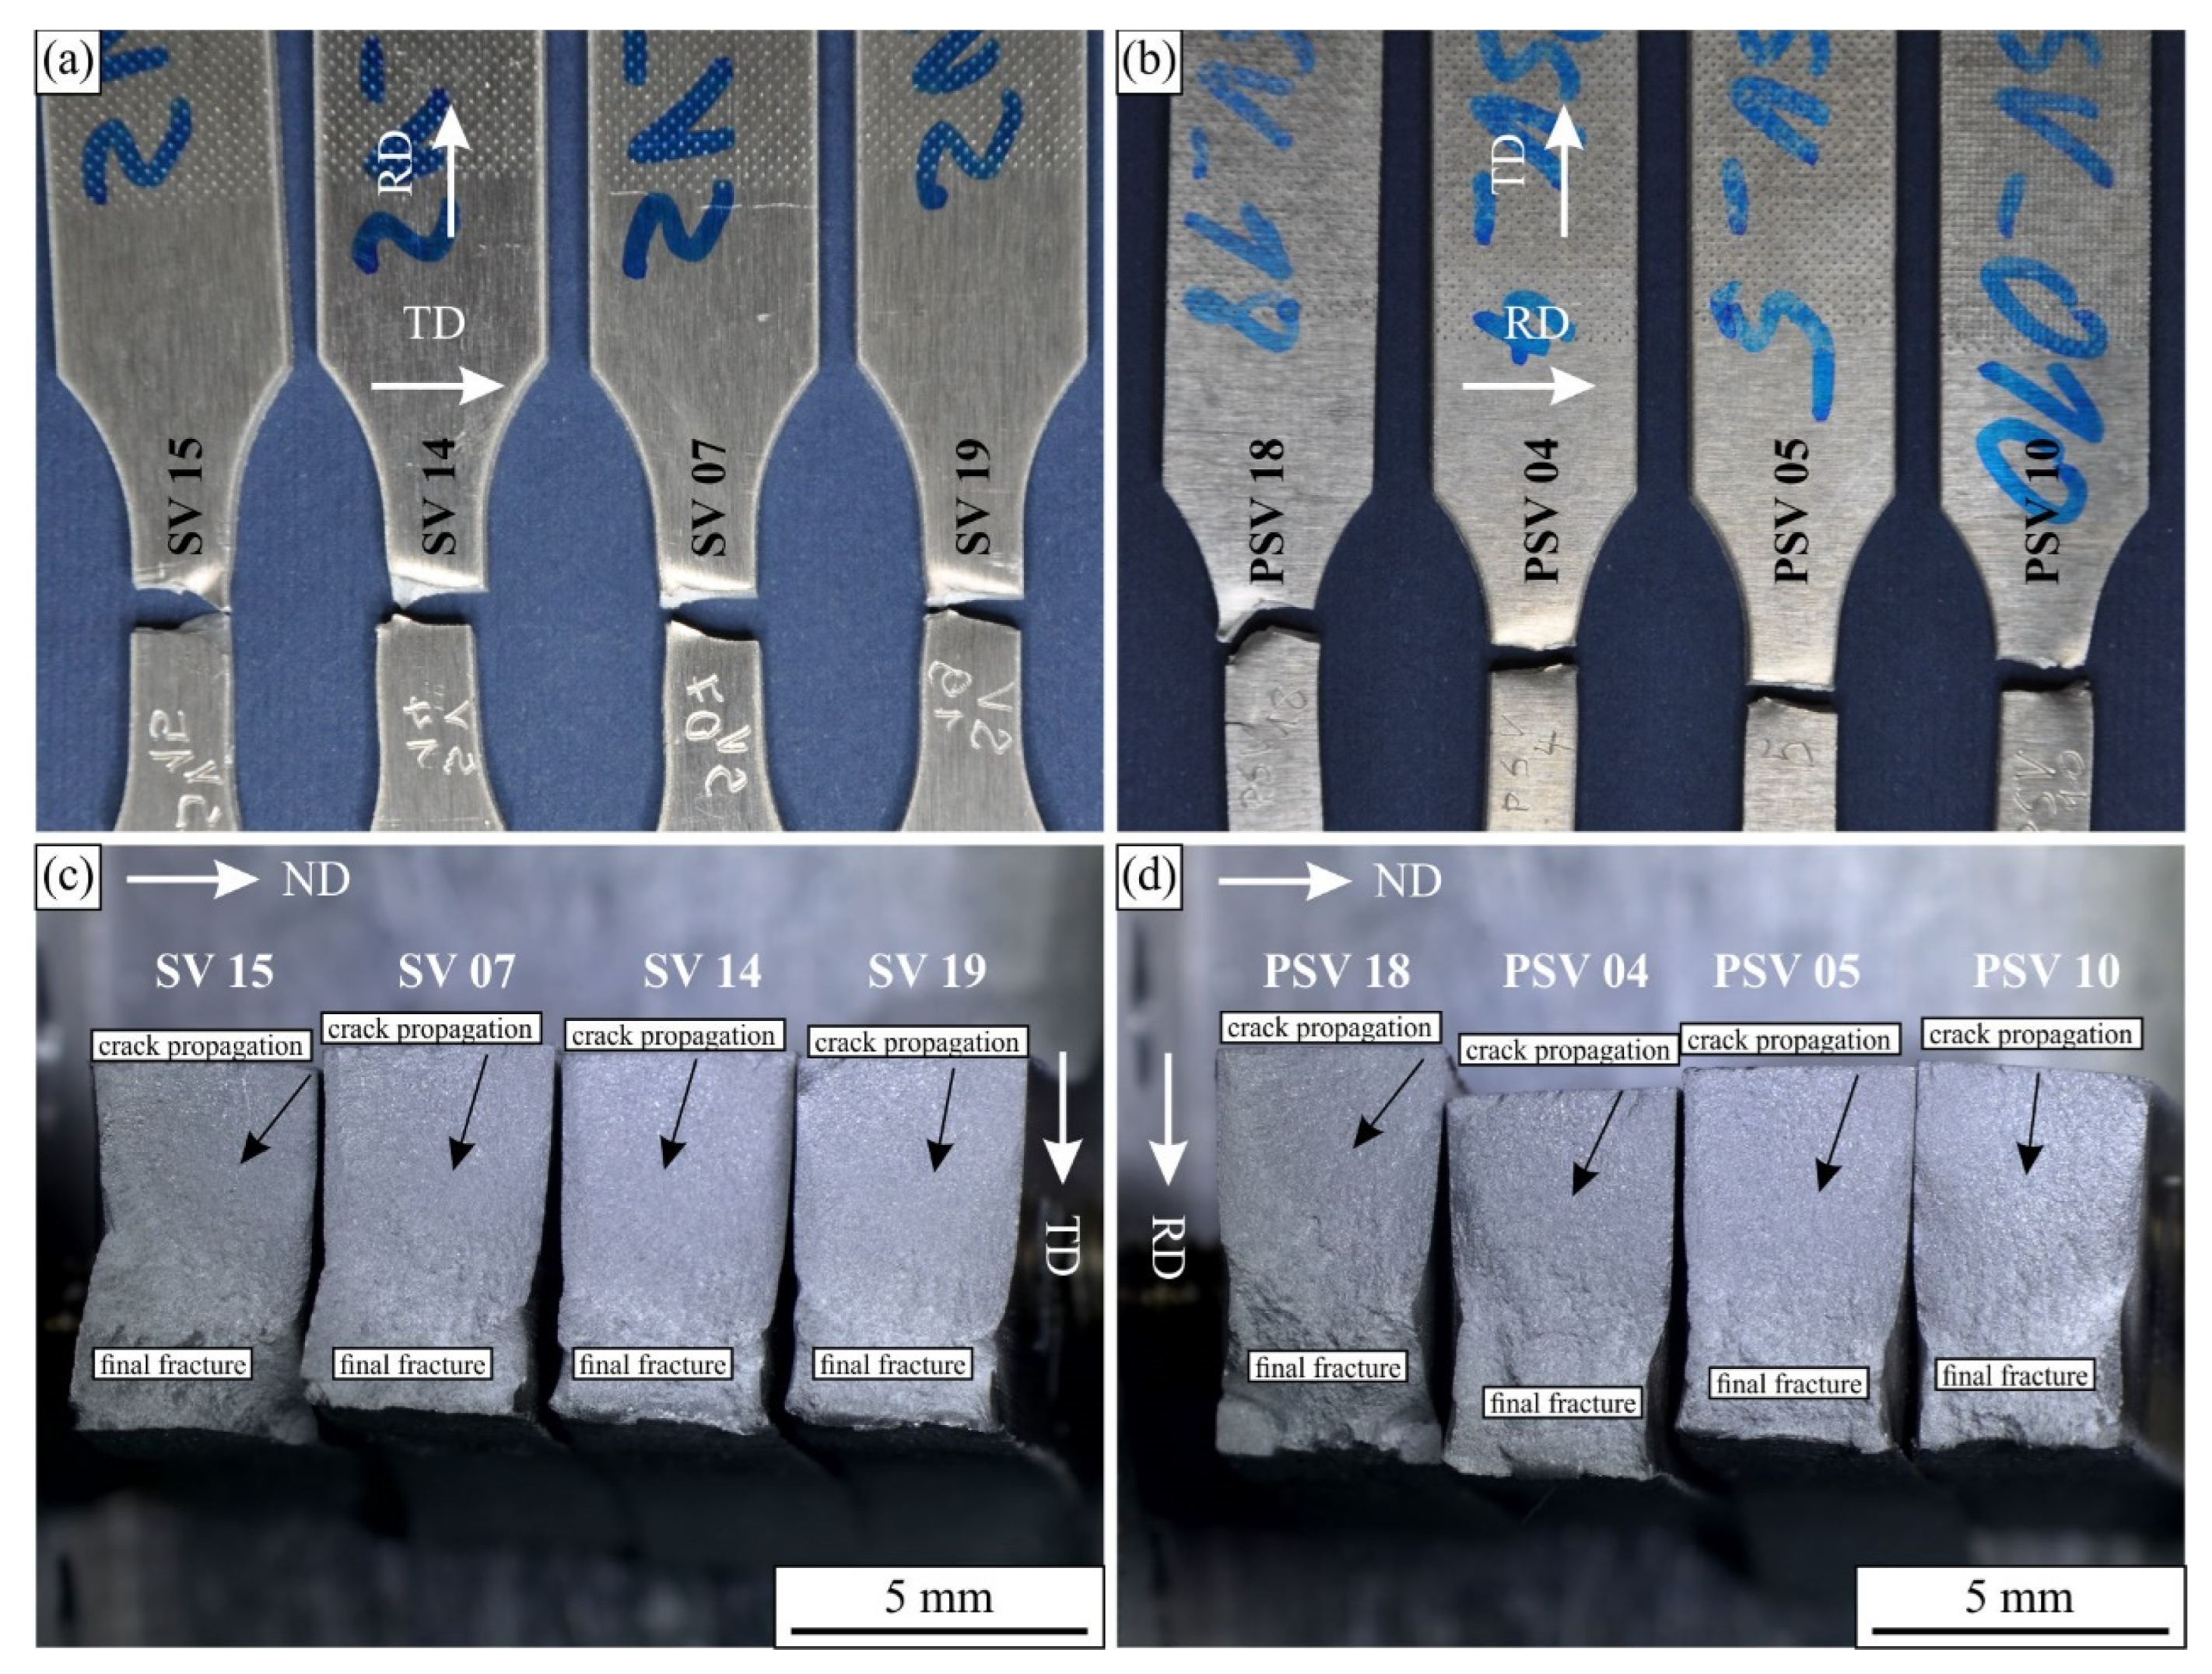
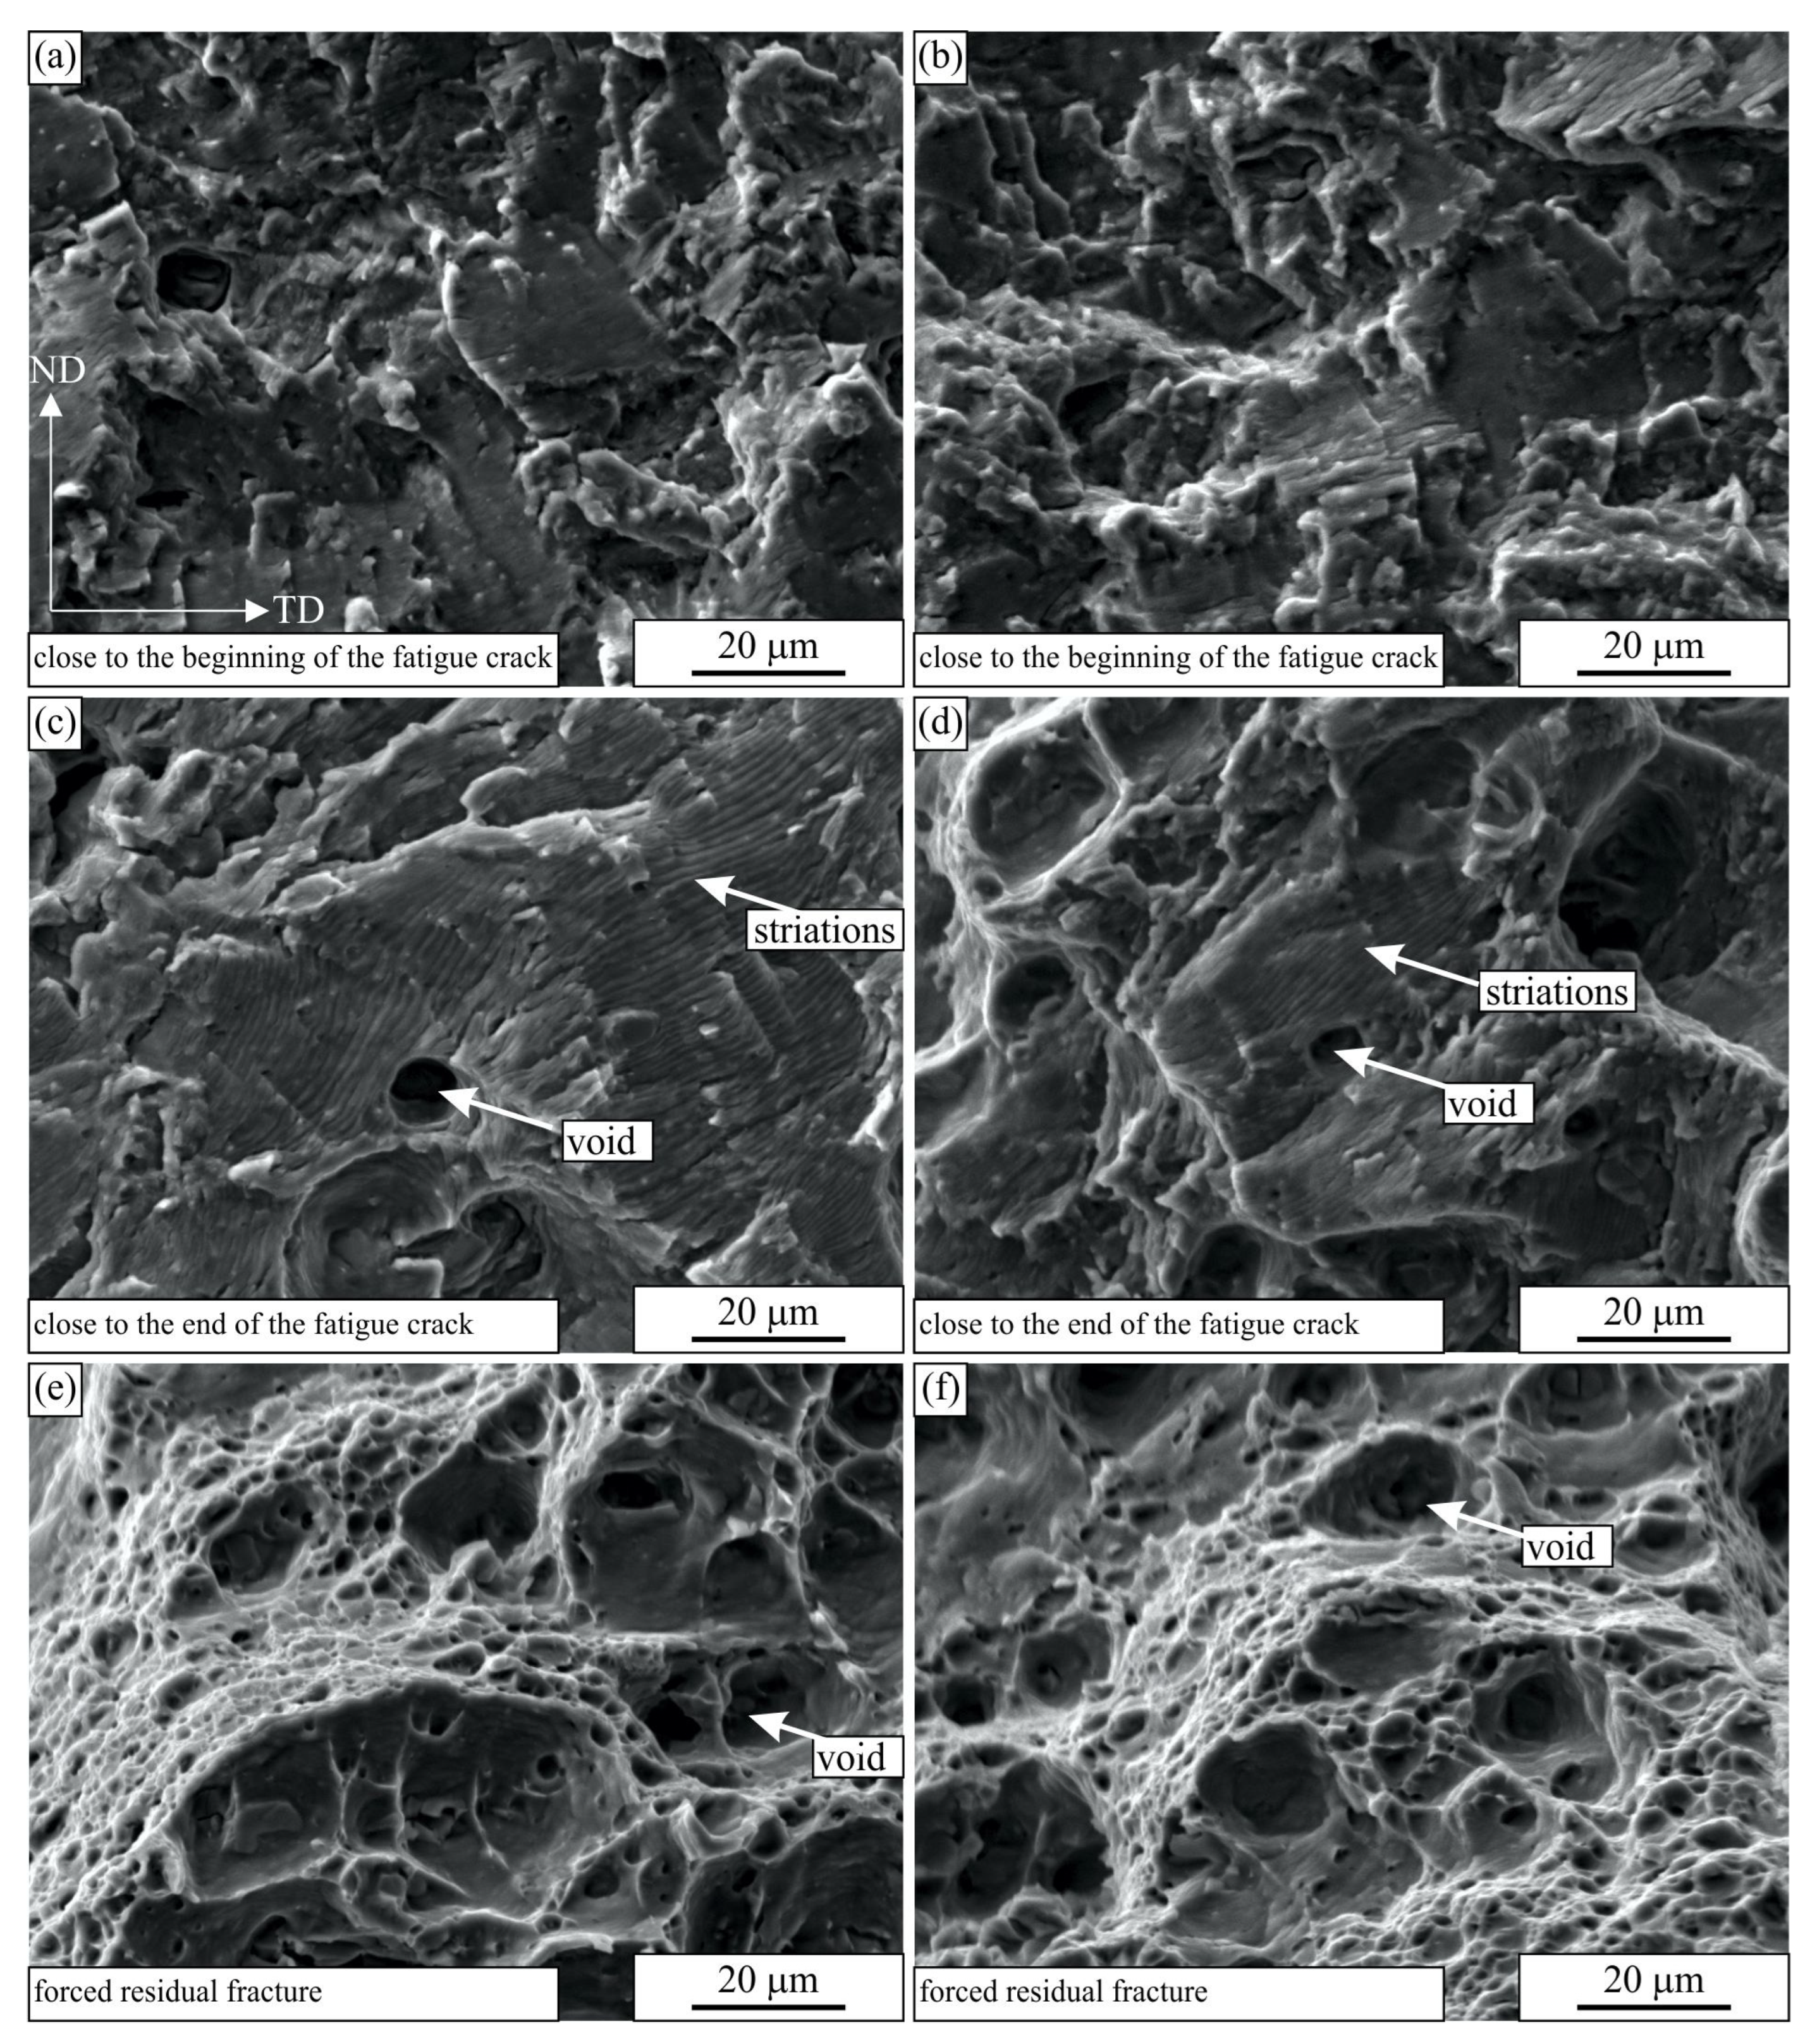
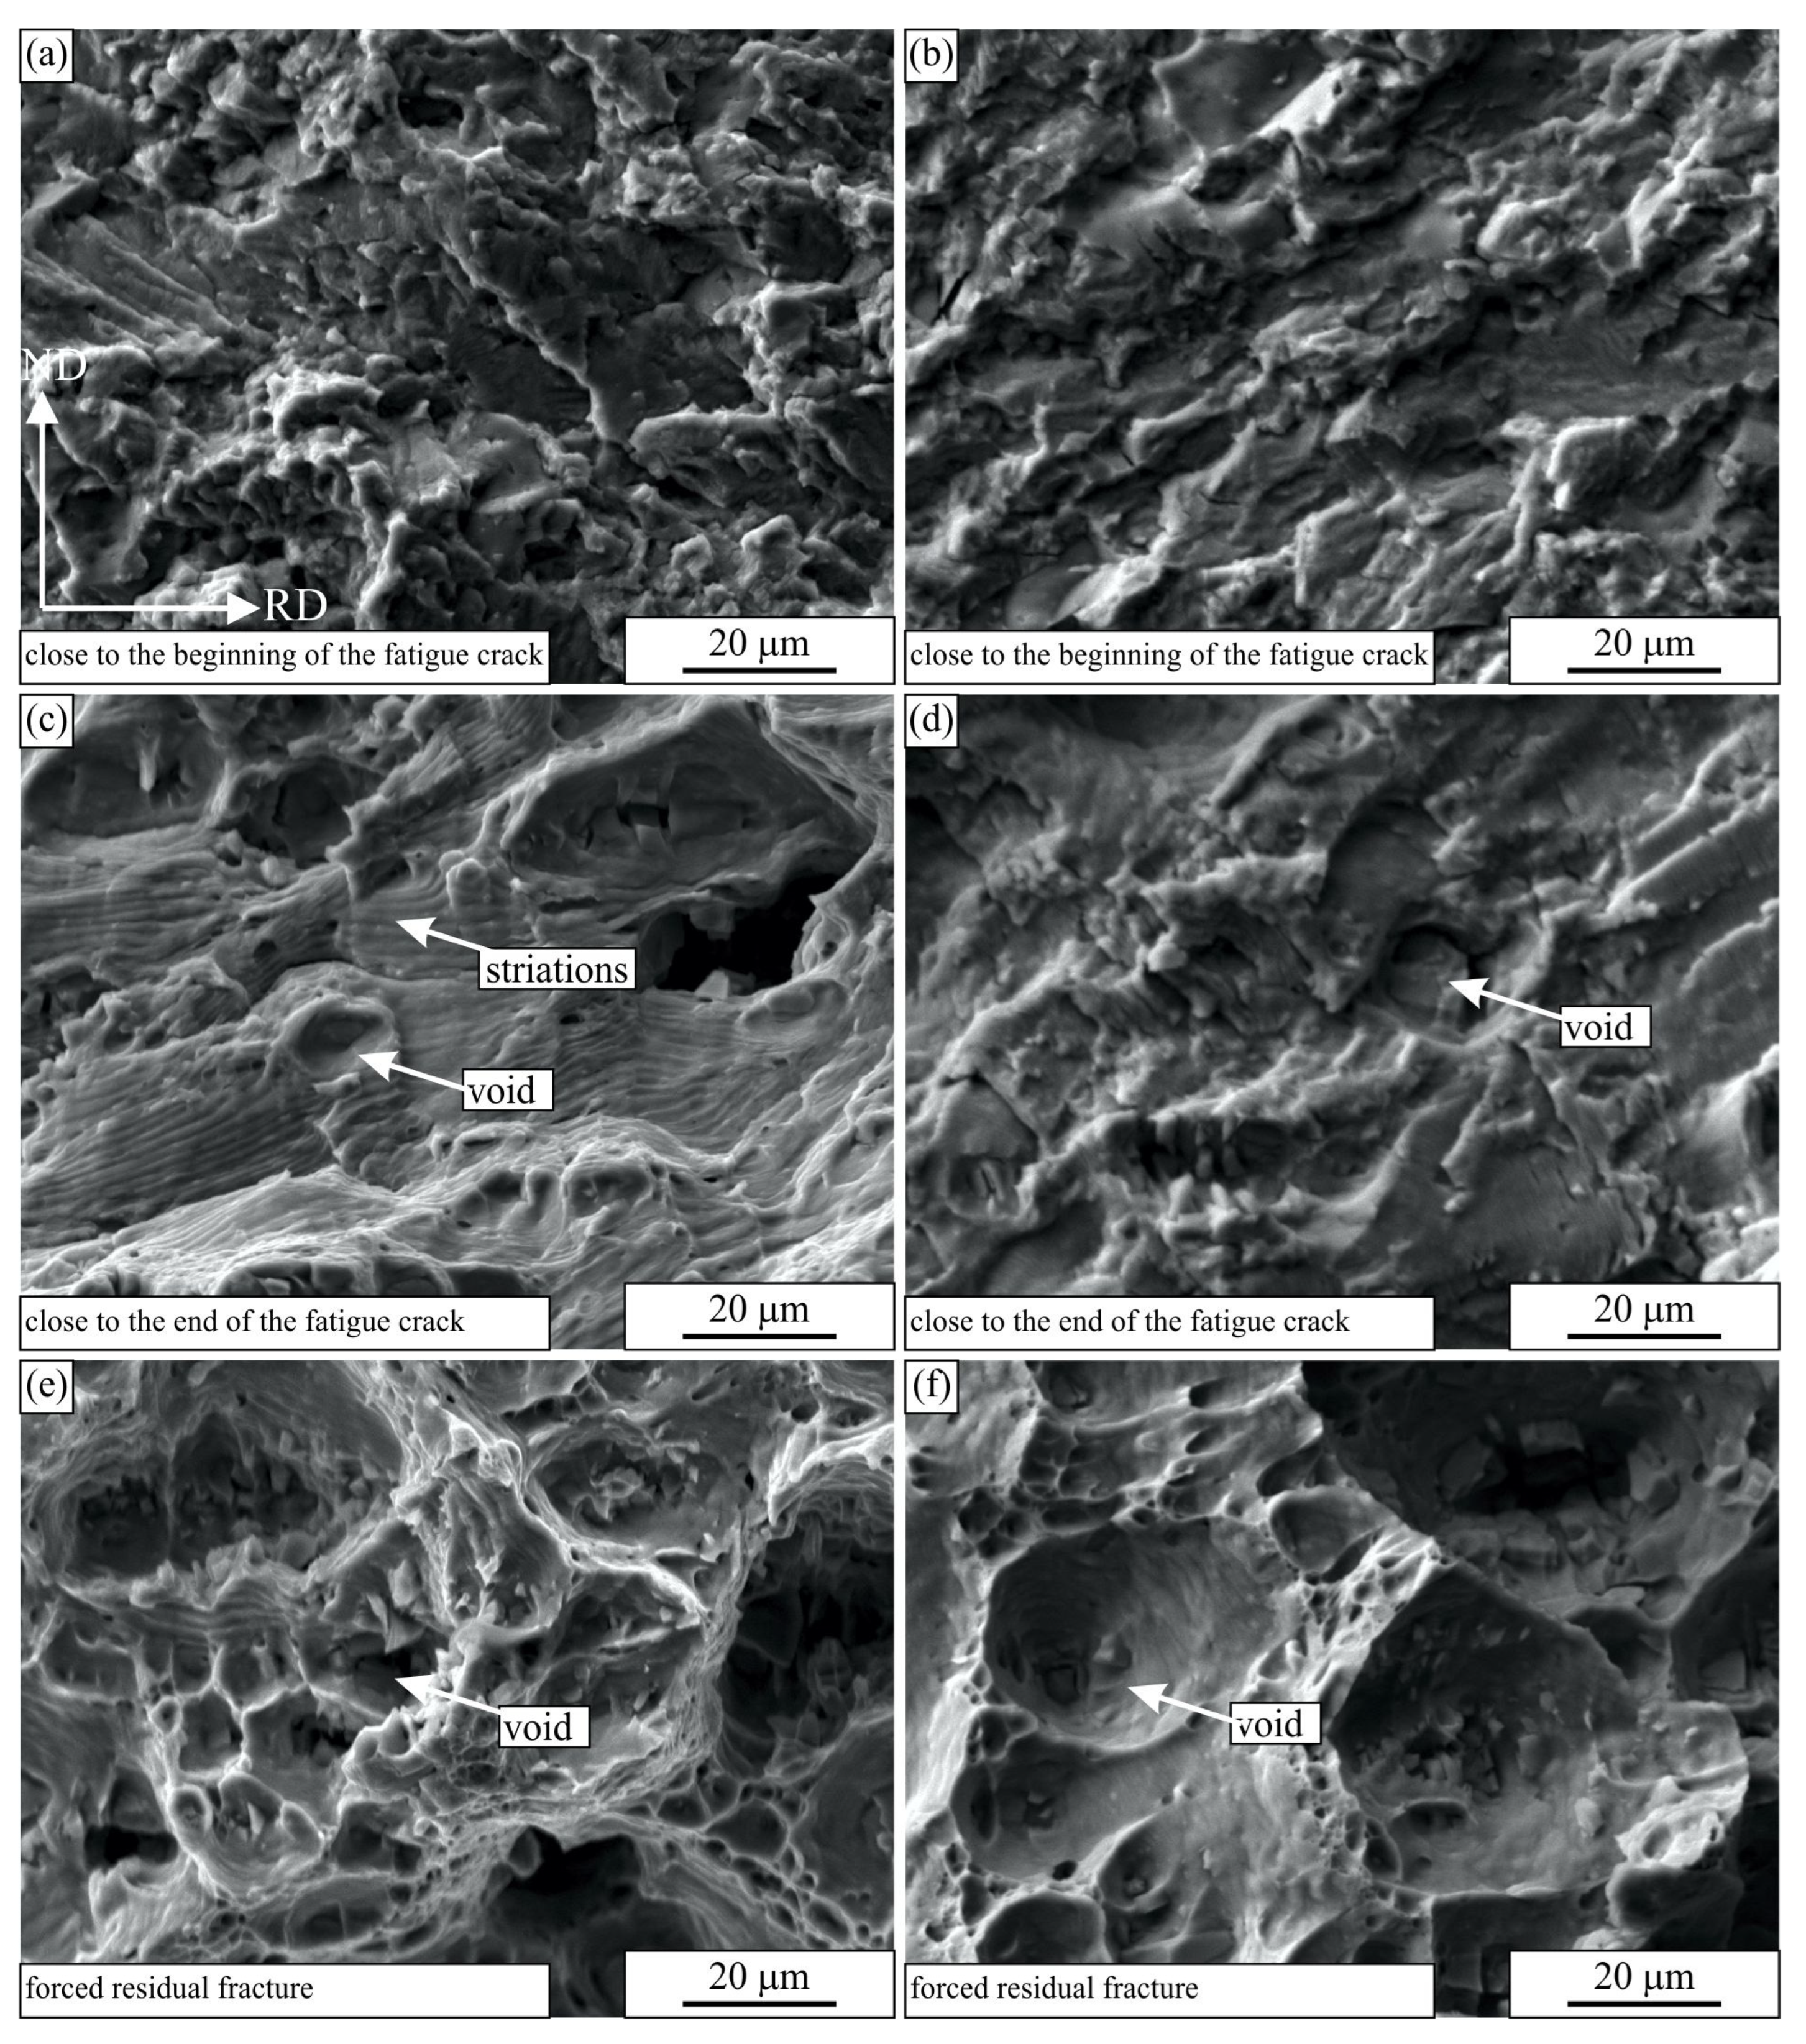
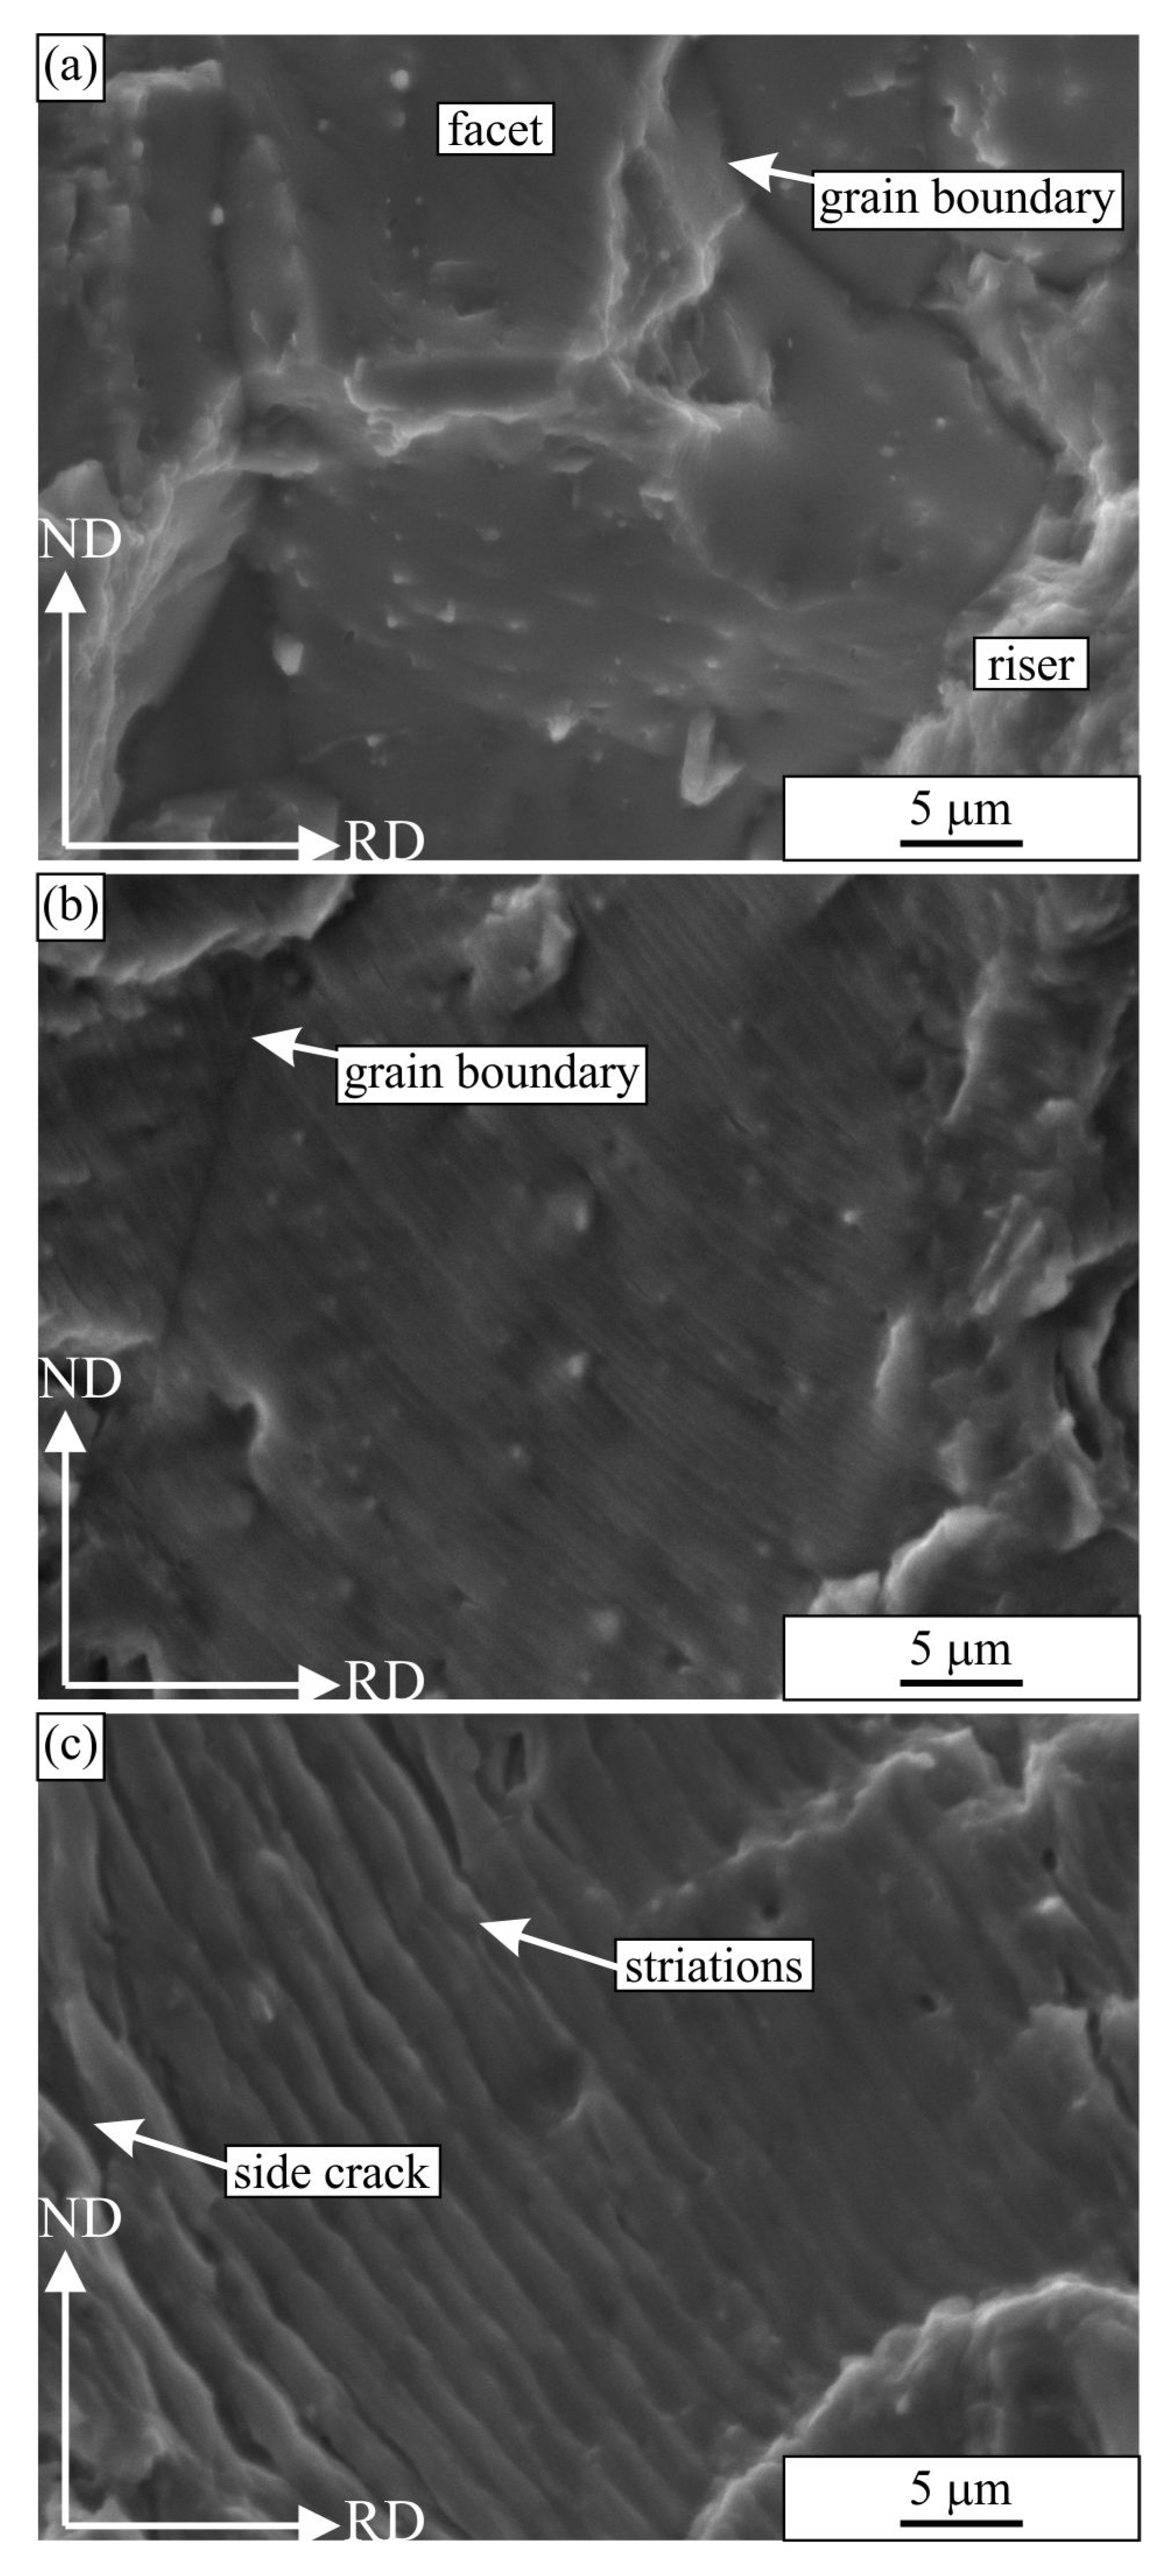
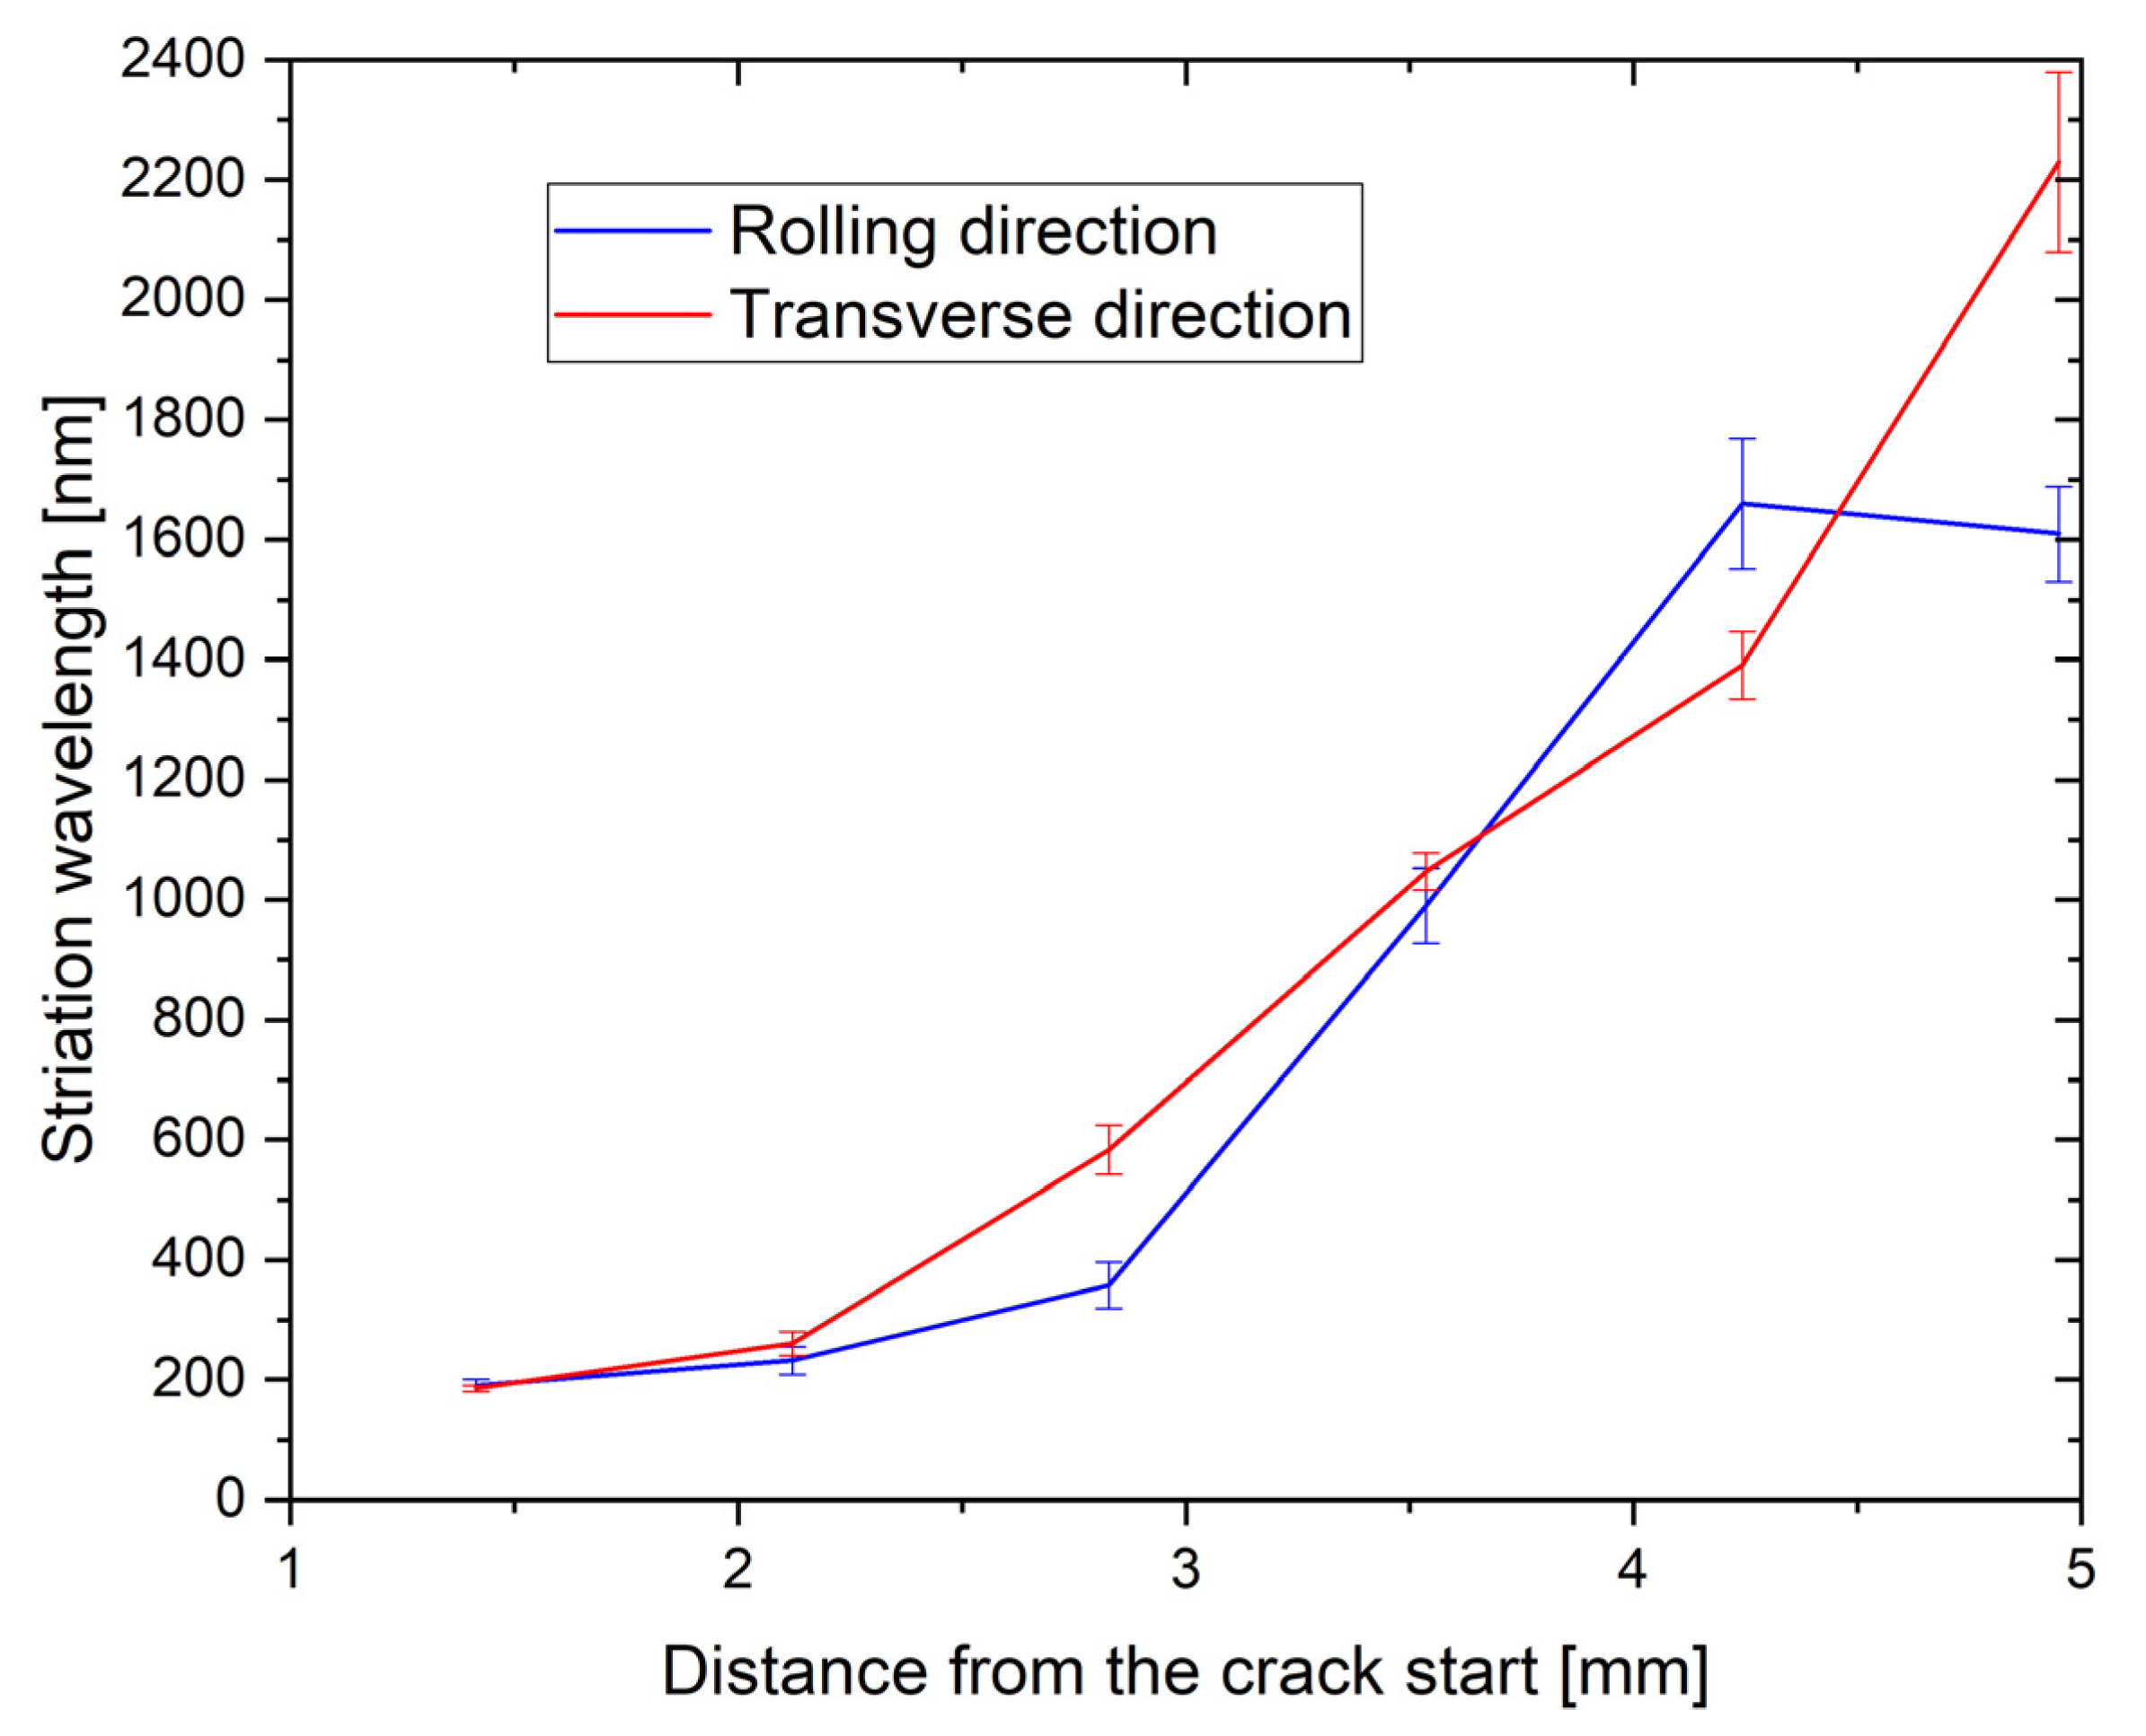
- The micrography of the fractured surfaces of the fatigue specimens has shown that the fracture characteristics are similar for both specimen orientations (longitudinal or transversal). The fracture surface has a typical appearance for the ductile material, characterised by striations during propagation of the fatigue crack and final ductile fracture. The distance between striations increased from the crack beginning (less than 0.5 micrometres) to the crack end (more than 3 micrometres).
- In the proposed research work, we analysed only two specimen orientations: (i) in the rolling direction and (ii) transverse to the rolling direction. The third specimen orientation (45° in regard to the rolling direction) could be investigated in our further research work. Furthermore, further research work should consider the higher number of experiments, especially in the long-life fatigue area (more than 107 loading cycles). In this case, a comprehensive statistical evaluation could be performed to obtain more qualitative results regarding the fatigue behaviour of the analysed aluminium alloy.
Author Contributions
Funding
Data Availability Statement
Acknowledgments
Conflicts of Interest
References
- Hirsch, J.; Al-Samman, T. Superior Light Metals by Texture Engineering: Optimised Aluminum and Magnesium Alloys for Automotive Applications. Acta Mater. 2013, 61, 818–843. [Google Scholar] [CrossRef]
- Liu, Y.; Sun, Y.; Zhang, L.; Zhao, Y.; Wang, J.; Liu, C. Microstructure and Mechanical Properties of Al-5Mg-0.8Mn Alloys with Various Contents of Fe and Si Cast under Near-Rapid Cooling. Metals 2017, 7, 428. [Google Scholar] [CrossRef] [Green Version]
- Jin, H. Optimization of Aluminum Alloy AA5083 for Superplastic and Quick Plastic Forming. Metall. Mater. Trans. A 2019, 50, 3868–3890. [Google Scholar] [CrossRef]
- Ilman, M.N.; Triwibowo, N.A.; Wahyudianto, A.; Muslih, M.R. Environmentally Assisted Fatigue Behaviour of Stress Relieved Metal Inert Gas (MIG) AA5083 Welds in 3.5% NaCl Solution. Int. J. Fatigue 2017, 100, 285–295. [Google Scholar] [CrossRef]
- Billy, R.G.; Müller, D.B. Aluminium Use in Passenger Cars Poses Systemic Challenges for Recycling and GHG Emissions. Resour. Conserv. Recycl. 2023, 190, 106827. [Google Scholar] [CrossRef]
- Tianyu, Z.; Teng, Z.; Yuting, H.; Xianghong, F.; Yaping, B. Probabilistic Model of the Fatigue Life of Epoxy-Coated Aluminum Alloys Considering Atmospheric Exposure. Int. J. Fatigue 2022, 162, 106899. [Google Scholar] [CrossRef]
- Raabe, D.; Ponge, D.; Uggowitzer, P.J.; Roscher, M.; Paolantonio, M.; Liu, C.; Antrekowitsch, H.; Kozeschnik, E.; Seidmann, D.; Gault, B.; et al. Making Sustainable Aluminum by Recycling Scrap: The Science of “Dirty” Alloys. Prog. Mater. Sci. 2022, 128, 100947. [Google Scholar] [CrossRef]
- Hajjioui, E.A.; Bouchaâla, K.; Faqir, M.; Essadiqi, E. A Review of Manufacturing Processes, Mechanical Properties and Precipitations for Aluminum Lithium Alloys Used in Aeronautic Applications. Heliyon 2022, 9, e12565. [Google Scholar] [CrossRef]
- Manuel, N.; Beltrão, D.; Galvão, I.; Leal, R.M.; Costa, J.D.; Loureiro, A. Influence of Tool Geometry and Process Parameters on Torque, Temperature, and Quality of Friction Stir Welds in Dissimilar Al Alloys. Materials 2021, 14, 6020. [Google Scholar] [CrossRef]
- Xu, S.; Chen, J.; Shen, W.; Hou, R.; Wu, Y. Fatigue Strength Evaluation of 5059 Aluminum Alloy Welded Joints Considering Welding Deformation and Residual Stress. Int. J. Fatigue 2022, 162, 106988. [Google Scholar] [CrossRef]
- Bay, R.M.; Shrock, D.J.; Akman, A.M.; Bland, L.G.; Thodla, R.; Lockem, J.S. The effect of sensitization and fatigue loading frequency on corrosion fatigue of AA5083-H131. Int. J. Fatigue 2019, 124, 1–9. [Google Scholar] [CrossRef]
- Sidhom, N.; Moussa, N.B.; Janeb, S.; Braham, C.; Sidhom, H. Potential Fatigue Strength Improvement of AA 5083-H111 Notched Parts by Wire Brush Hammering: Experimental Analysis and Numerical Simulation. Mater. Des. 2014, 64, 503–519. [Google Scholar] [CrossRef] [Green Version]
- Liu, Y.; Luo, L.; Han, C.; Ou, L.; Wang, J.; Liu, C. Effect of Fe, Si and Cooling Rate on the Formation of Fe- and Mn-Rich Intermetallics in Al-5Mg-0.8Mn Alloy. J. Mater. Sci. Technol. 2016, 32, 305–312. [Google Scholar] [CrossRef]
- Ding, S.; Zhang, J.; Khan, S.A.; Yanagimoto, J. Static Recovery of A5083 Aluminum Alloy after a Small Deformation through Various Measuring Approaches. J. Mater. Sci. Technol. 2022, 104, 202–213. [Google Scholar] [CrossRef]
- Dowling, N.E. Mechanical Behavior of Materials; Cambridge University Press: Cambridge, UK, 2000; Volume 15, ISBN 978-0-13-139506-0. [Google Scholar]
- Klemenc, J.; Šeruga, D.; Nagode, A.; Nagode, M. Comprehensive Modelling of the Hysteresis Loops and Strain–Energy Density for Low-Cycle Fatigue-Life Predictions of the AZ31 Magnesium Alloy. Materials 2019, 12, 3692. [Google Scholar] [CrossRef] [PubMed] [Green Version]
- Tomažinčič, D.; Nečemer, B.; Vesenjak, M.; Klemenc, J. Low-Cycle Fatigue Life of Thin-Plate Auxetic Cellular Structures Made from Aluminium Alloy 7075-T651. Fatigue Fract. Eng. Mater. Struct. 2019, 42, 1022–1036. [Google Scholar] [CrossRef] [Green Version]
- Sedighi, M.; Monshi, P.; Joudaki, J. Investigation of Mechanical Properties and Fatigue Life of ECARed AA5083 Aluminium Alloy. Fatigue Fract. Eng. Mater. Struct. 2017, 40, 412–422. [Google Scholar] [CrossRef]
- Ma, M.; Zhang, J.; Yi, D.; Wang, B. Investigation of High-Cycle Fatigue and Fatigue Crack Propagation Characteristic in 5083-O Aluminum Alloy. Int. J. Fatigue 2019, 126, 357–368. [Google Scholar] [CrossRef]
- Meng, L.; Goyal, A.; Doquet, V.; Ranc, N.; Couzinié, J.-P. Ultrafine versus Coarse Grained Al 5083 Alloys: From Low-Cycle to Very-High-Cycle Fatigue. Int. J. Fatigue 2019, 121, 84–97. [Google Scholar] [CrossRef] [Green Version]
- Ben Ali, N.; Estevez, R.; Tanguy, D. Heterogeneity of Grain Boundaries in 5xxx and 7xxx Aluminum Alloys and Its Influence on Intergranular Toughness. Eng. Fract. Mech. 2013, 97, 1–11. [Google Scholar] [CrossRef]
- Hockauf, K.; Wagner, M.F.-X.; Halle, T.; Niendorf, T.; Hockauf, M.; Lampke, T. Influence of Precipitates on Low-Cycle Fatigue and Crack Growth Behavior in an Ultrafine-Grained Aluminum Alloy. Acta Mater. 2014, 80, 250–263. [Google Scholar] [CrossRef]
- Wu, Y.; Liao, H.; Tang, Y. Enhanced High-Cycle Fatigue Strength of Al–12Si–4Cu-1.2Mn-T6 Cast Aluminum Alloy at Room Temperature and 350 C. Mater. Sci. Eng. A 2021, 825, 141917. [Google Scholar] [CrossRef]
- Khisheh, S.; Khalili, K.; Azadi, M.; Hendouabadi, V.Z. Influences of Roughness and Heat Treatment on High-Cycle Bending Fatigue Properties of A380 Aluminum Alloy under Stress-Controlled Cyclic Loading. Mater. Chem. Phys. 2021, 264, 124475. [Google Scholar] [CrossRef]
- Gao, T.; Sun, Z.; Xue, H.; Retraint, D. Effect of Surface Mechanical Attrition Treatment on High Cycle and Very High Cycle Fatigue of a 7075-T6 Aluminium Alloy. Int. J. Fatigue 2020, 139, 105798. [Google Scholar] [CrossRef]
- Meng, X.; Leng, X.; Shan, C.; Zhou, L.; Zhou, J.; Huang, S.; Lu, J. Vibration Fatigue Performance Improvement in 2024-T351 Aluminum Alloy by Ultrasonic-Assisted Laser Shock Peening. Int. J. Fatigue 2023, 168, 107471. [Google Scholar] [CrossRef]
- Xing, S.; Pei, X.; Mei, J.; Dong, P.; Su, S.; Zhen, C. Weld Toe versus Root Fatigue Failure Mode and Governing Parameters: A Study of Aluminum Alloy Load-Carrying Fillet Joints. Mar. Struct. 2023, 88, 103344. [Google Scholar] [CrossRef]
- Sakin, R. Investigation of Bending Fatigue-Life of Aluminum Sheets Based on Rolling Direction. Alex. Eng. J. 2018, 57, 35–47. [Google Scholar] [CrossRef]
- Nečemer, B.; Klemenc, J.; Zupanič, F.; Glodež, S. Modelling and Predicting of the LCF-Behaviour of Aluminium Auxetic Structures. Int. J. Fatigue 2022, 156, 106673. [Google Scholar] [CrossRef]
- Kramberger, J.; Nečemer, B.; Glodež, S. Assessing the Cracking Behavior of Auxetic Cellular Structures by Using Both a Numerical and an Experimental Approach. Theor. Appl. Fract. Mech. 2019, 101, 17–24. [Google Scholar] [CrossRef]
- Nečemer, B.; Kramberger, J.; Vuherer, T.; Glodež, S. Fatigue Crack Initiation and Propagation in Re-Entrant Auxetic Cellular Structures. Int. J. Fatigue 2019, 126, 241–247. [Google Scholar] [CrossRef]
- Nečemer, B.; Vuherer, T.; Glodež, S.; Kramberger, J. Fatigue Behaviour of Re-Entrant Auxetic Structures Made of the Aluminium Alloy AA7075-T651. Thin-Walled Struct. 2022, 180, 109917. [Google Scholar] [CrossRef]
- Nečemer, B.; Zupanič, F.; Gabriel, D.; Tarquino, E.A.; Šraml, M.; Glodež, S. Low Cycle Fatigue Behaviour of Ductile Aluminium Alloys Using the Inelastic Energy Approach. Mater. Sci. Eng. A 2021, 800, 140385. [Google Scholar] [CrossRef]
- Nečemer, B.; Klemenc, J.; Glodež, S. The Computational LCF-Analyses of Chiral and Re-Entrant Auxetic Structure Using the Direct Cyclic Algorithm. Mater. Sci. Eng. A 2020, 789, 139618. [Google Scholar] [CrossRef]
- Lehmhus, D.; Vesenjak, M.; de Schampheleire, S.; Fiedler, T. From Stochastic Foam to Designed Structure: Balancing Cost and Performance of Cellular Metals. Materials 2017, 10, 922. [Google Scholar] [CrossRef] [PubMed] [Green Version]
- Yen, B.T.; Hodgson, I.C.; Zhou, Y.E.; Crudele, B.B. Bilinear S-N Curves and Equivalent Stress Ranges for Fatigue Life Estimation. J. Bridg. Eng. 2013, 18, 26–30. [Google Scholar] [CrossRef]
- Tanaka, K.; Akiniwa, Y. A Model for Propagation of Small Fatigue Crack Interacting with Grain Boundary. J. Soc. Mater. Sci. Jpn. 1985, 34, 1301–1307. [Google Scholar] [CrossRef]
- Tanaka, K. Fatigue Crack Propagation. In Comprehensive Structural Integrity; Milne, I., Ritchie, R.O., Karihaloo, B., Eds.; Pergamon: Oxford, UK, 2003. [Google Scholar]
- Pineau, A.; McDowell, D.L.; Busso, E.P.; Antolovich, S.D. Failure of Metals II: Fatigue. Acta Mater. 2016, 107, 484–507. [Google Scholar] [CrossRef]


| Al [wt %] | Mg [wt %] | Mn [wt %] | Si [wt %] | Fe [wt %] | Zn [wt %] | Cr [wt %] | Ti [wt %] | Cu [wt %] |
|---|---|---|---|---|---|---|---|---|
| 92.55 | 4.9 | 1 | 0.4 | 0.4 | 0.25 | 0.25 | 0.15 | 0.1 |
| Young’s Modulus E [GPa] | Yield Stress [MPa] | UTS [MPa] | Elongation A [%] | ||||
|---|---|---|---|---|---|---|---|
| (RD) | (TD) | (RD) | (TD) | (RD) | (TD) | (RD) | (TD) |
| 70.8 | 71.2 | 143.2 | 141.9 | 293.9 | 284.2 | 22.2 | 21.9 |
| Number of Cycles at the Knee Point Nk [Cycles] | Stress Amplitude at the Knee Point σa,k [MPa] | Slope before the Knee Point k [/] | Slope after the Knee Point K∗ [/] | ||||
|---|---|---|---|---|---|---|---|
| (RD) | (TD) | (RD) | (TD) | (RD) | (TD) | (RD) | (TD) |
| 596,500 | 348,500 | 60.2 | 59.7 | 10.02 | 6.14 | 389.04 | 199.5 |
Disclaimer/Publisher’s Note: The statements, opinions and data contained in all publications are solely those of the individual author(s) and contributor(s) and not of MDPI and/or the editor(s). MDPI and/or the editor(s) disclaim responsibility for any injury to people or property resulting from any ideas, methods, instructions or products referred to in the content. |
© 2023 by the authors. Licensee MDPI, Basel, Switzerland. This article is an open access article distributed under the terms and conditions of the Creative Commons Attribution (CC BY) license (https://creativecommons.org/licenses/by/4.0/).
Share and Cite
Nečemer, B.; Zupanič, F.; Vuherer, T.; Glodež, S. High-Cycle Fatigue Behaviour of the Aluminium Alloy 5083-H111. Materials 2023, 16, 2674. https://doi.org/10.3390/ma16072674
Nečemer B, Zupanič F, Vuherer T, Glodež S. High-Cycle Fatigue Behaviour of the Aluminium Alloy 5083-H111. Materials. 2023; 16(7):2674. https://doi.org/10.3390/ma16072674
Chicago/Turabian StyleNečemer, Branko, Franc Zupanič, Tomaž Vuherer, and Srečko Glodež. 2023. "High-Cycle Fatigue Behaviour of the Aluminium Alloy 5083-H111" Materials 16, no. 7: 2674. https://doi.org/10.3390/ma16072674