
Characterization of 5356 Aluminum Walls Produced by Wire Arc Additive Manufacturing (WAAM)
 ,
,  , , and
Abstract
:1. Introduction
2. Materials and Methods
2.1. Materials
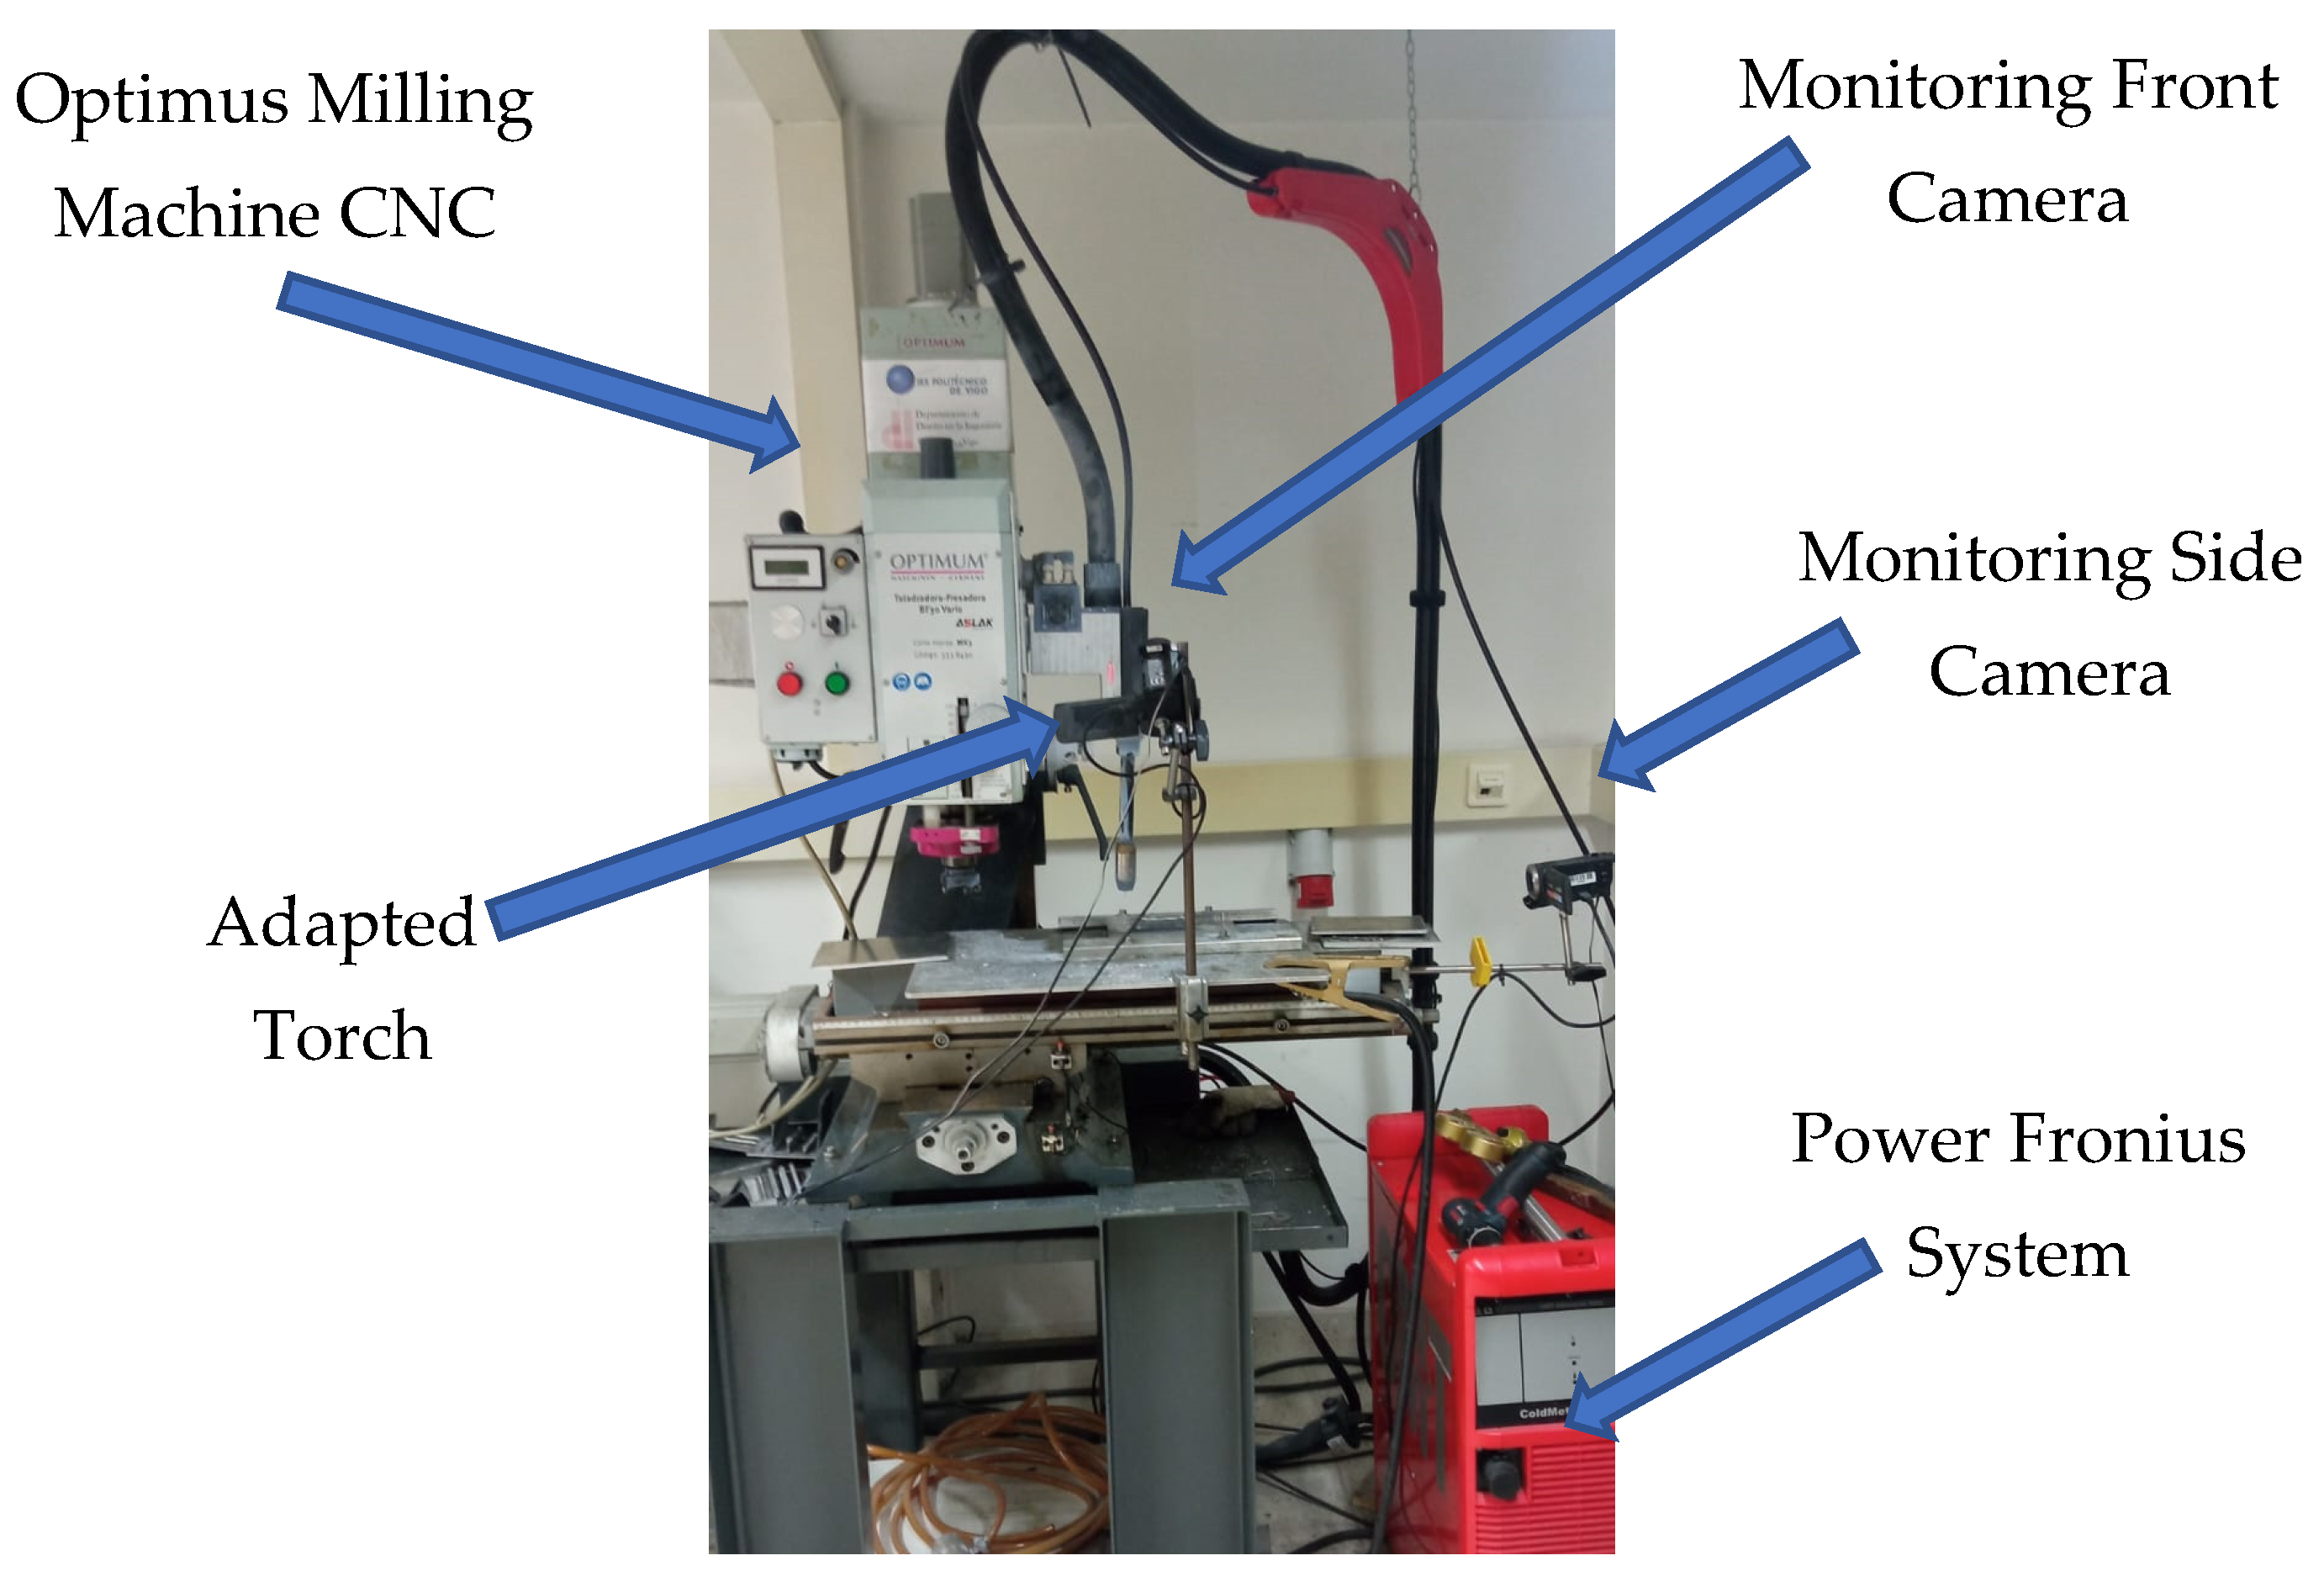
2.2. Equipment
- The welding machine was a Fronius TPS 4000 CMT R machine, which allows welding using Fronius® patented CMT technology. The results are reduced welding temperature and optimized wire movement. Thus, the machine offers a better weld seam quality than the conventional GMAW welding process.
- Positioning system. The BF 30 Vario Optimum CNC milling machine efficiently manages the movement of the entire system. This machine was adapted to position the torch weld in the Z axis. The movement of the X-Y table of the CNC system makes it possible to deposit a layer of weld on a fixed Z level with the welding torch attached to the milling machine head. An auxiliary worktable was required to isolate both systems electrically.
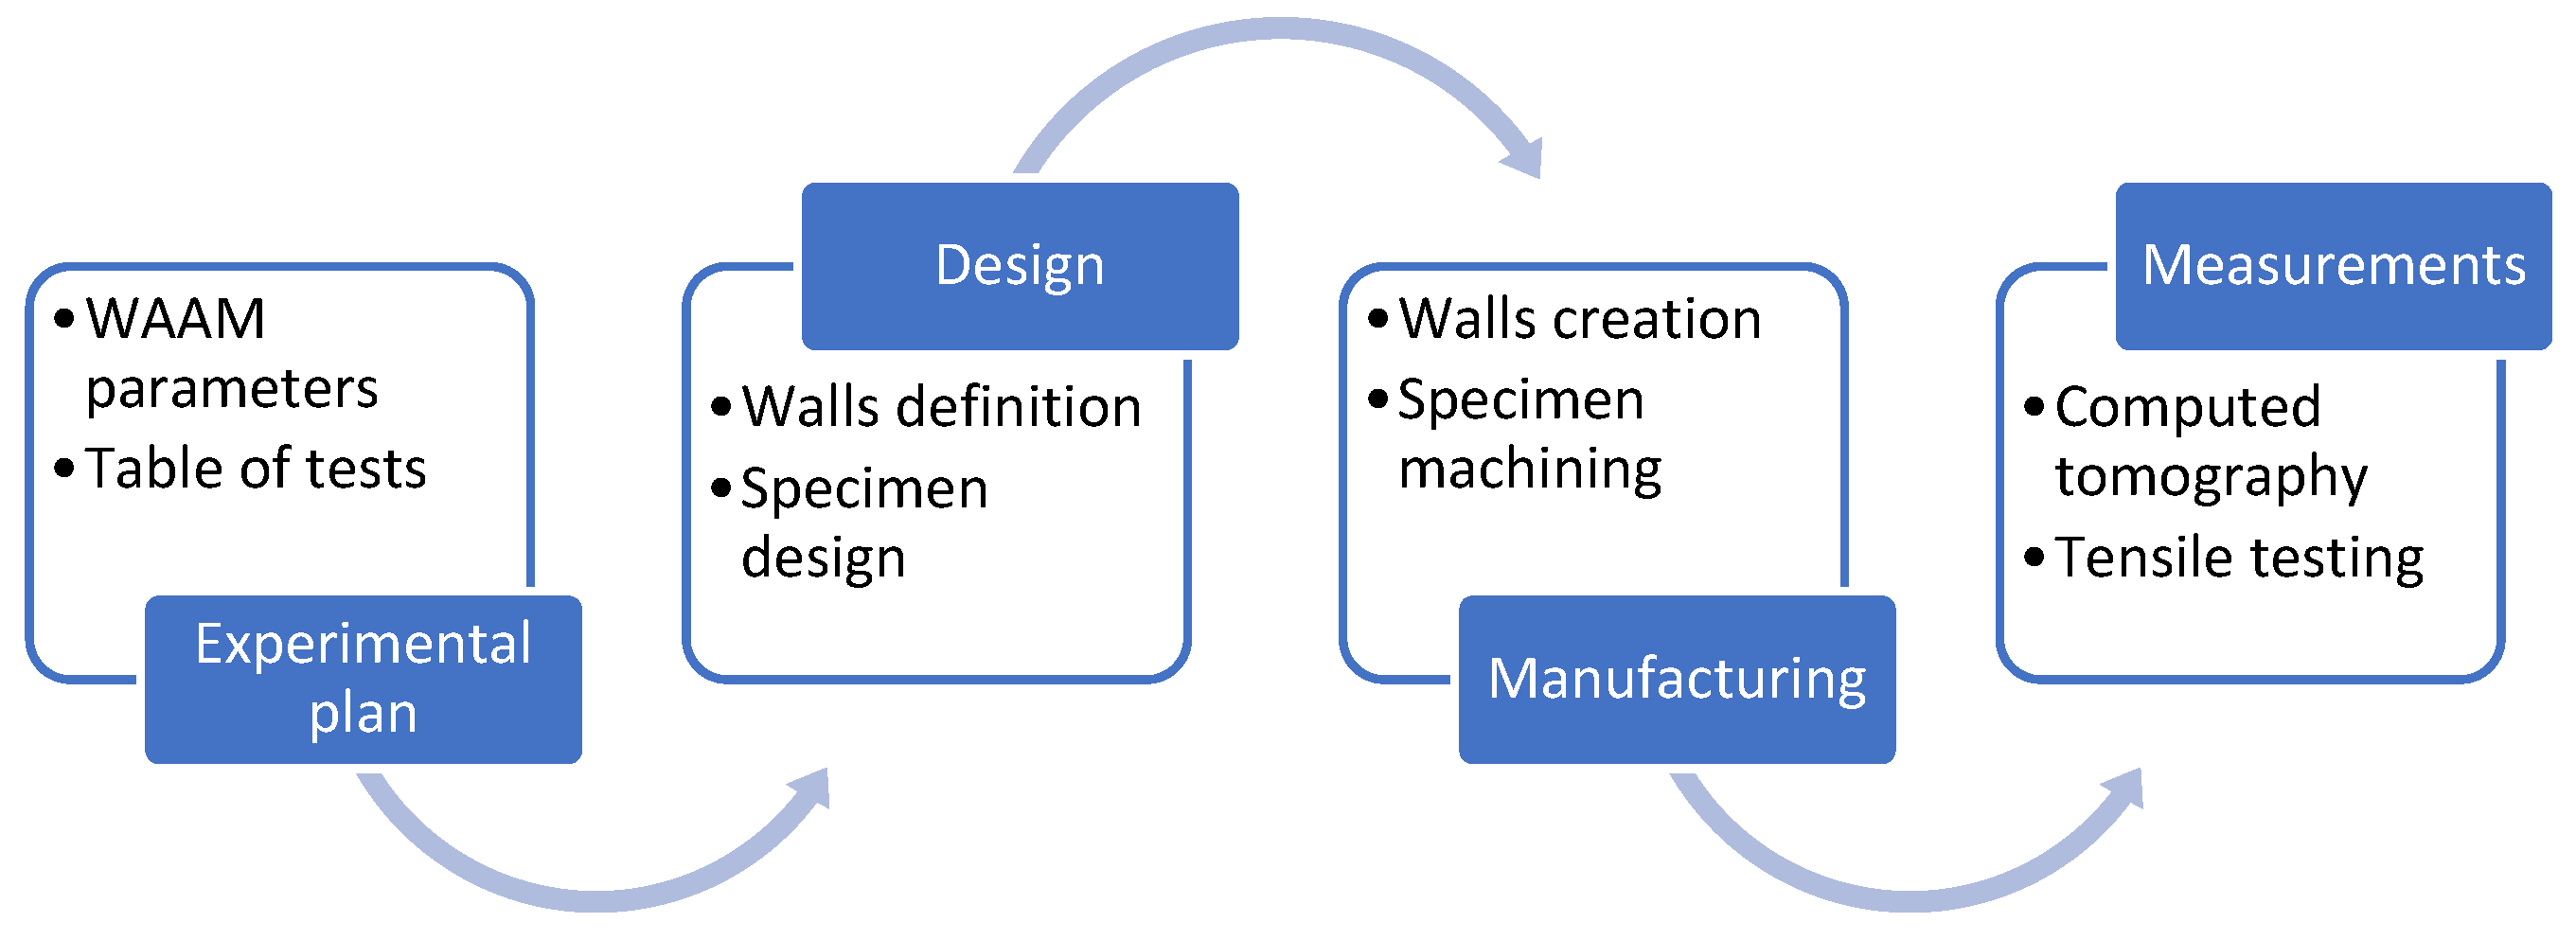
2.3. Reseach Methodology
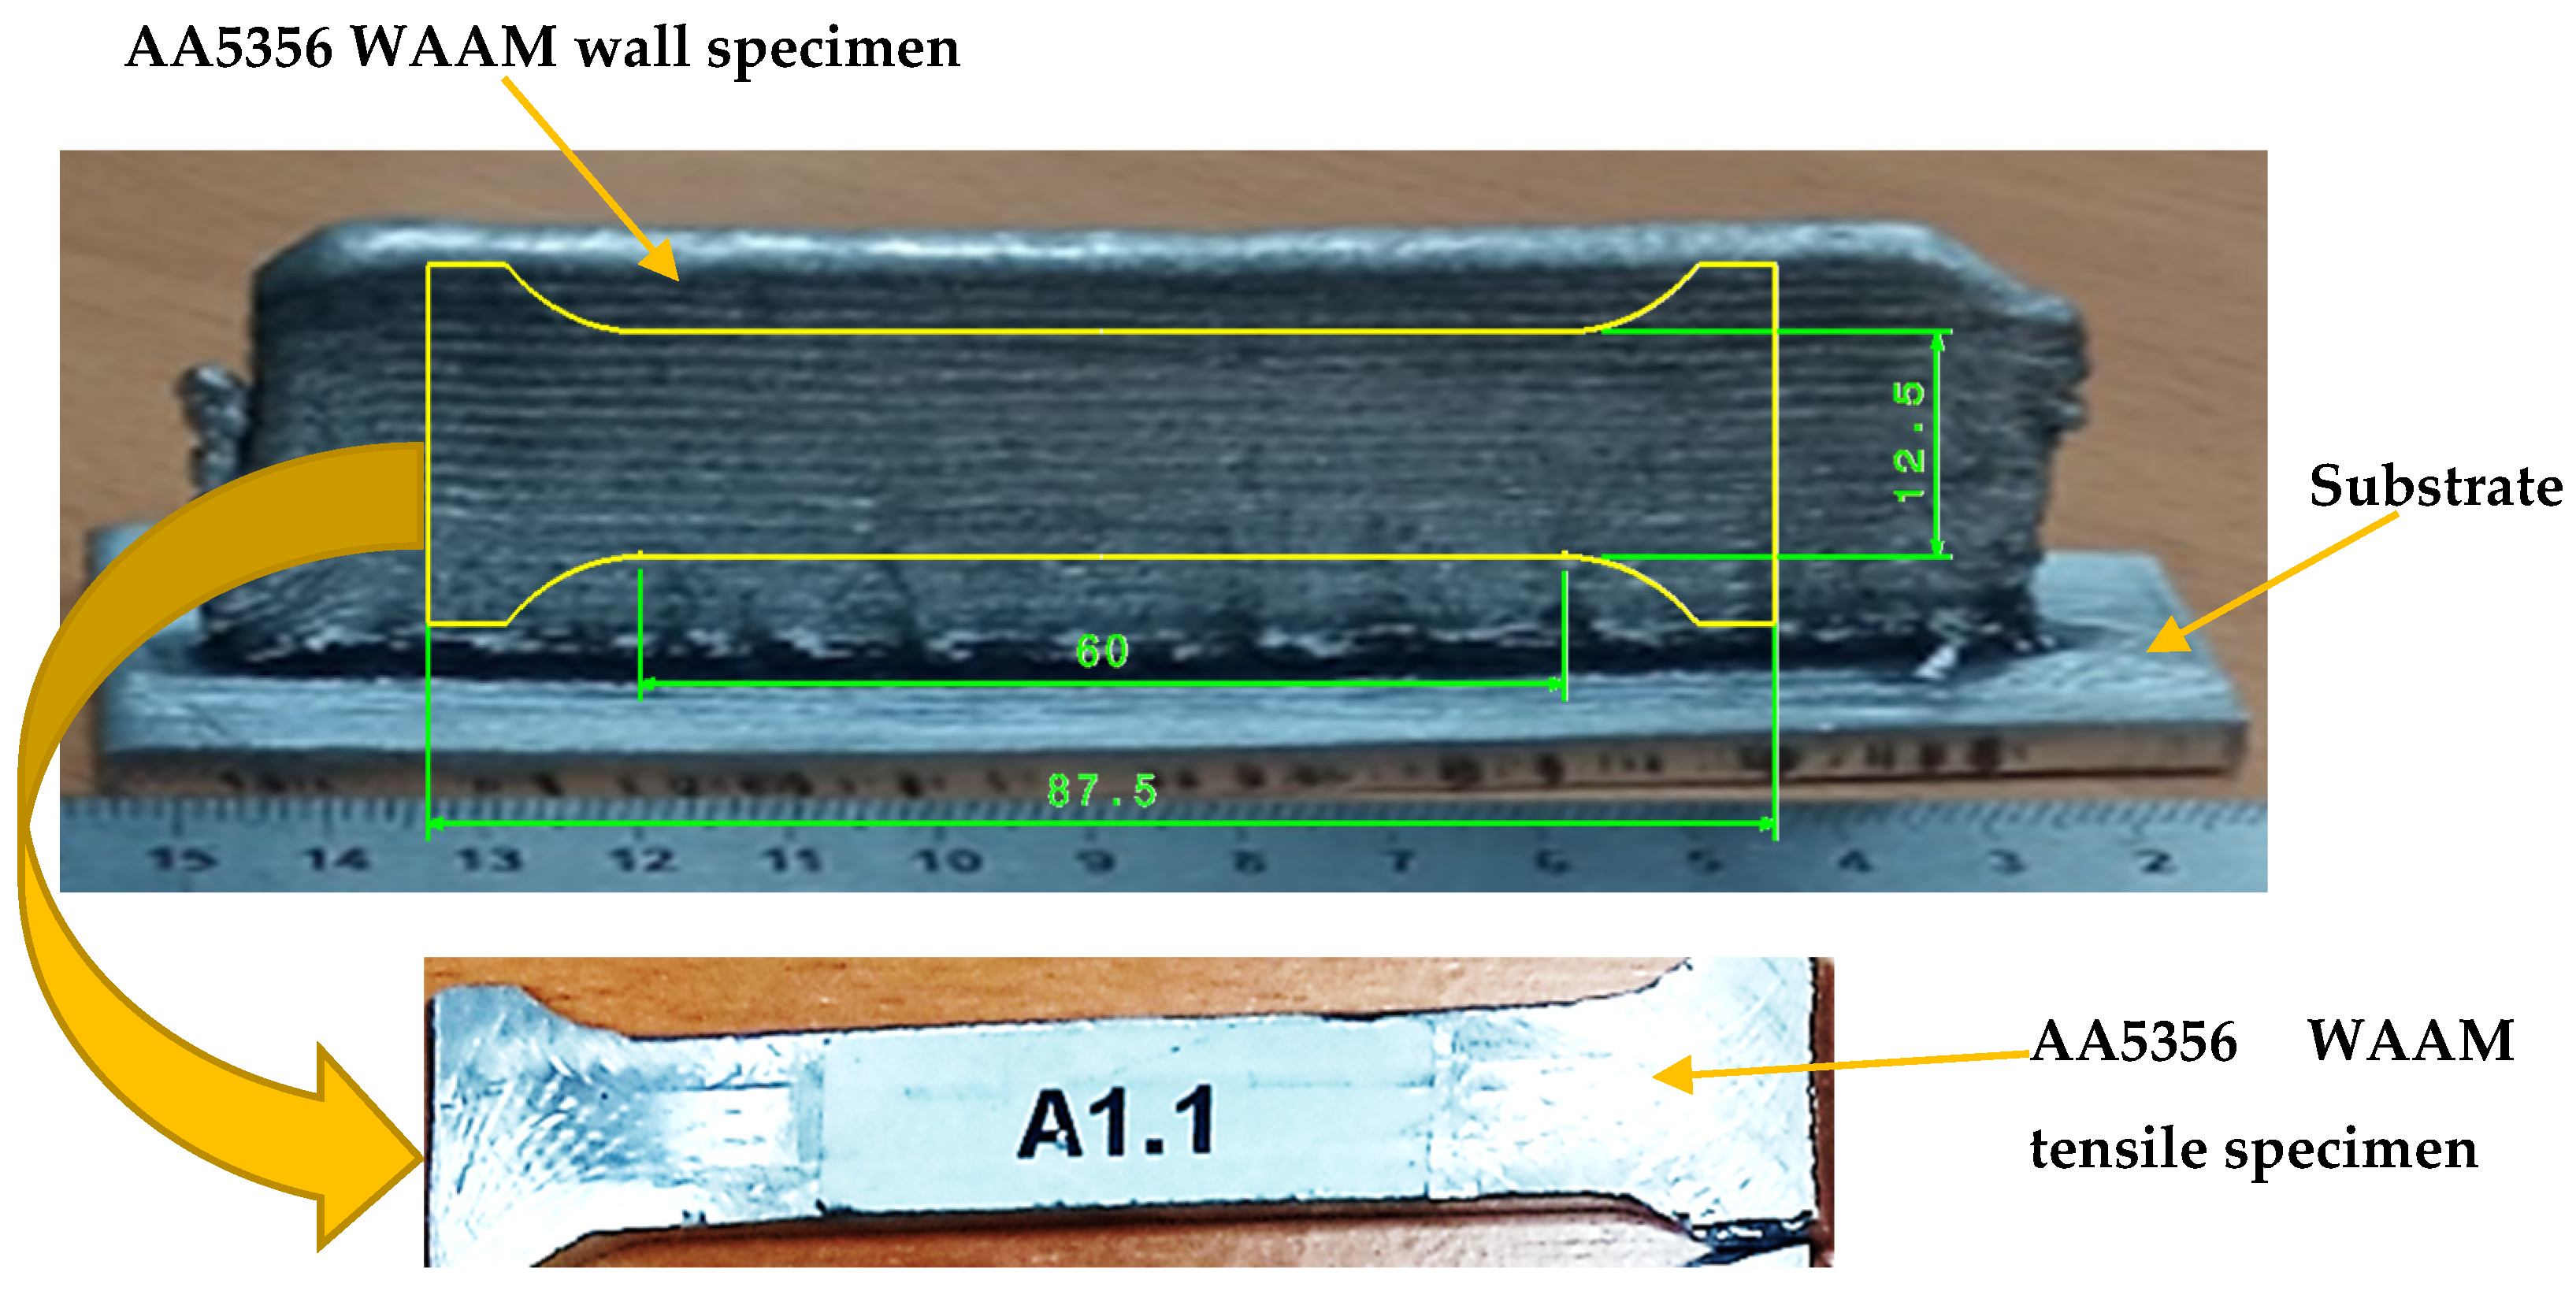
2.4. Design and Manufacturing of the Specimens
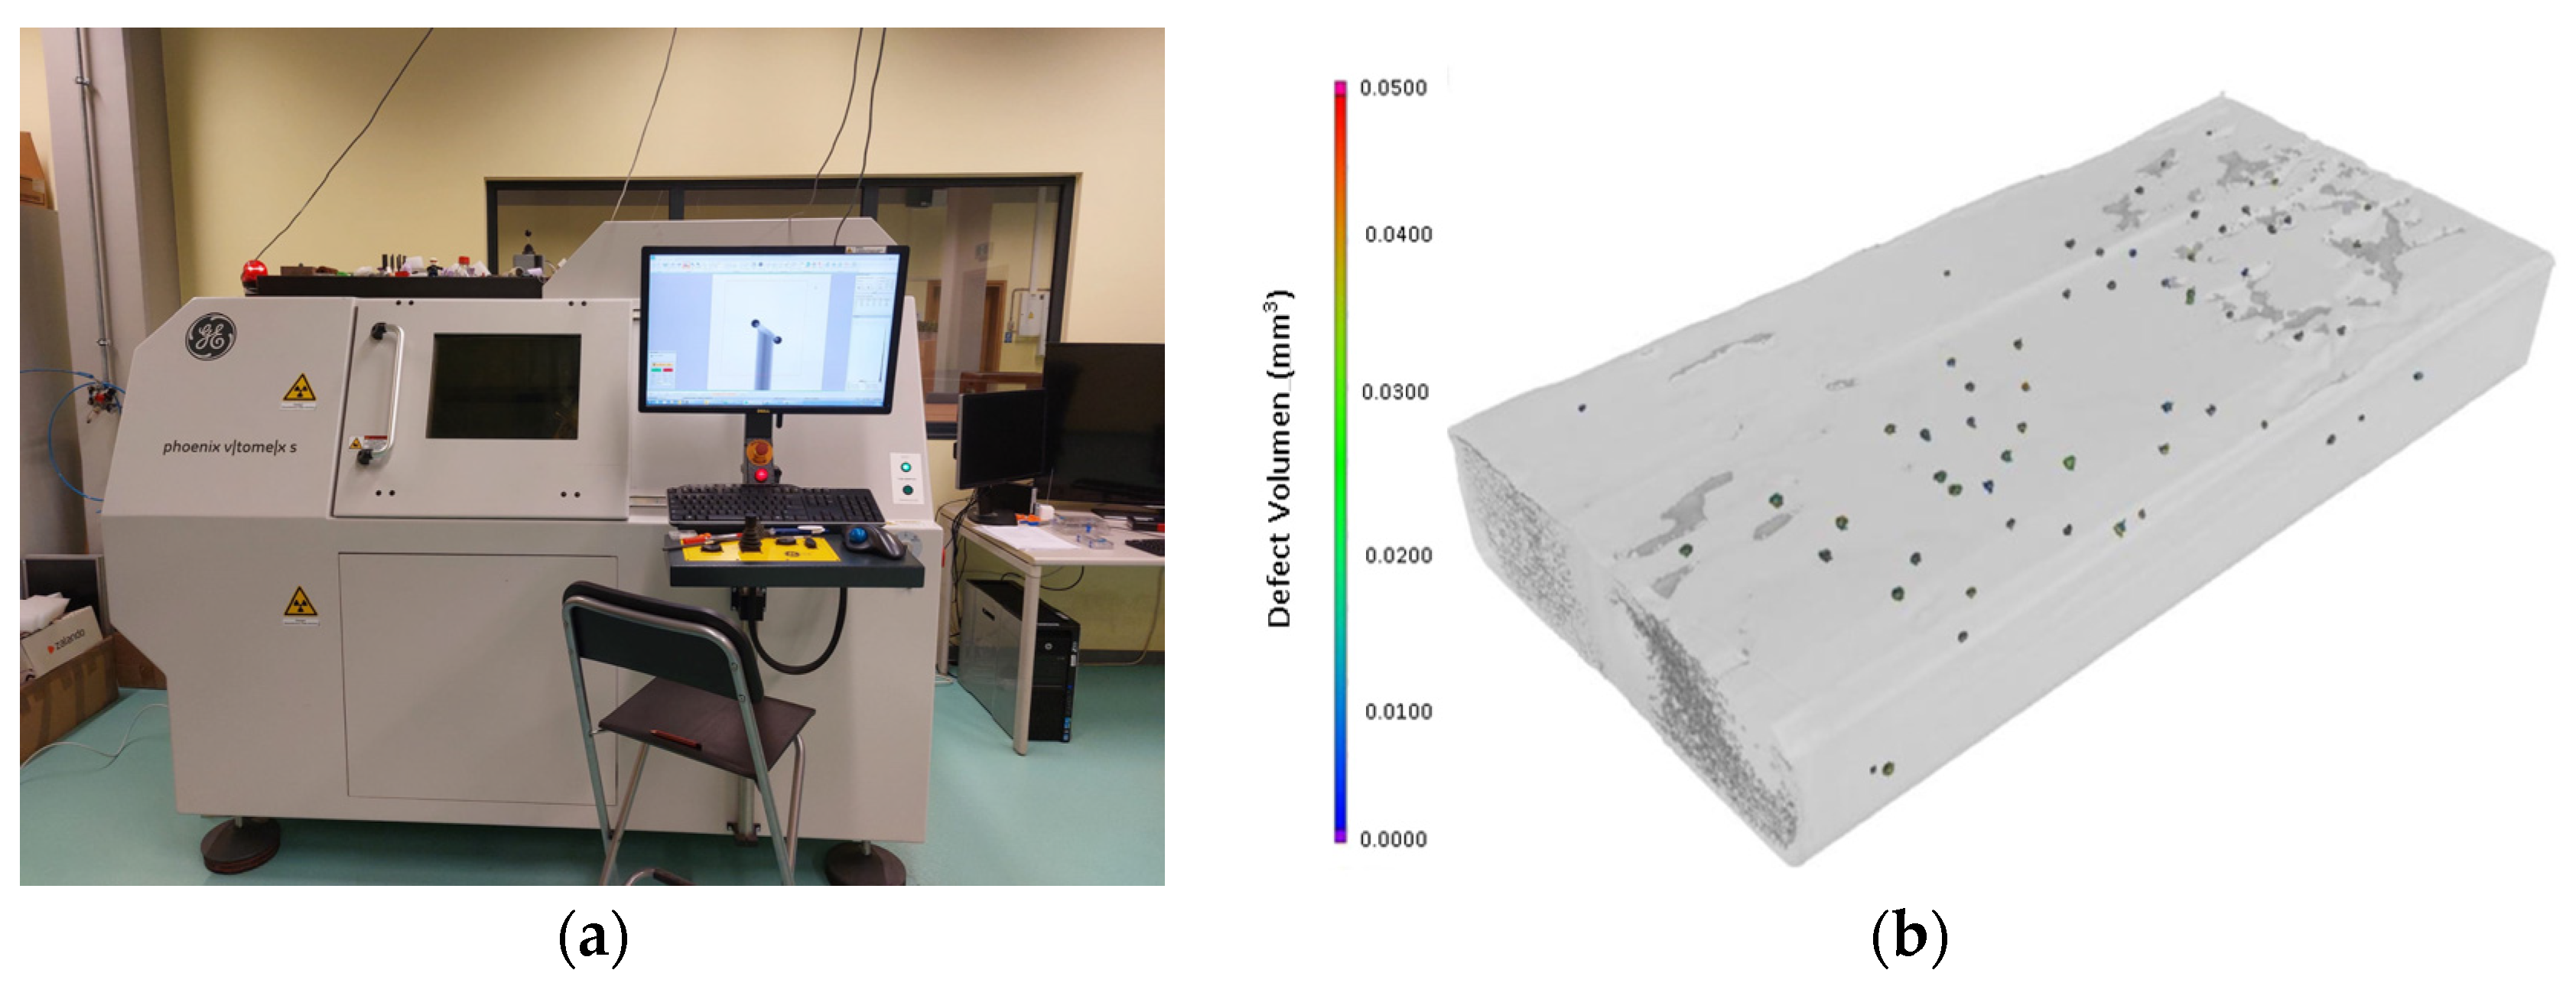
2.5. Measurements
3. Results and Discussion
3.1. Process Parameters and Porosity Analysis
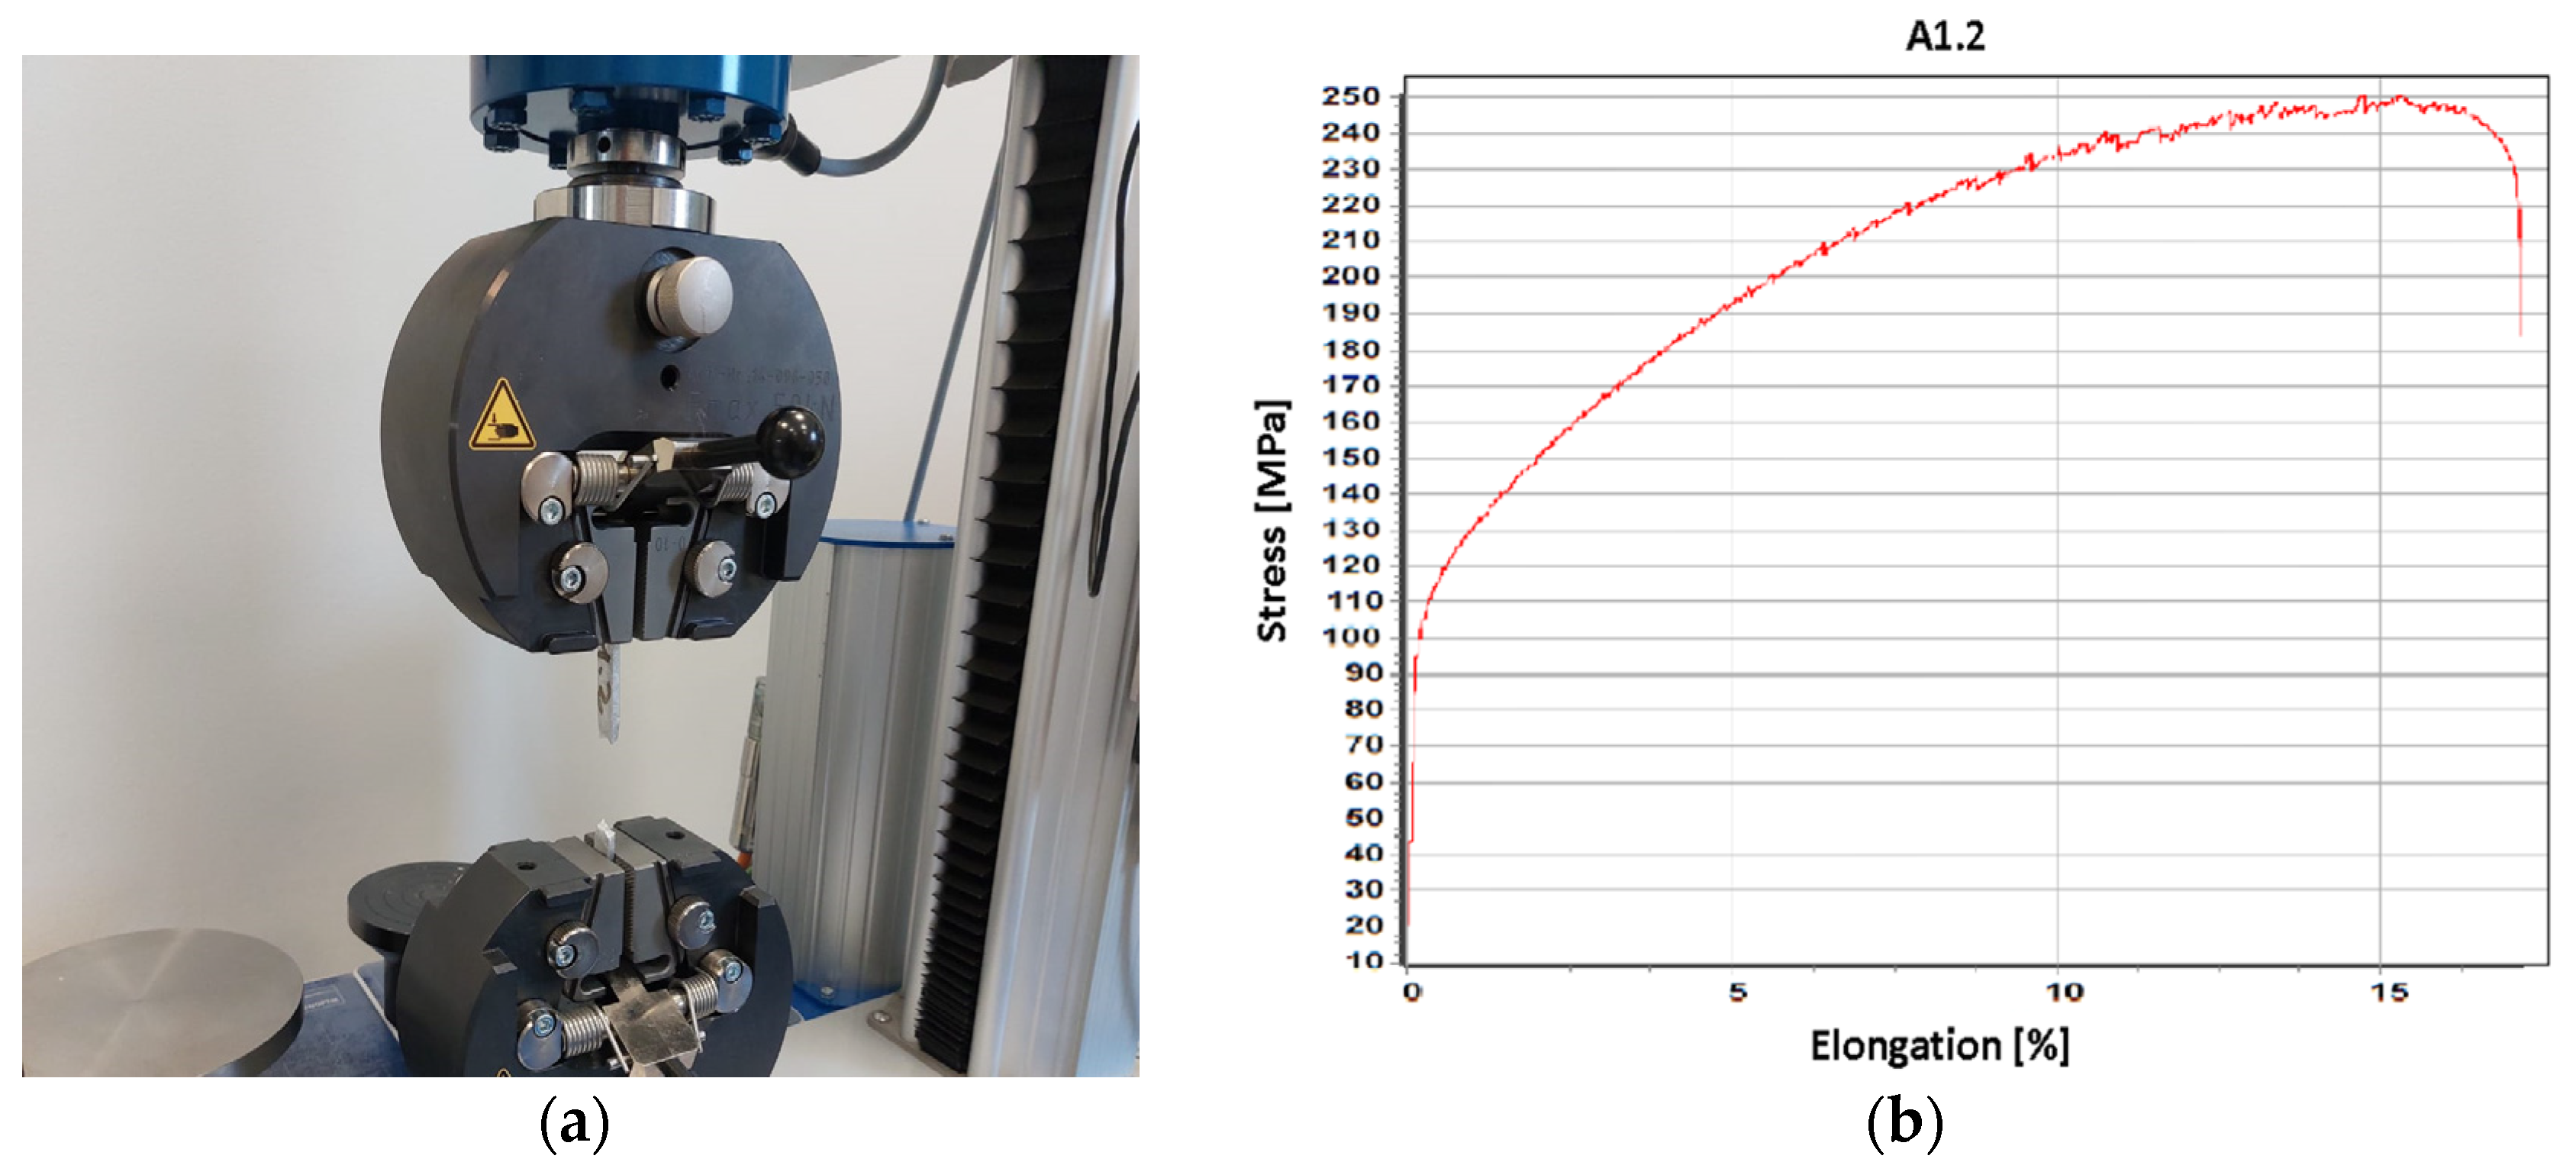
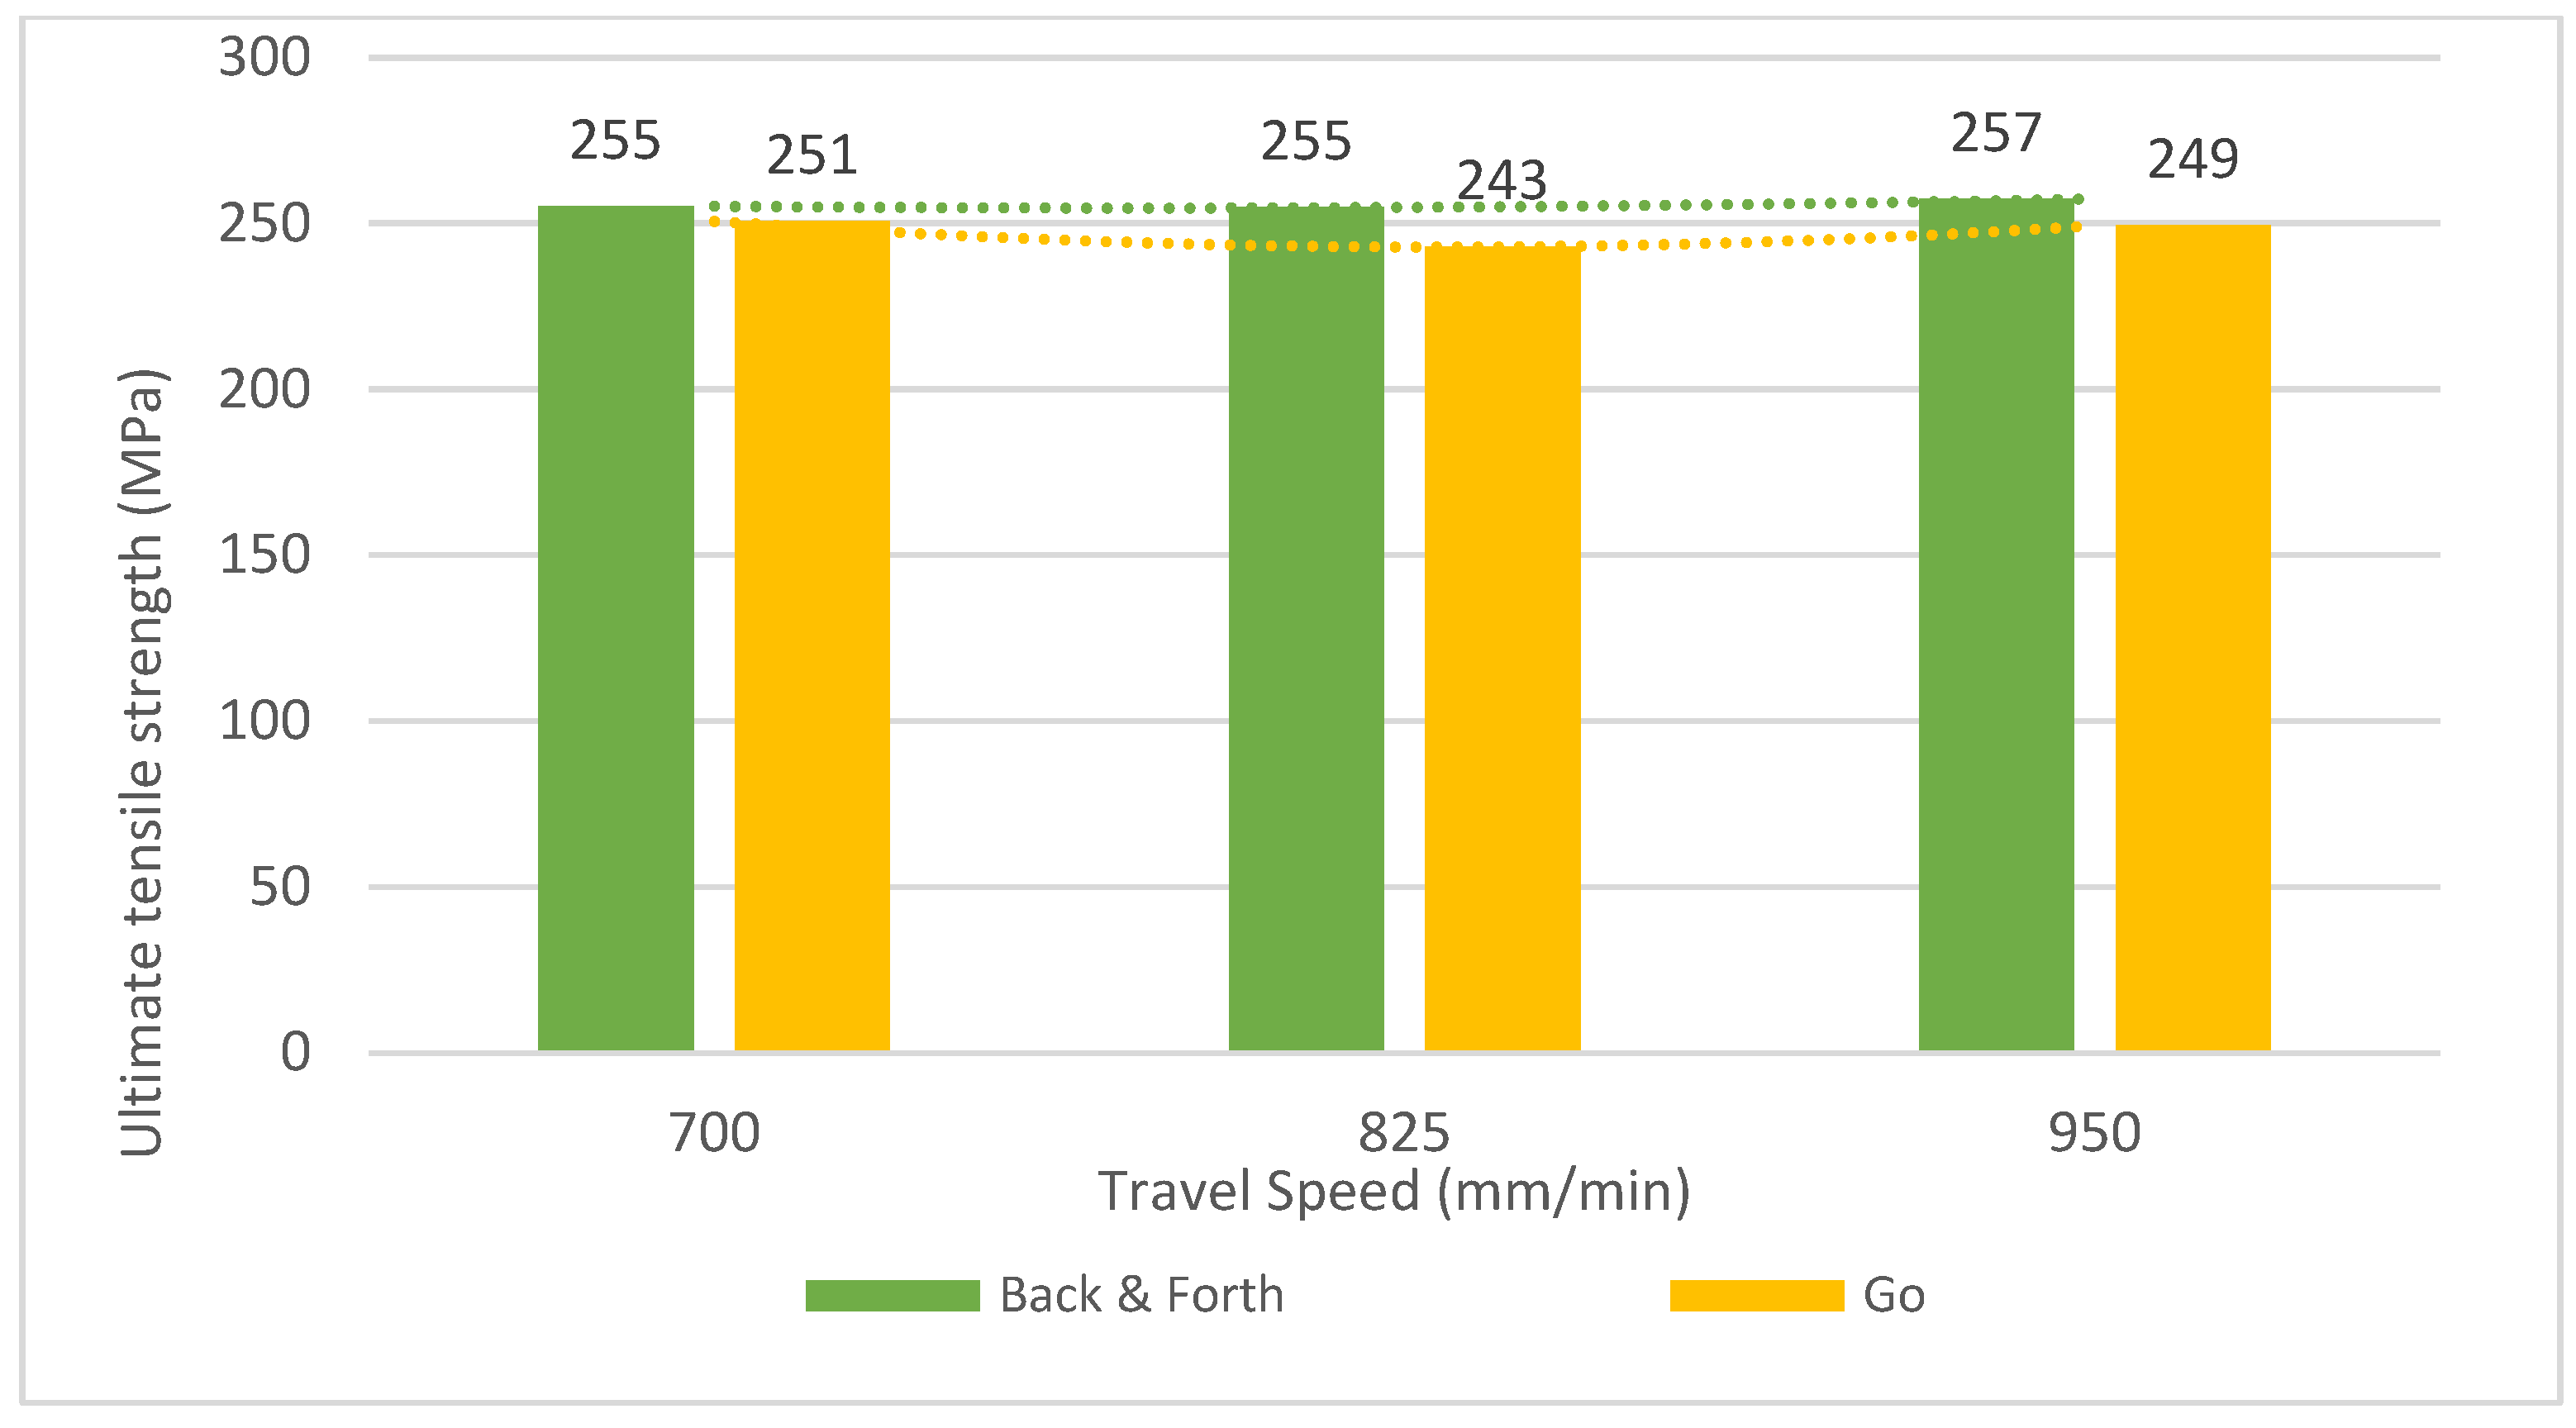
3.2. Relationship of Process Parameters and Tensile Test
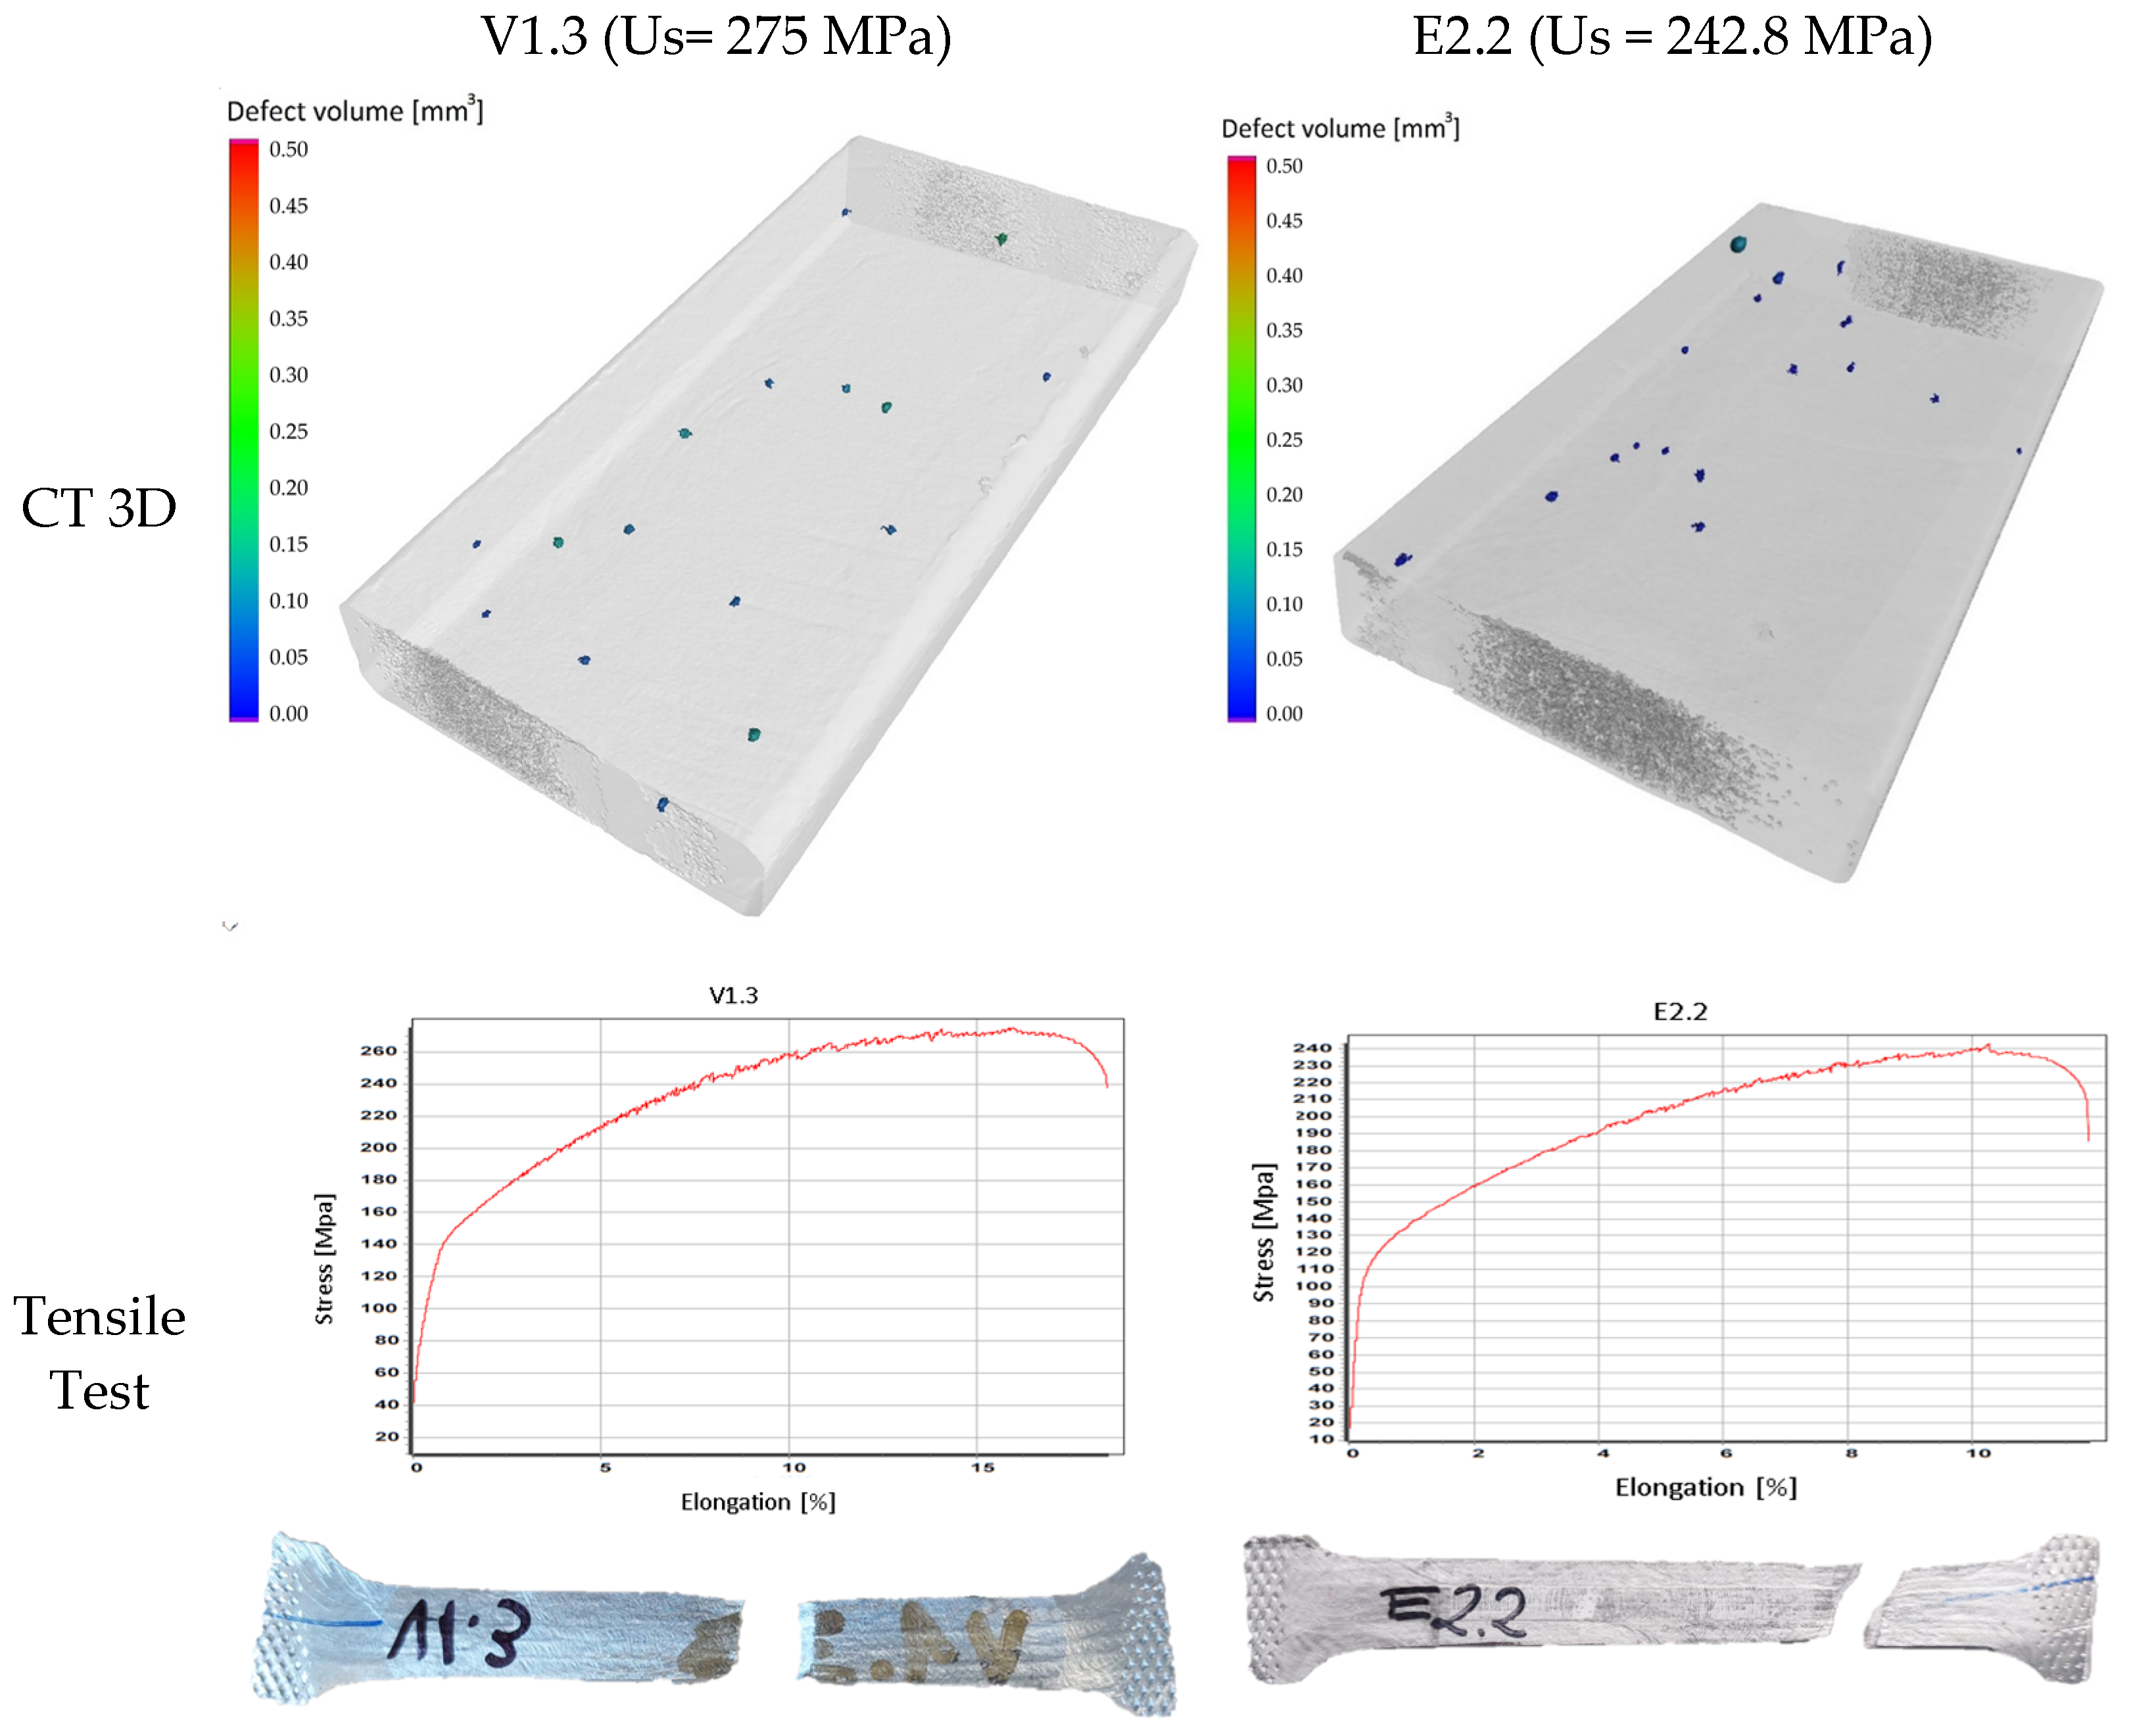
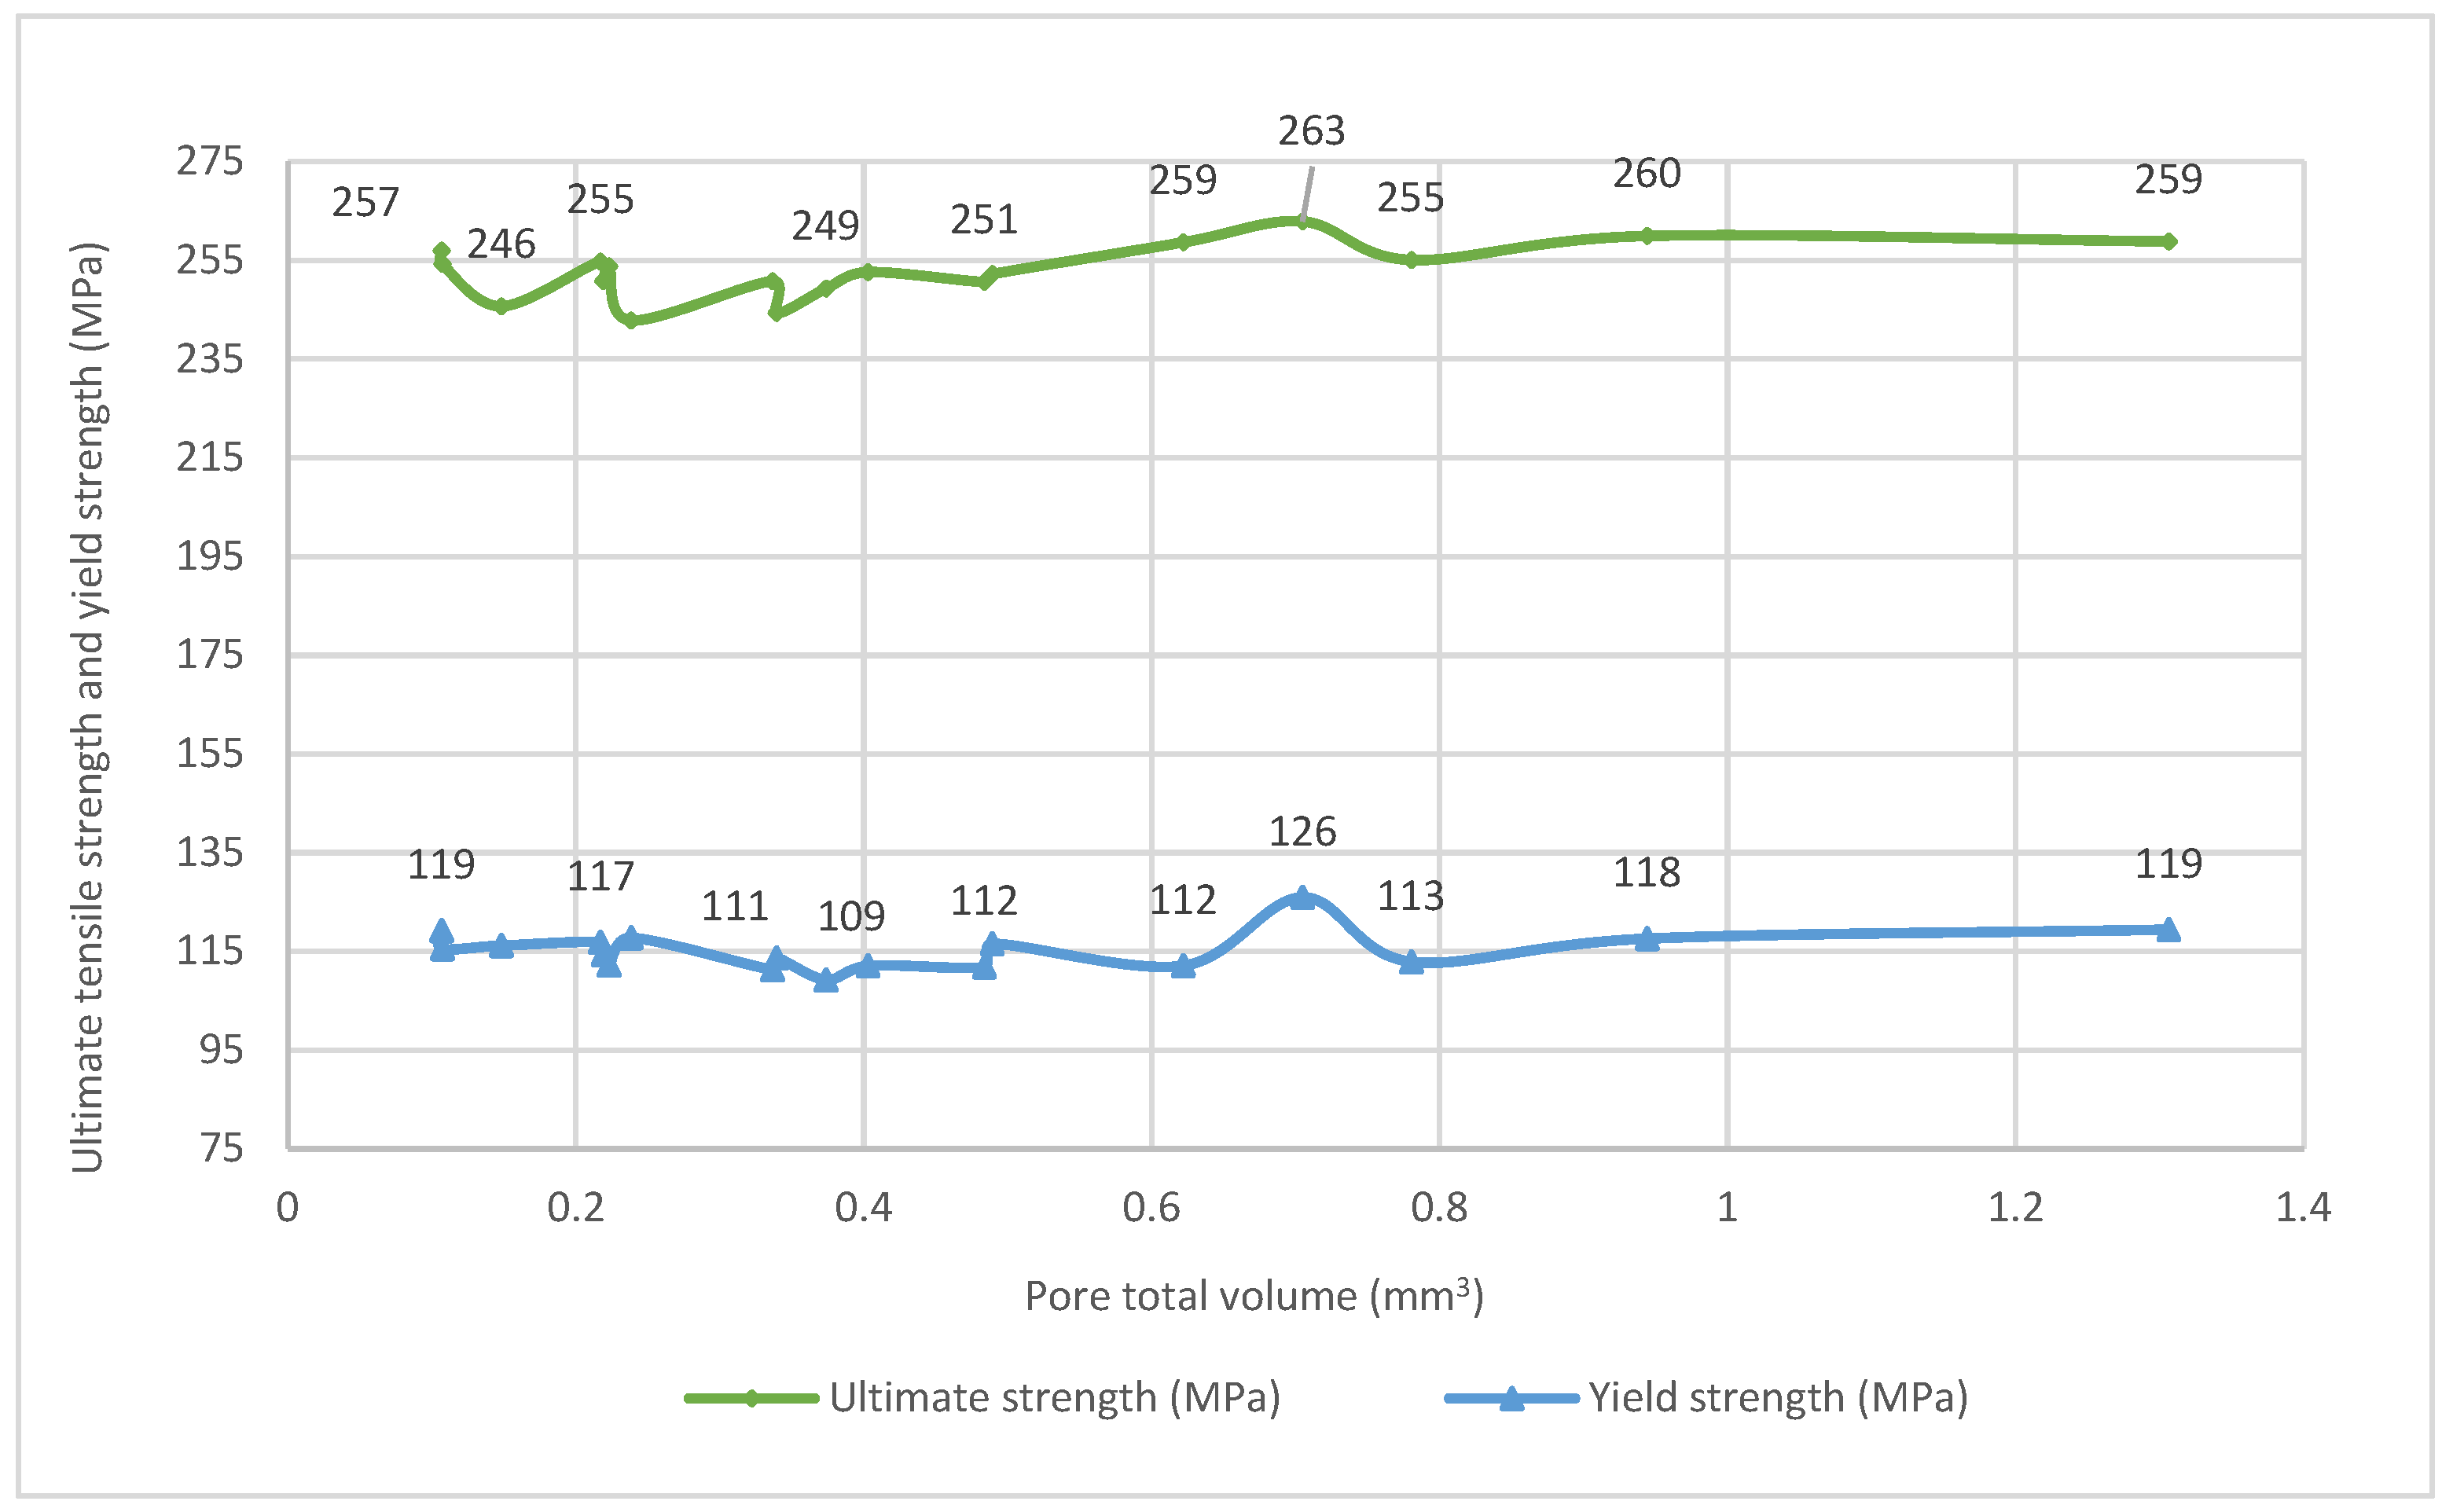
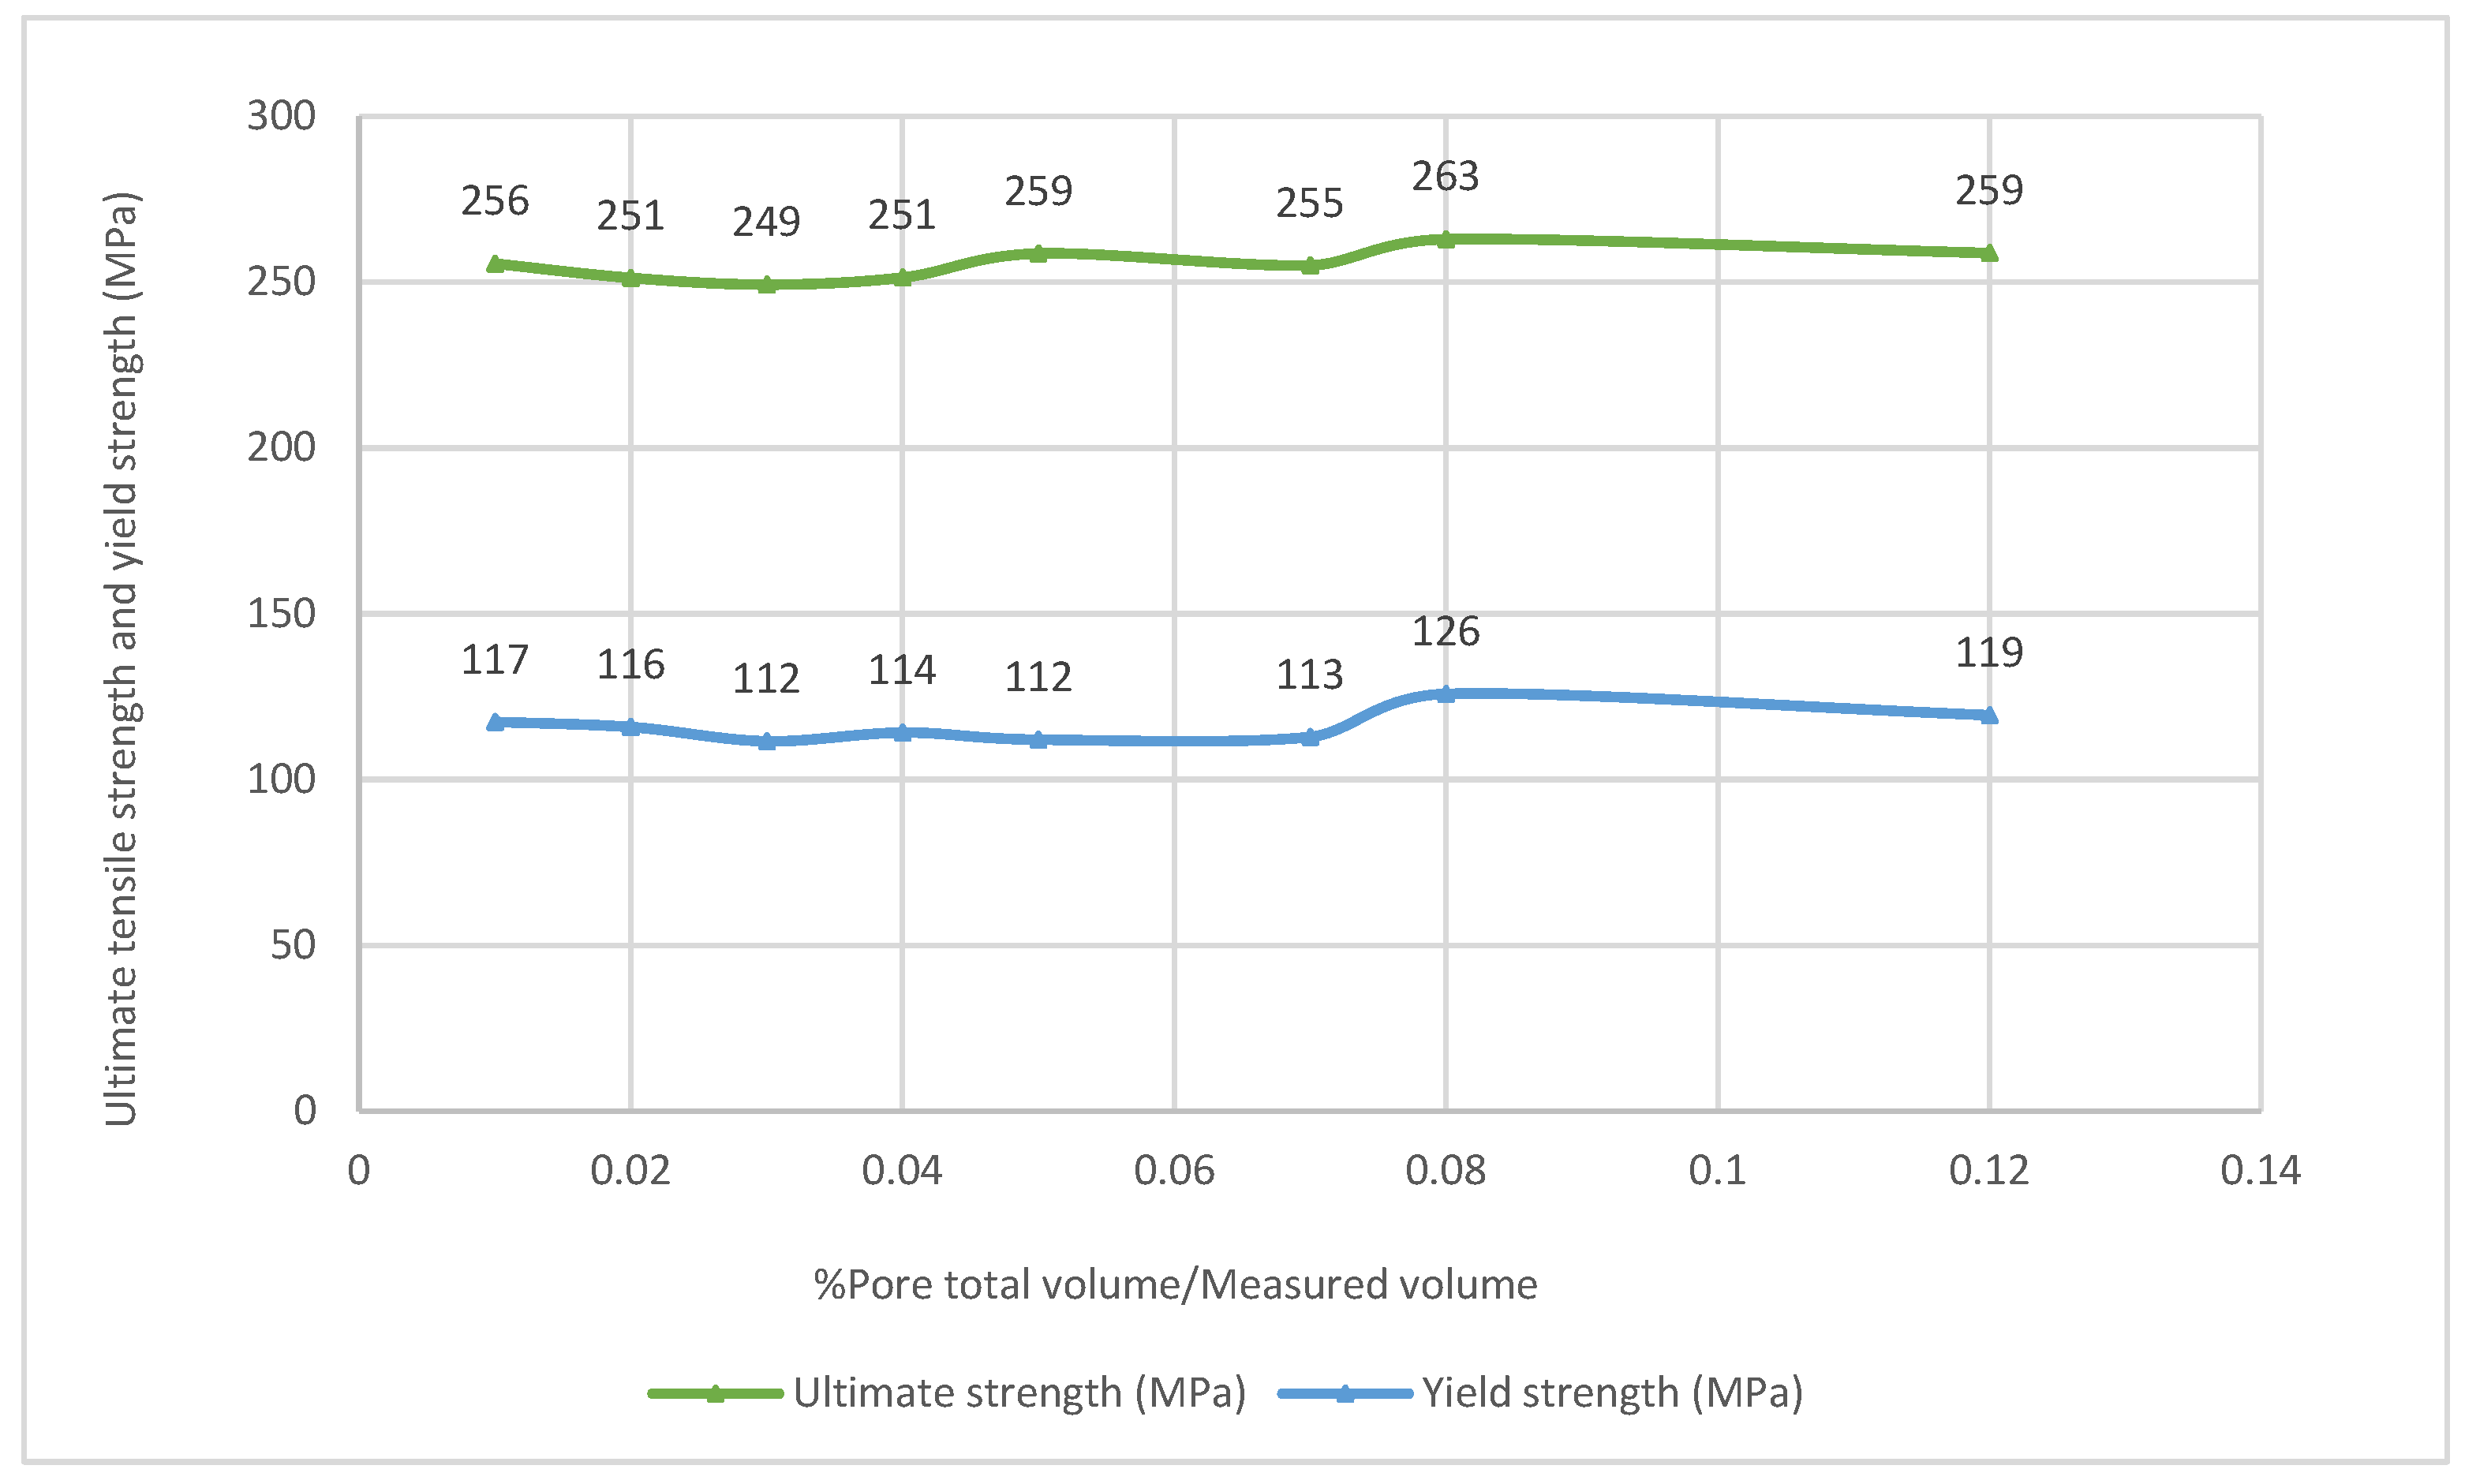
3.3. Relationship of Porosity and Tensile Test Parameters
4. Conclusions
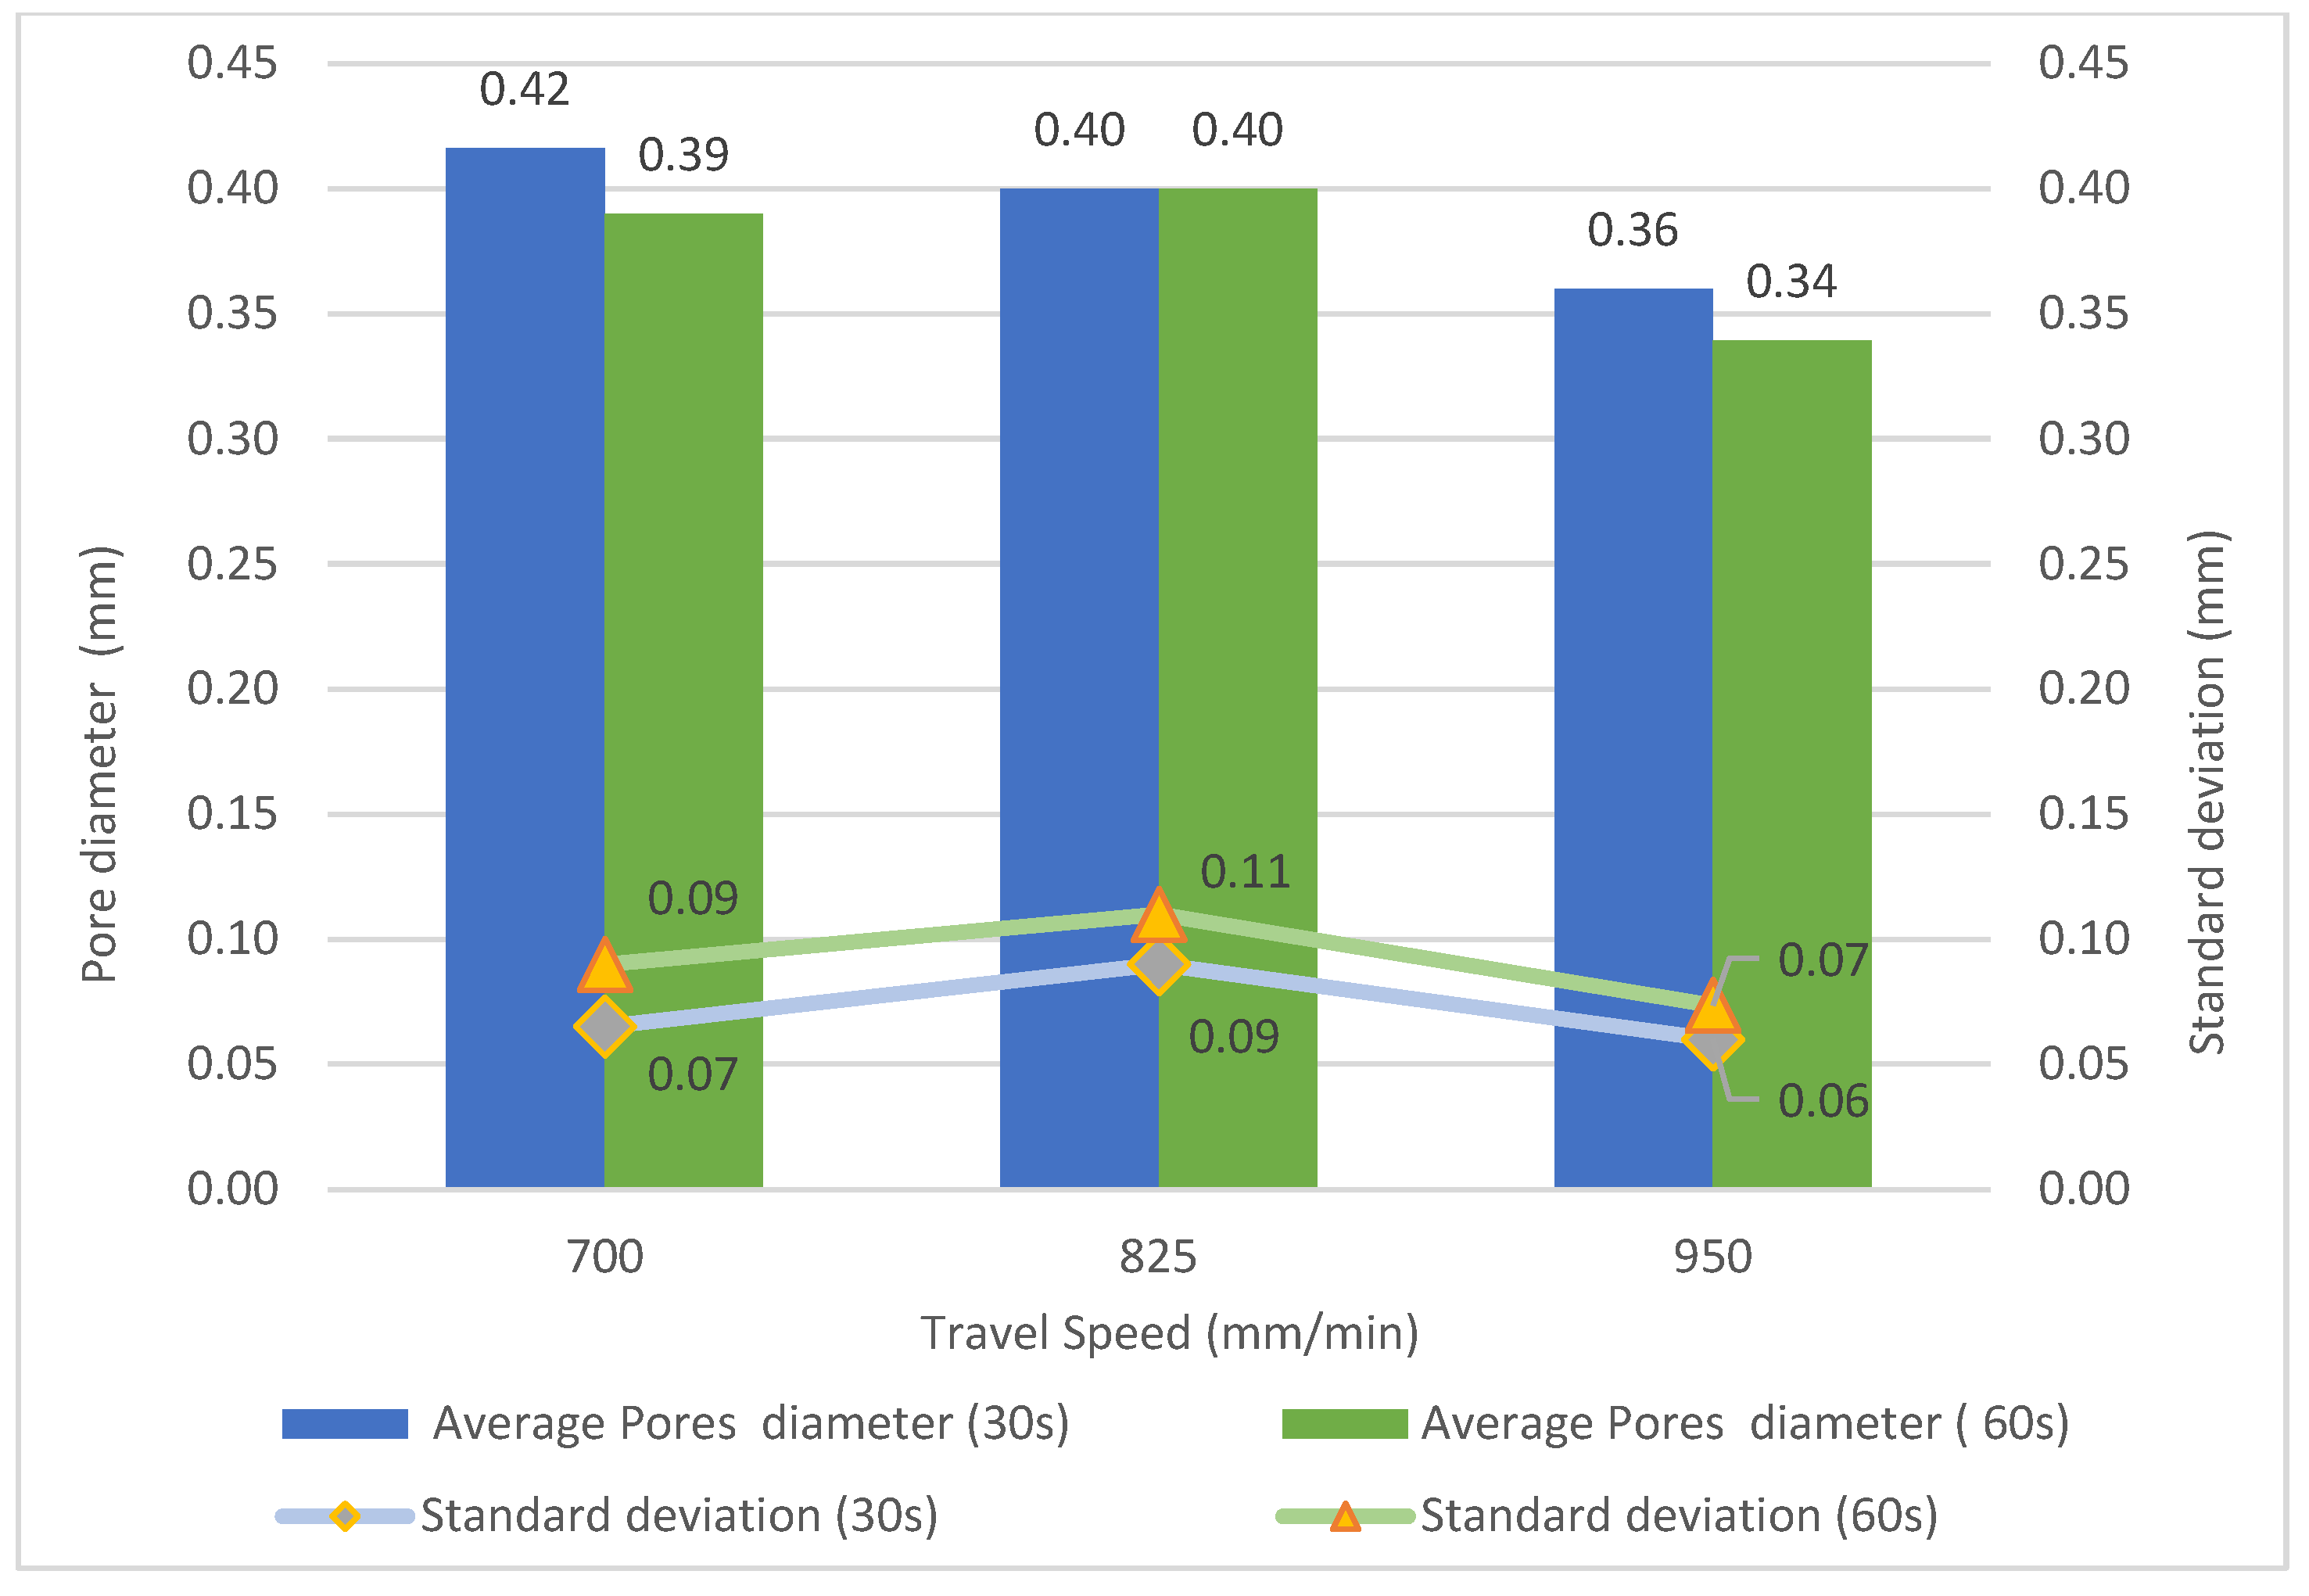
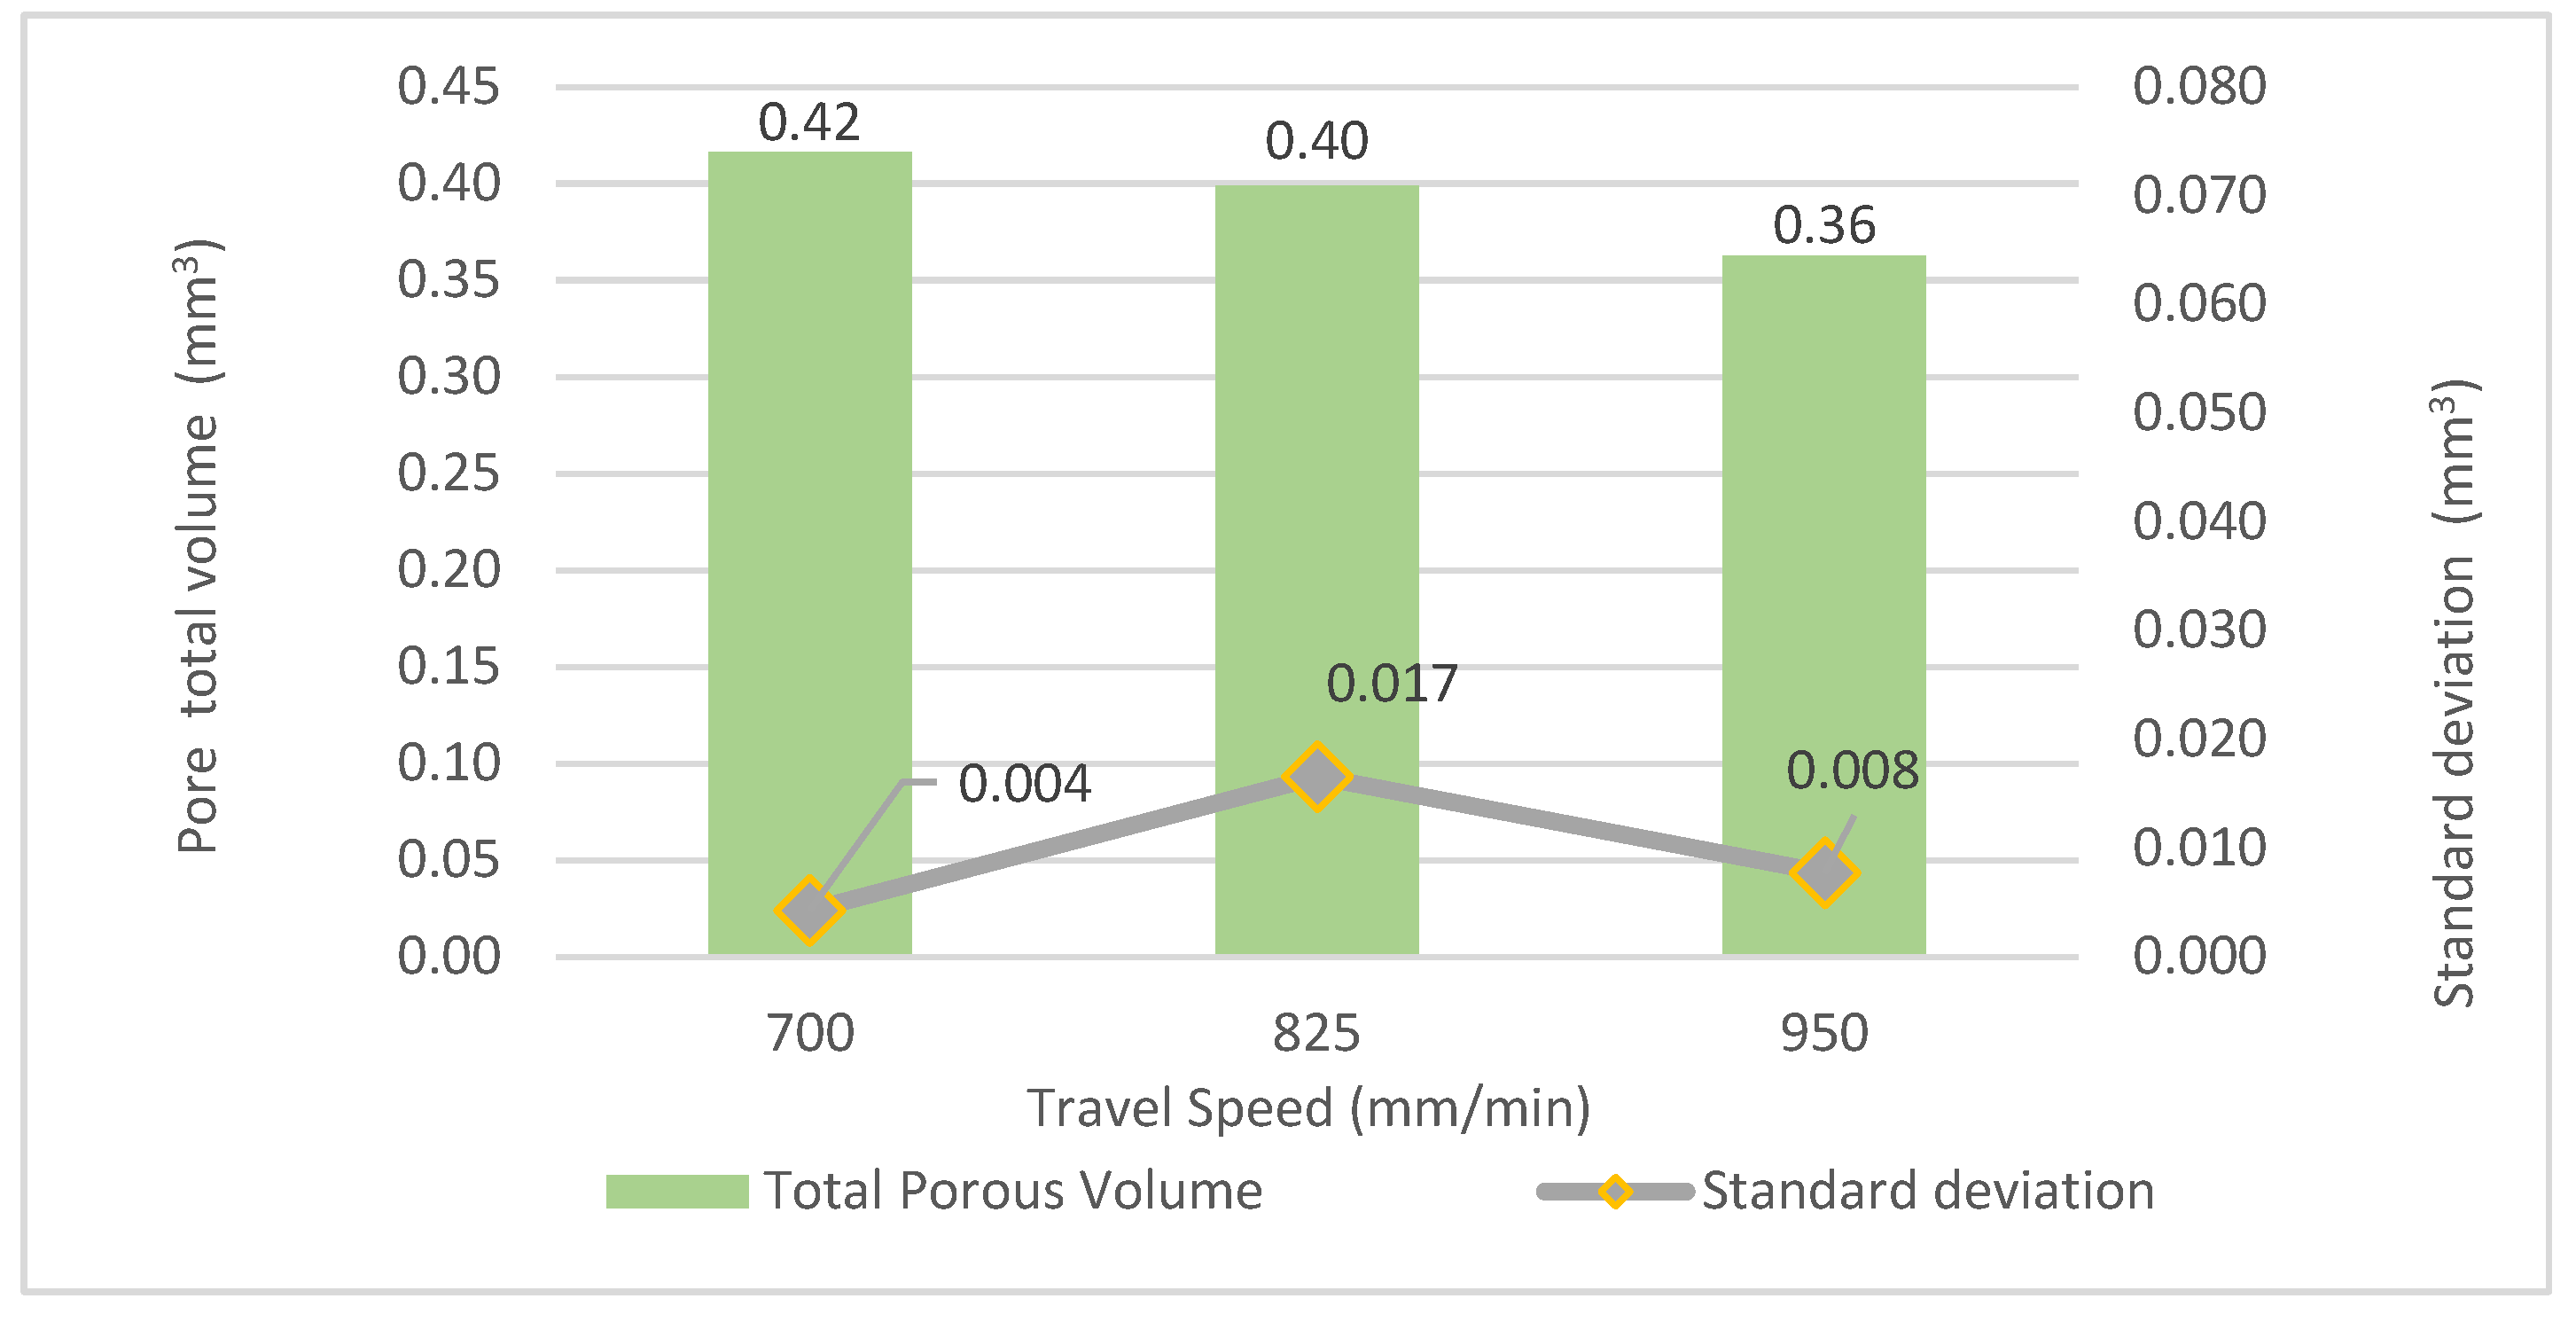
- The diameter of the pores slightly decreases with the increment of travel speed and cooling time. Thus, lower heat accumulation provided a positive outcome in terms of porosity. Specifically, the total pore volume decreases from 0.42 to 0.36 mm3, i.e., it decreases by 14% when increasing the travel speed from 700 to 950 mm/min.
- The WAAM manufacturing process allowed for obtaining walls with high ultimate tensile strength.
- There is almost no variation of ultimate tensile strength if the travel speed changes, but the best strategy was ‘Back and forth’. The maximum elongation was also higher when using the ‘back and forth’ strategy.
- The ultimate tensile strength and the yield strength were unrelated to the pore total volume. It should be highlighted that the percentage of the pore total volume over the measured volume was lower than 0.12% for all the scanned specimens.
Author Contributions
Funding
Institutional Review Board Statement
Informed Consent Statement
Data Availability Statement
Acknowledgments
Conflicts of Interest
References
- Sartal, A.; Carou, D.; Davim, J.P. Enabling Technologies for the Successful Deployment of Industry 4.0. Enabling Technologies for the Successful Deployment of Industry 4.0; CRC Press: Boca Raton, FL, USA, 2020. [Google Scholar] [CrossRef]
- Karnik, N.; Bora, U.; Bhadri, K.; Kadambi, P.; Dhatrak, P. A comprehensive study on current and future trends towards the characteristics and enablers of industry 4.0. J. Ind. Inf. Integr. 2022, 27, 100294. [Google Scholar] [CrossRef]
- ISO/ASTM 52900:2015(E); Standard Terminology for Additive Manufacturing—General Principles—Terminology. ASTM International: West Conshohocken, PA, USA, 2015.
- Singh, S.R.; Khanna, P. Wire arc additive manufacturing (WAAM): A new process to shape engineering materials. Mater. Today Proc. 2020, 44, 118–128. [Google Scholar] [CrossRef]
- Yu, L.; Chen, K.; Zhang, Y.; Liu, J.; Yang, L.; Shi, Y. Microstructures and mechanical properties of NiTi shape memory alloys fabricated by wire arc additive manufacturing. J. Alloys Compd. 2022, 892, 162193. [Google Scholar] [CrossRef]
- Chaturvedi, M.; Scutelnicu, E.; Rusu, C.; Mistodie, L.; Mihailescu, D.; Subbiah, A. Wire Arc Additive Manufacturing: Review on Recent Findings and Challenges in Industrial Applications and Materials Characterization. Metals 2021, 11, 939. [Google Scholar] [CrossRef]
- Ahn, D.G. Directed Energy Deposition (DED) Process: State of the Art. Int. J. Precis. Eng. Manuf.-Green Technol. 2021, 8, 703–742. [Google Scholar] [CrossRef]
- Reisgen, U.; Sharma, R.; Oster, L. Plasma Multiwire Technology with Alternating Wire Feed for Tailor-Made Material Properties in Wire and Arc Additive Manufacturing. Metals 2019, 9, 745. [Google Scholar] [CrossRef] [Green Version]
- Zhang, C.; Gao, M.; Zeng, X. Workpiece vibration augmented wire arc additive manufacturing of high strength aluminum alloy. J. Mater. Process. Technol. 2019, 271, 85–92. [Google Scholar] [CrossRef]
- Koli, Y.; Aravindan, S.; Rao, P. Influence of heat input on the evolution of δ-ferrite grain morphology of SS308L fabricated using WAAM-CMT. Mater. Charact. 2022, 194, 112363. [Google Scholar] [CrossRef]
- Chen, X.; Su, C.; Wang, Y.; Siddiquee, A.N.; Sergey, K.; Jayalakshmi, S.; Singh, R.A. Cold Metal Transfer (CMT) Based Wire and Arc Additive Manufacture (WAAM) System. J. Surf. Investig. X-ray Synchrotron Neutron Tech. 2018, 12, 1278–1284. [Google Scholar] [CrossRef]
- Yang, Q.; Xia, C.; Deng, Y.; Li, X.; Wang, H. Microstructure and Mechanical Properties of AlSi7Mg0.6 Aluminum Alloy Fabricated by Wire and Arc Additive Manufacturing Based on Cold Metal Transfer (WAAM-CMT). Materials 2019, 12, 2525. [Google Scholar] [CrossRef] [Green Version]
- Pereira, A.; Carou, D.; Fenollera, M.; Prado, T.; Gapiński, B.; Wieczorowski, M. Experimental Study on the Manufacturing of Steel Inclined Walls by Directed Energy Deposition Based on Dimensional and 3D Surface Roughness Measurements. Materials 2022, 15, 4994. [Google Scholar] [CrossRef]
- Chaudhari, R.; Parikh, N.; Khanna, S.; Vora, J.; Patel, V. Effect of multi-walled structure on microstructure and mechanical properties of 1.25Cr-1.0Mo steel fabricated by GMAW-based WAAM using metal-cored wire. J. Mater. Res. Technol. 2022, 21, 3386–3396. [Google Scholar] [CrossRef]
- Vora, J.; Parmar, H.; Chaudhari, R.; Khanna, S.; Doshi, M.; Patel, V. Experimental investigations on mechanical properties of multi-layered structure fabricated by GMAW-based WAAM of SS316L. J. Mater. Res. Technol. 2022, 20, 2748–2757. [Google Scholar] [CrossRef]
- Ryan, E.; Sabin, T.; Watts, J.; Whiting, M. The influence of build parameters and wire batch on porosity of wire and arc additive manufactured aluminium alloy 2319. J. Mater. Process. Technol. 2018, 262, 577–584. [Google Scholar] [CrossRef]
- Al-Nabulsi, Z.; Mottram, J.; Gillie, M.; Kourra, N.; Williams, M. Mechanical and X ray computed tomography characterisation of a WAAM 3D printed steel plate for structural engineering applications. Constr. Build. Mater. 2020, 274, 121700. [Google Scholar] [CrossRef]
- Wang, J.; Zhu, K.; Zhang, W.; Zhu, X.; Lu, X. Microstructural and defect evolution during WAAM resulting in mechanical property differences for AA5356 component. J. Mater. Res. Technol. 2023, 22, 982–996. [Google Scholar] [CrossRef]
- Rodrigues, T.A.; Duarte, V.R.; Miranda, R.; Santos, T.G.; Oliveira, J. Ultracold-Wire and arc additive manufacturing (UC-WAAM). J. Mater. Process. Technol. 2021, 296, 117196. [Google Scholar] [CrossRef]
- Feldkamp, L.A.; Davis, L.C.; Kress, J.W. Practical Cone-Beam Algorithm. J. Opt. Soc. Am. A 1984, 1, 612–619. [Google Scholar] [CrossRef] [Green Version]
- Venkatakrishnan, S.; Ziabari, A.K.; Bingham, P.; Helmreich, G. Model-based reconstruction for enhanced X-ray CT of dense tri-structural isotropic particles. Appl. Opt. 2022, 61, C73. [Google Scholar] [CrossRef]
- Gapiński, B.; Wieczorowski, M.; Mietliński, P.; Mathia, T.G. Verification of Computed Tomograph for Dimensional Measurements. In Lecture Notes in Mechanical Engineering; Springer: Berlin, Germany, 2022; pp. 142–155. [Google Scholar] [CrossRef]
- Gapiński, B.; Wieczorowski, M.; Bak, A.; Domínguez, A.P.; Mathia, T. The Assessment of Accuracy of Inner Shapes Manufactured by FDM. AIP Conf. Proc. 2018, 1960, 140009. [Google Scholar]
- Maszybrocka, J.; Gapinski, B.; Dworak, M.; Skrabalak, G.; Stwora, A. Modelling, Manufacturability and Compression Properties of the Cpti Grade 2 Cellular Lattice with Radial Gradient Tpms Architecture. Bull. Pol. Acad. Sci. Tech. Sci. 2019, 67, 719–727. [Google Scholar] [CrossRef]
- Scully, J.R.; Young, G.A.; Smith, S.W. Hydrogen Solubility, Diffusion and Trapping in High Purity Aluminum and Selected Al-Base Alloys. Mater. Sci. Forum 2000, 331, 1583–1600. [Google Scholar] [CrossRef]
- Gapinski, B.; Wieczorowski, M.; Marciniak-Podsadna, L.; Domínguez, A.P.; Cepova, L.; Rey, A.M. Measurement of Surface Topography Using Computed Tomography; Springer: Cham, Switzerland, 2018. [Google Scholar] [CrossRef]
- Langelandsvik, G.; Akselsen, O.M.; Furu, T.; Roven, H.J. Review of Aluminum Alloy Development for Wire Arc Additive Manufacturing. Materials 2021, 14, 5370. [Google Scholar] [CrossRef] [PubMed]
- Horgar, A.; Fostervoll, H.; Nyhus, B.; Ren, X.; Eriksson, M.; Akselsen, O. Additive manufacturing using WAAM with AA5183 wire. J. Mater. Process. Technol. 2018, 259, 68–74. [Google Scholar] [CrossRef]
- Fang, X.; Zhang, L.; Chen, G.; Dang, X.; Huang, K.; Wang, L.; Lu, B. Correlations between Microstructure Characteristics and Mechanical Properties in 5183 Aluminium Alloy Fabricated by Wire-Arc Additive Manufacturing with Different Arc Modes. Materials 2018, 11, 2075. [Google Scholar] [CrossRef] [PubMed] [Green Version]
- Li, S.; Zhang, L.-J.; Ning, J.; Wang, X.; Zhang, G.-F.; Zhang, J.-X.; Na, S.-J.; Fatemeh, B. Comparative study on the microstructures and properties of wire+arc additively manufactured 5356 aluminium alloy with argon and nitrogen as the shielding gas. Addit. Manuf. 2020, 34, 101206. [Google Scholar] [CrossRef]
- Köhler, M.; Hensel, J.; Dilger, K. Effects of Thermal Cycling on Wire and Arc Additive Manufacturing of Al-5356 Components. Metals 2020, 10, 952. [Google Scholar] [CrossRef]
- Wang, J.; Shen, Q.; Kong, X.; Chen, X. Arc Additively Manufactured 5356 Aluminum Alloy with Cable-Type Welding Wire: Microstructure and Mechanical Properties. J. Mater. Eng. Perform. 2021, 30, 7472–7478. [Google Scholar] [CrossRef]
- Derekar, K.; Lawrence, J.; Melton, G.; Addison, A.; Zhang, X.; Xu, L. Influence of Interpass Temperature on Wire Arc Additive Manufacturing (WAAM) of Aluminium Alloy Components. MATEC Web Conf. 2019, 269, 05001. [Google Scholar] [CrossRef]
- Jiangang, P.; Bo, Y.; Jinguo, G.; Yu, R.; Hongjun, C.; Liang, Z.; Hao, L. Influence of arc mode on the microstructure and mechanical properties of 5356 aluminum alloy fabricated by wire arc additive manufacturing. J. Mater. Res. Technol. 2022, 20, 1893–1907. [Google Scholar] [CrossRef]
- Aluminum 5356. Available online: https://www.matweb.com/search/DataSheet.aspx?MatGUID=61e953ece76c4f4a86dd28ff540f41fa&ckck=1 (accessed on 5 July 2022).
- ISO 14175:2008; Welding Consumables-Gases and Gas Mixtures for Fusion Welding and Allied Processes. American National Standards Institute: Miami, FL, USA, 2008.
- González, J.; Rodríguez, I.; Prado-Cerqueira, J.-L.; Diéguez, J.; Pereira, A. Additive manufacturing with GMAW welding and CMT technology. Procedia Manuf. 2017, 13, 840–847. [Google Scholar] [CrossRef]
- Kumar, N.; Bhavsar, H.; Mahesh, P.; Srivastava, A.K.; Bora, B.J.; Saxena, A.; Dixit, A.R. Wire Arc Additive Manufacturing—A revolutionary method in additive manufacturing. Mater. Chem. Phys. 2022, 285, 126144. [Google Scholar] [CrossRef]
- Su, C.; Chen, X.; Gao, C.; Wang, Y. Effect of heat input on microstructure and mechanical properties of Al-Mg alloys fabricated by WAAM. Appl. Surf. Sci. 2019, 486, 431–440. [Google Scholar] [CrossRef]
- Aldalur, E.; Suárez, A.; Veiga, F. Metal transfer modes for Wire Arc Additive Manufacturing Al-Mg alloys: Influence of heat input in microstructure and porosity. J. Mater. Process. Technol. 2021, 297, 117271. [Google Scholar] [CrossRef]
- Altıparmak, S.C.; Yardley, V.A.; Shi, Z.; Lin, J. Challenges in additive manufacturing of high-strength aluminium alloys and current developments in hybrid additive manufacturing. Int. J. Light. Mater. Manuf. 2021, 4, 246–261. [Google Scholar] [CrossRef]
- Hauser, T.; Reisch, R.T.; Breese, P.P.; Lutz, B.S.; Pantano, M.; Nalam, Y.; Bela, K.; Kamps, T.; Volpp, J.; Kaplan, A.F. Porosity in wire arc additive manufacturing of aluminium alloys. Addit. Manuf. 2021, 41, 101993. [Google Scholar] [CrossRef]
- Lin, Z.; Song, K.; Yu, X. A review on wire and arc additive manufacturing of titanium alloy. J. Manuf. Process. 2021, 70, 24–45. [Google Scholar] [CrossRef]
- Pépe, N.; Egerland, S.; Colegrove, P.A.; Yapp, D.; Leonhartsberger, A.; Scotti, A. Measuring the process efficiency of controlled gas metal arc welding processes. Sci. Technol. Weld. Join. 2011, 16, 412–417. [Google Scholar] [CrossRef] [Green Version]
- Sinha, A.K.; Pramanik, S.; Yagati, K.P. Research progress in arc based additive manufacturing of aluminium alloys—A review. Measurement 2022, 200, 111672. [Google Scholar] [CrossRef]
- Arana, M.; Ukar, E.; Rodriguez, I.; Aguilar, D.; Álvarez, P. Influence of deposition strategy and heat treatment on mechanical properties and microstructure of 2319 aluminium WAAM components. Mater. Des. 2022, 221, 110974. [Google Scholar] [CrossRef]
- Malicki, M.; Sobczak, K. Verification of the Computed Tomography Results of Aluminum Alloy Welded Joint. Fatigue Aircr. Struct. 2018, 2018, 47–52. [Google Scholar] [CrossRef] [Green Version]
- ISO 7500-1:2018; Metallic Materials—Calibration and Verification of Static Uniaxial Testing Machines—Part 1: Tension/Compression Testing Machines—Calibration and Verification of the Force-Measuring System. International Organization for Standardization: Geneva, Switzerland, 2018. Available online: https://www.iso.org/standard/72572.html (accessed on 15 January 2023).
- Ou, W.; Mukherjee, T.; Knapp, G.; Wei, Y.; DebRoy, T. Fusion zone geometries, cooling rates and solidification parameters during wire arc additive manufacturing. Int. J. Heat Mass Transf. 2018, 127, 1084–1094. [Google Scholar] [CrossRef]
- Gu, J.; Bai, J.; Ding, J.; Williams, S.; Wang, L.; Liu, K. Design and cracking susceptibility of additively manufactured Al-Cu-Mg alloys with tandem wires and pulsed arc. J. Mater. Process. Technol. 2018, 262, 210–220. [Google Scholar] [CrossRef]
- Fang, X.; Zhang, L.; Li, H.; Li, C.; Huang, K.; Lu, B. Microstructure Evolution and Mechanical Behavior of 2219 Aluminum Alloys Additively Fabricated by the Cold Metal Transfer Process. Materials 2018, 11, 812. [Google Scholar] [CrossRef] [PubMed] [Green Version]
- Zhou, Y.; Lin, X.; Kang, N.; Huang, W.; Wang, J.; Wang, Z. Influence of travel speed on microstructure and mechanical properties of wire + arc additively manufactured 2219 aluminum alloy. J. Mater. Sci. Technol. 2020, 37, 143–153. [Google Scholar] [CrossRef]
- Haselhuhn, A.S.; Buhr, M.W.; Wijnen, B.; Sanders, P.G.; Pearce, J.M. Structure-property relationships of common aluminum weld alloys utilized as feedstock for GMAW-based 3-D metal printing. Mater. Sci. Eng. A 2016, 673, 511–523. [Google Scholar] [CrossRef] [Green Version]


| Mg | Fe | Si | Cu | Sn | Ti | Cr | Mn | Be | Zn |
|---|---|---|---|---|---|---|---|---|---|
| 5.0 | 0.40 | 0.25 | 0.10 | - | 1.10 | 0.2 | 0.05 | - | 0.10 |
| Characteristic | Value |
|---|---|
| Density, ρ (kg/m3) | 2640 |
| Specific heat capacity, c (J/kg·K) | 900 |
| Thermal conductivity, k (W/m·K) | 121.8 |
| Coefficient of thermal expansion, α (°C−1) | 22.5 |
| Modulus of elasticity, E(GPa) | 70 |
| Poissons ratio, µ | 0.33 |
| Yield strength, σy (MPa) | 130 |
| WAAM Parameter | Value |
|---|---|
| Current (A) | 70 |
| Voltage (V) | 14.7 |
| Wire feed speed (m/min) | 6.5 |
| Mode1 | CMT |
| Mode2 | S2 |
| Gas | 99.9% Ar |
| Gas flow rate (L/min) | 9 |
| Test | Walls | Travel Speed (mm/min) | Cooling Time (s) | Path Strategy | Heat Input (kJ/mm) |
|---|---|---|---|---|---|
| A1 | A1.1/A1.2/A1.3 | 950 | 30 | Back & Forth | 0.052 |
| A2 | A2.1/A2.2/A2.3 | 950 | 30 | Go | 0.052 |
| A3 | A3.1/A3.2/A3.3 | 950 | 60 | Back & Forth | 0.052 |
| A4 | A4.1/A4.2/A4.3 | 950 | 60 | Go | 0.052 |
| E1 | E1.1/E1.2/E1.3 | 825 | 60 | Back & Forth | 0.060 |
| E2 | E2.1/E2.2/E2.3 | 825 | 60 | Go | 0.060 |
| E3 | E3.1/E3.2/E3.3 | 700 | 60 | Back & Forth | 0.071 |
| E4 | E4.1/E4.2/E4.3 | 700 | 60 | Go | 0.071 |
| V1 | V1.1/V1.2/V1.3 | 700 | 30 | Back & Forth | 0.071 |
| V2 | V2.1/V2.2/V2.3 | 700 | 60 | Back & Forth | 0.071 |
| V3 | V3.1/V3.2/V3.3 | 825 | 30 | Back & Forth | 0.060 |
| V4 | V4.1/V4.2/V4.3 | 825 | 60 | Back & Forth | 0.060 |
| Specimen | Mean Pore Diameter (mm) | Mean Pore Volume (mm3) | Standard Deviation of Pore Diameter (mm) | Standard Deviation of Pore Volume (mm3) | Pore Total Volume (mm3) |
|---|---|---|---|---|---|
| A1.1 | 0.43 | 0.014 | 0.117 | 0.039 | 0.51 |
| A1.2 | 0.33 | 0.006 | 0.064 | 0.003 | 0.34 |
| A2.2 | 0.37 | 0.006 | 0.054 | 0.002 | 0.23 |
| A2.3 | 0.39 | 0.007 | 0.067 | 0.003 | 0.34 |
| A3.1 | 0.34 | 0.007 | 0.097 | 0.007 | 0.70 |
| A3.2 | 0.35 | 0.006 | 0.069 | 0.003 | 0.78 |
| A4.1 | 0.33 | 0.006 | 0.071 | 0.003 | 0.40 |
| A4.3 | 0.34 | 0.006 | 0.057 | 0.002 | 0.22 |
| E1.2 | 0.36 | 0.012 | 0.191 | 0.033 | 0.22 |
| E1.3 | 0.37 | 0.015 | 0.160 | 0.029 | 0.49 |
| E2.1 | 0.45 | 0.009 | 0.091 | 0.003 | 0.16 |
| E2.2 | 0.38 | 0.013 | 0.120 | 0.023 | 0.24 |
| E3.1 | 0.39 | 0.007 | 0.060 | 0.002 | 0.70 |
| E3.2 | 0.32 | 0.006 | 0.099 | 0.003 | 0.31 |
| E4.1 | 0.38 | 0.008 | 0.060 | 0.005 | 0.48 |
| E4.2 | 0.43 | 0.010 | 0.123 | 0.008 | 0.39 |
| V1.2 | 0.42 | 0.008 | 0.056 | 0.003 | 0.11 |
| V1.3 | 0.41 | 0.009 | 0.074 | 0.004 | 0.14 |
| V2.2 | 0.41 | 0.010 | 0.095 | 0.007 | 0.15 |
| V2.3 | 0.41 | 0.007 | 0.080 | 0.003 | 0.11 |
| V3.2 | 0.40 | 0.007 | 0.094 | 0.003 | 0.62 |
| V3.3 | 0.39 | 0.010 | 0.143 | 0.033 | 0.94 |
| V4.1 | 0.40 | 0.008 | 0.072 | 0.006 | 0.37 |
| V4.2 | 0.40 | 0.007 | 0.085 | 0.003 | 0.22 |
| Specimen | So (mm2) | Fmax (kN) | Ultimate Tensile Strength (MPa) | Max Elongation (%) | Yield Strength (MPa) |
|---|---|---|---|---|---|
| A3.1 | 30.00 | 7.98 | 266.00 | 11.60 | 134.04 |
| A4.3 | 35.04 | 8.79 | 250.86 | 15.29 | 114.38 |
| E2.2 | 36.67 | 8.91 | 242.98 | 11.86 | 117.80 |
| V2.2 | 37.5 | 9.22 | 245.87 | 12.73 | 116.22 |
| (*) V1.3 | 38.78 | 10.66 | 274.88 | 18.48 | 133.44 |
| E3.2 | 39.38 | 10.19 | 258.76 | 14.91 | 119.44 |
| (*) A1.1 | 39.66 | 10.72 | 270.30 | 18.21 | 129.92 |
| E3.1 | 39.69 | 10.31 | 259.76 | 17.49 | 117.87 |
| V1.2 | 40.13 | 10.21 | 254.42 | 15.31 | 115.58 |
| (*) E4.2 | 40.91 | 9.57 | 233.93 | 11.14 | 115.28 |
| (*) E2.1 | 41.01 | 9.56 | 233.11 | 13.25 | 109.75 |
| E4.1 | 41.27 | 10.34 | 250.55 | 15.56 | 111.91 |
| A2.3 | 42.68 | 10.43 | 244.38 | 13.38 | 113.75 |
| V2.3 | 42.83 | 11.01 | 257.06 | 14.55 | 119.24 |
| (*) A2.2 | 42.85 | 9.88 | 230.57 | 14.89 | 116.70 |
| E1.2 | 42.89 | 10.93 | 254.84 | 18.25 | 116.94 |
| A3.2 | 43.46 | 11.09 | 255.18 | 15.12 | 112.91 |
| V3.3 | 44.25 | 11.50 | 259.89 | 18.61 | 117.64 |
| V3.2 | 44.50 | 11.51 | 249.21 | 17.08 | 109.26 |
| V4.1 | 44.50 | 11.09 | 258.65 | 18.42 | 112.14 |
| A4.1 | 44.82 | 11.32 | 252.57 | 14.46 | 112.13 |
| E1.3 | 45.52 | 11.48 | 252.20 | 16.60 | 116.59 |
| V4.2 | 45.85 | 11.64 | 253.87 | 17.62 | 112.27 |
| A1.2 | 47.10 | 11.81 | 250.74 | 17.18 | 111.35 |
Disclaimer/Publisher’s Note: The statements, opinions and data contained in all publications are solely those of the individual author(s) and contributor(s) and not of MDPI and/or the editor(s). MDPI and/or the editor(s) disclaim responsibility for any injury to people or property resulting from any ideas, methods, instructions or products referred to in the content. |
© 2023 by the authors. Licensee MDPI, Basel, Switzerland. This article is an open access article distributed under the terms and conditions of the Creative Commons Attribution (CC BY) license (https://creativecommons.org/licenses/by/4.0/).
Share and Cite
Wieczorowski, M.; Pereira, A.; Carou, D.; Gapinski, B.; Ramírez, I. Characterization of 5356 Aluminum Walls Produced by Wire Arc Additive Manufacturing (WAAM). Materials 2023, 16, 2570. https://doi.org/10.3390/ma16072570
Wieczorowski M, Pereira A, Carou D, Gapinski B, Ramírez I. Characterization of 5356 Aluminum Walls Produced by Wire Arc Additive Manufacturing (WAAM). Materials. 2023; 16(7):2570. https://doi.org/10.3390/ma16072570
Chicago/Turabian StyleWieczorowski, Michal, Alejandro Pereira, Diego Carou, Bartosz Gapinski, and Ignacio Ramírez. 2023. "Characterization of 5356 Aluminum Walls Produced by Wire Arc Additive Manufacturing (WAAM)" Materials 16, no. 7: 2570. https://doi.org/10.3390/ma16072570