Article

Mechanical Behaviour Evaluation of Full Iron Tailings Concrete Columns under Large Eccentric Short-Term Loading

1
Civil Engineering Department, Hebei Agricultural University, Baoding 071001, China
2
School of Materials Science and Engineering, University of Science and Technology Beijing, Beijing 100083, China
*
Authors to whom correspondence should be addressed.
Materials 2023, 16(6), 2466; https://doi.org/10.3390/ma16062466
Submission received: 10 February 2023 / Revised: 11 March 2023 / Accepted: 16 March 2023 / Published: 20 March 2023
(This article belongs to the Special Issue Mechanical Research of Reinforced Concrete Materials)

Abstract

:
In this study, full iron tailings concrete (FITC) was created using iron tailings from a tailings pond in Qian’an, China. Iron tailings account for 86.8% of the total mass of solid raw materials in the FITC. To enable large-scale use of FITC, a comprehensive investigation of the structural behaviour of full-iron tailing-reinforced concrete (FITRC) specimens is warranted. Therefore, eight rectangular reinforced concrete (RC) columns with conventional reinforced concrete (CRC) as a control were tested to investigate the effects of section dimensions, initial eccentricities, and concrete strengths, on the structural behaviour of FITRC columns under large eccentric short-term loading. The experimental and analytical results indicated that the sectional strain of the FITRC columns satisfied the plane-section assumption under short-term loading, and the lateral deflection curve agreed well with the half-sinusoidal curve. In addition, the FITRC columns exhibited a slightly lower cracking load and lower ultimate load capacity than the CRC columns, and the crack widths were larger than those of the CRC columns. The reduction in the load capacity observed in the FITRC was within the permissible range stated in the design code, thereby satisfying the code requirements. The deformation coefficients of the FITRC and CRC columns were identical, and the cracking and ultimate loads calculated according to the current code and theories were in good agreement with the measured results.

1. Introduction

Tailings are a major source of solid waste generated by the separation of valuable fractions from ore during mining operations [1,2]. Improper disposal of tailings occupies land resources, pollutes the environment, and releases hazardous substances [3]. In China, tailings are widely distributed [4] with a low utilisation rate [5]. Figure 1 shows photographs of piles of iron tailings. In 2018, 475 million tonnes of iron tailings were produced in China, accounting for 39.22% of the total tailings [6] (Figure 2). In 2019, 536 million tonnes of tailings were produced in China, of which 116 million tonnes were comprehensively utilised [7]. This represents a utilisation rate of 21.6%, which is significantly lower than the average utilisation rate in developed countries [8]. In addition, tailings dams pose a debris-flow hazard. Sudden failures of tailings dams occurred in Xiangfen County, Shanxi Province, China, in 2008 [9], and Jiaokou County, Shanxi Province, China, in 2022 [10]. These disasters injured hundreds of people and caused significant losses. Because of these problems, tailings have received considerable attention from the scientific community [11,12]. The optimal approach for dealing with the problems associated with iron tailings is to develop technologies for their large-scale use [13].
Concrete is a leading construction material, with an annual global consumption of approximately 25 billion tonnes [14]. The construction sector is responsible for over 30% of global greenhouse gas emissions [15]. In China, cement production is expected to reach approximately 2.38 billion tonnes in 2021 [16]. Several studies have recommended the use of tailings in the cement and concrete industry [17,18,19,20,21,22,23,24] to significantly reduce carbon dioxide emissions and consumption of natural resources [25].
Iron tailings are inert at room temperature [26,27]. Previous studies have used iron tailings as coarse [28,29] and fine aggregates [30,31,32,33,34,35], as well as silica materials for the production of aerated concrete at high temperatures [36,37,38]. Some studies have also used iron tailings as an admixture [39,40,41,42,43,44] and examined the activation of iron tailings powder [45,46]. The use of iron tailings in concrete has the potential to reduce the storage of iron tailings, reduce land use and reduce environmental pollution. At the same time, the replacement of fly ash with iron tailings powder as an admixture could reduce the cost of concrete and promote the sustainable development of concrete. In addition, iron tailings can improve the carbonation resistance, frost resistance, and sulphate erosion resistance of concrete [47,48].
To enable the extensive application of iron tailings in reinforced concrete, it is imperative to validate the structural behaviour of reinforced concrete samples containing iron tailings compared with plain concrete. A study was conducted to compare the flexural behaviour of iron tailings sand concrete beams and conventional concrete (CC) beams [49]. The results showed that the two types of concrete beams exhibited similar flexural behaviours and that the calculation of the crack width of iron tailings sand concrete beams should be corrected when the replacement rate of iron tailings sand is greater than 40%. Another study [50] investigated the axial compressive behaviour of short iron tailings sand concrete columns. The results showed that the iron tailings sand concrete short columns were comparable to CC short columns in terms of axial compressive strength, deformation, and ductility. The seismic behaviour of iron tailings sand concrete columns was investigated [51]. The results showed that the failure patterns of iron tailings sand concrete columns and CC columns were almost identical, while the flexural capacity of the iron tailings sand concrete columns was slightly different from that of the CC columns, and iron tailings sand could completely replace conventional sand. Compared with CC columns, the axial compressive properties of full iron tailing concrete columns satisfied the requirements of the current code [52]. Further, the calculation model that considered the hoop restraint effect could more accurately predict the axial compressive bearing capacity of full iron tailings concrete columns.
These studies show that the mechanical behaviour of reinforced concrete (RC) specimens made from iron tailings sand replacing fine aggregates is marginally different from that of conventional reinforced concrete (CRC) specimens. However, very few studies have been conducted on the mechanical behaviour of full iron tailings reinforced concrete (FITRC) specimens. The novelty of this study is the use of full iron tailings concrete (FITC), which was produced using iron tailings powder as an admixture, iron tailings gravel as a coarse aggregate, and iron tailings sand as a fine aggregate. To the best of our knowledge, this is the first investigation of the structural behaviour of FITRC columns under large eccentric loads. We aimed to comprehensively evaluate the characteristics and limitations of FITRC columns to provide a theoretical basis for the large-scale use of iron tailings. We believe that this study will be of practical significance to structural engineers in China. Previous dam failures in tailings ponds have caused significant casualties and property losses and have adversely affected the environment. Therefore, large-scale use of iron tailings in RC can effectively dispose of iron tailings, reduce the consumption of resources needed for cement production and sand mining, and ensure sustainable development.

2. Materials and Experimental Design
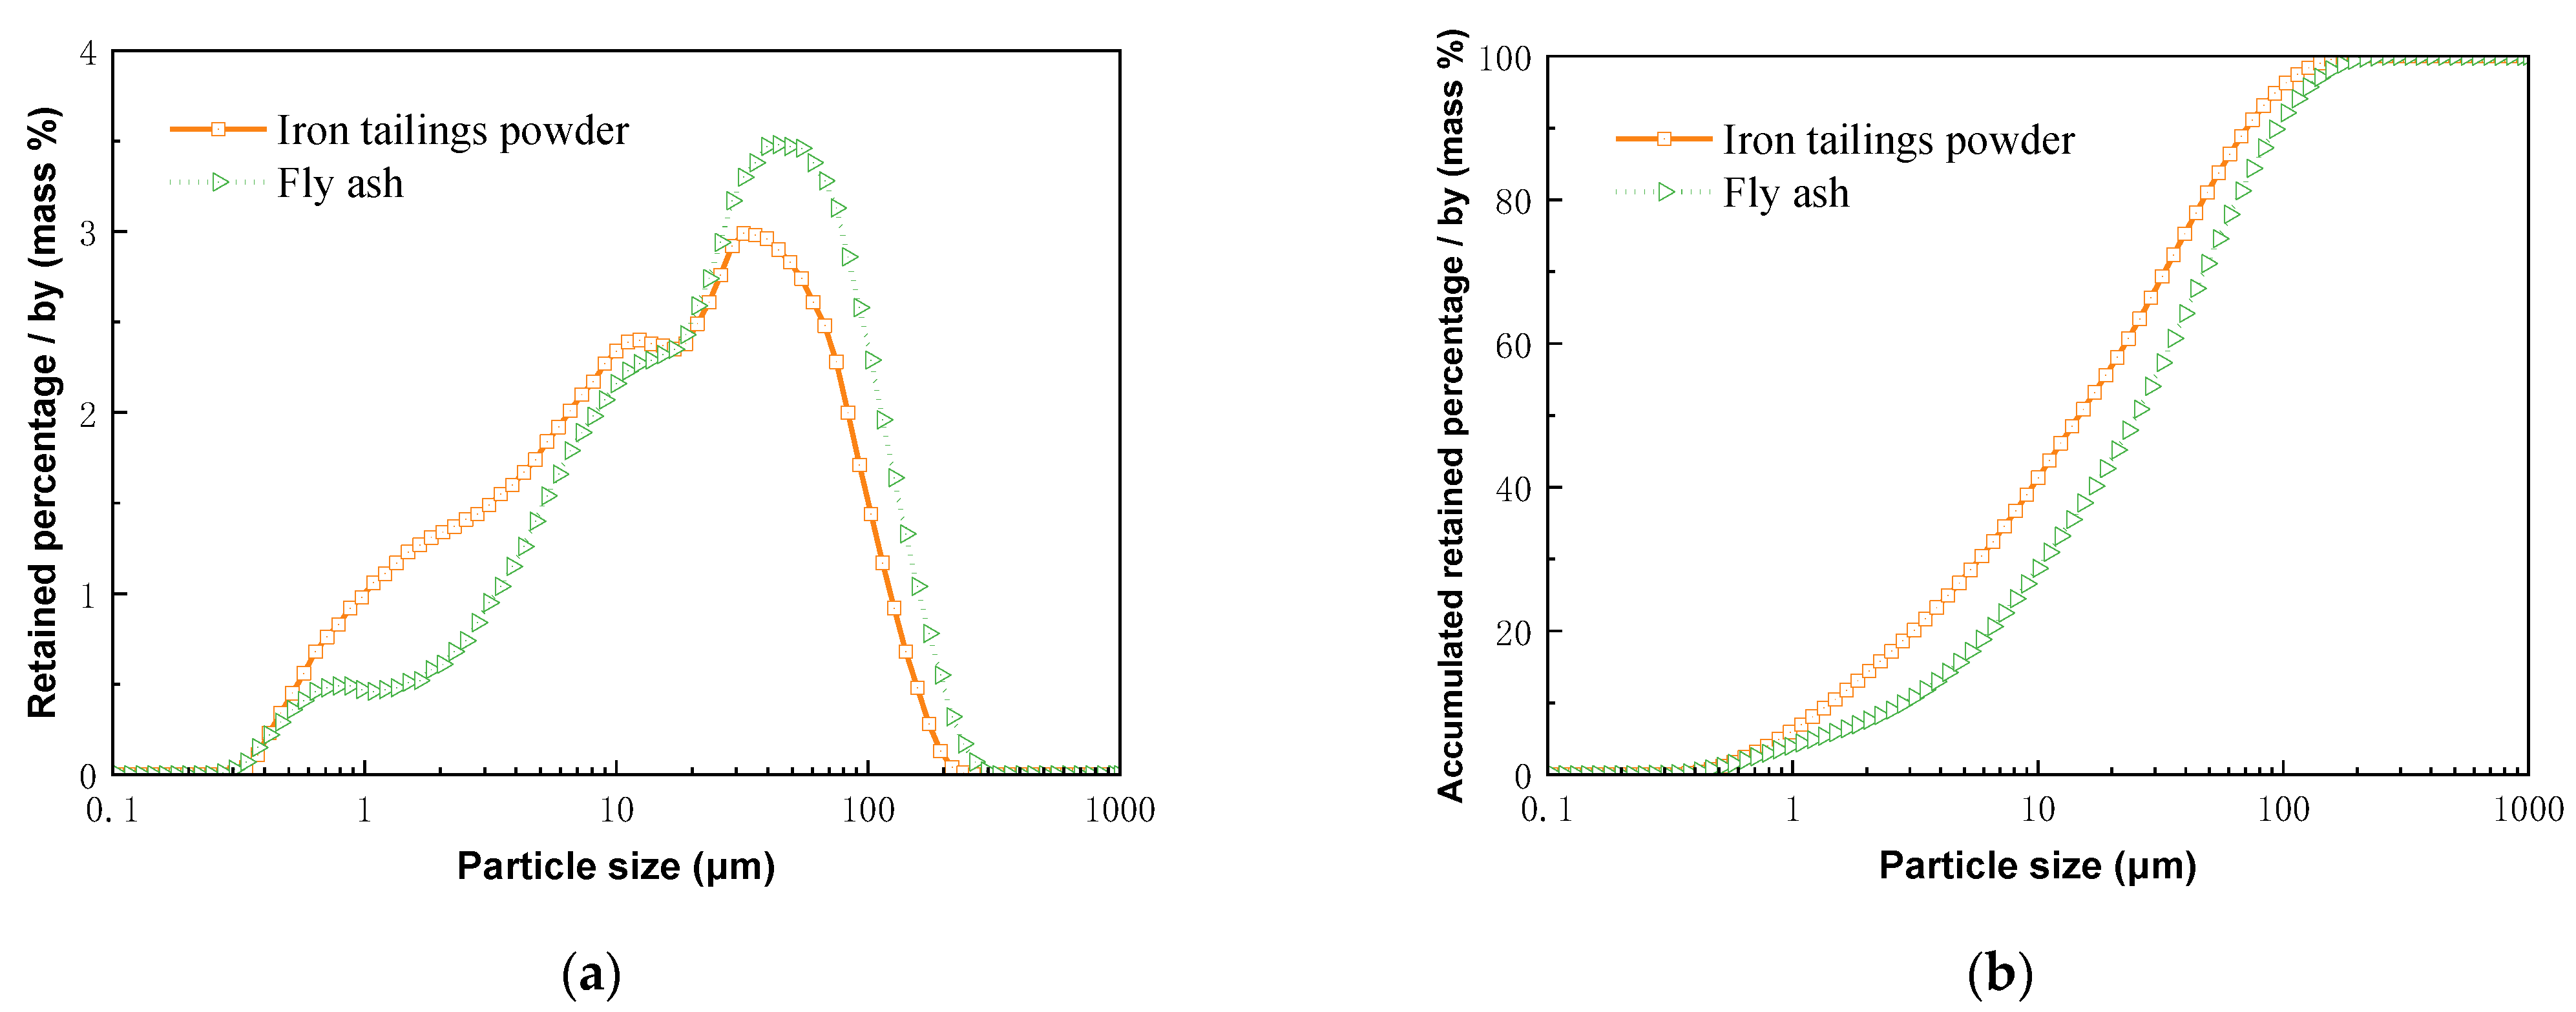
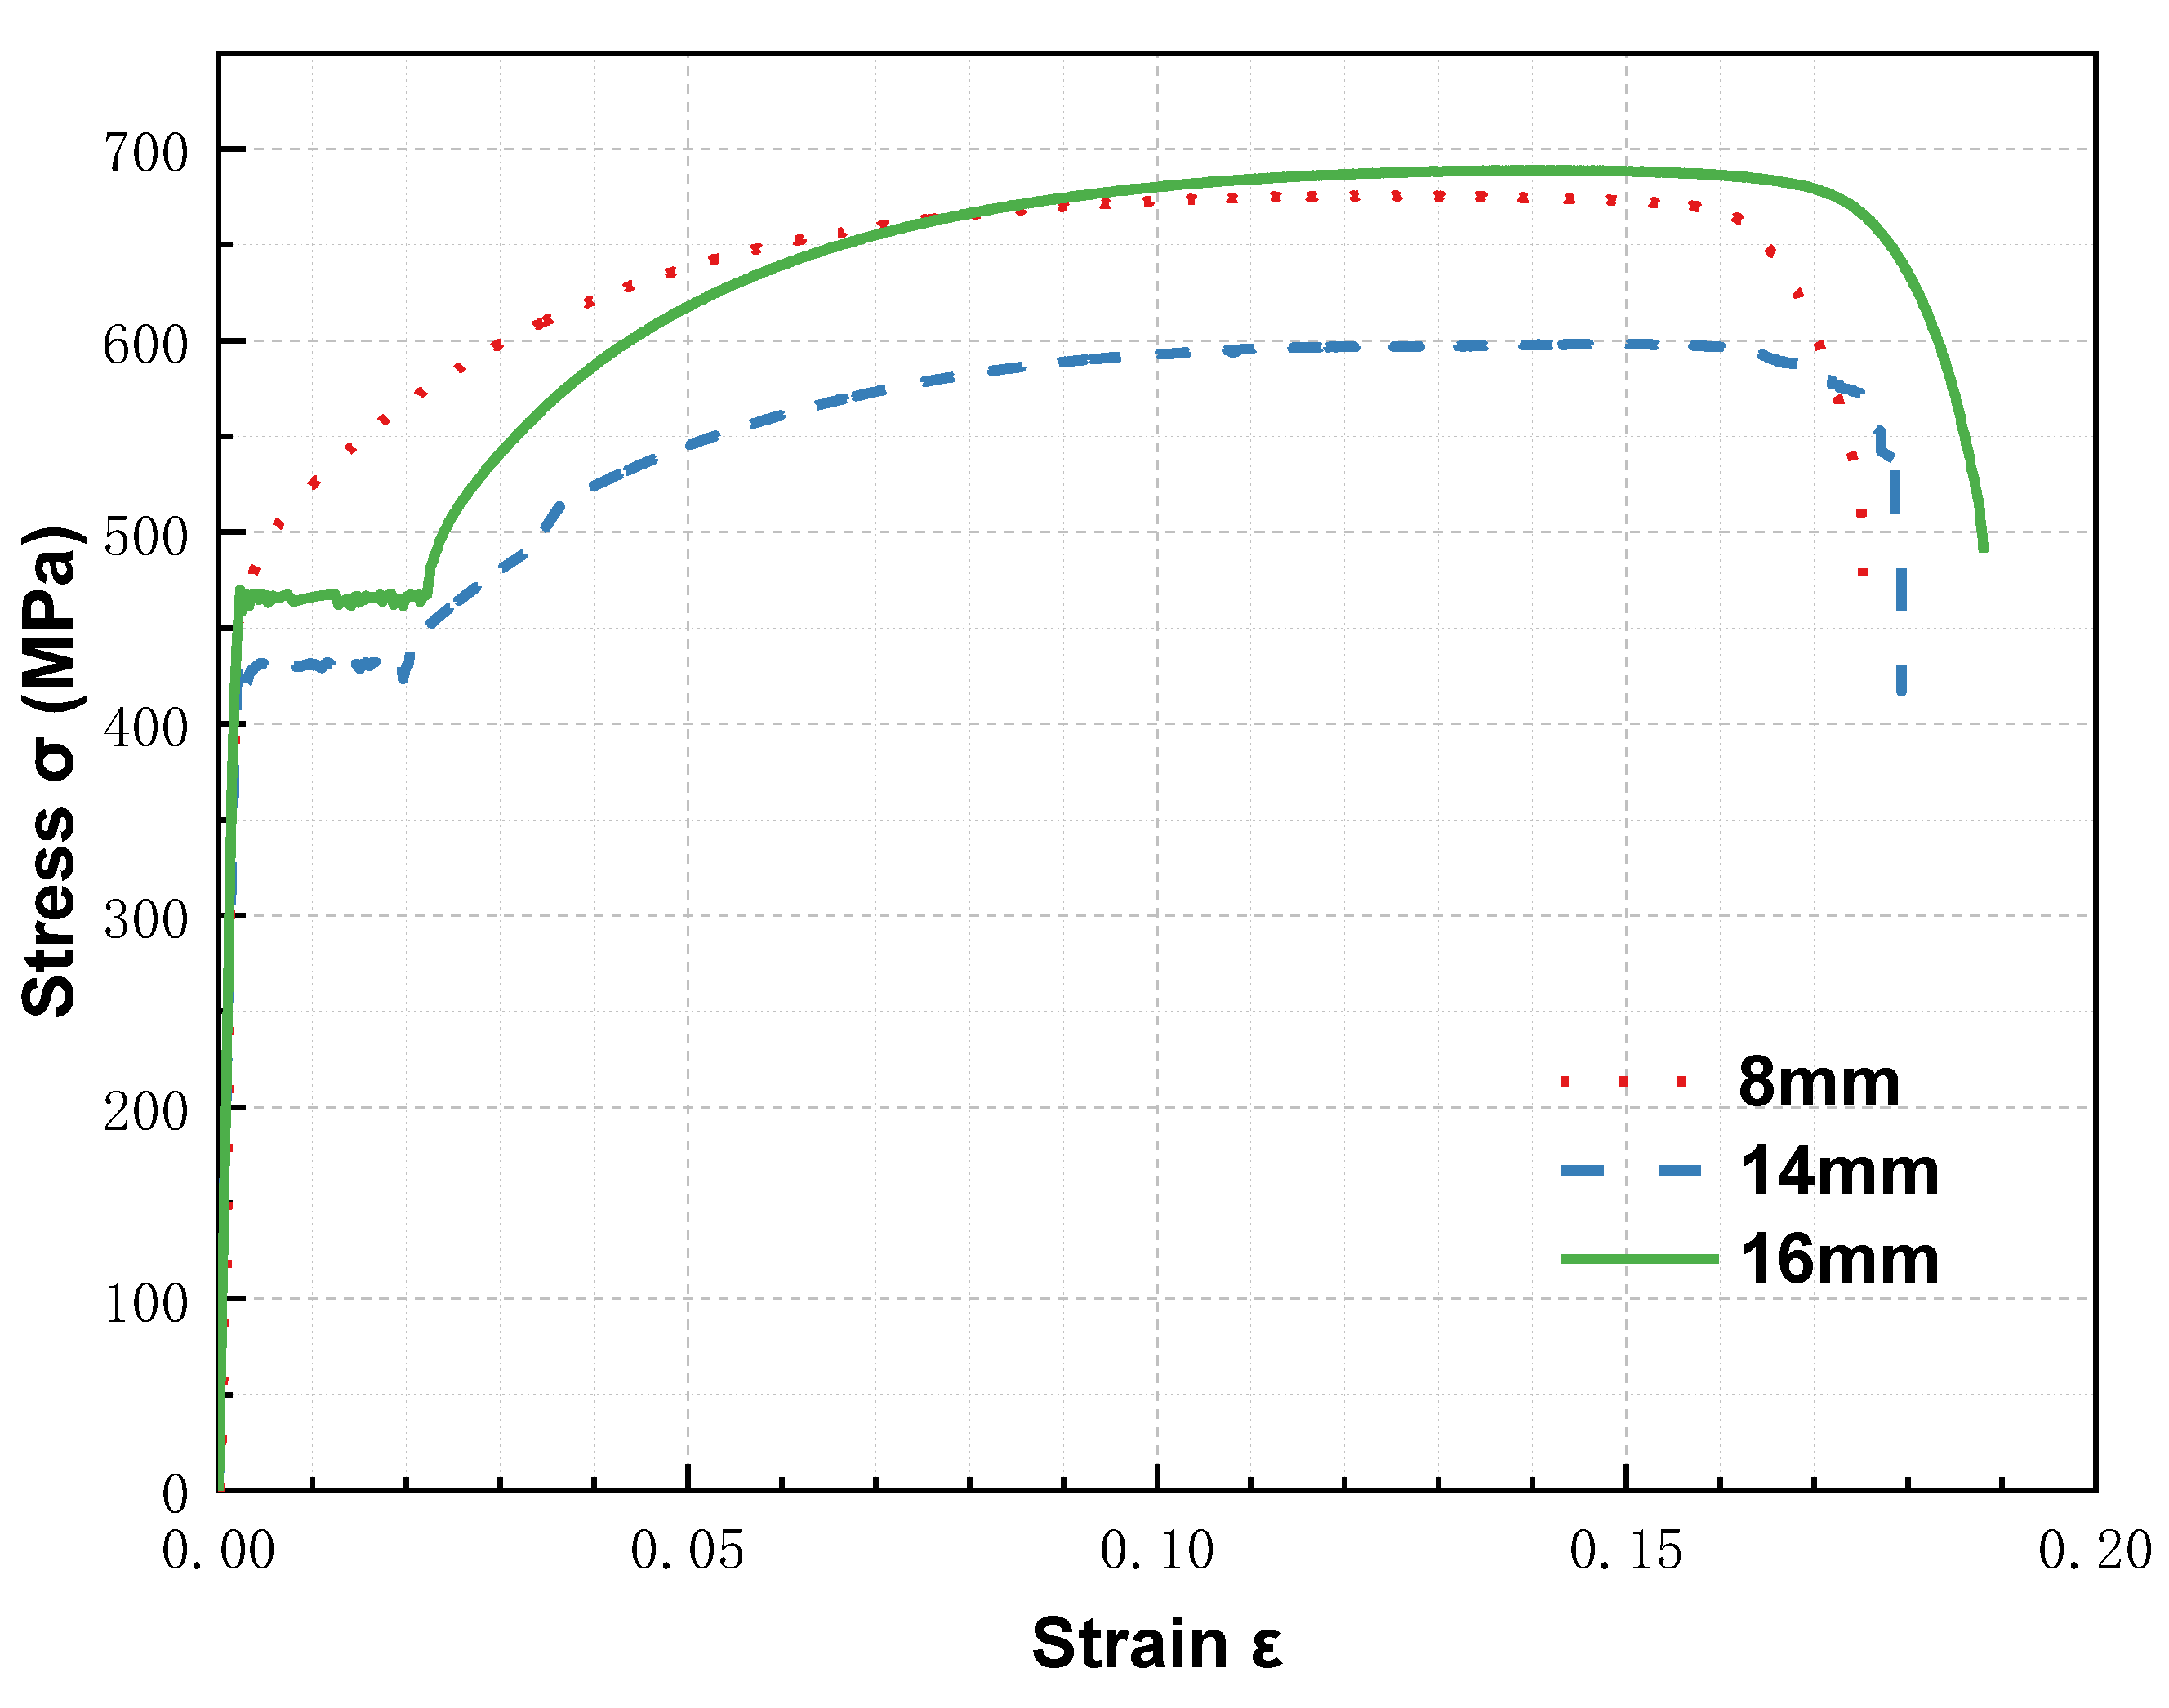
2.1. Materials

Table 1 shows the chemical compositions of the iron tailings, fly ash, river sand, and conventional gravel. Iron tailings are siliceous, with a silica content exceeding 60%.
All the samples were in powder form (<50 μm). The mineral composition of the raw materials was determined using X-ray diffraction (XRD). Quartz is the primary mineral in iron tailings, with trace amounts of anorthite, haematite, and microcline (Figure 3), all of which are inert materials that do not undergo hydration. This indicates that iron tailings have low cementitious reactivity in their original state. The particle sizes of the iron tailings were reduced, the original microstructure of the iron tailings was altered, and the reactivity of the iron tailings was improved by mechanical grinding. Cement consists of primary active cementitious materials, such as dicalcium silicate (C2S), tricalcium silicate (C3S), tricalcium aluminate (C3A), and tetracalcium aluminoferrite (C4AF). The main mineral constituents of fly ash are mullite, sillimanite, and quartz. The primary mineral constituents of river sand are cordierite, dolomite, cossyrite, and quartz. The primary mineral constituents of the conventional gravel are calcite, dolomite, and quartz.
Figure 4 shows the microscopic morphologies of the cementitious materials. The cement (Figure 4a) and iron tailings powder (Figure 4b) had varying particle sizes and many angularities. The fly ash particles were mostly spherical in shape (Figure 4c) with heterogeneous surfaces and showed some micro-porosities. Compared to iron tailings, fly ash can morphologically reduce the fluidity of concrete mixtures.
Ordinary Portland cement (P.O 42.5) was selected, and its primary indices are listed in Table 2. Iron tailings powder was sourced from Qian’an, Hebei, China, and mechanically activated by grinding in a single-shaft horizontal ball mill. Grade II fly ash was used. Table 3 lists the physical indices of the two mineral admixtures, and Figure 5 shows the particle size distributions of the two admixtures.
Table 4 summarises the primary indices of the iron tailings gravel and conventional gravel, showing that iron tailings gravel is superior to conventional gravel in terms of compressive strength and rock crushing index; however, the rate of expansion caused by the alkali–aggregate reaction of iron tailings gravel is inferior to that of conventional gravel. It is also superior to conventional gravel in terms of soundness. Iron tailings sand has a fineness modulus of 2.8, apparent density of 2780 kg·m−3 and bulk density of 1666 kg·m−3. River sand has a fineness modulus of 2.6, apparent density of 2650 kg·m−3 and bulk density of 1623 kg·m−3.

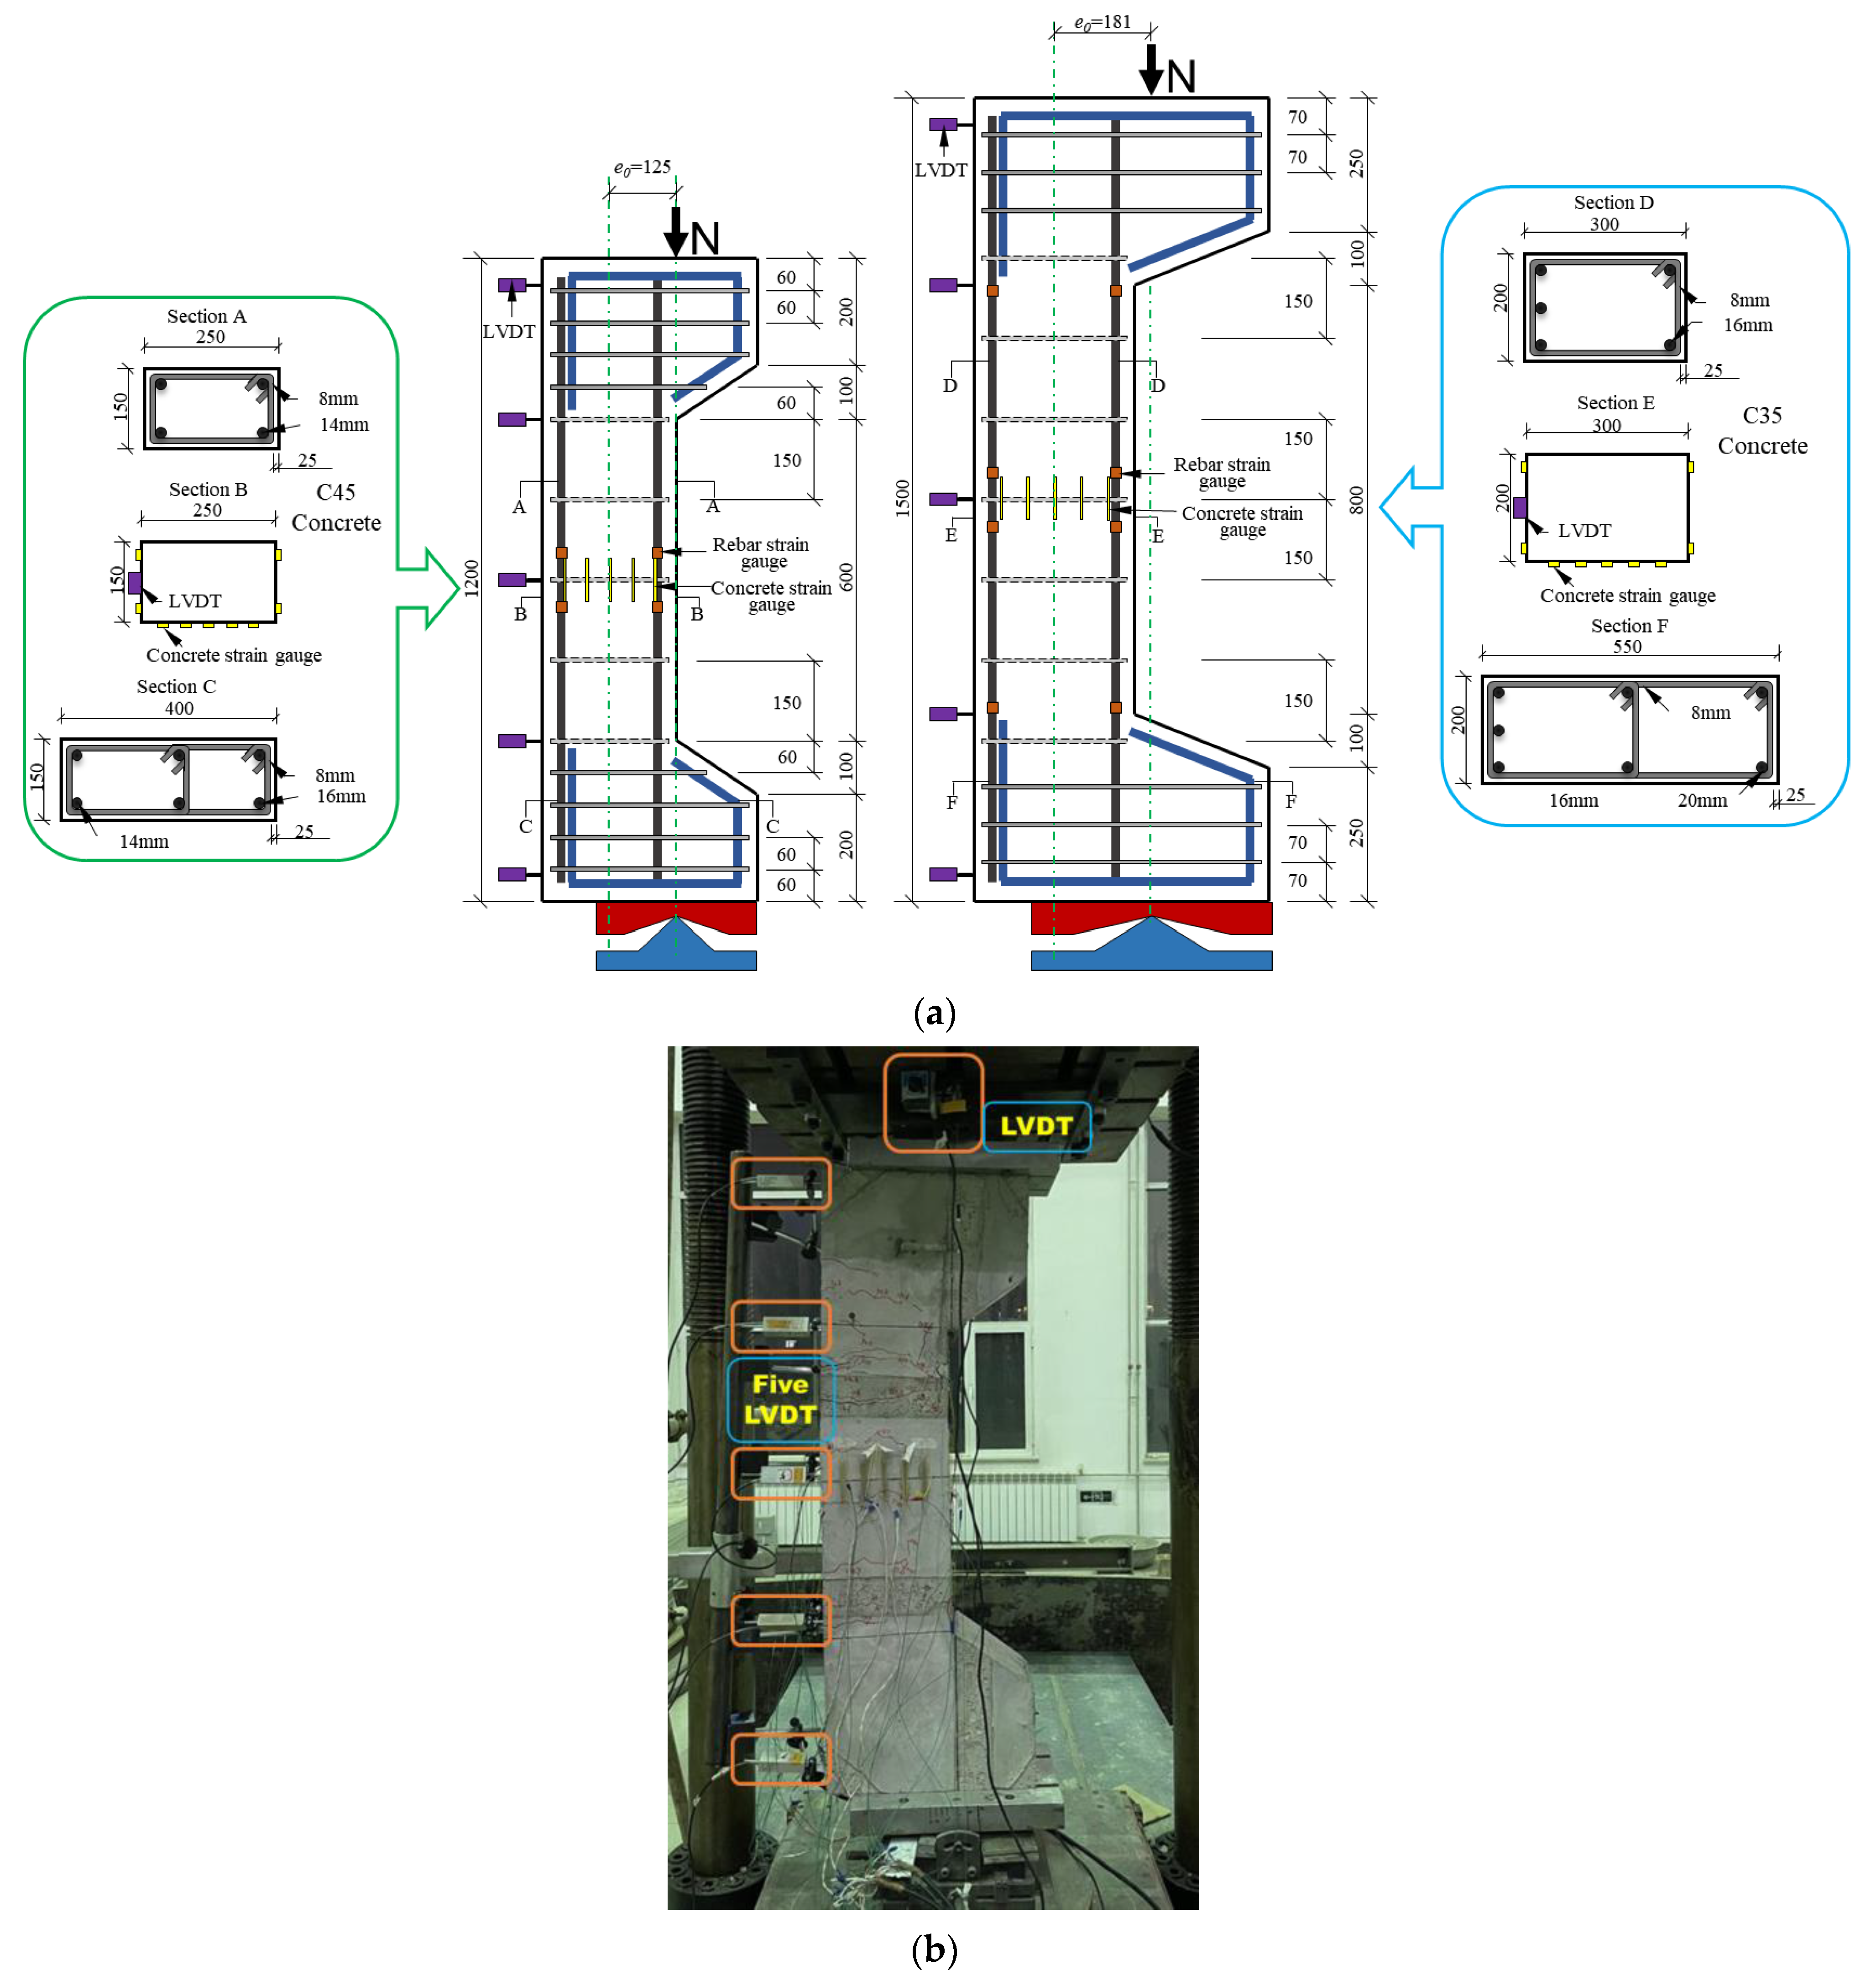
2.2. Experiment Design

The concrete mix proportions were designed according to the JGJ55-2011 specification in China [53]. In total, four concrete mix proportions and two strength grades were tested (grades C35 and C45). The specific proportions are listed in Table 5. Considering that fly ash can reduce the fluidity of concrete mix, FITC is superior to CC in terms of workability at the same water/binder ratio and water-reducing agent dosage. The mass of the iron tailings was 87.0% of the total mass of the FITC.
The mechanical behaviour of the concrete, including cubic and prismatic compressive strength, splitting tensile strength, modulus of elasticity, and Poisson’s ratio, was tested according to GB/T 50081-2019 [54]. The test results are presented in Table 6. The cubic, prismatic compressive, and tensile strengths of FITC were slightly lower than those of CC, and the modulus of elasticity of FITC decreased by 19.1% and 18.4%, respectively, compared with CC.
An HRB400 grade rebar was selected, consisting of 14 mm and 16 mm diameter longitudinal bars and 8 mm diameter stirrups. Figure 6 shows the stress–strain curves of the rebars, and Table 7 lists the primary engineering indices of the rebars. Symmetrical and asymmetrical reinforcements were used for the RC columns. Figure 7a shows the details of the reinforcement. Two axial linear variable differential transformers (LVDTs) and five lateral LVDTs were placed on the RC columns, as shown in Figure 7.
To mitigate the effect of an additional bending moment on an eccentrically pressurised column specimen, the span-depth ratio (L/h) should not exceed 5. The 1200 mm high specimen had 150 mm × 250 mm sectional dimensions and symmetrical reinforcement of two 14 mm rebars in tension and two 14 mm rebars in compression made of C45 strength concrete. The 1500 mm-high specimen had a 200 mm × 300 mm section and asymmetric reinforcement with three 16 mm rebars in tension and two 16 mm rebars in compression made from C35 concrete. To ensure that the specimens could withstand a large eccentric load, cow legs were placed at the top and bottom of the specimen. The concrete was poured into three FITRC columns and one CRC column.
Before the start of the experiment, the RC columns were placed at the location specified by the initial eccentricity e0 and preloaded. The preload did not exceed 20% of the ultimate load, and the column stability was evaluated. The columns were formally loaded in several stages of 5%–15% of the calculated ultimate bearing capacity Nu. Once the specified load was reached after each loading stage, the load was maintained for 3 min to fully release the strain in the RC, and the strain and displacement were measured at the corresponding time points.

3. Experimental Results and Discussion

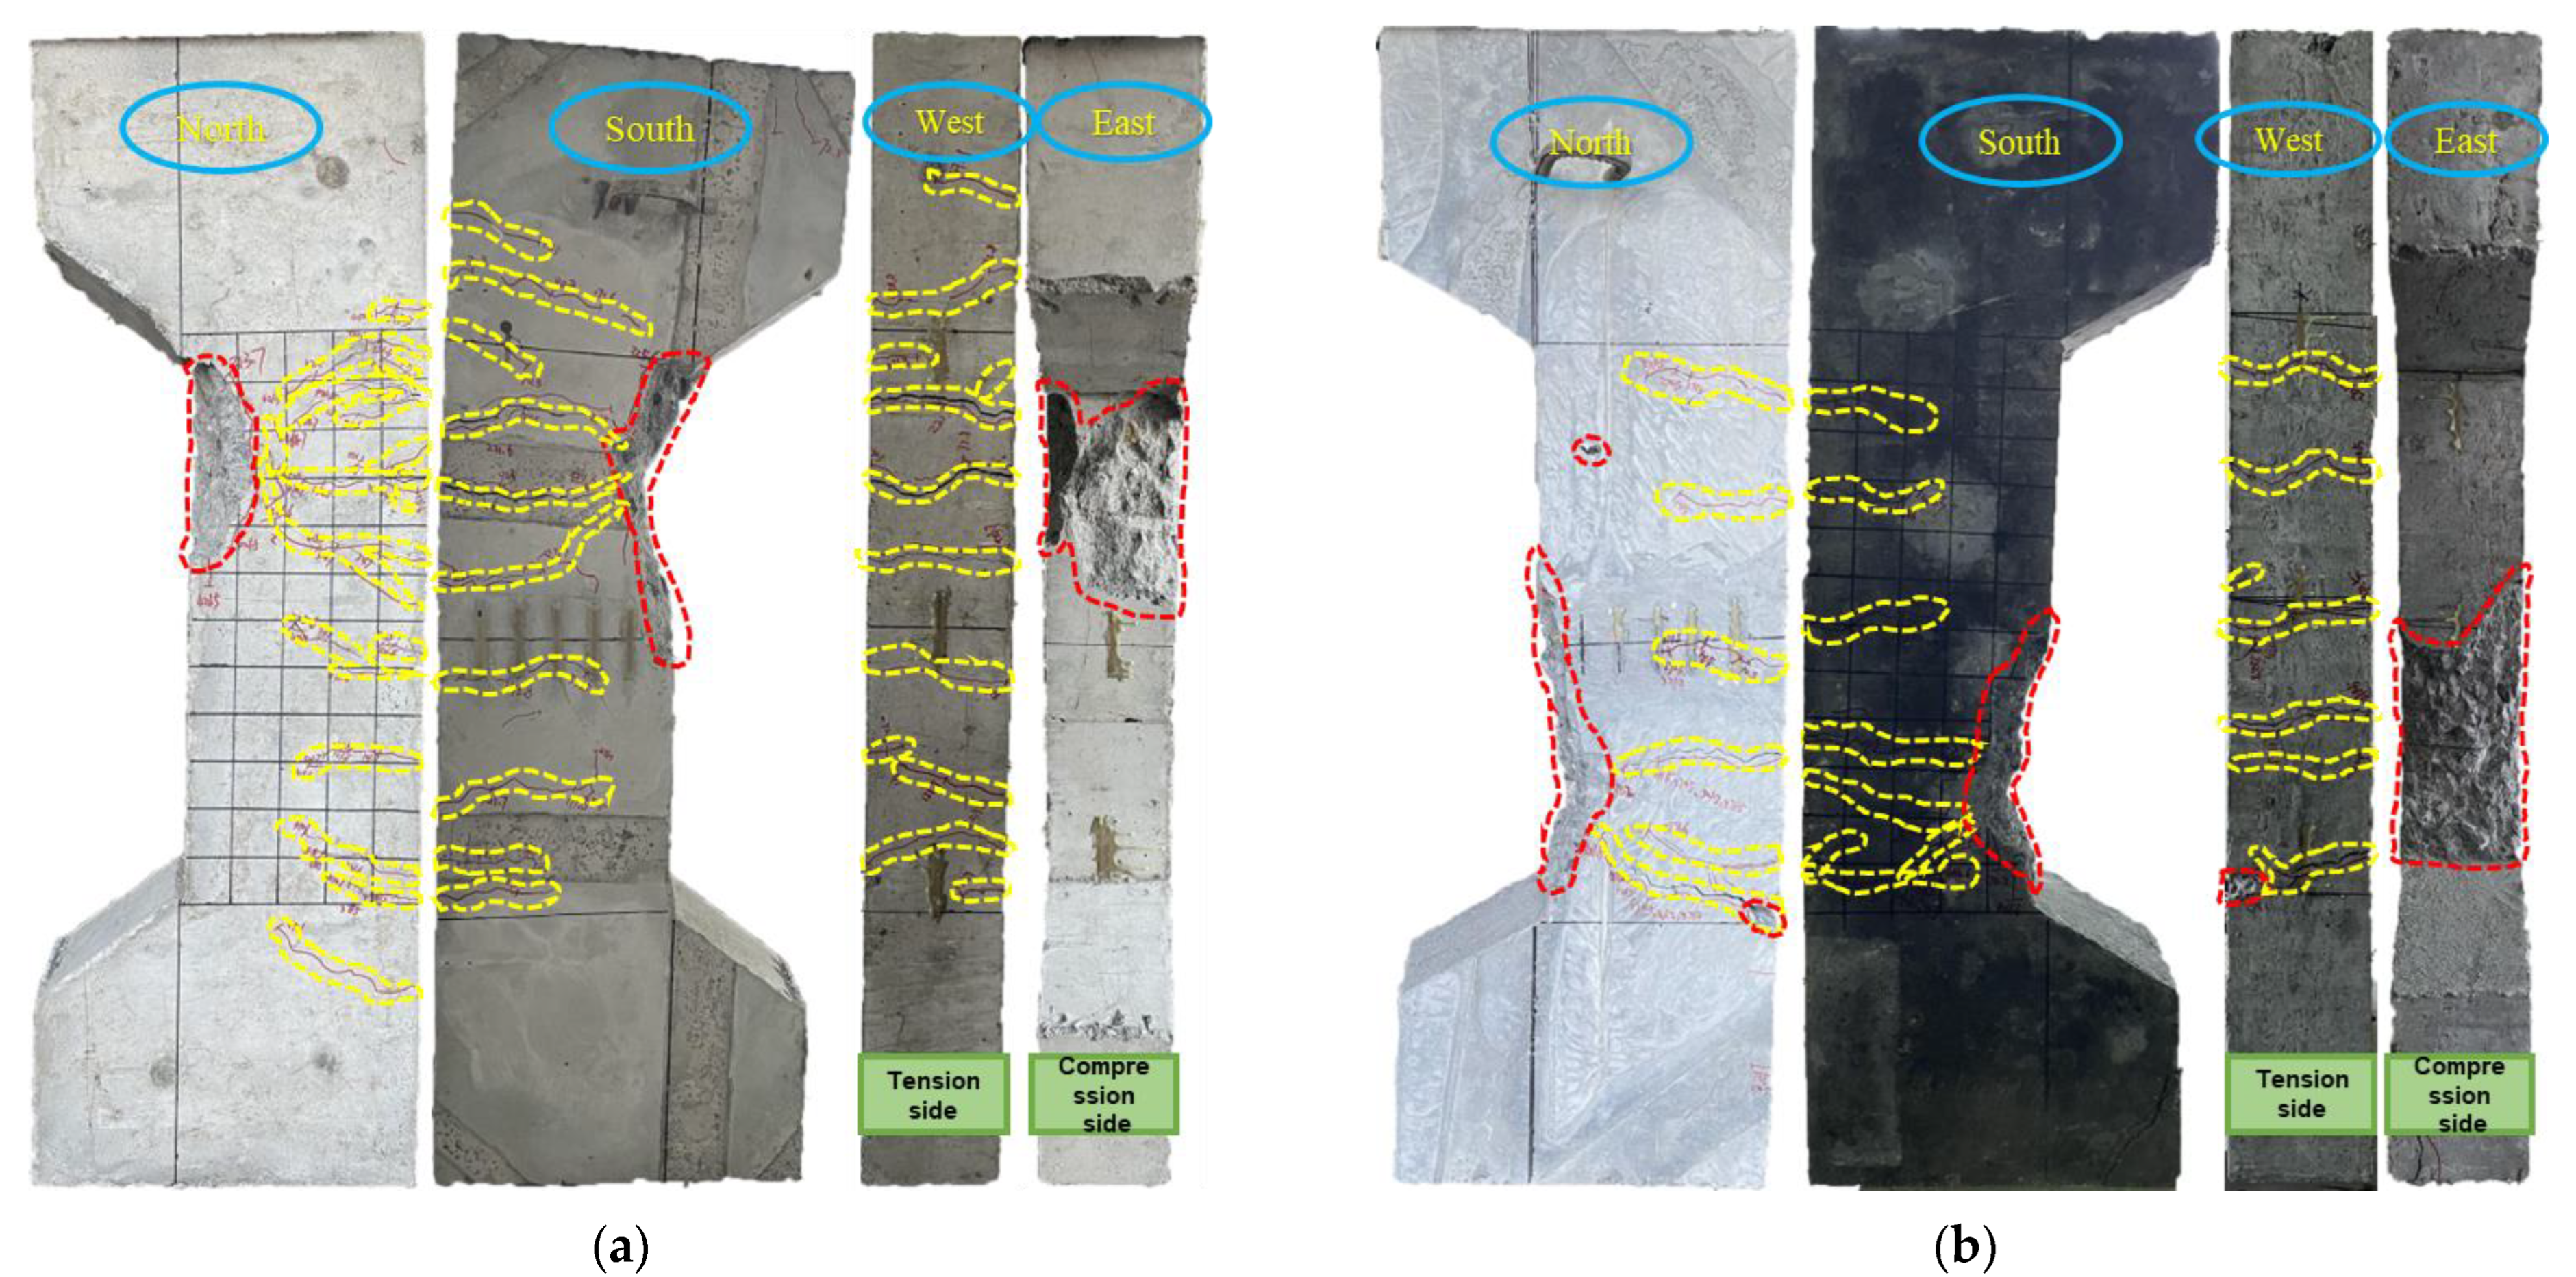
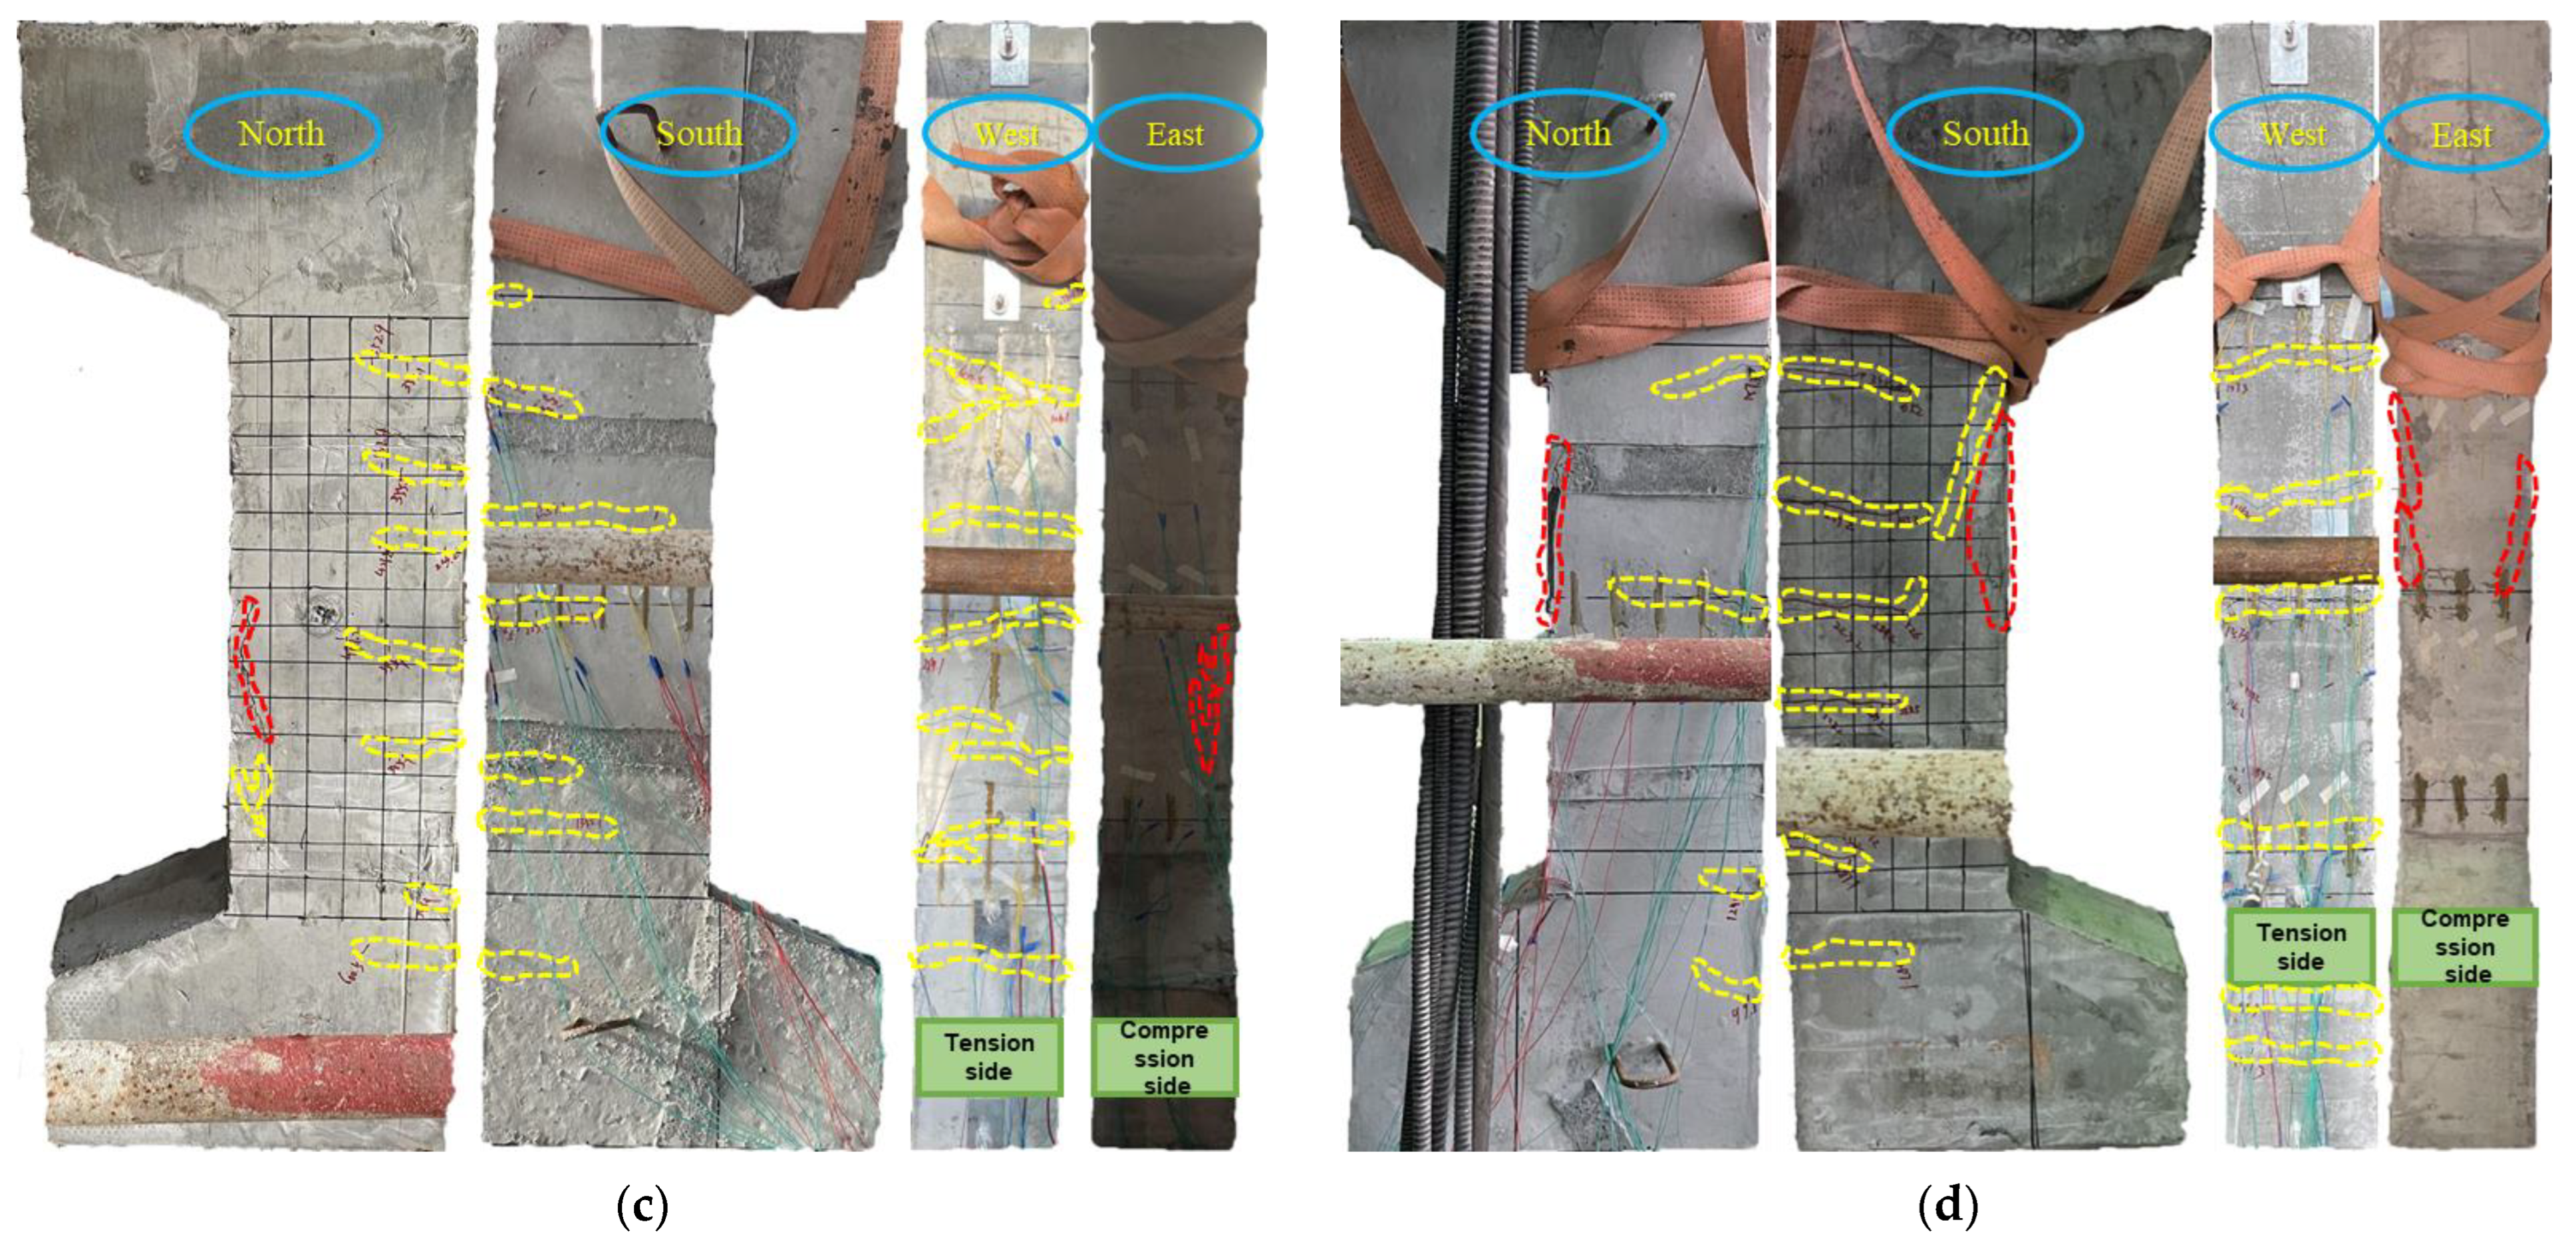
3.1. Failure Modes and Crack Propagation

The failure modes of the FITRC and CRC columns under large eccentric loads were similar. The failure of all specimens was manifested by longitudinal bar yielding in the tension zone, followed by concrete crushing in the compression zone (Figure 8). The eccentricity of the FITRC45 and CRC45 columns was 0.60 and that of the FITRC35 and CRC35 columns was 0.70. In a previous study [55], the eccentric compressive behaviour of iron tailings sand RC columns was investigated, and similar results were obtained.
Cracks occurred in the tension zone at the midspan point along the lateral depth of the FITRC45 and CRC45 columns when the load reached approximately 0.2 Nu and propagated with increasing load, resulting in new microcracks. When the load reached approximately 0.9 Nu, vertical cracks were observed in the lateral compression zone of the column specimens and began to propagate. When the ultimate load Nu was reached, the concrete cracks in the compression zone elongated and were accompanied by the appearance of new microcracks. Some of the concrete was crushed as the test specimen continued to be loaded, and the ultimate compressive strain of the concrete in the compression zone was reached; thus, the axial load on the column specimens decreased. Similar failure processes were observed for FITRC35 and CRC35 columns.
Regardless of whether the eccentricity was 0.60 or 0.70, the final failure of all the RC columns was demonstrated by the crushed concrete in the outer layer of the stirrups and the intact concrete in the inner layer of the stirrups. This can be attributed to the fact that the stirrups significantly restrained the concrete in the inner layer and inhibited its deformation. In addition, Figure 8 shows that the area of crushed concrete was related to the eccentricity of the specimen section; that is, a smaller eccentricity indicated a larger area of crushed concrete.
Figure 9 shows the load–maximum crack width curves of the RC columns. The crack width propagation trends of FITRC and CRC columns remained similar for eccentricities of 0.60 and 0.70, and the curves of the four RC columns overlapped. Considering that the splitting tensile strength of FITC was lower than that of CC, the crack width of FITRC columns was larger than that of CRC columns at the same load level.

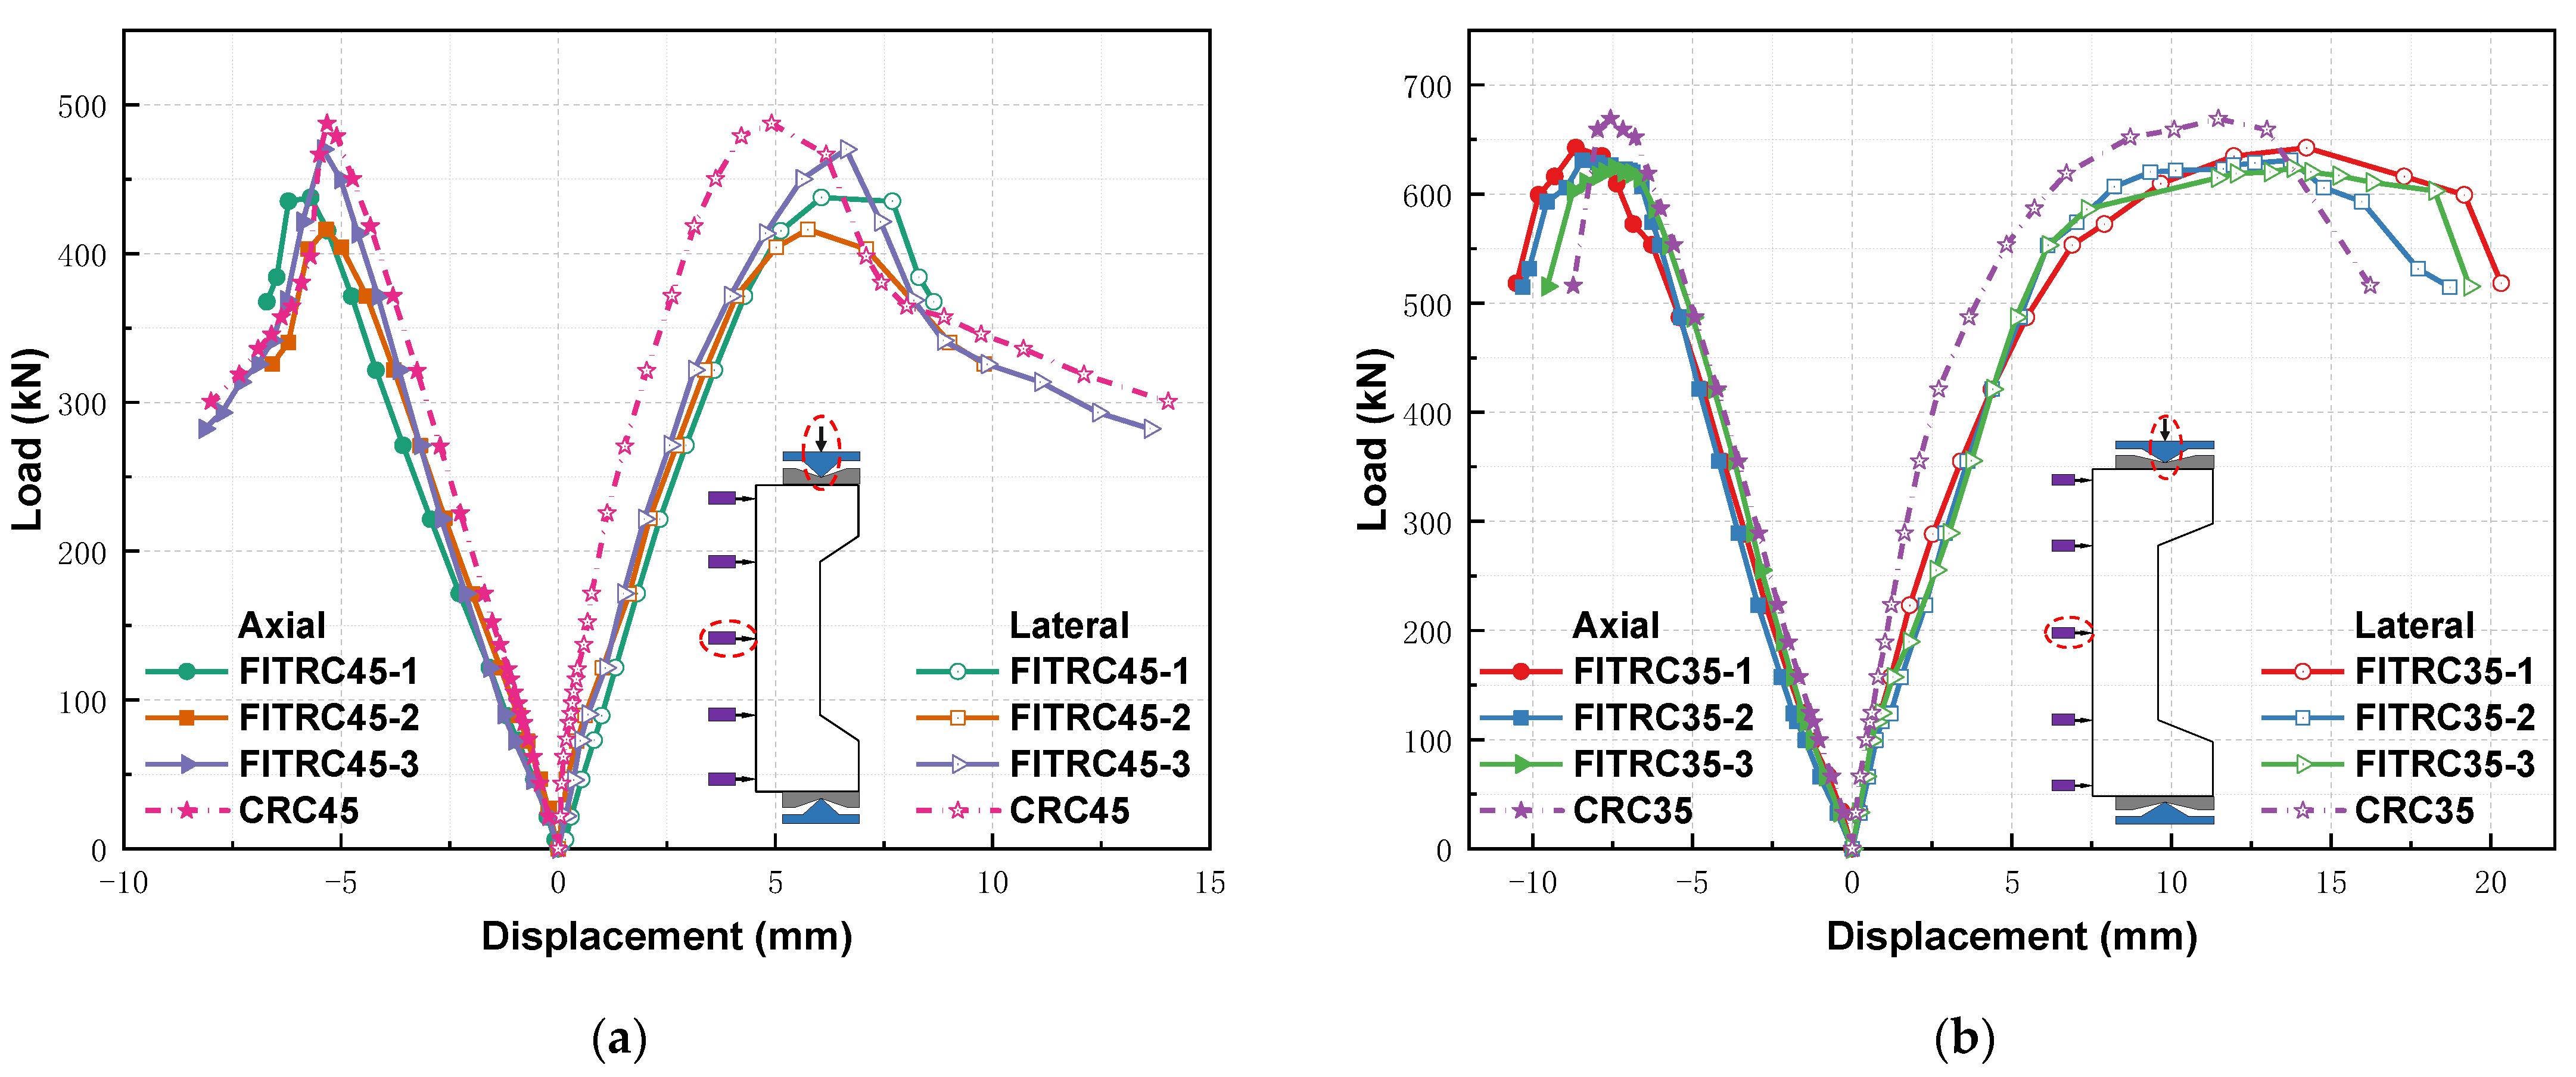
3.2. Load–Deflection Relationships

Figure 10 shows the axial load–deflection relationship (axial and lateral displacements) of RC columns under large eccentric loads. Axial and lateral displacements were measured using a vertical displacement gauge and a displacement gauge at the midspan point along the column depth, respectively. The negative and positive values in the figure indicate the axial and lateral displacements, respectively, at the midspan point along the column depth. Prior to longitudinal bar yielding, there was an approximately linear relationship between the loads and displacements of all the RC columns. After tensile yielding of the longitudinal bars, the stiffness of the RC columns decreased and the load-deflection curve increased nonlinearly until the peak load was reached when the concrete cover was crushed and spalled. After the peak load, the curve shows a decreasing trend; the load of the RC columns showed a rapid reduction of 5–10% followed by a more gradual reduction, and ductile failures occurred in the specimens. The vertical and lateral displacements of the CRC columns were clearly smaller than those of the FITRC columns. In particular, there were smaller lateral displacements compared to vertical displacements, considering that the modulus of elasticity of CC was approximately 19% greater than that of FITC (Table 6). Similarly, the peak loads of the CRC columns were slightly higher than those of the FITRC columns (Table 8).
Figure 11 shows the lateral displacements of four typical RC columns distributed along the column depth (measured using five displacement gauges). The RC columns exhibited similar lateral displacements at the different loading stages. Furthermore, the columns showed slow and rapid increases in lateral displacement in the early loading stages and as the peak load approached, respectively. The lateral deformations of the RC columns were caused by first- and second-order moments. In accordance with the literature [56], the lateral deformations and sinusoidal waveforms of columns hinged at both ends remained similar. Therefore, the lateral deformation of the RC columns can be expressed as follows:
D L = Δ p sin π l L
where Δp is the maximum displacement at the midspan point along the column depth, l is the location along the column depth, L is the column depth, and DL is the lateral displacement of the column at l. Figure 11 compares the lateral deformations of the RC columns and the sinusoidal model, which agree well for eccentricities of both 0.60 and 0.70, thereby indicating that the sinusoidal model can effectively predict the lateral deformations of FITRC columns at different loading stages.

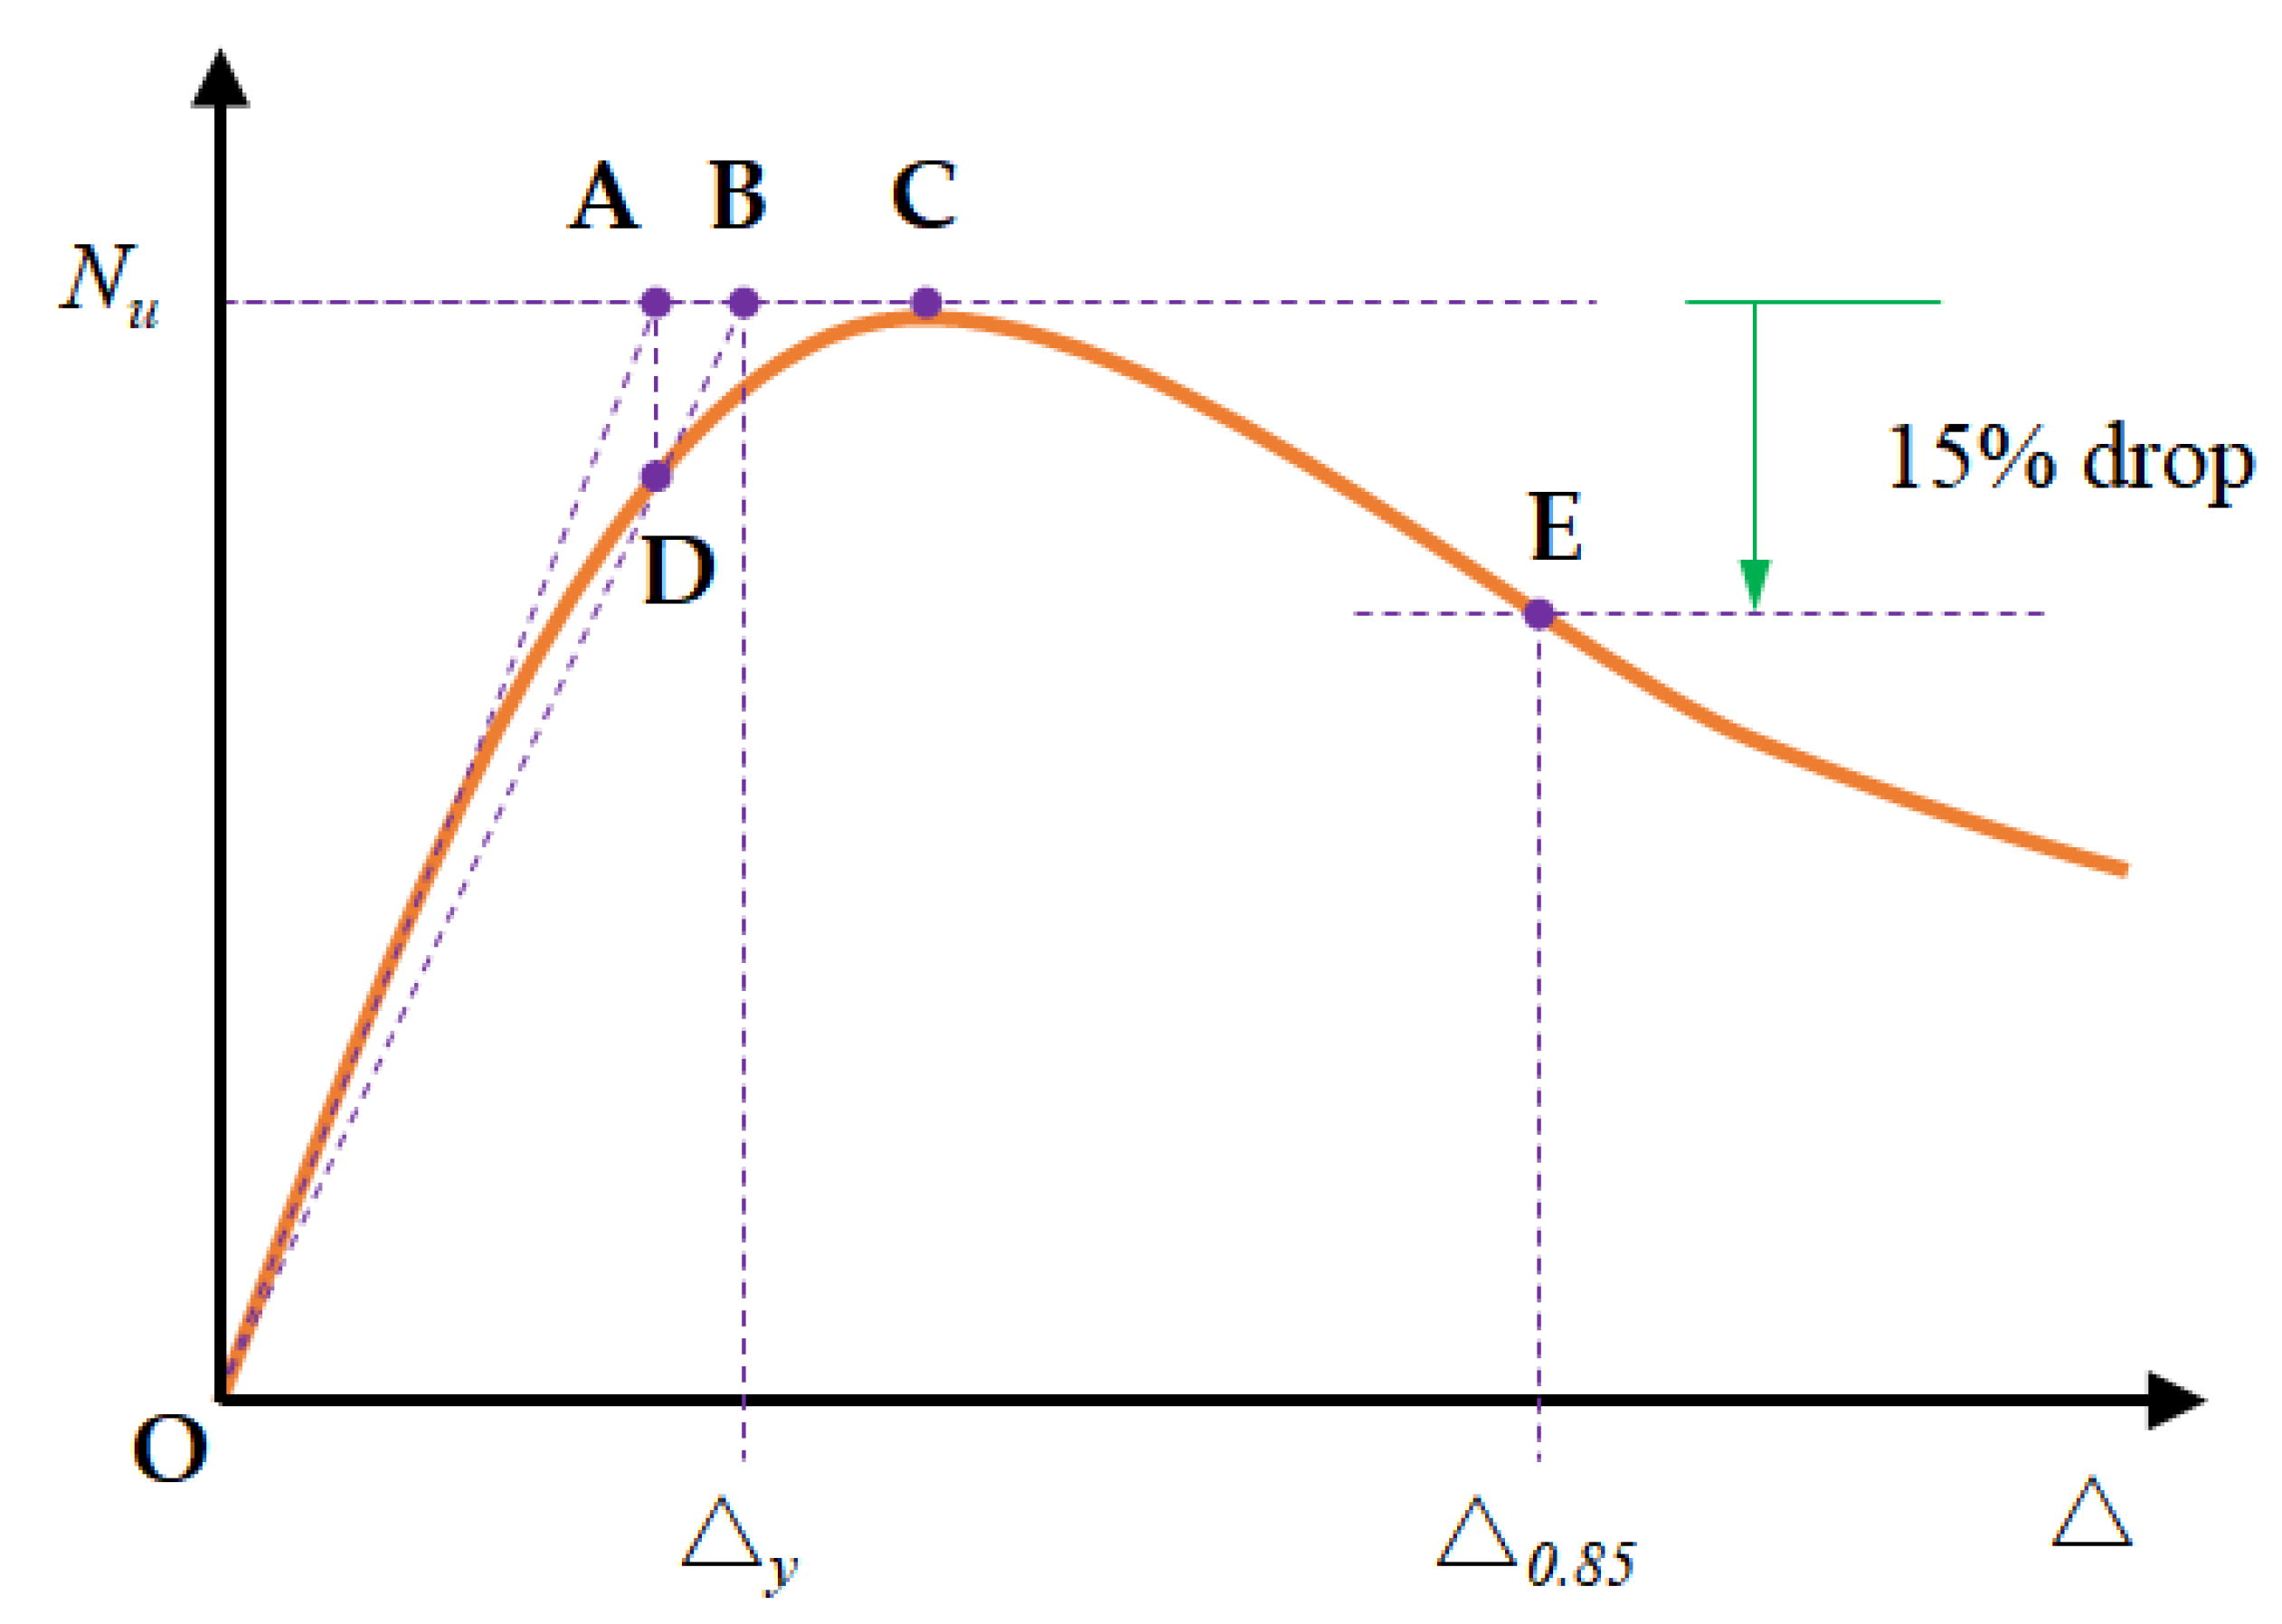
3.3. Deformation and Ductility

Table 8 lists the primary test results of the RC columns, including the peak load Nu, displacement at the corresponding peak load Δp, and yield displacement Δy. The behaviour parameters of the RC columns were quantified to determine the deformation capacity of the RC columns. In seismic design, the inelastic deformation capacity of specimens is generally quantified using the displacement ductility factor [57] and deformation coefficient [58]. The displacement ductility factor indicates the ductility behaviour of the specimens, which can be calculated as follows.
μ = Δ 0.85 Δ y
The deformation coefficient indicates the deformation capacity of the specimens after reaching the peak load and can be calculated as follows.
λ = Δ 0.85 Δ p
Here, Δ0.85 is the corresponding displacement at Nu of 0.85 in the load decreasing stage [57], Δp is the peak lateral deflection at the peak load, and Δy is the corresponding displacement at the yield load when the limit is reached in the elastic stage. The yield displacement Δy can be obtained using a graphical method [57] (Figure 12).
Table 8 shows that the mean ductility factors of the FITRC45 and FITRC35 columns were 1.78 and 2.82, respectively, and the ductility factors relative to the CRC45 and CRC35 columns were reduced by 36.6% and 19.5%, respectively. Therefore, an increase in section size and eccentricity reduced the difference in ductility between FITRC35 and CRC35 columns. A previous study [52] examined the axial compressive properties of full iron tailings RC columns and also found that the ductility coefficients of FITRC columns were lower than those of CRC columns. The mean deformation coefficients of the FITRC45 and FITRC35 columns were 1.33 and 1.35, respectively, and the deformation coefficients relative to CRC45 and CRC35 columns were reduced and increased by 5.27% and 2.80%, respectively. In the load-decreasing phase, the deformation capacities of FITRC and CRC columns were identical.
As can be seen from Table 8, the lateral deflection Δp corresponding to the peak load of the FITRC columns was greater than that corresponding to the peak load of the CRC columns, and the mean values of Δp of the FITRC45 and FITRC35 columns increased by 25% and 21%, respectively, compared to the CRC45 and CRC35 columns.

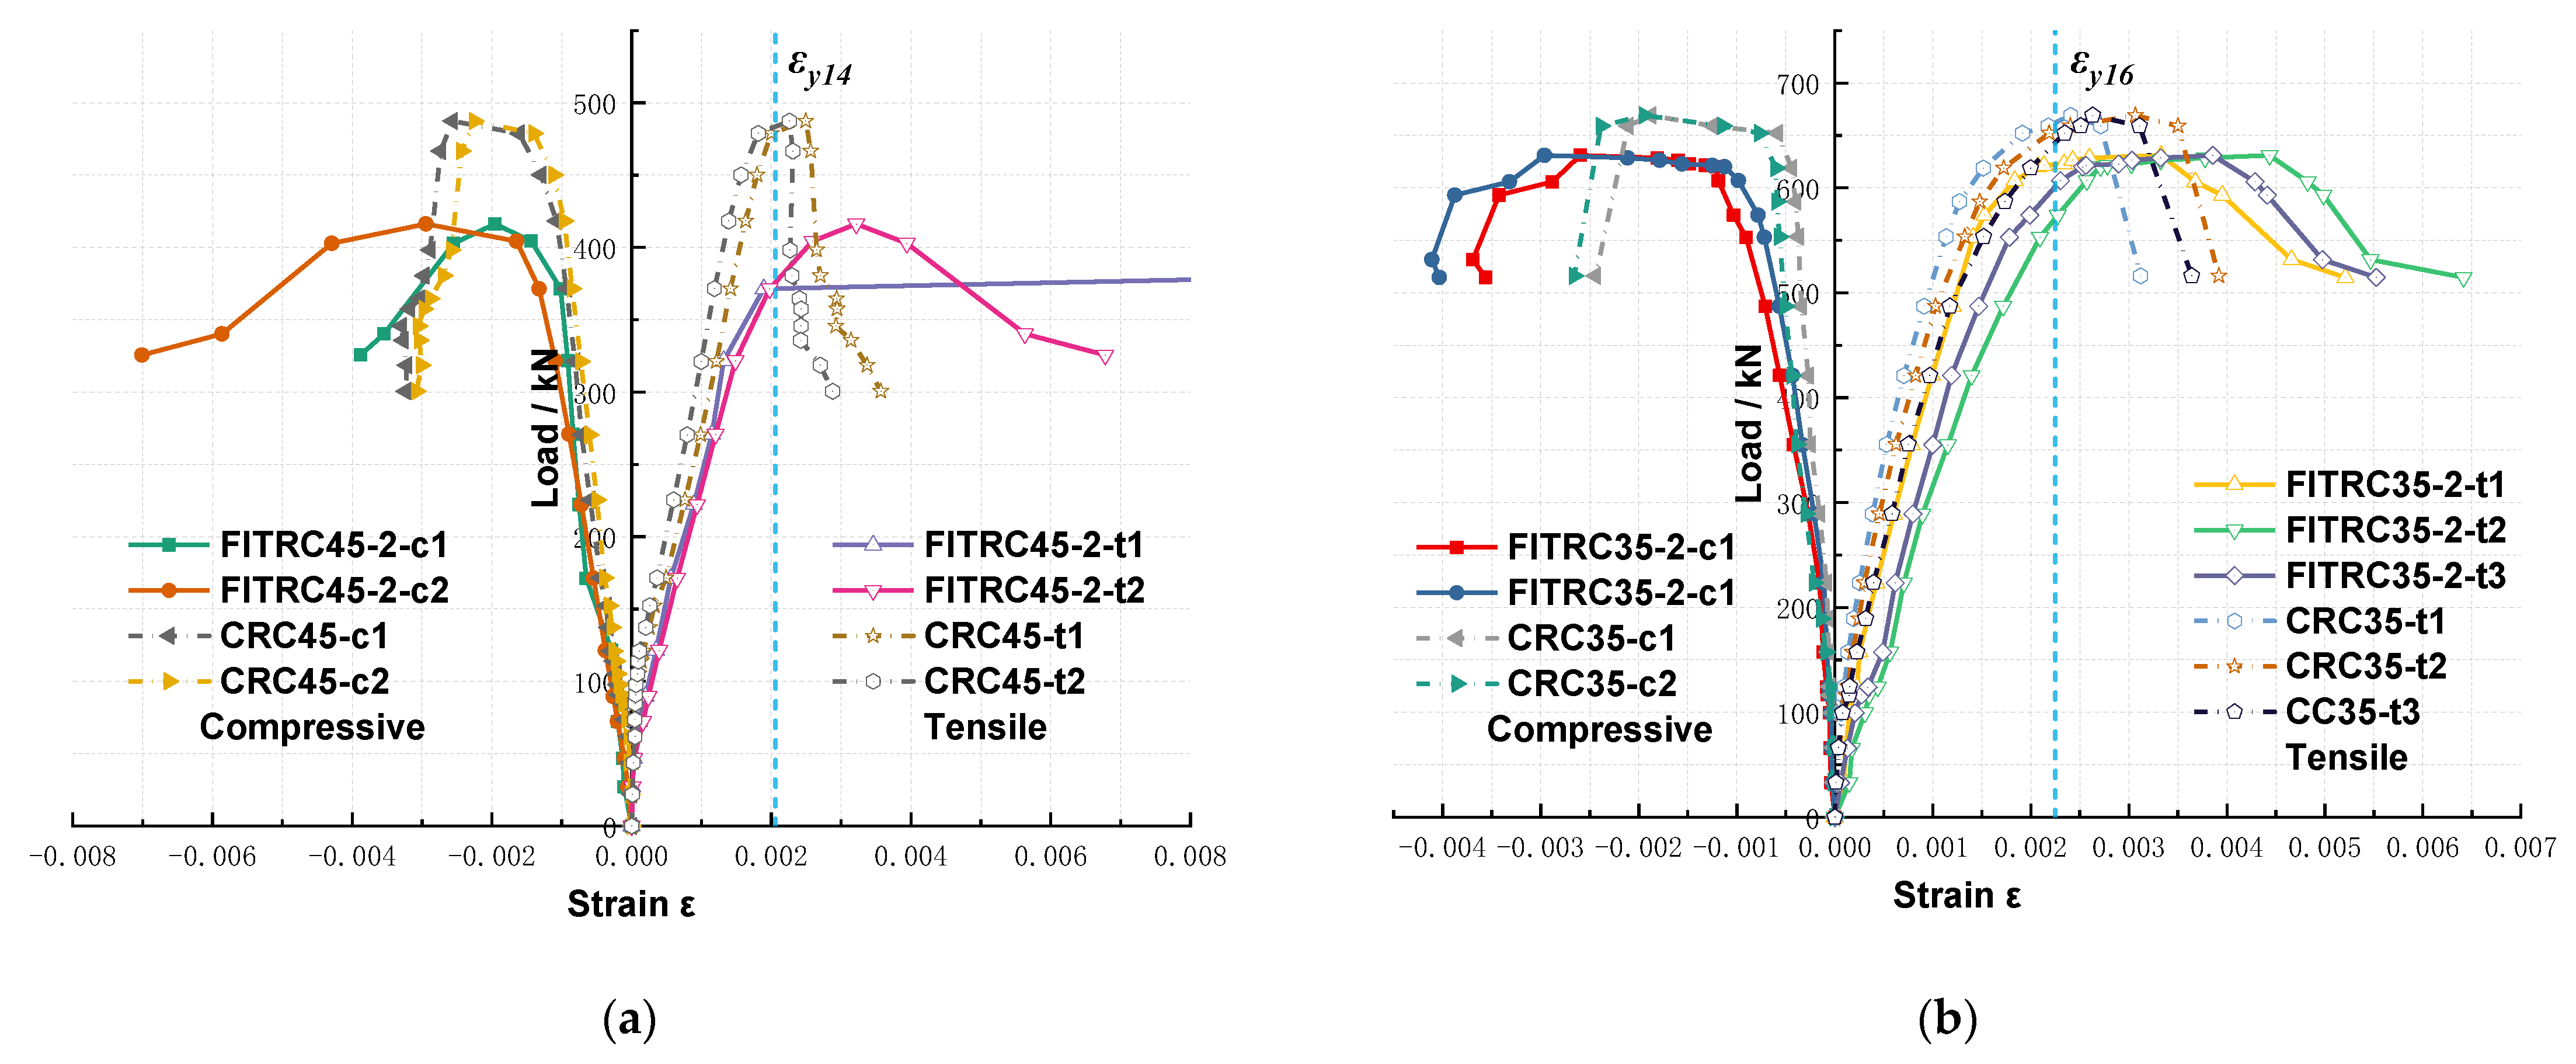
3.4. Load–Strain Relationships

Figure 13 shows the load–rebar strain curves of typical RC columns, where c is Asc of the compressive rebars, which were close to the axial compressive force with a negative strain value, and t is Ast of the tensile rebars, which were away from the axial compressive force (Figure 7) with a positive strain value. εy14 and εy16 are the tensile yield strains of rebars with diameters of 14 and 16 mm, respectively. Figure 13 shows that the strains of Ast in the RC columns were greater than εy14 and εy16, and the yield strain of rebars in the compression zone was reached before the peak load was reached. The stress state is a typical feature of compression failure at large eccentricities. In addition, the strain of rebars in the FITRC columns was significantly higher than that in the CRC columns for both Asc and Ast, because FITC had a lower modulus of elasticity than CC. In addition, the prismatic compressive and cracking strengths of FITC were slightly lower than those of CC. As a result, the ultimate load of the FITC columns was lower than that of the CRC columns, while the lateral deflection and axial displacement of the FITC columns are greater than those of the CRC columns.
Concrete strain gauges were placed along the section depth of the RC column, as shown in Figure 7a, to study the strain distribution of the concrete during loading. Figure 14 shows the strain distribution of typical concrete. Under large eccentric loads, the concrete in the tension zone of the RC columns cracked, resulting in failure of the concrete strain gauges near the tension zone. In particular, the strain distributions in the concrete before and after cracking were recorded. Figure 13 shows that the concrete strain was linearly distributed along the depth of the RC column section. Therefore, FITRC columns satisfied the planar section assumption, and the flexural capacity of FITRC columns can be theoretically calculated according to the planar section assumption.

4. Analysis of Sectional Capacities

4.1. Moment Magnification Factor

Considering the axial and flexural deformations that occurred in the RC columns under large eccentric loads during the experiment, the axial capacity, moment, and crack resistance should be calculated across the section at the mid-span of the column depth. Figure 15 shows a schematic of the second-order effects of the RC columns. Under the eccentric axial load N with initial eccentricity e0, the lateral displacement Δp of the RC columns across the column depth at the midspan allowed the eccentricity of the axial load relative to the centre of mass of the section to reach Δp + e0. Meanwhile, the moment of the RC columns increased from M1 = Ne0 to Mmax = M1 + M2 = N (e0 + Δp), which is known as the second-order effect of eccentrically loaded columns [59,60]. During design, the second-order effects are accounted for using the moment augmentation factor [61].
According to [62], the relationship between the ultimate sectional curvature φp and Δp of RC columns can be expressed as:
φ p = Δ p π L 2
This equation is valid only if the first- and second-order deformations of a column can be expressed as sinusoidal shapes.
Therefore, the moment augmentation factor η can be expressed as:
η = e 0 + Δ p e 0 = 1 + φ p L 2 e 0 π 2
In the design code, an additional eccentricity ea is introduced because of uncertain load locations, uneven concrete quality, and construction variations, and a value of 20 mm is considered with an eccentricity of ei = e0 + ea.

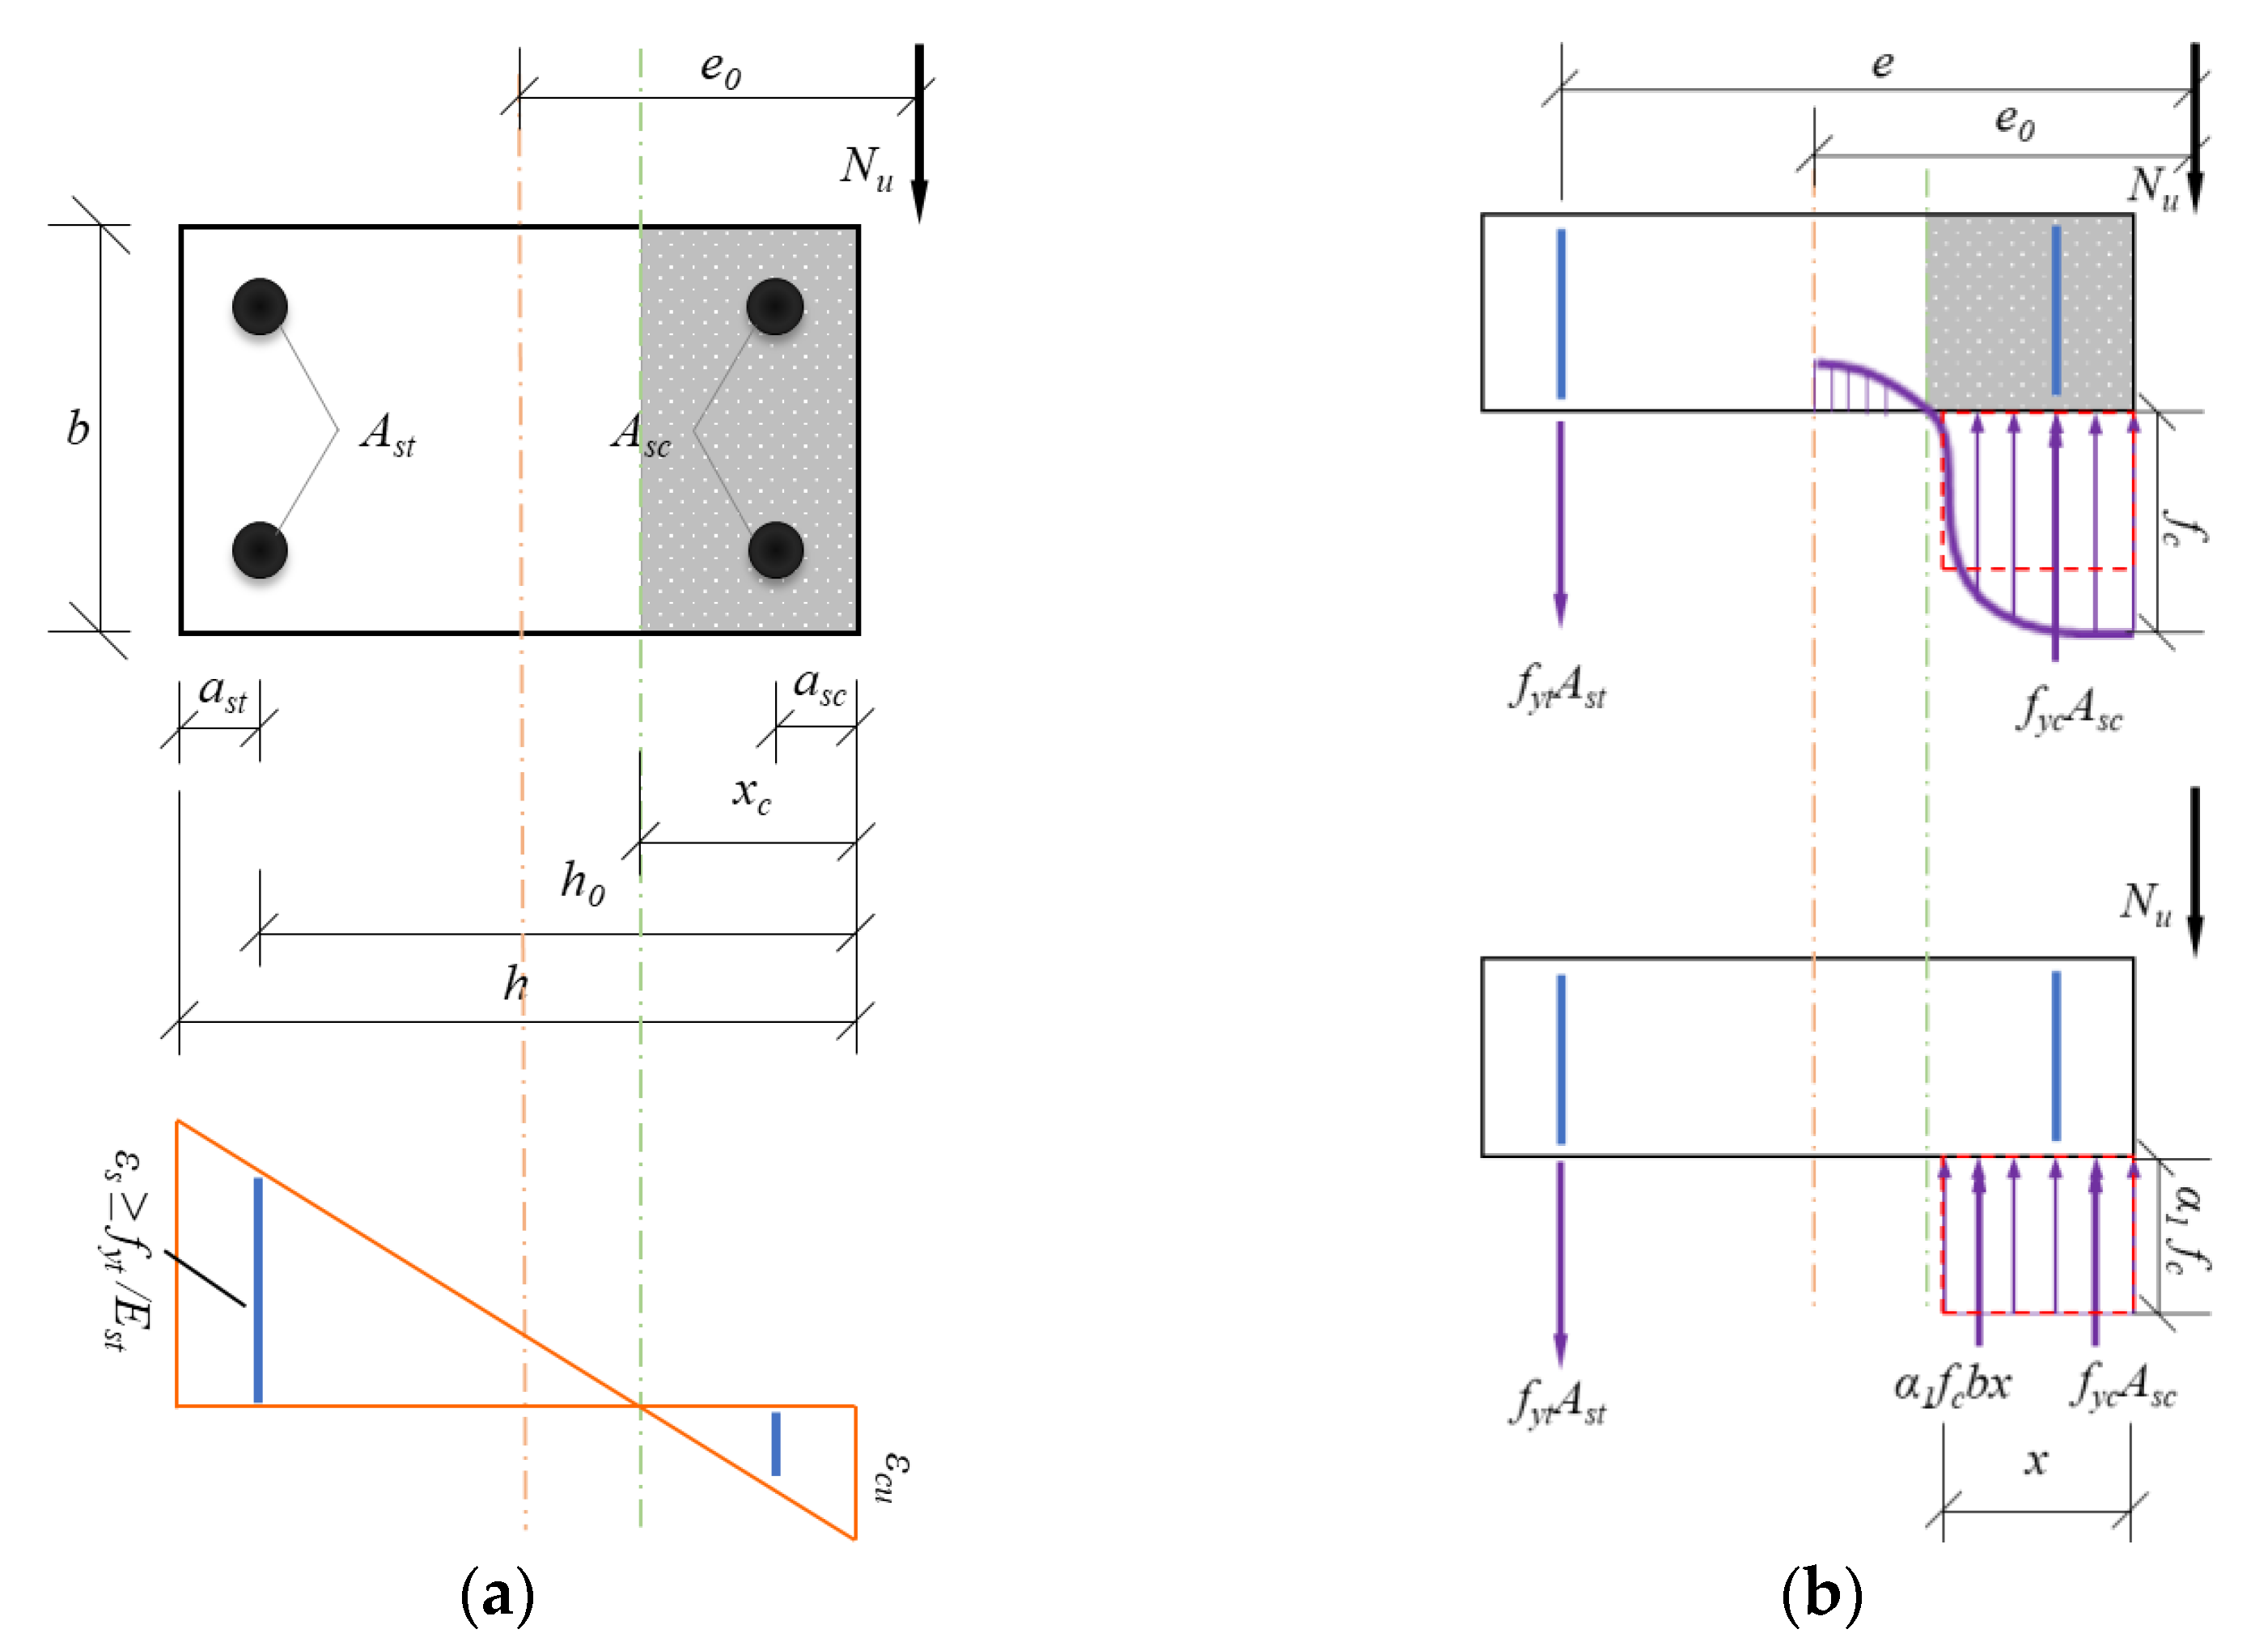
4.2. Bearing Capacity

In general, the bearing capacity under eccentric compression is calculated using the equivalent rectangular stress diagram [61], assuming that the FITRC columns satisfy the plane section assumption, and the theoretical calculation can be performed according to GB 50010-2010 [61]. Furthermore, to simplify the calculation process, the tensile strength of the concrete was ignored. Figure 16 shows a simplified diagram for calculating the section of an RC column subjected to compression failure under a large eccentric load.
The compressive stress curve of the concrete in the compression zone was replaced with an equivalent rectangular diagram. According to the equilibrium conditions of the forces, the following formula was obtained.
N u = α 1 f c b x + f y c A s c f y t A s t
Here, α1 is the equivalent rectangular stress block coefficient of concrete in the compression zone, defined as 1.0; b and h are the sectional dimensions of the RC columns; fyt and fyc are the yield strengths of the tensile and compressive longitudinal bars, respectively; Ast and Asc are the sectional areas of the tensile and compressive longitudinal bars, respectively. According to the resultant point of various forces on the tensile specimens in Figure 16b, the moment equilibrium conditions were determined and expressed as:
N u e = α 1 f c b x h 0 0.5 x + f y c A s c h 0 a s c
e = η e i + 0.5 h a s t
where e is the distance from the point of axial force to the resultant point of Ast of tensile longitudinal bars, h0 is the distance from the resultant point of Ast of tensile longitudinal bars to the edge of the compressive concrete, x is the depth of concrete in the compression zone, ast is the distance from the resultant point of Ast of tensile longitudinal bars to the edge of the tensile concrete, and asc is the distance from the resultant point of Asc of compressive longitudinal bars to the edge of the compressive concrete.

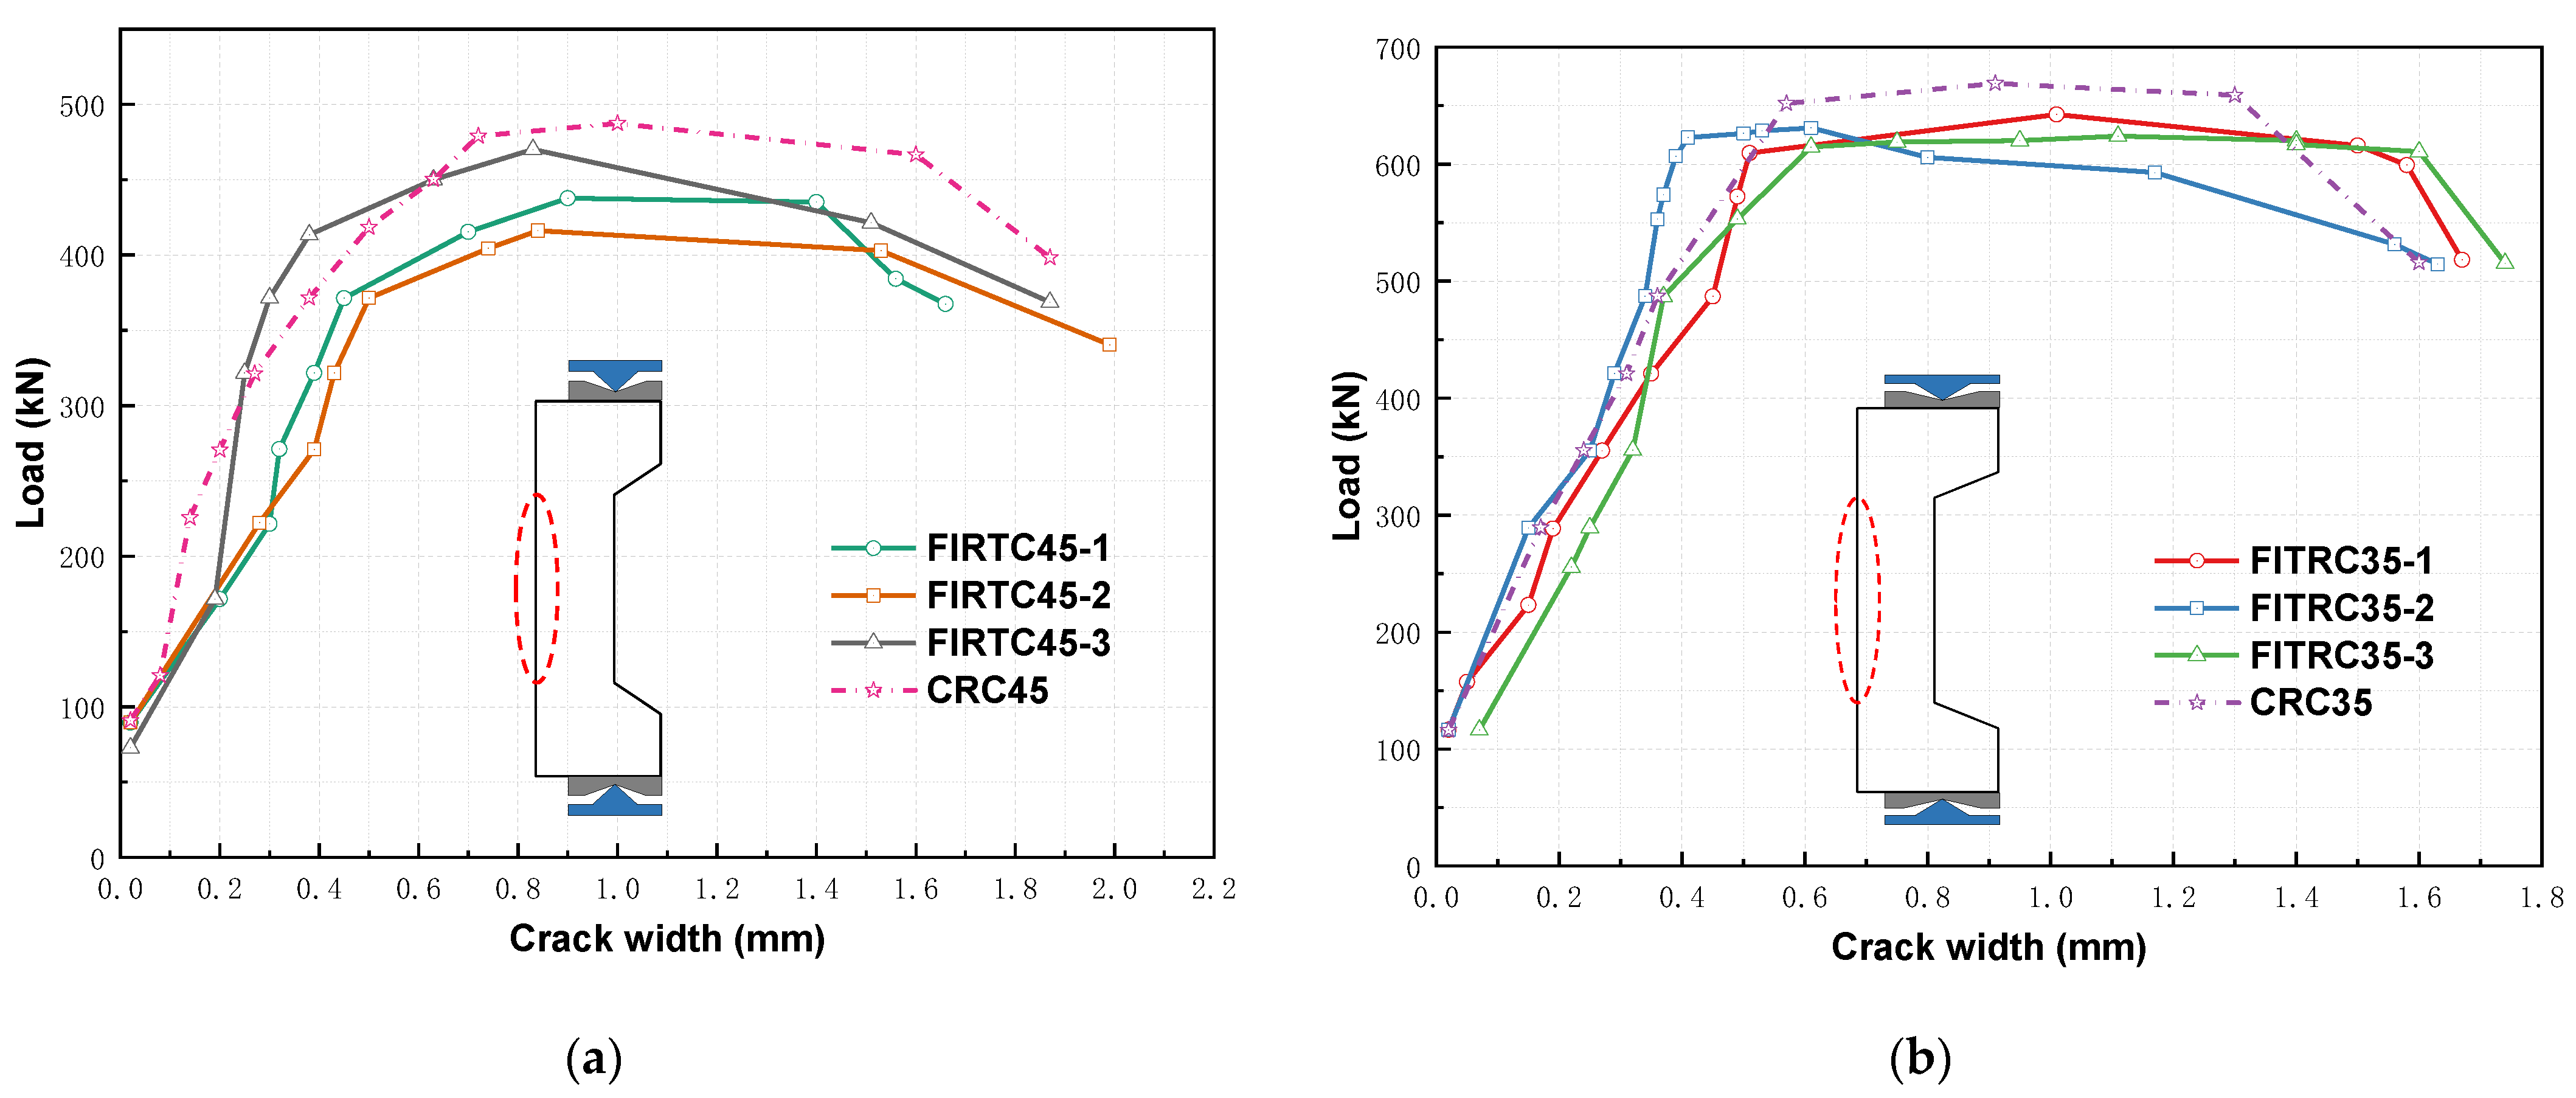
4.3. Crack-Resistant Load

According to the SL191-2008 standard in China [63], the crack resistance of RC columns under eccentric compression should be calculated as follows:
N c r γ m α c t f t A 0 W 0 e i A 0 W 0
where γm is the plastic section modulus, with the rectangular section set to 1.55; αct is the tensile stress limit coefficient of concrete, offset to 0.85; A0 is the area of the transformed section; and W0 is the elastic section modulus of the tensile edge of the transformed section, calculated as:
A 0 = b h + α E A s t + α E A s c
W 0 = I 0 / ( h y 0 )
I 0 = ( 0.0833 + 0.19 α E ρ ) b h 3
y 0 = ( 0.5 + 0.425 α E ρ ) h
where I0 is the moment of inertia of the column section, y0 is the distance from the axis of gravity of the transformed section to the compression edge, and ρ is the reinforcement ratio of the tensile longitudinal bars.

4.4. Experimental Verification of Theoretical Predictions

According to the aforementioned formulae, the moment augmentation factor and bearing capacity of the RC columns were calculated using the measured mechanical parameters of the rebar and concrete, respectively, and compared with the experimental results. As shown in Table 9, the theoretically calculated cracking load and ultimate bearing capacity were in good agreement with the measured results, with a maximum error of only 16%. In addition, there was a strength safety margin, which verifies that the calculation formulae are effective for FITRC columns under large eccentric loads.
Table 10 lists the moments of the RC columns and the calculated moment augmentation factor. According to the structural design code [61], the moment augmentation factor η should be 1.0 when L/h ratios do not exceed 5.0. Furthermore, the moment augmentation factor of the FITRC columns is greater than that of the CRC columns in the control group. The measured moment augmentation factors of the six FITRC columns are close to each other, with a maximum value of 1.079, whereas the η value of the FITRC columns increases by a maximum of 1.5% compared to the CRC columns. This is because the L/h ratios of the RC columns in this study do not exceed 5.0 and the impact of the second-order effects is marginal.
In addition, Table 10 shows that the second-order moments of the FITRC columns are larger than those of the CRC columns. Furthermore, the average ratio of the second-order moments of the three FITRC45 columns to the CRC45 columns is 1.14, and that of the three FITRC35 columns to the CRC35 columns is 1.15. Therefore, if the second-order effect is to be considered in the structural design, the moment augmentation factor η of the FITRC columns should be 1.15 for safety reasons.

5. Conclusions

This study investigated the structural behaviour of FITRC columns under large eccentric loading. Six FITRC columns and two CRC column specimens were examined to investigate the effect of different raw materials, section dimensions, and eccentricities, on the mechanical behaviour of RC columns under large eccentric compression. The following conclusions were drawn from this study:
  • Under large eccentric short-term loads, the failure modes of the FITRC and CRC columns were found to be similar, and the failures were manifested by the yielding of the tensile and compressive rebars and concrete crushing in the compression zone. The long-term behaviour of FITRC (creep and shrinkage) requires further investigation.
  • As the prismatic compressive and tensile strengths of the FITRC columns were slightly lower than those of the CRC columns, the ultimate load capacity of the FITRC columns was slightly lower than that of the CRC columns, and the crack widths of the FITRC columns were greater than those of the CRC columns.
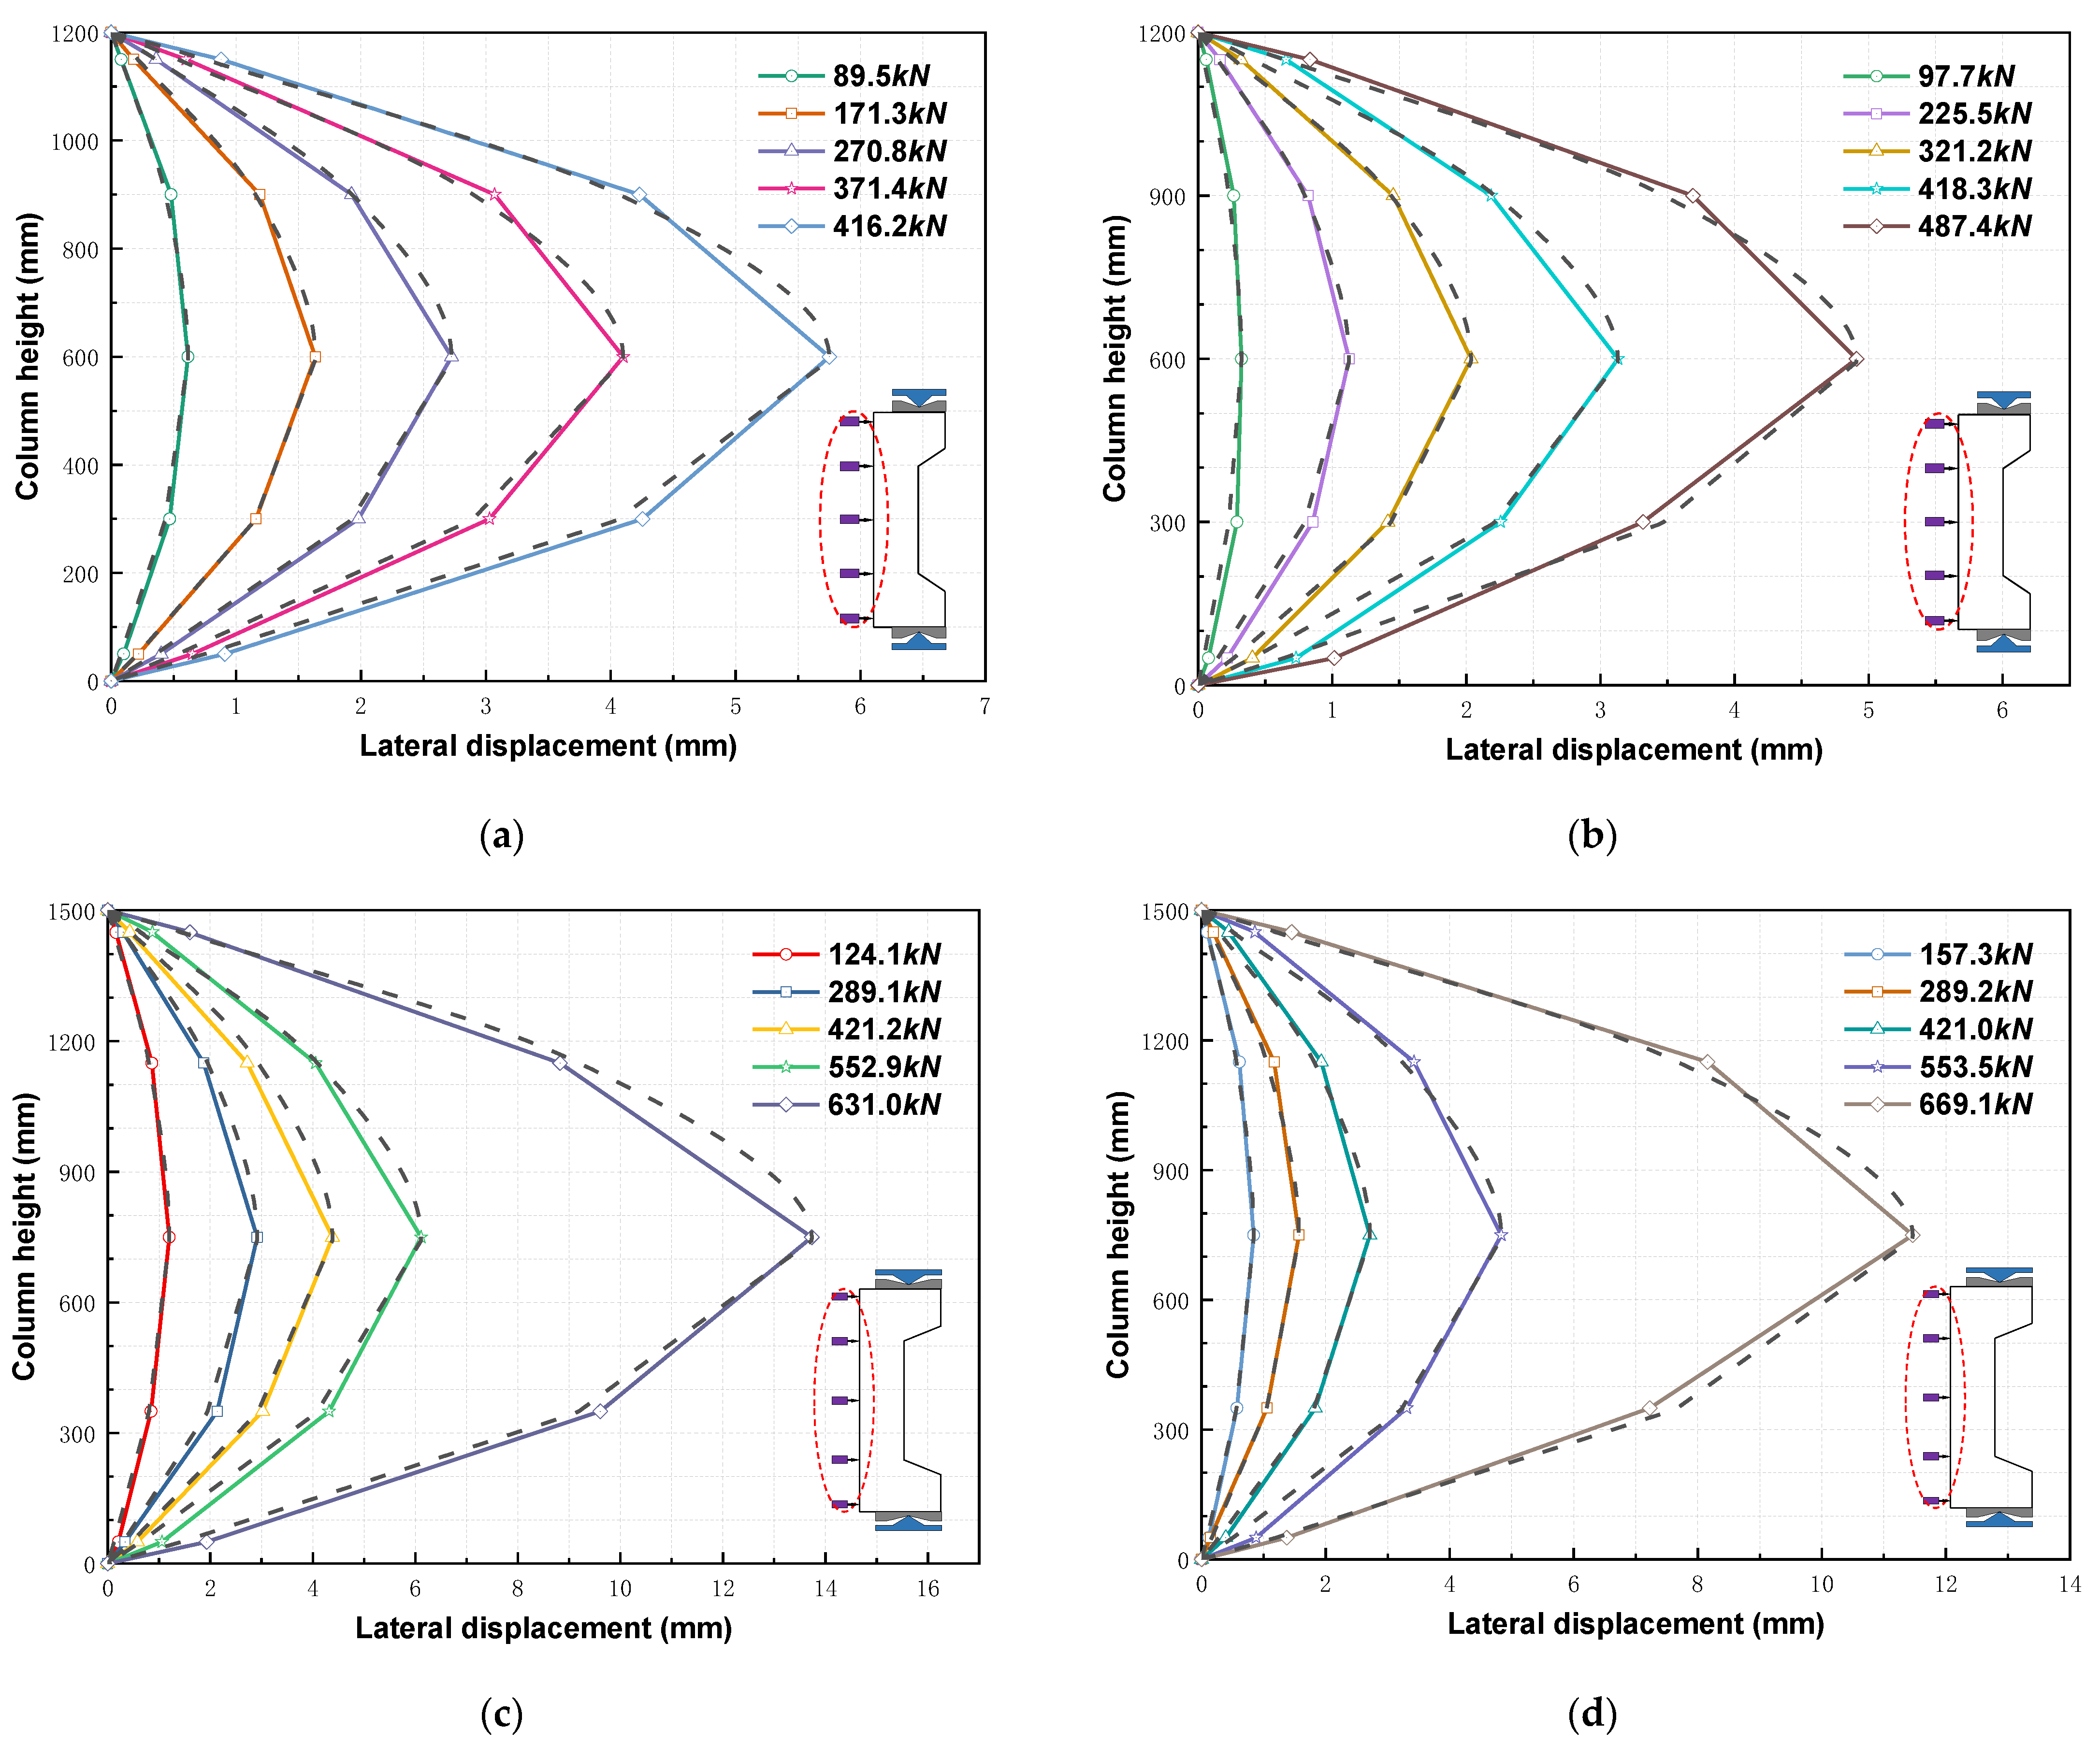
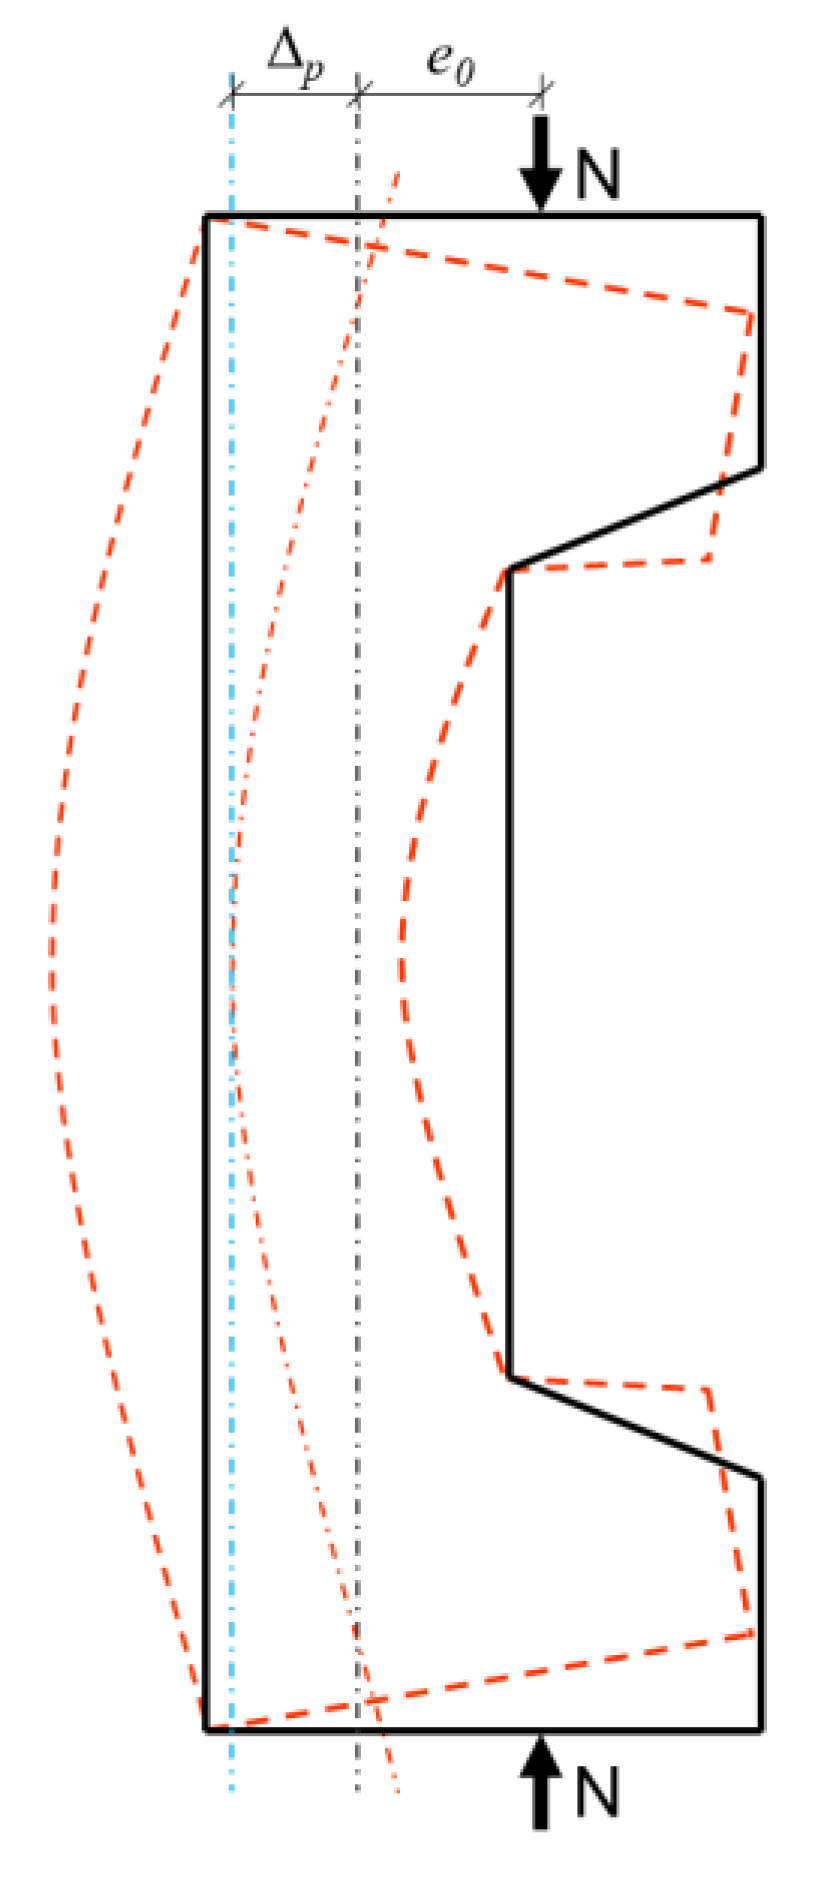
  • The sectional strain of the FITRC columns, which was similar to that of the CRC columns, satisfied the planar section assumption, and the lateral deflection curve agreed well with the half-sinusoidal assumption, which is consistent with the CRC column assumption in the current specifications.
  • Compared with the CRC45 and CRC35 columns, the ductility factors of the FITRC45 and FITRC35 columns were 36.6% and 19.5% lower, respectively. The underlying cause of this phenomenon was the comparatively low modulus of elasticity of FITC, which resulted in a more pronounced lateral deformation of the FITRC columns when subjected to eccentric loading than the CRC columns under equivalent conditions.
  • Based on the current Chinese standards, the theoretical calculations for the cracking load and ultimate load capacity of FITRC columns are relatively accurate. The calculation results indicate that FITRC columns have a certain safety reserve, and that FITC has the potential for practical application in the construction sector.
  • Because the lateral deflection of the FITC columns was greater than that of the CRC columns, the second-order moments of the FITC columns were greater than those of the CRC columns. If the second-order effect is considered in the structural design, the moment augmentation factor of the FITRC columns should be 1.15 for safety reasons. Therefore, FITRC columns with high L/h ratios should be investigated further.
The ductility factor of FITRC columns is much lower than that of CRC columns, so the ductility of FITRC columns can theoretically be improved by stirrup reinforcement. However, this hypothesis requires further investigation.

Author Contributions

X.M.: Conceptualisation, methodology, validation, investigation, data curation, and writing of the original draft. J.S.: Conceptualisation, methodology, writing—review and editing, and supervision. F.Z.: Validation, data curation, resources, and supervision. J.Y.: Investigation and resources. M.Y.: Investigation and resources. Z.M.: Validation and visualisation. Y.B.: Investigation and resources. Y.L.: Investigation and resources. All authors have read and agreed to the published version of the manuscript.

Funding

This work was supported by the Hebei Province Key Research and Development Project, China [grant number 19211502D], and the Hebei Province Graduate Innovation Funding Project, China [grant number CXZZBS2018109].

Institutional Review Board Statement

Not applicable.

Informed Consent Statement

Not applicable.

Data Availability Statement

Not applicable.

Conflicts of Interest

The authors declare no conflict of interest.

References

  1. Maruthupandian, S.; Chaliasou, A.; Kanellopoulos, A. Recycling mine tailings as precursors for cementitious binders—Methods, challenges and future outlook. Constr. Build. Mater. 2021, 312, 125333. [Google Scholar] [CrossRef]
  2. Zuccheratte, A.C.V.; Freire, C.B.; Lameiras, F.S. Synthetic gravel for concrete obtained from sandy iron ore tailing and recycled polyethyltherephtalate. Constr. Build. Mater. 2017, 151, 859–865. [Google Scholar] [CrossRef]
  3. Arbili, M.M.; Alqurashi, M.; Majdi, A.; Ahmad, J.; Deifalla, A.F. Concrete made with iron ore tailings as a fine aggregate: A step towards sustainable concrete. Materials 2022, 15, 6236. [Google Scholar] [CrossRef] [PubMed]
  4. Lv, X.; Lin, Y.; Chen, X.; Shi, Y.; Liang, R.; Wang, R.; Peng, Z. Environmental impact, durability performance, and interfacial transition zone of iron ore tailings utilized as dam concrete aggregates. J. Clean. Prod. 2021, 292, 126068. [Google Scholar] [CrossRef]
  5. Lv, X.; Shen, W.; Wang, L.; Dong, Y.; Zhang, J.; Xie, Z. A comparative study on the practical utilization of iron tailings as a complete replacement of normal aggregates in dam concrete with different gradation. J. Clean. Prod. 2019, 211, 704–715. [Google Scholar] [CrossRef]
  6. Zhao, J.; Ni, K.; Su, Y.; Shi, Y. An evaluation of iron ore tailings characteristics and iron ore tailings concrete properties. Constr. Build. Mater. 2021, 286, 122968. [Google Scholar] [CrossRef]
  7. National Bureau of Statistics; Ministry of Environmental Protection. China Statistical Yearbook on Environment; China Statistics Press: Beijing, China, 2020. [Google Scholar]
  8. Shettima, A.U.; Hussin, M.W.; Ahmad, Y.; Mirza, J. Evaluation of iron ore tailings as replacement for fine aggregate in concrete. Constr. Build. Mater. 2016, 120, 72–79. [Google Scholar] [CrossRef]
  9. IFENG. Dam Break Accident in Xiangfen, Shanxi: Who is Responsible for the Disaster? 2008. Available online: https://news.ifeng.com/mainland/200809/0912_17_780544.shtml (accessed on 1 December 2022).
  10. CHINANEWS. Shanxi Jiaokou Official Response ‘A Tailings Dam Accident’. 2022. Available online: http://www.chinanews.com.cn/sh/2022/04-01/9717734.shtml (accessed on 1 December 2022).
  11. Ahmari, S.; Zhang, L. Production of eco-friendly bricks from copper mine tailings through geopolymerization. Constr. Build. Mater. 2012, 29, 323–331. [Google Scholar] [CrossRef]
  12. Kinnunen, P.; Ismailov, A.; Solismaa, S.; Sreenivasan, H.; Räisänen, M.L.; Levänen, E.; Illikainen, M. Recycling mine tailings in chemically bonded ceramics—A review. J. Clean. Prod. 2018, 174, 634–649. [Google Scholar] [CrossRef] [Green Version]
  13. Zhang, N.; Tang, B.; Liu, X. Cementitious activity of iron ore tailing and its utilization in cementitious materials, bricks and concrete. Constr. Build. Mater. 2021, 288, 123022. [Google Scholar] [CrossRef]
  14. Zareei, S.A.; Ameri, F.; Bahrami, N.; Shoaei, P.; Moosaei, H.R.; Salemi, N. Performance of sustainable high strength concrete with basic oxygen steel-making (BOS) slag and nano-silica. J. Build. Eng. 2019, 25, 100791. [Google Scholar] [CrossRef]
  15. Kusuma, G.H.; Budidarmawan, J.; Susilowati, A. Impact of concrete quality on sustainability. Procedia Eng. 2015, 125, 754–759. [Google Scholar] [CrossRef] [Green Version]
  16. National Bureau of Statistics of China. National Data: Output of Industrial Products in 2021. 2021. Available online: https://data.stats.gov.cn/english/easyquery.htm?cn=C01 (accessed on 1 December 2022).
  17. Thomas, B.S.; Damare, A.; Gupta, R.C. Strength and durability characteristics of copper tailing concrete. Constr. Build. Mater. 2013, 48, 894–900. [Google Scholar] [CrossRef]
  18. Sant’Ana Filho, J.N.; Da Silva, S.N.; Silva, G.C.; Mendes, J.C.; Fiorotti Peixoto, R.A. Technical and environmental feasibility of interlocking concrete pavers with iron ore tailings from tailings dams. J. Mater. Civil. Eng. 2017, 29, 04017104. [Google Scholar] [CrossRef]
  19. Liu, J.; Zhou, Y.; Wu, A.; Wang, H. Reconstruction of broken Si-O-Si bonds in iron ore tailings (IOTs) in concrete. Int. J. Min. Met. Mater. 2019, 26, 1329–1336. [Google Scholar] [CrossRef]
  20. Tang, C.; Li, K.; Ni, W.; Fan, D. Recovering Iron from iron ore tailings and preparing concrete composite admixtures. Minerals 2019, 9, 232. [Google Scholar] [CrossRef] [Green Version]
  21. Carvalho Eugênio, T.M.; Francisco Fagundes, J.; Santos Viana, Q.; Pereira Vilela, A.; Farinassi Mendes, R. Study on the feasibility of using iron ore tailing (IoT) on technological properties of concrete roof tiles. Constr. Build. Mater. 2021, 279, 122484. [Google Scholar] [CrossRef]
  22. Xu, F.; Wang, S.; Li, T.; Liu, B.; Li, B.; Zhou, Y. Mechanical properties and pore structure of recycled aggregate concrete made with iron ore tailings and polypropylene fibers. J. Build. Eng. 2021, 33, 101572. [Google Scholar] [CrossRef]
  23. Ullah, S.; Yang, C.; Cao, L.; Wang, P.; Chai, Q.; Li, Y.; Wang, L.; Dong, Z.; Lushinga, N.; Zhang, B. Material design and performance improvement of conductive asphalt concrete incorporating carbon fiber and iron tailings. Constr. Build. Mater. 2021, 303, 124446. [Google Scholar] [CrossRef]
  24. Lv, Z.; Jiang, A.; Liang, B. Development of eco-efficiency concrete containing diatomite and iron ore tailings: Mechanical properties and strength prediction using deep learning. Constr. Build. Mater. 2022, 327, 126930. [Google Scholar] [CrossRef]
  25. Medjigbodo, S.; Bendimerad, A.Z.; Rozière, E.; Loukili, A. How do recycled concrete aggregates modify the shrinkage and self-healing properties? Cem. Concr. Compos. 2018, 86, 72–86. [Google Scholar] [CrossRef]
  26. Carrasco, E.V.M.; Magalhaes, M.D.C.; Santos, W.J.D.; Alves, R.C.; Mantilla, J.N.R. Characterization of mortars with iron ore tailings using destructive and nondestructive tests. Constr. Build. Mater. 2017, 131, 31–38. [Google Scholar] [CrossRef]
  27. Yao, G.; Wang, Q.; Wang, Z.; Wang, J.; Lyu, X. Activation of hydration properties of iron ore tailings and their application as supplementary cementitious materials in cement. Powder Technol. 2020, 360, 863–871. [Google Scholar] [CrossRef]
  28. Tan, Y.; Zhu, Y.; Xiao, H. Evaluation of the hydraulic, physical, and mechanical properties of pervious concrete using iron tailings as coarse aggregates. Appl. Sci. 2020, 10, 2691. [Google Scholar] [CrossRef] [Green Version]
  29. Feng, W.; Dong, Z.; Jin, Y.; Cui, H. Comparison on micromechanical properties of interfacial transition zone in concrete with iron ore tailings or crushed gravel as aggregate. J. Clean. Prod. 2021, 319, 128737. [Google Scholar] [CrossRef]
  30. Zhao, S.; Fan, J.; Sun, W. Utilization of iron ore tailings as fine aggregate in ultra-high performance concrete. Constr. Build. Mater. 2014, 50, 540–548. [Google Scholar] [CrossRef]
  31. Zhang, W.; Gu, X.; Qiu, J.; Liu, J.; Zhao, Y.; Li, X. Effects of iron ore tailings on the compressive strength and permeability of ultra-high performance concrete. Constr. Build. Mater. 2020, 260. [Google Scholar] [CrossRef]
  32. Zhang, Z.; Zhang, Z.; Yin, S.; Yu, L. Utilization of iron tailings sand as an environmentally friendly alternative to natural river sand in high-strength concrete: Shrinkage characterization and mitigation strategies. Materials 2020, 13, 5614. [Google Scholar] [CrossRef]
  33. Mendes Protasio, F.N.; de Avillez, R.R.; Letichevsky, S.; Silva, F.D.A. The use of iron ore tailings obtained from the Germano dam in the production of a sustainable concrete. J. Clean. Prod. 2021, 278, 123929. [Google Scholar] [CrossRef]
  34. Zhu, Q.; Yuan, Y.; Chen, J.; Fan, L.; Yang, H. Research on the high-temperature resistance of recycled aggregate concrete with iron tailing sand. Constr. Build. Mater. 2022, 327, 126889. [Google Scholar] [CrossRef]
  35. Chen, Z.; Chen, S.; Zhou, Y.; Zhang, C.; Meng, T.; Jiang, S.; Liu, L.; Hu, G. Effect of incorporation of rice husk ash and iron ore tailings on properties of concrete. Constr. Build. Mater. 2022, 338, 127584. [Google Scholar] [CrossRef]
  36. Wang, C.; Ni, W.; Zhang, S.; Wang, S.; Gai, G.; Wang, W. Preparation and properties of autoclaved aerated concrete using coal gangue and iron ore tailings. Constr. Build. Mater. 2016, 104, 109–115. [Google Scholar] [CrossRef]
  37. Ma, B.; Cai, L.; Li, X.; Jian, S. Utilization of iron tailings as substitute in autoclaved aerated concrete: Physico-mechanical and microstructure of hydration products. J. Clean. Prod. 2016, 127, 162–171. [Google Scholar] [CrossRef]
  38. Cai, L.; Ma, B.; Li, X.; Lv, Y.; Liu, Z.; Jian, S. Mechanical and hydration characteristics of autoclaved aerated concrete (AAC) containing iron-tailings: Effect of content and fineness. Constr. Build. Mater. 2016, 128, 361–372. [Google Scholar] [CrossRef]
  39. Cheng, Y.; Huang, F.; Li, W.; Liu, R.; Li, G.; Wei, J. Test research on the effects of mechanochemically activated iron tailings on the compressive strength of concrete. Constr. Build. Mater. 2016, 118, 164–170. [Google Scholar] [CrossRef]
  40. Han, F.; Song, S.; Liu, J.; Huang, S. Properties of steam-cured precast concrete containing iron tailing powder. Powder Technol. 2019, 345, 292–299. [Google Scholar] [CrossRef]
  41. Han, F.; Luo, A.; Liu, J.; Zhang, Z. Properties of high-volume iron tailing powder concrete under different curing conditions. Constr. Build. Mater. 2020, 241, 118108. [Google Scholar] [CrossRef]
  42. Yang, M.; Sun, J.; Dun, C.; Duan, Y.; Meng, Z. Cementitious activity optimization studies of iron tailings powder as a concrete admixture. Constr. Build. Mater. 2020, 265, 120760. [Google Scholar] [CrossRef]
  43. Gu, X.; Zhang, W.; Zhang, X.; Li, X.; Qiu, J. Hydration characteristics investigation of iron tailings blended ultra high performance concrete: The effects of mechanical activation and iron tailings content. J. Build. Eng. 2022, 45, 103459. [Google Scholar] [CrossRef]
  44. Han, F.; Zhang, H.; Liu, J.; Song, S. Influence of iron tailing powder on properties of concrete with fly ash. Powder Technol. 2022, 398, 117132. [Google Scholar] [CrossRef]
  45. Cheng, Y.; Huang, F.; Qi, S.; Li, W.; Liu, R.; Li, G. Durability of concrete incorporated with siliceous iron tailings. Constr. Build. Mater. 2020, 242, 118147. [Google Scholar] [CrossRef]
  46. Cheng, Y.; Yang, S.; Zhang, J.; Sun, X. Test research on hydration process of cement-iron tailings powder composite cementitious materials. Powder Technol. 2022, 399, 117215. [Google Scholar] [CrossRef]
  47. Zhang, R. Experimental Studies of Influence for Iron Tailings on Carbonation and Frost Resistance of Concrete. Master’s Thesis, Hebei Agricultural University, Baoding, China, 2022. [Google Scholar]
  48. Yang, M.; Sun, J.; Xu, Y.; Wang, J. Analysis of influence from iron tailings powder on sulfate corrosion resistance of concrete and its mechanism. Water Resour. Hydropower Eng. 2022, 53, 177–185. [Google Scholar]
  49. Chen, X. Experimental Study on the Mechanical Properties of the Iron Tailing Sand Green Concrete Members. Ph.D. Thesis, Wuhan University of Technology, Wuhan, China, 2017. [Google Scholar]
  50. Zhang, K. Experimental Research on Axial Compression of Ferrous Mill Tailing Concrete Short Columns. Master’s Thesis, North China University of Science and Technology, Tangshan, China, 2016. [Google Scholar]
  51. Li, H. Experimental Study on Seismic Bearing Capacity of Iron Tailorite Concrete Column. Master’s Thesis, North China University of Science and Technology, Tangshan, China, 2018. [Google Scholar]
  52. Ma, X.; Sun, J.; Zhang, F.; Yuan, J.; Meng, Z. Experimental studies and analyses on axial compressive properties of full iron tailings concrete columns. Case Stud. Constr. Mat. 2023, 18, e1881. [Google Scholar] [CrossRef]
  53. JGJ55-2011; Specification for Mix Proportion Design of Ordinary Concrete. Architecture and Building Press: Beijing, China, 2011.
  54. GB/T 50081-2019; Standard for Test Methods of Concrete Physical and Mechanical Properties. China Architecture and Building Press: Beijing, China, 2019.
  55. Yan, P. Experimental study on mechanical behaviour of high performance iron tailing concrete columns. Master’s Thesis, Hebei University of Architecture, Zhangjiakou, China, 2017. [Google Scholar] [CrossRef]
  56. Lloyd, N.A.; Rangan, B.V. Studies on high-strength concrete columns under eccentric compression. Aci Struct. J. 1996, 93, 631–638. [Google Scholar] [CrossRef]
  57. Tang, J. Seismic Resistance of Joints in Reinforced Concrete Frames; Southeast University Press: Nanjing, China, 1989. [Google Scholar]
  58. Wang, L.; Kai-Leung Su, R. Theoretical and experimental study of plate-strengthened concrete columns under eccentric compression loading. J. Struct. Eng. 2013, 139, 350–359. [Google Scholar] [CrossRef] [Green Version]
  59. ACI 318-14; Building Code Requirements for Structural Concrete and Commentary. American Concrete Institute: Detroit, MI, USA, 2014.
  60. Li, Y. Experimental and Theoretical Research on Mechanical Behavior of RC Columns with 600MPa Reinforcing Bars. Ph.D. Thesis, Southeast University, Nanjing, China, 2019. [Google Scholar] [CrossRef]
  61. GB 50010-2010; Code for Design of Concrete Structures. China Architecture and Building Press: Beijing, China, 2010.
  62. Ge, W.; Chen, K.; Guan, Z.; Ashour, A.; Lu, W.; Cao, D. Eccentric compression behaviour of concrete columns reinforced with steel-FRP composite bars. Eng. Struct. 2021, 238, 112240. [Google Scholar] [CrossRef]
  63. SL191-2008; Design Code for Hydraulic Concrete Structures. China Water and Power Press: Beijing, China, 2008.
Figure 1. Photos of iron tailings stacking dam in Hebei, China: (a) mining and tailings site; (b) tailings site.
Materials 16 02466 g001
Figure 2. Breakdown of tailings production in 2018.
Materials 16 02466 g002
Figure 3. XRD patterns of concrete raw materials.
Materials 16 02466 g003
Figure 4. SEM micrograph at 4000× magnification of particles: (a) cement; (b) iron tailings; (c) fly ash.
Materials 16 02466 g004aMaterials 16 02466 g004b
Figure 5. Particle size distribution curves of two mineral admixtures: (a) particle size distribution; (b) cumulative particle size distribution.
Materials 16 02466 g005
Figure 6. Stress–strain curve of rebars.
Materials 16 02466 g006
Figure 7. Compression test on RC columns under large eccentric loading: (a) geometry and reinforcement details of RC columns (unit: mm); (b) test setup.
Materials 16 02466 g007
Figure 8. Typical failure modes of RC columns: (a) FITRC45-2 column specimen; (b) CRC45 column specimen; (c) FITRC35-2 column specimen; (d) CRC35 column specimen.
Materials 16 02466 g008aMaterials 16 02466 g008b
Figure 9. Load–maximum crack width curves of RC columns: (a) e0/h0 = 0.60; (b) e0/h0 = 0.70.
Materials 16 02466 g009
Figure 10. Load–deflection curves of RC columns: (a) e0/h0 = 0.60; (b) e0/h0 = 0.70.
Materials 16 02466 g010
Figure 11. Lateral deformation along the section depth of typical RC columns: (a) FITRC45-2 column specimen; (b) CRC45 column specimen; (c) FITRC35-2 column specimen; (d) CRC35 column specimen.
Materials 16 02466 g011
Figure 12. Definitions of yield displacement Δy and ultimate displacement Δ0.85.
Materials 16 02466 g012
Figure 13. Load–rebar strain curves of typical RC columns: (a) e0/h0 = 0.60; (b) e0/h0 = 0.70.
Materials 16 02466 g013
Figure 14. Typical concrete strain distribution along the section depth at the mid-span point: (a) FITRC45-2 column specimen; (b) CRC45 column specimen; (c) FITRC35-2 column specimen; (d) CRC35 column specimen.
Materials 16 02466 g014
Figure 15. Schematic diagram of the second-order effect.
Materials 16 02466 g015
Figure 16. Simplified diagram for calculation of the section subjected to compression failure under large eccentric loading: (a) strain diagram of the specimens; (b) equivalent calculation diagram.
Materials 16 02466 g016
Table 1. Main chemical composition of concrete raw materials.
SpecimensSiO2Fe2O3MgOAl2O3CaOCaCO3
Iron tailings68.2%12.5%6.8%5.1%4.8%0.0%
Fly ash52.2%5.6%1.3%26.5%4.2%0.0%
River sand44.0%3.3%16.0%6.4%27.5%0.0%
Conventional gravel15.0%0.3%16.2%0.2%0.0%68.1%
Table 2. Primary technical indices of Portland cement.
Apparent DensityFlexural Strength (MPa)Compressive Strength (MPa)
(kg·m−3)3 d28 d3 d28 d
30906.910.831.252.7
Table 3. Primary technical indices of mineral admixtures.
SpecimensD10 (μm)D50 (μm)D90 (μm)SSA (m2·kg−1)AD (m2·kg−1)
Iron tailings powder1.5115.5174.84480.62770
Conventional gravel3.0226.5198.18415.12180
Table 4. Main technical indices of coarse aggregate.
SpecimensCompressive Strength of Rock (MPa)Crushing Index (%)Soundness (%)Alkali–Aggregate Reaction (%)AD (m2·kg−1)BD (kg·m−3)
Iron tailings gravel62.26.053.50.05127301570
Conventional gravel60.06.563.70.04227001550
Table 5. Design of mix proportions.
SpecimensWater Binder RatioWater (kg)Cement (kg)Iron Tailings Powder (kg)Iron Tailings Sand (kg)Iron Tailings Gravel (kg)Fly Ash (kg)River Sand (kg)Conventional Gravel (kg)Water Reducing Agent (kg)Slump (mm)Dispersion (mm)
FITC450.321703691587391017---3.1210520 × 530
CC450.32170369---1587069763.1200470 × 490
FITC350.401703011297751071---2.5215515 × 535
CC350.40170301---12974610312.5205475 × 490
Table 6. Mechanical behaviour of concrete.
SpecimensCubic Compressive Strength
fcu (MPa)
Prismatic Compressive Strength
fc (MPa)
Splitting Tensile Strength
ft (MPa)
Static Modulus of Elasticity
Ec (MPa)
Poisson’s Ratio
ν
FITC4553.538.13.53.22 × 1040.27
CC4555.941.43.73.98 × 1040.24
FITC3544.434.83.23.05 × 1040.25
CC3547.836.33.43.74 × 1040.23
Table 7. Mechanical behaviour of rebars.
Reinforcement
Diameter (mm)
Yield Strength
fy (MPa)
Ultimate Strength
fu (MPa)
Elastic Modulus
Es (MPa)
Percentage Elongation
after Fracture (%)
84606762.06 × 10417.2
144305982.09 × 10419.0
164666892.07 × 10420.3
Table 8. Main performance indices of RC columns.
SpecimensNu (kN)Δp (mm)Δy (mm)Δ0.85 (mm)μλ
FITRC45-1437.76.065.238.041.541.33
FITRC45-2416.25.754.008.582.151.49
FITRC45-3470.16.634.717.751.651.17
CRC45487.44.912.466.892.801.40
FITRC35-1642.514.236.6219.802.991.39
FITRC35-2631.013.736.7217.322.581.26
FITRC35-3624.013.806.6019.172.901.39
CRC35669.111.464.2815.023.511.31
Table 9. Bearing capacity of RC columns.
SpecimensNcr (kN)Nu (kN)Ncr-t (kN)Nu-t (kN) N c r N c r t N u N u t
FITRC45-189.5437.785.3405.21.051.08
FITRC45-289.5416.285.3405.21.051.03
FITRC45-390.3470.185.3405.21.061.16
CRC4590.8487.486.8418.61.051.16
FITRC35-1116.5642.5110.8598.91.051.07
FITRC35-2116.5631.0110.8598.91.051.05
FITRC35-3116.3624.0110.8598.91.051.04
CRC35116.2669.1111.9608.41.041.10
Table 10. Moments of RC columns.
SpecimensNu (kN)Δp (mm)ηM1
(kN·m)
M2
(kN·m)
Mmax
(kN·m)
M 2 M 2 ( C R C )
FITRC45-1437.76.061.04854.72.757.41.11
FITRC45-2416.25.751.04652.02.454.41.00
FITRC45-3470.16.631.05358.83.161.91.30
CRC45487.44.911.03960.92.463.31.00
FITRC35-1642.514.231.079116.39.1125.41.19
FITRC35-2631.013.731.076114.28.7122.91.13
FITRC35-3624.013.801.076112.98.6121.61.12
CRC35669.111.461.063121.17.7128.81.00
Disclaimer/Publisher’s Note: The statements, opinions and data contained in all publications are solely those of the individual author(s) and contributor(s) and not of MDPI and/or the editor(s). MDPI and/or the editor(s) disclaim responsibility for any injury to people or property resulting from any ideas, methods, instructions or products referred to in the content.

