
Effect of Low Nesquehonite Addition on the Hydration Product and Pore Structure of Reactive Magnesia Paste

Abstract
:1. Introduction
2. Materials and Methods
2.1. Materials
2.2. Paste Preparation and Curing
2.3. Testing Methods
2.3.1. Compressive Strength Test
2.3.2. Pore Size Distribution and Total Pore Volume Test
2.3.3. Morphology of the Hydration Product and Pore Structure Observations
2.3.4. Hydration Product Analyses
2.3.5. Weight Loss and Heat Absorption Capacity Test
3. Results
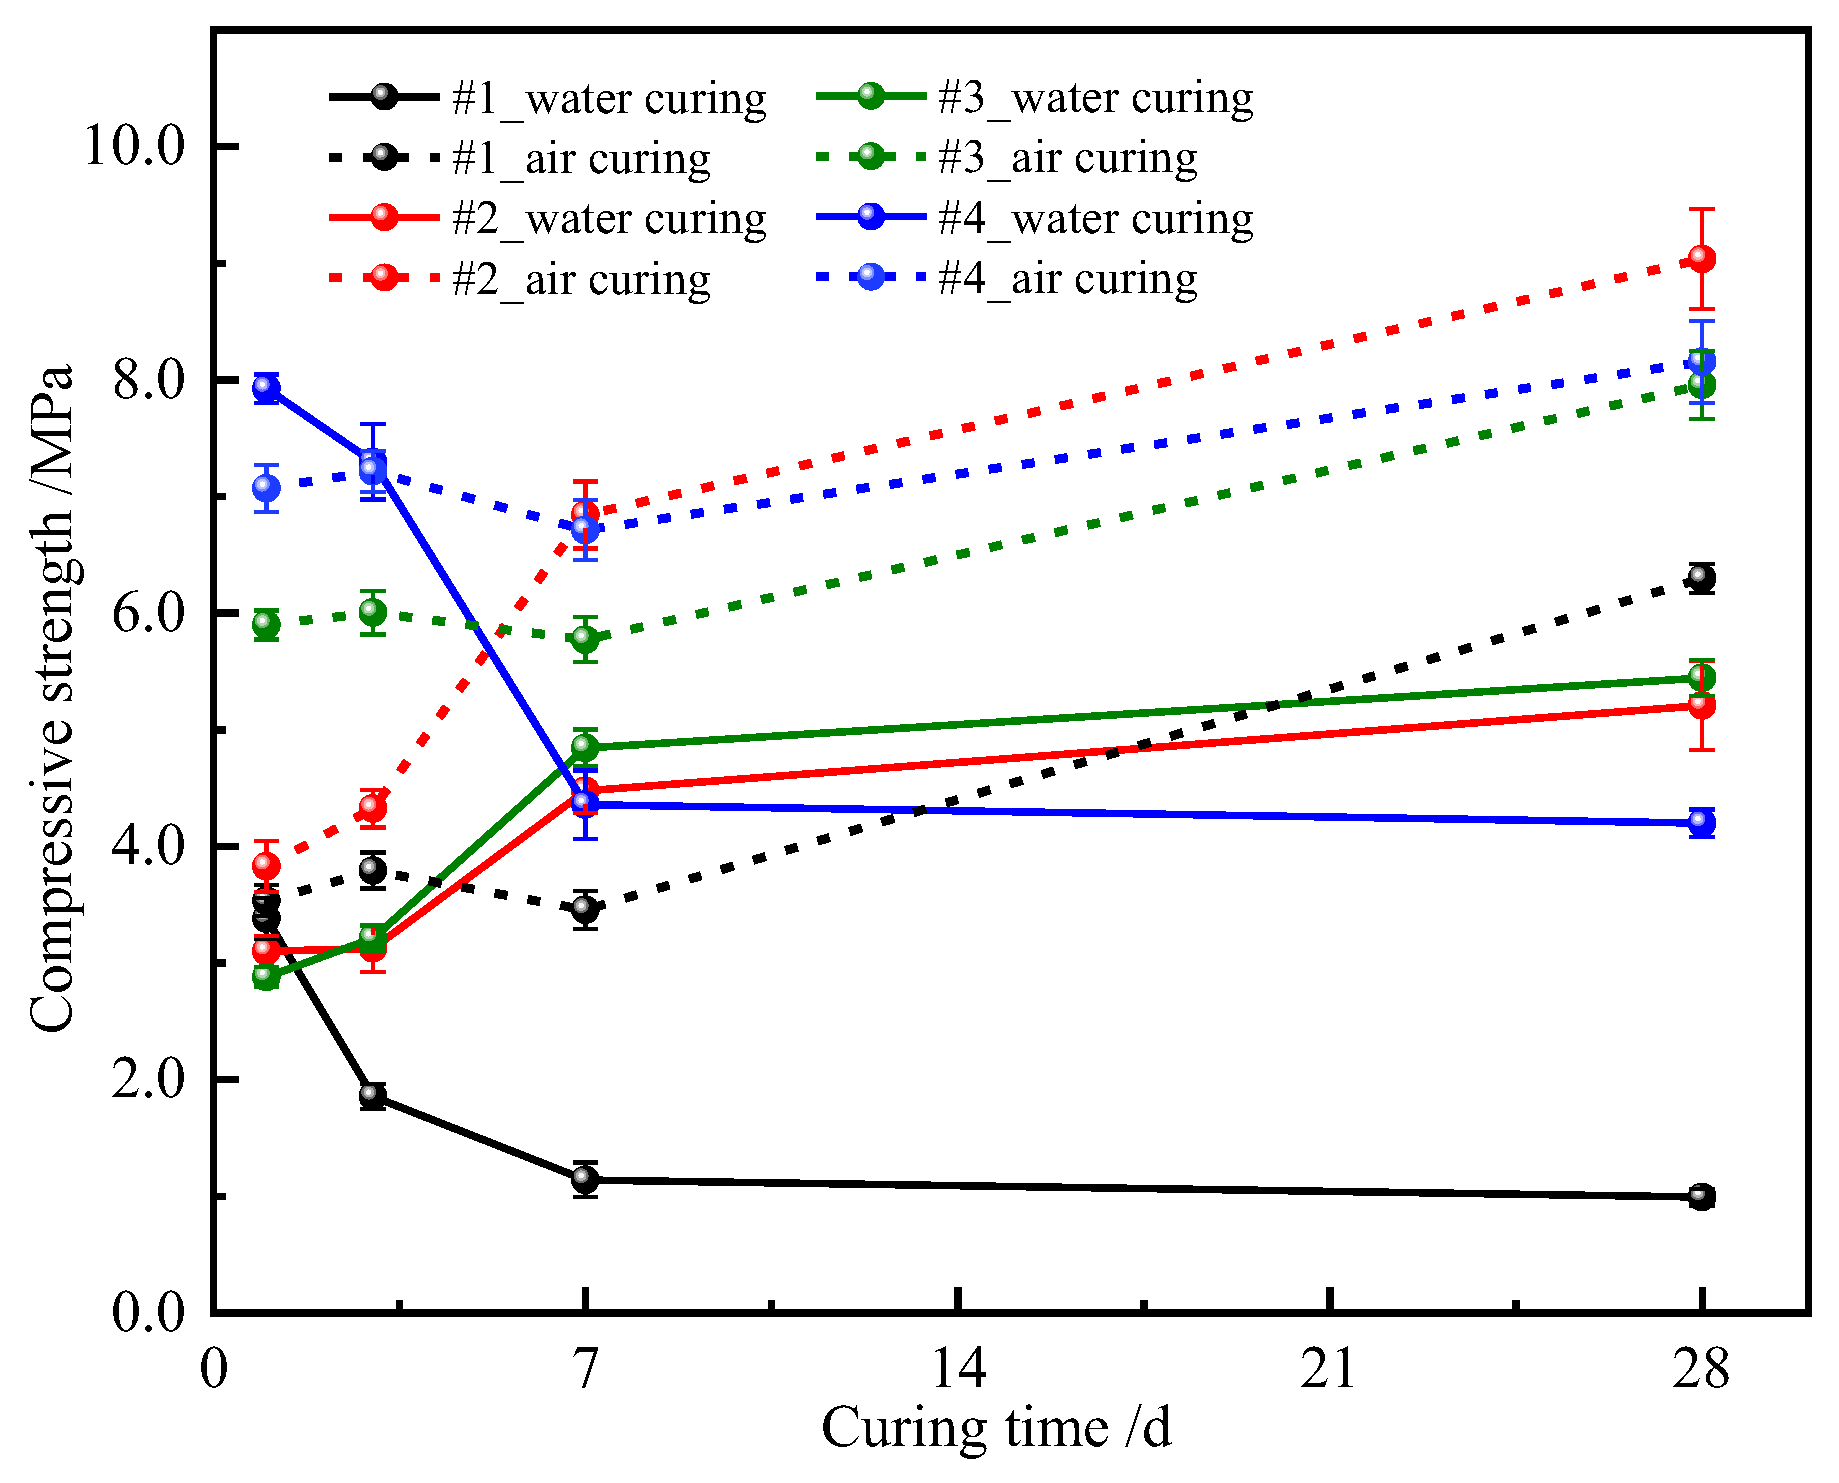
3.1. Compressive Strength
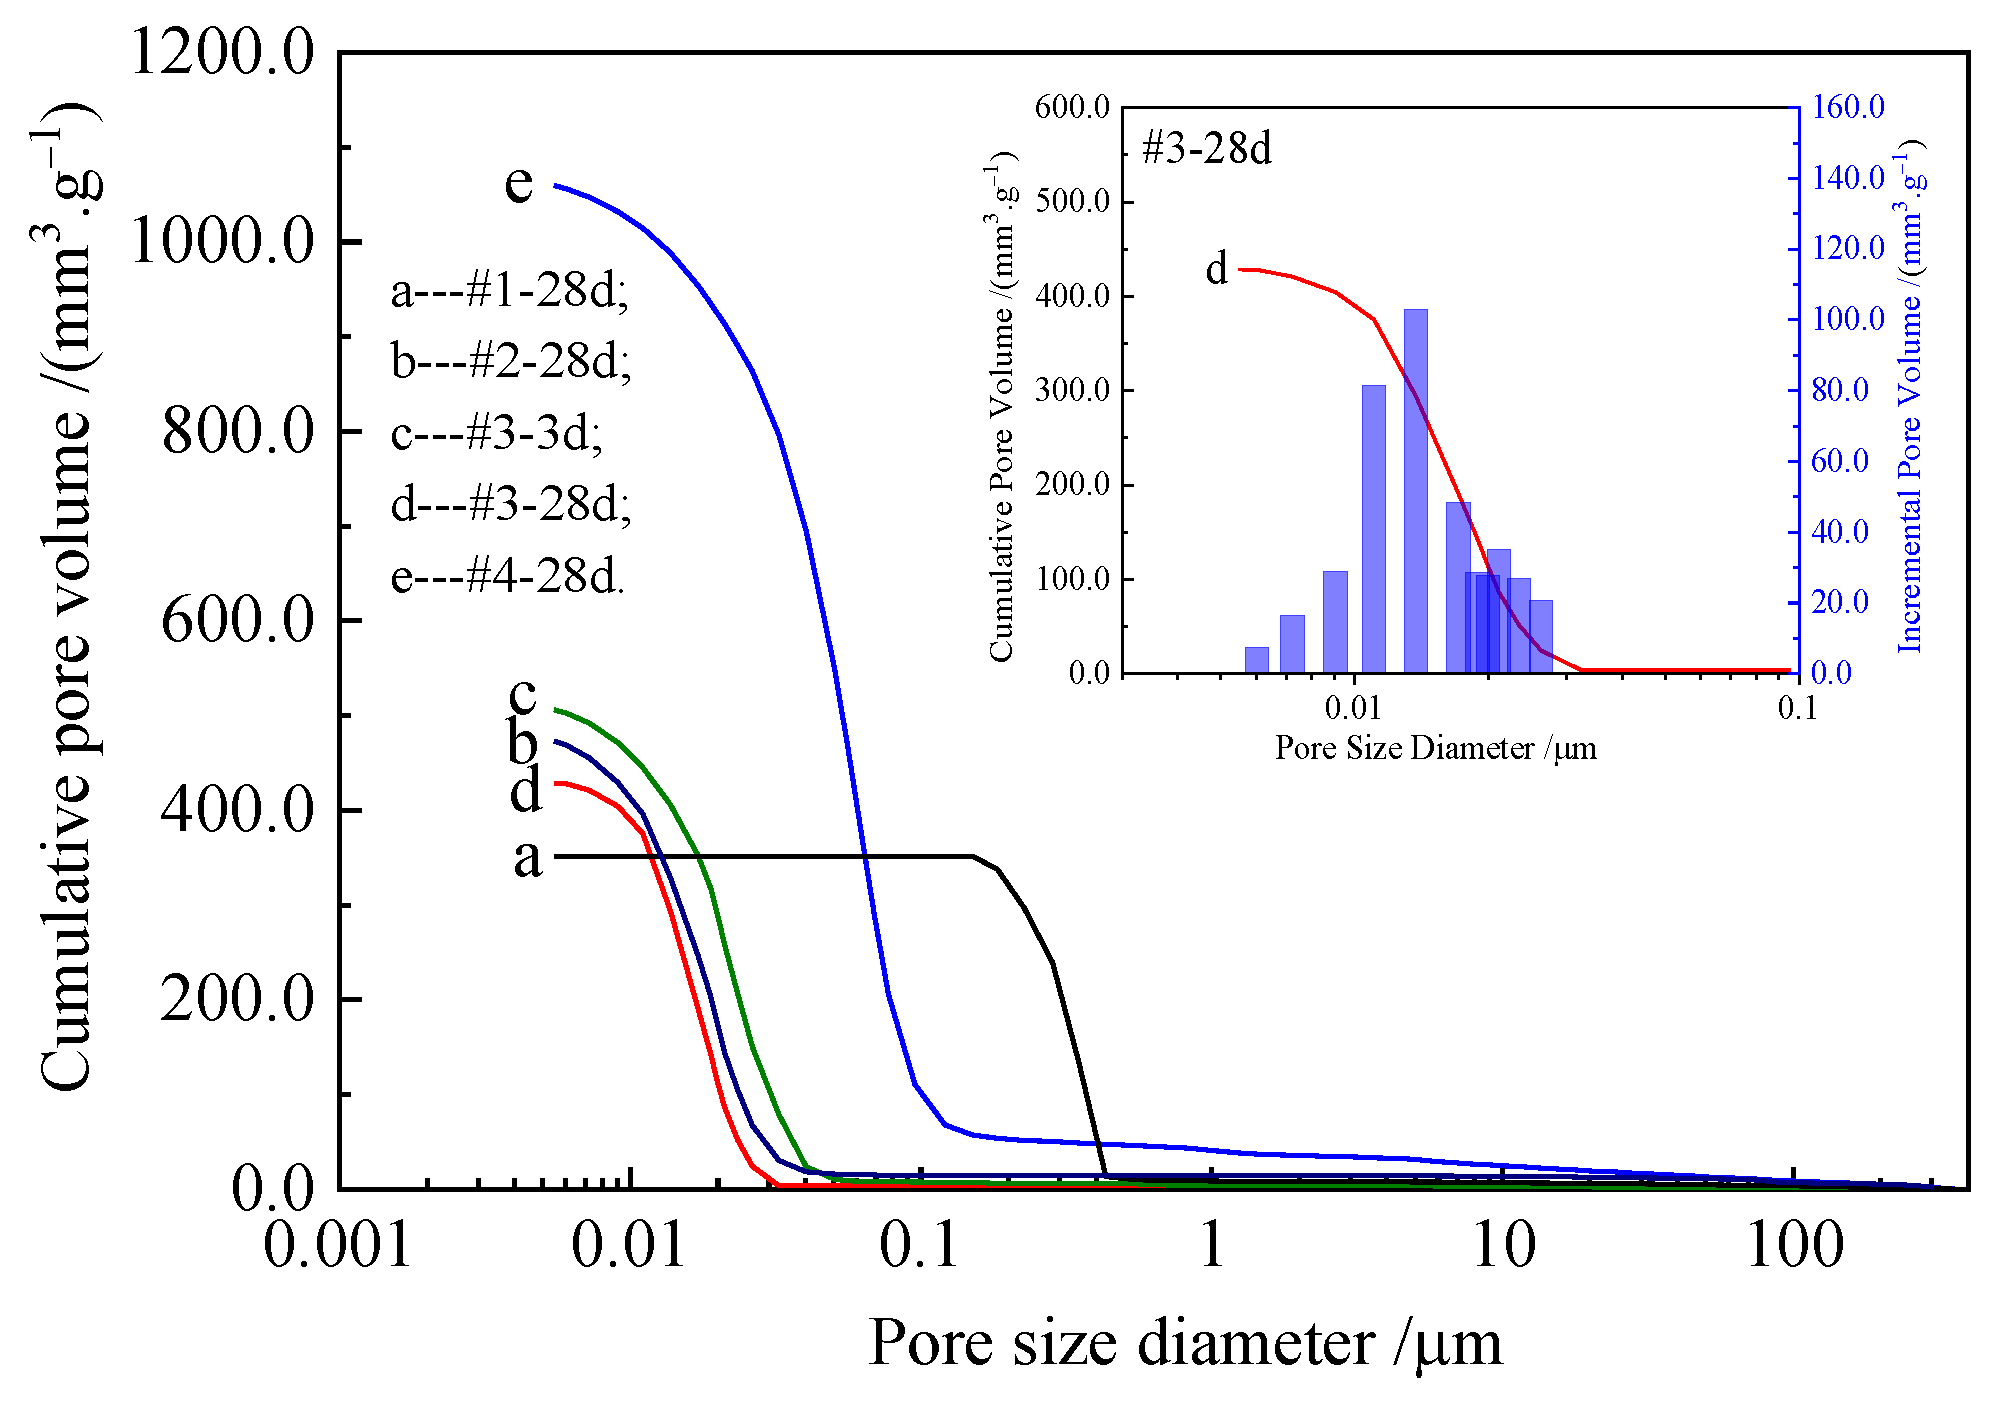
3.2. Pore Structure Characteristics
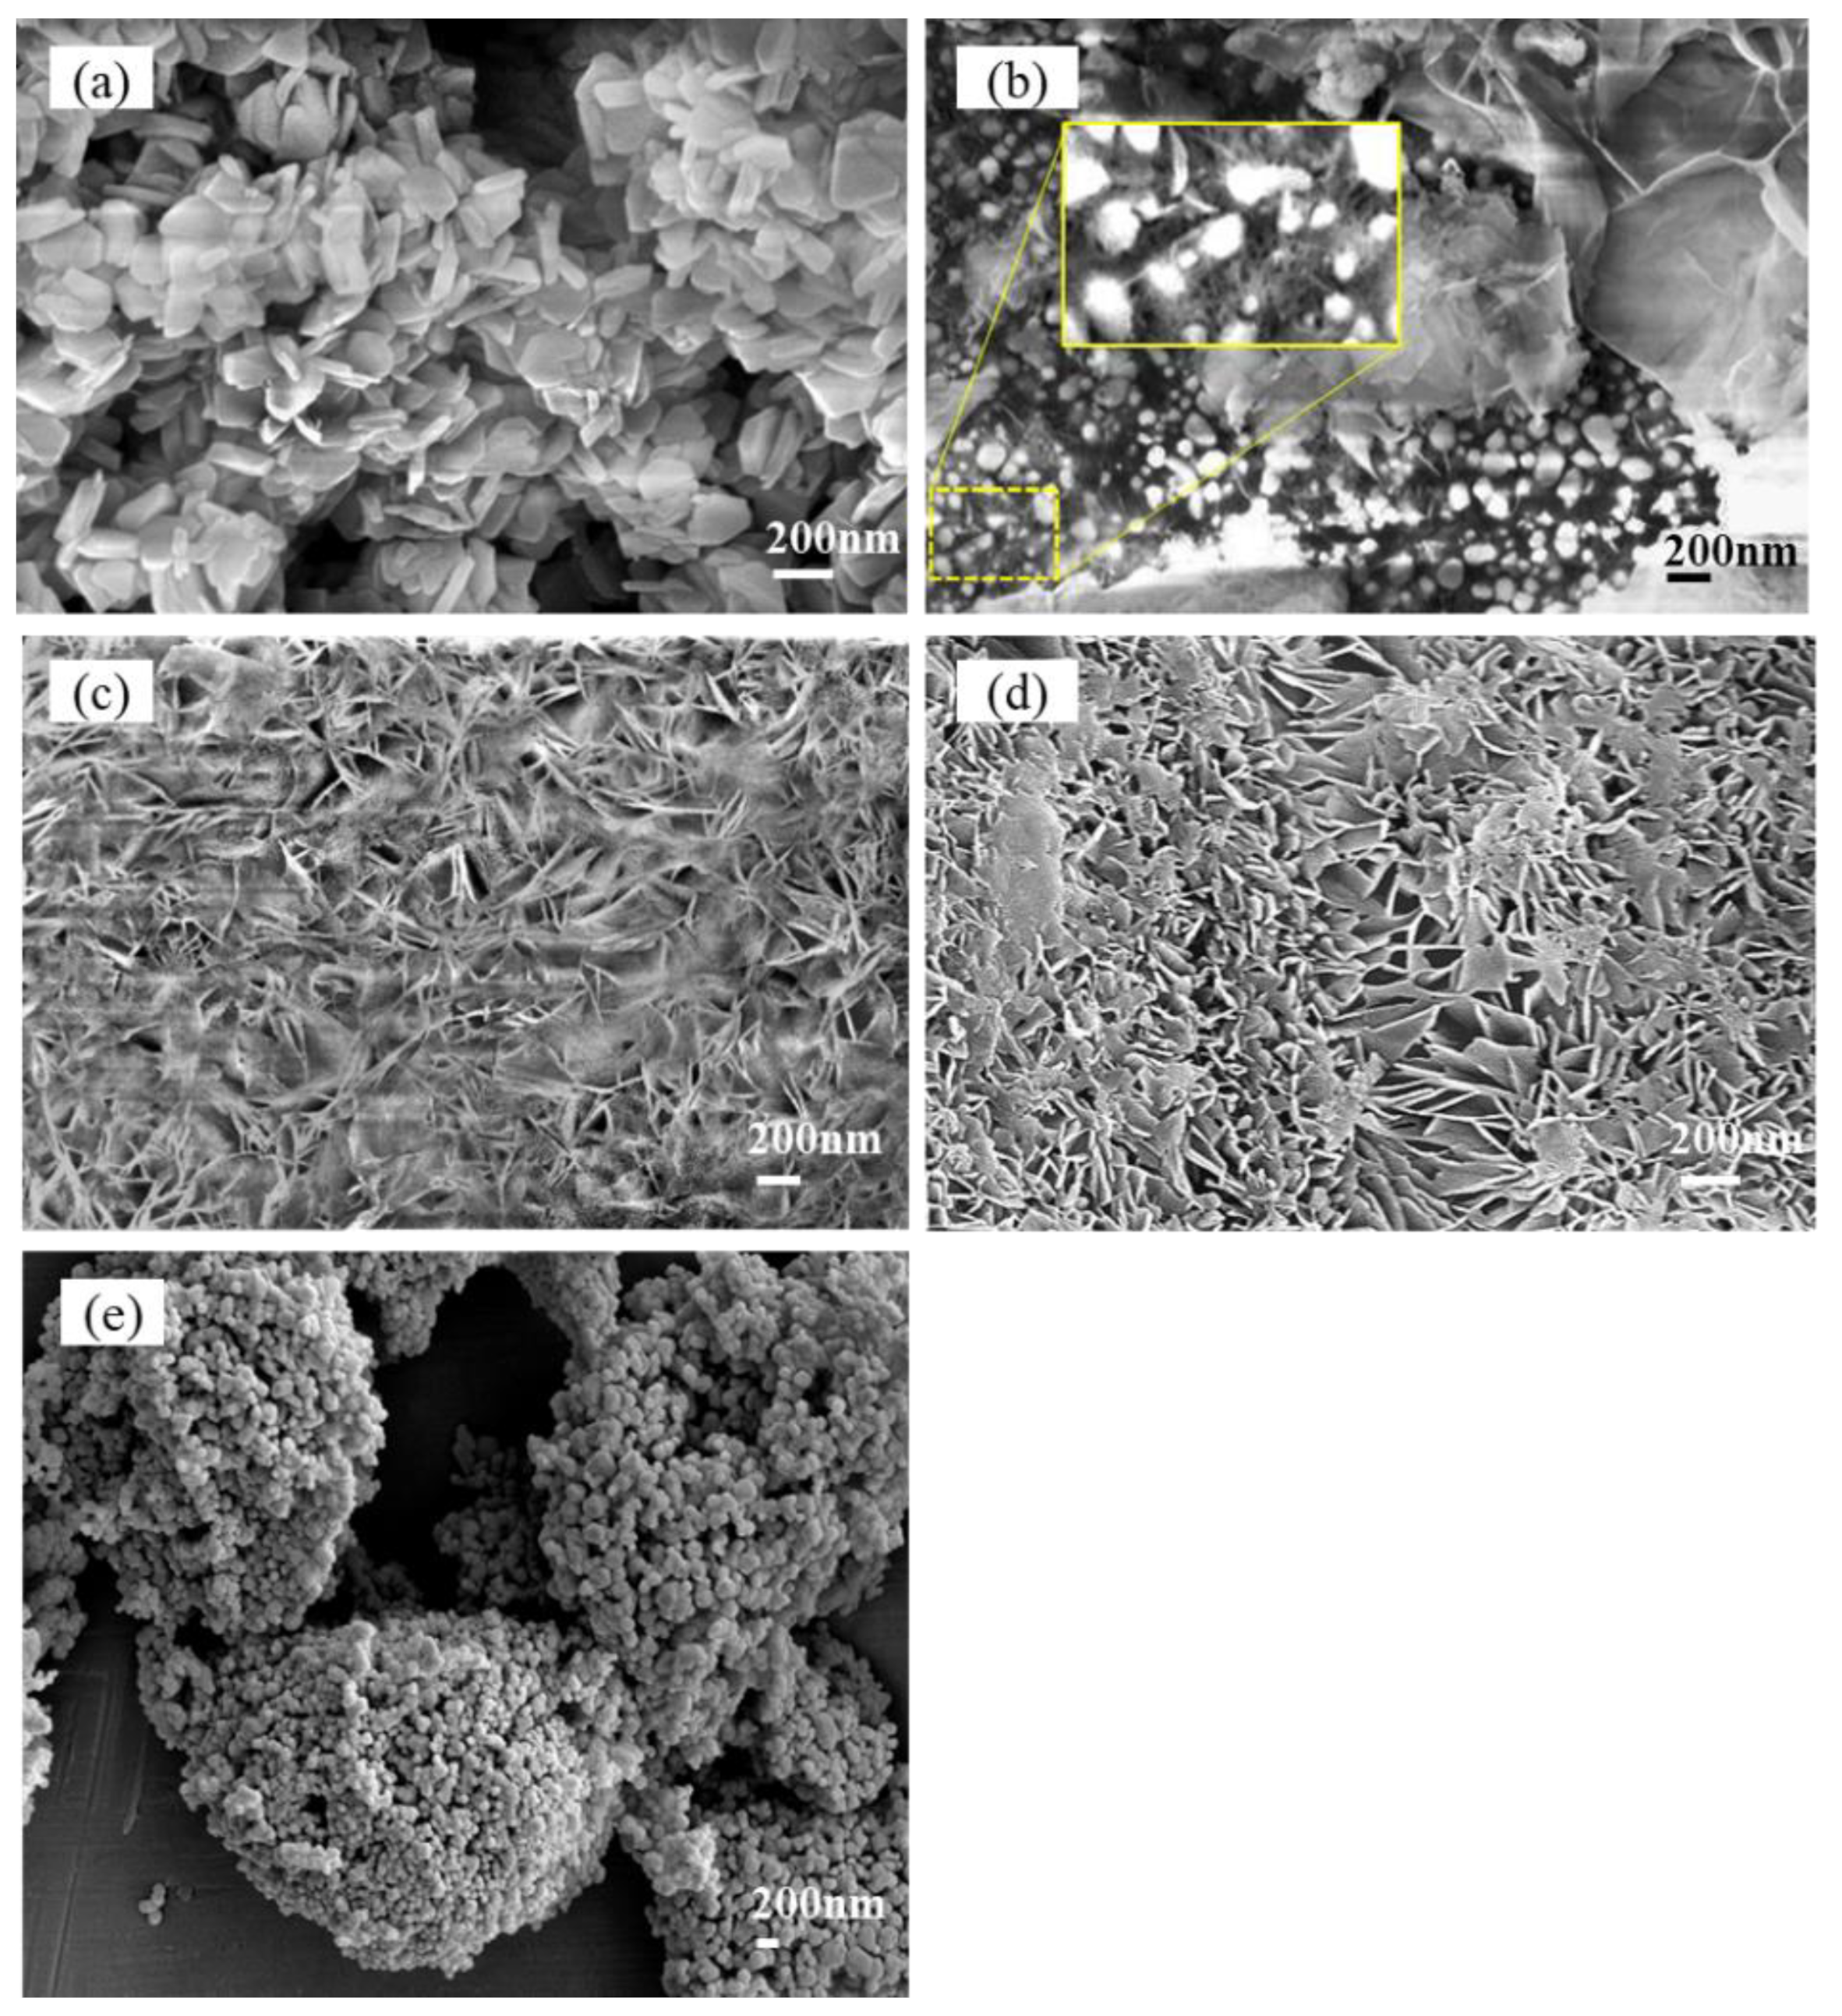
3.3. Morphology of the Hydration Products and Pores
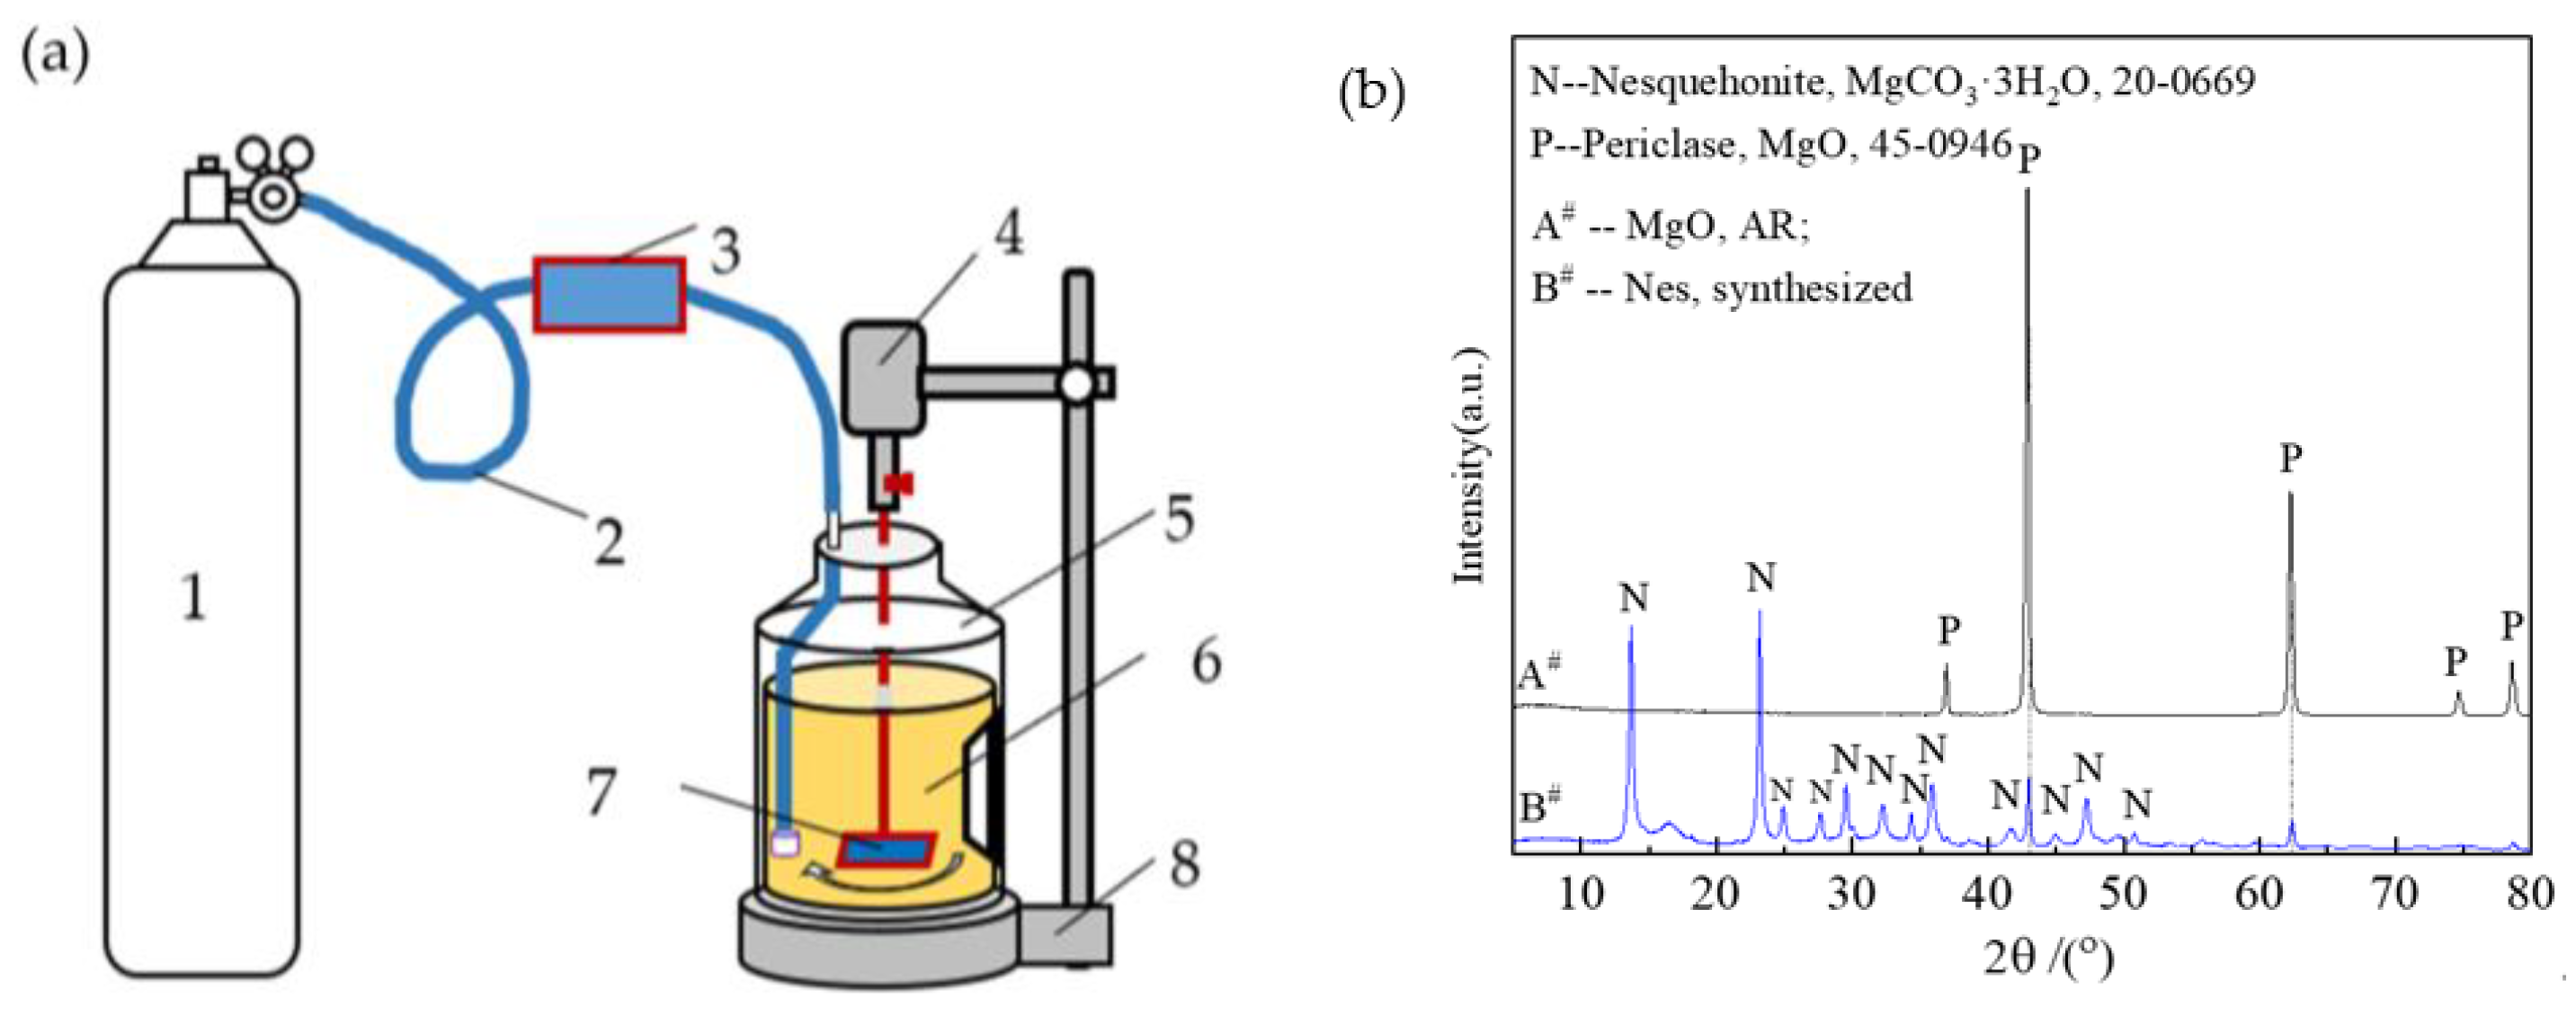
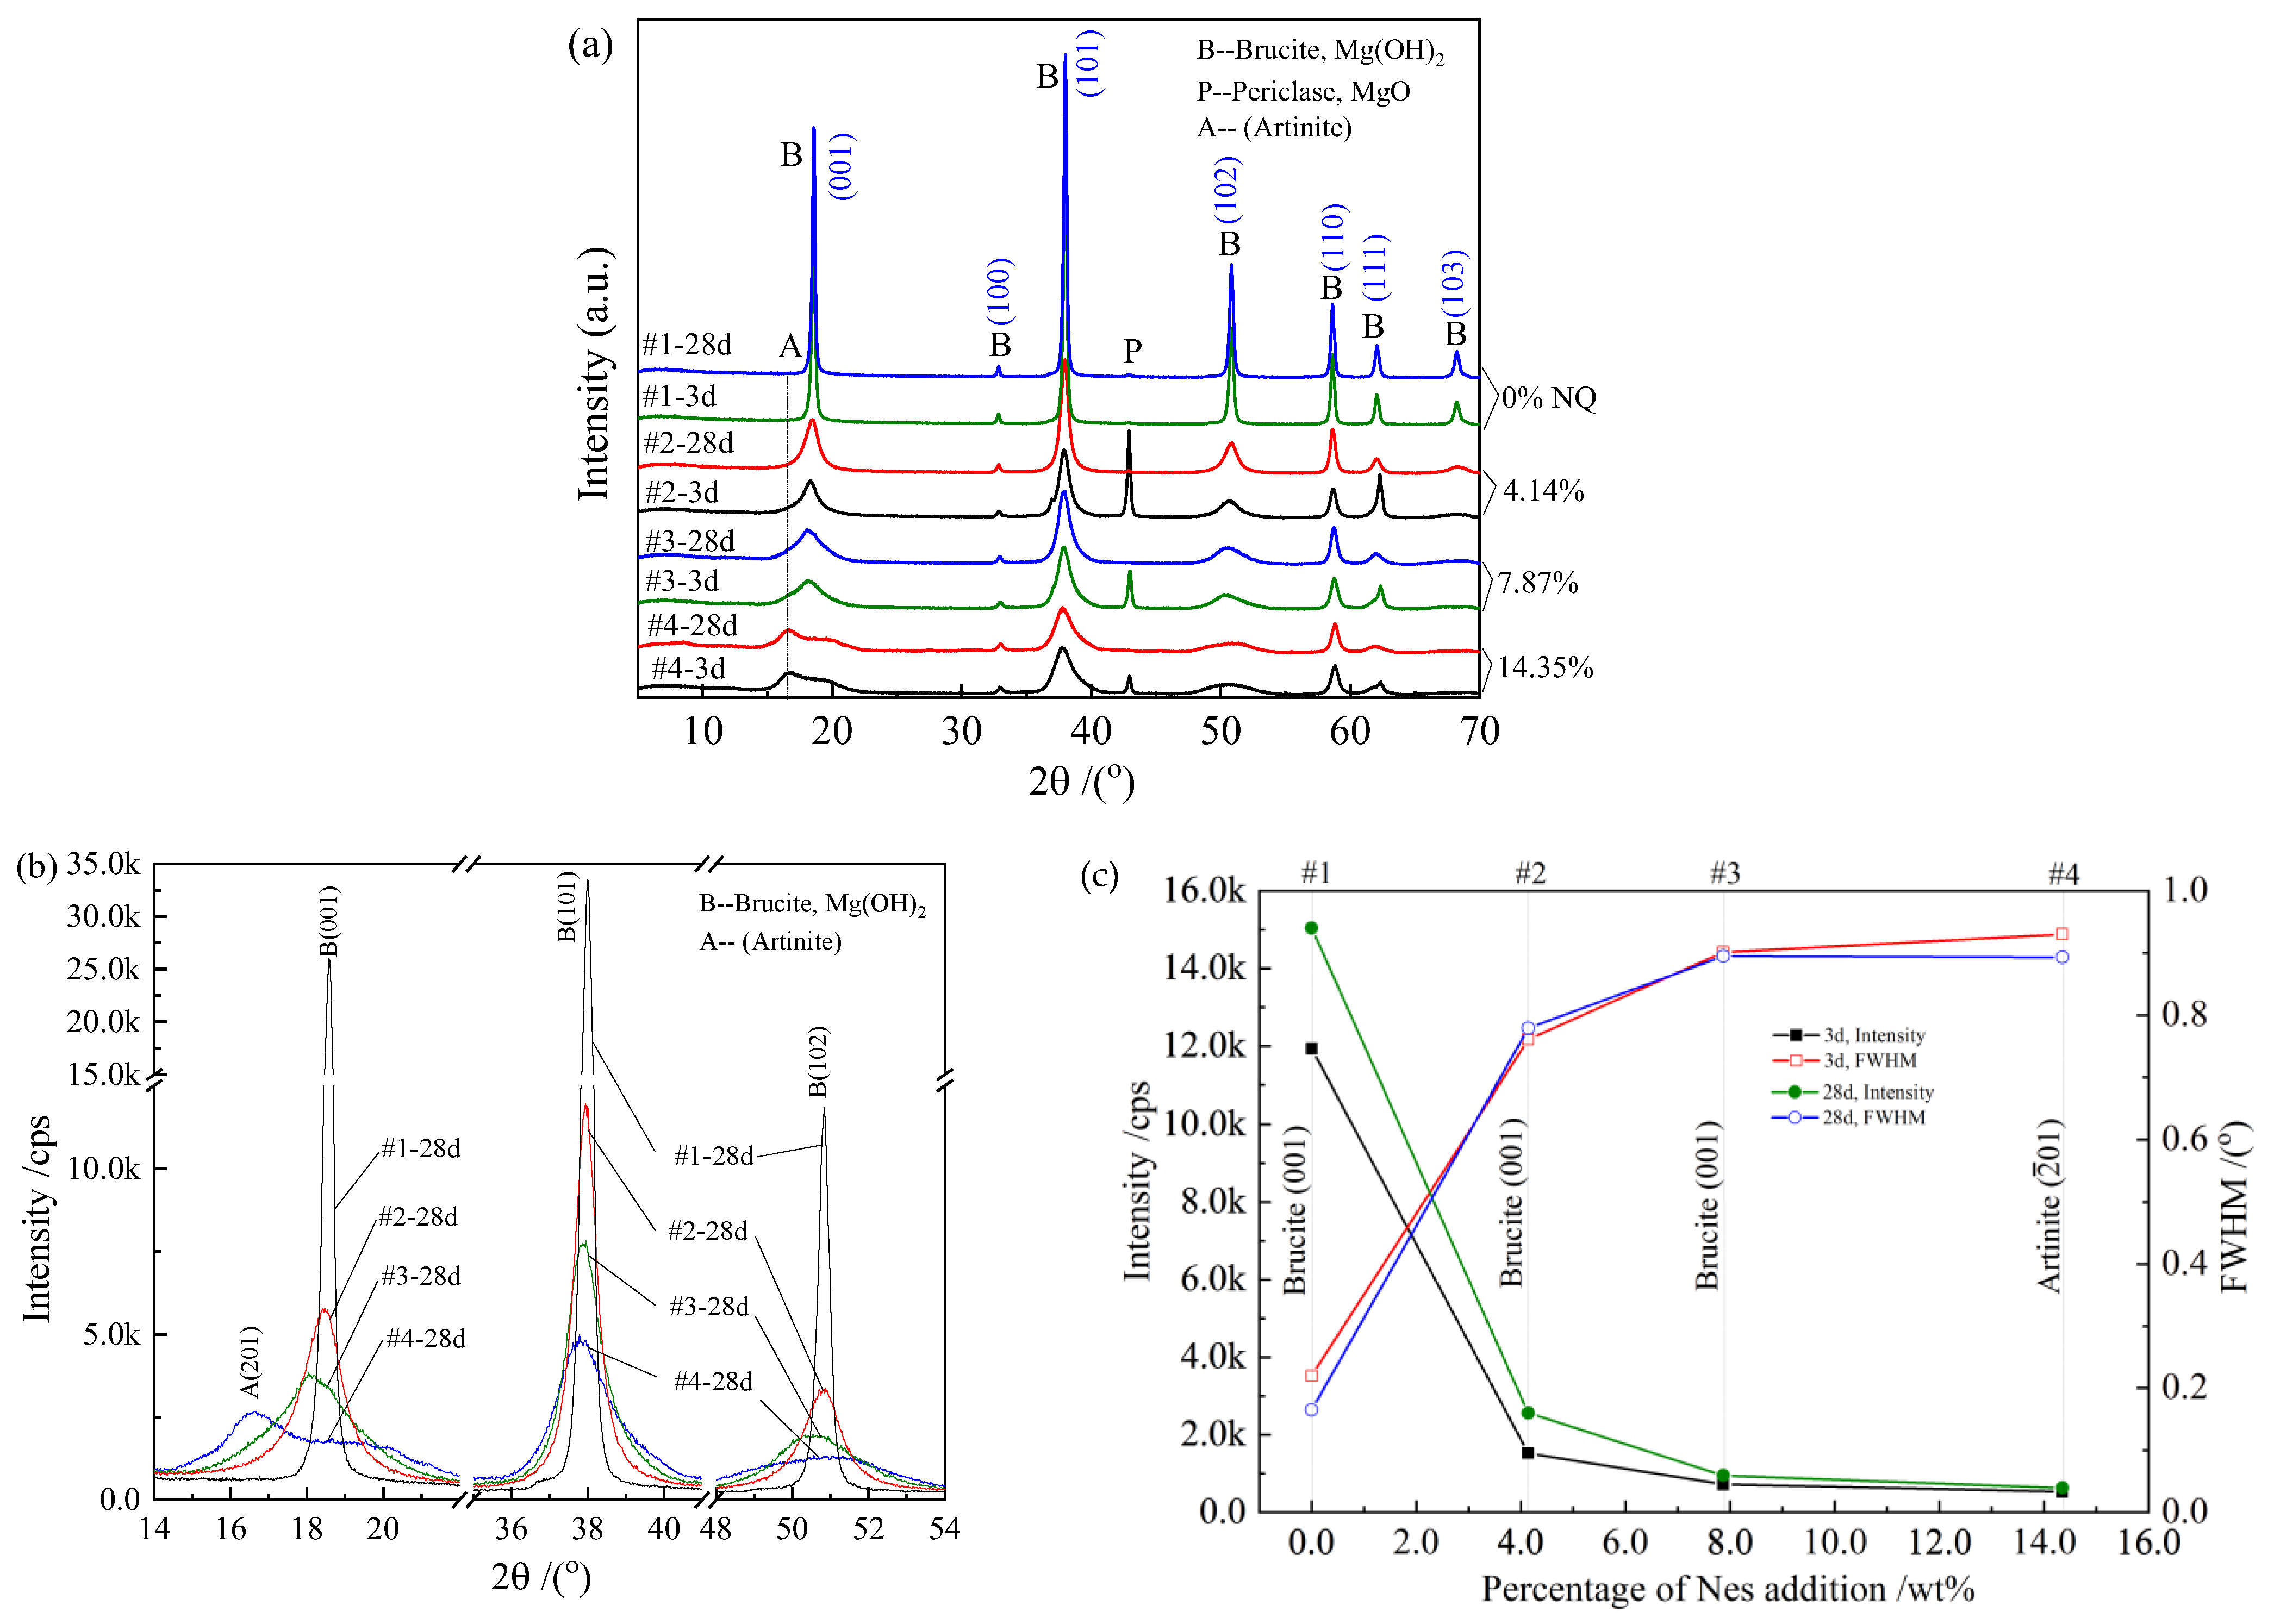
3.4. XRD Analysis and Phase Characteristics
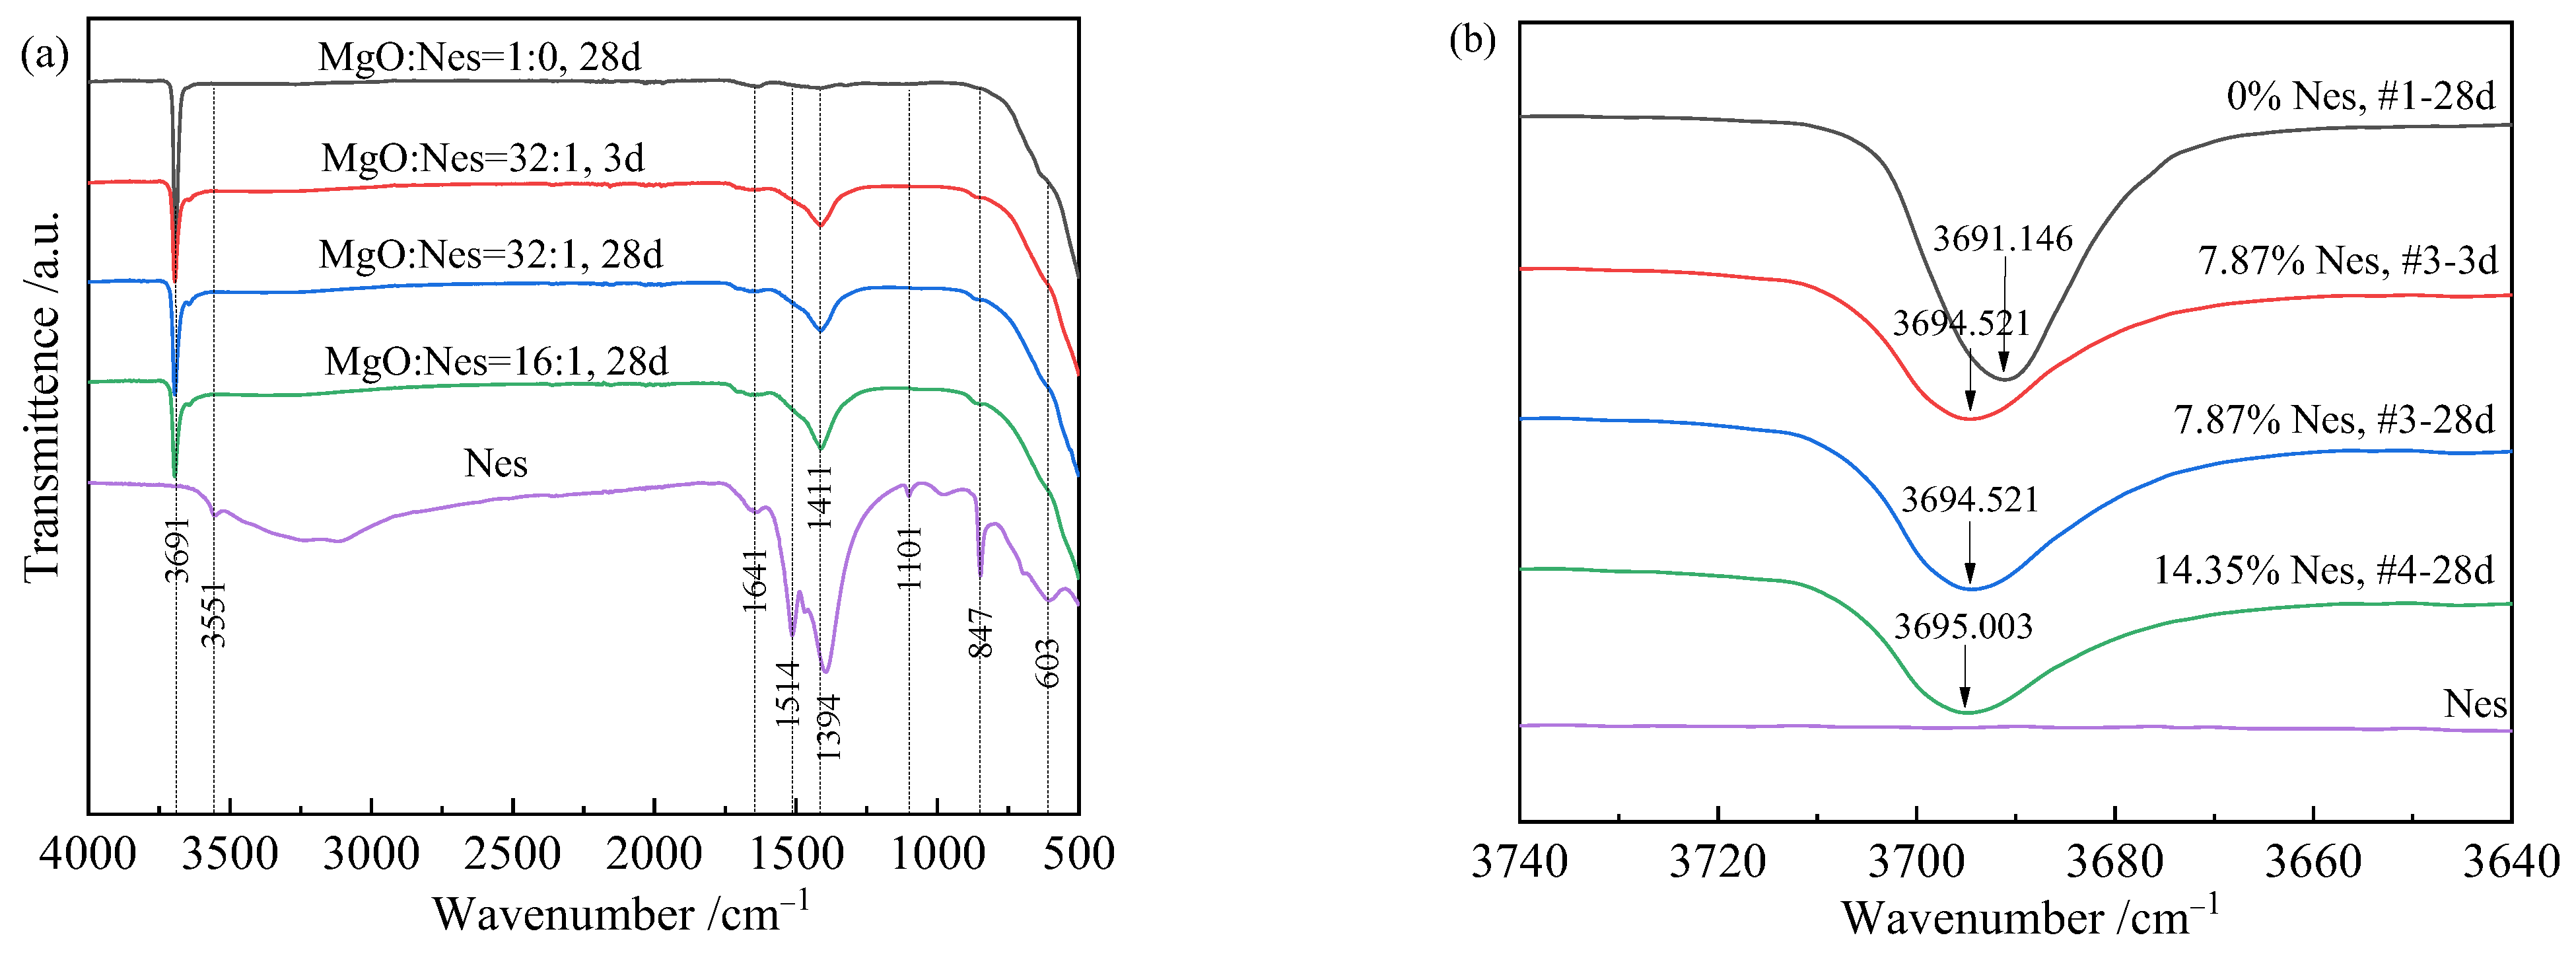
3.5. FT-IR Analysis and Group Properties
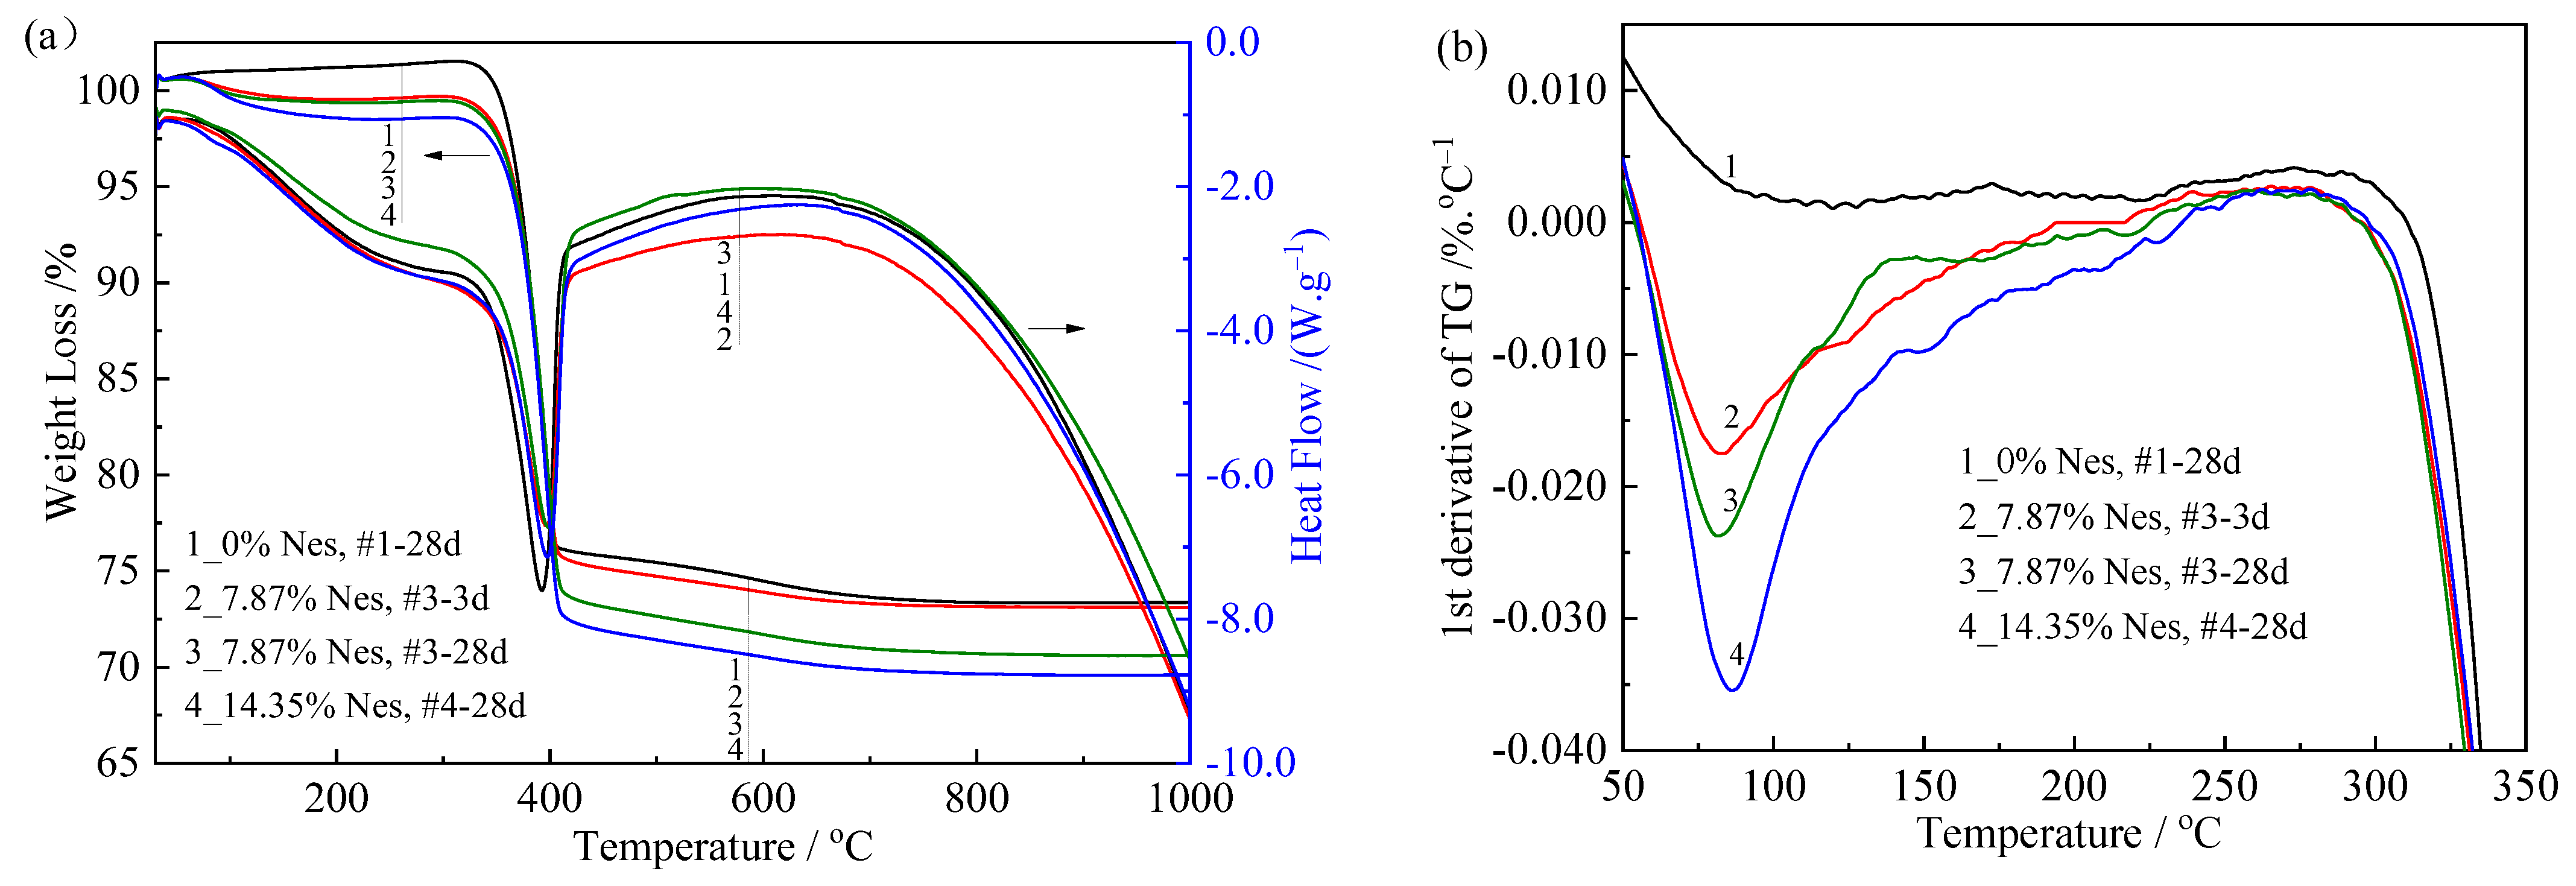
3.6. TG/DSC Analysis and Thermal Effects
4. Discussion
5. Conclusions
- (1)
- The addition of a small amount of Nes also helped to improve the strength of reactive MgO paste under water-curing conditions. The hydration product changed from small plate-like Mg(OH)2 crystals to interlaced sheet-like crystals in samples containing Nes.
- (2)
- The porosity increased from 36.25% to 64.55%, and the total pore surface area increased from 4.6 m2/g to 118.5 m2/g. The total pore volume increased, the pore diameter decreased, and most of the pores were nanopores in the samples with a small amount of Nes addition.
- (3)
- Compared with the pure MgO sample, the hydration product diffraction peak of the sample with the Nes addition became lower and wider. The crystal structure of the hydration products was similar to that of Mg(OH)2, with a larger d-spacing at the (001), (101), and (102) planes.
- (4)
- FTIR and TG results showed that the hydration products contained HCO3– structural units and a small amount of crystallized water, which could be expressed as xMgCO3·Mg(OH)2·yH2O or x[Mg(HCO3)(OH)]·Mg(OH)2·zH2O. The samples with 7.87% and 14.35% Nes additions had x-values in the final hydration products of 0.025 and 0.048, respectively.
Author Contributions
Funding
Institutional Review Board Statement
Informed Consent Statement
Data Availability Statement
Conflicts of Interest
References
- Rotana, H.; Kemal, C. Accelerated carbonation of reactive magnesium oxide cement (RMC)-based composite with supercritical carbon dioxide (scCO2). J. Clean. Prod. 2020, 248, 119282. [Google Scholar]
- Oh, D.Y.; Noguchi, T.; Kitagaki, R.; Park, W.J. CO2 emission reduction by reuse of building material waste in the Japanese cement industry. Renew. Sustain. Energy Rev. 2014, 38, 796–810. [Google Scholar] [CrossRef]
- Almeida, M.; Ferreira, M. Ten questions concerning cost-effective energy and carbon emission optimization in building renovation. Build. Environ. 2018, 143, 15–23. [Google Scholar] [CrossRef]
- Emad, B.; Ezzatollah, S.; Muhammad, I.R. Challenges against CO2 abatement strategies in cement industry: A review. J. Environ. Sci. 2021, 104, 84–101. [Google Scholar]
- Zhang, R.X.; Bassim, N.; Panesar, D.K. Characterization of Mg components in reactive MgO—Portland cement blends during hydration and carbonation. J. CO2 Util. 2018, 27, 518–527. [Google Scholar] [CrossRef]
- Walling, S.A.; Provis, J.L. Magnesia-based cements: A journey of 150 years and cements for the future. Chem. Rev. 2016, 116, 4170–4204. [Google Scholar] [CrossRef] [PubMed] [Green Version]
- Al-tabbaa, A. Reactive Magnesia Cement, Eco-Efficient Concrete Part IV: Future Alternative Binders and Use of Nano and Biotech; Woodhead Publishing Ltd.: Sawston, UK, 2013; Volume 27, pp. 523–543. [Google Scholar]
- Dung, N.T.; Hay, R.; Lesimple, A.; Celik, K.; Unluer, C. Influence of CO2 concentration on the performance of MgO cement mixes. Cem. Concr. Compos. 2021, 115, 103826. [Google Scholar] [CrossRef]
- Zhang, R.X.; Arrigoni, A.; Panesar, D.K. Could reactive MgO cement be a green solution? The effect of CO2 mineralization and manufacturing route on the potential global warming impact. Cem. Concr. Compos. 2021, 124, 104263. [Google Scholar] [CrossRef]
- José, N.; Hawreen, A.; Miguel, B.; Luís, E.; Jorge, D.B. Magnesia (MgO) Production and characterization, and its influence on the performance of cementitious materials: A Review. Materials 2020, 13, 4752. [Google Scholar]
- Shand, M.A. The Chemistry Technology of Magnesia; John Wiley & Sons, Inc.: Hoboken, NJ, USA, 2006. [Google Scholar]
- Unluer, C.; Al-tabbaa, A. Impact of hydrated magnesium carbonate additives on the carbonation of reactive MgO cements. Cem. Concr. Res. 2013, 54, 87–97. [Google Scholar] [CrossRef]
- Unluer, C.; Al-tabbaa, A. The role of brucite, ground granulated blastfurnace slag, and magnesium silicates in the carbonation and performance of MgO cements. Constr. Build. Mater. 2015, 94, 629–643. [Google Scholar] [CrossRef] [Green Version]
- Mo, L.W.; Deng, M.; Tang, M.S. Effects of calcination condition on expansion property of MgO-type expansive agent used in cement-based materials. Cem. Concr. Res. 2010, 40, 437–446. [Google Scholar] [CrossRef]
- Sonat, C.; Lim, C.H.; Liska, M.; Unluer, C. Recycling and reuse of reactive MgO cements—A feasibility study. Constr. Build. Mater. 2017, 157, 172–181. [Google Scholar] [CrossRef]
- Li, X.; Qiu, R.; Xue, F.B.; Fang, L.; Cheng, F.Q. Effects of unreactive MgO and impurities in light burned MgO on the hydration process and performance of base magnesium sulfate cement. Constr. Build. Mater. 2020, 240, 117854. [Google Scholar] [CrossRef]
- Eubank, W.R. Calcination studies of magnesium oxides. J. Am. Ceram. Soc. 1951, 34, 225–229. [Google Scholar] [CrossRef]
- Pachta, V.; Tsardaka, E.C.; Stefanidou, M. The role of flame retardants in cement mortars exposed at elevated temperatures. Constr. Build. Mater. 2021, 273, 122029. [Google Scholar] [CrossRef]
- Chang, C.G.; An, L.Y.; Lin, R.; Wen, J.; Dong, J.M. Effect of Calcination Temperature on Mechanical Properties of Magnesium Oxychloride Cement. Materials 2022, 15, 607. [Google Scholar] [CrossRef]
- Bettelini, M. Systems approach to underground safety. Undergr. Space 2020, 5, 258–266. [Google Scholar] [CrossRef]
- Hua, N.; Tessari, A.; Khorasani, N.E. Characterizing damage to a concrete liner during a tunnel fire. Tunn. Undergr. Space Technol. 2021, 109, 103761. [Google Scholar] [CrossRef]
- Dung, N.T.; Unluer, C. Improving the performance of reactive MgO cement-based concrete mixes. Constr. Build. Mater. 2016, 126, 747–758. [Google Scholar] [CrossRef]
- Al-tabbaa, A.; Vandeperre, L.J. Accelerated carbonation of reactive MgO cements. Adv. Cem. Res. 2007, 19, 67–79. [Google Scholar]
- Vlasopoulos, N.; Cheeseman, C.R. Binder Composition. U.S. Patent 2011/0290155A1, 1 October 2011. [Google Scholar]
- Vlasopoulos, N. Process of Producing Cement Binder Compositions Containing Magnesium. U.S. Patent 2013/0213273A1, 22 August 2013. [Google Scholar]
- Dung, N.T.; Unluer, C. Sequestration of CO2 in reactive MgO cement-based mixes with enhanced hydration mechanisms. Constr. Build. Mater. 2017, 143, 71–82. [Google Scholar] [CrossRef]
- Dung, N.T.; Unluer, C. Development of MgO concrete with enhanced hydration and carbonation mechanisms. Cem. Concr. Res. 2018, 103, 160–169. [Google Scholar] [CrossRef]
- Kuenzel, C.; Zhang, F.; Ferrándiz-Mas, V.; Cheeseman, C.R.; Gartner, E.M. The mechanism of hydration of MgO-hydromagnesite blends. Cem. Concr. Res. 2018, 103, 123–129. [Google Scholar] [CrossRef]
- Sanna, A.; Uibu, M.; Caramanna, G.; Kuusik, R.; Maroto-Valer, M.M. A review of mineral carbonation technologies to sequester CO2. Chem. Soc. Rev. 2014, 43, 8049–8080. [Google Scholar] [CrossRef] [Green Version]
- Ferrini, V.; Vito, C.D.; Mignardi, S. Synthesis of nesquehonite by reaction of gaseous CO2, with Mg chloride solution: Its potential role in the sequestration of carbon dioxide. J. Hazard. Mater. 2009, 168, 832–837. [Google Scholar] [CrossRef]
- Kloprogge, J.T.; Martens, W.N.; Nothdurft, L.; Duong, L.V.; Webb, G.E. Low temperature synthesis and characterization of nesquehonite. J. Mater. Sci. Lett. 2003, 22, 825–829. [Google Scholar] [CrossRef] [Green Version]
- Ren, H.R.; Chen, Z.; Wu, Y.L.; Yang, M.D.; Chen, J.; Hu, H.S.; Liu, J. Thermal characterization and kinetic analysis of nesquehonite, hydromagnesite, and brucite, using TG-DTG and DSC techniques. J. Therm. Anal. Calorim. 2014, 115, 1949–1960. [Google Scholar] [CrossRef]
- Frost, R.L.; Kloprogge, J.T. Infrared emission spectroscopic study of brucite. Spectrochim. Acta Part A Mol. Biomol. Spectrosc. 1999, 55, 2195–2205. [Google Scholar] [CrossRef]
- George, S. Infrared and Raman Characteristic Group Frequencies: Tables and Charts, 3rd ed.; John Wiley & Sons Ltd.: London, UK, 2004. [Google Scholar]
- Frost, R.L.; Palmer, S.J. Infrared and infrared emission spectroscopy of nesquehonite Mg(OH)(HCO3)·2H2O—Implications for the formula of nesquehonite. Spectrochim. Acta Part A Mol. Biomol. Spectrosc. 2011, 78, 1255–1260. [Google Scholar] [CrossRef] [PubMed] [Green Version]
- Skliros, V.; Tsakiridis, P.; Perraki, M. A combined Raman, Fourier transform infrared, and X-ray diffraction study of thermally treated nesquehonite. J. Raman Spectrosc. 2020, 51, 1445–1453. [Google Scholar] [CrossRef]
- Kandiban, M.; Vigneshwaran, P.; Potheher, I.V. Synthesis and characterization of MgO nanoparticles for photocatalytic applications. Natl. Conf. Adv. Cryst. Growth Nanotechnol. 2015, 3, 941–947. [Google Scholar]
- Frost, R.L.; Bahfenne, S.; Graham, J. Raman spectroscopic study of the magnesium carbonate minerals—Artinite and dypingite. J. Raman Spectrosc. 2010, 40, 855–860. [Google Scholar] [CrossRef] [Green Version]


| Sample No. | Designed MgO:Nes Molar Ratio | Water-to-Solid Ratio | Percentage of Nes Addition (wt%) | |
|---|---|---|---|---|
| MgO | Nes | |||
| #1 | 1 | 0 | 1.1 | 0 |
| #2 | 64 | 1 | 1.1 | 4.14 |
| #3 | 32 | 1 | 1.1 | 7.87 |
| #4 | 16 | 1 | 1.1 | 14.35 |
| Sample No. | #1-28d | #2-28d | #3-3d | #3-28d | #4-28d |
|---|---|---|---|---|---|
| MgO:Nes molar ratio | 1:0 | 64:1 | 32:1 | 32:1 | 16:1 |
| Nes addition (wt%) | 0 | 4.14 | 7.87 | 7.87 | 14.35 |
| Total pore volume (mm3/g) | 351.3 | 473.0 | 506.1 | 428.5 | 1059.6 |
| Total pore area (m2/g) | 4.6 | 121.3 | 111.1 | 112.7 | 118.5 |
| Average pore diameter (nm) | 303.5 | 15.6 | 18.2 | 15.2 | 35.8 |
| Dry bulk density (kg/m3) | 1032 | 1054 | 1070 | 893 | 609 |
| Porosity (%) | 36.25 | 49.83 | 54.12 | 38.27 | 64.55 |
| Band Position (cm−1) | Origin | Movement | Reference |
|---|---|---|---|
| 603 | Mg-O | Mg-O bending vibration | [36,37] |
| 847 | CO32− from Nes | ν2 symmetric bending vibration | [35,36] |
| 1101 | CO32− from Nes | ν1 symmetric stretching vibration | [35,36] |
| 1394, 1514 | CO32−/HCO3− from Nes | ν3 antisymmetric stretching vibration | [35,36] |
| 1411 | HCO3− from unknown phase | [34] | |
| 1641 | H2O | H-O-H bending vibration | [28] |
| 3551 | Nes water of crystallization | [36] | |
| 3691~3695 | Mg(OH)2 | Anti-symmetrical O-H stretching vibration of lattice hydroxide | [28,33] |
| Sample No. | #1-28d | #3-3d | #3-28d | #4-28d |
|---|---|---|---|---|
| Temperature range of dehydration (°C) | 310–602 | 296–613 | 293–604 | 298–631 |
| Inflection point of dehydration by TG (Tip) (°C) | 390 | 394 | 395 | 396 |
| Peak temperature of dehydration by DSC (Tp_DSC) (°C) | 384 | 388 | 390 | 389 |
| Mass loss of dehydration (%) | 27.1 | 25.9 | 27.8 | 28.3 |
| Calculated Mg(OH)2 content in hydrated product (wt%) | 87.6 | 83.9 | 90.1 | 91.7 |
| Heat absorption of dehydration (J/g) | 1074 | 1116 | 975 | 905 |
Disclaimer/Publisher’s Note: The statements, opinions and data contained in all publications are solely those of the individual author(s) and contributor(s) and not of MDPI and/or the editor(s). MDPI and/or the editor(s) disclaim responsibility for any injury to people or property resulting from any ideas, methods, instructions or products referred to in the content. |
© 2023 by the authors. Licensee MDPI, Basel, Switzerland. This article is an open access article distributed under the terms and conditions of the Creative Commons Attribution (CC BY) license (https://creativecommons.org/licenses/by/4.0/).
Share and Cite
Shi, R.; Hao, Y.; Chen, D.; Liu, W. Effect of Low Nesquehonite Addition on the Hydration Product and Pore Structure of Reactive Magnesia Paste. Materials 2023, 16, 2445. https://doi.org/10.3390/ma16062445
Shi R, Hao Y, Chen D, Liu W. Effect of Low Nesquehonite Addition on the Hydration Product and Pore Structure of Reactive Magnesia Paste. Materials. 2023; 16(6):2445. https://doi.org/10.3390/ma16062445
Chicago/Turabian StyleShi, Run, Yuehan Hao, Deping Chen, and Wenxin Liu. 2023. "Effect of Low Nesquehonite Addition on the Hydration Product and Pore Structure of Reactive Magnesia Paste" Materials 16, no. 6: 2445. https://doi.org/10.3390/ma16062445