Article

Carbon Emission Evaluation of CO2 Curing in Vibro-Compacted Precast Concrete Made with Recycled Aggregates

by
David Suescum-Morales
1,
Enrique Fernández-Ledesma
1,
Ágata González-Caro
2,
Antonio Manuel Merino-Lechuga
1,
José María Fernández-Rodríguez
2,* and
José Ramón Jiménez
1,*
1
Área de Ingeniería de la Construcción, Escuela Politécnica Superior de Belmez, Universidad de Córdoba, 14240 Córdoba, Spain
2
Área de Química Inorgánica, Escuela Politécnica Superior de Belmez, Universidad de Córdoba, 14240 Córdoba, Spain
*
Authors to whom correspondence should be addressed.
Materials 2023, 16(6), 2436; https://doi.org/10.3390/ma16062436
Submission received: 17 February 2023 / Revised: 12 March 2023 / Accepted: 15 March 2023 / Published: 18 March 2023
(This article belongs to the Special Issue Concrete Chemistry and Sustainability)

Abstract

:
The objective of the present study was to explore three types of vibro-compacted precast concrete mixtures replacing fine and coarse gravel with a recycled/mixed concrete aggregate (RCA or MCA). The portlandite phase found in RCA and MCA by XRD is a “potential” CO2 sink. CO2 curing improved the compressive strength in all the mixtures studied. One tonne of the mixtures studied could be decarbonised after only 7 days of curing 13,604, 36,077 and 24,635 m3 of air using natural aggregates, RCA or MCA, respectively. The compressive strength obtained, XRD, TGA/DTA and carbon emission evaluation showed that curing longer than 7 days in CO2 was pointless. The total CO2 emissions by a mixture using CO2 curing at 7 days were 221.26, 204.38 and 210.05 kg CO2 eq/m3 air using natural aggregates, RCA or MCA, respectively. The findings of this study provide a valuable contribution to carbon emission evaluation of CO2 curing in vibro-compacted precast concrete with recycled/mixed concrete aggregates (RCA or MCA). The technology proposed in this research facilitates carbon capture and use and guarantees enhanced compressive strength of the concrete samples.

1. Introduction

Ordinary Portland cement (OPC) is the most widely used material in construction worldwide, with a global consumption between 1930 and 2013 of 76.2 billion tonnes [1,2]. The manufacture of OPC produces a large amount of CO2 (1 tonne of cement emits approximately 1 tonne of CO2), which means that 8% of the world’s total CO2 emissions are related to the cement industry [3,4,5]. Scientists must therefore work together to reduce/reuse the CO2 emissions produced by OPC manufacturing.
Global warming and climate change are growing problems. According to the Intergovernmental Panel on Climate Change (IPCC) [6], the increase in the earth’s surface temperature will lead to dire consequences, and CO2 emissions are the main cause of global warming [7,8]. Carbon capture storage (CCS) and carbon capture utilisation technologies (CCU) are among the many ways to reduce CO2 emissions [9]. The cost of emitting CO2 in the European Union is approximately 80 €/t CO2, although this will increase due to current policies [10]. With the implementation of CCU, instead of costing money, CO2 would become a source of income.
It has been demonstrated recently that CO2 curing of cement-based materials converts gaseous CO2 into solid calcium carbonate [11,12,13], also called mineral carbonation technology (MCT), and is considered to be a cost-effective and environmentally-friendly method of capturing and storing CO2 [14]. CO2 sequestration by mineral carbonation and its subsequent conversion into a product for the construction industry is one of the most representative examples of MCT [15]. Several studies have applied the CO2 curing concept to produce commercial building material: Several authors [16,17,18] carbonated different types of slag into building material; Zhen et al. [19] directly used the CO2 generated by a cement factory (flue gas carbonation) to cure cement products; Suescum-Morales et al. [5,12,20] studied the application of carbonation in different forms of mortars intended for use as unreinforced construction products up to 7 days of curing. There has been no application of carbonation for longer curing ages, for example, up to 28 days, and studies along these lines would fill many gaps in our current knowledge. Carbonation mainly involves a reaction between CO2 and calcium silicate phases [21]. Equations (1) and (2) are usually related to accelerated carbonation at early ages. Equations (3)–(5) are normally related to the durable carbonation of concrete, although they also occur when there is forced carbonation [22,23]. The main equations are presented in Equations (1)–(5):
3 3 C a O · S i O 2 + 3 x C O 2 + y H 2 O x C a O · S i O 2 · y H 2 O + 3 x C a C O 3
2 2 C a O · S i O 2 + 2 x C O 2 + y H 2 O x C a O · S i O 2 · y H 2 O + 2 x C a C O 3
C a O H 2 + C O 2 C a C O 3 + H 2 O
C x S H y + z C O 2 C ( x z ) S H y + z C a C O 3
C S H + C O 2 C a C O 3 + S i O 2 + H 2 O
The rapid development and constant growth of the construction sector generate a large number of recycled aggregates from construction and demolition waste (RAC&D) [24,25], which is around 30 billion tonnes per year. The reuse of masonry waste, such as recycled aggregate, was a highly relevant topic to the scientific community from the early 1970s [26,27]. The main reasons for this interest include the avoidance of depositing such waste and the overexploitation of natural aggregates (NA) [28,29]. Within RAC&D, there are different types of aggregates, depending on their origin (in very short form) [12,20]: recycled ceramic aggregates (ceramic waste); recycled concrete aggregates (concrete waste) and mixed recycled aggregate (a mixture of the two above. RAC&D is usually of poorer quality than NA, which results in poorer properties of the resulting mixtures. This is due to RAC&D having adhered to the old mortar with lower density, higher porosity, lower crush resistance, higher water absorption value and weaker interfacial transition zones (ITZs) [5,12,30,31]. Therefore, the development of new techniques to improve the quality of RAC&D is on the rise [27,32,33,34,35,36,37], among which are those that improve the quality of RAC&D by using CO2 (accelerated carbonation), which seems to be a very promising technology [38,39,40,41].
To apply CO2 curing at mixtures using RAC&D at a commercial scale, the environmental impact of accelerated carbonation treatment must be considered, since the energy consumption required is usually significant [41,42]. A life cycle assessment (LCA) can be carried out to quantify this impact [43,44,45], or a somewhat simpler form of CO2 footprint assessment can be carried out [46,47,48]. There have been several studies conducting the comparative LCA analysis between NA and RAC&D [49], and, although the ISO 14040 standard regulates the definition and selection criteria of functional units, the units chosen for investigating concrete products are insufficient to reflect concrete in terms of its environmental impact [50]. Most of the studies found only calculate the CO2 sequestration capacity of CO2 cured samples, without taking into account the carbon footprint of the curing process itself [5,12,25,51]. However, CO2 sequestration of cement-based waste materials is a multi-process activity with consumption of energy: demolition sector, recycling sector and carbon capture sector, among others [52]. There are no studies that calculate CO2 sequestration in mixtures made with RAC&D through thermogravimetric analysis, nor are there studies that perform a carbon footprint assessment considering both the materials used and the curing conditions and time. Studies along these lines can also fill this knowledge gap.
The objective of the present study was to explore three types of vibro-compacted precast concrete mixtures replacing fine and coarse gravel with two types of RAC&D. CO2 curing for 1, 3, 7, 14 and 28 days was employed to improve the compressive strength and CO2 sequestration. X-ray diffraction (XRD) of the hardened samples was measured to analyse the effect of CO2 curing for the duration of 28 days of curing. The carbon emission evaluation was performed using thermogravimetric analysis for the CO2 sequestration and, and a CO2 footprint assessment for the different mixtures and time/curing conditions.

2. Materials and Methods
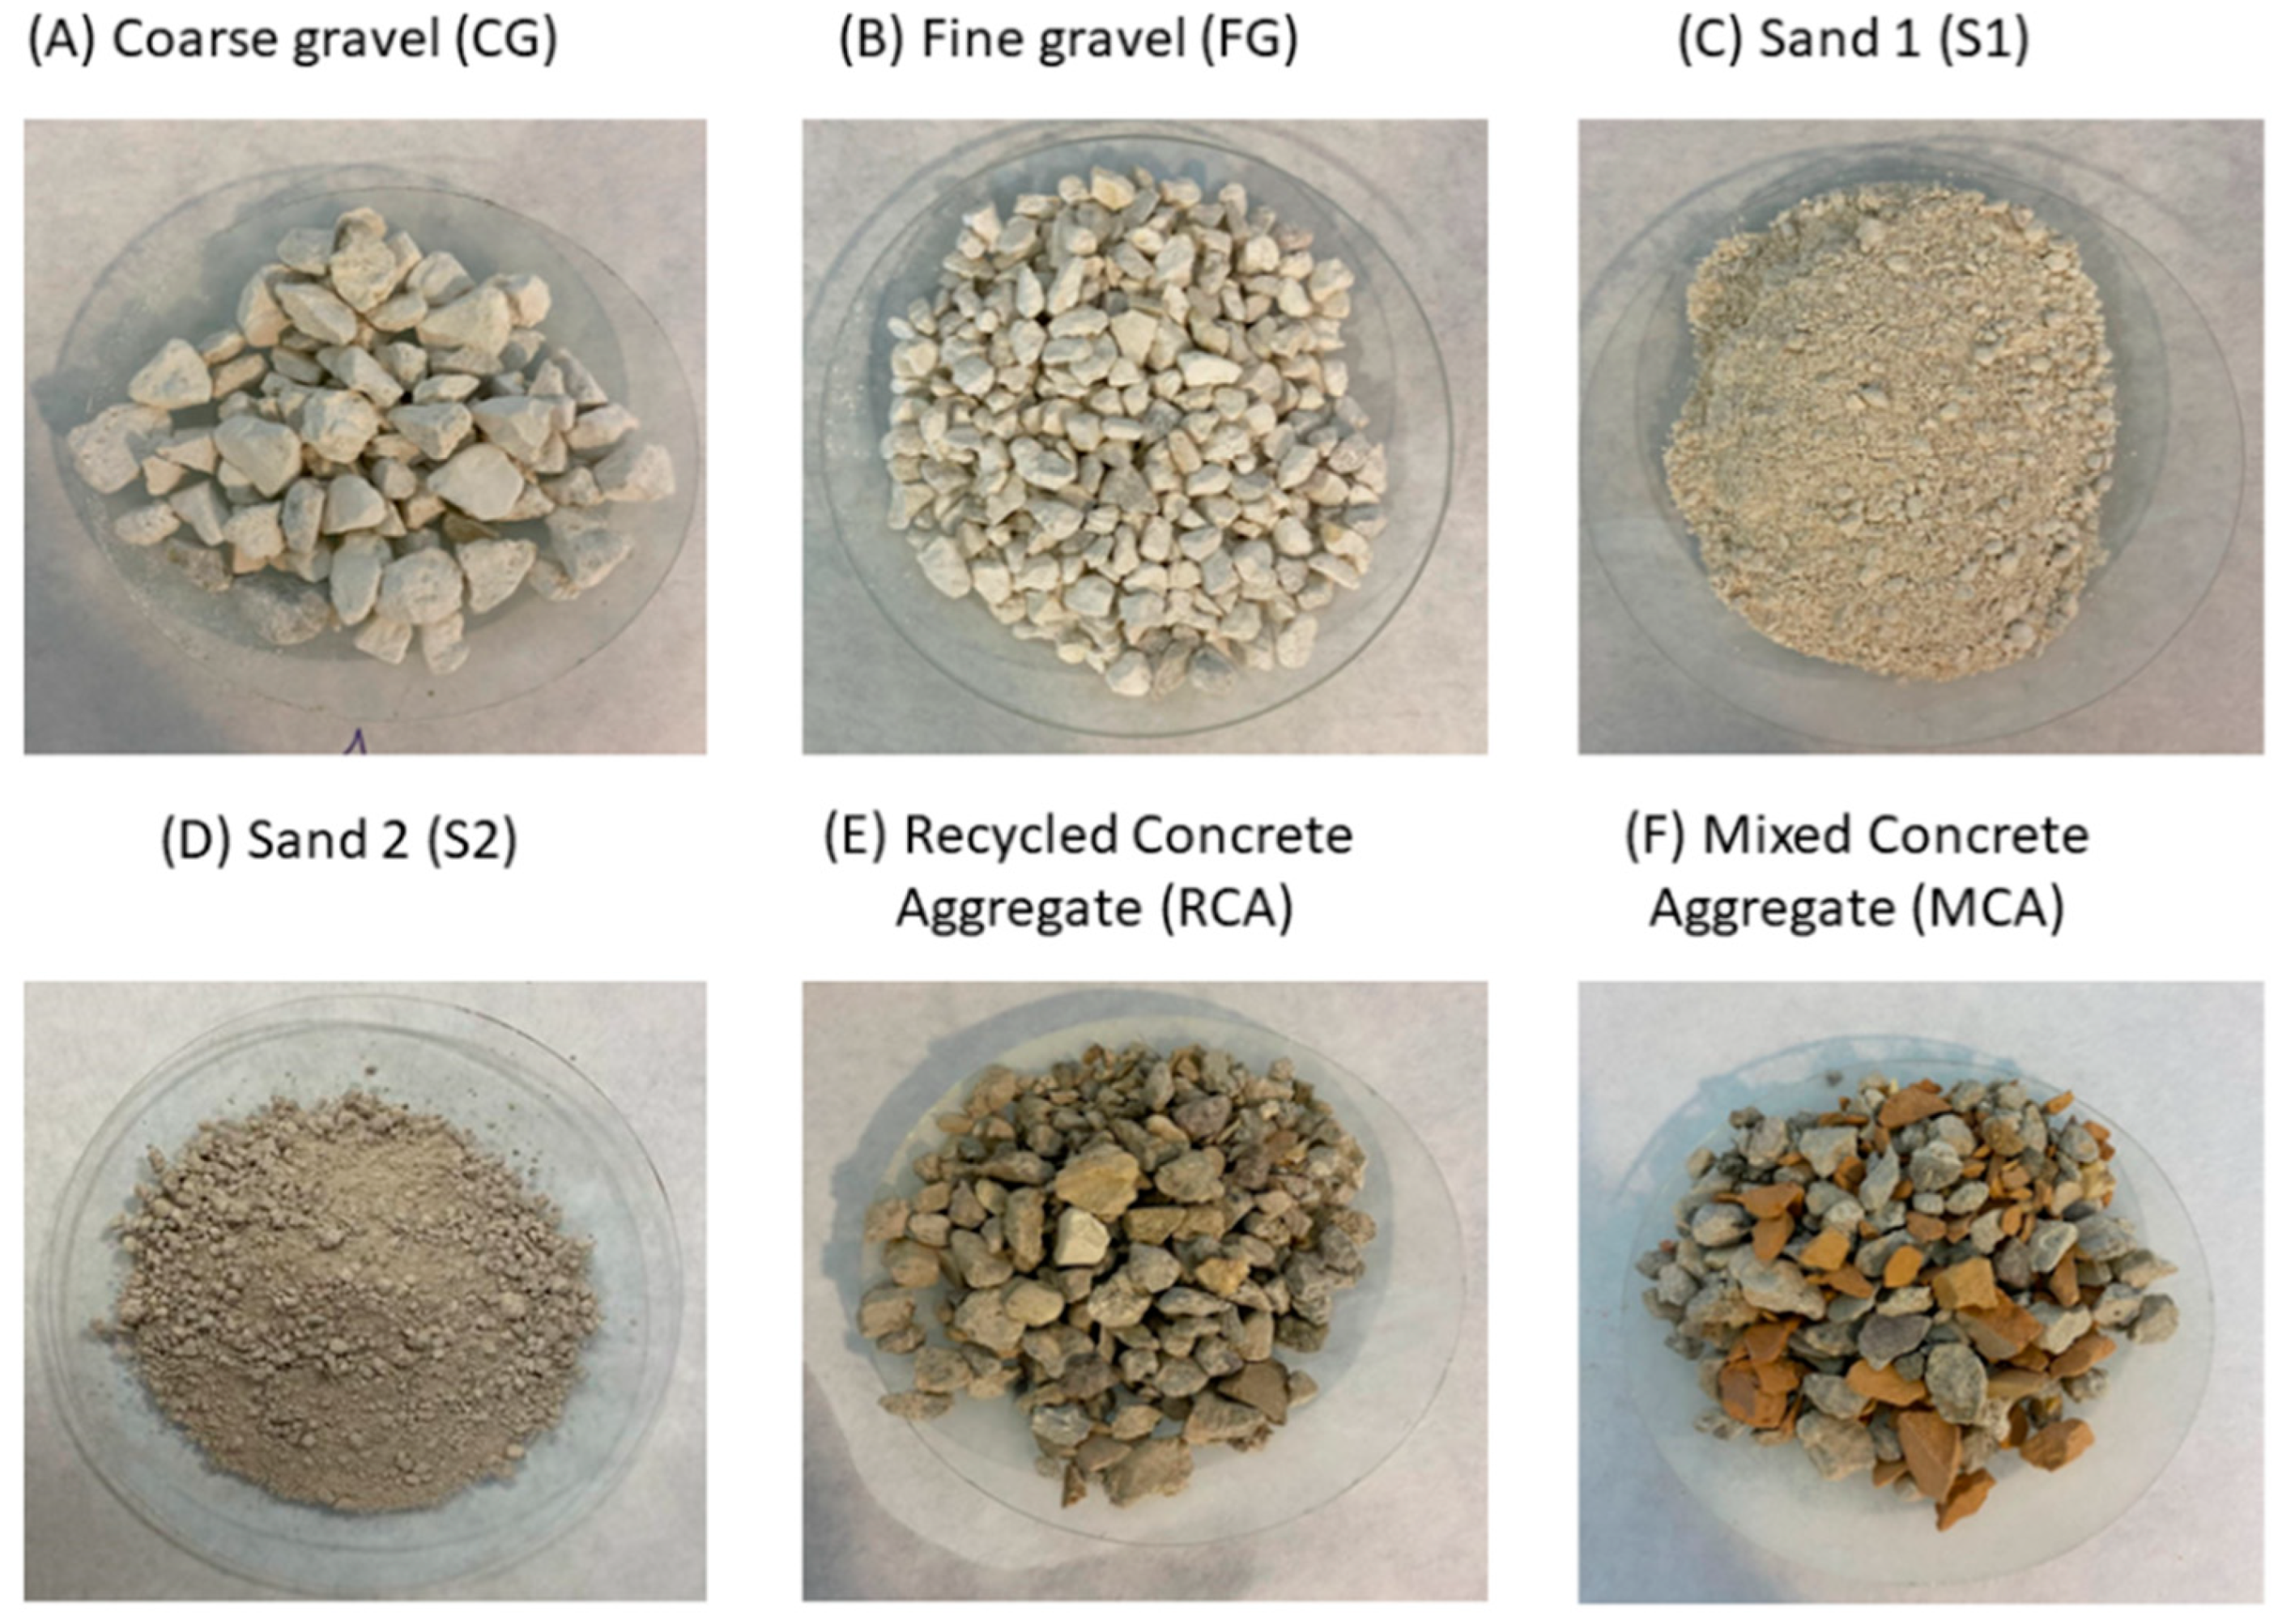
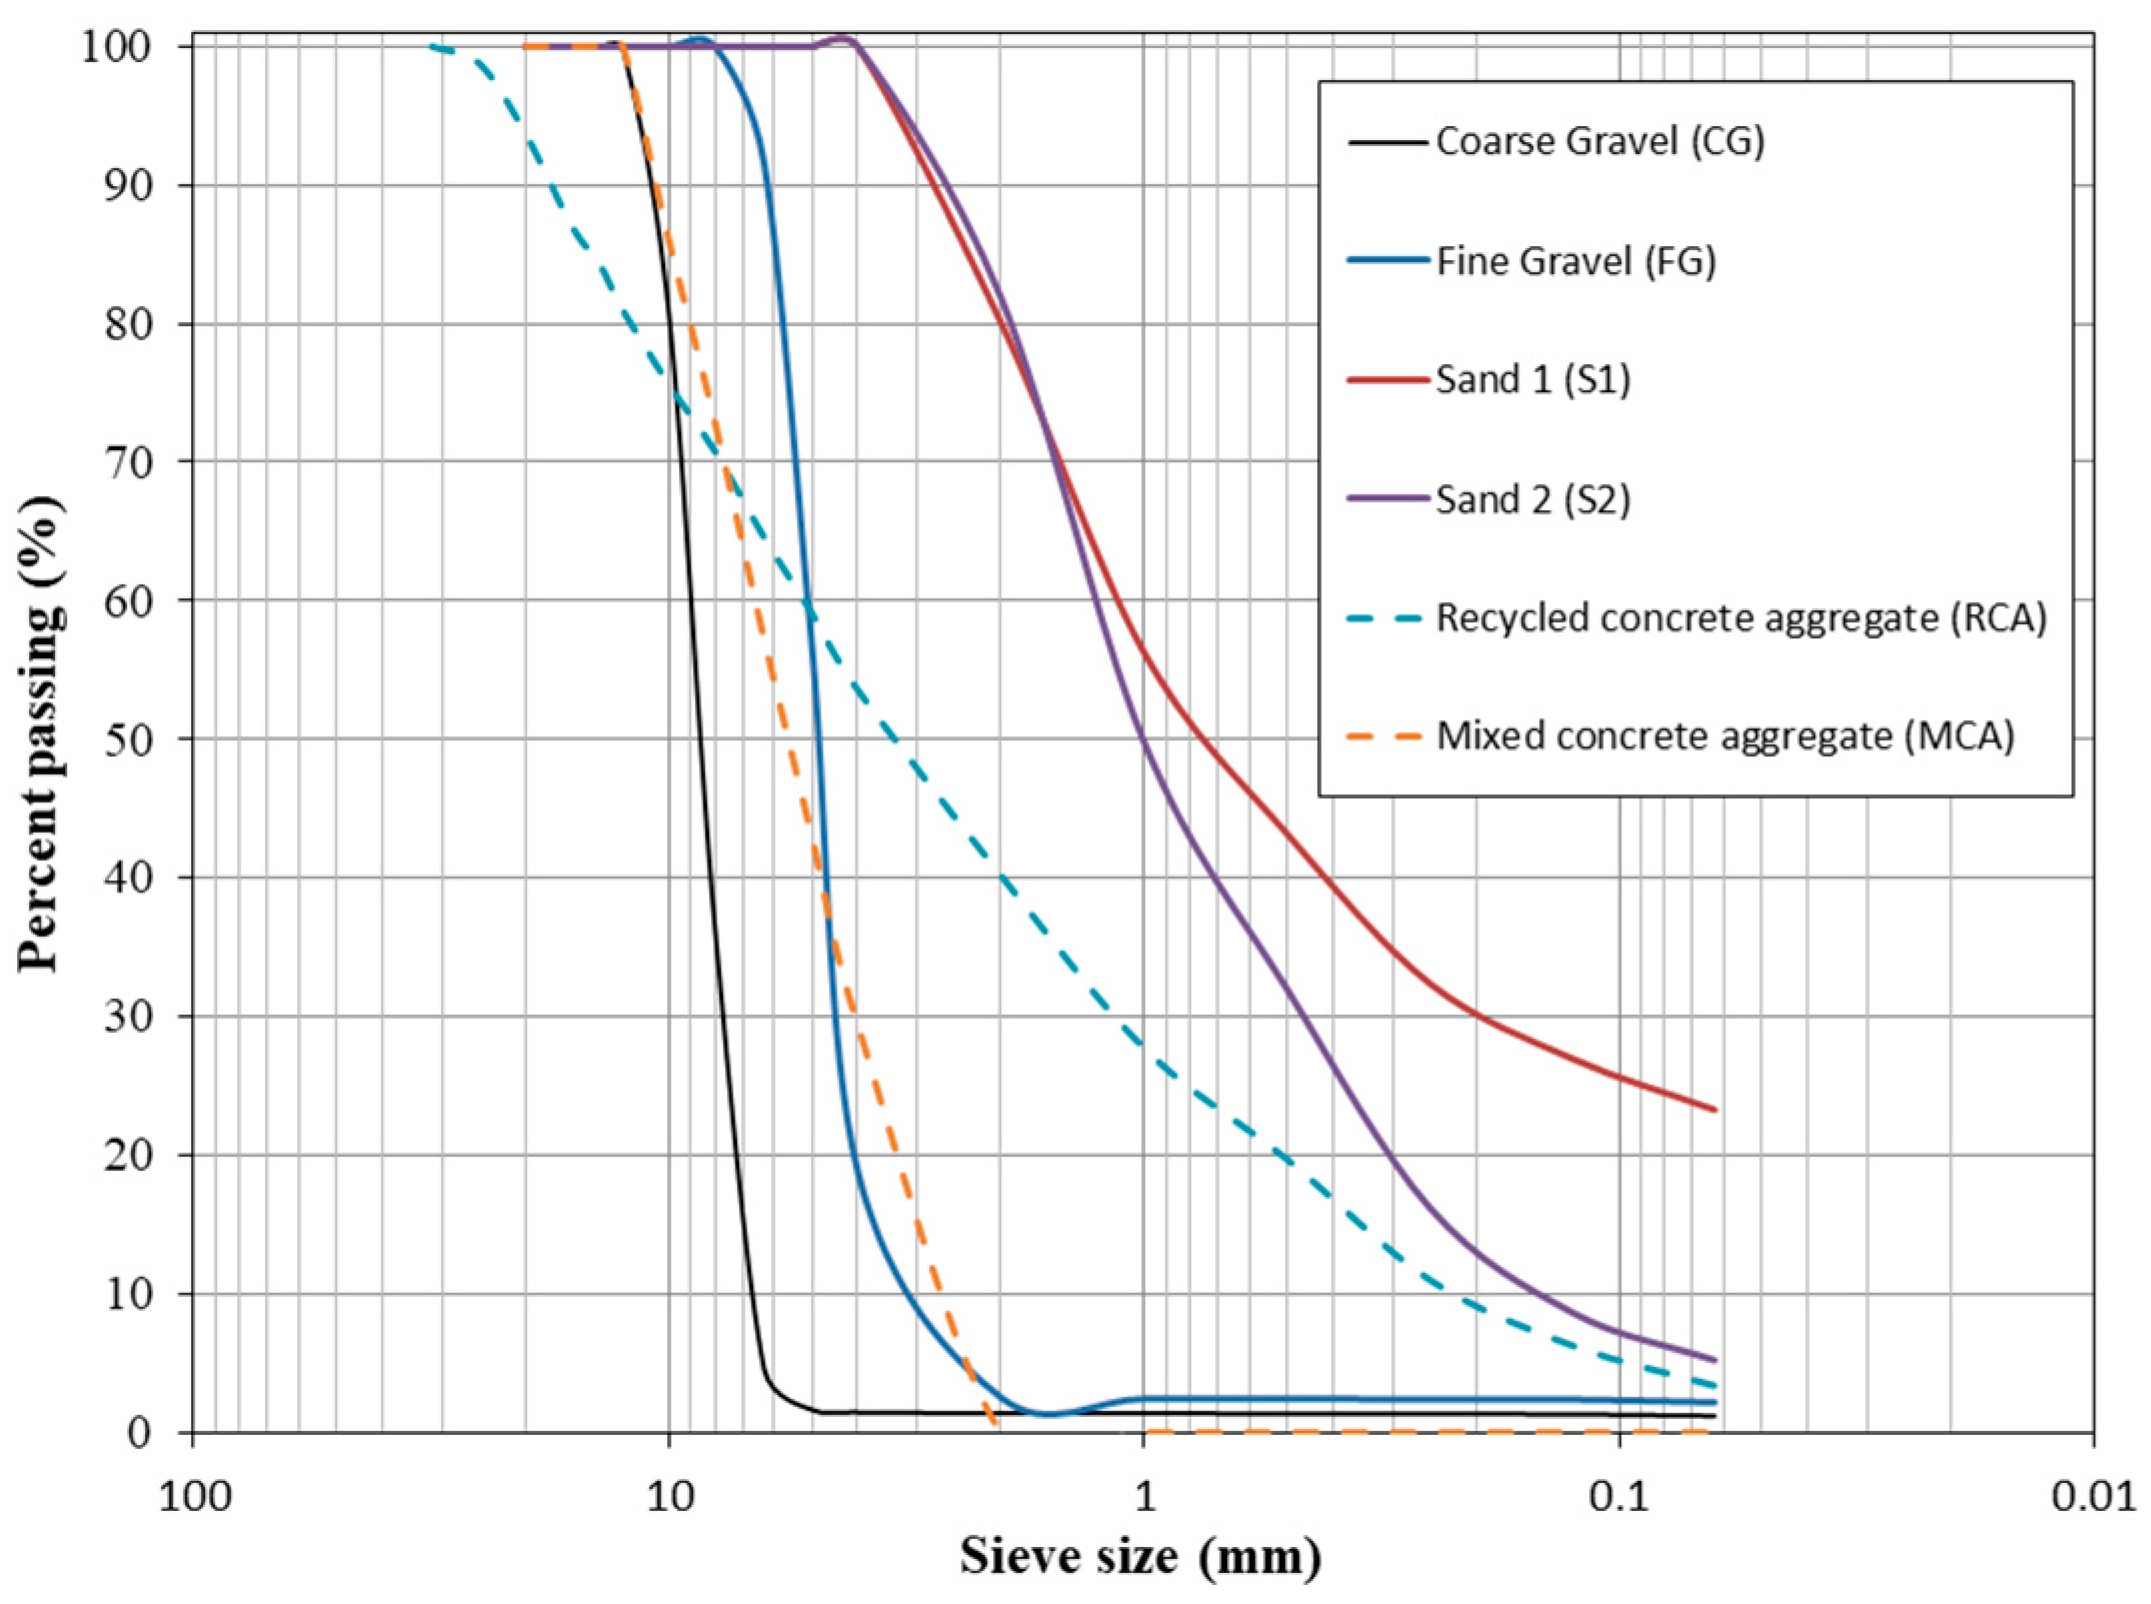
2.1. Raw Materials

In this study, two types of natural coarse aggregates and natural fine aggregates were used: coarse gravel (CG), fine gravel (FG), sand-1 (S1) and sand-2 (S2). Two types of recycled aggregate were also used: recycled concrete aggregate (RCA) and mixed concrete aggregate (MCA). Figure 1 shows the aspect of the aggregates used. These aggregates were taken from a quarry in Cordoba (Spain). The difference between RCA and MCA was that MCA included pieces of ceramic bricks. Figure 2 shows the original particle size distribution of all the aggregates used in this study [53]. The skeletal density and water absorption were measured according to UNE-EN-1097-6:2013 [54]. Table 1 shows the basic physical parameter indicators of the aggregates and a CEM II/A-V 42.5 R was used [55]. The mixing water was tap water with polycarboxylate-based product from BASF (Glenium 3030 NS) as a plasticizer (1210 kg/m3).

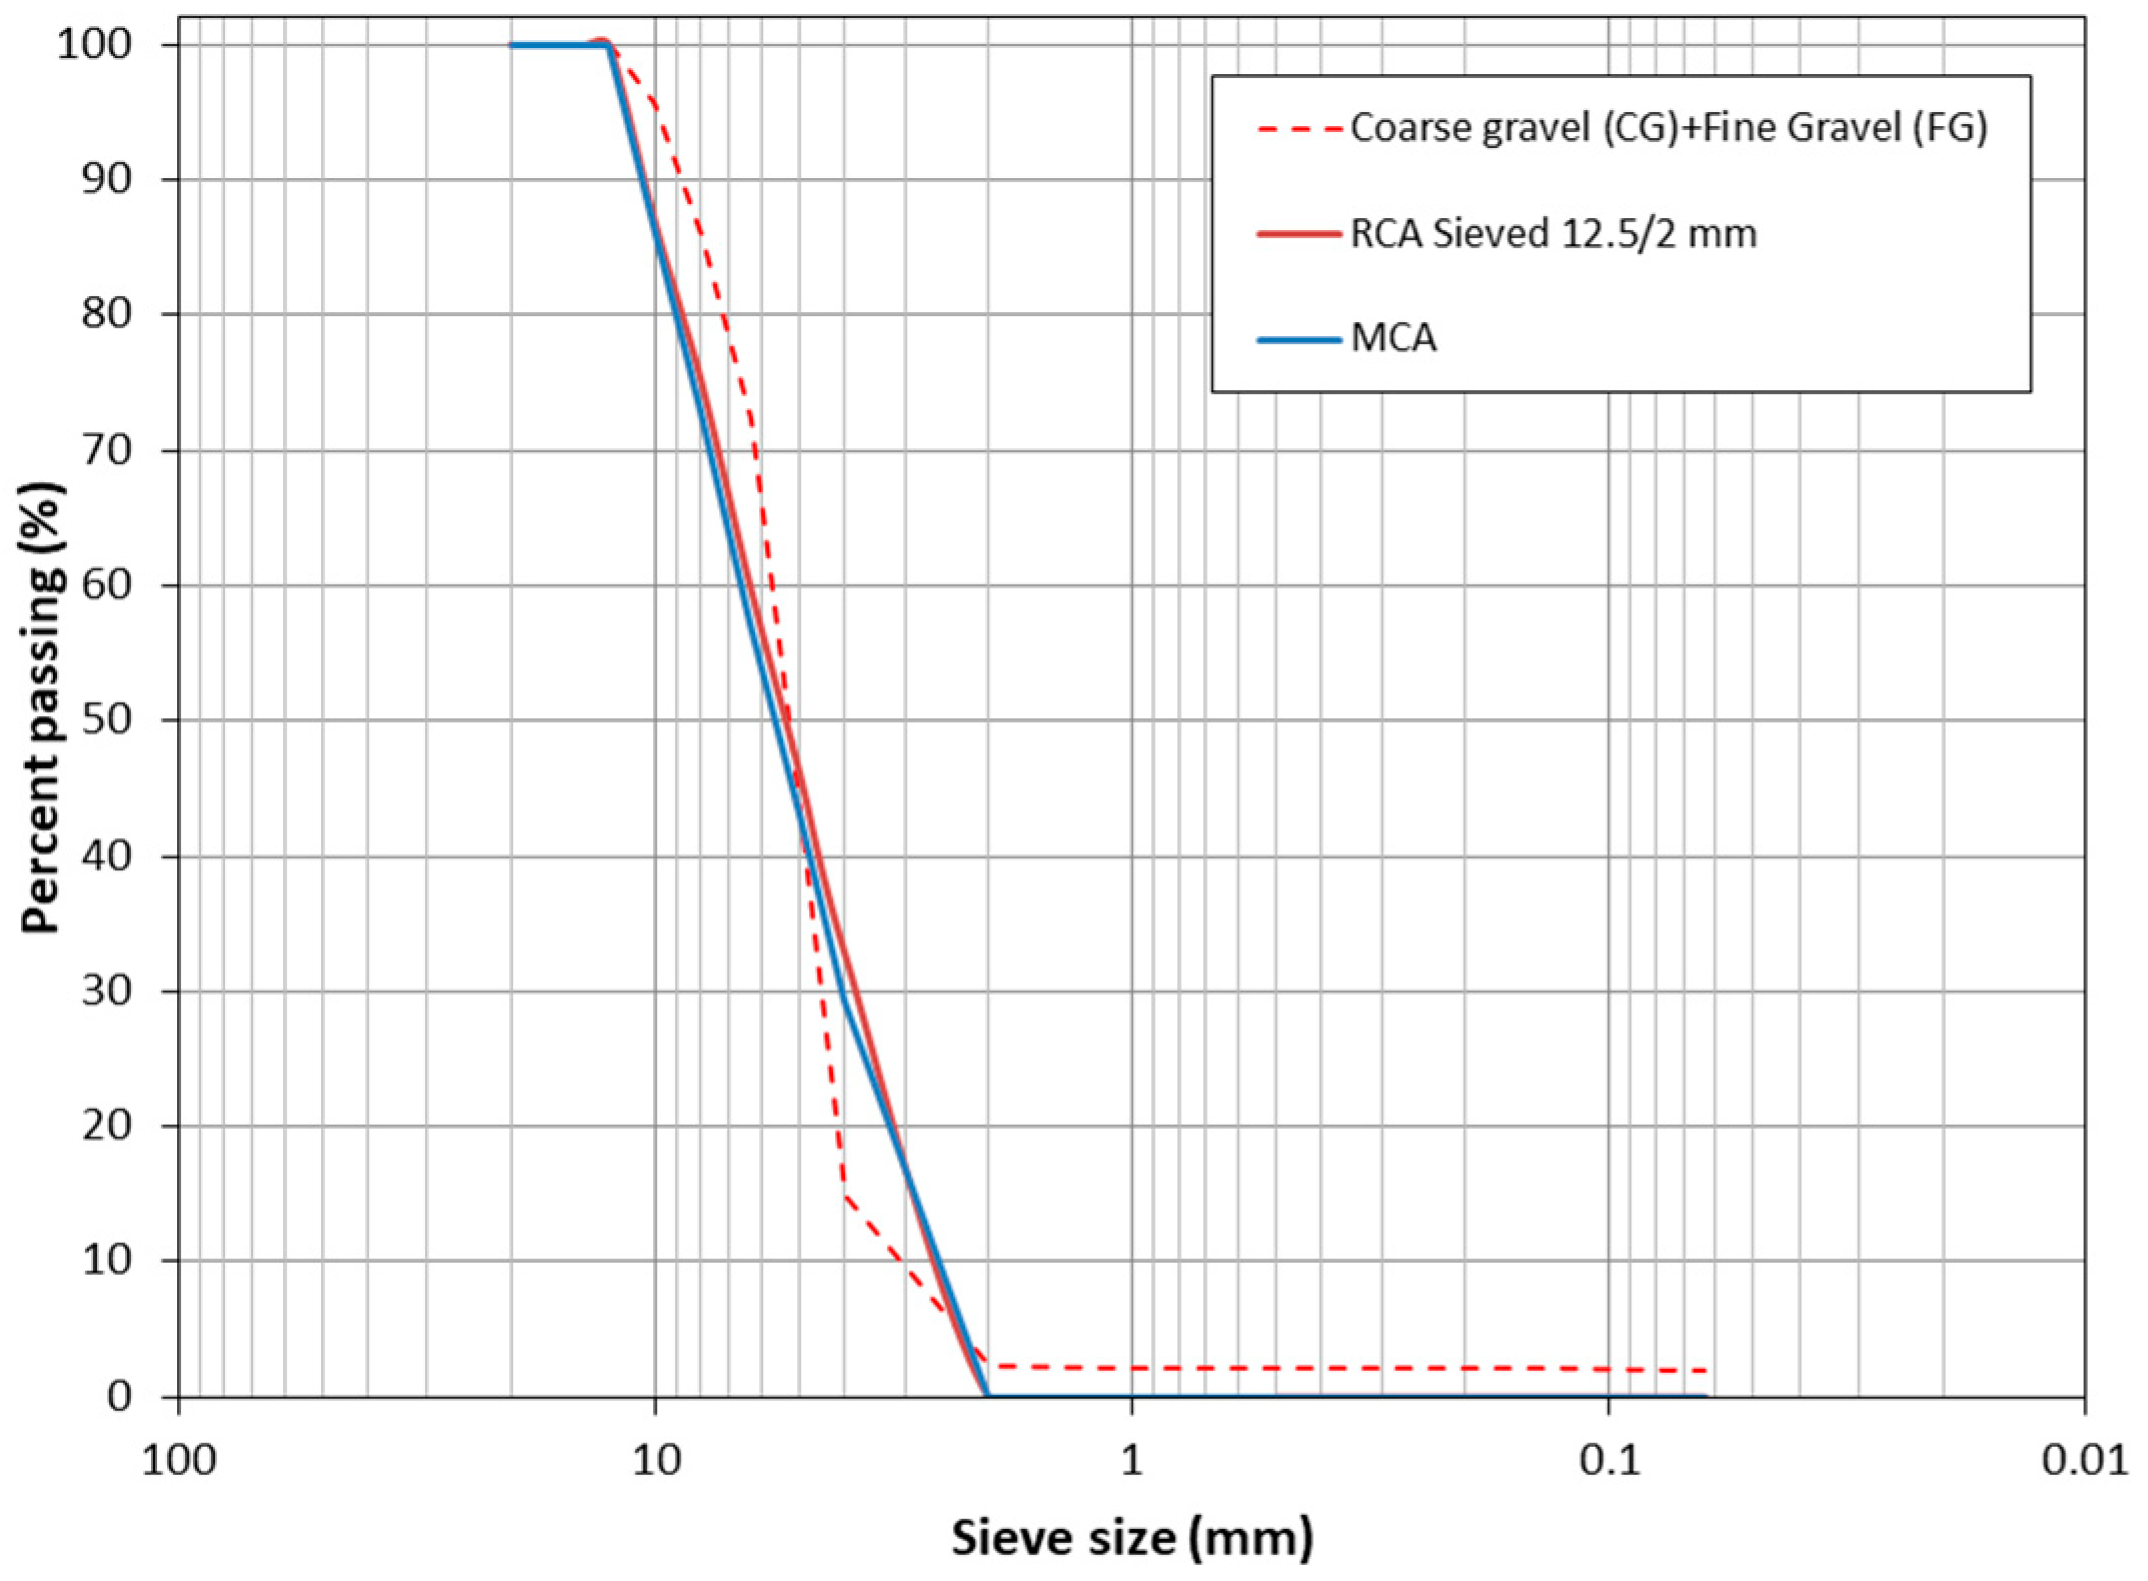
2.2. Aggregate Preparation and Mix Design

The aim was to replace coarse aggregates (CG and FG) with RCA and MCA. However, according to Figure 2, the particle sizes appear to be very different. Therefore, after an experimental and iterative process, it was decided to make a mixture of 22.22% CG and 77.78% FG (with respect to the sum of CG and FG). RCA had very large particle sizes (larger than 12.5 mm) and a very large proportion of finer particles (smaller than 2 mm). Therefore, in order to make the size of MCA and RCA similar, sieving was carried out. RCA material was sieved by 12.5 and 2 mm, rejecting the upper and lower parts, respectively. For MCA, no sieving was required. With this combination, the particle sizes were very similar for the composition of GC + FG, RCA and MCA, as shown in Figure 3.
The proportions of concrete mixtures are given in Table 2. The aim of the mixtures was that they should be demoulded immediately. Therefore, a low w/c ratio was used (w/c = 0.4). For the reference mixture (named CONTROL), the water saturation was calculated according to the values of water absorption shown in Table 1. It can be observed that the composition of CG and FG represented 22.22 and 77.78%, respectively (with respect to the sum of CG and FG).
For the mixture substituting 100% GC + FG by RCA (named M-100-RCA), the amount was calculated as shown in Equation (6). The volumes of both CG and FG (volumetric substitution) were taken into account. The same procedure was followed for the mixture substituting 100% GC + FG by MCA (named M-100-MCA), as shown in Equation (7). To calculate these quantities and the water absorption, the data shown in Table 1 was again used.
A m o u n t   o f   R C A = ( γ R C A · A m o u n t C G ) ( γ C G ) + ( γ R C A · A m o u n t F G ) ( γ F G )
A m o u n t   o f   M C A = ( γ M C A · A m o u n t C G ) ( γ C G ) + ( γ M C A · A m o u n t F G ) ( γ F G )

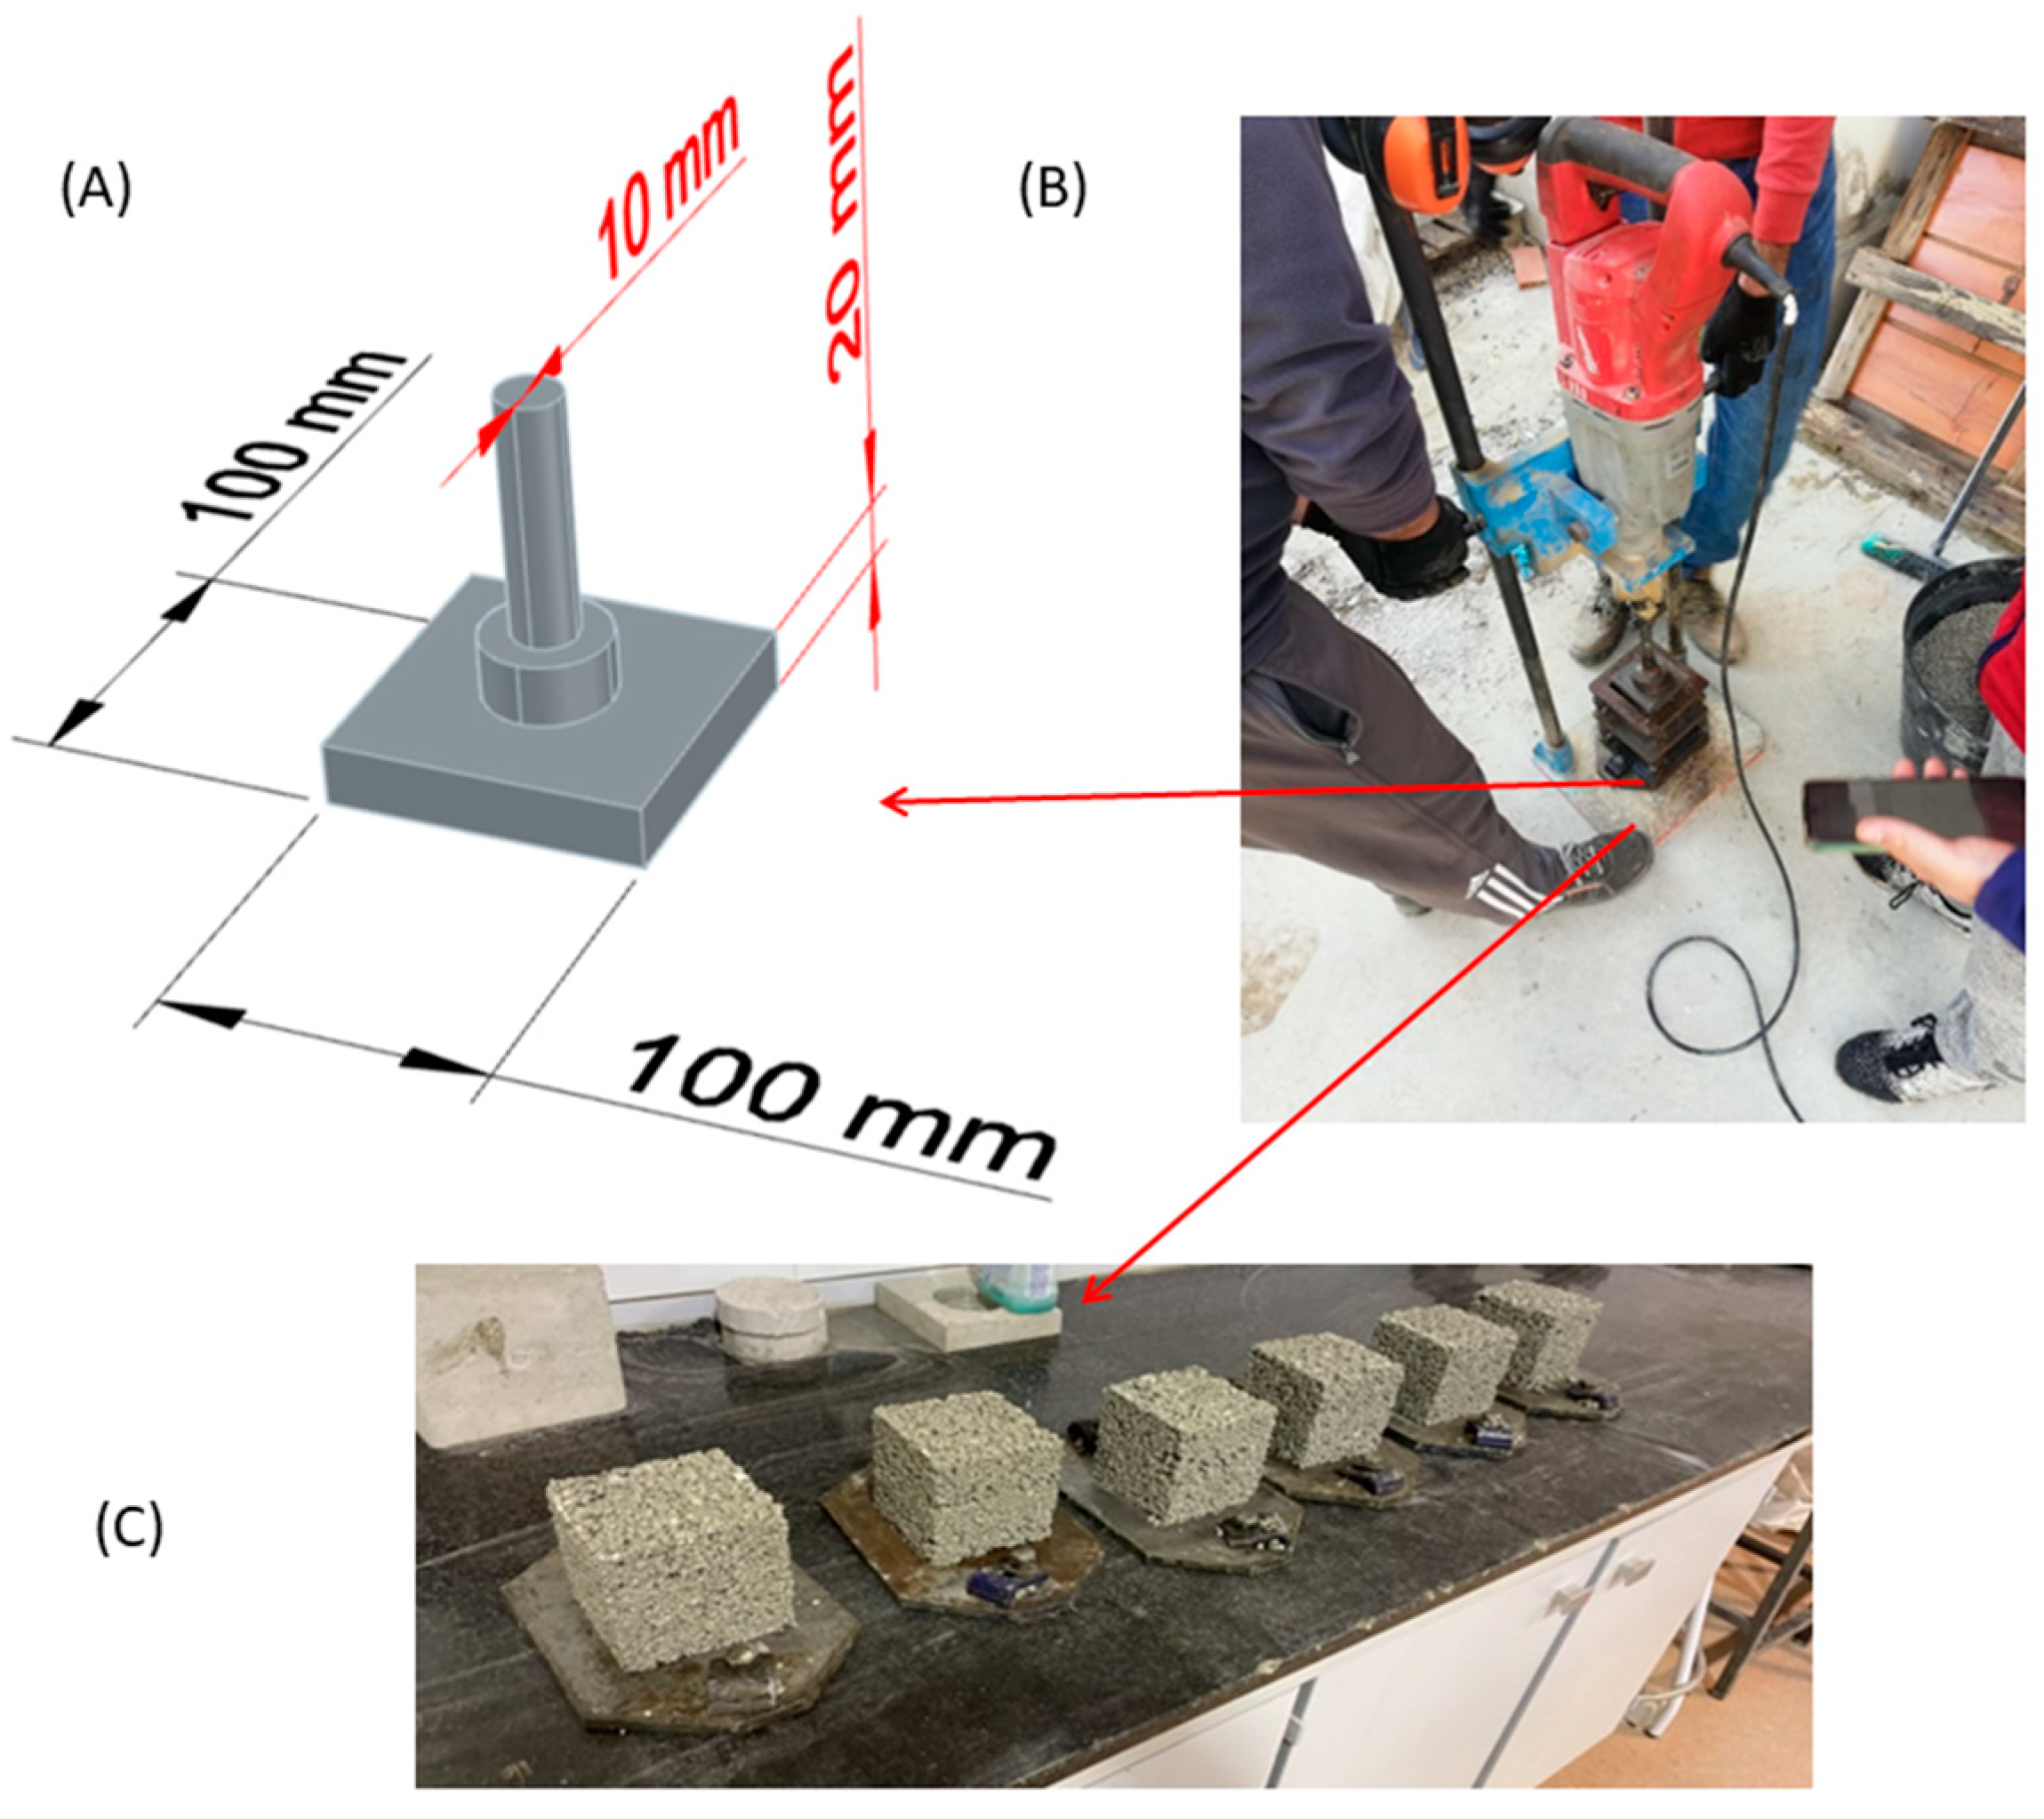
2.3. Concrete Mixing Procedure and Casting

The procedure for the mixing was as follows: the coarse aggregates (CG and FG or RCA or MAC) were added and mixed for 1 min, and then the fine aggregates (S1 and S2) were added and mixed for another minute. The saturation water and all aggregates were mixed for 10 min, the effective water together with the plasticizer was added and then the cement was added. A mixing time of 5 min was carried out. The mixer used was a professional electric mixer (Inhersa X155, Inhersa company, Castellón, Spain). For all the mixes, the results of the slump test were 0 mm [56], which indicated a dry consistency or S1 class, according to Eurocode 2 [57,58]. Cube samples of 100 mm were cast.
Due to the very dry consistency of the concretes obtained, vibro-compaction with a Kango vibration hammer (Milwaukee Kango 900 S) was applied. The 100 × 100 mm cubic moulds were filled in 2 batches, with a vibro-compaction of 10 s in each of these batches. The hammer used as well as the 3-D modelling of the specially fabricated steel part for this procedure by the authors is shown in Figure 4. The aim was to follow a procedure similar to that used in an unreinforced precast plant [59].

2.4. Curing Conditions and Test Methods

Once the samples were demoulded, they were subjected to:
  • Conventional climatic chamber (CCC): 20 °C and 65% relative humidity. The CO2 level under this environment was equivalent to atmospheric conditions (≈0.04%);
  • CO2 climatic chamber (CO2CC): For this environment a Climacell 707-Evo (MMM Group, Planegg, München, Germany) with a CO2 level of 5% (99.995% purity, supplied by Linde) and 20 °C with 65% relative humidity. The pressure was ambient.
According to the manufacturer, the maximum power of both pieces of equipment was 300 W, but with these conditions, a consumption of about 0.15 kW/h can be considered. This value will be used for the carbon footprint assessment.
The raw materials were subjected to X-ray Fluorescence (XRF) in order to determine their chemical composition. For this purpose, ZSX PPRIMUS IV (Rigaku) equipment with a power of 4 kW was used, as well as X-ray diffraction (XRD) for all raw materials and for the samples hardened at the age of 7, 14 and 28 days in the different hardening environments. For XRD, a Bruker D8 Discover A25 instrument with Cukα (λ = 1.54050 A, 40 kV and 30 mA) was used. A speed of 0.018 2θ·s−1 was used from 10° to 70° (2θ). The library used to compare the crystalline peaks was the JCPDS library [60]. Thermogravimetric analysis and differential thermal analysis (TGA/DTA) were applied for all raw materials and for the hardened samples at the same ages for XRD. TGA/DTA was carried out with Setaram Setys Evolution 16/18 apparatus. Before XRF, XRD and TGA/DTA, all samples were properly powdered. The heating rate of the TGA/DTA test was 5° min−1, and the temperature range was approximately 20–1000 °C. At the indicated ages and for XRD and TGA/DTA, the samples were immersed in pure absolute ethanol (PanReac.AppliChem) for 48 h to “stop” the setting reactions. The same recommendations and procedures indicated by RILEM TC-238 SCM were followed, except for the immersion time (in this case 48 h) [61].
“All raw materials and hardened concretes were prepared by crushing them in advance to obtain a representative sample of each material (for XRD and TGA/DTA). The powder was quartered and all measurements were carried out in triplicate. A similar procedure was carried out in other investigations [4,62,63,64]. The compressive strength [65] was determined at 1, 3, 7, 14 and 28 days of curing in the two hardening environments presented. Dry bulk density and accessible porosity for water were determined at 28 days of age, according to UNE 83980 [66], for both environments.

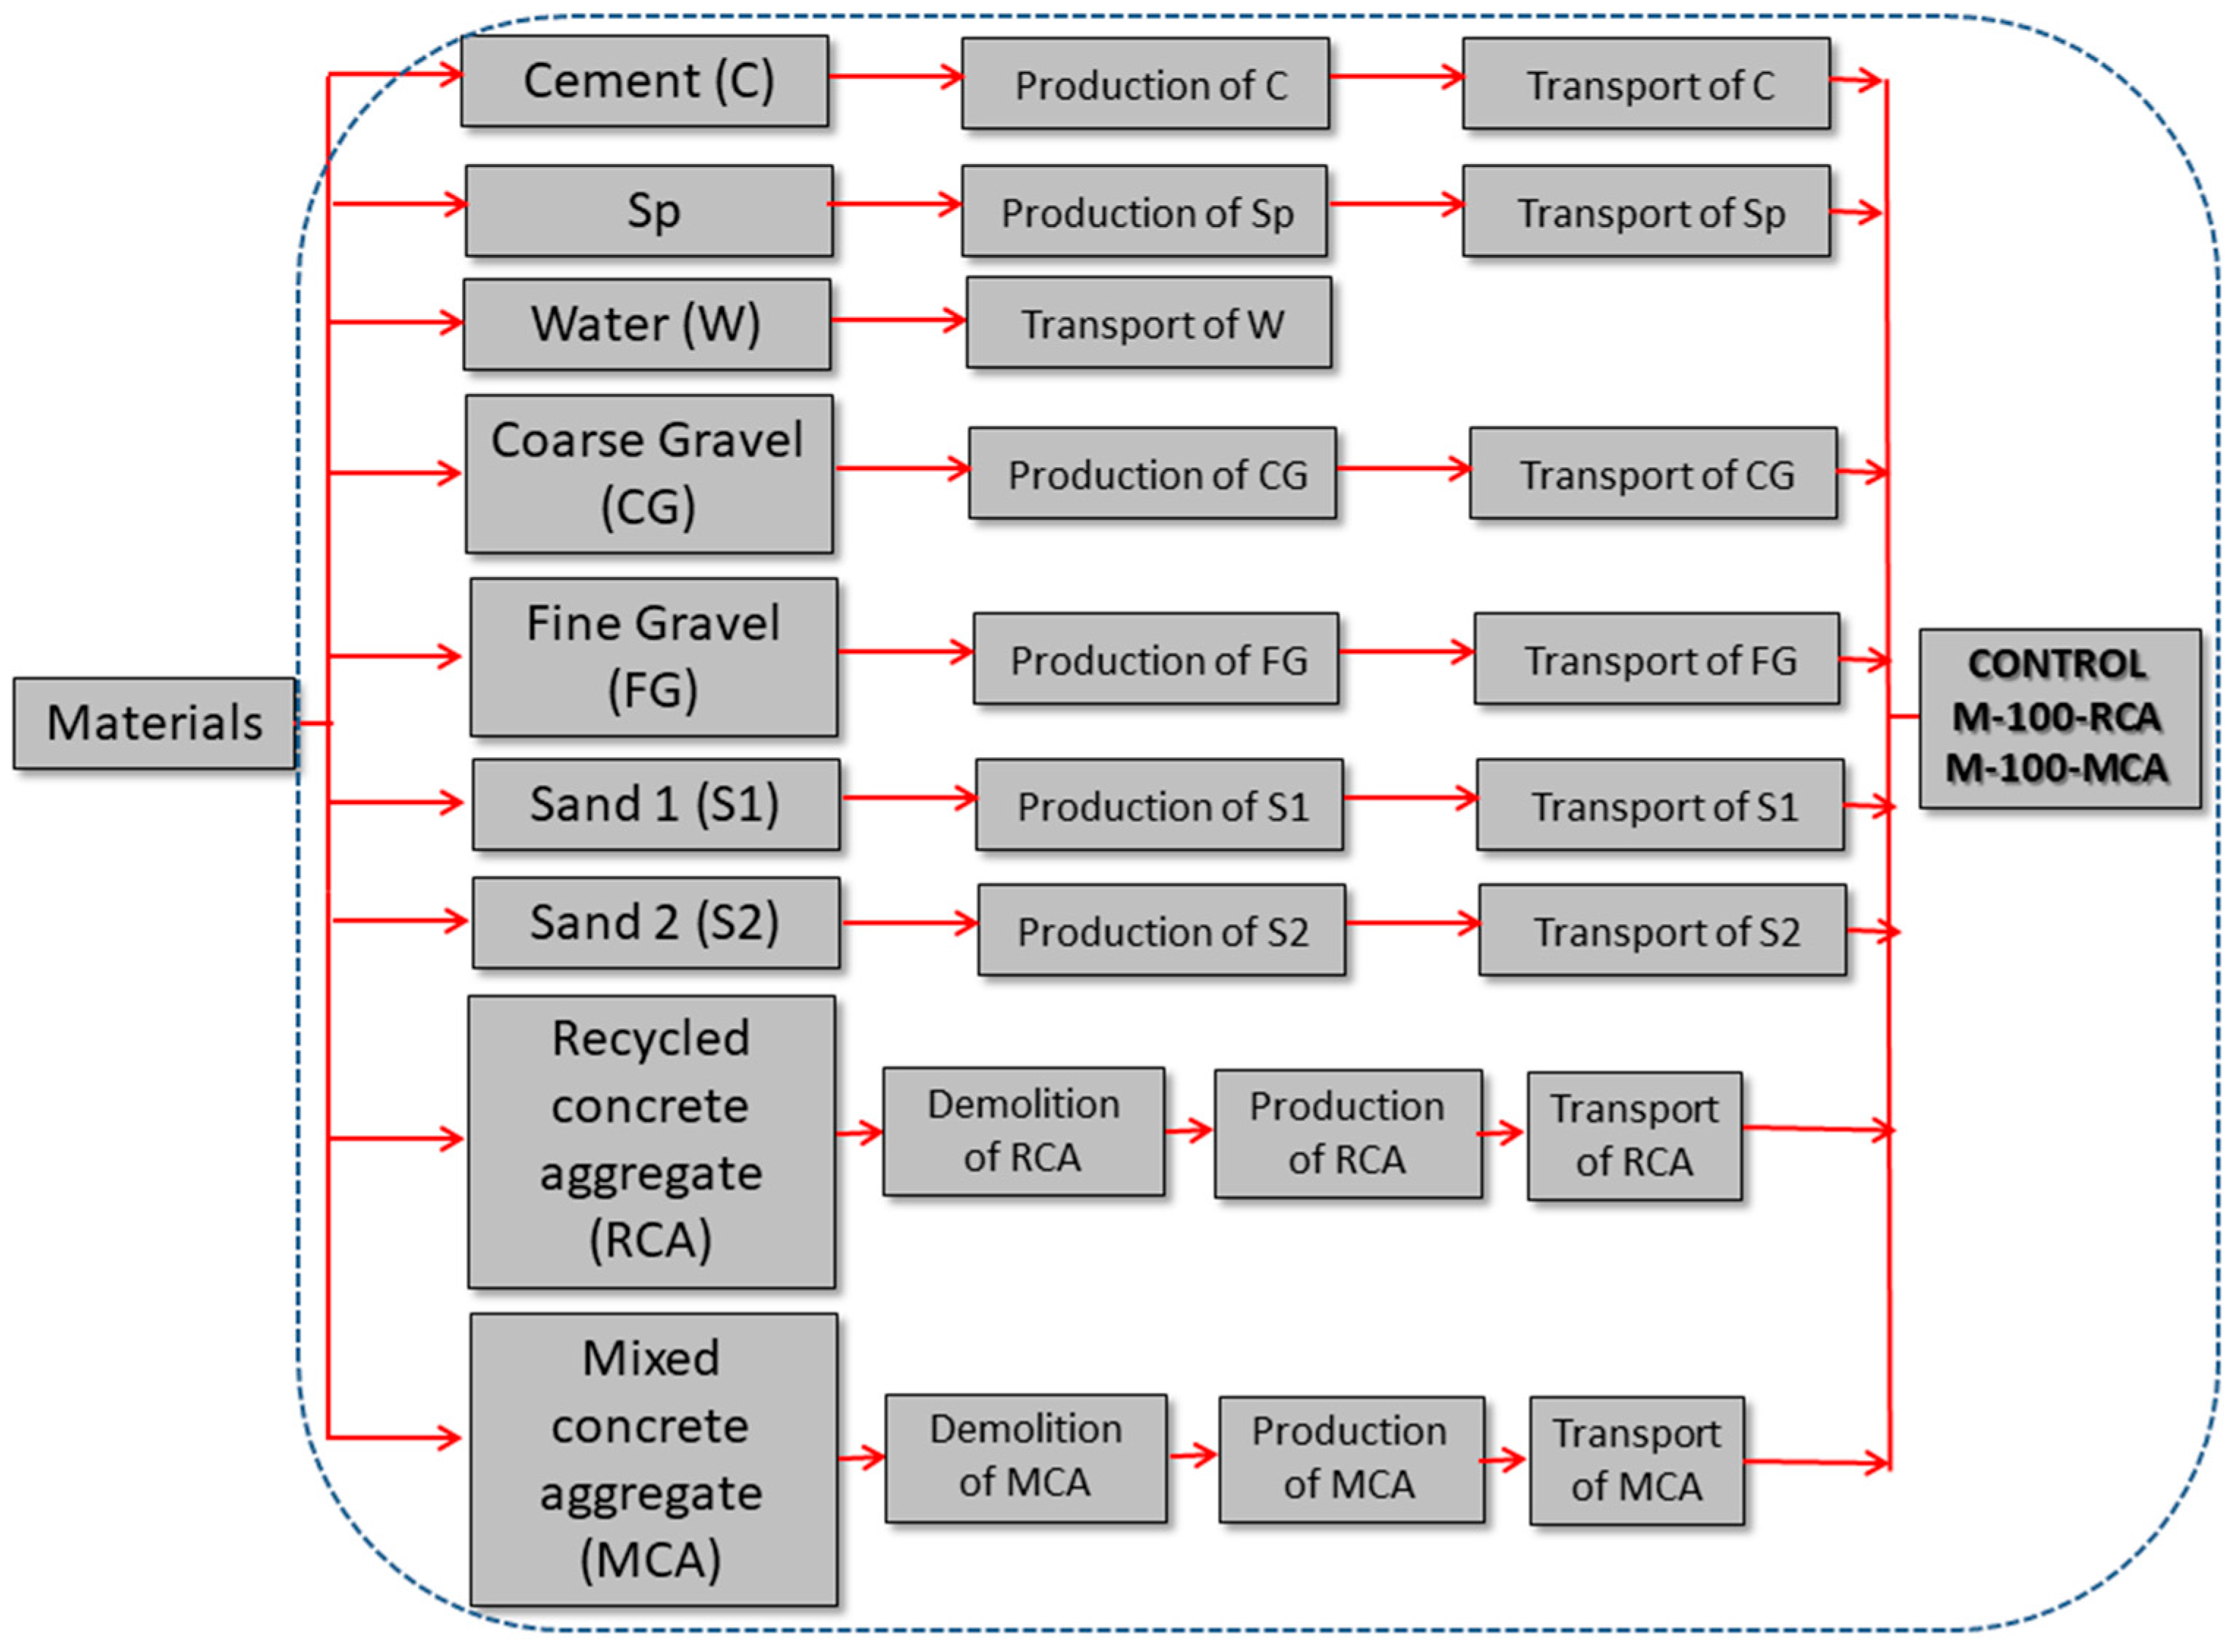
2.5. Carbon Footprint Assessment

The calculation of the carbon footprint was made for each mixture: CONTROL, M-100-RCA and M-100-MCA. As can be seen in Table 2, the main difference was the use of CG, FG, RAC or MAC. The CO2 emission system for the production of the different blends is presented in Figure 5.
The CO2 emissions: “CO2 emitted materials” from the materials shown in Figure 5 for 1 m3 of the mixture can be calculated according to Equation (8) [46].
C O 2   e m i t t e d   m a t e r i a l s   =   i = 1 n N i · I i
where n represents the number of raw materials used (see Figure 5); Ni is the weight of material used to make 1 m3 of concrete (kg); and Ii is the CO2 emission of material i per kilogram (kg CO2 eq/kg).
The CO2 emissions produced by the curing of the samples “CO2 emitted by curing”, both in the CCC and CO2CC environment can be calculated according to Equation (9) to make 1 m3 of concrete [52].
C O 2   e m i t t e d   b y   c u r i n g   =   E e l e · t   +   ( E C O 2 c u r · t ) 1   m 3
where Eele is the CO2 emission of electricity (kg CO2 eq/h) for conventional climatic chamber (CCC); ECO2-cur is the CO2 emission of electricity for CO2 climatic chamber (CO2CC) and t hours for curing (h). If the sample was cured in CCC, only the first term of Equation (9) was taken into account. If it was cured in CO2CC, only the second term was considered. The emission factor for the Spanish electricity grid was considered to be 200 g CO2/KWh [67]. The difference between Eele and ECO2-cur is that the CO2 emission factor of ECO2-cur is, albeit insignificant, slightly higher because it also considers the CO2 emission necessary to capture the CO2 used in the curing process. Normally, this capture is carried out in industries that generate CO2, usually using monoethanolamine (MEA) as a capture device, because of its many advantages [68,69]. Therefore, for this rough estimate, both Eele and ECO2-cur would be considered equal, although we want to clarify their differences. Finally, the total CO2 emissions would be the sum of Equations (8) and (9), as shown in Equation (10). These emission factors may differ for other investigations, as the efficiency of the equipment used may be different. However, they are usually very close to each other.
T o t a l   C O 2   e m i s s i o n s   =   C O 2   e m i t t e d   m a t e r i a l s   +   C O 2   e m i t t e d   b y   c u r i n g
Table 3 shows the carbon emission coefficient for the different materials (Ii) and for both curing chambers (Eele and ECO2-cur) [41,46,47,49,70,71,72]. Emissions from the mixing process were not taken into account. The Ii factor depends, among other factors, on the fineness of the material (if it is obtained by crushing) and whether it comes from the natural or recycled aggregate.

3. Results and Discussion
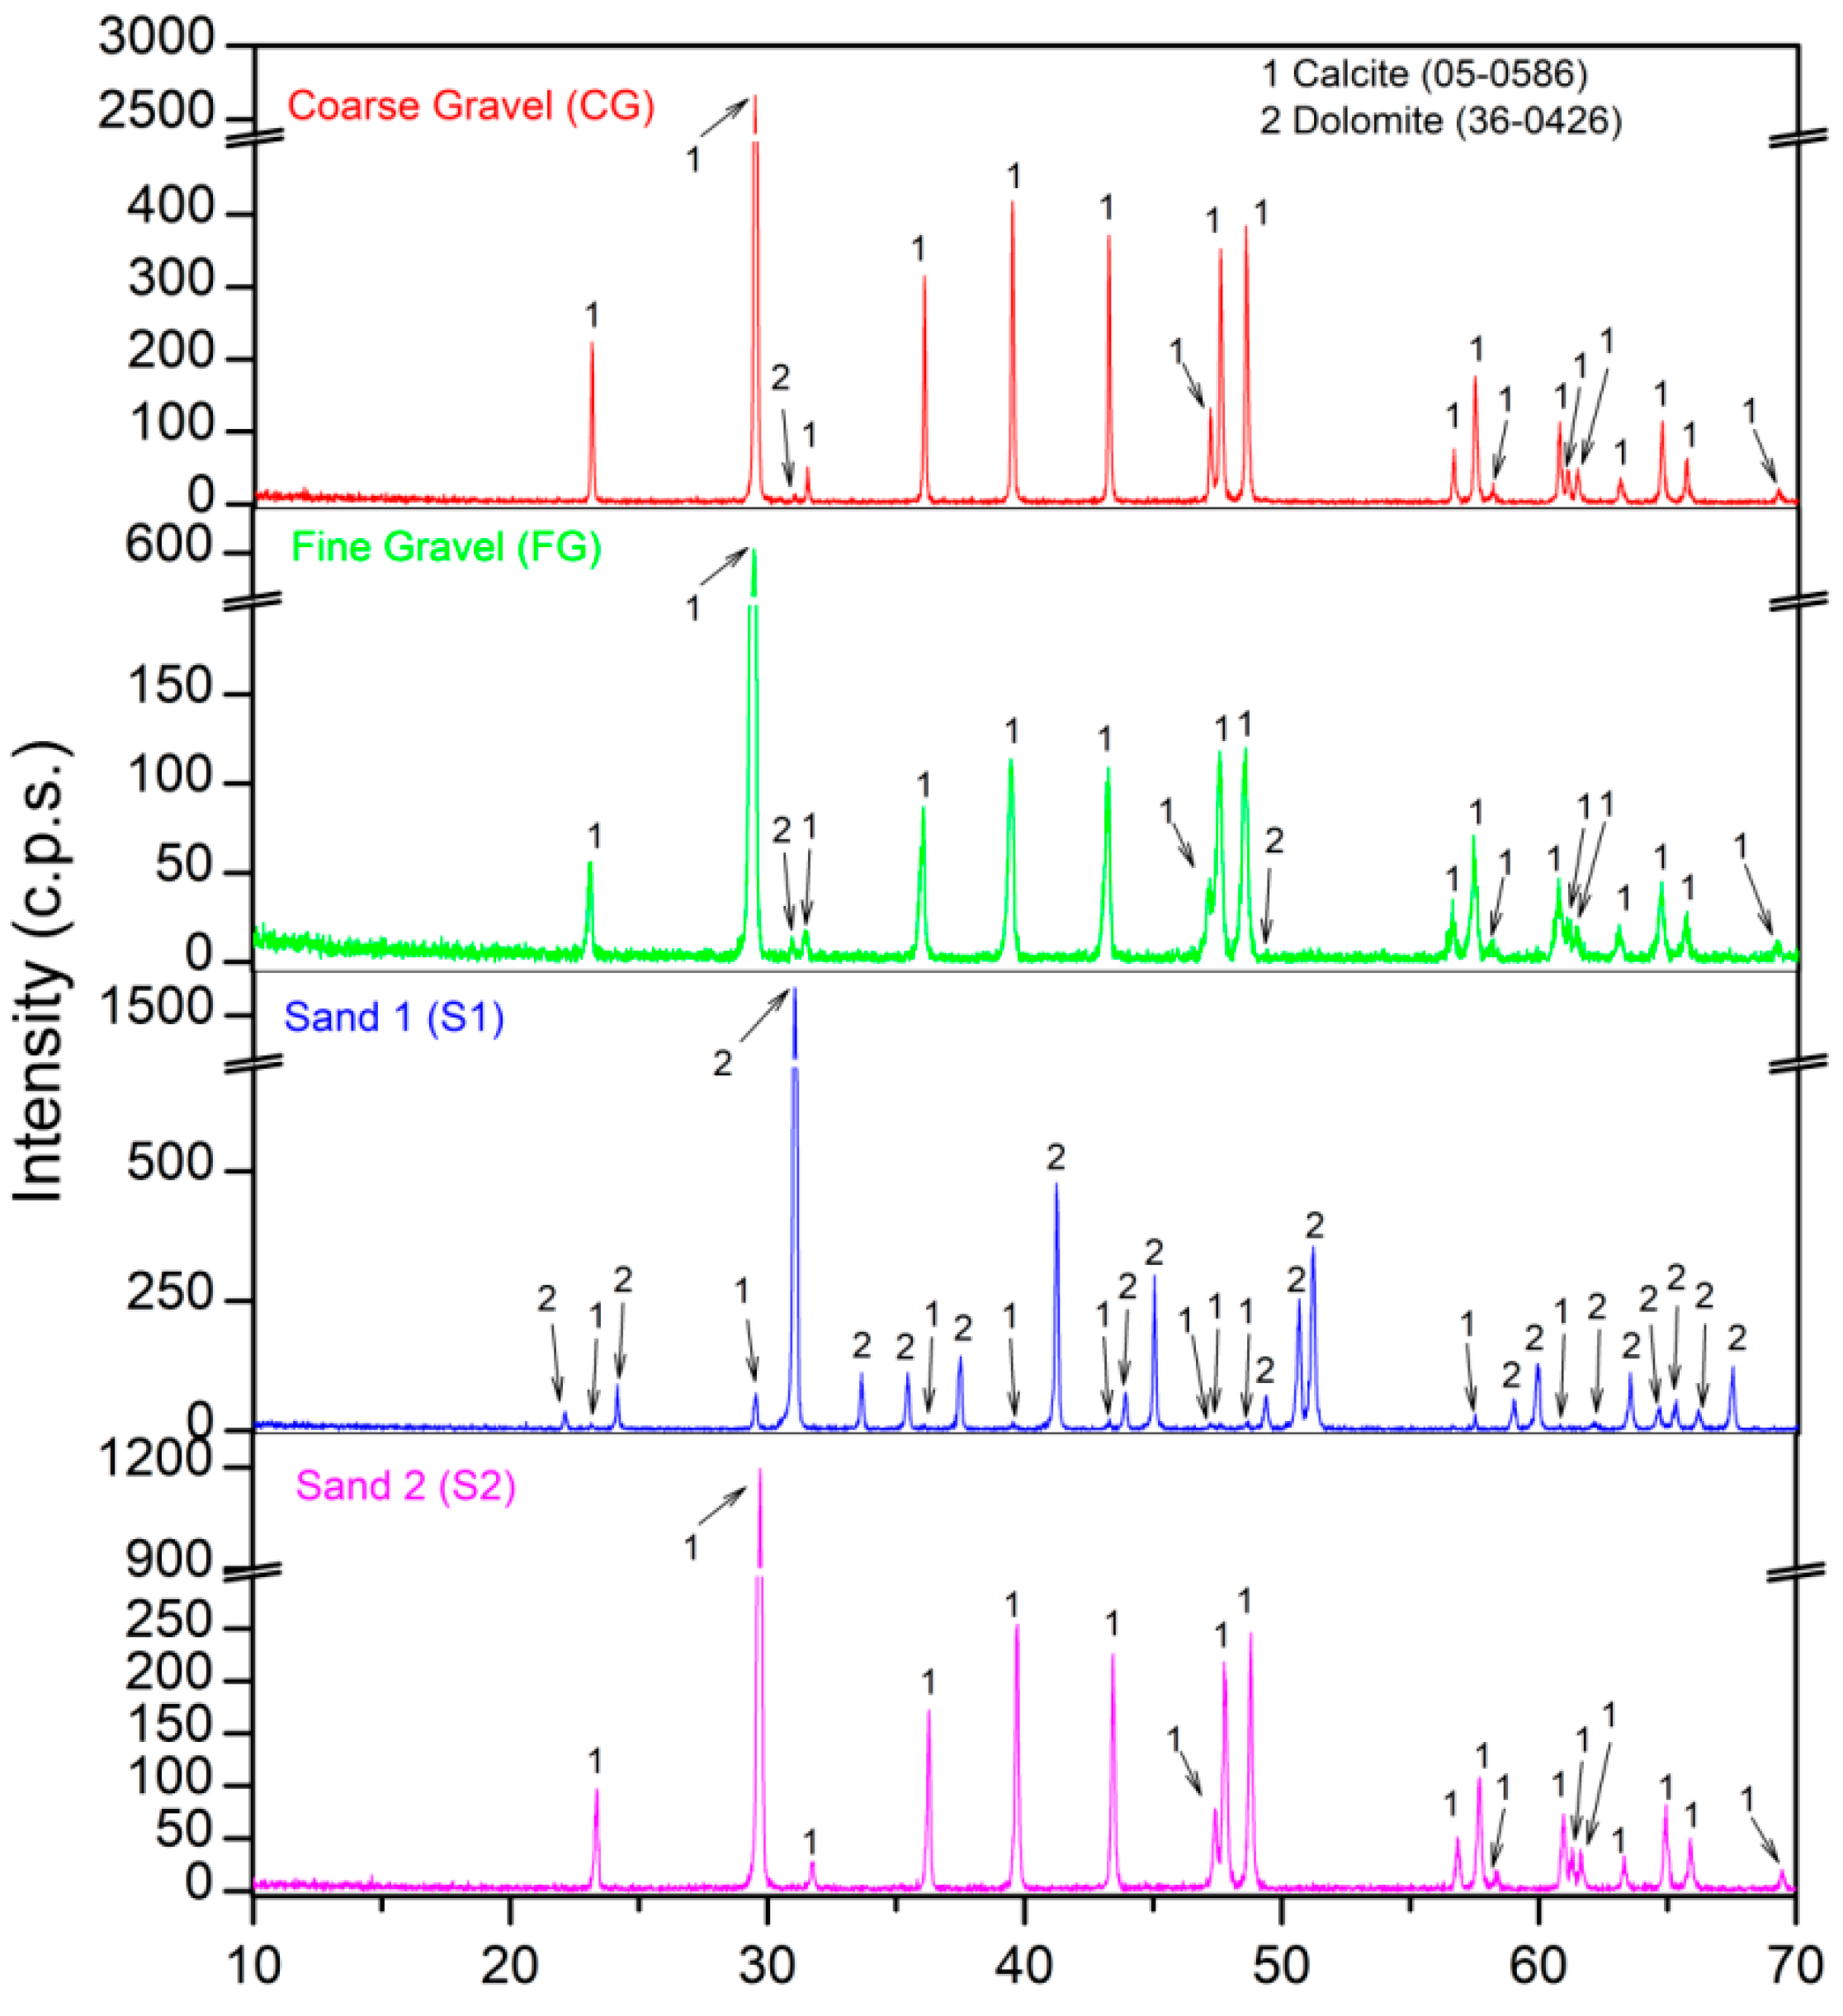
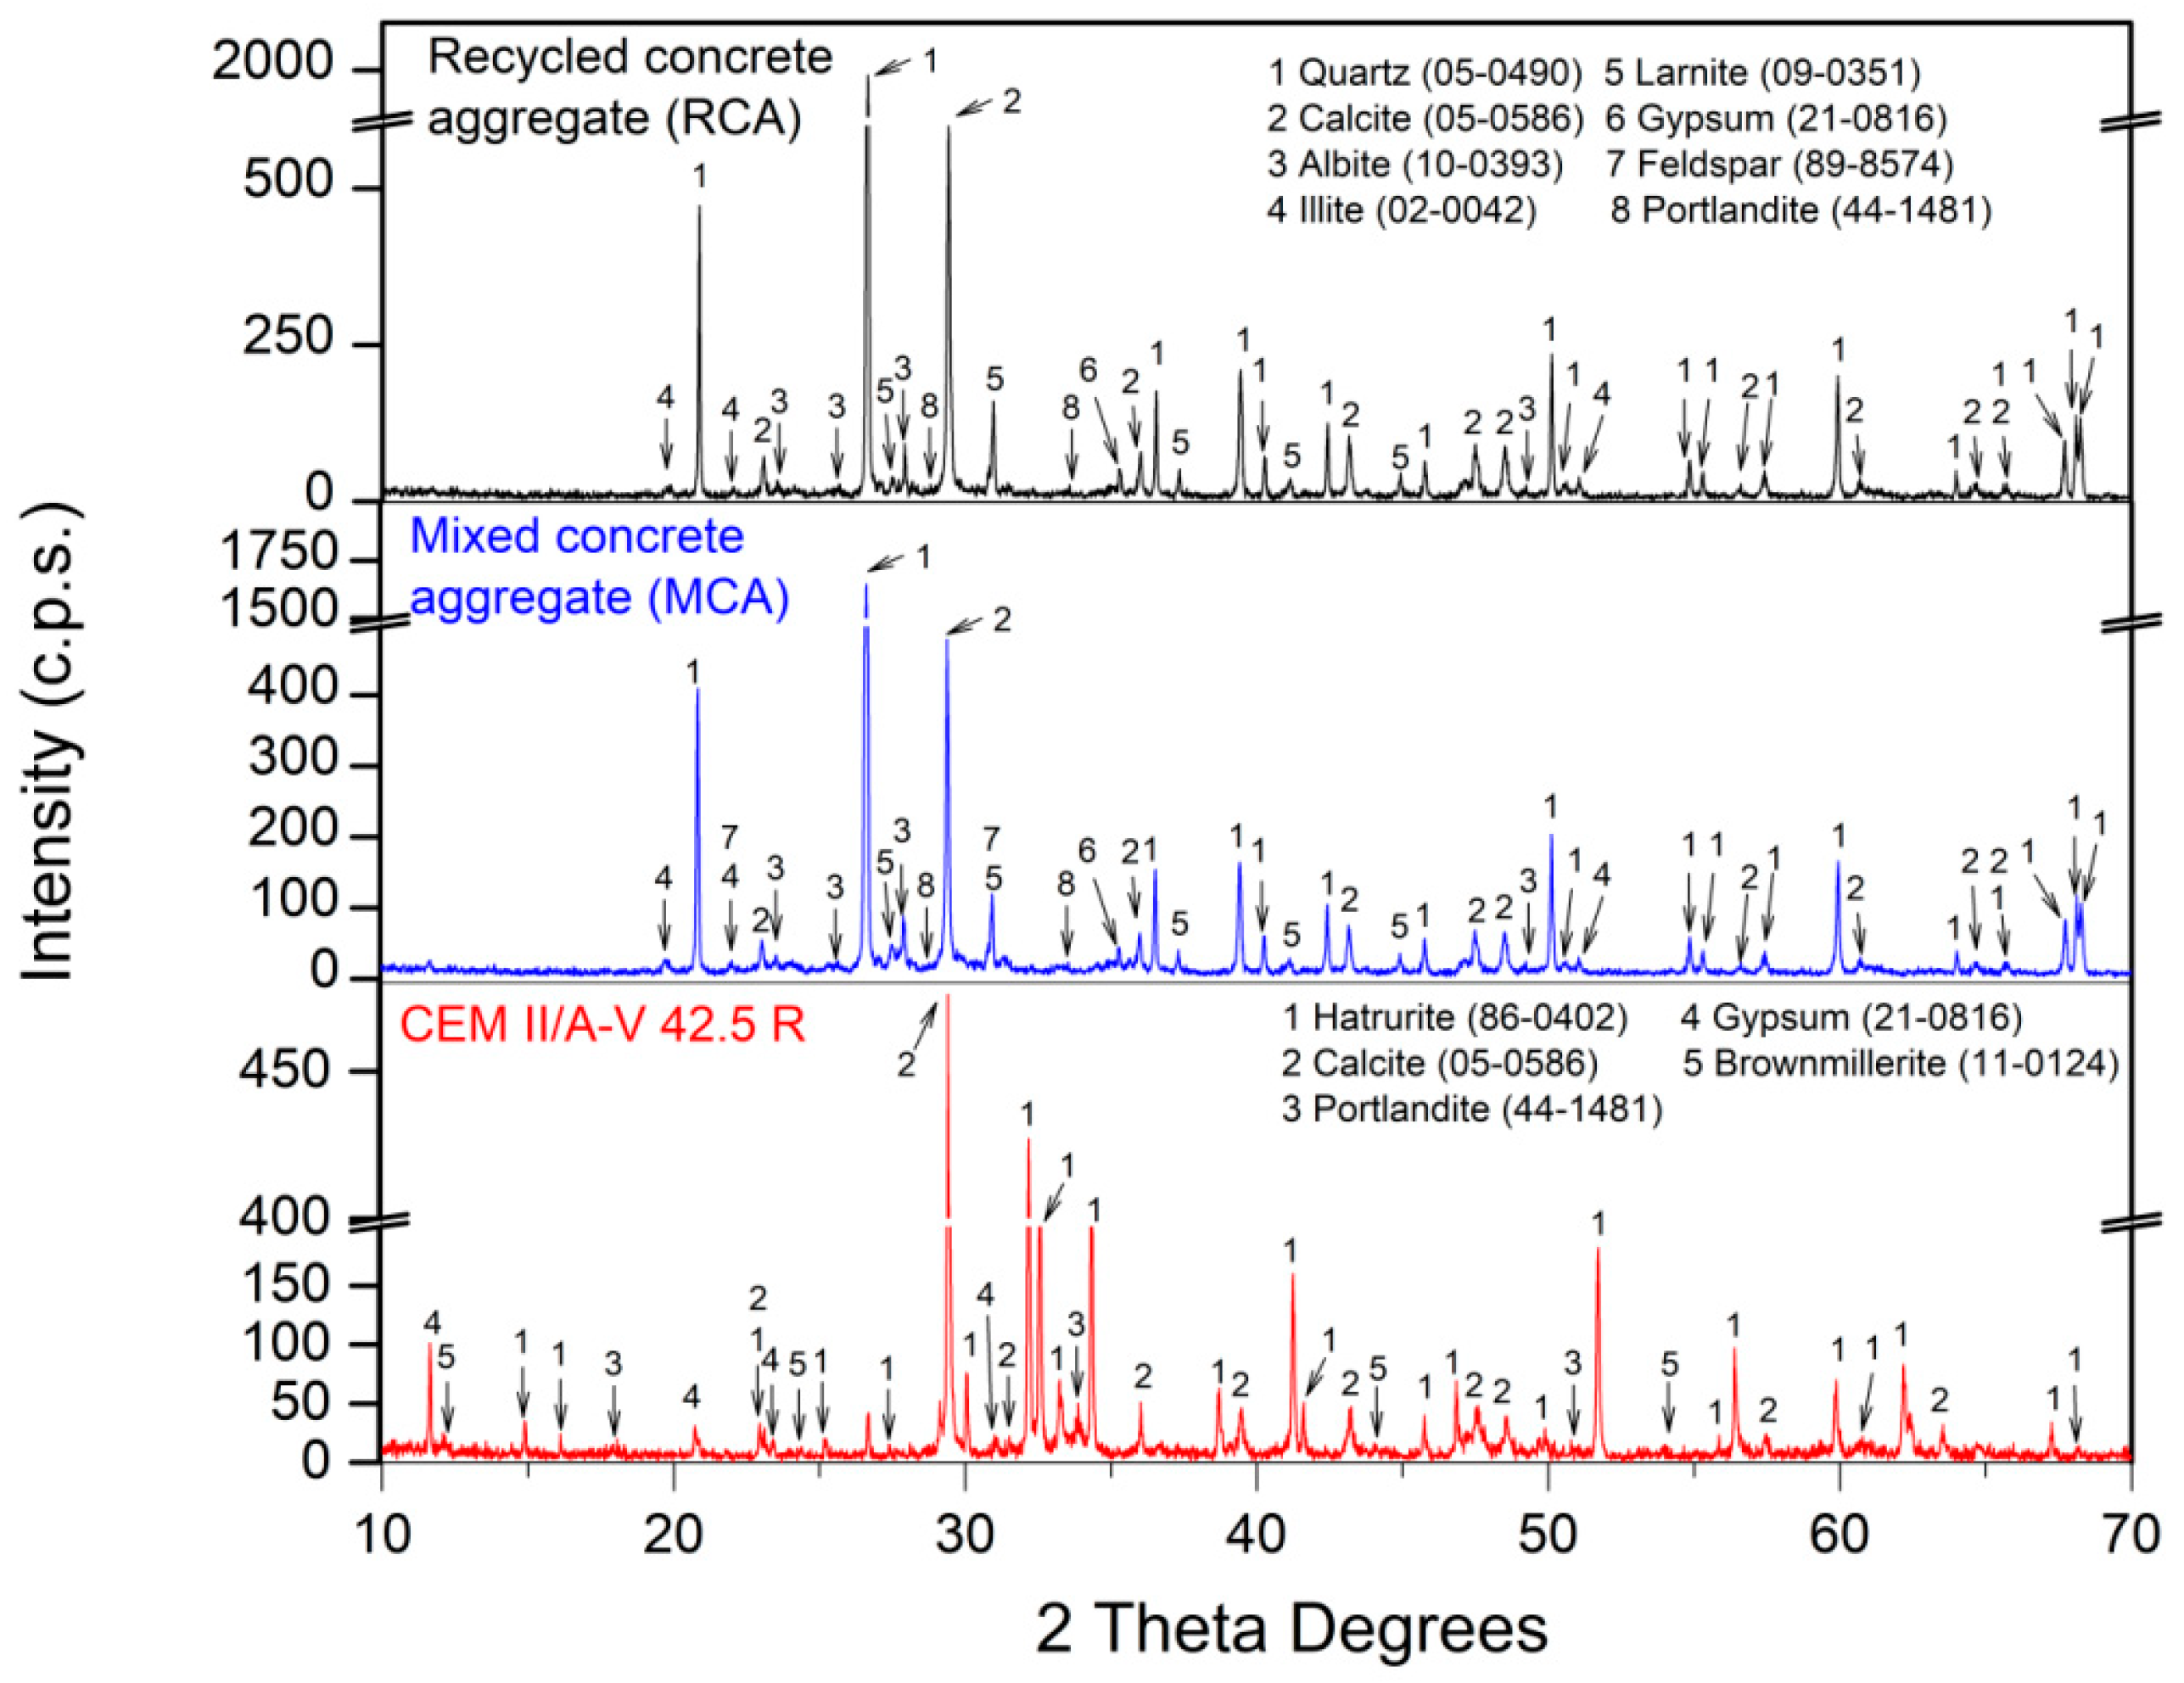
3.1. Raw Materials

Table 4 presents the chemical composition. Figure 6 and Figure 7 show the mineralogical composition of all the raw materials used in this research. The fundamental oxide of both gravels (CG and FG) was CaO. The main phase for CG and FG was calcite (CaCO3) (05-0586) [60]. A very small intensity of dolomite (CaMg(CO3)2) (36-0426) [60] was also found in both gravels. For S1, the amount of CaO decreased while MgO increased, which was reflected in XRD (Figure 6), where the dolomite phase had a higher intensity than that of CG and FG. For S2, again, the major oxide was CaO and, in this case, only the calcite phase was found in XRD.
For RCA and MCA, the chemical composition was very similar. Slightly higher SiO2 and Al2O3 contents were found in MCA, which might be related to the content of ceramic brick pieces in MCA [73] and could improve the pozzolanic reactions in the resulting concrete [74]. The main phases for RCA and MCA were quartz (SiO2) (05-0490) [60] and calcite (CaCO3) (05-0586) [60]. Other minority phases were also found: albite (Na(Si3Al)O8 (10-0393) [60]; illite ((Na,K)Al2(Si3AlO10)(OH)2) (02-0042) [60]; larnite (Ca2SiO4) (09-0351) [60], gypsum (CaSO4·H2O) (21-0816) [60] and portlandite (Ca(OH)2) (44-1481) [60]. The portlandite phase found in RCA and MCA using X-ray diffraction is a “potential” CO2 sink according to Equation (3), which may be due to the fact that both RCA and MCA had been in storage for a very short time and were “fresh”. The feldspar phase (NaSiAl3O8) [60] was found in MCA and not in RCA, which may have come from the pieces of ceramic brick that present MCA [75].
TGA and DTA for the natural aggregates used in this study are presented in Figure 8. For CG and FG, the main mass loss started at approximately 700 °C. From this range, the decomposition of calcite started, according to Equation (11), which was the main phase found in XRD. The low dolomite intensity found in the gravels was not detected by TGA/DTA. Similar results were obtained in other research studies [12,30,76].
C a C O 3 C O 2 + C a O
However, for S1, a change in DTA was observed, although it did not start to lose mass noticeably until 700 °C, because dolomite was the main phase found in S1. The thermal decomposition of dolomite includes two stages [77,78]. The first stage (from 700 to 780 °C) is shown in Equation (12) and the second stage (from 780 to 1000 °C) in Equation (11).
C a M g ( C O 3 ) 2 C a C O 3 + M g O + C O 2
A very similar result was found for S2 as for FG and CG. This confirms the purity of calcite found for S2.
TGA and DTA for RCA, MCA and cement used in this study are presented in Figure 9. For RCA and MCA, the TGA/DTA result was very similar: (i) up to 105 °C of the physically absorbed water was lost [30]; (ii) from 105 to 380 °C, the loss of hydrated calcium silicates and aluminates occurred (CSH and CASH, respectively) [79,80]; (iii) from 380 to 480 °C, an endothermic peak (in DTA) related to the loss of portlandite was found which was identified in XRD (Figure 7) [23,81] and (iv) from 640 to 1000 °C, decomposition of calcium carbonate occurs, according to Equation (11) [4,82]. For cement, a typical result was found, with ranges of weight loss already extensively described in other research studies [5,12,30].

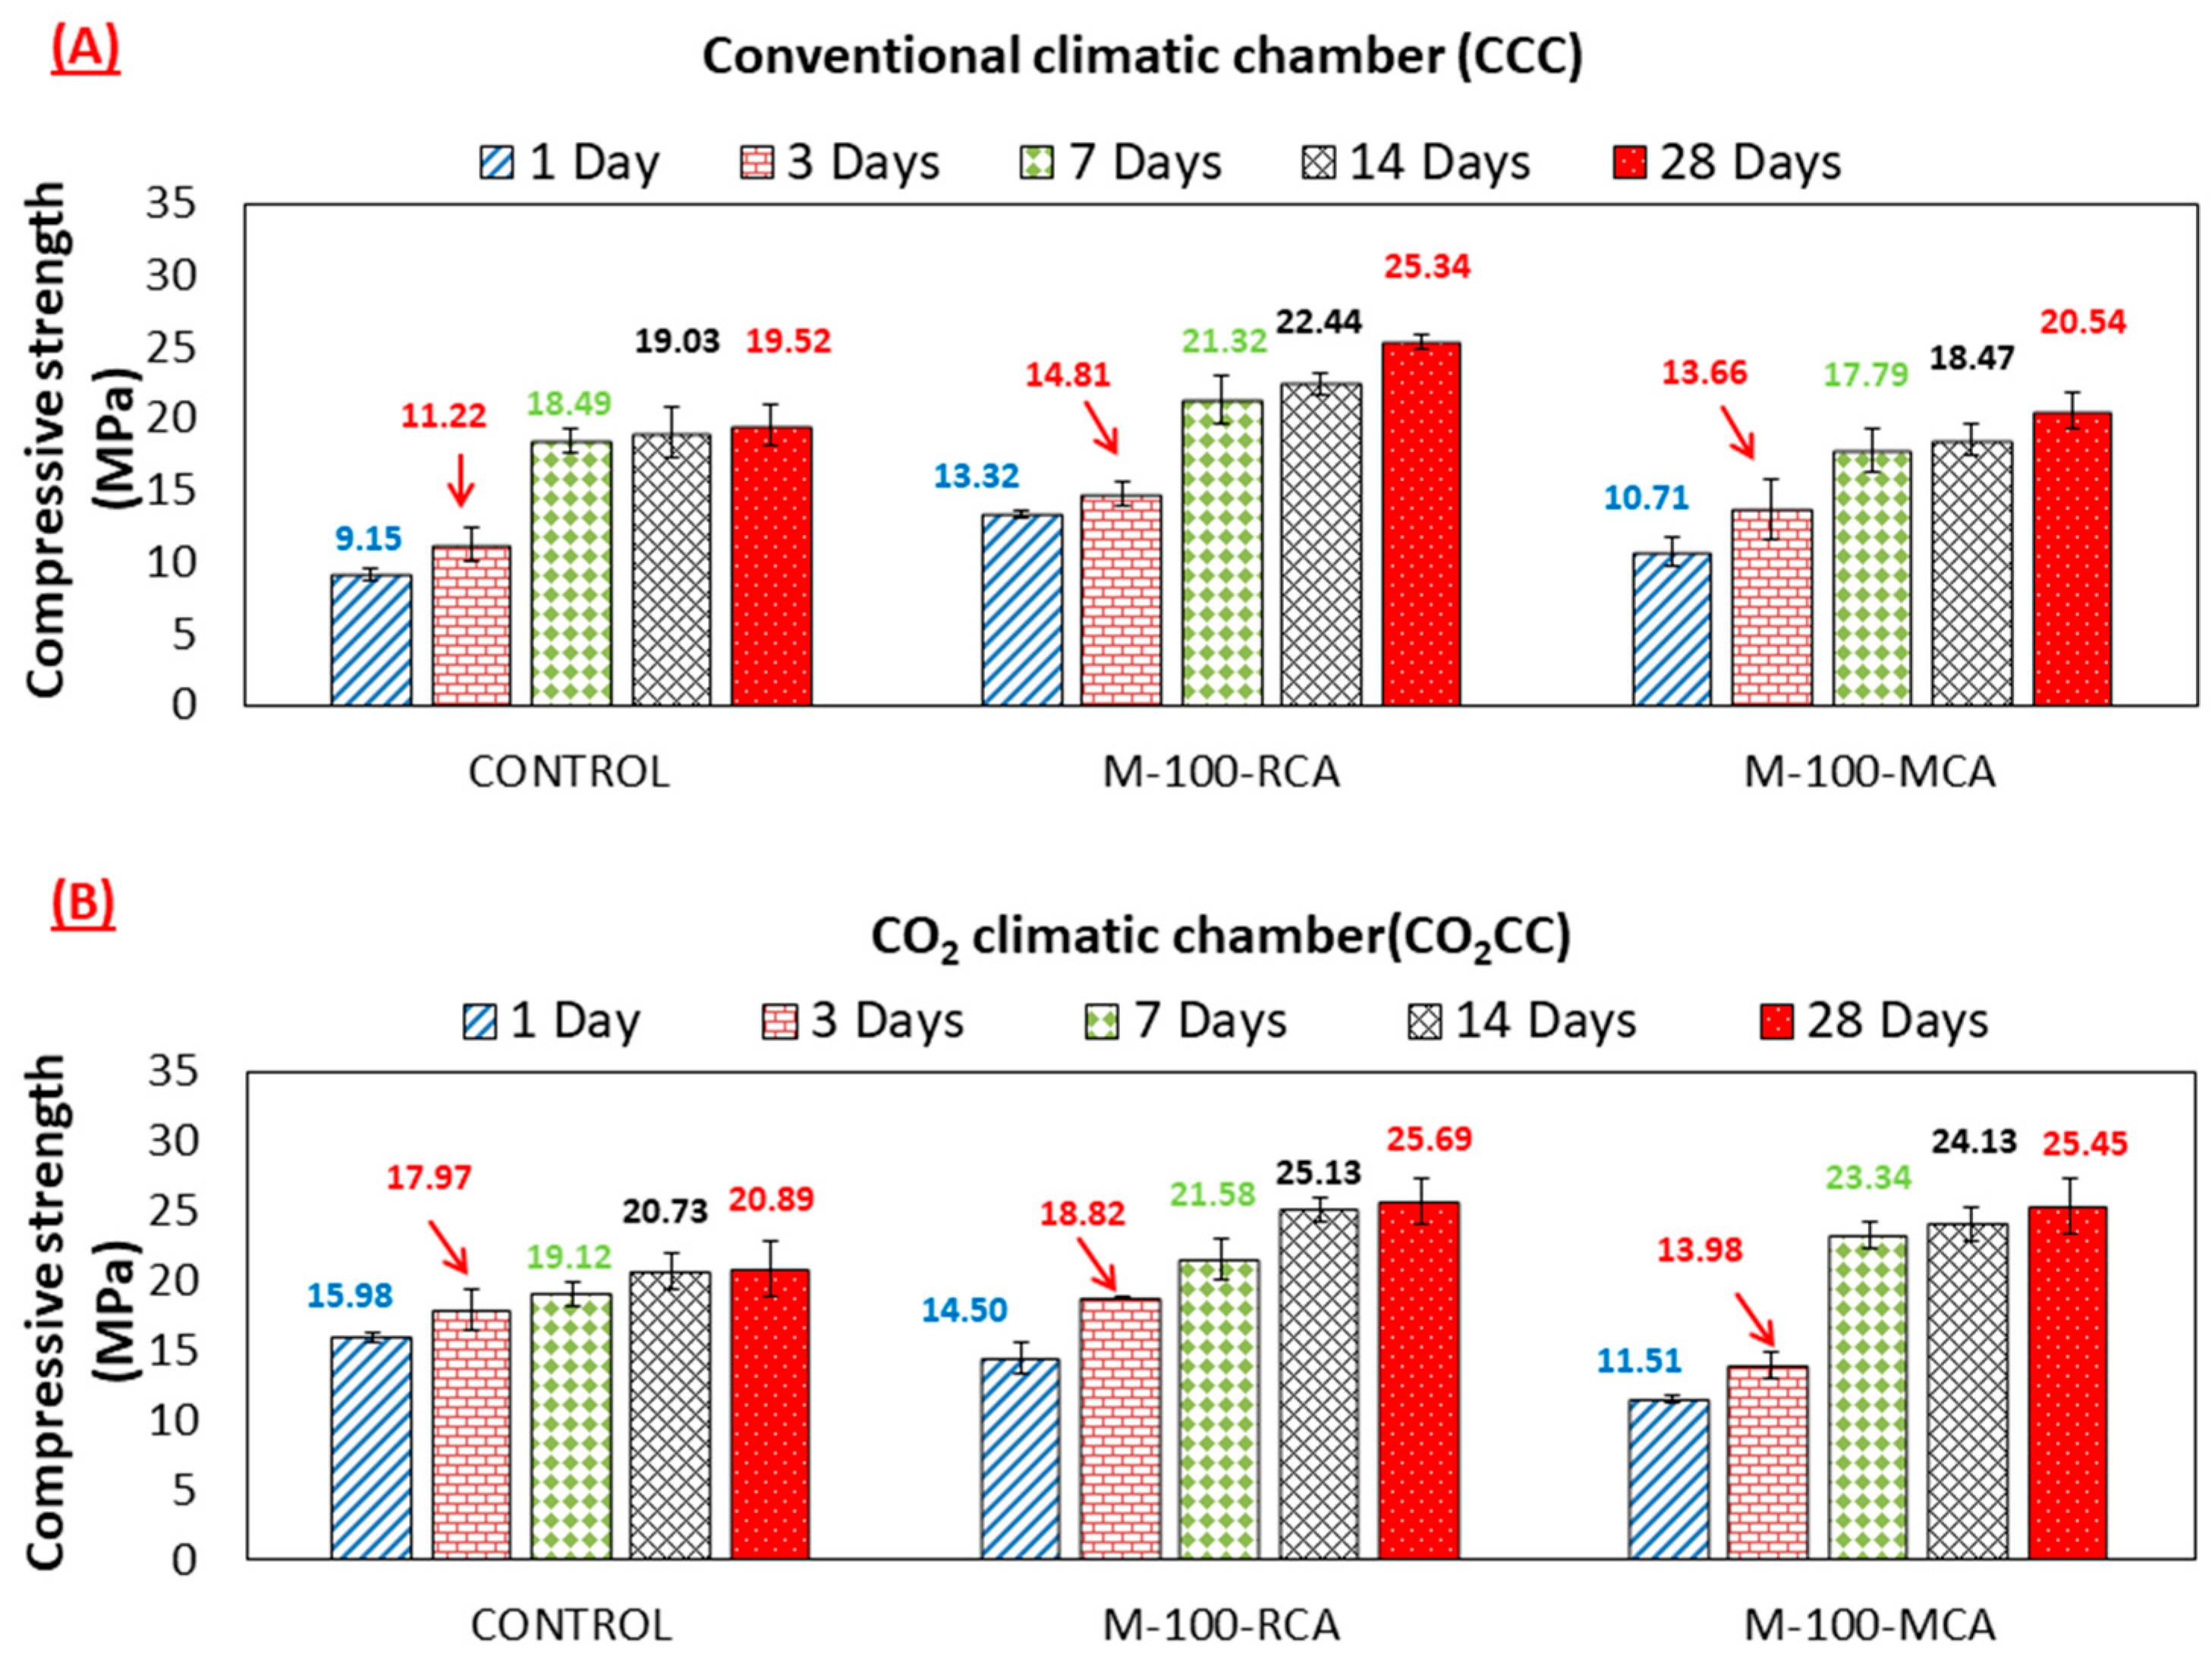
3.2. Compressive Strength

Figure 10 shows the compressive strength of all the mixes studied, under both curing environments for 1, 3, 7, 14 and 28 days of age. The substitution of CG and FG for RCA using CCC (i.e., CONTROL vs. M-100-RCA) improved the compressive strength at all curing ages. Similarly, the substitution of CG and FG by MCA using CCC (i.e., CONTROL vs. M-100-MCA) also improved the compressive strength at all curing ages. These increases compared to CONTROL for the age of 28 days were 29.81 and 5.22% for M-100-RCA and M-100-MCA, respectively. While this is a very good result, it is unusual. The compressive strength of recycled aggregate was lower than conventional concrete [28,83]. There are many factors that influence the relationship between compressive strength and the use of recycled aggregates [84]: (a) recycled aggregate replacement level; (b) recycled aggregate size; (c) quality of recycled aggregate; (d) influence of the mixing procedure; (e) environmental conditions; (f) chemical admixtures and (g) additions incorporation. In this case, the use of very similar sizes between the FG and CG. Both recycled aggregates were very important factors (see Figure 3, factor (b)) [85], as well as the use of saturated aggregate before mixing (see Table 2, factor (d)) [86]. The quality of the recycled aggregate is also very important (factor (c)), as the portlandite and larnite phases found (see Figure 7 and Figure 9) can lead to improvements in compressive strength [87]. This indicates the feasibility of replacing CG and FG with RCA and MCA, which maximises the circular economy concept and minimises the use of non-renewable natural resources.
Curing with a CO2 climatic chamber (CO2CC) improved compressive strength at all ages, compared to the conventional climatic chamber (CCC). This result, which is very common, is recognised in most research [25,39,88] and is caused by a “densification” of the sample due to carbonation according to Equations (1)–(5) [21,89]. For the control mixture, 7 days of curing in CO2CC was similar to 28 days of curing in CCC. For the M-100-RCA mixture, 14 days of curing in CO2CC was similar to 28 days of curing in CCC. For the M-100-MCA mixture 7 days of curing in CO2CC improved by 13.53% the compressive strength obtained for 28 days of curing in CCC. These results highlight the difficulty of making comparisons between CO2CC and CCC curing for compressive strength purposes, as it depends on the nature of each mix. Several authors have already indicated that the mechanisms of natural and accelerated carbonation are different [23,90]. It indicates that the effect of curing in CO2 after 14 days was insignificant, it being possible that from this age the samples were fully carbonated (perhaps it could be indicated for 7 days, especially for the control and M-100-MCA mixture). With the mixtures studied, it is not necessary to cure for up to 28 days in CO2CC. Rather, 7 or 14 days are sufficient. The results obtained also indicated that CO2CC can be used in a non-reinforced precast plant, increasing productivity and decreasing the curing time.

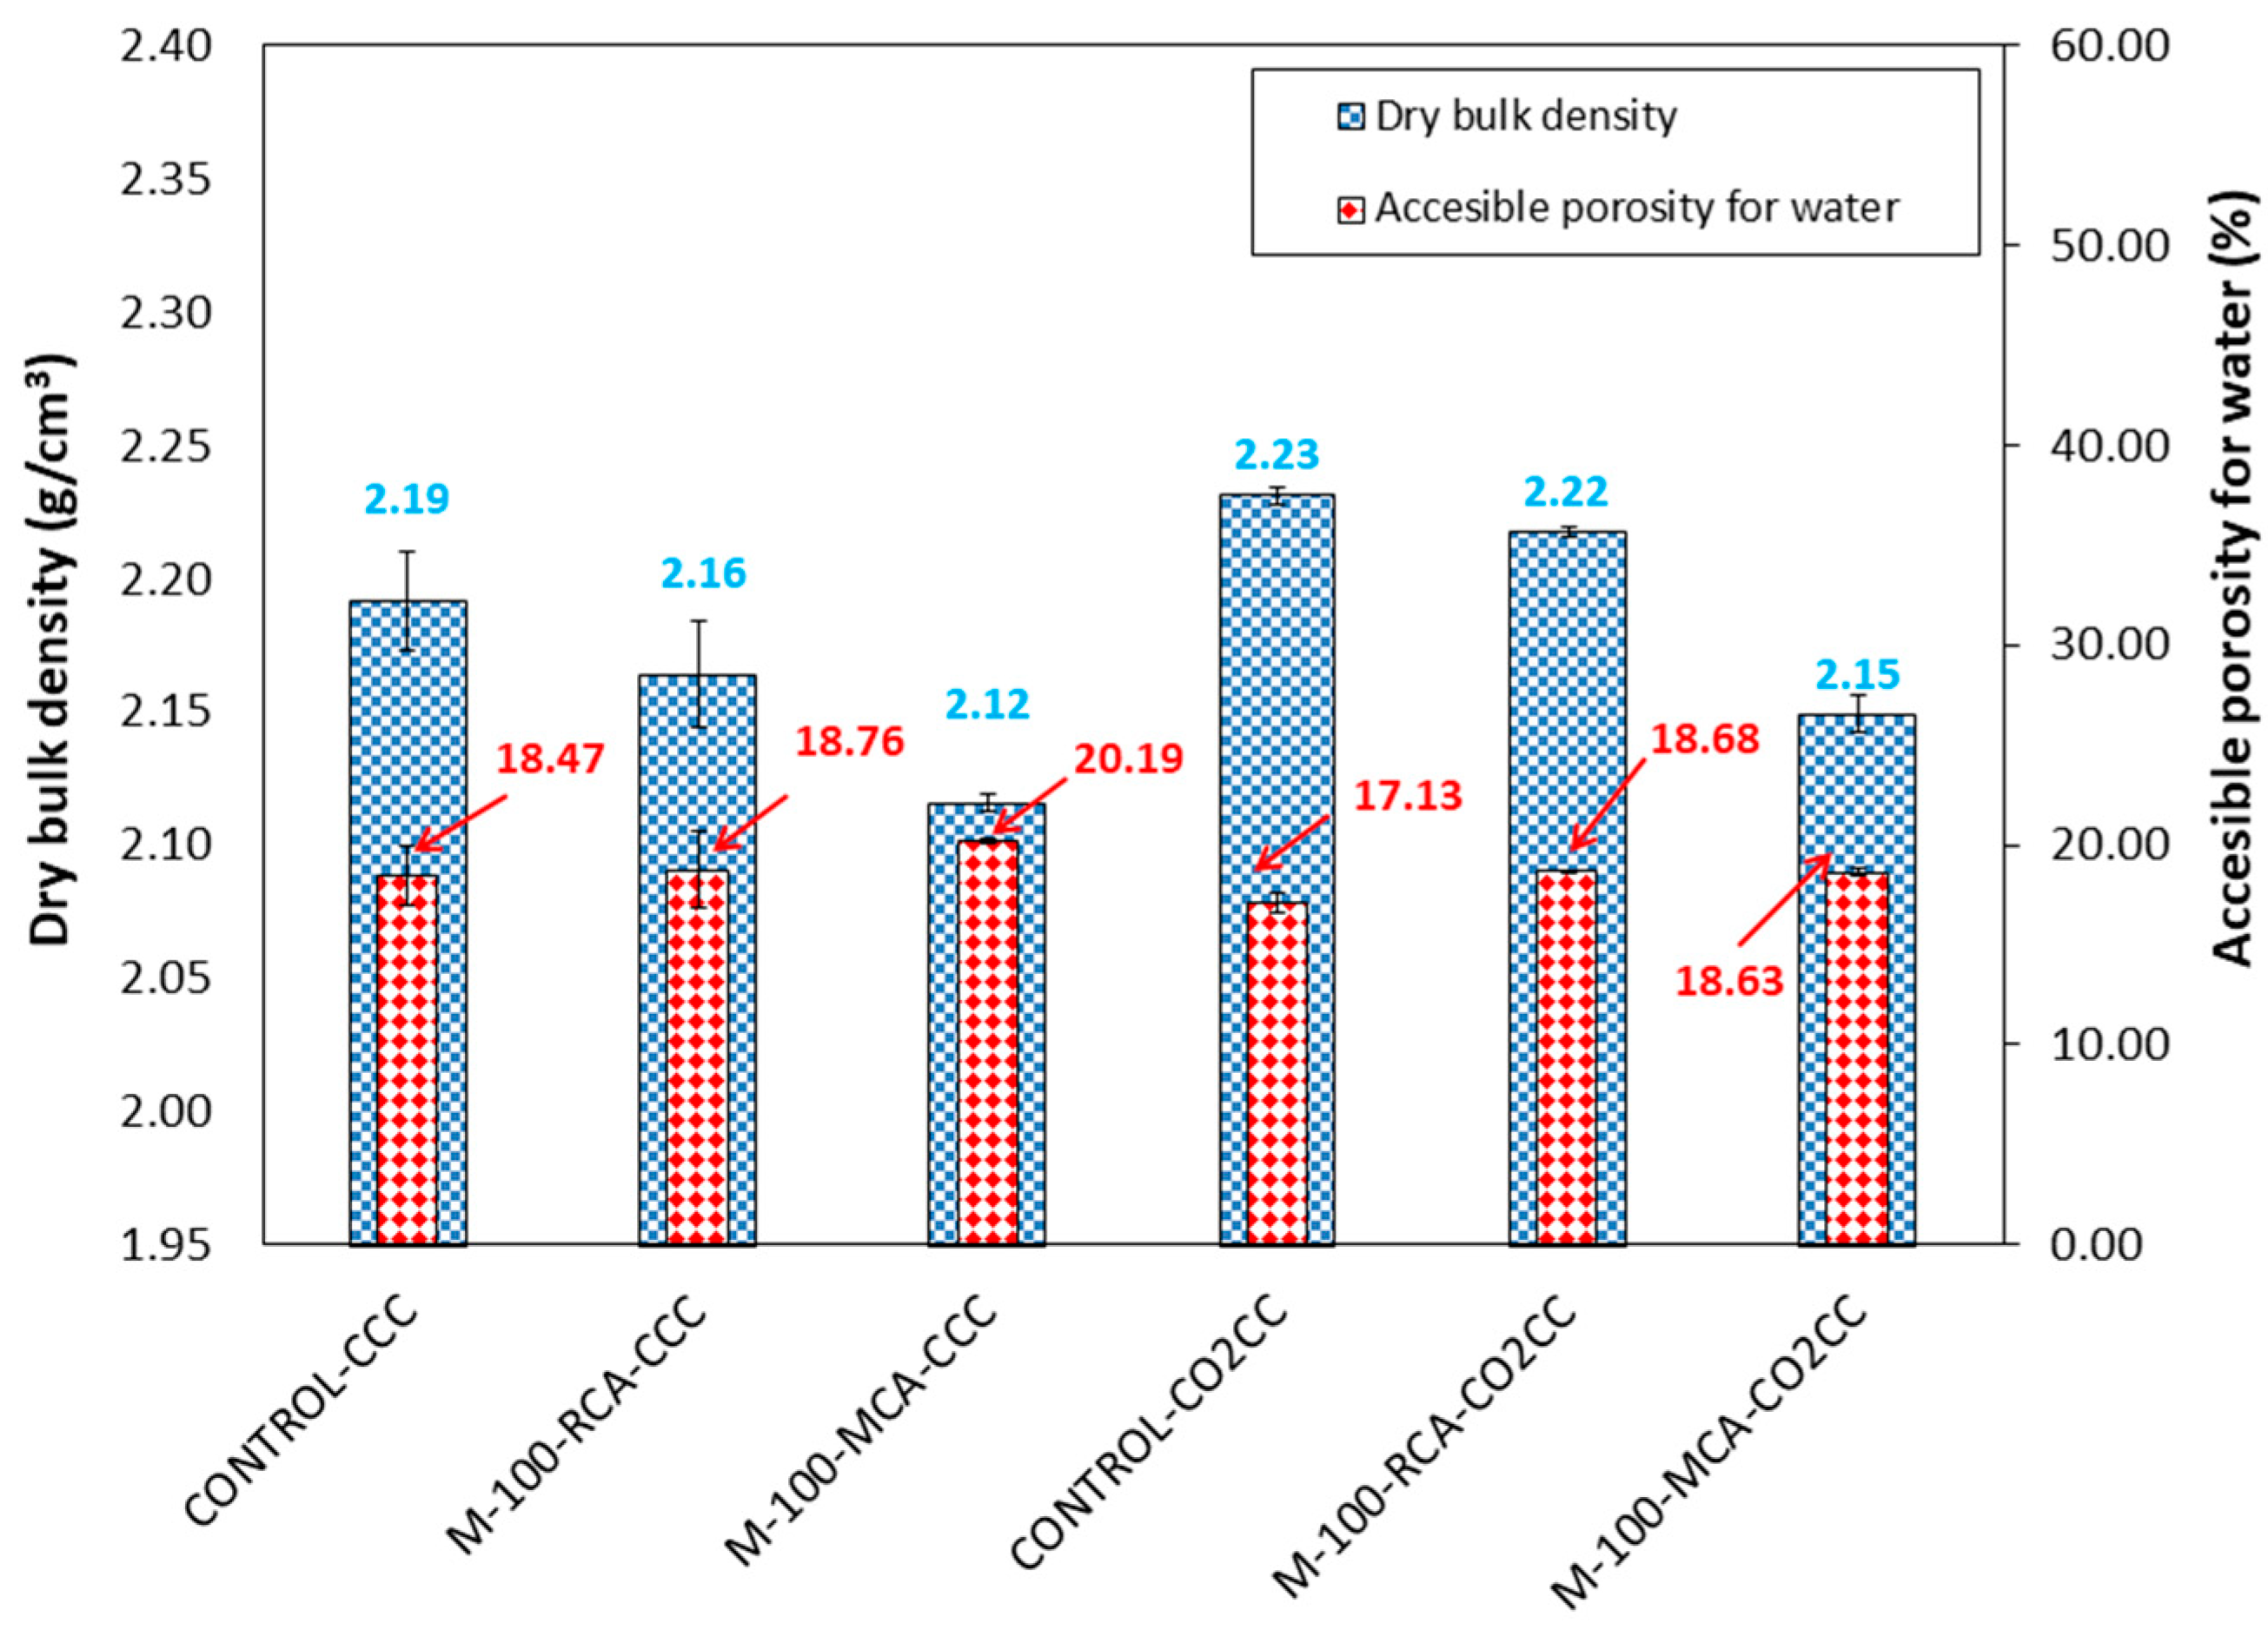
3.3. Dry Bulk Density and Accessible Porosity for Water

Figure 11 shows dry bulk density and accessible porosity for water at 28 days of curing for CCC and CO2CC. The substitution of CG and FG for RCA and MCA decreased dry bulk density and increased accessible porosity for water for all the mixtures and under both curing environments. This was due to the lower dry bulk density and higher water absorption of RCA and MCA versus CG and FG (Table 1), mainly due to the cementitious mortar adhered to RCA and MCA surface having greater porosity than natural aggregates [91,92].
Curing in CO2 (CO2CC) increased the dry bulk density and decreased accessible porosity for water, which is in accordance with the improvement in compressive strength found (Figure 10) and was due to the pore-filling effect produced by the carbonation, in accordance with other studies [12,38,93,94].

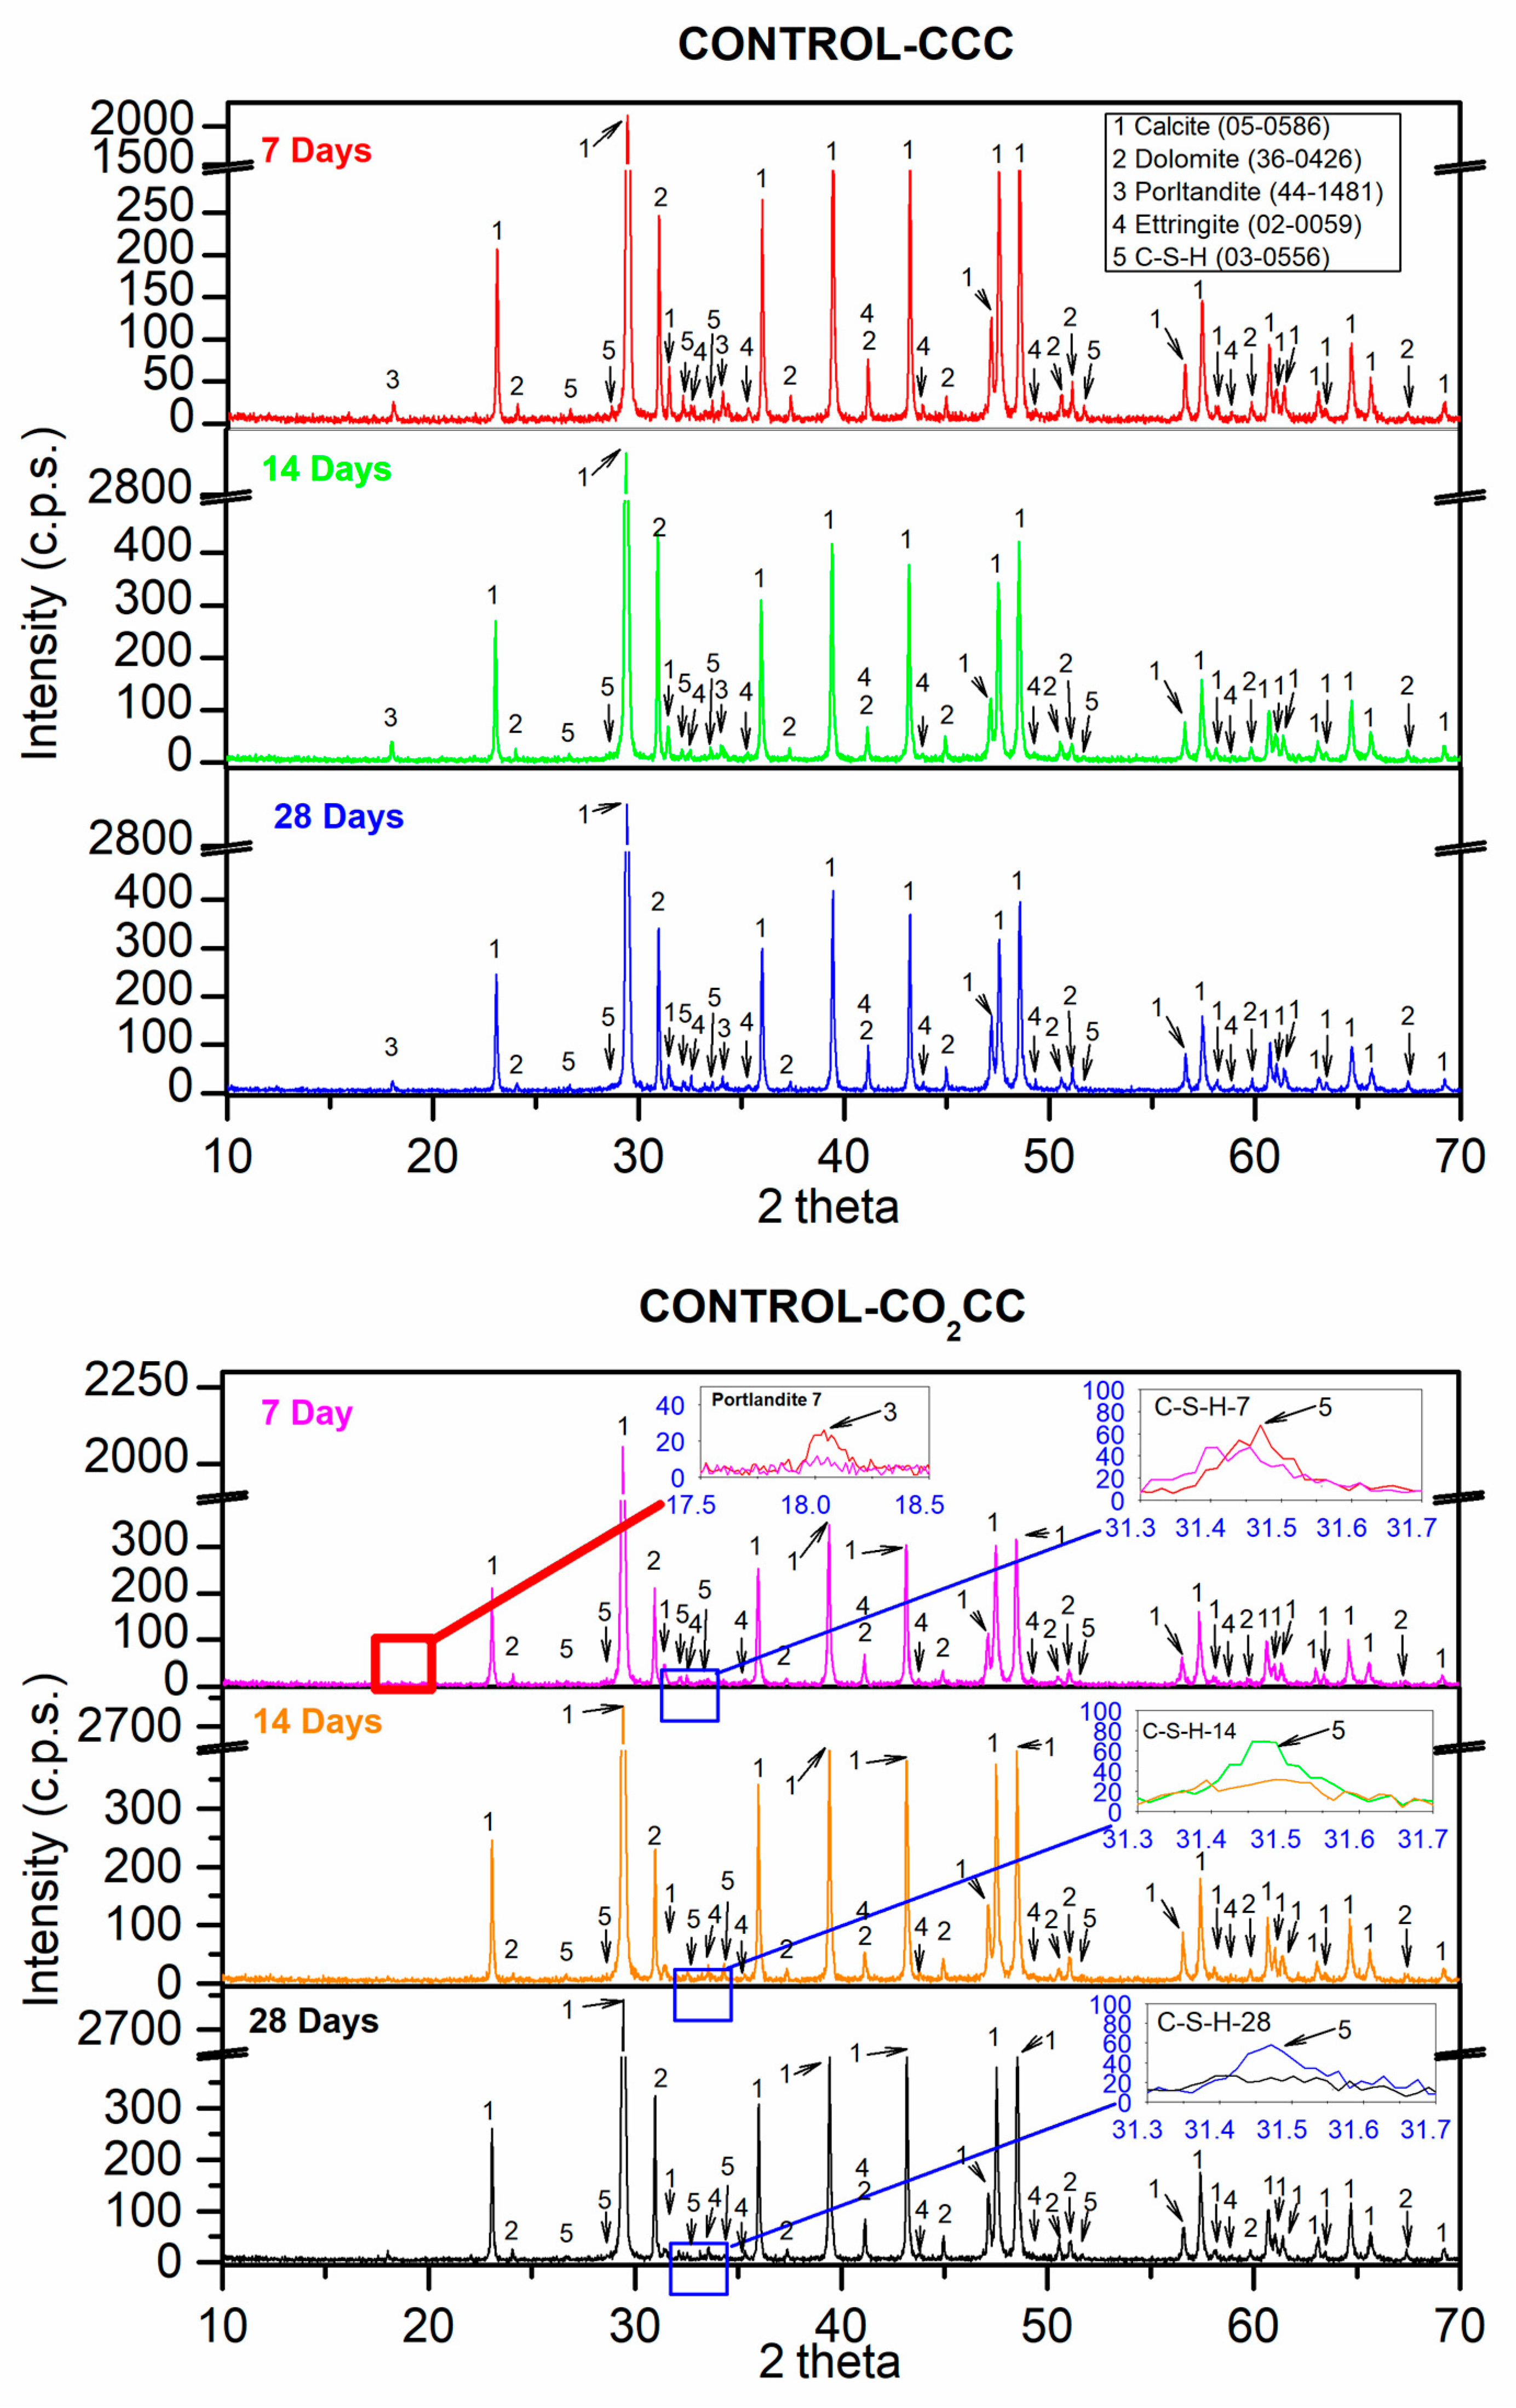
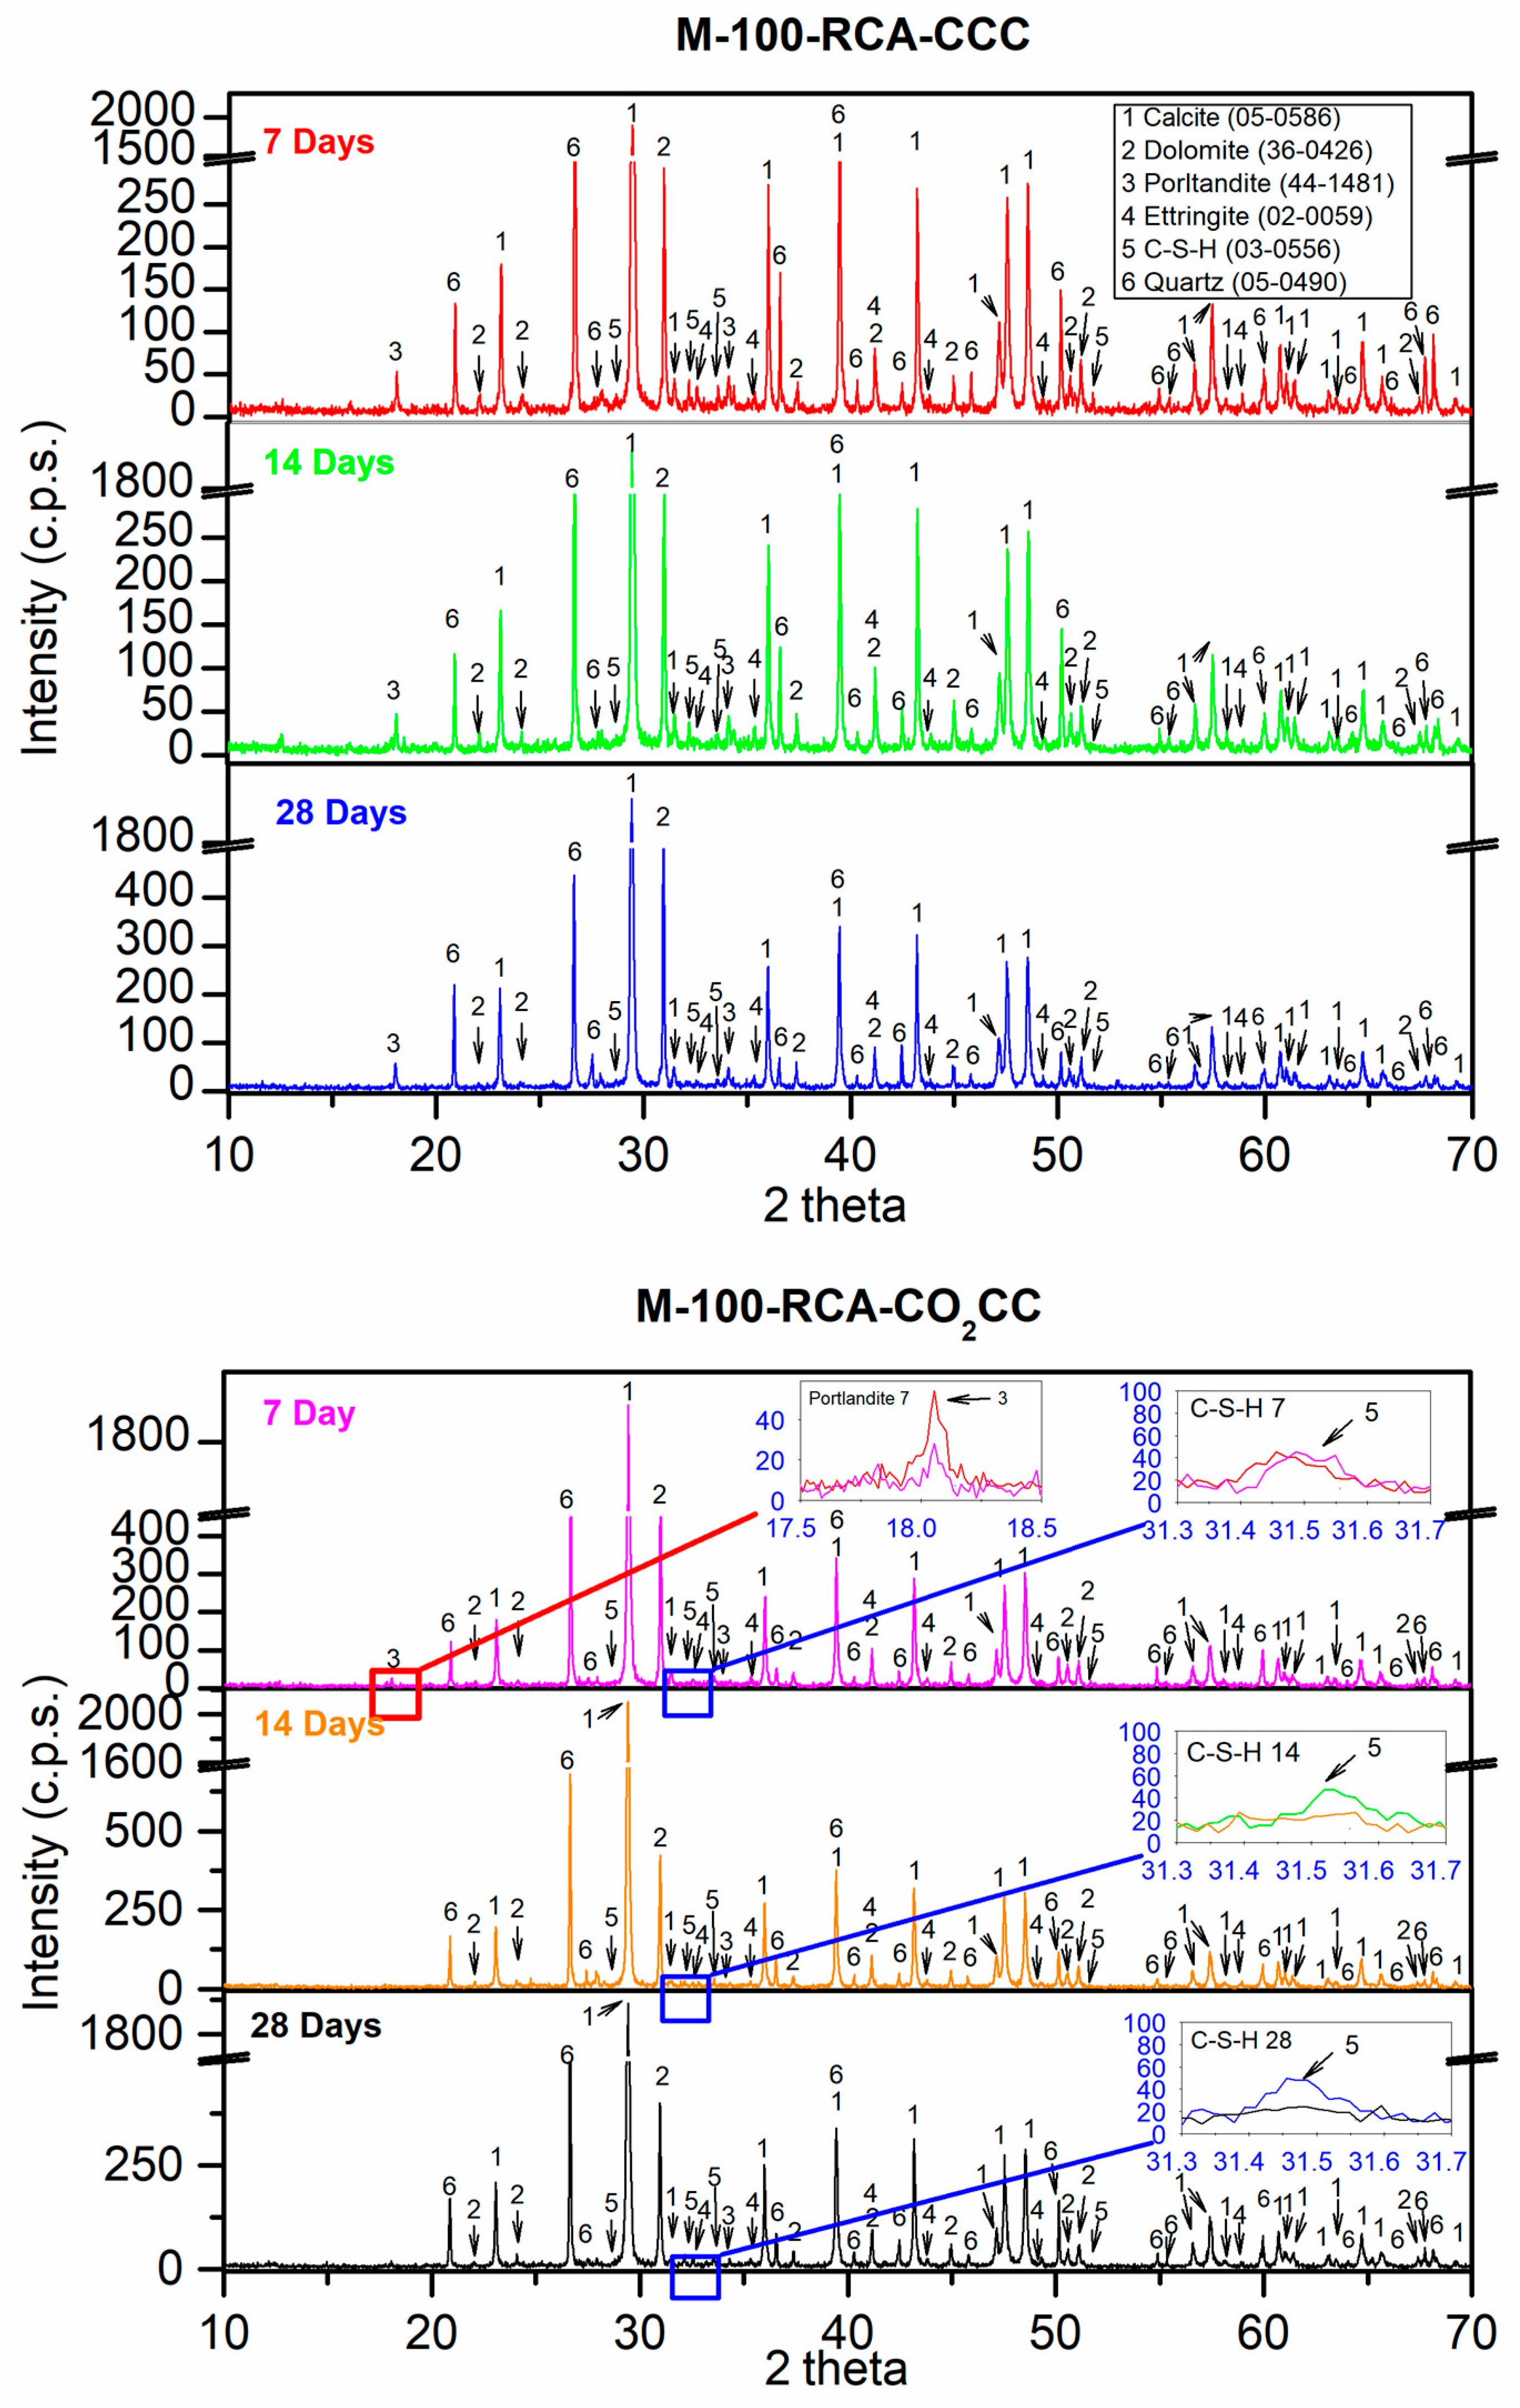
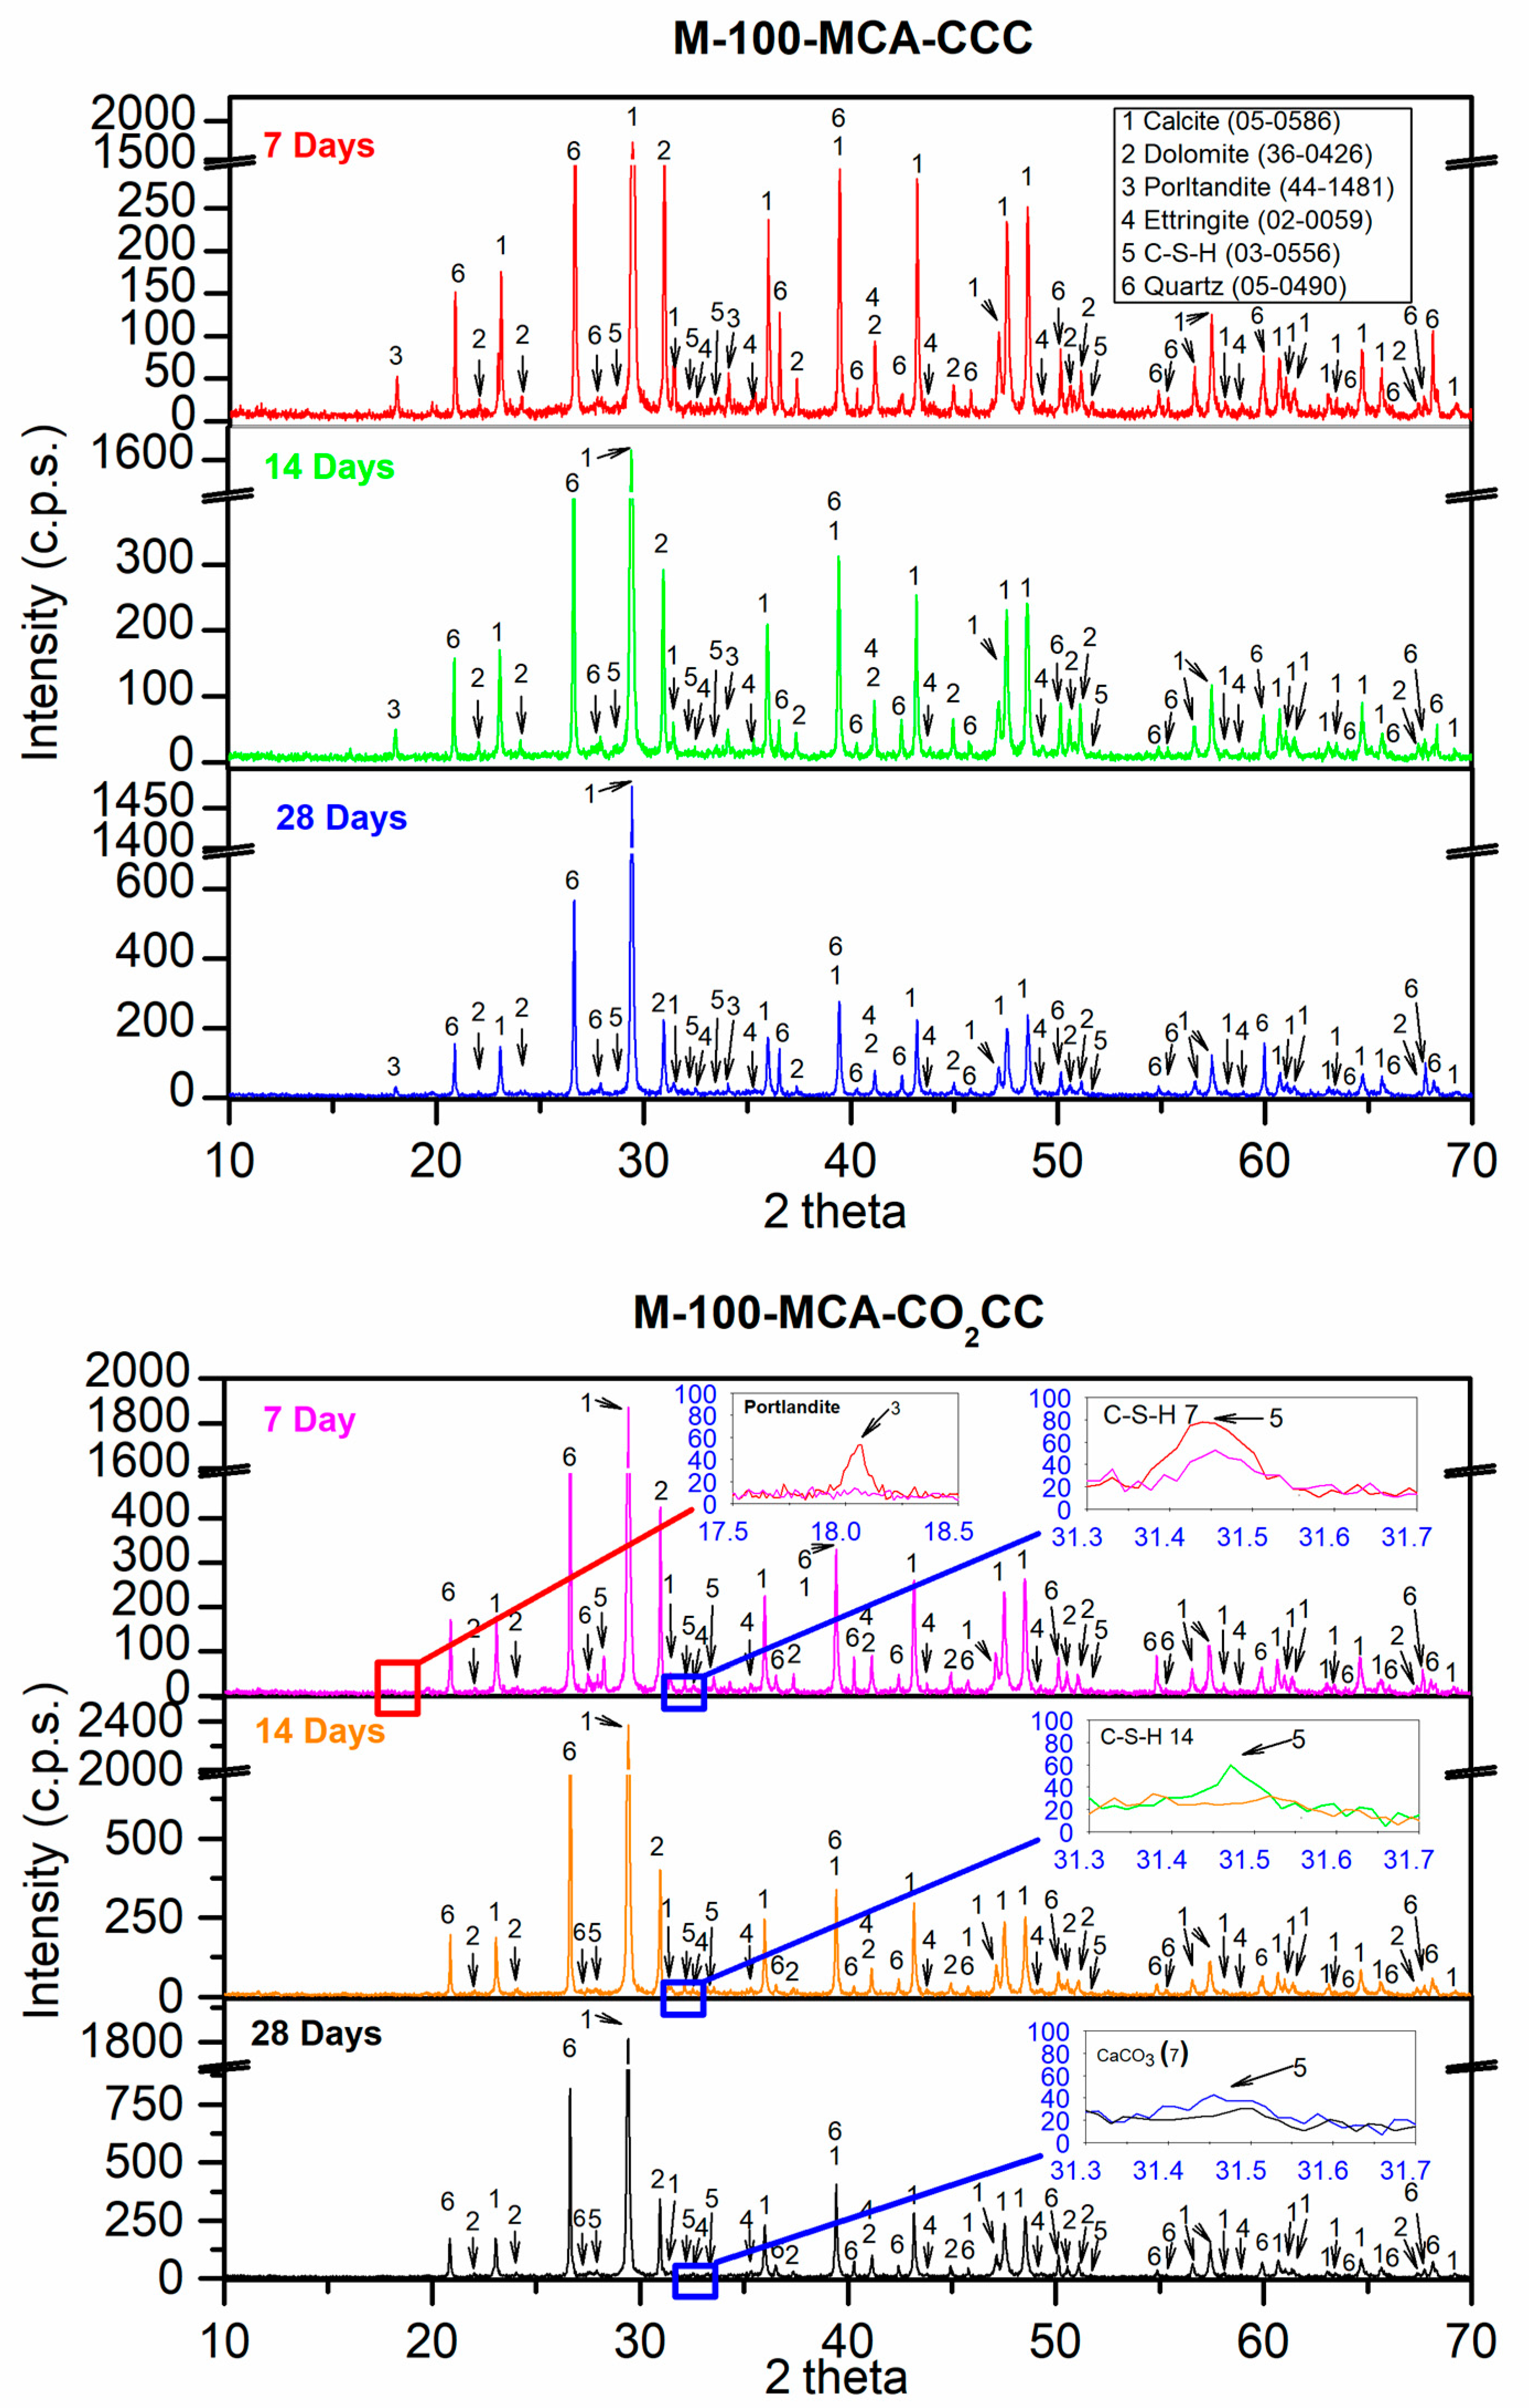
3.4. X-ray Diffraction Analysis

Figure 12 shows the XRD results for the CONTROL mixture under the two curing environments (CCC and CO2CC) at ages 7, 14 and 28 days. For the mixture, the control mixture at 7 days under CCC for the main phases was calcite (CaCO3) (05-0586) [60] and dolomite (CaMg(CO3)2) (36-0426) [60]. These phases came from the aggregates used (CG, FG, S1 and S2). The portlandite (Ca(OH)2) (44-1481) [60], ettringite (Ca6Al2(SO4)3(OH)12·26 H2O) (00-0059) [60] and calcium silicate hydrate (2CaSiO3·3H2O) (03-0556), also named C-S-H [60] phases, were the main hydration reactions [95,96,97]. The same phases were found at 14 and 28 days with no significant changes. Note that at 7 days, neither the alite phase (also sometimes called hatrurite) nor the belite phase were not found. In other investigations with similar mixtures [5,12,30], they were found, especially at 1 and 3 days of curing. This was the result of the alite having reacted almost completely at 7 days, together with gypsum, which was also not found, to form ettringite, as shown in Equation (13). It is also the result of the hydration of Portland cement, according to Equations (14) and (15) [98].
3 C a O · A l 2 O 3 + 3 C a S O 4 + 32 H 2 O 3 C a O · A l 2 O 3 · 3 C a S O 4 · 32 H 2 O
2 3 C a O · S i O 2 + 6 H 2 O 3 C a O · 2 S i O 2 · 3 H 2 O + 3 C a ( O H ) 2
2 2 C a O · S i O 2 + 4 H 2 O 3 C a O · 2 S i O 2 · 3 H 2 O + C a ( O H ) 2
Following the above, this indicates that applying accelerated carbonation after 7 days of curing to the control mix will be less “efficient”, as Equations (1)–(5) would be reduced to Equations (3)–(5). This was in accordance with the slight improvements found after 7 days in the compressive strength for the control mix in Figure 10, under CO2CC.
Basically, carbonation at ambient pressure primarily includes three steps: (1) diffusion of CO2 producing CO32−; (2) dissolution of calcium-based phases, generating Ca2+ and (3) nucleation and precipitation of CaCO3 according to Equations (1)–(5) [99,100]. Applied to the phases found, carbonation applied with CO2CC should “consume” phases such as portlandite and C-S-H Equations (3)–(5). In fact, at 7 days, under CO2CC it can be observed in the inset labelled “Portlandite 7” that the portlandite phase has practically disappeared (red line vs pink line). Additionally, a slight decrease in the C-S-H phase was observed when CO2CC was used. This is indicated in the inset labelled “C-S-H-7” (red line vs pink line). The rest of the phases found were the same as those found under CCC, although perhaps with a little more intensity in the calcite phase, which is in accordance with Equations (3)–(5). At 14 and 28 days, under CO2CC, the portlandite phase was logically still absent. As for the C-S-H phase, the decrease produced by the contact of this phase with CO2 is fulfilled, which can be observed in the inset “C-S-H 14” and “C-S-H 28” respectively for the age of 14 and 28 days.
Figure 13 shows the XRD results for the M-100-RCA mixture under the two curing environments (CCC and CO2CC) at 7, 14 and 28 days. For the mixture M-100-RCA at 7 days under CCC, the main phases were calcite (CaCO3) (05-0586) [60] and dolomite (CaMg(CO3)2) (36-0426) [60]. These phases came from S1 and S2 (Figure 6). The quartz (SiO2) (05-0490) [60], coming from the use of RCA, also appeared as a main phase (Figure 7). As with the control mixture, the phases of portlandite (Ca(OH)2) (44-1481) [60], ettringite (Ca6Al2(SO4)3(OH)12·26 H2O) (00-0059) [60] and calcium silicate hydrate (2CaSiO3·3H2O) (03-0556) [60] were found. No changes were found at 14 and 28 days cured in CCC. The absence of alite and belite that was found in other research of similar blends [5,12,30] is indicative that “it makes no sense” to apply carbonation at 7 days of curing.
Under CO2CC, at 7 days, it can be observed in the inset labelled “Portlandite 7” that this phase still exists, although with little intensity. For the control mixture, this phase did not exist. This may be due to the portlandite already present in the RCA itself (Figure 7). Therefore, this may be indicative that the use of RCA with the portlandite phase is a “CO2 sink” according to Equation (3). Again, a small decrease in the C-S-H phase was also observed, indicated by the inset labelled “C-S-H 7” (red line vs. pink line). At 14 days, the disappearance of the portlandite phase was observed, which is in accordance with the fact that after 14 days the compressive strength remained approximately constant, and there was no significant increase (Figure 9). Logically, the same is true at 28 days of curing. The insets labelled “C-S-H 14” and “C-S-H 28” show the same as those obtained for the control mix.
Figure 14 shows the XRD results for the M-100-RCA mixture under the two curing environments (CCC and CO2CC) at 7, 14 and 28 days. For the mixture M-100-MCA at 7 days under CCC, the main phases were calcite (CaCO3) (05-0586) [60], dolomite (CaMg(CO3)2) (36-0426) [60] and quartz (SiO2) (05-0490) [60]. Other minority phases were also found: portlandite (Ca(OH)2) (44-1481) [60], ettringite (Ca6Al2(SO4)3(OH)12·26 H2O) (00-0059) [60] and calcium silicate hydrate (2CaSiO3·3H2O) (03-0556) [60]. These phases were also found in the control and M-100-MCA mixtures. Again, belite and alite phases were not found, which is again indicative that it is not necessary to carbonate this type of sample at over 7 days of curing.
Under CO2CC, at 7 days it can be observed in the inset labelled “Portlandite 7” that the portlandite phase has practically disappeared (red line vs pink line). Also, a slight decrease in the C-S-H phase was observed when CO2CC was used. This is indicated in the inset labelled “C-S-H-7” (red line vs pink line). At 14 and 28 days, under CO2CC, the portlandite phase is logically still absent. As for the C-S-H phase, the decrease produced by the contact of this phase with CO2 is fulfilled, which can be observed in the inset “C-S-H 14” and “C-S-H 28” respectively at 14 and 28 days.

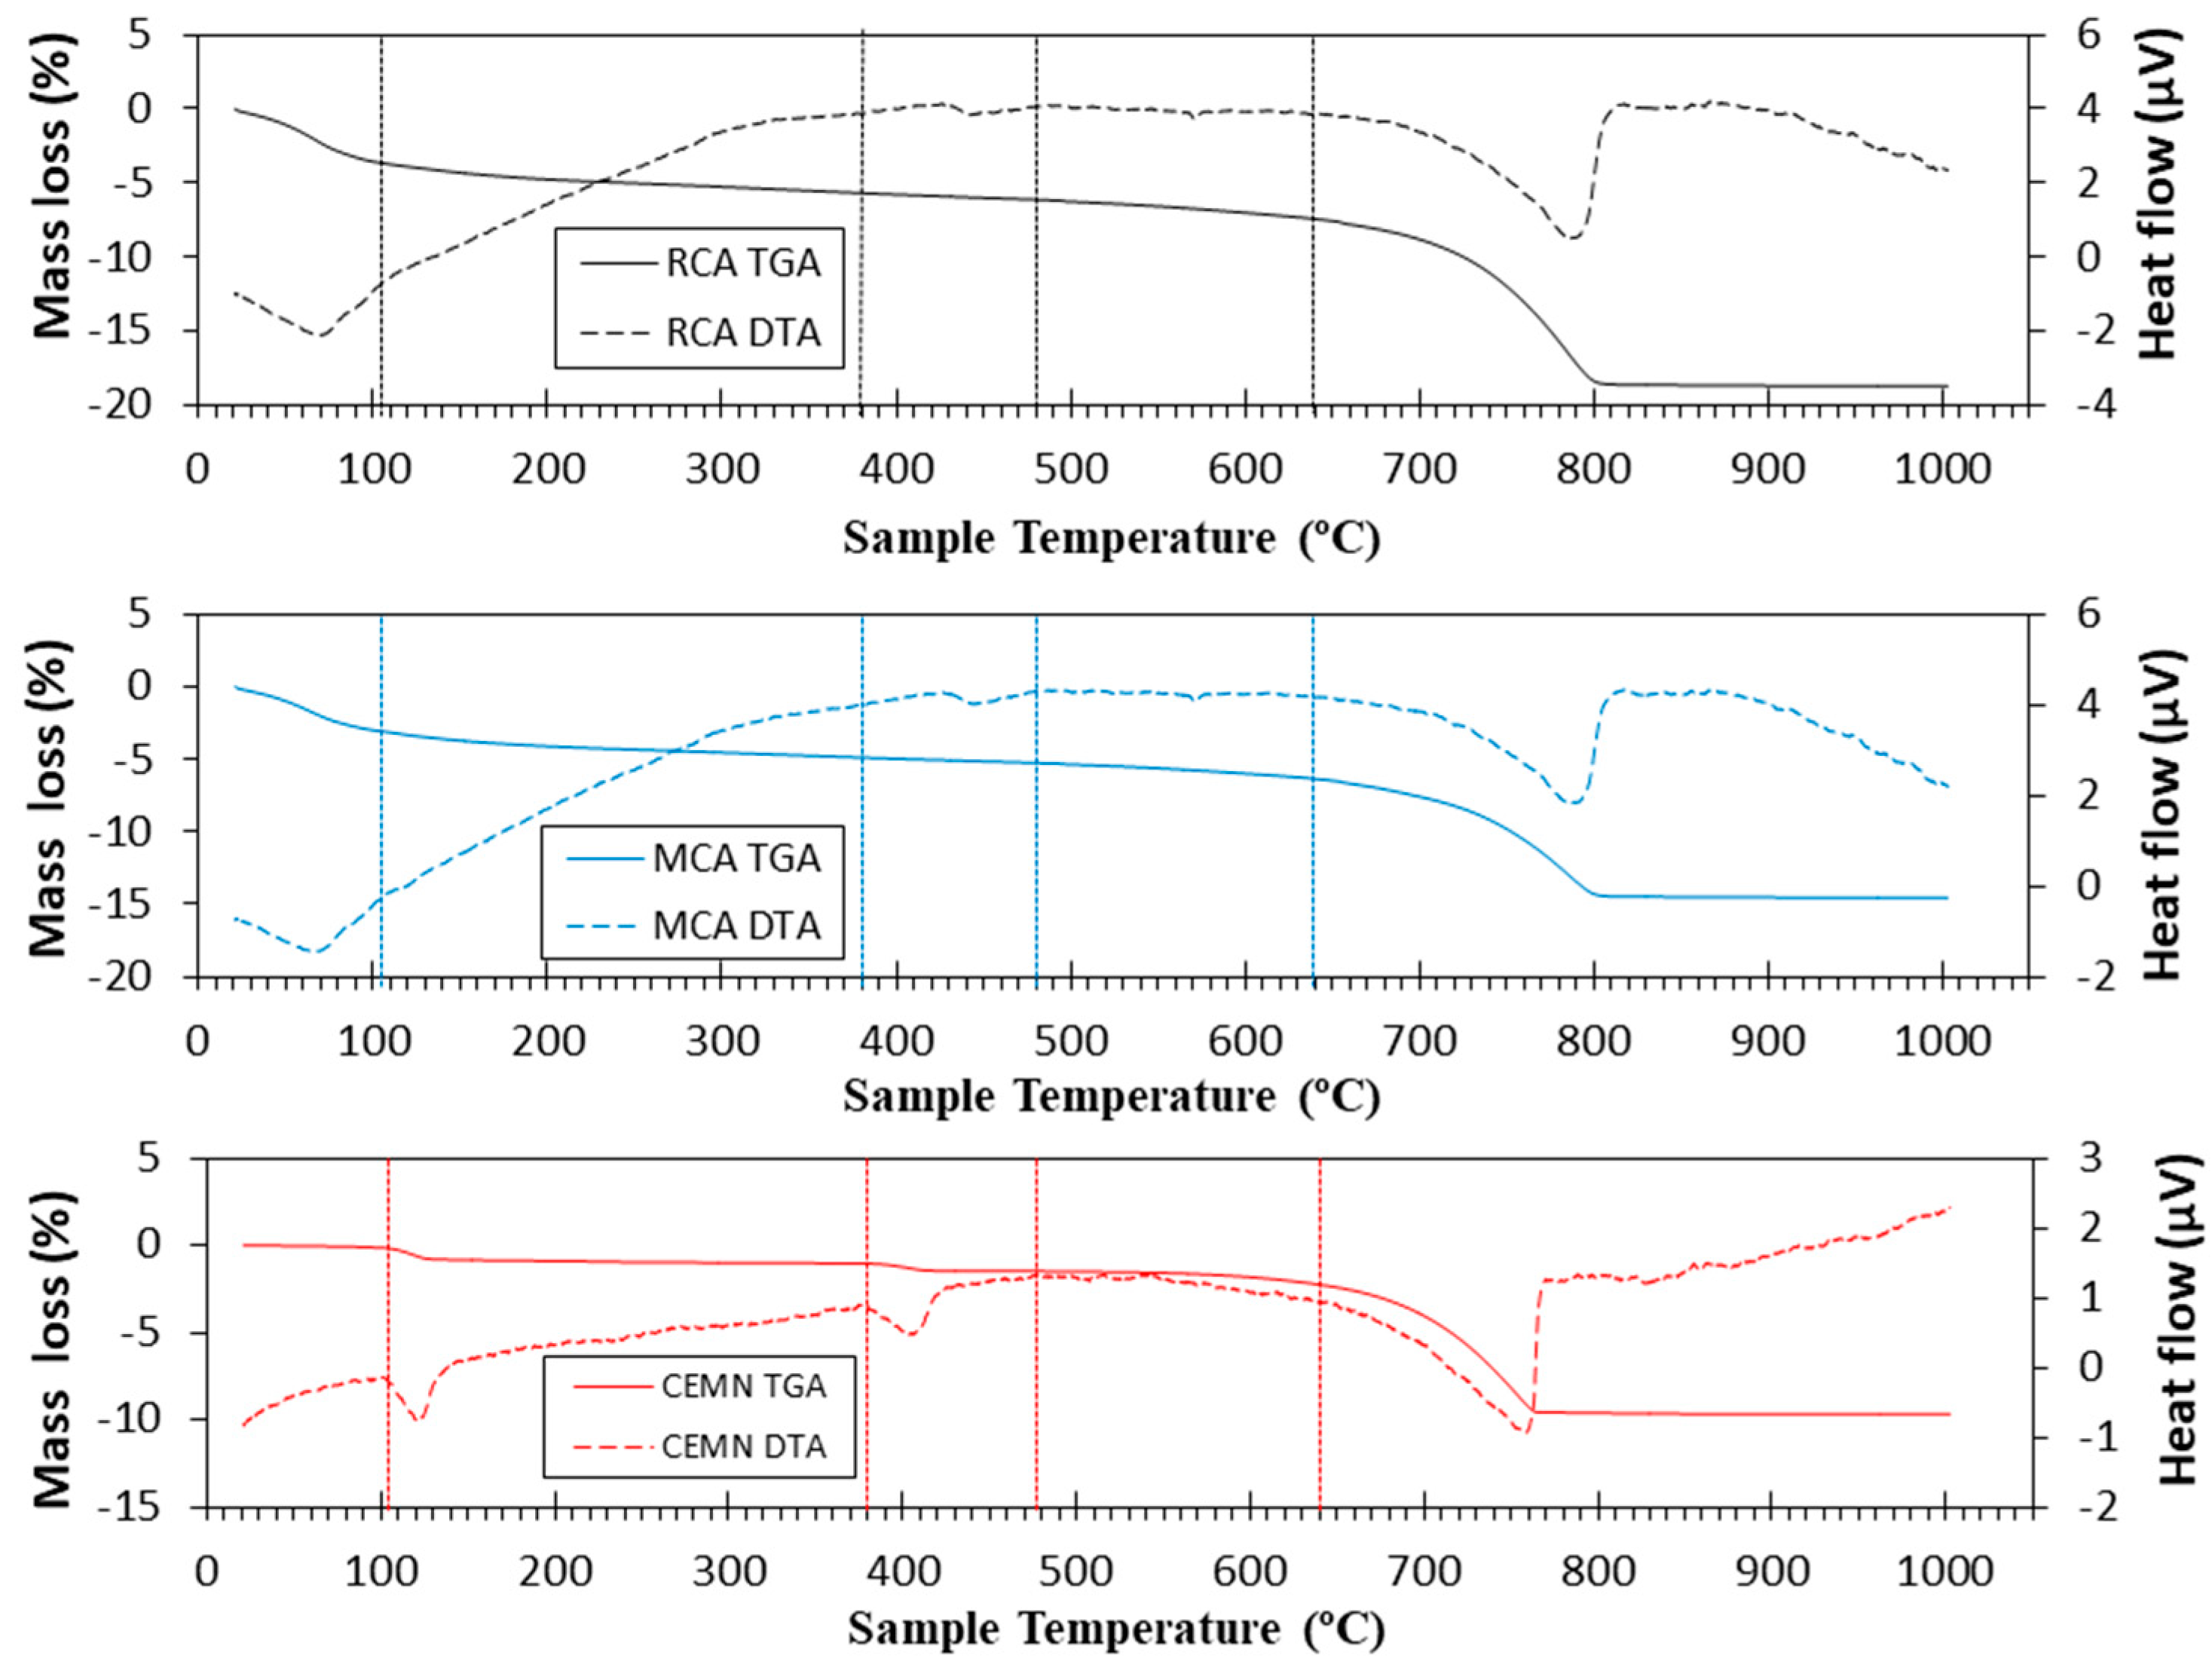
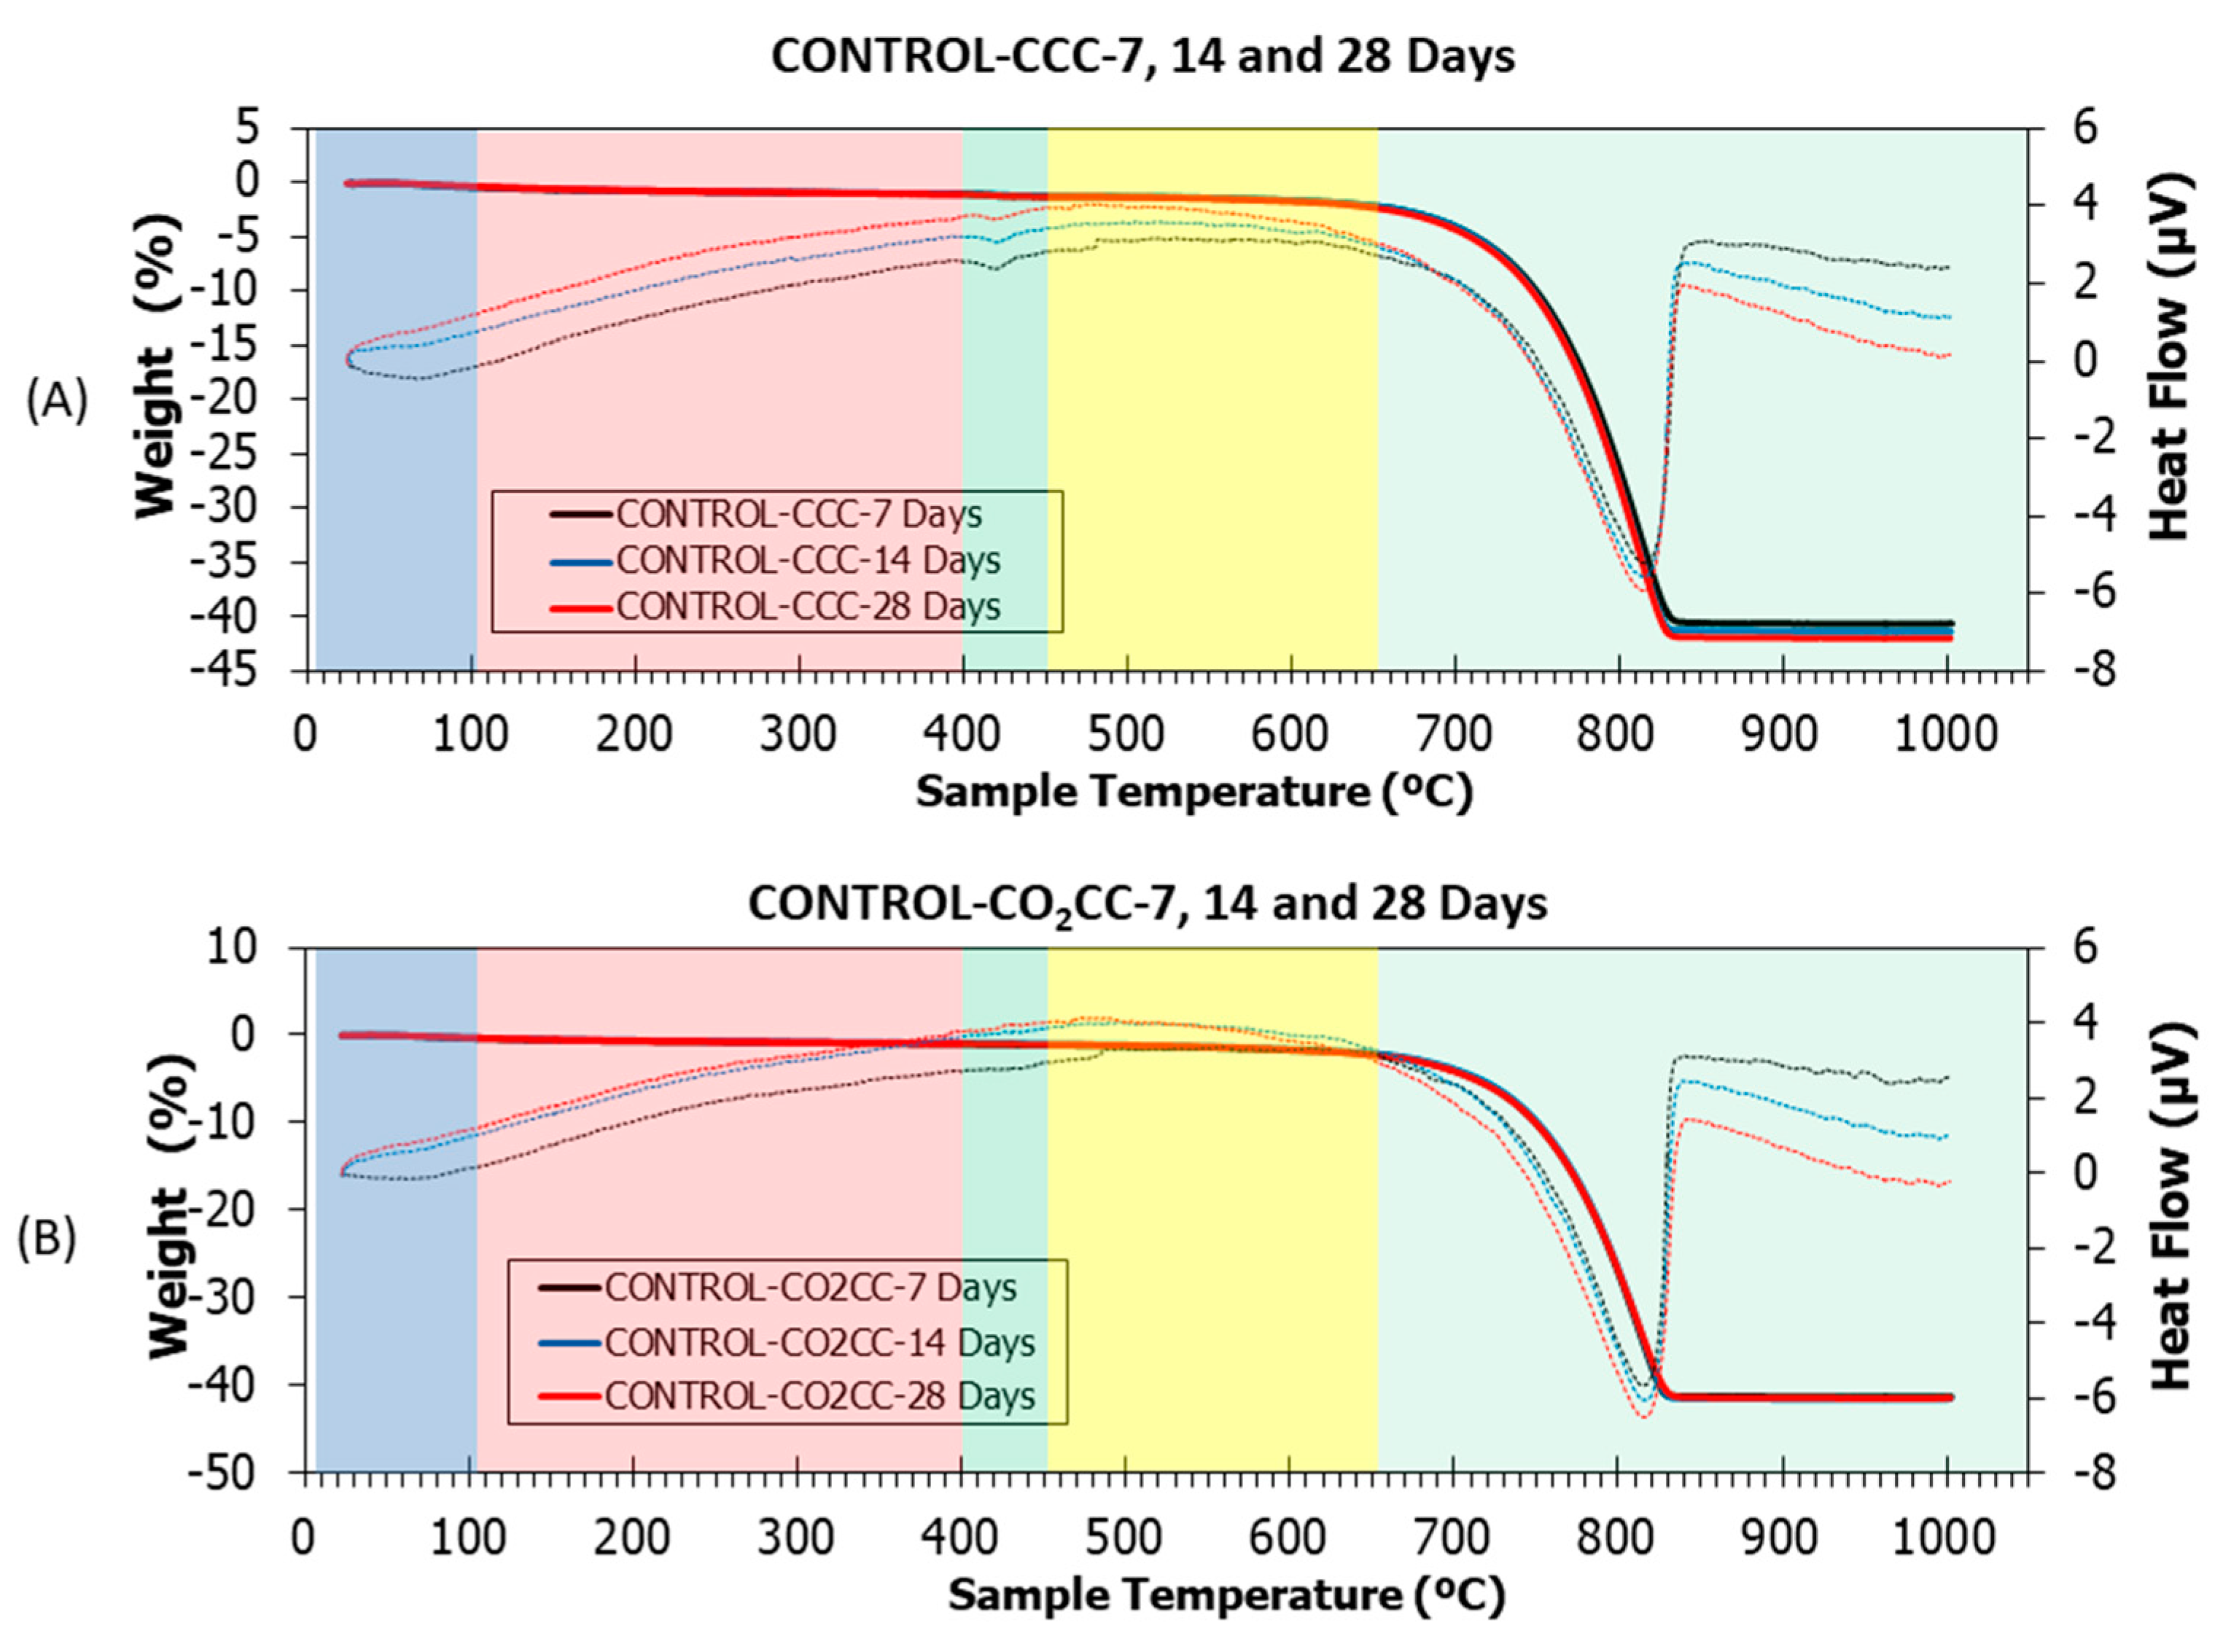
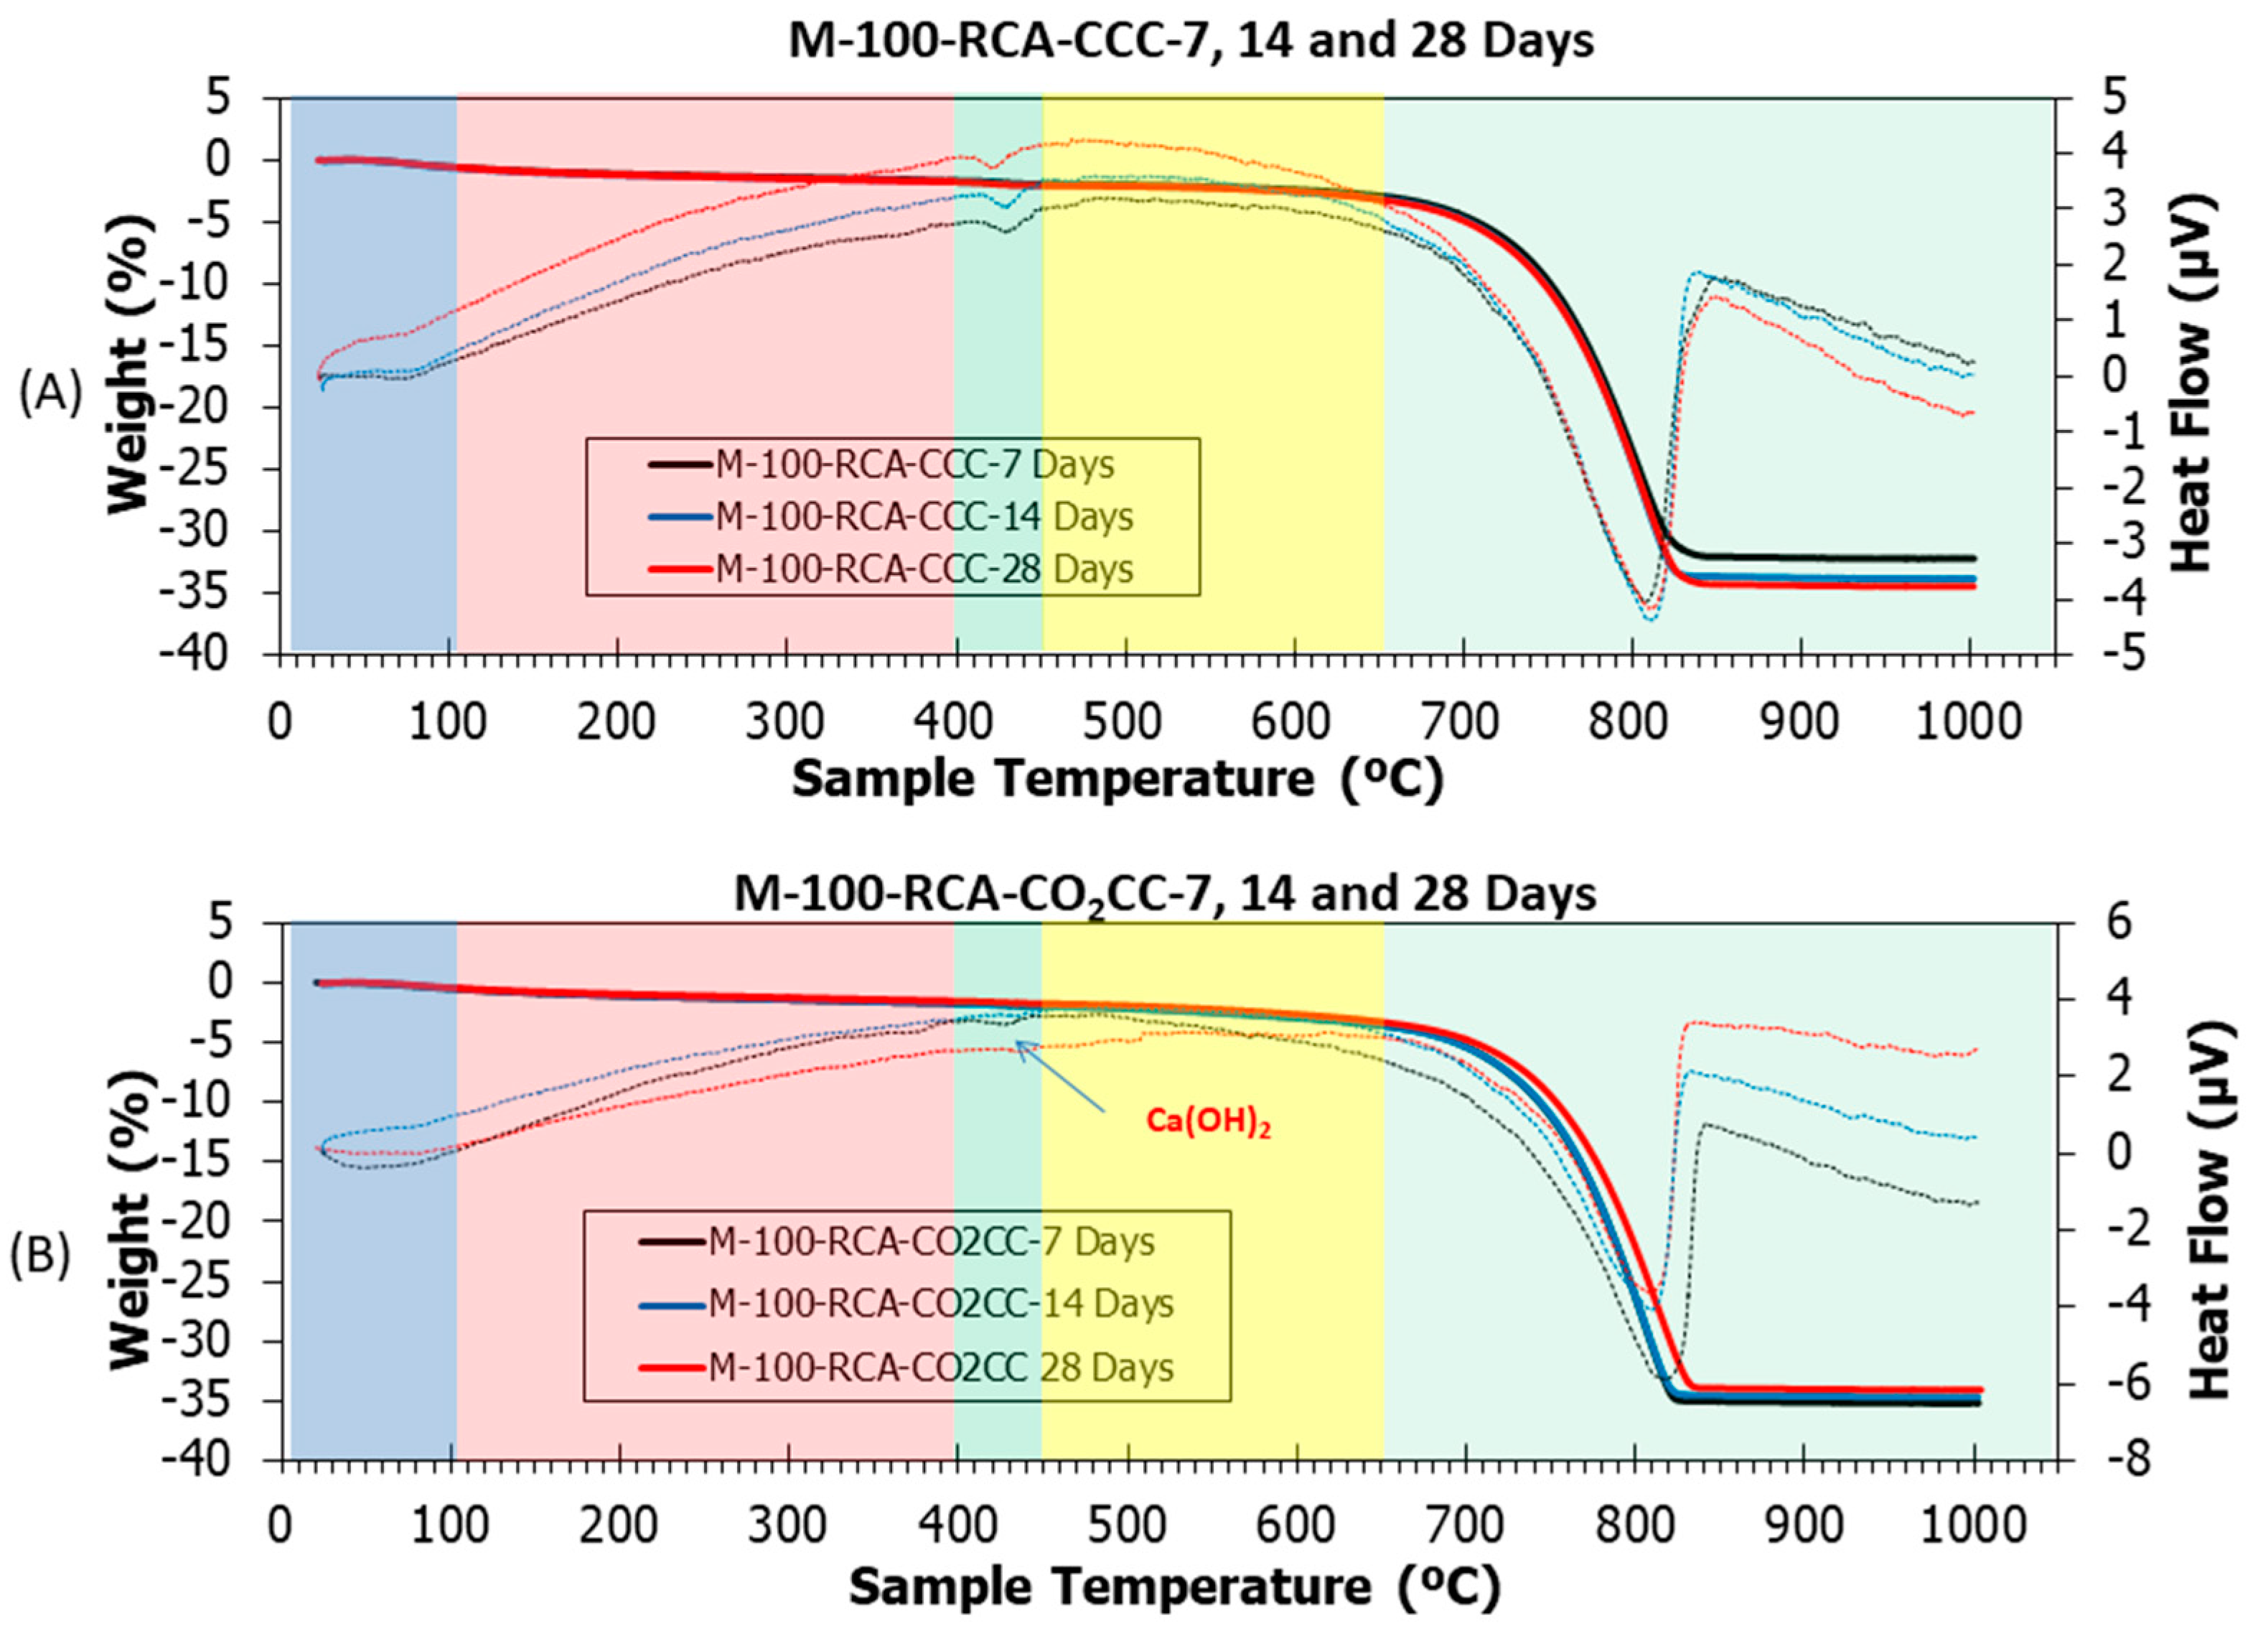
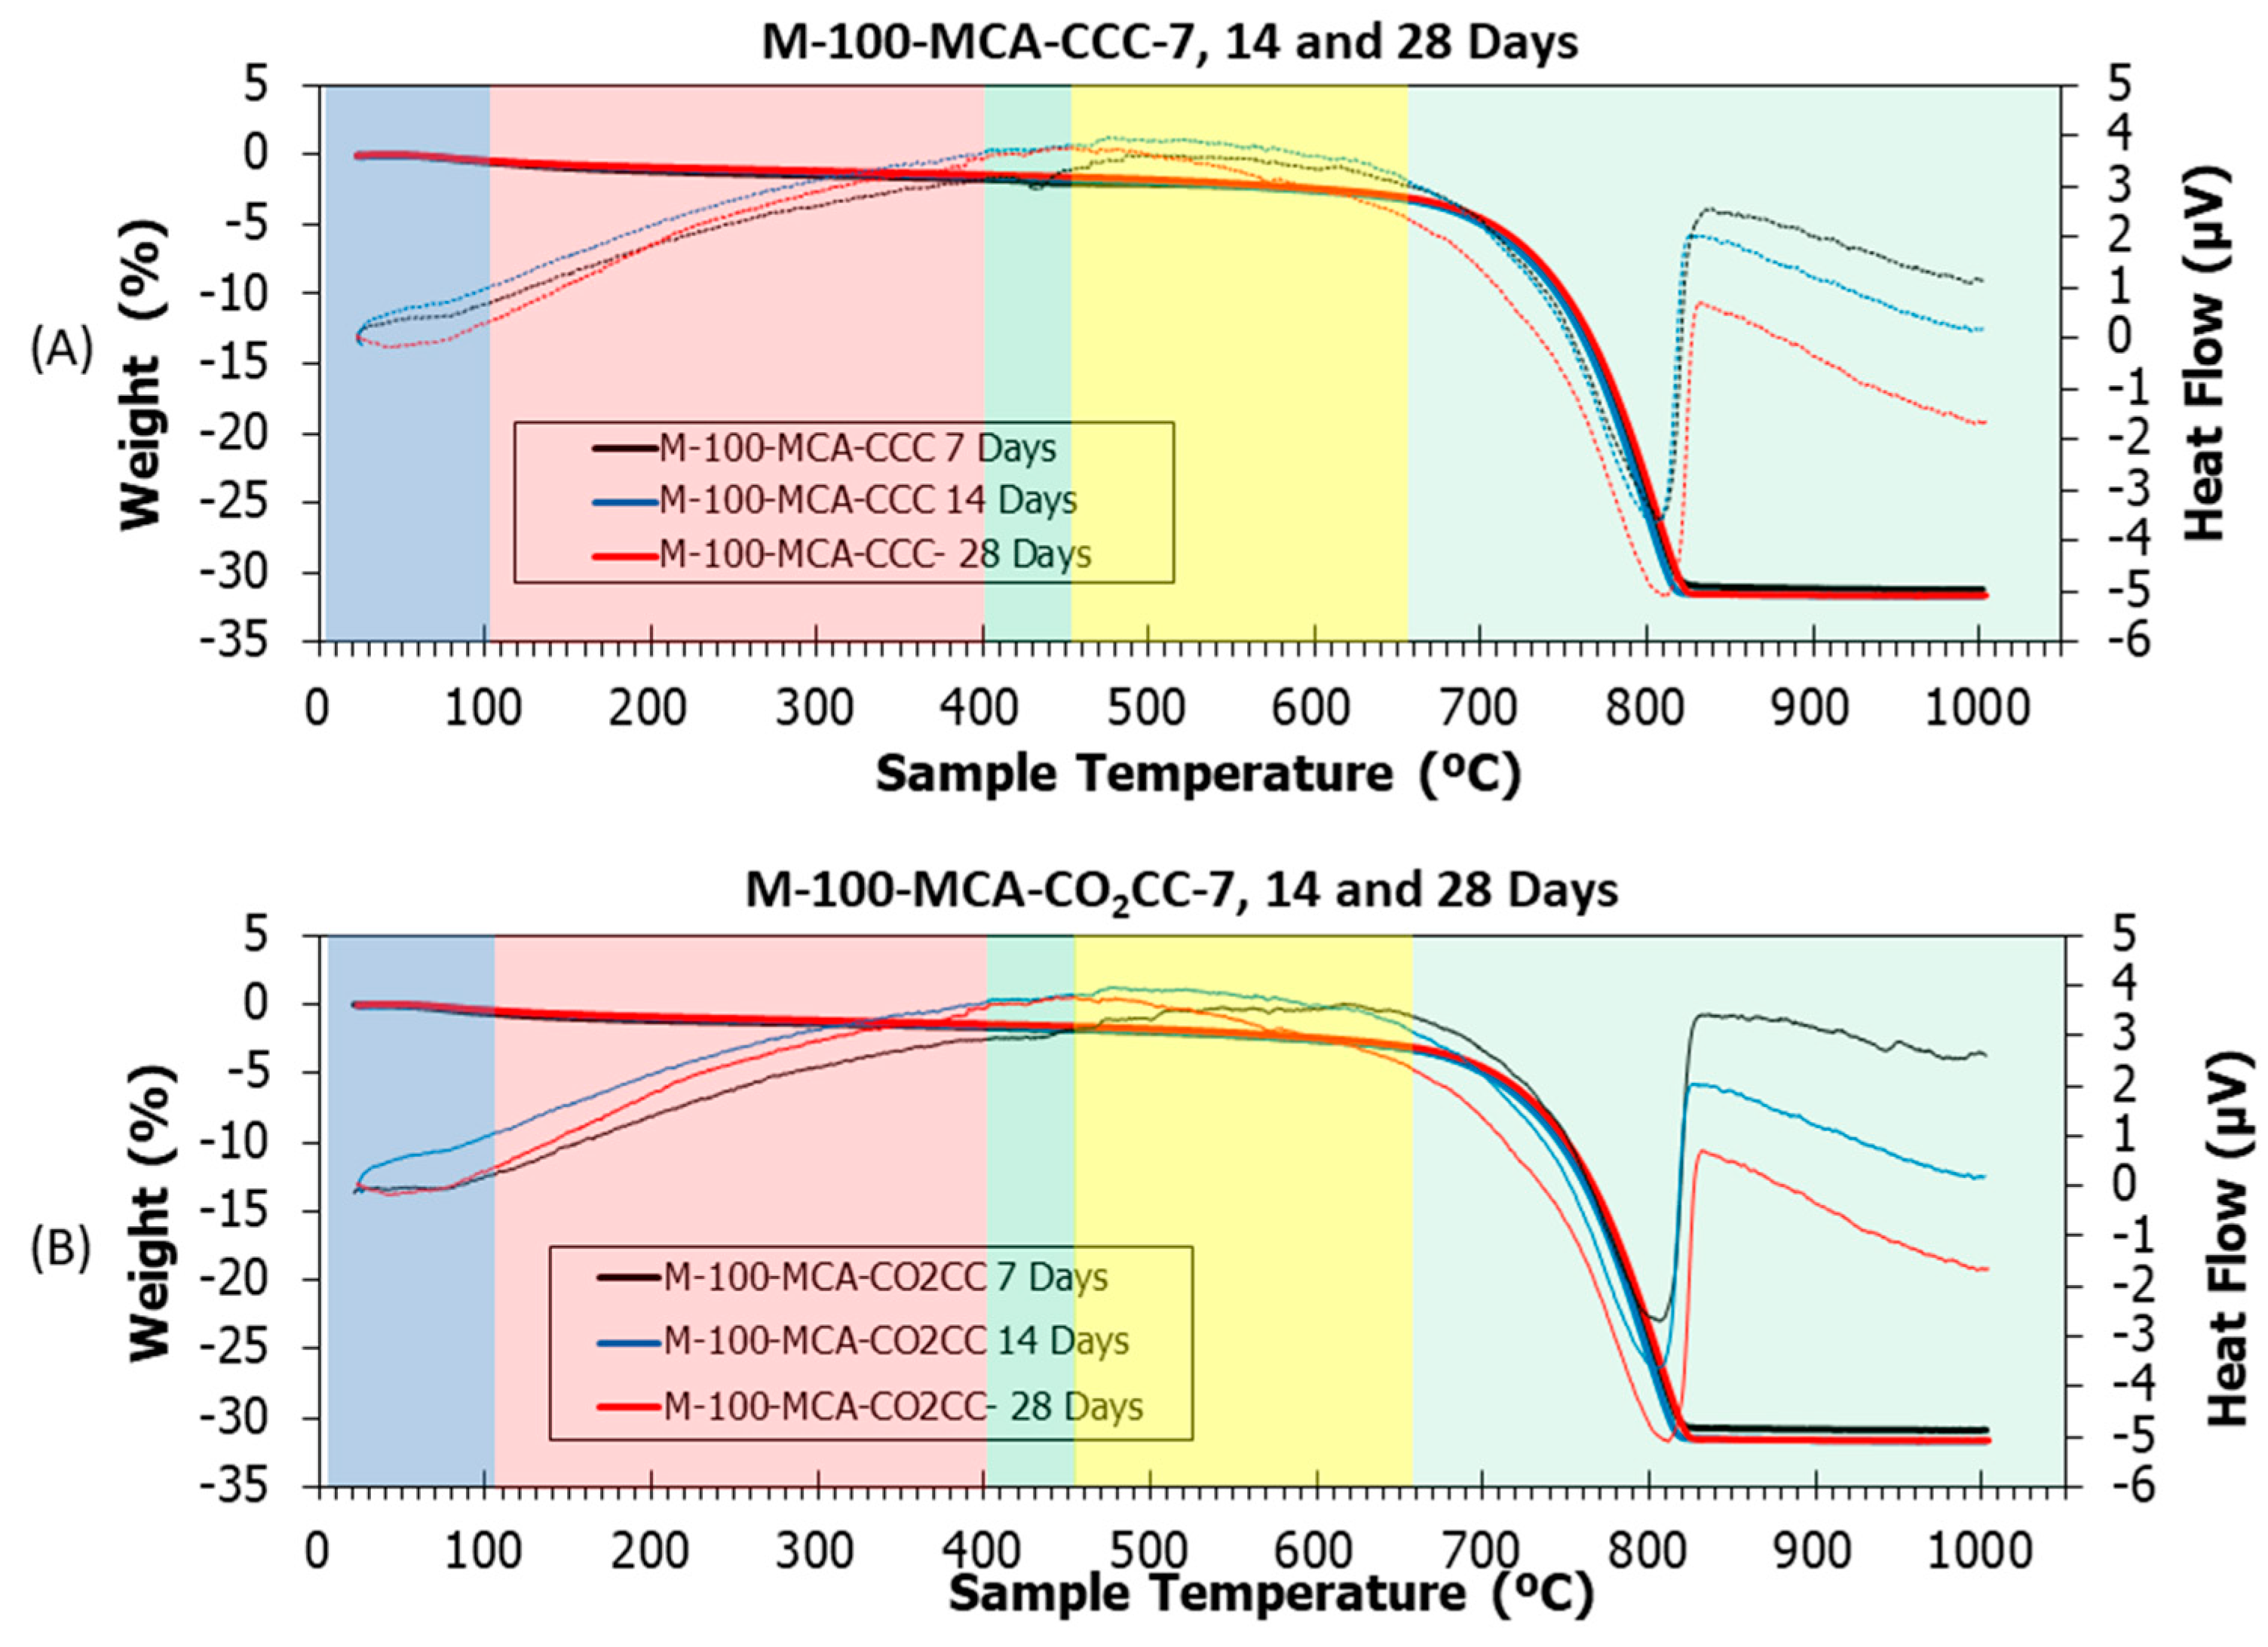
3.5. Thermogravimetric Analysis and Differential Thermal Analysis

Figure 15, Figure 16 and Figure 17 show thermogravimetric analysis (TGA) and differential thermal analysis (DTA) of all samples studied under CCC and CO2CC. Table 5 shows the weight losses for the different stretches. This analysis can determine the CO2 absorption produced through CO2 curing [101,102] by just comparing the amount of calcium carbonate in the same mixture before and after curing in CO2, as indicated in Equation (16). This can be done because the main product of carbonation is CaCO3, as indicated in Equations (1)–(5).
C O 2   s e q u e s t r a t e d   w t . %   =   C a C O 3   i n   C O 2 C C     C a C O 3   i n   C C C
Several common stretches were found in all the samples studied [5,12,30]: (i) From room temperature to 105 °C, ambient humidity was lost. It was observed that this loss was higher in the M-100 RCA and M-100-MCA mix than in the control mix, both for CCC and CO2CC, due to the higher water absorption of both RCA and MCA compared to CG and FG, as indicated in Table 1; (ii) From 105 to 400 °C, loss of ettringite and C-S-H detected by XRD occurred [103,104,105]. A slight decrease in weight loss was observed when comparing CCC versus CO2CC, which was already detected by XRD (see insets named “CSH 7”, “CSH 14” and “CSH 28”) for all samples; (iii) From 400 to 460 °C, decomposition of portlandite, if present, occurred. Its existence was identified with an endothermic peak in DTA. Under CCC, portlandite existed in all samples, as demonstrated by XRD. However, under CO2CC, it only appears in sample M-100-RCA at 7 days, which is in accordance with the XRD findings. The weight loss (Table 5) was lower in CO2CC than in CCC, which is in accordance with the above; (iv) From 460 to 650 °C, the initial carbonates formed in the hardening process were lost [106] and from 650 to 1000 °C, the calcium carbonate was lost [82], which is in accordance with the remarkable weight loss found. In this study, we will consider the last two sections together.
In order to observe the effect of CO2 curing, a comparison was made between CCC and CO2CC for the same samples and curing ages (Table 5). Generically, it was observed that the capture capacity increases under the CO2CC curing environment, which is indicative that CO2 curing of these materials not only improves compressive strength, but also absorbs CO2.
The increase for the control mix was 2.9, 3.6 and 3.6 kg/CO2 t sample under CO2CC. Two aspects are derived from the above: Firstly, it can be seen that using CO2CC longer than 14 days does not make sense from the point of view of increasing CO2 absorption. Secondly, it may appear as a low CO2 uptake. However, considering that the average CO2 level in the atmosphere is 400 ppm and, considering that the density of CO2 is 1.8 mg/cm3 under normal conditions, the amount of CO2 in 1 m3 of air is only 721.6 mg [107]. To reach the CO2 level of the pre-industrial era (280 ppm), only absorbing 120 ppm would be sufficient, i.e., 216.48 mg per m3 of air. With 1 tonne of the control mixture, 13,604 m3 of air could be decarbonised after only 7 days of curing.
For the M-100-RCA mixture, again it can be seen that it does not make sense to cure in CO2CC for more than 14 days. In this case, the CO2 absorption is higher than for the control mix, and this is due to the portlandite phase found in the RCA aggregate (Figure 7). Therefore, with only 7 days of curing, the 1 tonne of M-100-RCA mix could decarbonise under a CO2CC environment of about 36,077 m3 of air. It also does not make sense from a CO2 absorption point of view to cure the M-100-MCA mix for more than 14 days. In this case, 7 days of curing of 1 tonne of M-100-MCA mix would decarbonise 24,685 m3 of air. Considering that a conventional cobblestone has dimensions of 20 × 10 × 6, and using the dry densities obtained in Figure 11 as an estimate, the following was obtained: 1 single paving stone could decarbonise 3.61, 9.59 and 6.56 m3 of air at pre-industrial levels with the control, M-100-RCA and M-100-MCA mixtures, respectively.
Furthermore, the increase in CO2 sequestered per m3 has been calculated using the dry densities obtained in Figure 11. This will be used to calculate the carbon emission evaluation.
Based on the authors’ knowledge, no studies have been found that study the CO2 capture capacity of concrete mixes such as the one presented. They were found for very porous mortars, using similar levels of carbonation, but only using 7 days of curing [12], using carbonated water as curing and/or mixing water [5,20]. In other research, although CO2 is calculated, it is only estimated qualitatively [108]. This research fills this information gap.

3.6. Carbon Emission Evaluation

According to Table 2, Table 3 and Table 5, as well as Equations (8) and (9), the carbon emissions of each of the mixtures with different materials and curing were assessed and are presented in Table 6. Table 7 shows the results obtained for the incremental capture per m3 calculated through TGA/DTA (Table 5) with the respective carbon emissions calculated in Table 6.
CO2 emitted materials amounted to 223.18, 216.68 and 216.50 kg CO2 eq/m3 respectively for the control, M-100-RCA and M-100-MCA mixtures, respectively. This result is slightly below the range shown by W. Xing et al. [49] (278.35–524.44 kg CO2 eq/m3) in a review where they studied the environmental impact of 57 concrete products. These differences are caused by the effect of substituting fine or coarse aggregate [109,110], the recycling process [111,112] and the source and quality of primary material [113], among others. Furthermore, this result showed the feasibility of replacing CG and FG (natural aggregates) with RCA and MCA (recycled aggregates from construction and demolition waste).
However, it was observed that CO2 emissions for curing for 14 and 28 days were quite high (at least with the equipment used at the laboratory scale). In fact, for the control mix, CO2 emissions for curing at 14 and 28 days (10.08 and 20.16 kg CO2 eq/m3 shown in Table 6), are higher than the increase in CO2 sequestrated (8.23 and 8.16 kg CO2 sequestrated by m3 shown in Table 5). This again shows that, for the control mix it, does not make sense to cure more than 7 days in CO2CC. Using the same comparison, for the M-100-RCA and M-100-MCA mixtures, the CO2 emissions for curing would allow curing in CO2CC for up to 14 days. It is therefore not feasible to cure for 28 days in CO2CC for any of the mixtures studied.
Therefore, a CO2CC cure of up to 7 days (or even less) was sufficient to use CO2 curing as a tool to increase productivity, improve compressive strength and decrease CO2 emission in an unreinforced precast plant. It is not recommended to use more than 7 days in CO2 curing, as compressive strengths were maintained and only CO2 emissions were increased. No studies were found that relate the CO2 sequestered by similar mixtures and that also make an assessment of CO2 emissions, relating both results.
The mixture with the lowest total CO2 emissions was “M-100-RCA-CO2CC- 7 Days”. According to the strengths obtained in Figure 10, it could be classified as C16/20 “ordinary concrete” only at 7 days [57]. Therefore, “M-100-RCA-CO2CC- 7 Days” presents a very promising result to be tested on a real scale, such as paving stones, kerbs or any non-structural precast.

4. Conclusions

CO2 curing in vibro-compacted precast concrete with recycled/mixed concrete aggregates (RCA or MCA) is a promising technology. The CO2 curing enabled carbon sequestration, improved the compressive strength, increased the dry bulk density and decreased the accessible porosity for water. The findings are detailed in the following points:
  • The portlandite phase found in RCA and MCA by XRD is a “potential” CO2 sink;
  • The method of replacing natural aggregate with RCA and MCA should be carried out with very similar particle sizes. This even improves the compressive strengths obtained;
  • Curing in CO2 improved the compressive strength in all samples (CONTROL, M-100-RCA and M-100-MCA). It does not make sense to apply CO2 curing longer than 7 days on the mixes with natural aggregate and MCA, as the strengths remained constant. A CO2 curing of 14 days can be applied to the RCA mixes;
  • XRD and TGA/DTA showed that it does not make sense to apply CO2 curing beyond 7 days, since from that age all the blends were practically carbonated (except the blend with RCA, which did not carbonate until 14 days);
  • The mixtures of 1 tonne of control, M-100-RCA and M-100-MCA using CO2 curing could be decarbonised after only 7 days of curing 13,604, 36,077 and 24,635 m3 of air, respectively;
  • According to the carbon emission evaluation and the TGA/DTA results, curing longer than 7 days in CO2 for the reference mix (CONTROL) had higher CO2 emissions than the sequestered CO2. The mix with RCA and MCA would allow up to 14 days, but according to the compressive strength obtained; XRD and TGA/DTA results, only up to 7 days is recommended;
  • The total CO2 emissions by mixture using CO2 curing at 7 days were 221.26, 204.38 and 210.05 kg CO2 eq/m3 for CONTROL, M-100-RCA and M-100-MCA, respectively. This was calculated with the carbon footprint assessment and the CO2 sequestrated obtained with TGA/DTA.
In conclusion, the findings of this study provide a valuable contribution to carbon emission evaluation of CO2 curing in vibro-compacted precast concrete with recycled/mixed concrete aggregates (RCA or MCA). The new approach facilitates carbon capture and use and guarantees enhanced compressive strength of the concrete samples.

Author Contributions

Conceptualization, E.F.-L., J.R.J. and J.M.F.-R.; formal analysis, D.S.-M.; data curation, D.S.-M., Á.G.-C. and A.M.M.-L.; writing-original draft preparation, D.S.-M.; writing-review and editing, J.R.J. and J.M.F.-R.; supervision, E.F.-L., J.R.J. and J.M.F.-R.; visualization, D.S.-M.; funding acquisition, J.R.J. and J.M.F.-R. All authors have read and agreed to the published version of the manuscript.

Funding

Consejería de Transformación Económica, Industria, Conocimiento y Universidades. Junta de Andalucía. PREFABRICO-II Research Project. Ref. P20_00409. Andalusian FEDER Operational Program (2014-2020).

Institutional Review Board Statement

Not applicable.

Informed Consent Statement

Not applicable.

Data Availability Statement

Not applicable.

Acknowledgments

The authors would like to acknowledge the companies PAVIGESA and GECORSA for the contribution of materials and knowledge.

Conflicts of Interest

The authors declare that they have no known competing financial interest or personal relationship that could have influenced the work reported in this paper.

References

  1. Huang, B.; Gao, X.; Xu, X.; Song, J.; Geng, Y.; Sarkis, J.; Fishman, T.; Kua, H.; Nakatani, J. A Life Cycle Thinking Framework to Mitigate the Environmental Impact of Building Materials. One Earth 2020, 3, 564–573. [Google Scholar] [CrossRef]
  2. Xi, F.; Davis, S.J.; Ciais, P.; Crawford-Brown, D.; Guan, D.; Pade, C.; Shi, T.; Syddall, M.; Lv, J.; Ji, L.; et al. Substantial global carbon uptake by cement carbonation. Nat. Geosci. 2016, 9, 880–883. [Google Scholar] [CrossRef] [Green Version]
  3. Miller, S.A.; John, V.M.; Pacca, S.A.; Horvath, A. Carbon dioxide reduction potential in the global cement industry by 2050. Cem. Concr. Res. 2018, 114, 115–124. [Google Scholar] [CrossRef]
  4. Suescum-Morales, D.; Silva, R.V.; Bravo, M.; Jiménez, J.R.; Fernández-Rodríguez, J.M.; de Brito, J. Effect of incorporating municipal solid waste incinerated bottom ash in alkali-activated fly ash concrete subjected to accelerated CO2 curing. J. Clean. Prod. 2022, 370, 133533. [Google Scholar] [CrossRef]
  5. Suescum-Morales, D.; Jiménez, J.R.; Fernández-Rodríguez, J.M. Use of Carbonated Water as Kneading in Mortars Made with Recycled Aggregates. Materials 2022, 15, 4876. [Google Scholar] [CrossRef] [PubMed]
  6. I.P. on Climate Change, History Intergovernmental Panel on Climate Change (IPCC). 2022. Available online: https://archive.ipcc.ch/organization/organization_history.shtml (accessed on 7 December 2022).
  7. Yuan, J. Vertical Profiles of Carbon Dioxide in the Lower Troposphere at Manua Loa Observatory, Hawaii, Determined with a Multi-Copter Drone. In Ocean Sciences Meeting; AGU: Washington, DC, USA, 2020. [Google Scholar]
  8. Lu, B.; Shi, C.; Zheng, J.; Ling, T.C. Carbon Dioxide Sequestration on Recycled Aggregates; Elsevier Ltd.: Amsterdam, The Netherlands, 2018; ISBN 9780081024478. [Google Scholar]
  9. Madejski, P.; Chmiel, K.; Subramanian, N.; Kus, T. Methods and Techniques for CO2 Capture: Review of Potential. Energies 2022, 15, 887. [Google Scholar] [CrossRef]
  10. SENDECO2, Sistema Europeo de Negociación de CO2. 2022. Available online: https://www.sendeco2.com/es/ (accessed on 17 November 2022).
  11. Zhang, D.; Ghouleh, Z.; Shao, Y. Review on carbonation curing of cement-based materials. J. CO2 Util. 2017, 21, 119–131. [Google Scholar] [CrossRef]
  12. Suescum-Morales, D.; Kalinowska-wichrowska, K.; Fernández, J.M.; Jiménez, J.R. Accelerated carbonation of fresh cement-based products containing recycled masonry aggregates for CO2 sequestration. J. CO2 Util. 2021, 46, 101461. [Google Scholar] [CrossRef]
  13. Wang, D.; Xiao, J.; Duan, Z. Strategies to accelerate CO2 sequestration of cement-based materials and their application prospects. Constr. Build. Mater. 2022, 314, 125646. [Google Scholar] [CrossRef]
  14. Jang, J.G.; Kim, G.M.; Kim, H.J.; Lee, H.K. Review on recent advances in CO2 utilization and sequestration technologies in cement-based materials. Constr. Build. Mater. 2016, 127, 762–773. [Google Scholar] [CrossRef]
  15. Olajire, A.A. A review of mineral carbonation technology in sequestration of CO2. J. Pet. Sci. Eng. 2013, 109, 364–392. [Google Scholar] [CrossRef]
  16. Santos, R.M.; Van Bouwel, J.; Vandevelde, E.; Mertens, G.; Elsen, J.; Van Gerven, T. Accelerated mineral carbonation of stainless steel slags for CO2 storage and waste valorization: Effect of process parameters on geochemical properties. Int. J. Greenh. Gas Control 2013, 17, 32–45. [Google Scholar] [CrossRef] [Green Version]
  17. Jun, Y.; Han, S.H.; Kim, J.H. Performance of CO2-Cured Alkali-Activated Slag Pastes During Curing and Exposure. Int. J. Concr. Struct. Mater. 2023, 17, 3. [Google Scholar] [CrossRef]
  18. Jun, Y.; Han, S.H.; Kim, J.H. Early-age strength of CO2 cured alkali-activated blast furnace slag pastes. Constr. Build. Mater. 2021, 288, 123075. [Google Scholar] [CrossRef]
  19. He, Z.; Wang, S.; Mahoutian, M.; Shao, Y. Flue gas carbonation of cement-based building products. J. CO2 Util. 2020, 37, 309–319. [Google Scholar] [CrossRef]
  20. Suescum-Morales, D.; Fernández-Rodríguez, J.M.; Jiménez, J.R. Use of carbonated water to improve the mechanical properties and reduce the carbon footprint of cement-based materials with recycled aggregates. J. CO2 Util. 2022, 57, 101886. [Google Scholar] [CrossRef]
  21. Wang, X.; Guo, M.Z.; Ling, T.C. Review on CO2 curing of non-hydraulic calcium silicates cements: Mechanism, carbonation and performance. Cem. Concr. Compos. 2022, 133, 104641. [Google Scholar] [CrossRef]
  22. Suescum-Morales, D.; Cantador-Fernández, D.; Fernández, J.M.; Jiménez, J.R. The combined effect of CO2 and calcined hydrotalcite on one-coat limestone mortar properties. Constr. Build. Mater. 2020, 280, 122532. [Google Scholar] [CrossRef]
  23. Suescum-Morales, D.; Cantador-Fernandez, D.; Fernández, J.M.; Jiménez, J.R. Potential CO2 capture in one-coat limestone mortar modified with Mg3Al–CO3 calcined hydrotalcites using ultrafast testing technique. Chem. Eng. J. 2021, 415, 129077. [Google Scholar] [CrossRef]
  24. Liang, C.; Zhang, Y.; Wu, R.; Yang, D.; Ma, Z. The utilization of active recycled powder from various construction wastes in preparing ductile fiber-reinforced cementitious composites: A case study. Case Stud. Constr. Mater. 2021, 15, e00650. [Google Scholar] [CrossRef]
  25. Liang, C.; Pan, B.; Ma, Z.; He, Z.; Duan, Z. Utilization of CO2 curing to enhance the properties of recycled aggregate and prepared concrete: A review. Cem. Concr. Compos. 2020, 105, 103446. [Google Scholar] [CrossRef]
  26. Pistilli, M.F.; Peterson, C.F.; Corporation, M.S.; Shah, S.P. Properties and possible recycling of solid waste from ready-mix concrete. Cem. Concr. Res. 1975, 5, 617–630. [Google Scholar] [CrossRef]
  27. Tam, V.W.Y.; Wattage, H.; Le, K.N.; Buteraa, A.; Soomro, M. Methods to improve microstructural properties of recycled concrete aggregate: A critical review. Constr. Build. Mater. 2021, 270, 121490. [Google Scholar] [CrossRef]
  28. Wang, B.; Yan, L.; Fu, Q.; Kasal, B. A Comprehensive Review on Recycled Aggregate and Recycled Aggregate Concrete. Resour. Conserv. Recycl. 2021, 171, 105565. [Google Scholar] [CrossRef]
  29. Xiao, J.; Li, W.; Fan, Y.; Huang, X. An overview of study on recycled aggregate concrete in China (1996–2011). Constr. Build. Mater. 2012, 31, 364–383. [Google Scholar] [CrossRef]
  30. Kalinowska-Wichrowska, K.; Pawluczuk, E.; Bołtryk, M.; Jimenez, J.; Fernandez-Rodriguez, J.; Morales, D. The Performance of Concrete Made with Secondary Products—Recycled Coarse Aggregates, Recycled Cement Mortar, and Fly Ash–Slag Mix. Materials 2022, 15, 1438. [Google Scholar] [CrossRef]
  31. Pawluczuk, E.; Kalinowska-Wichrowska, K.; Jiménez, J.R.; Fernández, J.M.; Suescum-Morales, D. Geopolymer concrete with treated recycled aggregates: Macro and microstructural behavior. J. Build. Eng. 2021, 44, 103317. [Google Scholar] [CrossRef]
  32. Kazmi, S.M.S.; Munir, M.J.; Wu, Y.F.; Patnaikuni, I.; Zhou, Y.; Xing, F. Effect of recycled aggregate treatment techniques on the durability of concrete: A comparative evaluation. Constr. Build. Mater. 2020, 264, 120284. [Google Scholar] [CrossRef]
  33. Shi, C.; Li, Y.; Zhang, J.; Li, W.; Chong, L.; Xie, Z. Performance enhancement of recycled concrete aggregate-A review. J. Clean. Prod. 2016, 112, 466–472. [Google Scholar] [CrossRef]
  34. Wang, R.; Yu, N.; Li, Y. Methods for improving the microstructure of recycled concrete aggregate: A review. Constr. Build. Mater. 2020, 242, 118164. [Google Scholar] [CrossRef]
  35. Alqarni, A.S.; Abbas, H.; Al-shwikh, K.M.; Al-salloum, Y.A. Influence of Treatment Methods of Recycled Concrete Aggregate on Behavior of High Strength Concrete. Buildings 2022, 12, 494. [Google Scholar] [CrossRef]
  36. Allujami, H.M.; Abdulkareem, M.; Jassam, T.M.; Al-Mansob, R.A.; Ng, J.L.; Ibrahim, A. Nanomaterials in recycled aggregates concrete applications: Mechanical properties and durability. A review. Cogent Eng. 2022, 9, 2122885. [Google Scholar] [CrossRef]
  37. Alqarni, A.S.; Albidah, A.; Abbas, H.; Almusallam, T.; Al-Salloum, Y. Concrete Performance Produced Using Recycled Construction and By-Product Industrial Waste Coarse Aggregates. Materials 2022, 15, 8985. [Google Scholar] [CrossRef] [PubMed]
  38. Zhan, B.; Poon, C.S.; Liu, Q.; Kou, S.; Shi, C. Experimental study on CO2 curing for enhancement of recycled aggregate properties. Constr. Build. Mater. 2014, 67, 3–7. [Google Scholar] [CrossRef]
  39. Tam, V.W.Y.; Butera, A.; Le, K.N.; Li, W. Utilising CO2 technologies for recycled aggregate concrete: A critical review. Constr. Build. Mater. 2020, 250, 118903. [Google Scholar] [CrossRef]
  40. Torrenti, J.M.; Amiri, O.; Barnes-Davin, L.; Bougrain, F.; Braymand, S.; Cazacliu, B.; Colin, J.; Cudeville, A.; Dangla, P.; Djerbi, A.; et al. The FastCarb project: Taking advantage of the accelerated carbonation of recycled concrete aggregates. Case Stud. Constr. Mater. 2022, 17, e01349. [Google Scholar] [CrossRef]
  41. Li, L.; Wu, M. An overview of utilizing CO2 for accelerated carbonation treatment in the concrete industry. J. CO2 Util. 2022, 60, 102000. [Google Scholar] [CrossRef]
  42. Thonemann, N.; Zacharopoulos, L.; Fromme, F.; Nühlen, J. Environmental impacts of carbon capture and utilization by mineral carbonation: A systematic literature review and meta life cycle assessment. J. Clean. Prod. 2022, 332, 130067. [Google Scholar] [CrossRef]
  43. Zhang, Y.; Luo, W.; Wang, J.; Wang, Y.; Xu, Y.; Xiao, J. A review of life cycle assessment of recycled aggregate concrete. Constr. Build. Mater. 2019, 209, 115–125. [Google Scholar] [CrossRef]
  44. Huang, H.; Wang, T.; Kolosz, B.; Andresen, J.; Garcia, S.; Fang, M.; Maroto-Valer, M.M. Life-cycle assessment of emerging CO2 mineral carbonation-cured concrete blocks: Comparative analysis of CO2 reduction potential and optimization of environmental impacts. J. Clean. Prod. 2019, 241, 118359. [Google Scholar] [CrossRef]
  45. Hossain, M.U.; Poon, C.S.; Dong, Y.H.; Xuan, D. Evaluation of environmental impact distribution methods for supplementary cementitious materials. Renew. Sustain. Energy Rev. 2018, 82, 597–608. [Google Scholar] [CrossRef]
  46. Sun, J.; Chen, J.; Liao, X.; Tian, A.; Hao, J.; Wang, Y.; Tang, Q. The workability and crack resistance of natural and recycled aggregate mortar based on expansion agent through an environmental study. Sustainability 2021, 13, 491. [Google Scholar] [CrossRef]
  47. Chen, T.; Zhao, L.; Gao, X.; Li, L.; Qin, L. Modification of carbonation-cured cement mortar using biochar and its environmental evaluation. Cem. Concr. Compos. 2022, 134, 104764. [Google Scholar] [CrossRef]
  48. Praneeth, S.; Saavedra, L.; Zeng, M.; Dubey, B.K.; Sarmah, A.K. Biochar admixtured lightweight, porous and tougher cement mortars: Mechanical, durability and micro computed tomography analysis. Sci. Total Environ. 2021, 750, 142327. [Google Scholar] [CrossRef]
  49. Xing, W.; Tam, V.W.Y.; Le, K.N.; Butera, A.; Hao, J.L.; Wang, J. Effects of mix design and functional unit on life cycle assessment of recycled aggregate concrete: Evidence from CO2 concrete. Constr. Build. Mater. 2022, 348, 128712. [Google Scholar] [CrossRef]
  50. Xing, W.; Tam, V.W.; Le, K.N.; Hao, J.L.; Wang, J. Life cycle assessment of recycled aggregate concrete on its environmental impacts: A critical review. Constr. Build. Mater. 2022, 317, 125950. [Google Scholar] [CrossRef]
  51. Zhan, B.; Poon, C.; Shi, C. CO2 curing for improving the properties of concrete blocks containing recycled aggregates. Cem. Concr. Compos. 2013, 42, 1–8. [Google Scholar] [CrossRef]
  52. Zhang, N.; Zhang, D.; Zuo, J.; Miller, T.R.; Duan, H.; Schiller, G. Potential for CO2 mitigation and economic benefits from accelerated carbonation of construction and demolition waste. Renew. Sustain. Energy Rev. 2022, 169, 112920. [Google Scholar] [CrossRef]
  53. UNE-EN-933-1; Tests for Geometrical Properties of Aggregates. Part 1: Determination of Particle Size Distribution. Sieving Method. CEN: Imperial, CA, USA, 2012.
  54. UNE-EN-1097-6:2013; Tests for Mechanical and Physical Properties of Aggregates. Part 6: Determination of Particle Density and Water Absorption. CEN: Imperial, CA, USA, 2013.
  55. UNE-EN-197-1:2011; Part 1: Composition, Specifications and Conformity Criteria for Common Cements. CEN: Imperial, CA, USA, 2011.
  56. UNE-EN-12350-2; Testing Fresh Concrete. Part 2: Slump Test. CEN: Imperial, CA, USA, 2019.
  57. BS EN 1992-1-1:2004; Eurocode 2: Design of Concrete-Part 1-1: General Rules and Rules for Biddings. The European Union: Maastricht, The Netherlands, 2015.
  58. UNE-EN-206:2013+A2; Concrete. Specification, Performance, Production and Conformity. CEN: Imperial, CA, USA, 2021.
  59. Soutsos, M.N.; Tang, K.; Millard, S.G. Use of recycled demolition aggregate in precast products, phase II: Concrete paving blocks. Constr. Build. Mater. 2011, 25, 3131–3143. [Google Scholar] [CrossRef]
  60. JCPDS. Joint Committee on Power Diffraction Standard-International Centre for Diffraction; JCPDS: Newtown Square, PA, USA, 2003. [Google Scholar]
  61. Snellings, R.; Chwast, J.; Cizer, Ö.; De Belie, N.; Dhandapani, Y.; Durdzinski, P.; Elsen, J.; Haufe, J.; Hooton, D.; Patapy, C.; et al. RILEM TC-238 SCM recommendation on hydration stoppage by solvent exchange for the study of hydrate assemblages. Mater. Struct. Constr. 2018, 51, 172. [Google Scholar] [CrossRef]
  62. Suescum-Morales, D.; Ríos, J.D.; De La Concha, A.M.; Cifuentes, H.; Jiménez, J.R.; Fernández, J.M. Effect of moderate temperatures on compressive strength of ultra-high-performance concrete: A microstructural analysis. Cem. Concr. Res. 2021, 140, 106303. [Google Scholar] [CrossRef]
  63. Suescum-Morales, D.; Bravo, M.; Silva, R.V.; Jiménez, J.R.; Fernandez-Rodriguez, J.M.; de Brito, J. Effect of reactive magnesium oxide in alkali-activated fly ash mortars exposed to accelerated CO2 curing. Constr. Build. Mater. 2022, 342, 127999. [Google Scholar] [CrossRef]
  64. Gonzalez-Caro, Á.; Merino-lechuga, A.M.; Fernández Ledesma, E.; Suescum-morales, D. The Effect of Acanthocardia tuberculata Shell Powder as Filler on the Performance of Self-Compacting Mortar. Materials 2023, 16, 1734. [Google Scholar] [CrossRef] [PubMed]
  65. EN-12390-4:2020; Testing Hardened Concrete. Part 4: Compressive Strength of Test Specimens. BSI: San Jose, CA, USA, 2020.
  66. UNE-83980:2014; Concrete Durability. Test Methods. Determination of the Water Absorption, Density and Accesible Porosity for Water in Concrete. BSI: San Jose, CA, USA, 2014.
  67. Arcos-Vargas, A.; Núñez-Hernández, F.; Ballesteros-Gallardo, J.A. CO2 price effects on the electricity market and greenhouse gas emissions levels: An application to the Spanish market. Clean Technol. Environ. Policy 2022, 25, 997–1014. [Google Scholar] [CrossRef]
  68. Harun, N.; Nittaya, T.; Douglas, P.L.; Croiset, E.; Ricardez-Sandoval, L.A. Dynamic simulation of MEA absorption process for CO2 capture from power plants. Int. J. Greenh. Gas Control 2012, 10, 295–309. [Google Scholar] [CrossRef] [Green Version]
  69. Li, K.; Leigh, W.; Feron, P.; Yu, H.; Tade, M. Systematic study of aqueous monoethanolamine (MEA)-based CO2 capture process: Techno-economic assessment of the MEA process and its improvements. Appl. Energy 2016, 165, 648–659. [Google Scholar] [CrossRef]
  70. Batuecas, E.; Ramón-Álvarez, I.; Sánchez-Delgado, S.; Torres-Carrasco, M. Carbon footprint and water use of alkali-activated and hybrid cement mortars. J. Clean. Prod. 2021, 319, 128653. [Google Scholar] [CrossRef]
  71. Xiong, C.; Li, Q.; Lan, T.; Li, H.; Long, W.; Xing, F. Sustainable use of recycled carbon fiber reinforced polymer and crumb rubber in concrete: Mechanical properties and ecological evaluation. J. Clean. Prod. 2021, 279, 123624. [Google Scholar] [CrossRef]
  72. Yap, S.P.; Chen, P.Z.C.; Goh, Y.; Ibrahim, H.A.; Mo, K.H.; Yuen, C.W. Characterization of pervious concrete with blended natural aggregate and recycled concrete aggregates. J. Clean. Prod. 2018, 181, 155–165. [Google Scholar] [CrossRef]
  73. Reig, L.; Tashima, M.M.; Borrachero, M.V.; Monzó, J.; Cheeseman, C.R.; Payá, J. Properties and microstructure of alkali-activated red clay brick waste. Constr. Build. Mater. 2013, 43, 98–106. [Google Scholar] [CrossRef] [Green Version]
  74. Silva, R.V.; De Brito, J.; Dhir, R.K. Performance of cementitious renderings and masonry mortars containing recycled aggregates from construction and demolition wastes. Constr. Build. Mater. 2016, 105, 400–415. [Google Scholar] [CrossRef]
  75. Böke, H.; Akkurt, S.; Ipekoǧlu, B.; Uǧurlu, E. Characteristics of brick used as aggregate in historic brick-lime mortars and plasters. Cem. Concr. Res. 2006, 36, 1115–1122. [Google Scholar] [CrossRef]
  76. Gonzalez-Corominas, A.; Etxeberria, M. Properties of high performance concrete made with recycled fine ceramic and coarse mixed aggregates. Constr. Build. Mater. 2014, 68, 618–626. [Google Scholar] [CrossRef]
  77. Gu, K.; Jin, F.; Al-Tabbaa, A.; Shi, B. Activation of ground granulated blast furnace slag by using calcined dolomite. Constr. Build. Mater. 2014, 68, 252–258. [Google Scholar] [CrossRef] [Green Version]
  78. Sasaki, K.; Qiu, X.; Hosomomi, Y.; Moriyama, S.; Hirajima, T. Effect of natural dolomite calcination temperature on sorption of borate onto calcined products. Microporous Mesoporous Mater. 2013, 171, 1–8. [Google Scholar] [CrossRef]
  79. Patel, S.; Orlov, A.; Ariyachandra, E.; Peethamparan, S. Effect of flue gas temperature on NO2 adsorption by aged recycled concrete Waste: DRIFTS, TGA and BET study. Chem. Eng. J. 2021, 420, 130413. [Google Scholar] [CrossRef]
  80. Esquinas, A.R.; Ramos, C.; Jiménez, J.R.; Fernández, J.M.; de Brito, J. Mechanical behaviour of self-compacting concrete made with recovery filler from hot-mix asphalt plants. Constr. Build. Mater. 2017, 131, 114–128. [Google Scholar] [CrossRef]
  81. Phung, Q.T.; Maes, N.; Seetharam, S. Pitfalls in the use and interpretation of TGA and MIP techniques for Ca-leached cementitious materials. Mater. Des. 2019, 182, 108041. [Google Scholar] [CrossRef]
  82. Ashraf, W.; Olek, J. Elucidating the accelerated carbonation products of calcium silicates using multi-technique approach. J. CO2 Util. 2018, 23, 61–74. [Google Scholar] [CrossRef]
  83. Xiao, J.; Li, W.; Poon, C. Recent studies on mechanical properties of recycled aggregate concrete in China-A review. Sci. China Technol. Sci. 2012, 55, 1463–1480. [Google Scholar] [CrossRef]
  84. Silva, R.V.; De Brito, J.; Dhir, R.K. Establishing a relationship between modulus of elasticity and compressive strength of recycled aggregate concrete. J. Clean. Prod. 2016, 112, 2171–2186. [Google Scholar] [CrossRef]
  85. Xia, D.T.; Xie, S.J.; Fu, M.; Zhu, F. Effects of maximum particle size of coarse aggregates and steel fiber contents on the mechanical properties and impact resistance of recycled aggregate concrete. Adv. Struct. Eng. 2021, 24, 3085–3098. [Google Scholar] [CrossRef]
  86. Sosa, M.E.; Villagrán Zaccardi, Y.A.; Zega, C.J. A critical review of the resulting effective water-to-cement ratio of fine recycled aggregate concrete. Constr. Build. Mater. 2021, 313, 125536. [Google Scholar] [CrossRef]
  87. Kim, J. Influence of quality of recycled aggregates on the mechanical properties of recycled aggregate concretes: An overview. Constr. Build. Mater. 2022, 328, 127071. [Google Scholar] [CrossRef]
  88. Infante Gomes, R.; Brazão Farinha, C.; Veiga, R.; de Brito, J.; Faria, P.; Bastos, D. CO2 sequestration by construction and demolition waste aggregates and effect on mortars and concrete performance-An overview. Renew. Sustain. Energy Rev. 2021, 152, 111668. [Google Scholar] [CrossRef]
  89. Winnefeld, F.; Leemann, A.; German, A.; Lothenbach, B. CO2 storage in cement and concrete by mineral carbonation. Curr. Opin. Green Sustain. Chem. 2022, 38, 100672. [Google Scholar] [CrossRef]
  90. Sanjuán, M.A.; Andrade, C.; Cheyrezy, M. Concrete carbonation tests in natural and accelerated conditions. Adv. Cem. Res. 2003, 15, 171–180. [Google Scholar] [CrossRef]
  91. Silva, R.V.; Jiménez, J.R.; Agrela, F.; De Brito, J. Real-scale applications of recycled aggregate concrete. New Trends Eco-Effic. Recycl. Concr. 2018, 21, 573–589. [Google Scholar] [CrossRef]
  92. Wu, J.; Zhang, Y.; Zhu, P.; Feng, J.; Hu, K. Mechanical Properties and ITZ Microstructure of Recycled Aggregate Concrete Using Carbonated Recycled Coarse Aggregate. J. Wuhan Univ. Technol. Mater. Sci. Ed. 2018, 33, 648–653. [Google Scholar] [CrossRef]
  93. Kou, S.C.; Zhan, B.J.; Poon, C.S. Use of a CO2 curing step to improve the properties of concrete prepared with recycled aggregates. Cem. Concr. Compos. 2014, 45, 22–28. [Google Scholar] [CrossRef]
  94. Shi, C.; He, F.; Wu, Y. Effect of pre-conditioning on CO2 curing of lightweight concrete blocks mixtures. Constr. Build. Mater. 2012, 26, 257–267. [Google Scholar] [CrossRef]
  95. de Matos, P.R.; Andrade Neto, J.S.; Jansen, D.; De la Torre, A.G.; Kirchheim, A.P.; Campos, C.E.M. In-situ laboratory X-ray diffraction applied to assess cement hydration. Cem. Concr. Res. 2022, 162, 106988. [Google Scholar] [CrossRef]
  96. Gonçalves, T.; Silva, R.V.; de Brito, J.; Fernández, J.M.; Esquinas, A.R. Mechanical and durability performance of mortars with fine recycled concrete aggregates and reactive magnesium oxide as partial cement replacement. Cem. Concr. Compos. 2020, 105, 103420. [Google Scholar] [CrossRef]
  97. Lozano-Lunar, A.; Dubchenko, I.; Bashynskyi, S.; Rodero, A.; Fernández, J.M.; Jiménez, J.R. Performance of self-compacting mortars with granite sludge as aggregate. Constr. Build. Mater. 2020, 251, 118998. [Google Scholar] [CrossRef]
  98. Skalny, J.; Johansen, V.; Ïhaulow, N.; Palomo, A. As a form of sulfate attack. Mater. Construcción 1996, 46, 5–29. [Google Scholar] [CrossRef] [Green Version]
  99. Berger, R.L.; Young, J.F.; Leung, K. Acceleration of hydration of calcium silicates.pdf. Nat. Phys. Sci. 1972, 240, 16–18. [Google Scholar] [CrossRef]
  100. Xian, X.; Mahoutian, M.; Shao, Y. Production of concrete pipes by carbonation curing in an inflatable enclosure. Constr. Build. Mater. 2023, 363, 129861. [Google Scholar] [CrossRef]
  101. Zou, C.; Long, G.; Ma, C.; Xie, Y. Effect of subsequent curing on surface permeability and compressive strength of steam-cured concrete. Constr. Build. Mater. 2018, 188, 424–432. [Google Scholar] [CrossRef]
  102. Ramesh, B.A.; Kondraivendhan, B. Effect of Accelerated Carbonation on the Performance of Concrete Containing Natural Zeolite. J. Mater. Civ. Eng. 2020, 32, 04020037. [Google Scholar] [CrossRef]
  103. Zhan, B.J.; Xuan, D.X.; Poon, C.S.; Shi, C.J. Mechanism for rapid hardening of cement pastes under coupled CO2-water curing regime. Cem. Concr. Compos. 2019, 97, 78–88. [Google Scholar] [CrossRef]
  104. Bao, H.; Xu, G.; Wang, Q.; Peng, Y.; Liu, J. Study on the deterioration mechanism of cement-based materials in acid water containing aggressive carbon dioxide. Constr. Build. Mater. 2020, 243, 118233. [Google Scholar] [CrossRef]
  105. Shi, J.; Liu, B.; Shen, S.; Tan, J.; Dai, J.; Ji, R. Effect of curing regime on long-term mechanical strength and transport properties of steam-cured concrete. Constr. Build. Mater. 2020, 255, 119407. [Google Scholar] [CrossRef]
  106. Ye, G.; Liu, X.; De Schutter, G.; Poppe, A.M.; Taerwe, L. Influence of limestone powder used as filler in SCC on hydration and microstructure of cement pastes. Cem. Concr. Compos. 2007, 29, 94–102. [Google Scholar] [CrossRef]
  107. Kim, Y.Y.; Lee, K.M.; Bang, J.W.; Kwon, S.J. Effect of W/C ratio on durability and porosity in cement mortar with constant cement amount. Adv. Mater. Sci. Eng. 2014, 2014, 273460. [Google Scholar] [CrossRef] [Green Version]
  108. Moro, C.; Francioso, V.; Velay-Lizancos, M. Modification of CO2 capture and pore structure of hardened cement paste made with nano-TiO2 addition: Influence of water-to-cement ratio and CO2 exposure age. Constr. Build. Mater. 2021, 275, 122131. [Google Scholar] [CrossRef]
  109. Evangelista, L.; de Brito, J. Environmental life cycle assestment of concrete with fine recycled concrete aggregates. In SB07 Portugal: Sustainable Construction, Materials and Practices: Challenge of the Industry for the New Millenium; InHouse Publishing: Underwood, Australia, 2007; Volume 15, pp. 165–175. [Google Scholar]
  110. Evangelista, L.; de Brito, J. Durability performance of concrete made with fine recycled concrete aggregates. Cem. Concr. Compos. 2010, 32, 9–14. [Google Scholar] [CrossRef]
  111. Silva, R.V.; De Brito, J.; Dhir, R.K. Properties and composition of recycled aggregates from construction and demolition waste suitable for concrete production. Constr. Build. Mater. 2014, 65, 201–217. [Google Scholar] [CrossRef]
  112. Duan, Z.H.; Kou, S.C.; Poon, C.S. Prediction of compressive strength of recycled aggregate concrete using artificial neural networks. Constr. Build. Mater. 2013, 40, 1200–1206. [Google Scholar] [CrossRef]
  113. Tam, V.W.; Butera, A.; Le, K.N. Mechanical properties of CO2 concrete utilising practical carbonation variables. J. Clean. Prod. 2021, 294, 126307. [Google Scholar] [CrossRef]
Figure 1. Images of the aggregates used (A) CG, (B) FG, (C) S1, (D) S2, (E) RCA and (F) MCA.
Materials 16 02436 g001
Figure 2. Original particle size distribution of aggregates used.
Materials 16 02436 g002
Figure 3. Particle size distribution of CG + FG, RCA sieving and MCA.
Materials 16 02436 g003
Figure 4. (A) 3-D modelling of the special part used to compact the manufactured concrete, made by the authors; (B) Hammer used and (C) Specimens demoulded immediately after being manufactured.
Materials 16 02436 g004
Figure 5. CO2 emission system for CONTROL, M-100-RCA and M-100-MCA mixtures.
Materials 16 02436 g005
Figure 6. XRD patterns of natural aggregates used.
Materials 16 02436 g006
Figure 7. XRD patterns of recycled aggregates and cement used.
Materials 16 02436 g007
Figure 8. TGA (Solid lines) and DTA (dotted lines) curves for natural aggregates used.
Materials 16 02436 g008
Figure 9. TGA (Solid lines) and DTA (dotted lines) curves of recycled aggregates and cement used.
Materials 16 02436 g009
Figure 10. Compressive strength development of CONTROL, M-100-RCA and M-100-MCA under (A) CCC and (B) CO2CC at the ages of 1, 3, 7, 14 and 28 days.
Materials 16 02436 g010
Figure 11. Dry bulk density and accessible porosity for water of control, M-100-RCA and M-100-MCA under CCC and CO2CC at 28 days.
Materials 16 02436 g011
Figure 12. X-ray diffraction obtained for control under CCC and CO2CC at 7, 14 and 28 days.
Materials 16 02436 g012
Figure 13. X-ray diffraction obtained for M-100-RCA under CCC and CO2CC at 7, 14 and 28 days.
Materials 16 02436 g013
Figure 14. X-ray diffraction obtained for M-100-MCA under CCC and CO2CC at 7, 14 and 28 days.
Materials 16 02436 g014
Figure 15. TGA (solid lines) and DTA (dotted lines) of control under (A) CCC and (B) CO2CC at 7, 14 and 28 days.
Materials 16 02436 g015
Figure 16. TGA (solid lines) and DTA (dotted lines) of M-100-RCA under (A) CCC and (B) CO2CC at 7, 14 and 28 days.
Materials 16 02436 g016
Figure 17. TGA (solid lines) and DTA (dotted lines) of M-100-MCA under (A) CCC and (B) CO2CC at 7, 14 and 28 days.
Materials 16 02436 g017
Table 1. Basic physical parameters of the aggregates used.
Type of AggregatesSkeletal Density
γ (g/cm3)
Water Absorption
(%)
Coarse gravel (CG)2.473.13
Fine gravel (FG)2.432.64
Sand 1 (S1)2.652.40
Sand 2 (S2)2.621.78
Recycled concrete aggregate (RCA)2.217.42
Mixed concrete aggregate (MCA)2.179.02
Table 2. Mixture proportion of concrete mixtures.
NotationMixture Proportions (kg/m3)
Effective
Water
Additional Water/Saturati-on waterCemCoarse Gravel
(CG)
Fine Gravel
(FG)
Sand 1
(S1)
Sand 2
(S2)
Recycled Aggregate Concrete
(RAC)
Mixed Aggregate Concrete
(MAC)
SpW/C
CONTROL84502102007002001200--0.50.4
M-100-RCA8486.70210--2001200815.60-0.50.4
M-100-MCA8498.22210--2001200-798.950.50.4
Table 3. Carbon emission coefficient for materials and curing used.
MaterialsFactor IiUnitReferences
Cement1.002Kg CO2 eq/kg[47,49,70]
Superplasticizer 1.150Kg CO2 eq/kg[49]
Water3.47 × 10−4Kg CO2 eq/kg[70]
Coarse gravel4.10 × 10−3Kg CO2 eq/kg[47]
Fine gravel9.87 × 10−3Kg CO2 eq/kg[49]
Sand 12.79 × 10⁻³Kg CO2 eq/kg[71]
Sand 23.21 × 10⁻³Kg CO2 eq/kg[49]
Recycled concrete aggregate1.50 × 10−3Kg CO2 eq/kg[46,49]
Mixed concrete aggregate1.30 × 10−3Kg CO2 eq/kg[46,49]
CuringFactor Eele/ECO2-curUnit
Conventional Chamber
(0.15 kW/h)
0.03kg CO2 eq/h curing[52,67,68,69]
CO2 Chamber
(0.15 kW/h)
0.03kg CO2 eq/h curing[52,67,68,69]
Table 4. Chemical components of raw materials.
Components
(Mass% as Oxide)
Coarse Gravel
(CG)
Fine Gravel
(FG)
Sand 1
(S1)
Sand 2
(S2)
Recycled Concrete Aggregate
(RCA)
Mixed Concrete Aggregate
(MCA)
Cement
Na2O----0.820.820.24
MgO0.880.9637.980.782.773.111.33
Al2O30.200.730.060.967.7810.493.73
SiO20.392.120.912.1651.4052.0815.58
P2O5----0.110.120.09
SO30.070.100.110.111.141.354.79
Cl2O3-0.050.21-0.060.100.18
K2O0.030.090.050.181.802.381.21
CaO98.3195.7560.4490.3230.6225.1570.03
TiO2----0.430.550.23
MnO2----0.090.080.06
Fe2O30.100.180.235.502.763.592.44
CuO-------
ZnO------0.02
SrO0.03---0.030.040.08
Rb2O-----0.01-
Cr2O3----0.210.15-
Table 5. Different weight losses for all the mixtures studied and increase in CO2 sequestrated using CO2CC.
MixesΔ Mass (%)Δ Mass
(450–1000 °C)
CO2
Sequestrated (wt.%)
According to Equation (16)
Increase
in CO2
Sequestrated (g/t)
Increase
in CO2
Sequestrated
(g/m3)
RT-105 °C105–400 °C400–450 °C450–650 °C650–1000 °C
CONTROL-CCC- 7 Days−0.465−0.585−0.230−0.879−38.615−39.494
CONTROL-CCC- 14 Days−0.414−0.609−0.186−0.927−39.351−40.278
CONTROL-CCC- 28 Days−0.366−0.734−0.186−1.028−39.775−40.804
CONTROL-CO2CC- 7 Days−0.412−0.526−0.155−1.058−38.730−39.7890.29452945.216567.83
CONTROL-CO2CC- 14 Days−0.320−0.588−0.096−1.087−39.559−40.6470.36933693.838237.24
CONTROL-CO2CC- 28 Days−0.326−0.647−0.009−1.175−39.995−41.1700.36633663.328169.12
M-100-RCA-CCC- 7 Days−0.617−1.086−0.261−0.955−29.467−30.422
M-100-RCA-CCC- 14 Days−0.698−1.244−0.282−1.083−30.912−31.996
M-100-RCA-CCC- 28 Days−0.639−1.164−0.260−1.144−31.416−32.561
M-100-RCA-CO2CC- 7 Days−0.584−1.081−0.205−1.665−29.538−31.2030.78107810.9417,340.28
M-100-RCA-CO2CC- 14 Days−0.526−1.097−0.198−1.644−31.197−32.8420.84578457.5218,775.57
M-100-RCA-CO2CC- 28 Days−0.516−1.051−0.175−1.593−31.817−33.4100.84928492.9918,854.44
M-100-MCA-CCC- 7 Days−0.563−1.186−0.289−1.007−28.325−29.332
M-100-MCA-CCC- 14 Days−0.444−1.116−0.229−1.388−28.663−30.051
M-100-MCA-CCC- 28 Days−0.611−1.022−0.188−1.120−28.306−29.427
M-100-MCA-CO2CC- 7 Days−0.669−0.987−0.209−1.317−28.550−29.8670.53445344.9811,491.71
M-100-MCA-CO2CC- 14 Days−0.490−0.953−0.160−1.530−29.296−30.8260.77057702.2516,652.22
M-100-MCA-CO2CC- 28 Days−0.467−0.945−0.148−1.440−28.757−30.1970.77457745.2716,560.97
Table 6. CO2 emissions for materials and Curing.
MaterialsCO2 Emission Control
(kg CO2 eq/m3)
CO2 Emission
M-100-RCA
(kg CO2 eq/m3)
CO2 Emission
M-100-MCA
(kg CO2 eq/m3)
Cement210.420210.420210.42
Superplasticizer 0.5750.5750.575
Water0.0460.0590.063
Coarse gravel0.820--
Fine gravel6.909--
Sand 10.5580.5580.558
Sand 23.8523.8523.852
Recycled concrete aggregate-1.223-
Mixed concrete aggregate--1.038
CO2 emitted materials223.180216.687216.506
Curing7 Days
(kg CO2 eq/m3)
14 Days
(kg CO2 eq/m3)
28 Days
(kg CO2 eq/m3)
Conventional Chamber
(0.15 kW/h)
5.0410.0820.16
CO2 Chamber
(0.15 kW/h)
5.0410.0820.16
Table 7. Summary of total CO2 emissions by mixtures and CO2 sequestration.
Total CO2 Emissions (kg CO2 eq/m3)Total CO2 Emissions—CO2 Sequestrated (kg CO2 eq/m3)
CONTROL-CCC- 7 Days228.22228.22
CONTROL-CCC- 14 Days233.26233.26
CONTROL-CCC- 28 Days243.34243.34
CONTROL-CO2CC- 7 Days228.22221.66
CONTROL- CO2CC- 14 Days233.26225.02
CONTROL- CO2CC- 28 Days243.34235.17
M-100-RCA-CCC- 7 Days221.72221.72
M-100-RCA-CCC- 14 Days226.76226.76
M-100-RCA-CCC- 28 Days236.84236.84
M-100-RCA-CO2CC- 7 Days221.72204.38
M-100-RCA-CO2CC- 14 Days226.76207.99
M-100-RCA-CO2CC- 28 Days236.84217.99
M-100-MCA-CCC- 7 Days221.54221.54
M-100-MCA-CCC- 14 Days226.58226.58
M-100-MCA-CCC- 28 Days236.66236.66
M-100-MCA-CO2CC- 7 Days221.54210.05
M-100-MCA-CO2CC- 14 Days226.58209.93
M-100-MCA-CO2CC- 28 Days236.66220.10
Disclaimer/Publisher’s Note: The statements, opinions and data contained in all publications are solely those of the individual author(s) and contributor(s) and not of MDPI and/or the editor(s). MDPI and/or the editor(s) disclaim responsibility for any injury to people or property resulting from any ideas, methods, instructions or products referred to in the content.

