
Bi-Functionalized Transferrin@MoS2-PEG Nanosheets for Improving Cellular Uptake in HepG2 Cells
 , and
, and 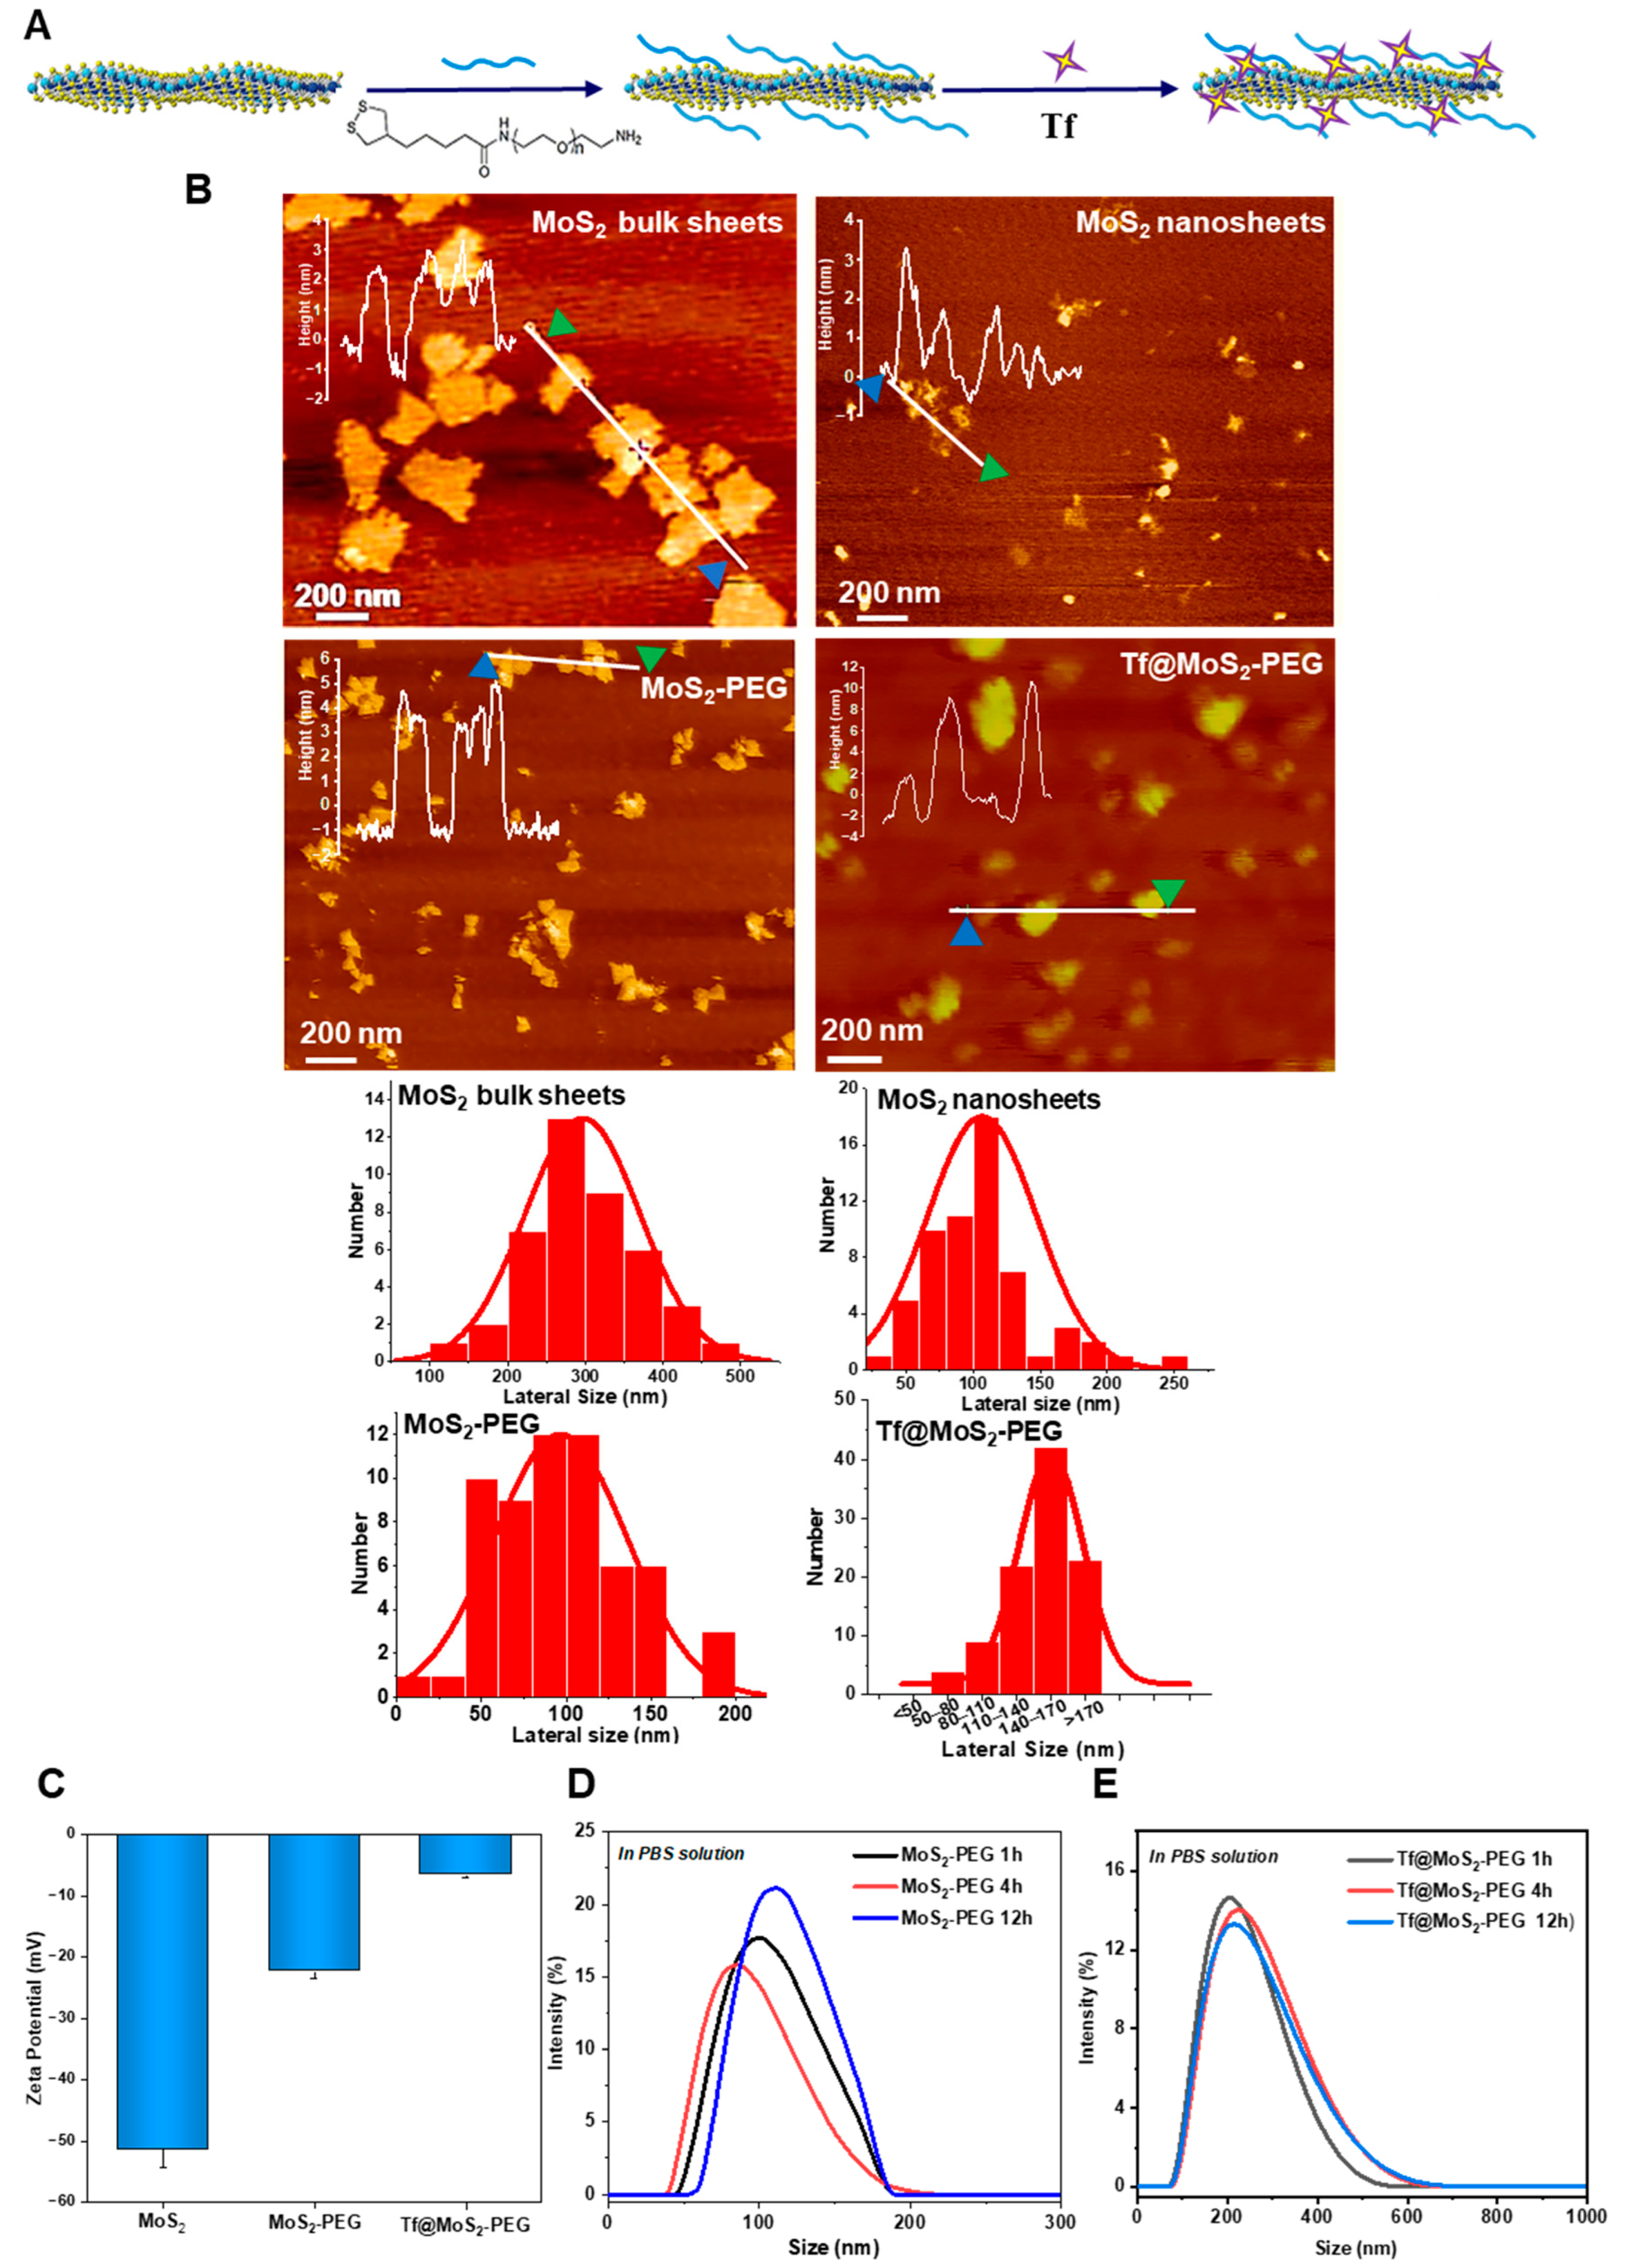
Abstract
:1. Introduction
2. Experimental Section
2.1. Materials
2.2. Preparation and Characterization of TF@MoS2-PEG and BSA@MoS2-PEG
2.3. Physicochemical Characterization of MoS2-PEG, Tf@MoS2-PEG, and BSA@MoS2-PEG Complex
2.4. Competitive Adsorption of Tf with BSA on MoS2-PEG NSs
2.5. Single Cellular Uptake Analysis
3. Results and Discussion
3.1. Formation of Tf@MoS2-PEG Complex
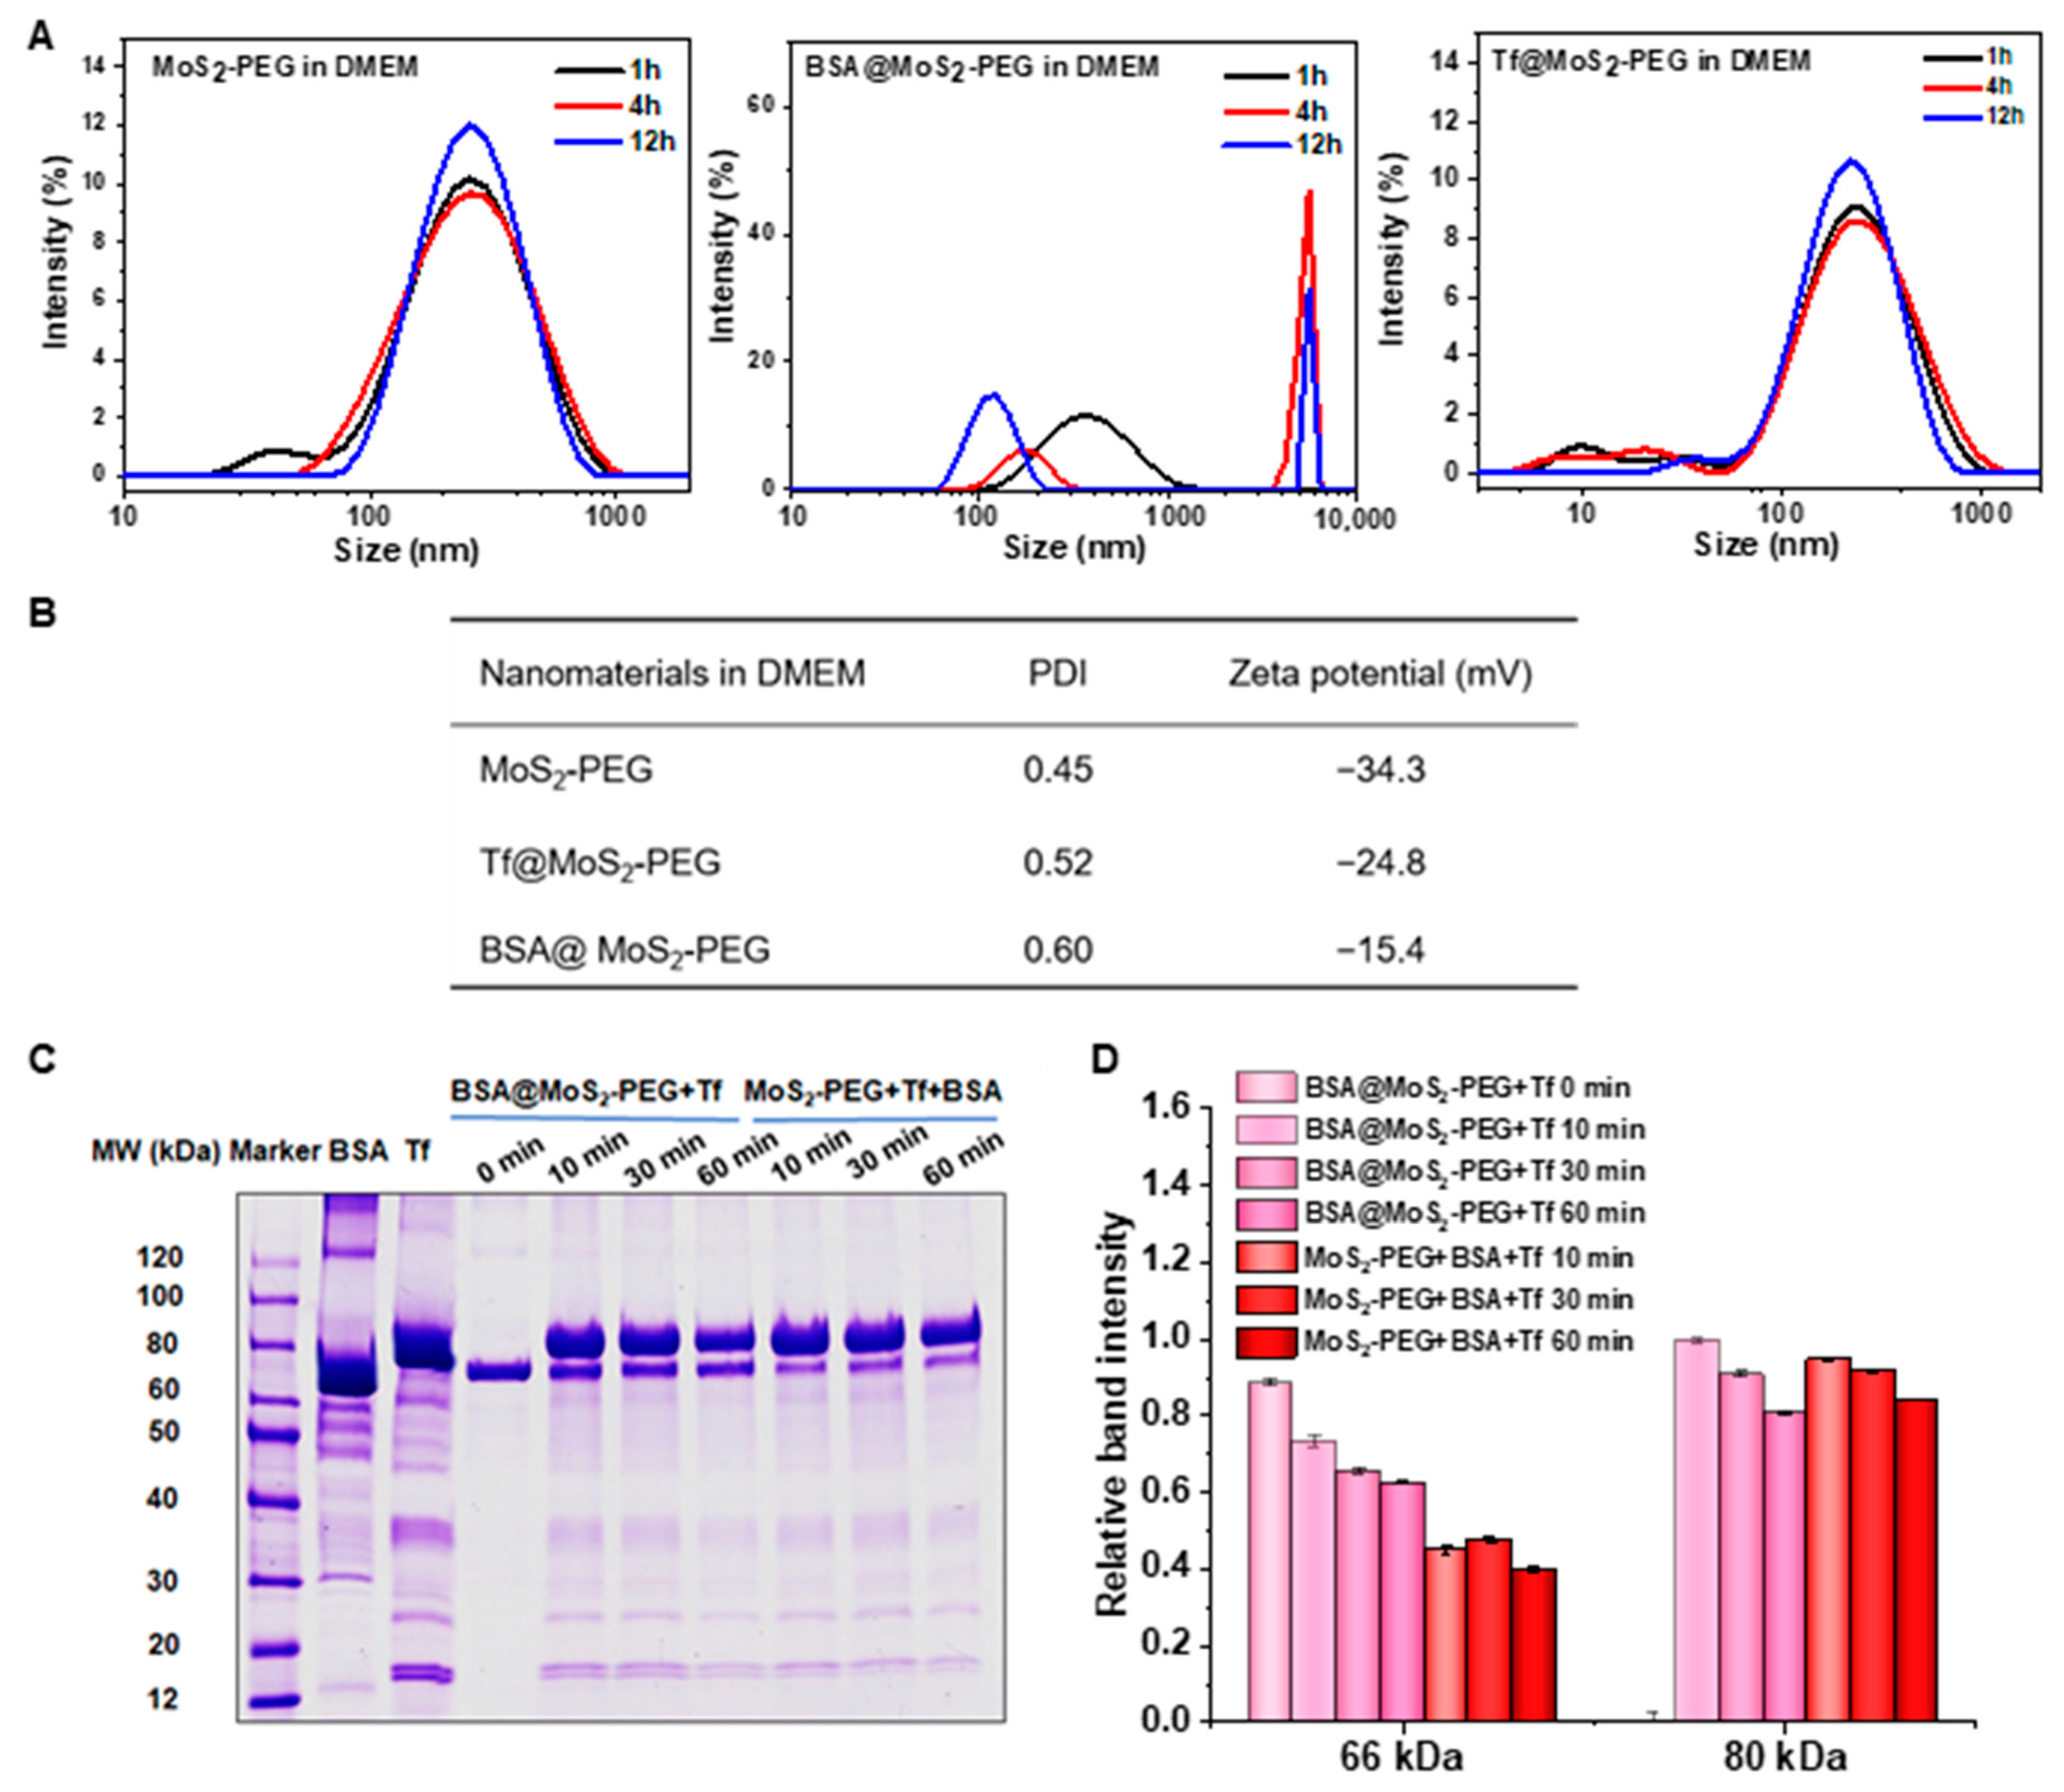
3.2. Competitive Adsorption of Tf and BSA on MoS2-PEG NSs
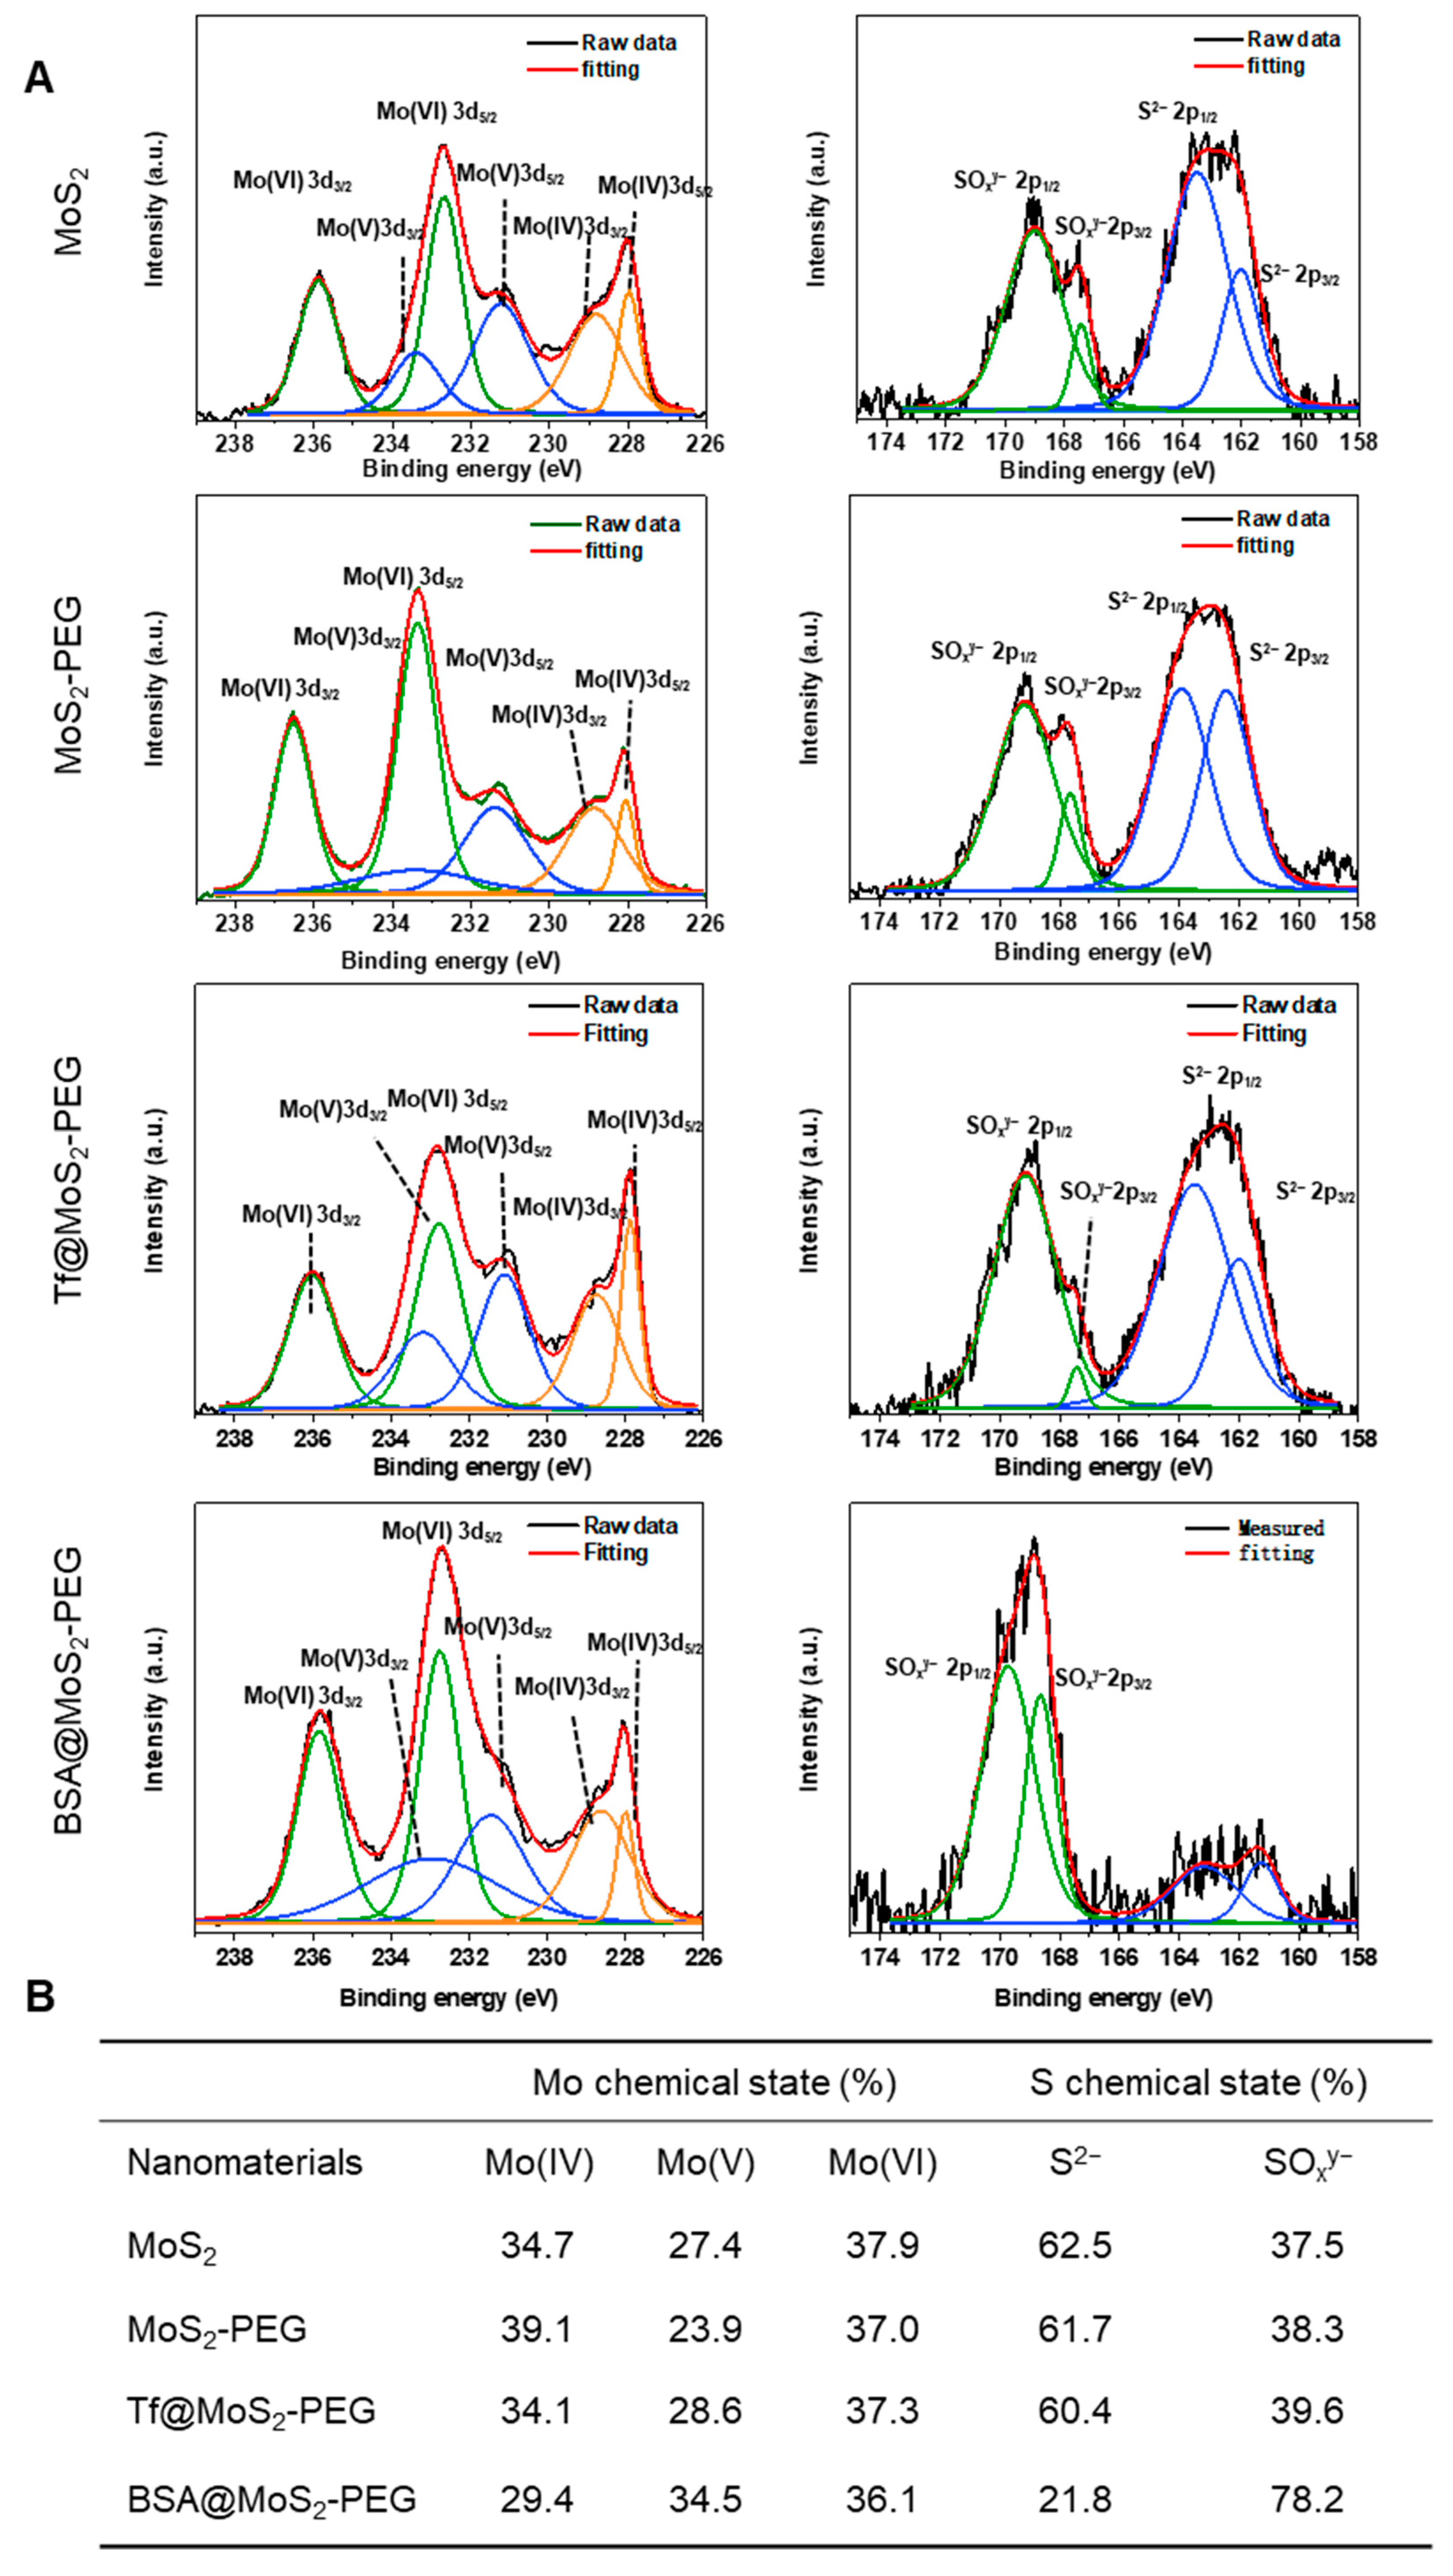
3.3. Chemical State Analysis of MoS2 NSs before and after Protein Coating by Synchrotron Radiation XPS
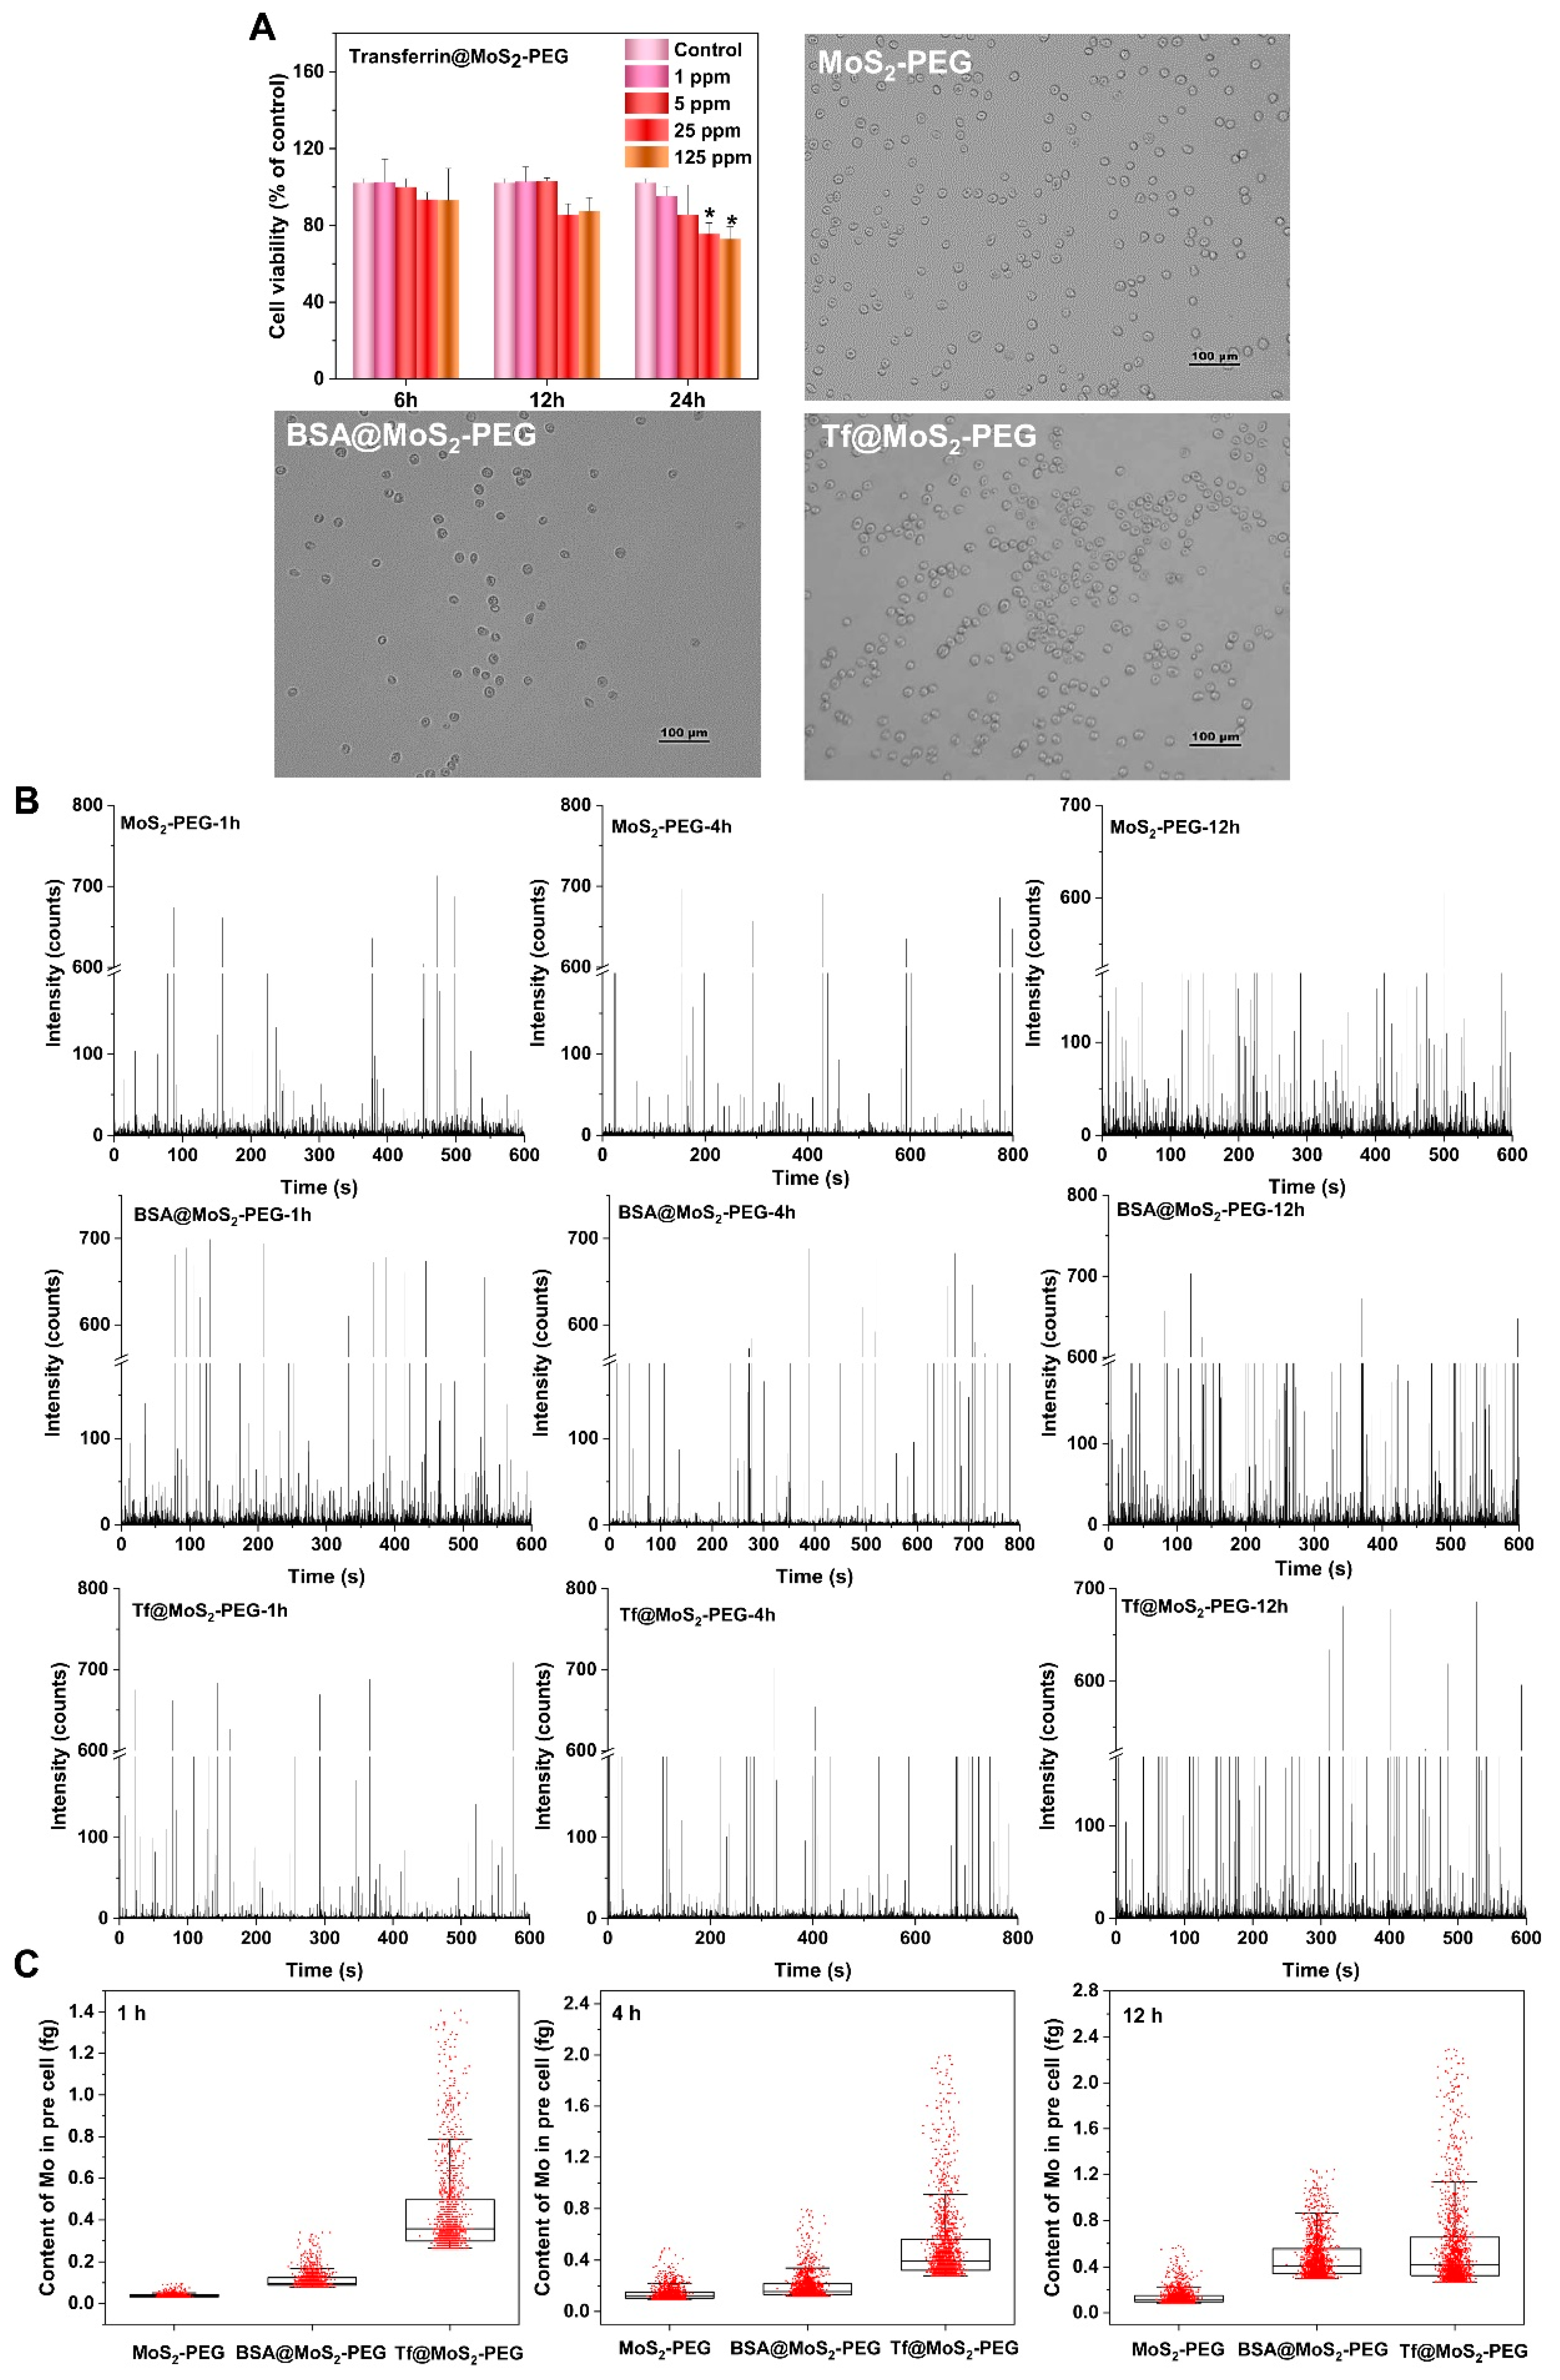
3.4. Single-Cell Uptake Analysis by Time-Resolved ICP-MS
4. Conclusions
Author Contributions
Funding
Institutional Review Board Statement
Informed Consent Statement
Data Availability Statement
Acknowledgments
Conflicts of Interest
References
- Ren, J.; Andrikopoulos, N.; Velonia, K.; Tang, H.; Cai, R.; Ding, F.; Ke, P.C.; Chen, C. Chemical and Biophysical Signatures of the Protein Corona in Nanomedicine. J. Am. Chem. Soc. 2022, 144, 9184–9205. [Google Scholar] [CrossRef] [PubMed]
- Cai, R.; Chen, C. The Crown and the Scepter: Roles of the Protein Corona in Nanomedicine. Adv. Mater. 2019, 31, 1805740. [Google Scholar] [CrossRef]
- Baimanov, D.; Wu, J.; Chu, R.; Cai, R.; Wang, B.; Cao, M.; Tao, Y.; Liu, J.; Guo, M.; Wang, J.; et al. Immunological Responses Induced by Blood Protein Coronas on Two-Dimensional MoS2 Nanosheets. ACS Nano 2020, 14, 5529–5542. [Google Scholar] [CrossRef]
- Cai, R.; Ren, J.; Ji, Y.; Wang, Y.; Liu, Y.; Chen, Z.; Sabet, Z.F.; Wu, X.; Lynch, I.; Chen, C. Corona of Thorns: The Surface Chemistry-Mediated Protein Corona Perturbs the Recognition and Immune Response of Macrophages. ACS Appl. Mater. Interfaces 2020, 12, 1997–2008. [Google Scholar] [CrossRef] [PubMed]
- Ke, P.C.; Lin, S.; Parak, W.J.; Davis, T.P.; Caruso, F. A Decade of the Protein Corona. ACS Nano 2017, 11, 11773–11776. [Google Scholar] [CrossRef] [PubMed]
- Li, S.; Ju, Y.; Zhou, J.; Faria, M.; Ang, C.-S.; Mitchell, A.J.; Zhong, Q.-Z.; Zheng, T.; Kent, S.J.; Caruso, F. Protein precoating modulates biomolecular coronas and nanocapsule–immune cell interactions in human blood. J. Mater. Chem. B 2022, 10, 7607–7621. [Google Scholar] [CrossRef] [PubMed]
- Butcher, N.J.; Mortimer, G.M.; Minchin, R.F. Unravelling the stealth effect. Nat. Nanotechnol. 2016, 11, 310–311. [Google Scholar] [CrossRef]
- Qian, H.; Wang, K.; Lv, M.; Zhao, C.; Wang, H.; Wen, S.; Huang, D.; Chen, W.; Zhong, Y. Recent advances on next generation of polyzwitterion-based nano-vectors for targeted drug delivery. J. Control. Release 2022, 343, 492–505. [Google Scholar] [CrossRef] [PubMed]
- Oh, J.Y.; Kim, H.S.; Palanikumar, L.; Go, E.M.; Jana, B.; Park, S.A.; Kim, H.Y.; Kim, K.; Seo, J.K.; Kwak, S.K.; et al. Cloaking nanoparticles with protein corona shield for targeted drug delivery. Nat. Commun. 2018, 9, 4548. [Google Scholar] [CrossRef] [Green Version]
- Prozeller, D.; Pereira, J.; Simon, J.; Mailänder, V.; Morsbach, S.; Landfester, K. Prevention of Dominant IgG Adsorption on Nanocarriers in IgG-Enriched Blood Plasma by Clusterin Precoating. Adv. Sci. 2019, 6, 1802199. [Google Scholar] [CrossRef] [Green Version]
- Zhang, L.; Wei, W.; Liu, Z.; Liu, X.; Song, E.; Song, Y. Dual effects of fibrinogen decoration on the tuning of silica nanoparticles-induced autophagic response: The implication of sedimentation and internalization. J. Hazard. Mater. 2021, 408, 124467. [Google Scholar] [CrossRef]
- Jaiswal, N.; Halder, S.; Mahata, N.; Chanda, N. Bi-Functional Gold Nanorod–Protein Conjugates with Biomimetic BSA@Folic Acid Corona for Improved Tumor Targeting and Intracellular Delivery of Therapeutic Proteins in Colon Cancer 3D Spheroids. ACS Appl. Bio Mater. 2022, 5, 1476–1488. [Google Scholar] [CrossRef] [PubMed]
- Yadav, V.; Roy, S.; Singh, P.; Khan, Z.; Jaiswal, A. 2D MoS2-Based Nanomaterials for Therapeutic, Bioimaging, and Biosensing Applications. Small 2019, 15, 1803706. [Google Scholar] [CrossRef] [Green Version]
- Guan, G.; Zhang, S.; Liu, S.; Cai, Y.; Low, M.; Teng, C.P.; Phang, I.Y.; Cheng, Y.; Duei, K.L.; Srinivasan, B.M.; et al. Protein Induces Layer-by-Layer Exfoliation of Transition Metal Dichalcogenides. J. Am. Chem. Soc. 2015, 137, 6152–6155. [Google Scholar] [CrossRef]
- Roy, S.; Deo, K.A.; Singh, K.A.; Lee, H.P.; Jaiswal, A.; Gaharwar, A.K. Nano-bio interactions of 2D molybdenum disulfide. Adv. Drug Deliv. Rev. 2022, 187, 114361. [Google Scholar] [CrossRef]
- Cao, M.; Cai, R.; Zhao, L.; Guo, M.; Wang, L.; Wang, Y.; Zhang, L.; Wang, X.; Yao, H.; Xie, C.; et al. Molybdenum derived from nanomaterials incorporates into molybdenum enzymes and affects their activities in vivo. Nat. Nanotechnol. 2021, 16, 708–716. [Google Scholar] [CrossRef]
- Qi, Y.; Zhang, T.; Jing, C.; Liu, S.; Zhang, C.; Alvarez, P.J.J.; Chen, W. Nanocrystal facet modulation to enhance transferrin binding and cellular delivery. Nat. Commun. 2020, 11, 1262. [Google Scholar] [CrossRef] [Green Version]
- Chen, X.; McGlynn, C.; McDonald, A.R. Two-Dimensional MoS2 Catalyzed Oxidation of Organic Thiols. Chem. Mater. 2018, 30, 6978–6982. [Google Scholar] [CrossRef]
- Wang, H.; Wang, B.; Wang, M.; Zheng, L.; Chen, H.; Chai, Z.; Zhao, Y.; Feng, W. Time-resolved ICP-MS analysis of mineral element contents and distribution patterns in single cells. Analyst 2015, 140, 523–531. [Google Scholar] [CrossRef] [PubMed]
- Zheng, L.-N.; Feng, L.-X.; Shi, J.-W.; Chen, H.-Q.; Wang, B.; Wang, M.; Wang, H.-F.; Feng, W.-Y. Single-Cell Isotope Dilution Analysis with LA–ICP–MS: A New Approach for Quantification of Nanoparticles in Single Cells. Anal. Chem. 2020, 92, 14339–14345. [Google Scholar] [CrossRef]
- Wang, S.; Li, K.; Chen, Y.; Chen, H.; Ma, M.; Feng, J.; Zhao, Q.; Shi, J. Biocompatible PEGylated MoS2 nanosheets: Controllable bottom-up synthesis and highly efficient photothermal regression of tumor. Biomaterials 2015, 39, 206–217. [Google Scholar] [CrossRef]
- Feng, W.; Chen, L.; Qin, M.; Zhou, X.; Zhang, Q.; Miao, Y.; Qiu, K.; Zhang, Y.; He, C. Flower-like PEGylated MoS2 nanoflakes for near-infrared photothermal cancer therapy. Sci. Rep. 2015, 5, 17422. [Google Scholar] [CrossRef] [Green Version]
- Chen, X.; Berner, N.C.; Backes, C.; Duesberg, G.S.; McDonald, A.R. Functionalization of Two-Dimensional MoS2: On the Reaction Between MoS2 and Organic Thiols. Angew. Chem. Int. Ed. 2016, 55, 5803–5808. [Google Scholar] [CrossRef]
- Wiley, D.T.; Webster, P.; Gale, A.; Davis, M.E. Transcytosis and brain uptake of transferrin-containing nanoparticles by tuning avidity to transferrin receptor. Proc. Natl. Acad. Sci. USA 2013, 110, 8662–8667. [Google Scholar] [CrossRef] [Green Version]
- Escalera-López, D.; Niu, Y.; Park, S.J.; Isaacs, M.; Wilson, K.; Palmer, R.E.; Rees, N.V. Hydrogen evolution enhancement of ultra-low loading, size-selected molybdenum sulfide nanoclusters by sulfur enrichment. Appl. Catal. B Environ. 2018, 235, 84–91. [Google Scholar] [CrossRef]
- Zhu, H.; Qin, X.; Cheng, L.; Azcatl, A.; Kim, J.; Wallace, R.M. Remote Plasma Oxidation and Atomic Layer Etching of MoS2. ACS Appl. Mater. Interfaces 2016, 8, 19119–19126. [Google Scholar] [CrossRef]
- Zeng, H.-J.; Sun, L.-J.; Qu, L.-B.; Yang, R. Modulation of bovine serum albumin aggregation by glutathione functionalized MoS2 quantum dots. Int. J. Biol. Macromol. 2022, 195, 237–245. [Google Scholar] [CrossRef] [PubMed]
- Ritz, S.; Schöttler, S.; Kotman, N.; Baier, G.; Musyanovych, A.; Kuharev, J.; Landfester, K.; Schild, H.; Jahn, O.; Tenzer, S.; et al. Protein Corona of Nanoparticles: Distinct Proteins Regulate the Cellular Uptake. Biomacromolecules 2015, 16, 1311–1321. [Google Scholar] [CrossRef] [PubMed]
- Ho, Y.T.; Azman, N.A.; Loh, F.W.Y.; Ong, G.K.T.; Engudar, G.; Kriz, S.A.; Kah, J.C.Y. Protein Corona Formed from Different Blood Plasma Proteins Affects the Colloidal Stability of Nanoparticles Differently. Bioconjugate Chem. 2018, 29, 3923–3934. [Google Scholar] [CrossRef]


Disclaimer/Publisher’s Note: The statements, opinions and data contained in all publications are solely those of the individual author(s) and contributor(s) and not of MDPI and/or the editor(s). MDPI and/or the editor(s) disclaim responsibility for any injury to people or property resulting from any ideas, methods, instructions or products referred to in the content. |
© 2023 by the authors. Licensee MDPI, Basel, Switzerland. This article is an open access article distributed under the terms and conditions of the Creative Commons Attribution (CC BY) license (https://creativecommons.org/licenses/by/4.0/).
Share and Cite
Xu, S.; Liang, S.; Wang, B.; Wang, J.; Wang, M.; Zheng, L.; Fang, H.; Zhang, T.; Bi, Y.; Feng, W. Bi-Functionalized Transferrin@MoS2-PEG Nanosheets for Improving Cellular Uptake in HepG2 Cells. Materials 2023, 16, 2277. https://doi.org/10.3390/ma16062277
Xu S, Liang S, Wang B, Wang J, Wang M, Zheng L, Fang H, Zhang T, Bi Y, Feng W. Bi-Functionalized Transferrin@MoS2-PEG Nanosheets for Improving Cellular Uptake in HepG2 Cells. Materials. 2023; 16(6):2277. https://doi.org/10.3390/ma16062277
Chicago/Turabian StyleXu, Si, Shanshan Liang, Bing Wang, Jiali Wang, Meng Wang, Lingna Zheng, Hao Fang, Tingfeng Zhang, Yi Bi, and Weiyue Feng. 2023. "Bi-Functionalized Transferrin@MoS2-PEG Nanosheets for Improving Cellular Uptake in HepG2 Cells" Materials 16, no. 6: 2277. https://doi.org/10.3390/ma16062277