

Accumulation of Plastic Strain at Notch Root of Steel Specimens Undergoing Asymmetric Fatigue Cycles: Analysis and Simulation

Abstract
:1. Introduction
2. Modeling and Formulation
2.1. Elastic and Plastic Strains
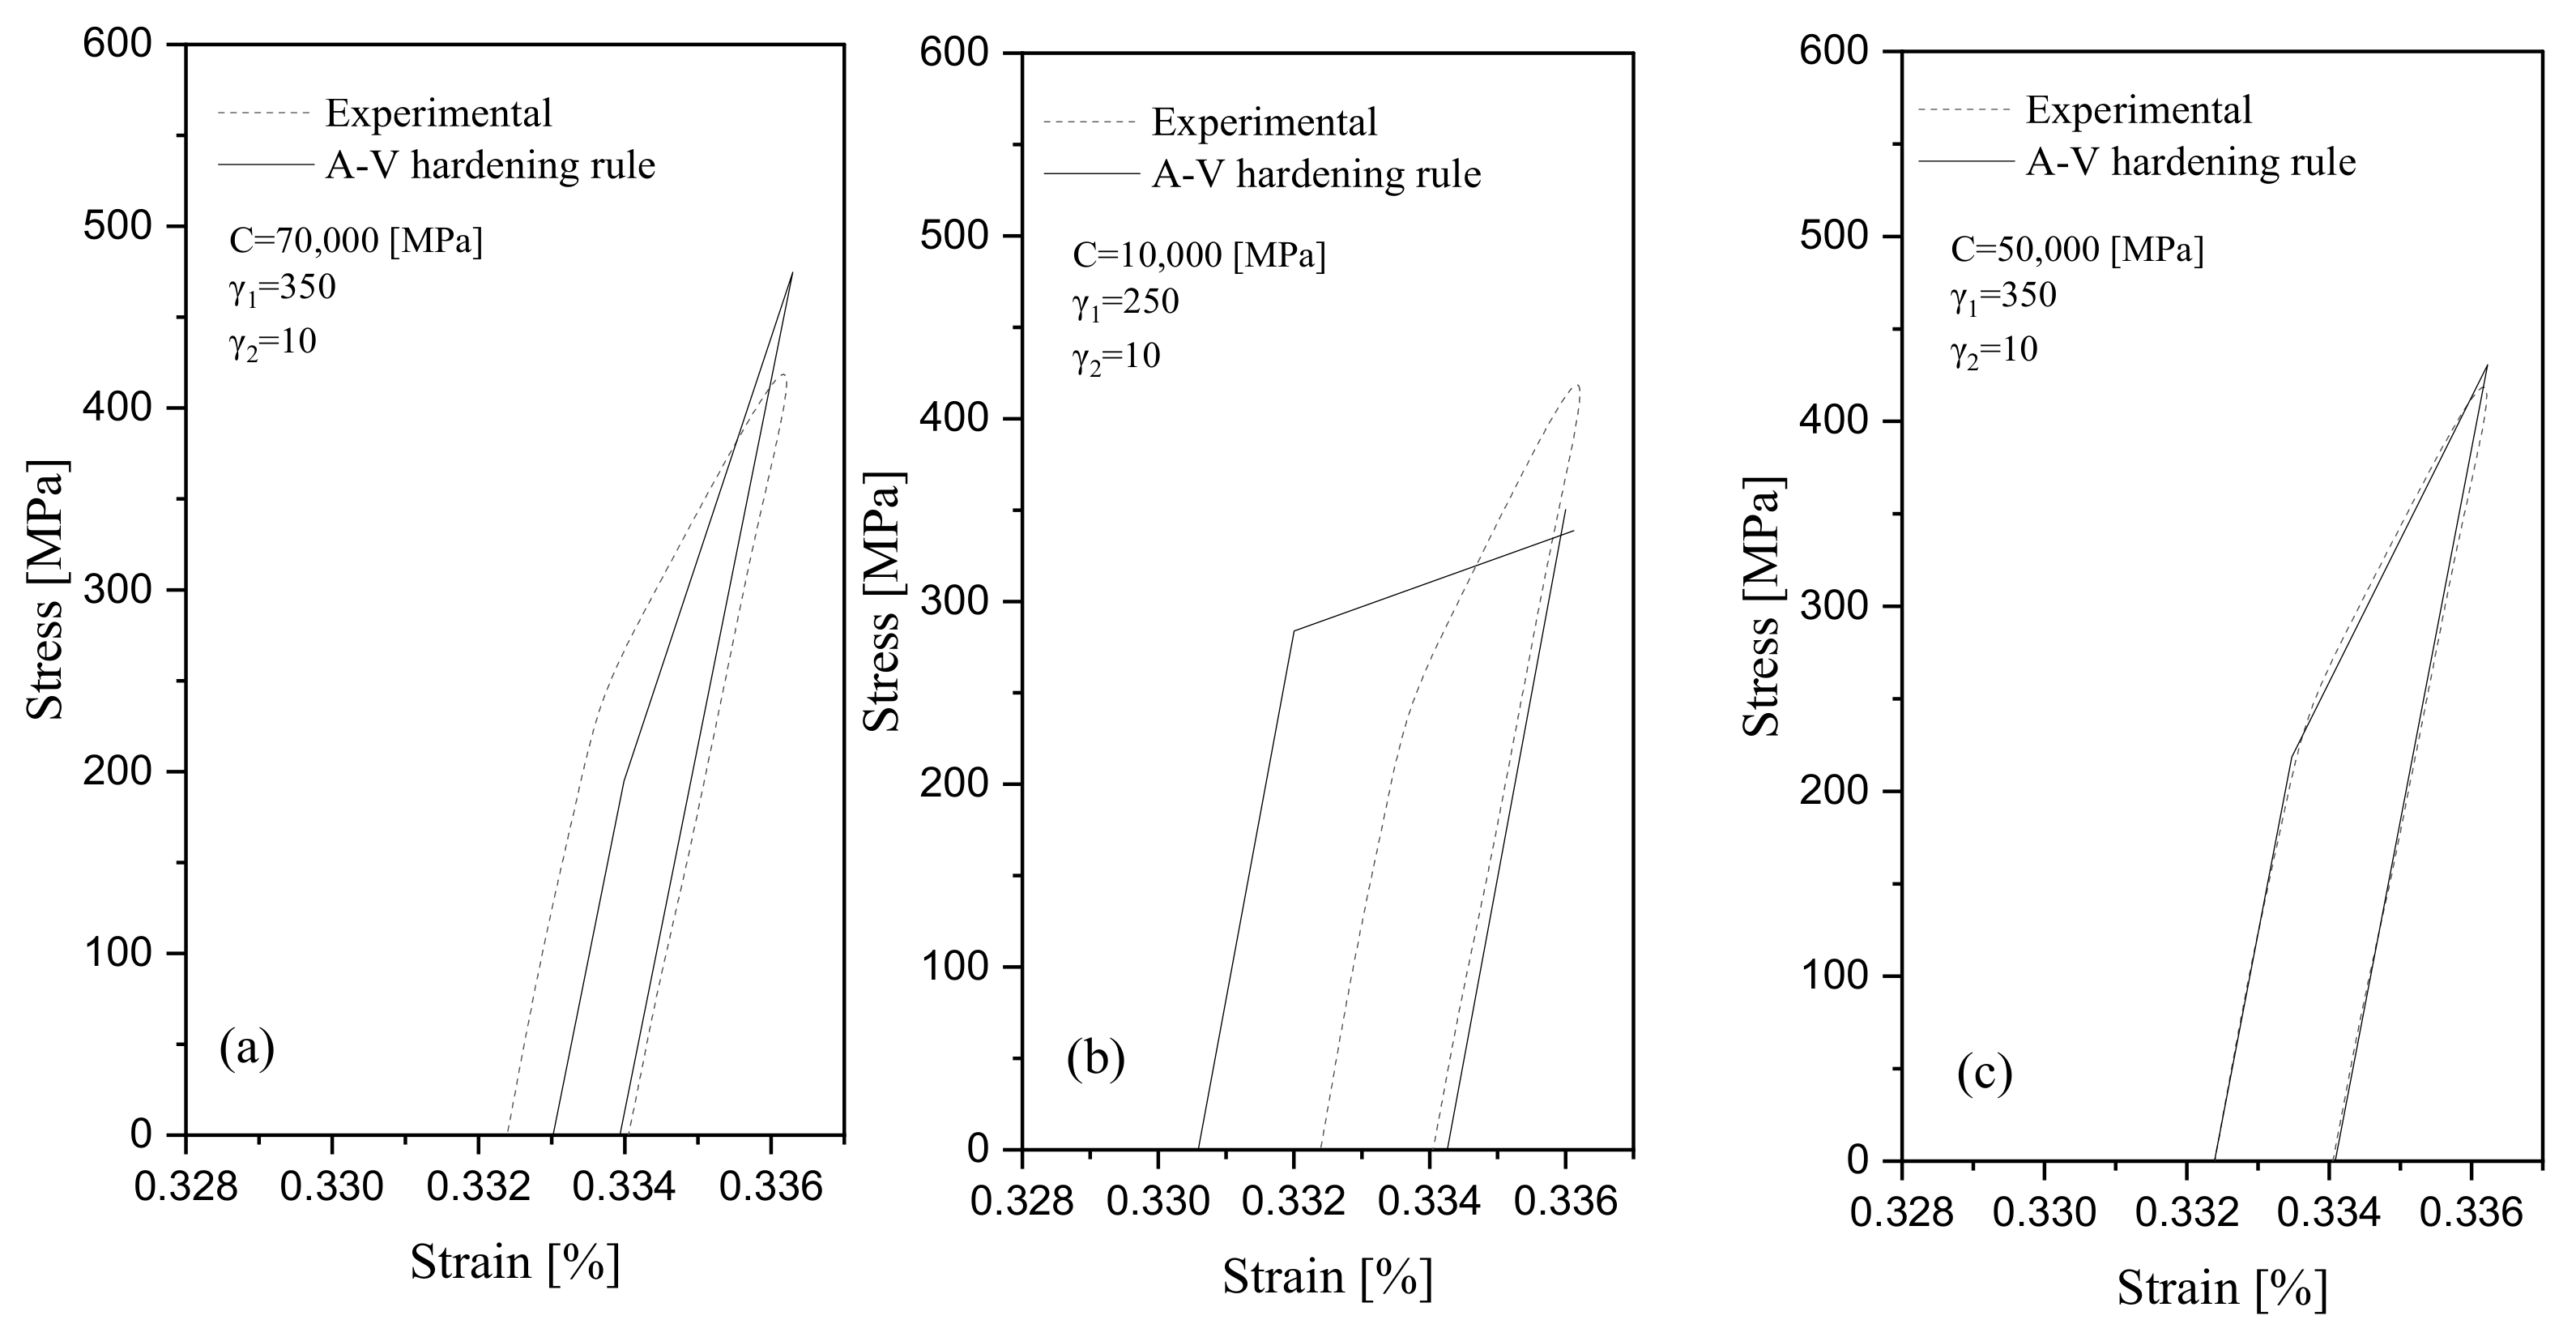
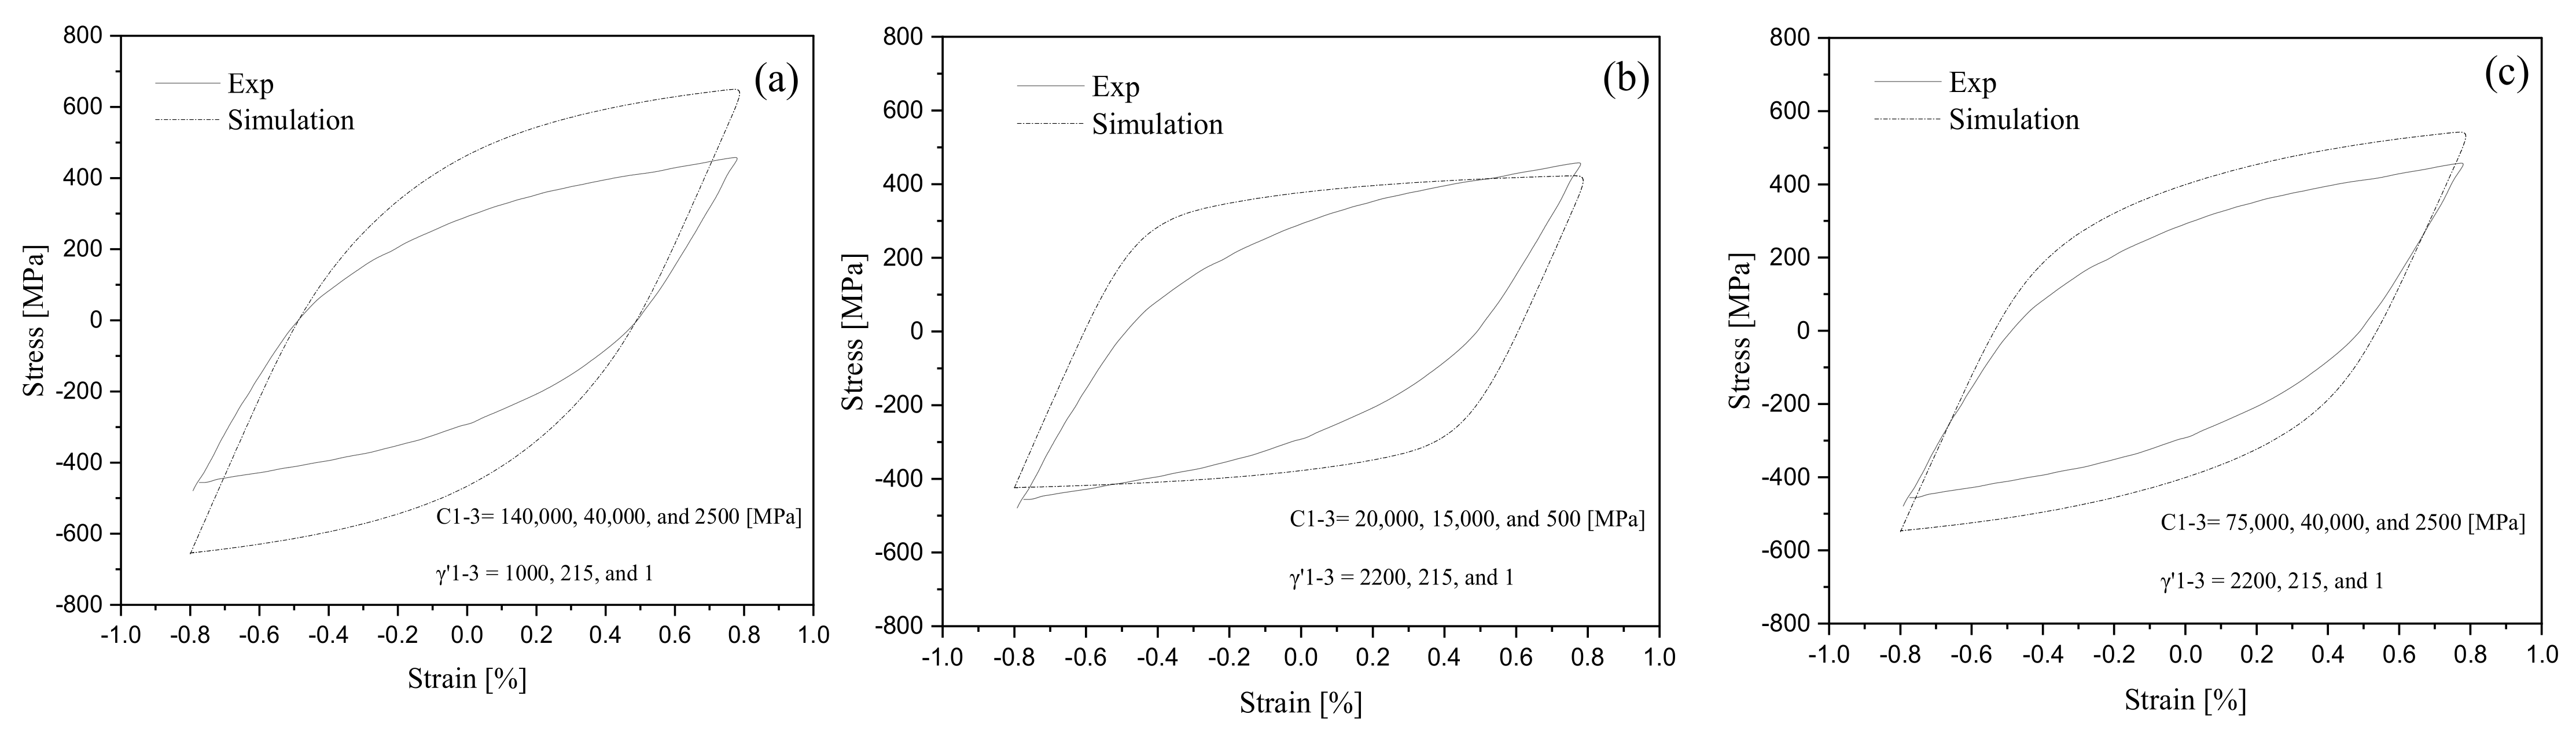
2.2. The Ahmadzadeh-Varvani (A-V) Kinematic Hardening Rule
2.3. Local Components of Stress and Strain at Notch Root and Local Ratcheting Strains
2.3.1. Neuber’s Rule
2.3.2. Glinka’s Rule
2.3.3. Hoffman and Seeger (H-S) Approach
2.4. Ratcheting Analysis Algorithm
- (i)
- Applied cyclic stresses to the notched specimens were introduced into the program,
- (ii)
- Through Equations (5a) and (5b), the backstress component , internal variable , and term were related to plastic strain increments over the loading progress,
- (iii)
- The plastic strain increment, , was computed through (i) Equations (16) and (17) based on Neuber’s rule, (ii) Equations (27) and (28) based on the Glinka approach, and (iii) Equations (37) and (38) by means of the H-S model.
- (iv)
- The accumulation of the progressive local plastic strain at the notch root, was controlled through the A-V hardening model while Neuber, Glinka, and H-S rules were coupled to the hardening framework.
- (v)
- Through Equations (18)–(20), the backstress components were defined during unloading (A→B)/reloading (B→C) paths and set as equal to their counterpart increments in Equations (5a)–(7). This enabled us to set relationships between nominal and local stress components in the coupled framework.
- (vi)
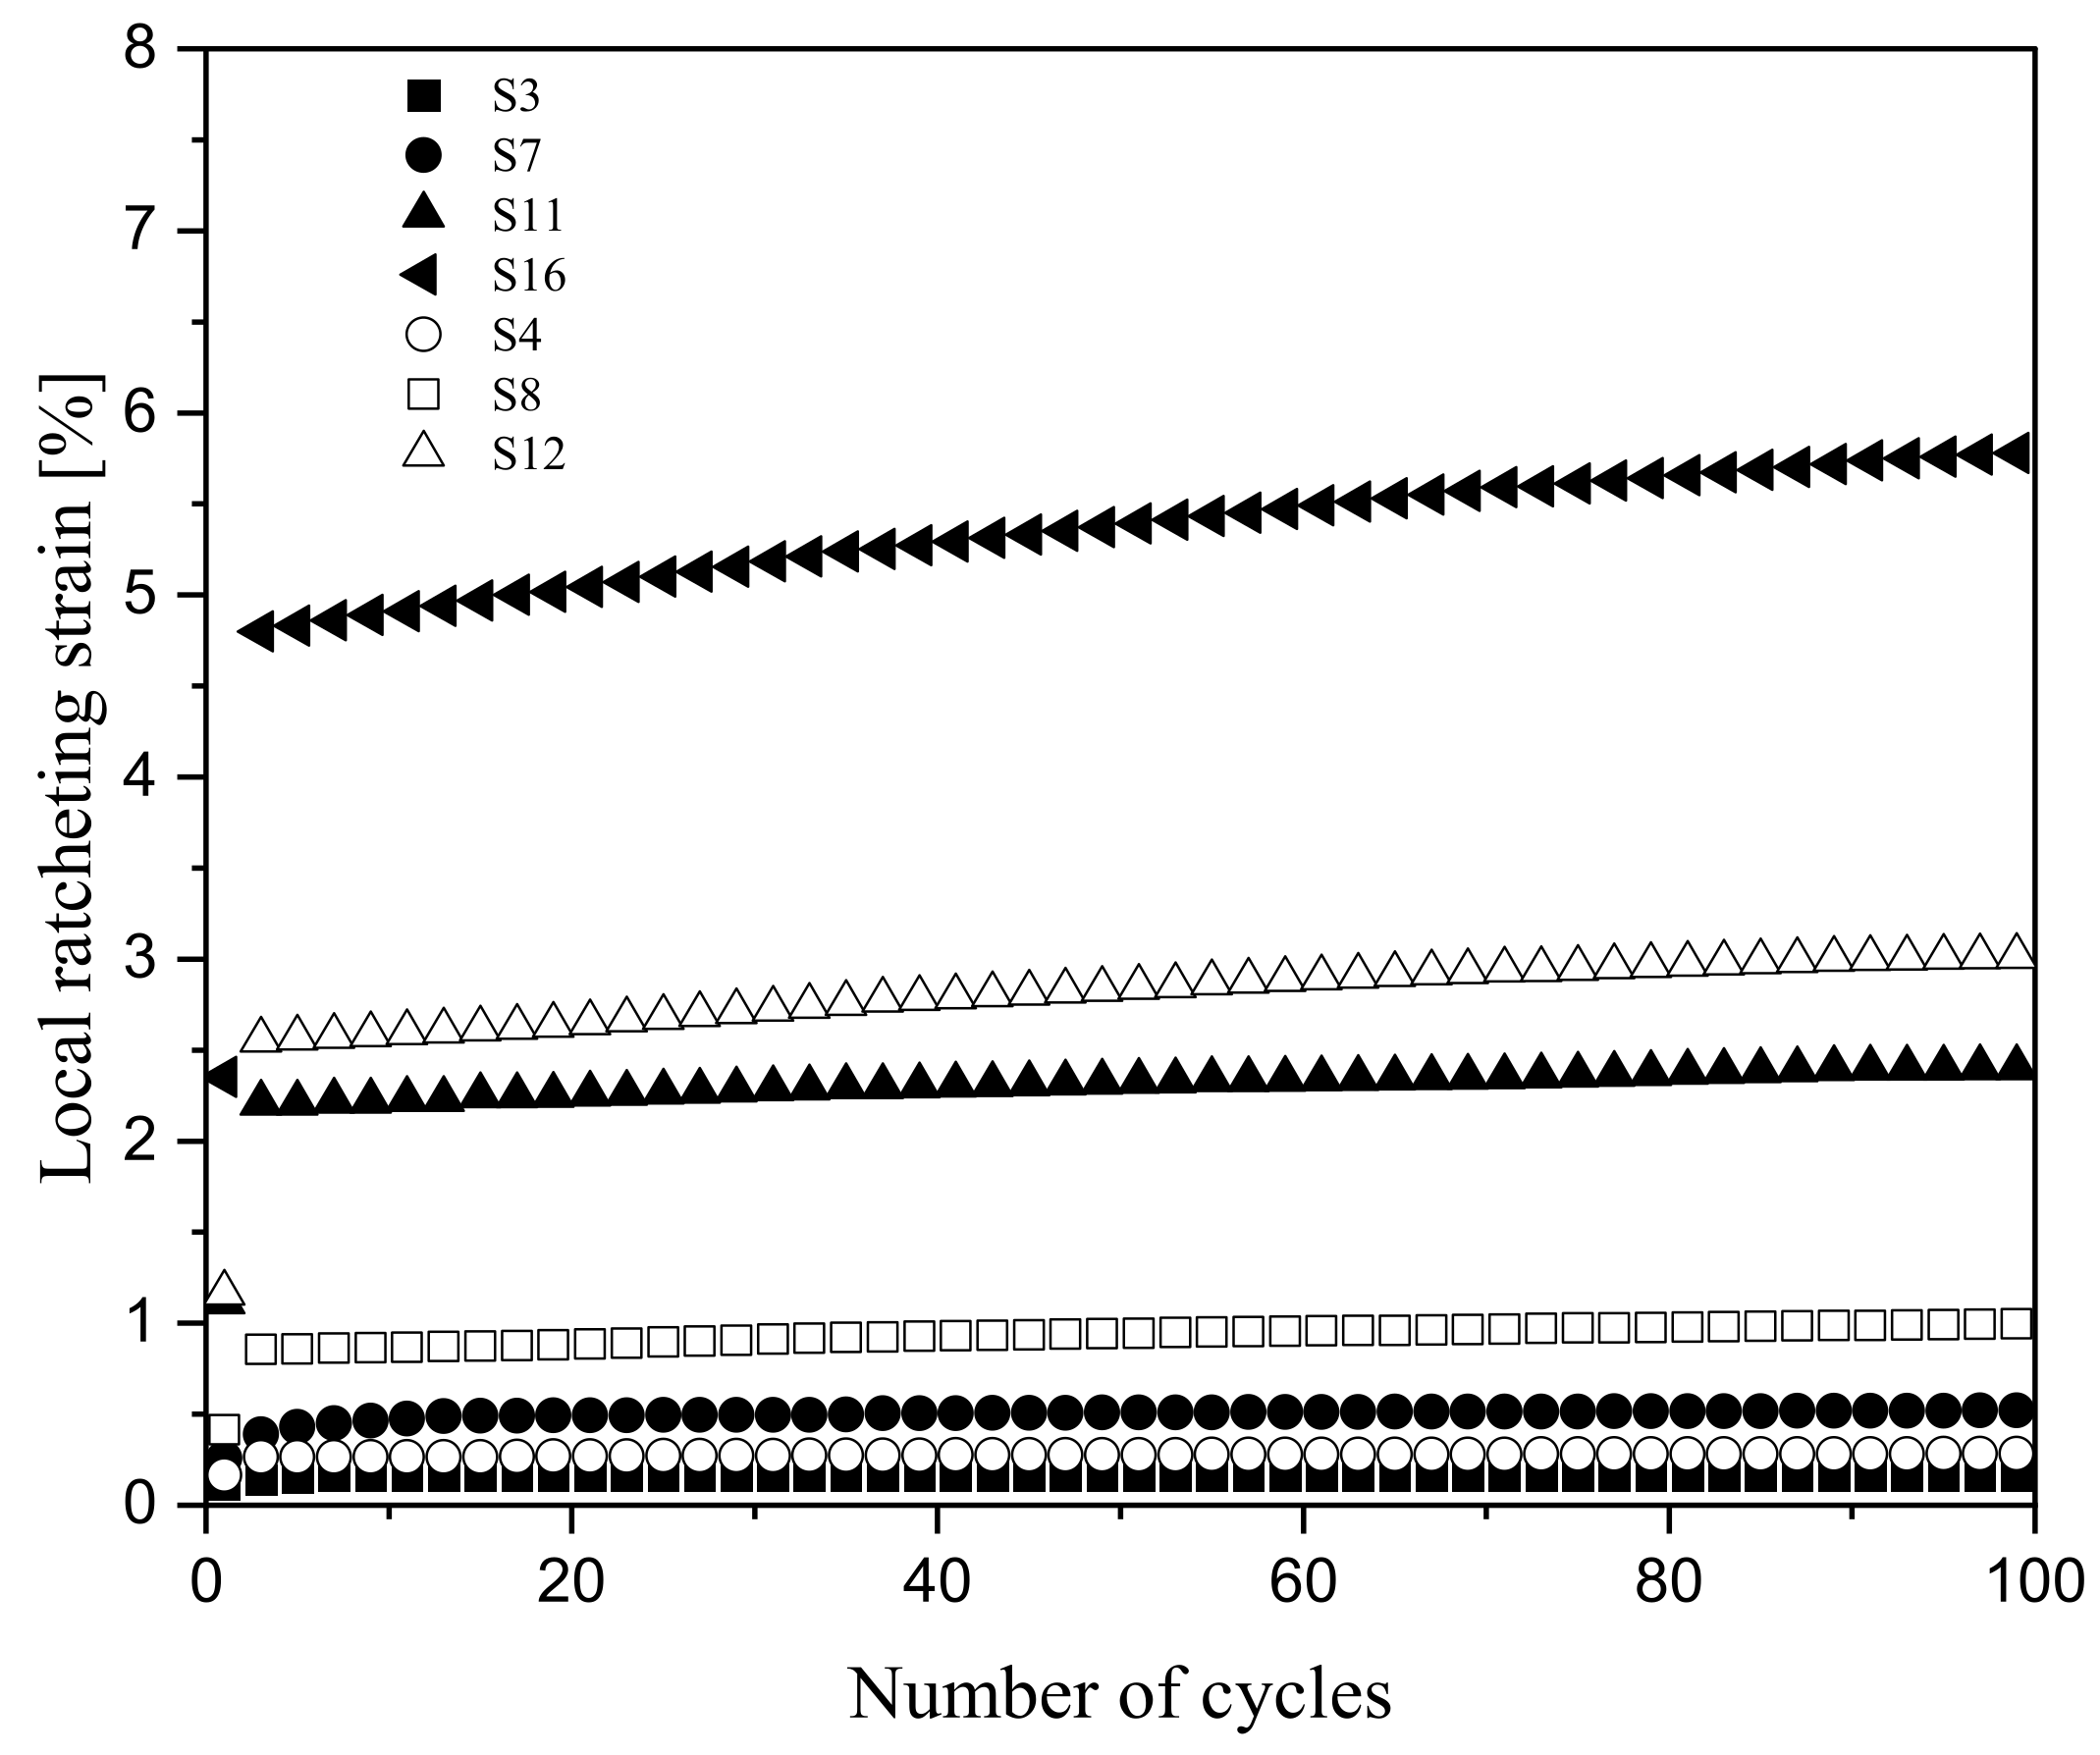
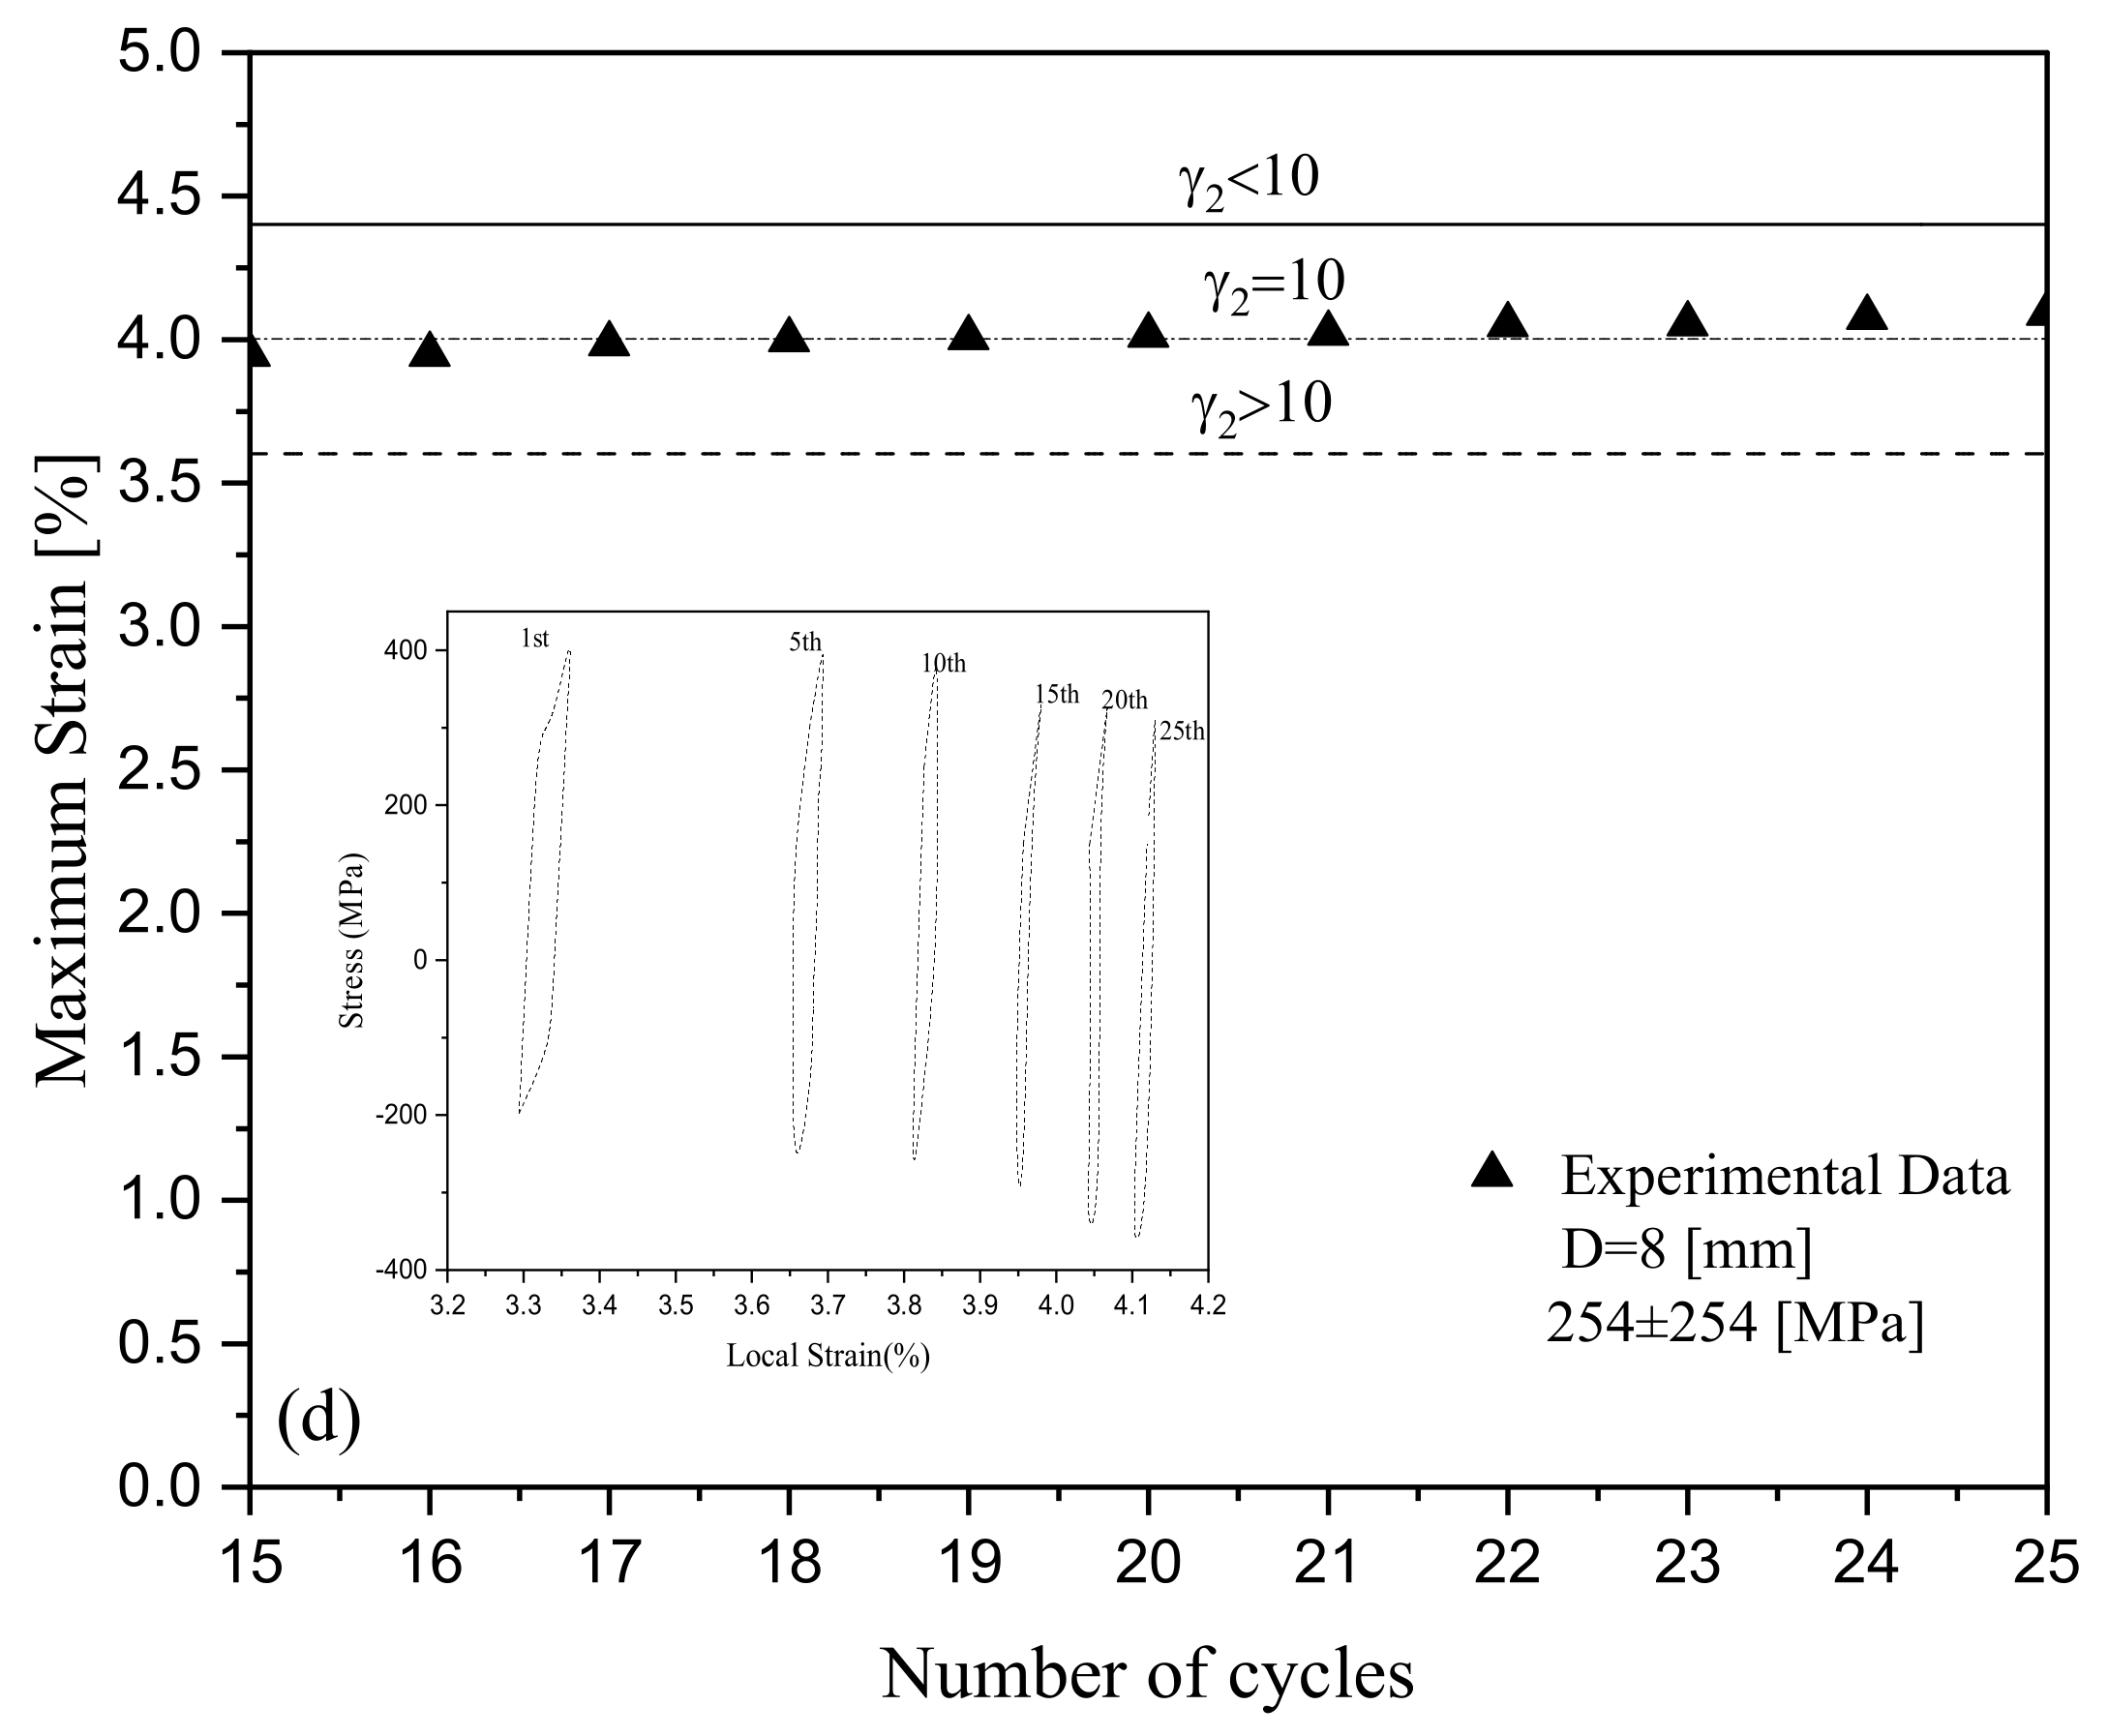
- The ratcheting strain was calculated from the average of maximum and minimum local strains over asymmetric loading cycles.
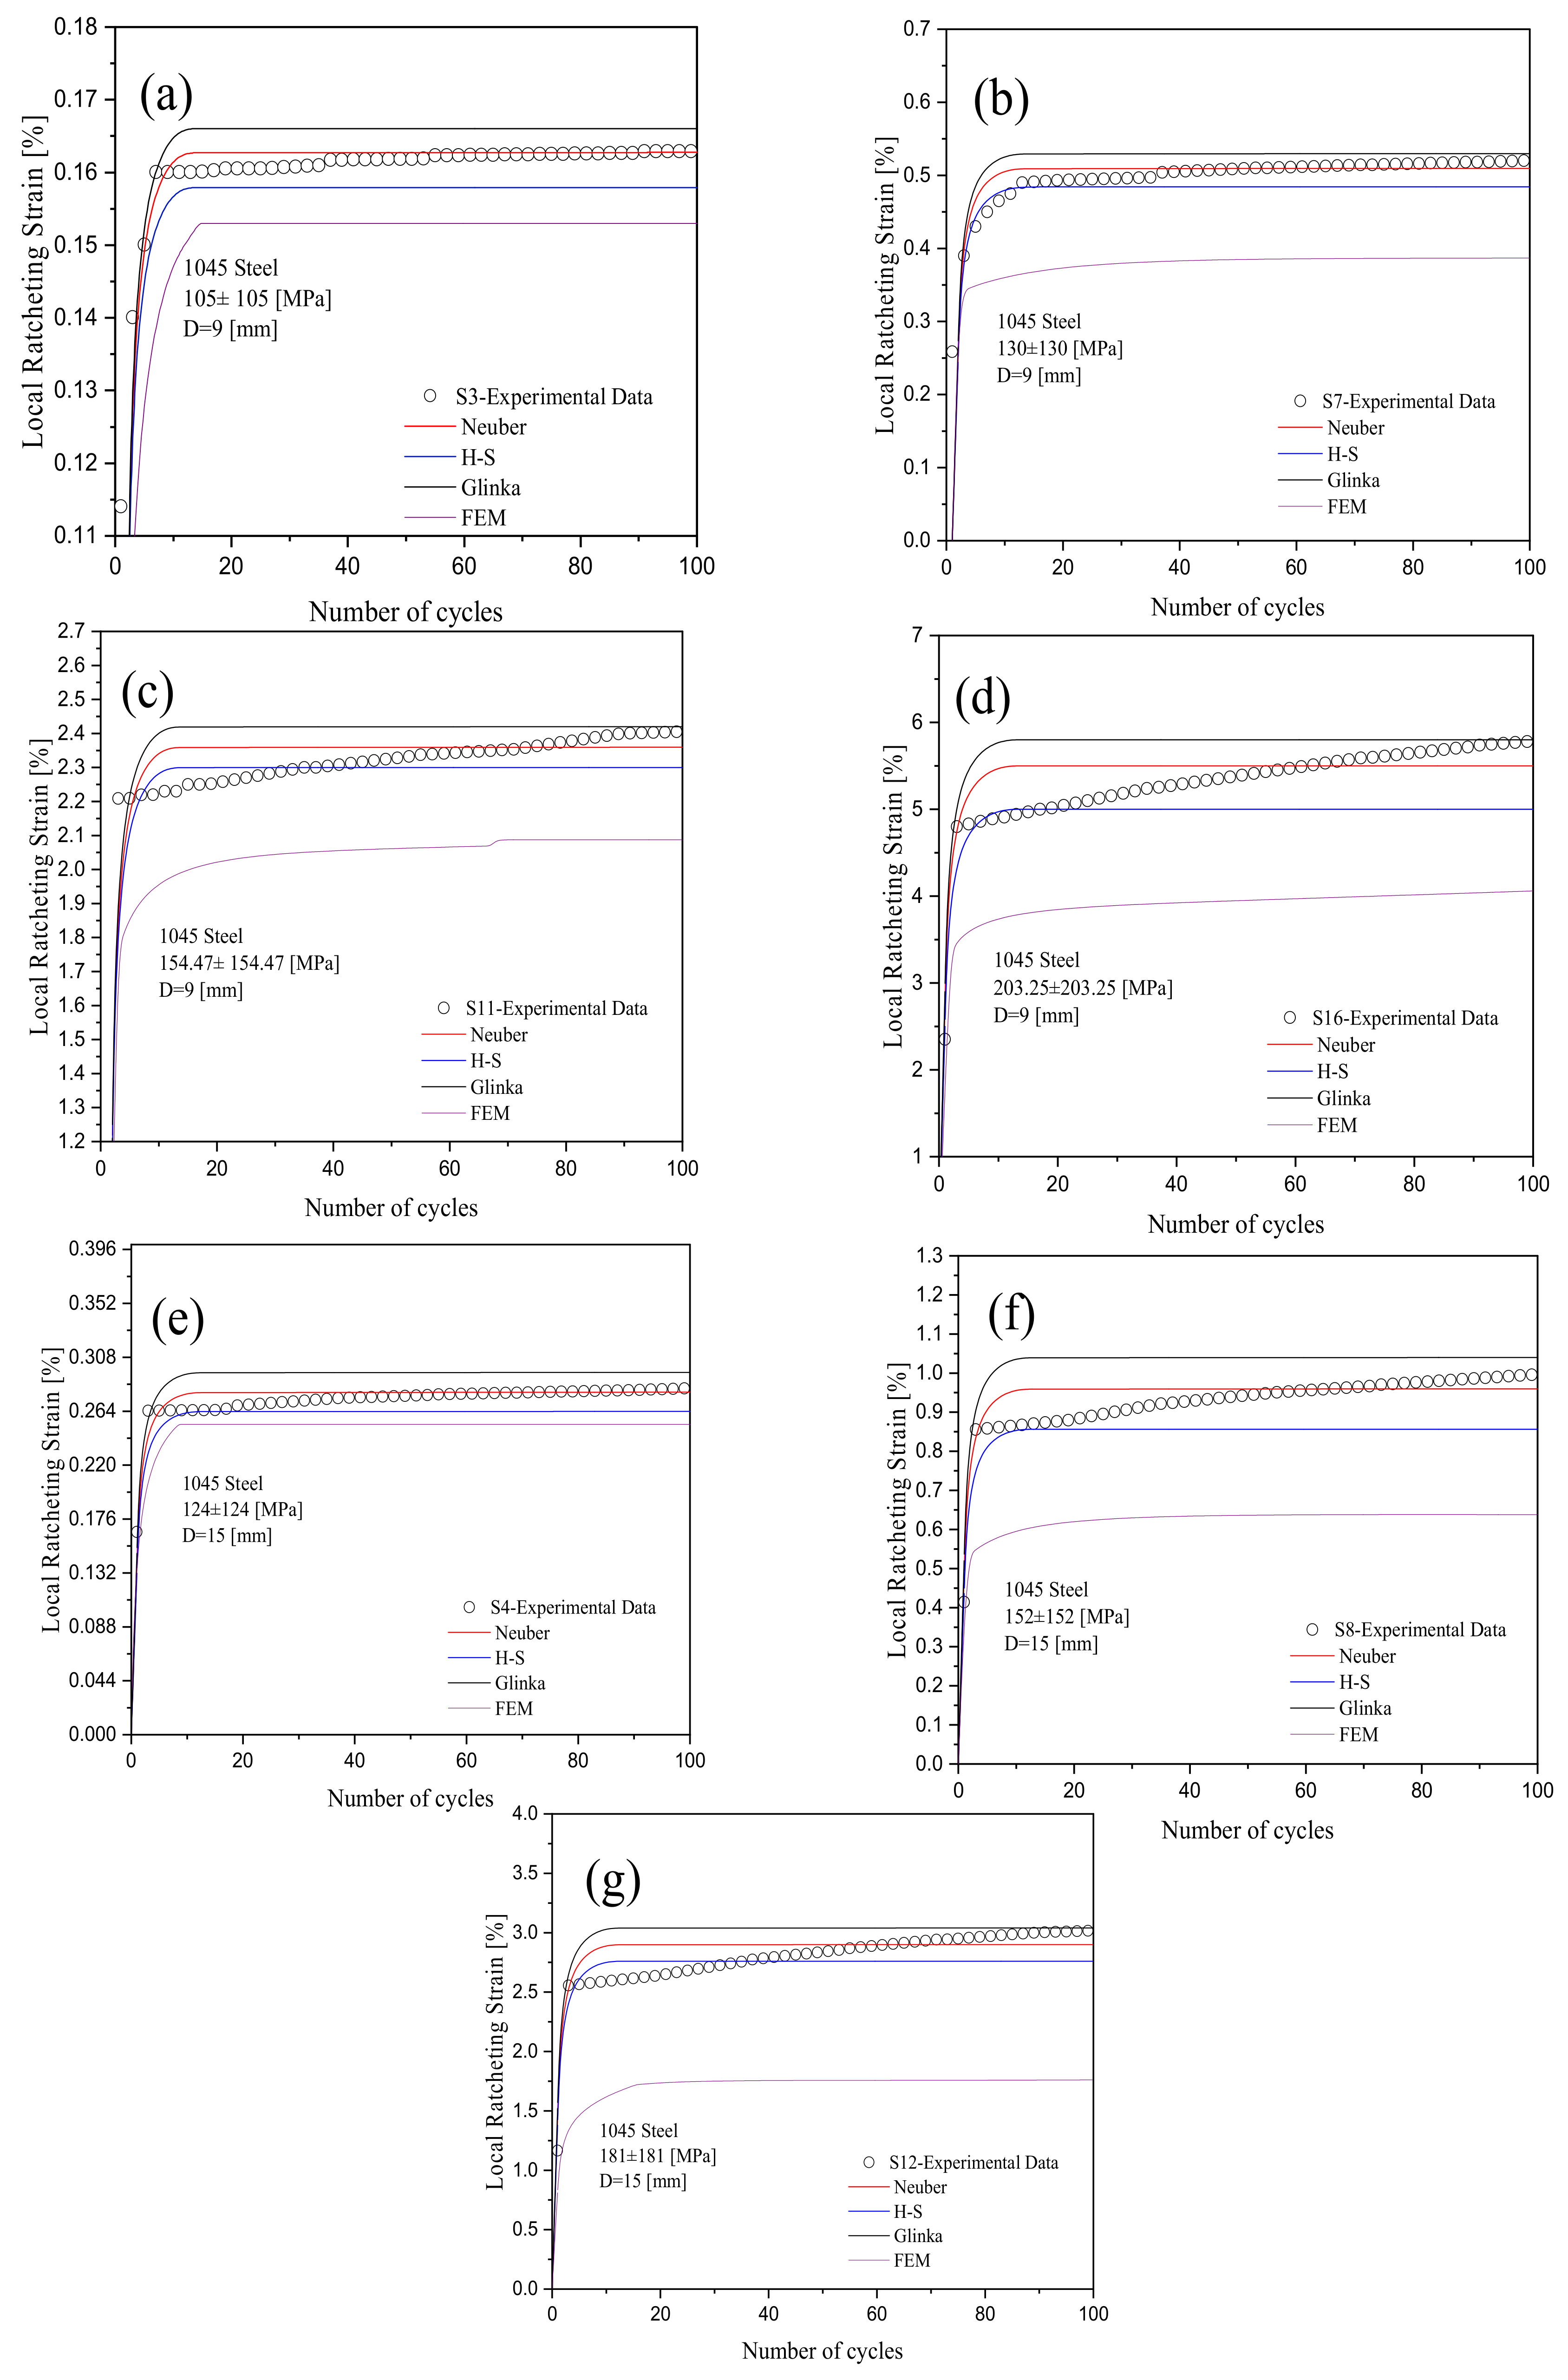
3. Testing Conditions and Ratcheting Data
4. Simulation of Local Ratcheting Strain through Finite Element Analysis
5. Results and Discussion
5.1. Local Ratcheting Prediction through the A-V Hardening Rule
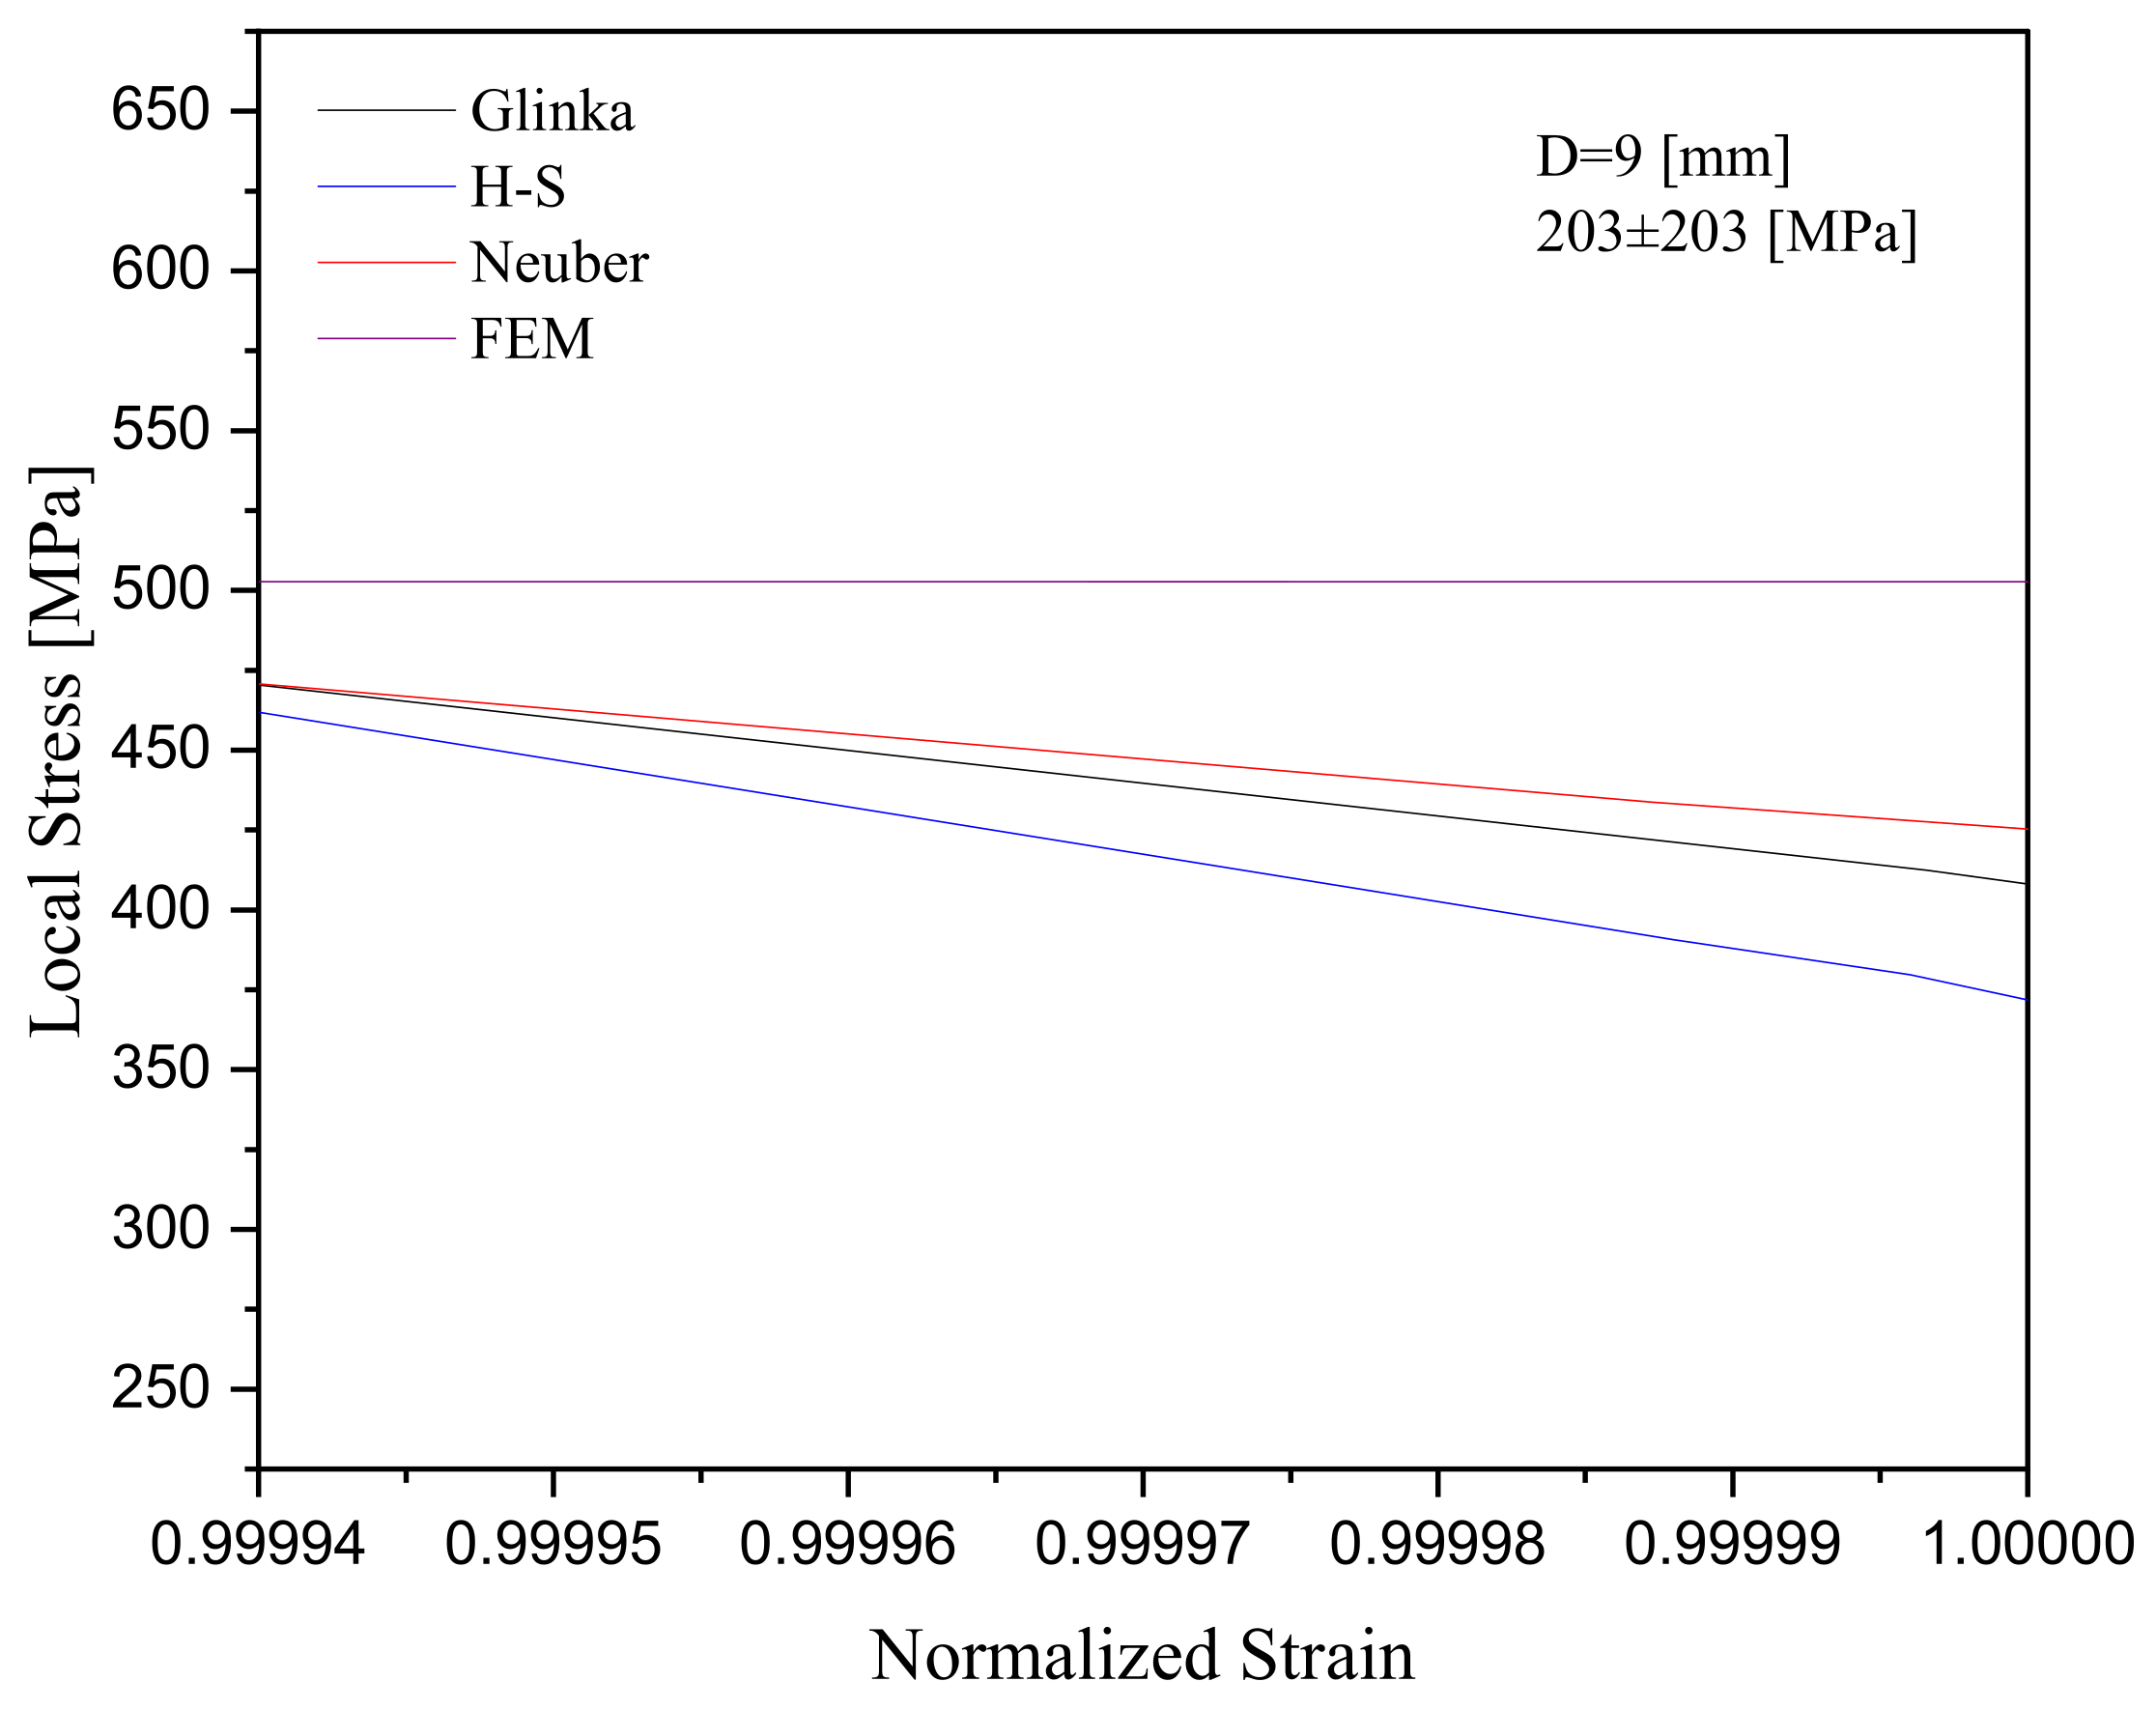
5.1.1. Estimation of Local Strain/Stress at Notch Roots through Different Models
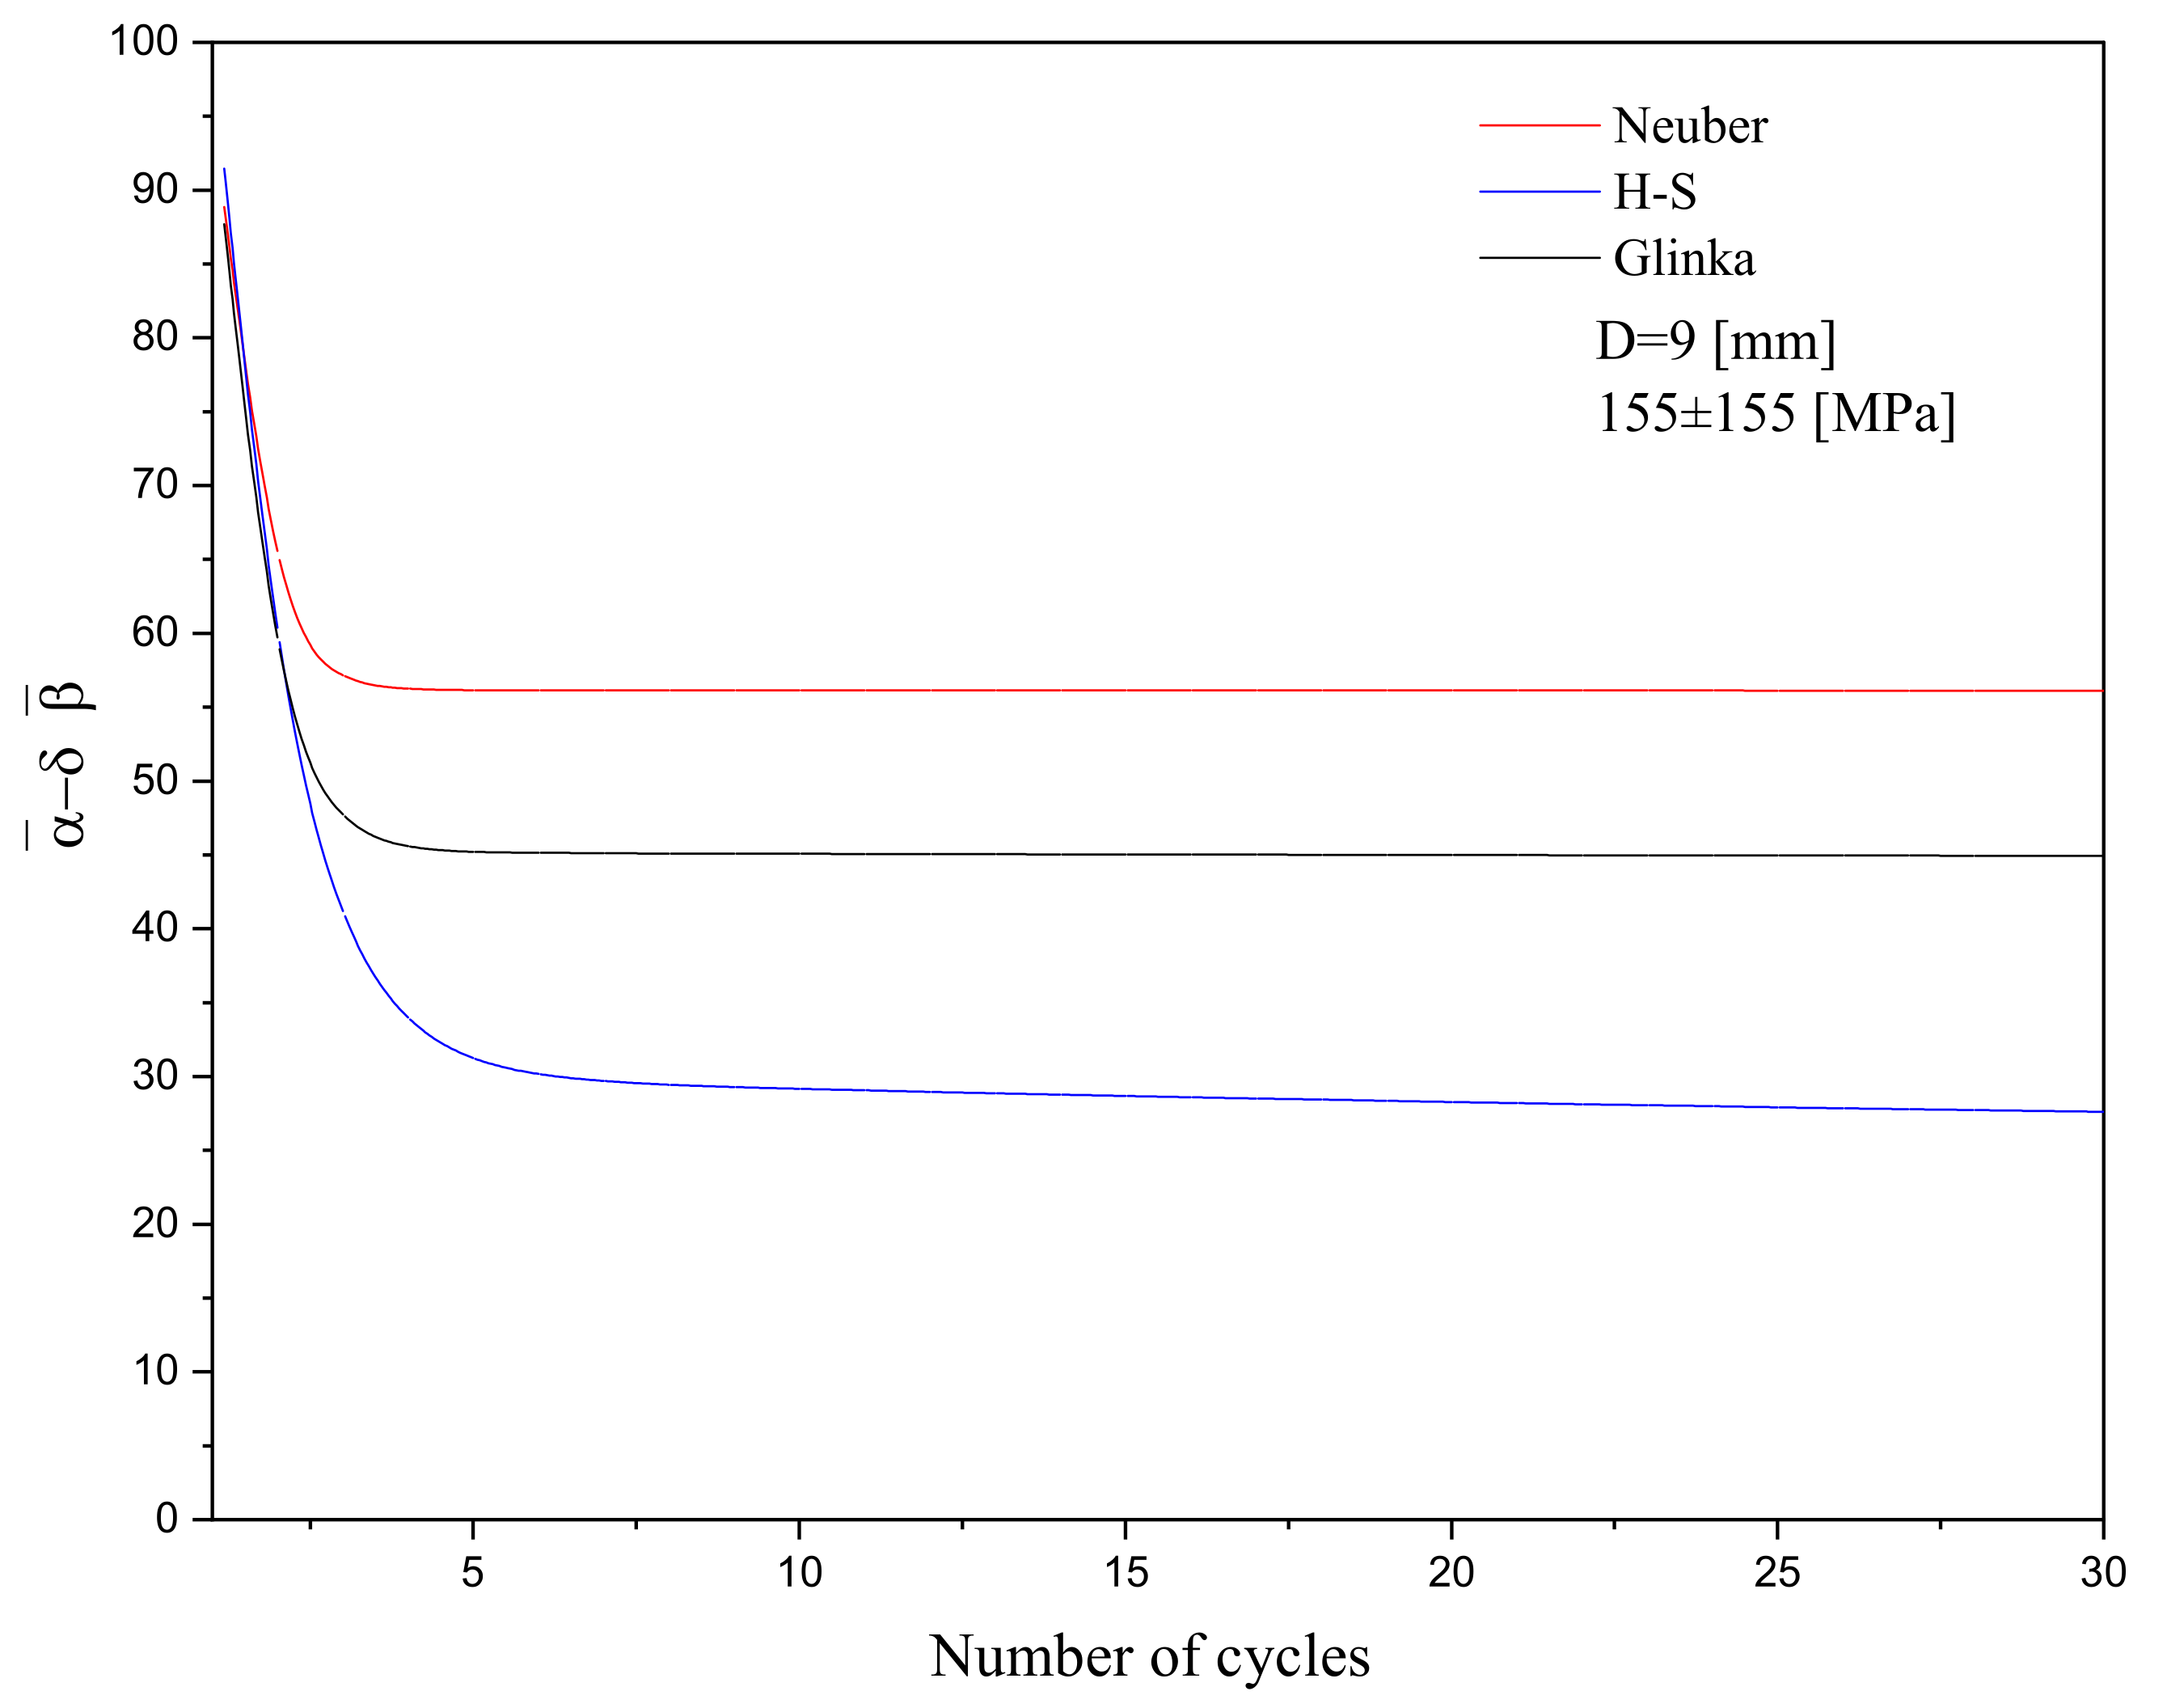
5.1.2. Backstress Evolution during Loading
5.2. Predicted and Simulated Local Ratcheting Curves
5.3. Discussion
6. Conclusions
Author Contributions
Funding
Institutional Review Board Statement
Informed Consent Statement
Data Availability Statement
Acknowledgments
Conflicts of Interest
Nomenclature
| Total strain increment tensor | |
| Elastic strain increment tensor | |
| Plastic strain increment tensor | |
| E | Modulus of elasticity |
| Plastic modulus | |
| Backstress tensor | |
| Stress tensor | |
| Unit tensor | |
| Poisson’s ratio | |
| G | Shear modulus |
| Deviatoric stress tensor | |
| Yield strength | |
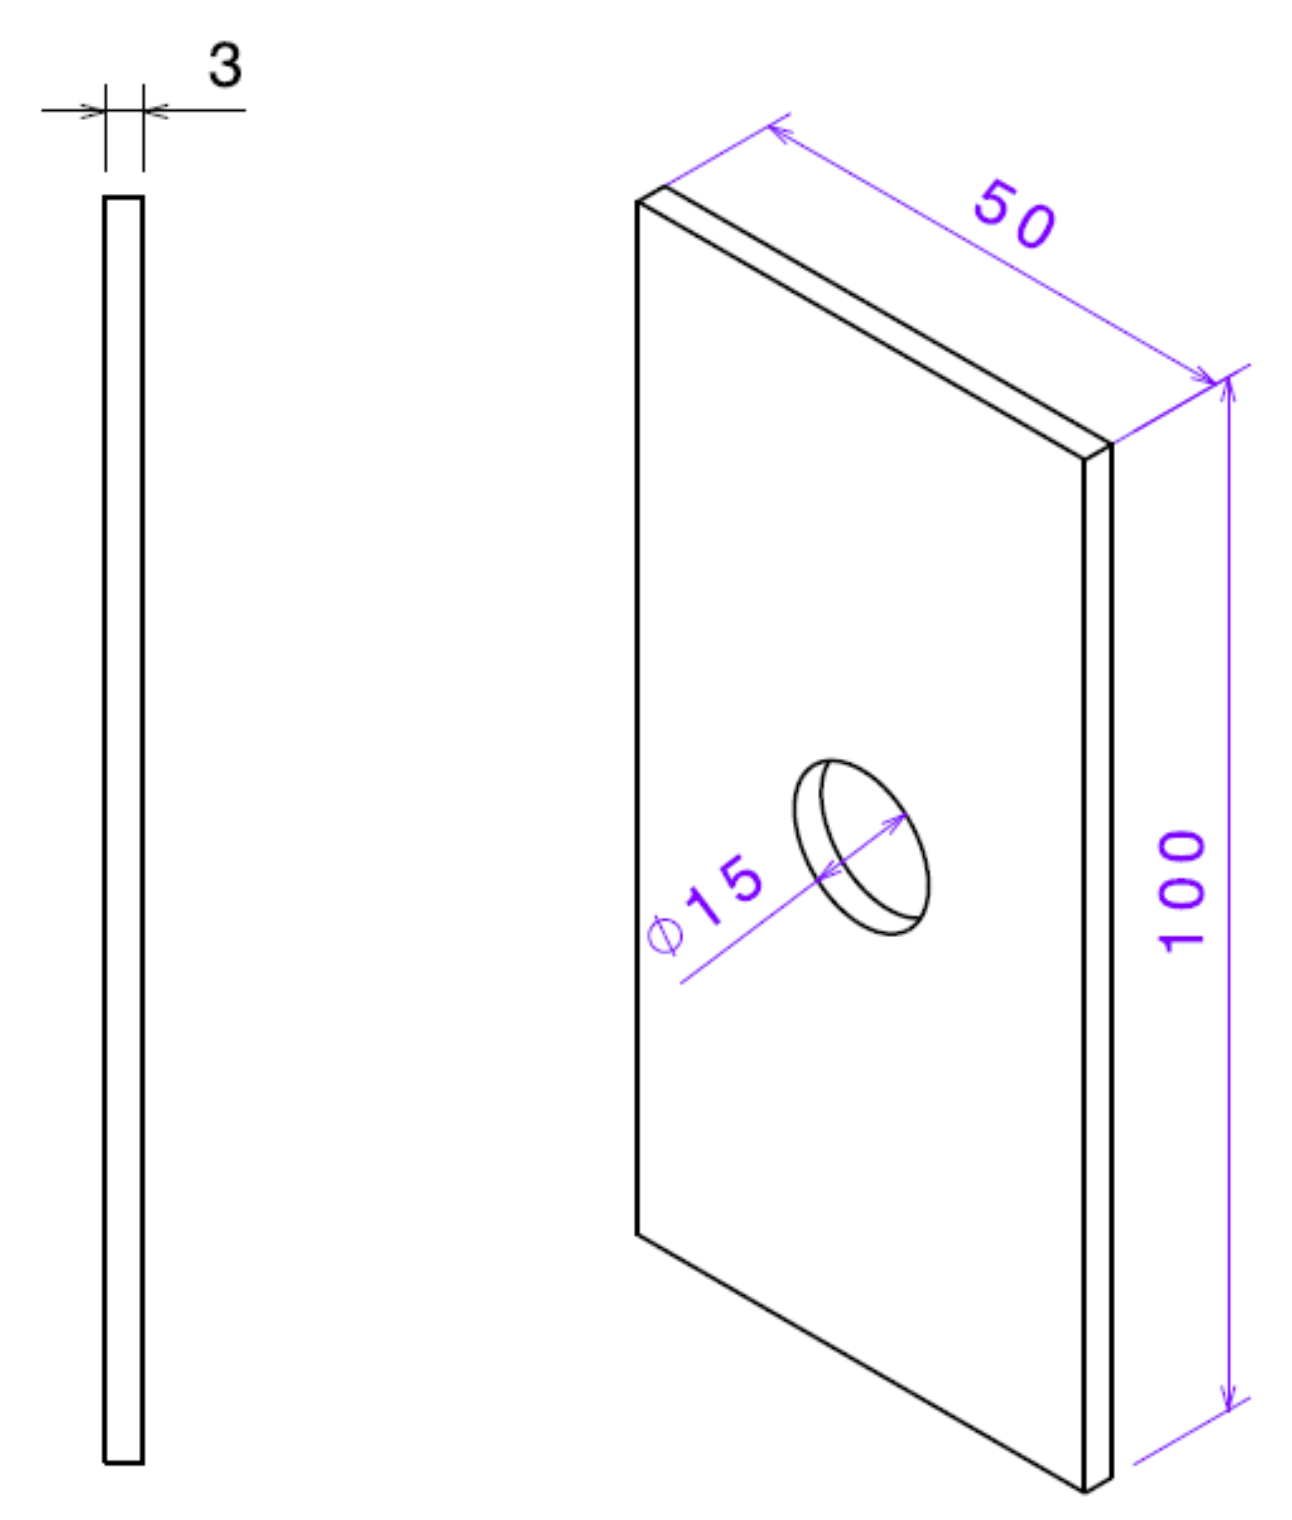
| D | Circular notch diameter |
| Coefficients of the A-V model | |
| , | Chaboche materials coefficients |
| Stress concentration factor | |
| Internal variable of the A-V model tensor | |
| Ramberg-Osgood coefficients | |
| S,e | Nominal stress and strain |
| R | Stress ratio |
| , | Stress and strain concentration factors |
| Uniaxial local stress and strain at the notch root | |
| Strain energy per unit volume at the notch root | |
| , | Elastic strain energy per unit volume due to the nominal remote stress S |
| Theoretical elastic equivalent stress at notch root | |
| Equivalent strain at notch root | |
| Equivalent stress at notch root | |
| Kp | Limit load factor |
| Stress ratios within the elastic domain |
References
- Ahmadzadeh, G.R.; Varvani-Farahani, A. Ratcheting assessment of materials based on the modified Armstrong–Frederick hardening rule at various uniaxial stress levels. Fatigue Fract. Eng. Mater. Struct. 2013, 36, 1232–1245. [Google Scholar] [CrossRef]
- Leis, B.N.; Topper, T.H. Cyclic deformation and fatigue analysis for notched component. Nucl. Eng. Des. 1974, 29, 370–383. [Google Scholar]
- Wang, C.H.; Rose, L.R.F. Transient and steady-state deformation at notch root under cyclic loading. Mech. Mater. 1998, 30, 229–241. [Google Scholar] [CrossRef]
- Hu, W.; Wang, C.H.; Barter, S. Analysis of Cyclic Mean Stress Relaxation and Strain Ratchetting Behavior of Aluminum 7050; Technical Report AR 010-989; DSTO Aeronautical and Maritime Research Laboratory: Fishermens Bend, VI, Australia, 1999. [Google Scholar]
- Rahman, S.M.; Hassan, T. Advanced cyclic plasticity models in simulating ratcheting responses of straight and elbow piping components, and notched plates. ASME Press. Vessel. Pip. Conf. 2005, 4188, 421–427. [Google Scholar]
- Lee, C.H.; Van Do, V.N.; Chang, K.H. Analysis of uniaxial ratcheting behavior and cyclic mean stress relaxation of a duplex stainless steel. Int. J. Plast. 2014, 62, 17–33. [Google Scholar] [CrossRef]
- Firat, M. A notch strain calculation of a notched specimen under axial-torsion loadings. Mater. Des. 2011, 32, 3876–3882. [Google Scholar] [CrossRef]
- Barkey, M.E. Calculation of Notch Strains under Multiaxial Nominal Loading. Ph.D. Thesis, Department of Theoretical and Applied Mechanics, University of Illinois, Urbana-Champaign, IL, USA, 1993. [Google Scholar]
- Kolasangiani, K.; Farhangdoost, K.; Shariati, M.; Varvani-Farahani, A. Ratcheting assessment of notched steel samples subjected to asymmetric loading cycles through coupled kinematic hardening-Neuber rules. Int. J. Mech. Sci. 2018, 144, 24–32. [Google Scholar] [CrossRef]
- Shekarian, A.; Varvani-Farahani, A. Ratcheting prediction at the notch root of steel samples over asymmetric loading cycles. J. Eng. Mater. Technol. Trans. 2020, 142, 1–23. [Google Scholar] [CrossRef]
- Neuber, H. Theory of stress concentration for shear-strained prismatical bodies with arbitrary nonlinear stress-strain law. J. Appl. Mech. 1961, 28, 544–550. [Google Scholar] [CrossRef]
- Shekarian, A.; Varvani-Farahani, A. Concurrent ratcheting and stress relaxation at the notch root of steel samples undergoing asymmetric tensile loading cycles. Fatigue Fract. Eng. Mater. Struct. 2019, 42, 1402–1413. [Google Scholar] [CrossRef]
- Liu, C.; Shi, S.; Cai, Y.; Chen, X. Ratcheting behavior of pressurized-bending elbow pipe after thermal aging. Int. J. Press. Vessel. Pip. 2019, 169, 160–169. [Google Scholar] [CrossRef]
- Chen, X.; Jiao, R.; Kim, K.S. On the Ohno-Wang kinematic hardening rules for multiaxial ratcheting modeling of medium carbon steel. Int. J. Plast. 2005, 21, 161–184. [Google Scholar] [CrossRef]
- Shekarian, A.; Varvani-Farahani, A. Ratcheting behavior of notched stainless-steel samples subjected to asymmetric loading cycles. J. Iron Steel Res. Int. 2021, 28, 86–97. [Google Scholar] [CrossRef]
- Shekarian, A.; Varvani-Farahani, A. Ratcheting response of SS316 steel samples with different notch shapes under various loading spectra. J. Mater. Eng. Perform. 2021, 30, 3524–3535. [Google Scholar] [CrossRef]
- Varvani-Farahani, A. A comparative study in descriptions of coupled kinematic hardening rules and ratcheting assessment over asymmetric stress cycles. Fatigue Fract. Eng. Mater. Struct. 2017, 40, 882–893. [Google Scholar]
- Kolasangiani, K.; Farhangdoost, K.; Shariati, M.; Varvani-Farahani, A. Ratcheting progress at notch root of 1045 steel samples over asymmetric loading cycles: Experiments and analyses. Fatigue Fract. Eng. Mater. Struct. 2018, 41, 1870–1883. [Google Scholar] [CrossRef]
- Kolasangiani, K.; Shariati, M.; Varvani-Farahani, A. Ratcheting examination of 1045 notched steel plates under Low-High and High-Low sequences. J. Test. Eval. 2020, 49, 20190728. [Google Scholar] [CrossRef]
- Molski, K.; Glinka, G. A method of elastic-plastic stress and strain calculation at a notch root. Mater. Sci. Eng. 1981, 50, 93–100. [Google Scholar] [CrossRef]
- Hoffmann, M.; Seeger, T. A generalized method for estimating multiaxial elastic–plastic notch stresses and strains. Part I: Theory. J. Eng. Mater. Technol. 1985, 107, 250–254. [Google Scholar] [CrossRef]
- Hoffmann, M.; Seeger, T. Stress–strain analysis and life predictions of a notched shaft under multiaxial loading. Multiaxial Fatigue Anal. Exp. 1989, AE-14, 81–101. [Google Scholar]
- ABAQUS User’s Manual; Version 6.13 User’s Manual; Hibbitt, Karlsson and Sorensen, Dassault Systèmes Simulia Corp.: Providence, RI, USA, 2016.
- Chaboche, J. On some modifications of kinematic hardening to improve the description of ratcheting effects. Int. J. Plast. 1991, 7, 661–678. [Google Scholar] [CrossRef]
- Kolasangiani, K. Analysis of Local and Global Ratcheting Behavior of AISI 1045 Steel Specimens with Cutout. Ph.D. Thesis, University of Mashhad, Mashhad, Iran, 2018. [Google Scholar]
- Gaudin, C.; Feaugas, X. Cyclic creep process in AISI 316L stainless steel in terms of dislocation patterns and internal stresses. Acta Mater. 2004, 52, 3097–3110. [Google Scholar] [CrossRef]


| Test Specimen | Notch Diameter (D) (mm) | ||
|---|---|---|---|
| S3 | 9 | 2.53 | |
| S7 | 9 | 2.53 | |
| S11 | 9 | 2.53 | |
| S16 | 9 | 2.53 | |
| S4 | 15 | 2.36 | |
| S8 | 15 | 2.36 | |
| S12 | 15 | 2.36 |
Disclaimer/Publisher’s Note: The statements, opinions and data contained in all publications are solely those of the individual author(s) and contributor(s) and not of MDPI and/or the editor(s). MDPI and/or the editor(s) disclaim responsibility for any injury to people or property resulting from any ideas, methods, instructions or products referred to in the content. |
© 2023 by the authors. Licensee MDPI, Basel, Switzerland. This article is an open access article distributed under the terms and conditions of the Creative Commons Attribution (CC BY) license (https://creativecommons.org/licenses/by/4.0/).
Share and Cite
Hatami, F.; Varvani-Farahani, A. Accumulation of Plastic Strain at Notch Root of Steel Specimens Undergoing Asymmetric Fatigue Cycles: Analysis and Simulation. Materials 2023, 16, 2153. https://doi.org/10.3390/ma16062153
Hatami F, Varvani-Farahani A. Accumulation of Plastic Strain at Notch Root of Steel Specimens Undergoing Asymmetric Fatigue Cycles: Analysis and Simulation. Materials. 2023; 16(6):2153. https://doi.org/10.3390/ma16062153
Chicago/Turabian StyleHatami, Faezeh, and Ahmad Varvani-Farahani. 2023. "Accumulation of Plastic Strain at Notch Root of Steel Specimens Undergoing Asymmetric Fatigue Cycles: Analysis and Simulation" Materials 16, no. 6: 2153. https://doi.org/10.3390/ma16062153