Article

3D DEM Simulations and Experiments on Spherical Impactor Penetrating into the Elongated Particles

1
School of Technology, Beijing Forestry University, Beijing 100083, China
2
College of Mechanical Engineering, Zhejiang University of Technology, Hangzhou 310023, China
3
Department of Engineering Mechanics, Zhejiang University, Hangzhou 310027, China
4
College of Engineering, University of California, Davis, One Shields Ave, Davis, CA 95616, USA
*
Authors to whom correspondence should be addressed.
Materials 2023, 16(4), 1664; https://doi.org/10.3390/ma16041664
Submission received: 15 December 2022 / Revised: 27 January 2023 / Accepted: 6 February 2023 / Published: 16 February 2023
(This article belongs to the Special Issue New Advancements in Computational Particle Mechanics)

Abstract

:
In this study, a brass or glass spherical impactor vertically penetrating into a granular bed composed of mono-sized spherical or elongated particles was simulated with three-dimensional (3D) discrete element method (DEM). Good agreement of the particle masses in the cup before and after penetration can be found in the simulations and experiments. The effects of particle length (Lp), friction coefficient, and particle configuration on the penetration depth of the impactor, ejecta mass, and solid volume fraction describing the response of the granular bed are discussed. The penetration depth is negatively correlated with Lp as the corresponding solid volume fraction of the granular bed decreases. A smaller friction coefficient leads to a larger penetration depth of the impactor and more ejection of particles. When the impactor is penetrating the Lp = 10 mm elongated particles, the penetration depth is negatively correlated to the order parameter and solid volume fraction.

1. Introduction

Non-spherical particles are widely ubiquitous in nature and industry; for instance, micro-particles of various shapes have been applied in drug transportation and mixing. Particle shape has been shown to influence various processes including drug transport and crystal preparation [1,2,3,4]. When non-spherical elongated particles are packed, the internal microstructure of the granular bed has a complex and important influence on the macroscopic mechanical response of the material, which is different from that of spherical particles. Furthermore, the mechanical behavior of non-spherical particles affected by the impact will have a significant influence on transportation and industrial production. Therefore, the study of the impact into elongated particles is of great importance.
The finite element method (FEM) is an effective numerical method for continuum material, such as variational phase-field problems [5,6], quasistatic frictional contact problems [7], and elastic systems [8]. In addition, the discrete element method (DEM) is one of the most effective numerical methods for studying the dynamic properties of granular medium; it is a discontinuous numerical method first proposed by Cundall in 1971 [9]. Based on the theory of Newton’s second law and the contact model between particles, the DEM can be applied to the particle dynamics and kinematics analysis by calculating the displacement and force of each particle in the granular system based on the explicit time step iteration.
Both 2D [10,11,12,13,14] and 3D [15,16,17] discrete element models have been used in numerical simulations of object impacts into target granular medium. Studies have shown that the response of the granular bed and impactor depends on many factors, such as the shape, size, angle, and penetration velocity of the impactor [10,18,19,20,21], and the friction coefficient and porosity of the granular bed [11]. In addition, the energy dissipates drastically during the transient impact process, which has a complex relationship with the physical parameters or material properties of the granular medium [22]. Based on studies of spherical particles, the effect of elongated particles can be discussed comparatively.
Numerical models of regular non-spherical particles such as cylinders [23], sphero-cylinders [24,25], polyhedrons [26,27], super-ellipsoids [28,29], multi-super-ellipsoids [30,31], and arbitrarily shaped elements [32] have been developed gradually. The packing of elongated particles was discussed by changing various parameters, such as coefficient of friction and coefficient of restitution [33]. The behavior of elongated particles with varying lengths was explored by discharging them from a rectangular hopper [34]. Studies have shown that the length of the particle can be used to adjust the buffer capacity for the non-spherical particle system [35]. Besides, the effects of particle length and configuration of granular bed on impact have not been discussed, and the effect mechanisms of the elongated particle system have not been studied comprehensively. This study can provide a fundamental insight for the mechanical behavior of impact into non-spherical particles.
In this study, we carried out experiments on vertical impact into granular material and compared the ejecta masses and initial solid volume fractions of the granular bed between experiments and simulations, considering spherical and elongated particles as the objective granular medium. For the simulations based on DEM, we investigated the behaviors of the ejected particles, the particles in the cup, and the impactor. For the above three objects of study, we considered the effects of some key factors according to their different behavior characteristics, including the length of elongated particles, the friction coefficient, the shape of the granular cup, and the configuration of particles.

2. Numerical Model and Methodology

In this study, the translational and rotational movements of particles are governed by Newton’s second law of motion. The equations are written as follows:
F i = m i d v i d t
T i = I i d ω i d t ( I i · ω i ) × ω i
in which m i , v i , I i , and ω i are the mass, translational velocity, moment of inertia, and rotational velocity of particle i, respectively, and Fi and Ti are external forces and torques exerting on it.
The contact types of the sphero-cylindrical particle for the DEM simulation are classified into four groups according to the normal contact forces, as shown in Table 1. The normal contact force calculation and implemented contact detection in this study were proposed by Kidokoro et al. [25] and modified by Guo et al. [36]. The magnitudes and directions of normal and tangential contact forces are determined by contact position and the overlap of the two contacting particles. The tangential force model is the Mindlin model, which only takes into account the static process in this study.
For the normal and tangential damping force [36], F n d and F t d are determined by
F n d = c β 2 S n m * v n
F t d = β 2 S t m * v t
where c is equal to 1 if the normal contact force Fn is proportional to δ n , and c is equal to 5 6 if the normal contact force Fn is proportional to δ n 3 2 . m* is equivalent mass, m * = ( 1 m 1 + 1 m 2 ) 1 , and m1 and m2 are the masses of two contacting particles. vn and vt are the normal and tangential components of relative velocity, respectively. β = lne π 2 + ( lne ) 2 is the contact damping coefficient, where e is the coefficient of restitution. Sn is normal contact stiffness, and St is tangential contact stiffness, given by S n = d F n d δ n and S t = 8 G * a , respectively.

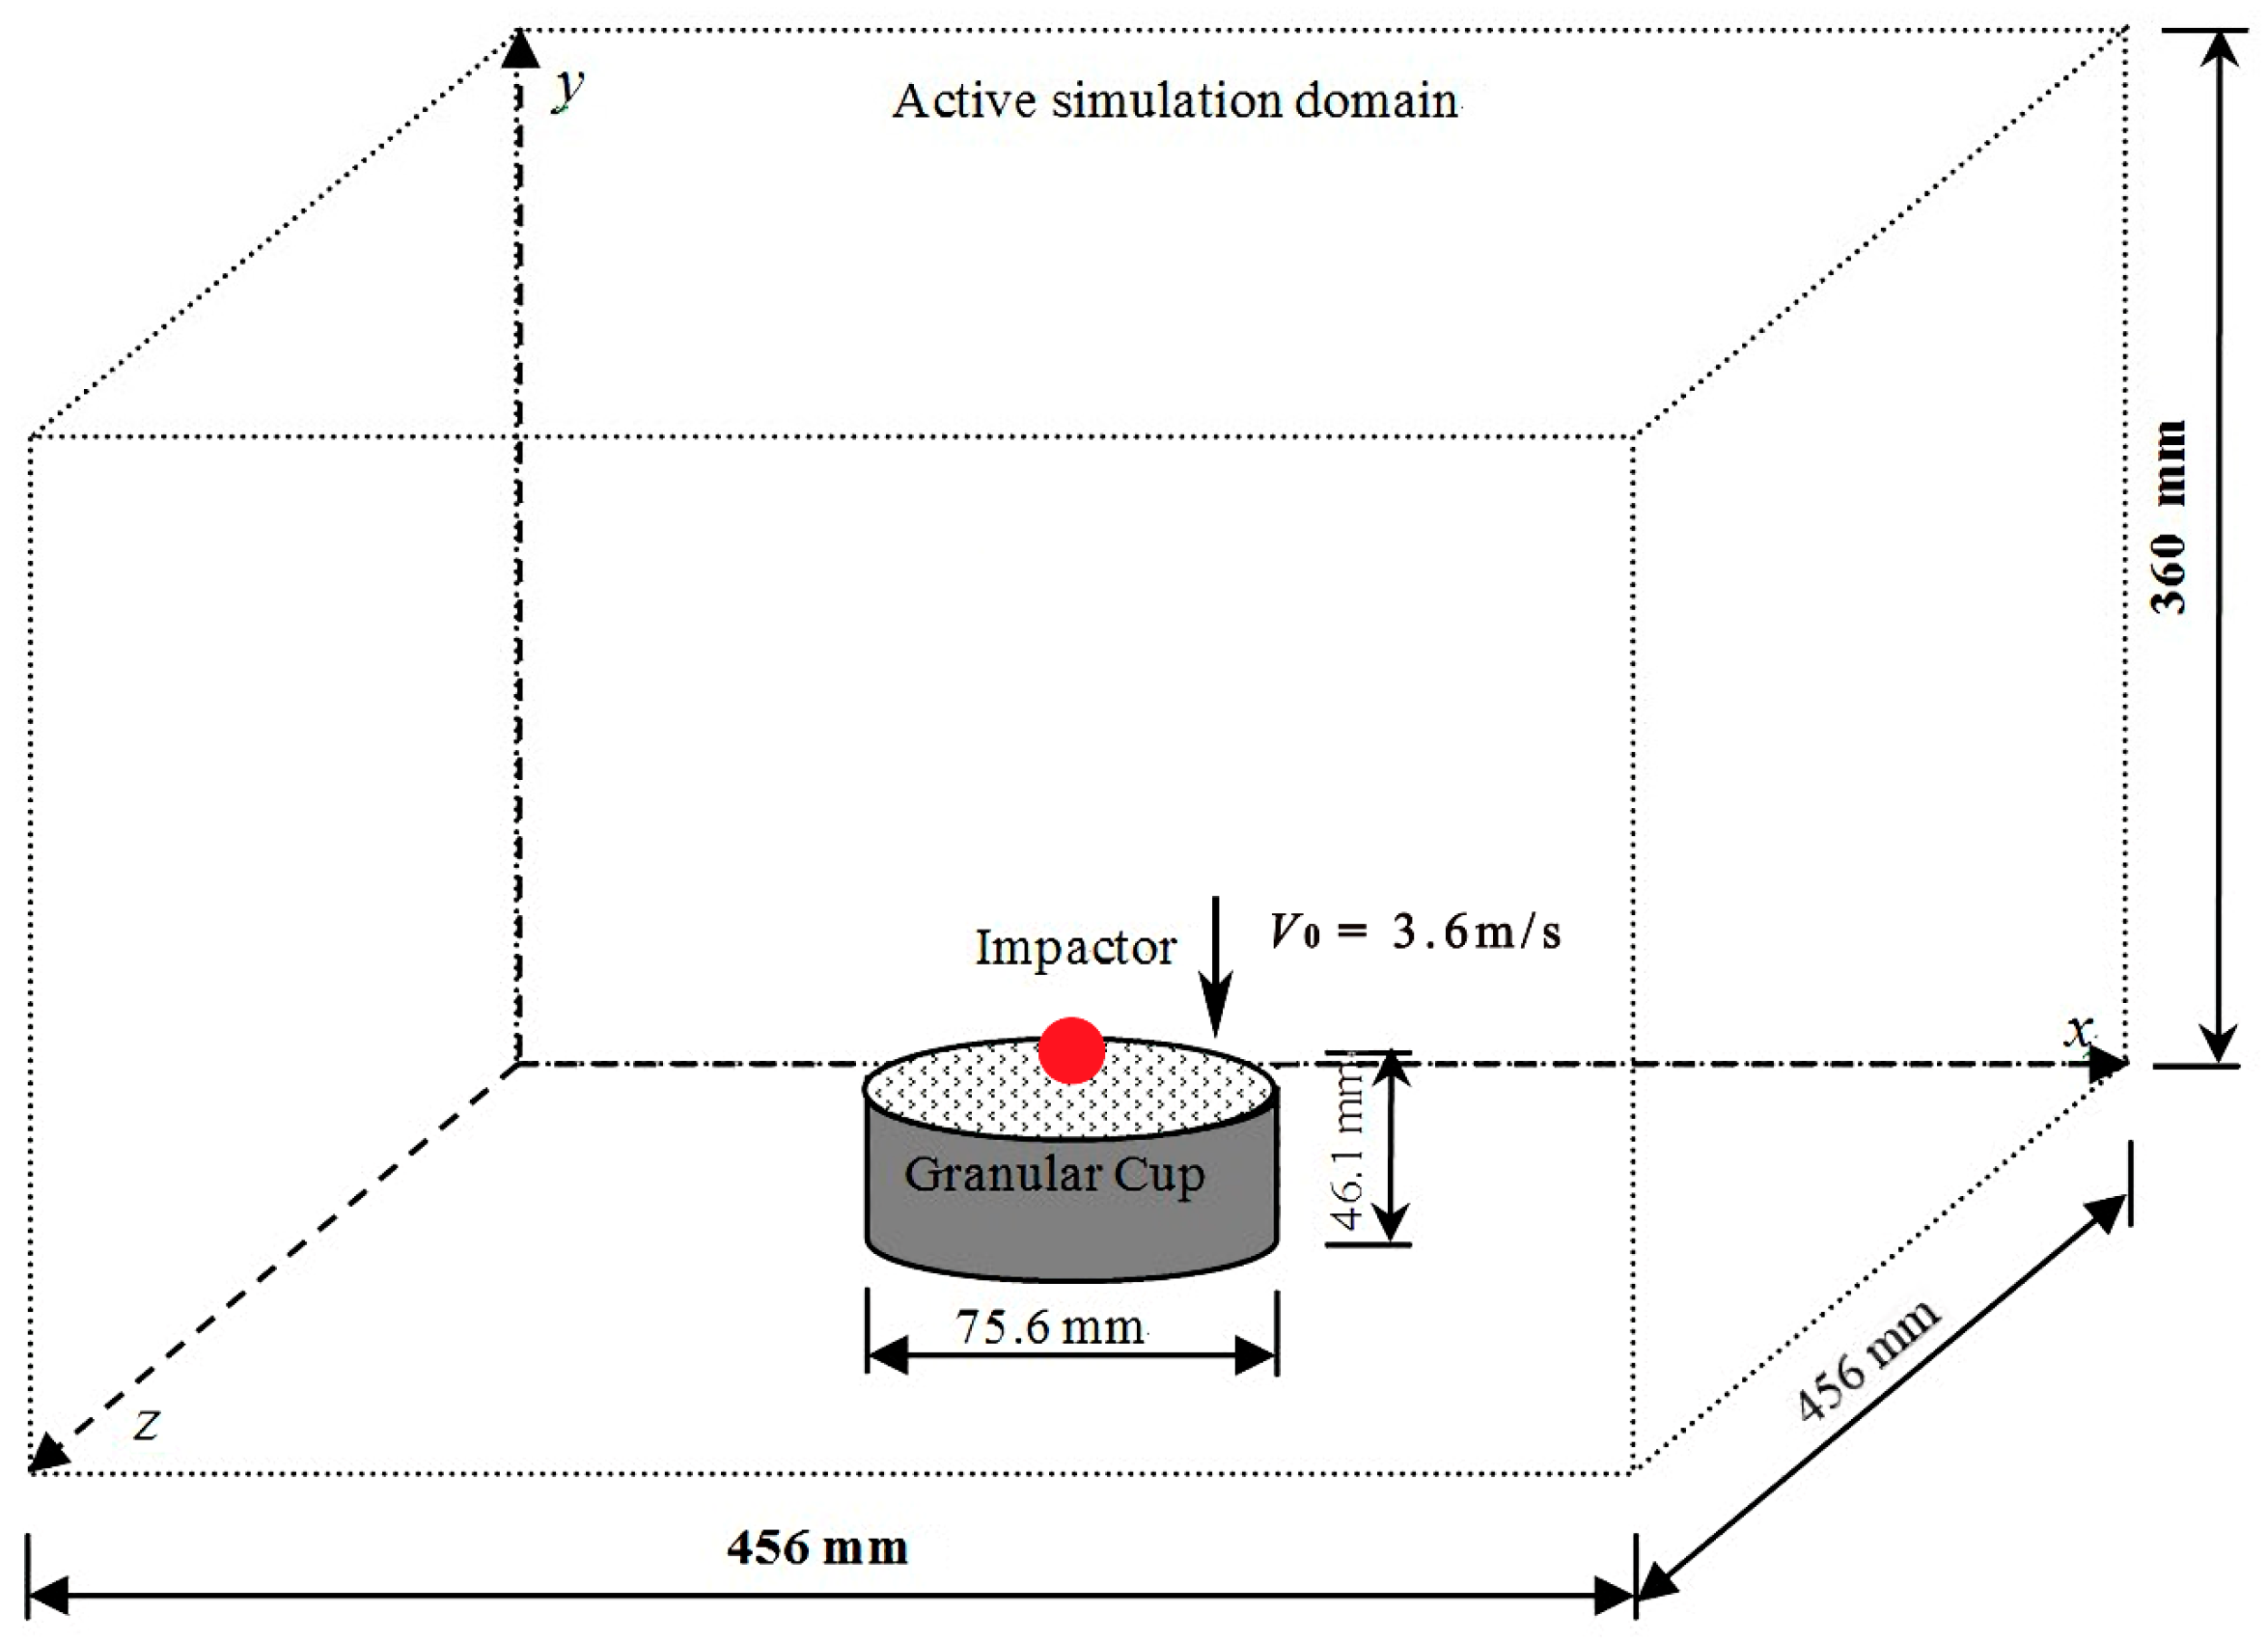
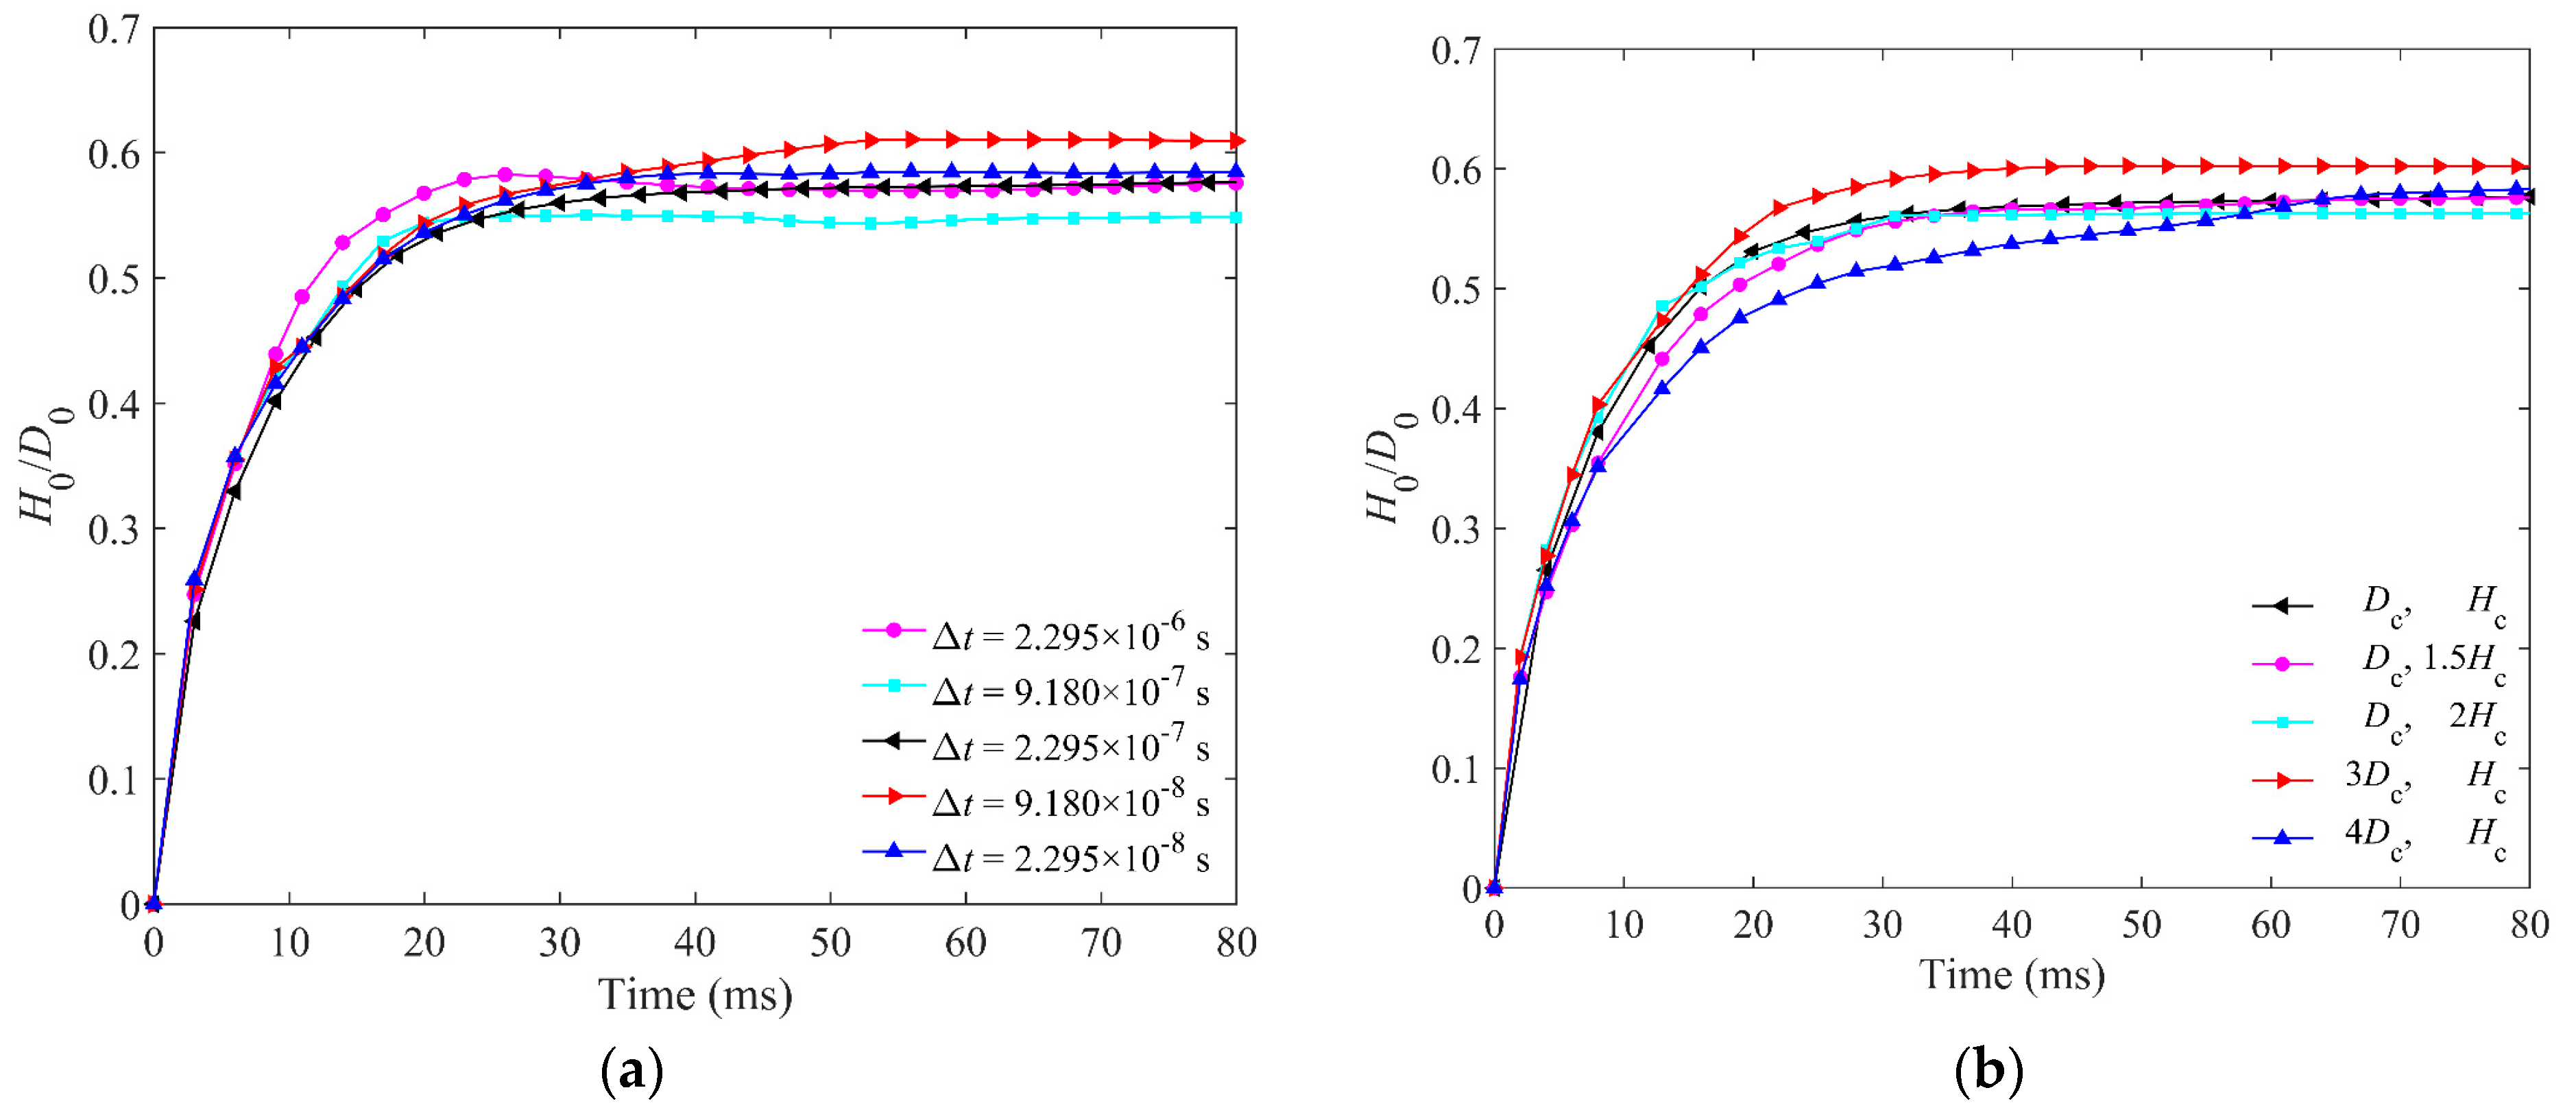
3. Experimental and Numerical Setup

The experimental apparatus used in this study is the same as what we used in the previous study [17]. Figure 1 shows the schematic of the experimental apparatus. The experiment was carried out in an airtight vacuum chamber (<200 mTorr), taking no account of the gas drag on the particles during the impact process. The impactor has a steel dot pasted on the top. Firstly, the impactor was fixed by an electromagnet at the central position of the crossbar at a height of H = 661 mm above the top of the granular bed. Then, the cylindrical particles were poured into the cup, and the surface of the granular bed was smoothed with a scraper. The total mass of the cup and the particles in it, m0, was weighed. The air was then pumped out until the pressure in the chamber was lower than 200 mTorr. Finally, the impactor was released from static state under gravity, and the vertical velocity of the impactor was calculated by V 0 = 2 g H (where g is the acceleration of gravity). After all particles reached the stable state, the total mass of the cup and particles remaining in it, m, was weighed. The mass of ejected particles can be obtained by the equation Δm = m0m. The objective particles used in the experiments are the steel balls and steel cords cut into different lengths (Lp = 4 mm and 6 mm), whose diameters are 2 mm. The impactors are brass and glass spheres, whose impact velocities are 3.60 m/s. The parameters of all the materials used in experiment are shown in Table 2.
The setup of DEM simulations is shown in Figure 2. The geometric and physical parameters of the cup, granular particles, and impactors are chosen from the experimental study. We mainly focus on the particles in the cup and the initial trajectory of ejected particles, and the cuboidal active simulation domain is big enough and will not affect the motion of ejected particles. The implementation of DEM simulation in this study was as follows: Firstly, the computing domain was divided into same-sized cuboid cells, and a certain number of particles were generated without contact and mapped into the cells. The particles were generated within the cylindrical domain with the same diameter as the cup and enough height. The generated particles then fell downward under gravity and packed in the cup until the cup was filled up with the particles. The translational and rotational motions of particles were controlled by Newton’s second law of motion. The normal and tangential contact forces were calculated by the overlap between two contacting objects according to various contact models. When all particles settled down, the impactor was then released with an initial vertical velocity of 3.60 m/s right above the particle bed and penetrated into the particle bed in the center.
In the DEM simulations, the particles are steel spheres and elongated steel particles of Lp = 4 mm, 6 mm, 8 mm, 10 mm with a hemisphere cap at each end. The diameters of the spheres and elongated particles are equal to 2 mm, which is the same as the cylindrical particles used in experiments. Brass and glass spherical impactors with the same diameter are used in both experiments and simulations. The diameter, the height, the density, the coefficient of friction, and the coefficient of restitution are measured experimentally. Young’s modulus and Poisson’s ratio are selected from a handbook [37]. The physical and geometric parameters of particles and impactors are summarized in Table 2. Contact detection of the elongated particles in this study is the same as the sphero-cylinder model in the literature [24]. The difference is that the elongated sphero-cylinder used here is rigid, and it was a flexible elastic model in the literature.
The time step and boundary effect are two important parameters for DEM simulations; therefore, the sensitivities of these two parameters are studied before we determine the final values of them. The penetration depths of five different time steps are compared. The Lp = 10 mm steel elongated particles and the glass impactor are chosen for simulation, and the parameters of materials are shown in Table 2. H0 and D0 are the penetration depth and diameter of the impactor, respectively. Hc and Dc are the height and diameter of the cup, respectively. Figure 3a shows the normalized penetration depth of the glass impactor for different time steps, which shows the limited effect of different time steps. It can be found that the final penetration depths of the glass impactor for different cup heights are very close. The radius and height of the cup have little effect on the penetration depth. There is no obvious tendency with the change of time step or cup size. The average penetration depths of different time steps and cup sizes are both approximately 0.58 D0. The penetration depths of different time steps are in the range of 0.55 to 0.61 D0, and those of different cups are in the range of 0.56 to 0.60 D0. Therefore, we chose ∆t = 2.295 × 10⁻⁷ s, and Dc and Hc as the final time step and cup size.

4. Results and Discussion

In this section, the key parameters on impact are discussed, including particle length, friction coefficient, cup shape, and particle configuration. In addition, three objects will be studied, including the particles out of the cup, the particles in the cup, and the impactor. Their fundamental parameters are analyzed, such as the ejecta mass, the penetration depth, the solid volume fraction, and the kinetic energy.

4.1. Effect of Particle Length

The effect of particle length on impact is studied in this section, and spherical particles and elongated particles of four different lengths with the same diameter are discussed. Two materials of brass and glass impactor with impact velocities of 3.60 m/s are used. The friction coefficients are the same as the base case and material parameters are shown in Table 2.
The kinetic energy of the ejected particles, the impactor, and the particles left in the cup are calculated. The kinetic energy includes rotational kinetic energy and translational kinetic energy. For particle i with mass mi and moment of inertia Ii, the translational velocity and rotational velocity at time t are defined as vi(t) and wi(t), respectively, and the total kinetic energy of N particles is given by
E k ( t ) = i N 1 2 m i v i 2 ( t ) + i N 1 2 I i ω i 2 ( t )
The initial kinetic energy of the impactor is E k 0 = 1 2 M V 0 2 , and the initial potential energy of the impactor is E p 0 = M g H 0 (the position of zero gravitational potential energy is at the final stopping point of the impactor). The mass of impactor M is calculated by the density and size shown in Table 2. We take the percentage of the energy to the sum of Ek0 and Ep0 as the scaled energy.

4.1.1. The Particles out of the Cup
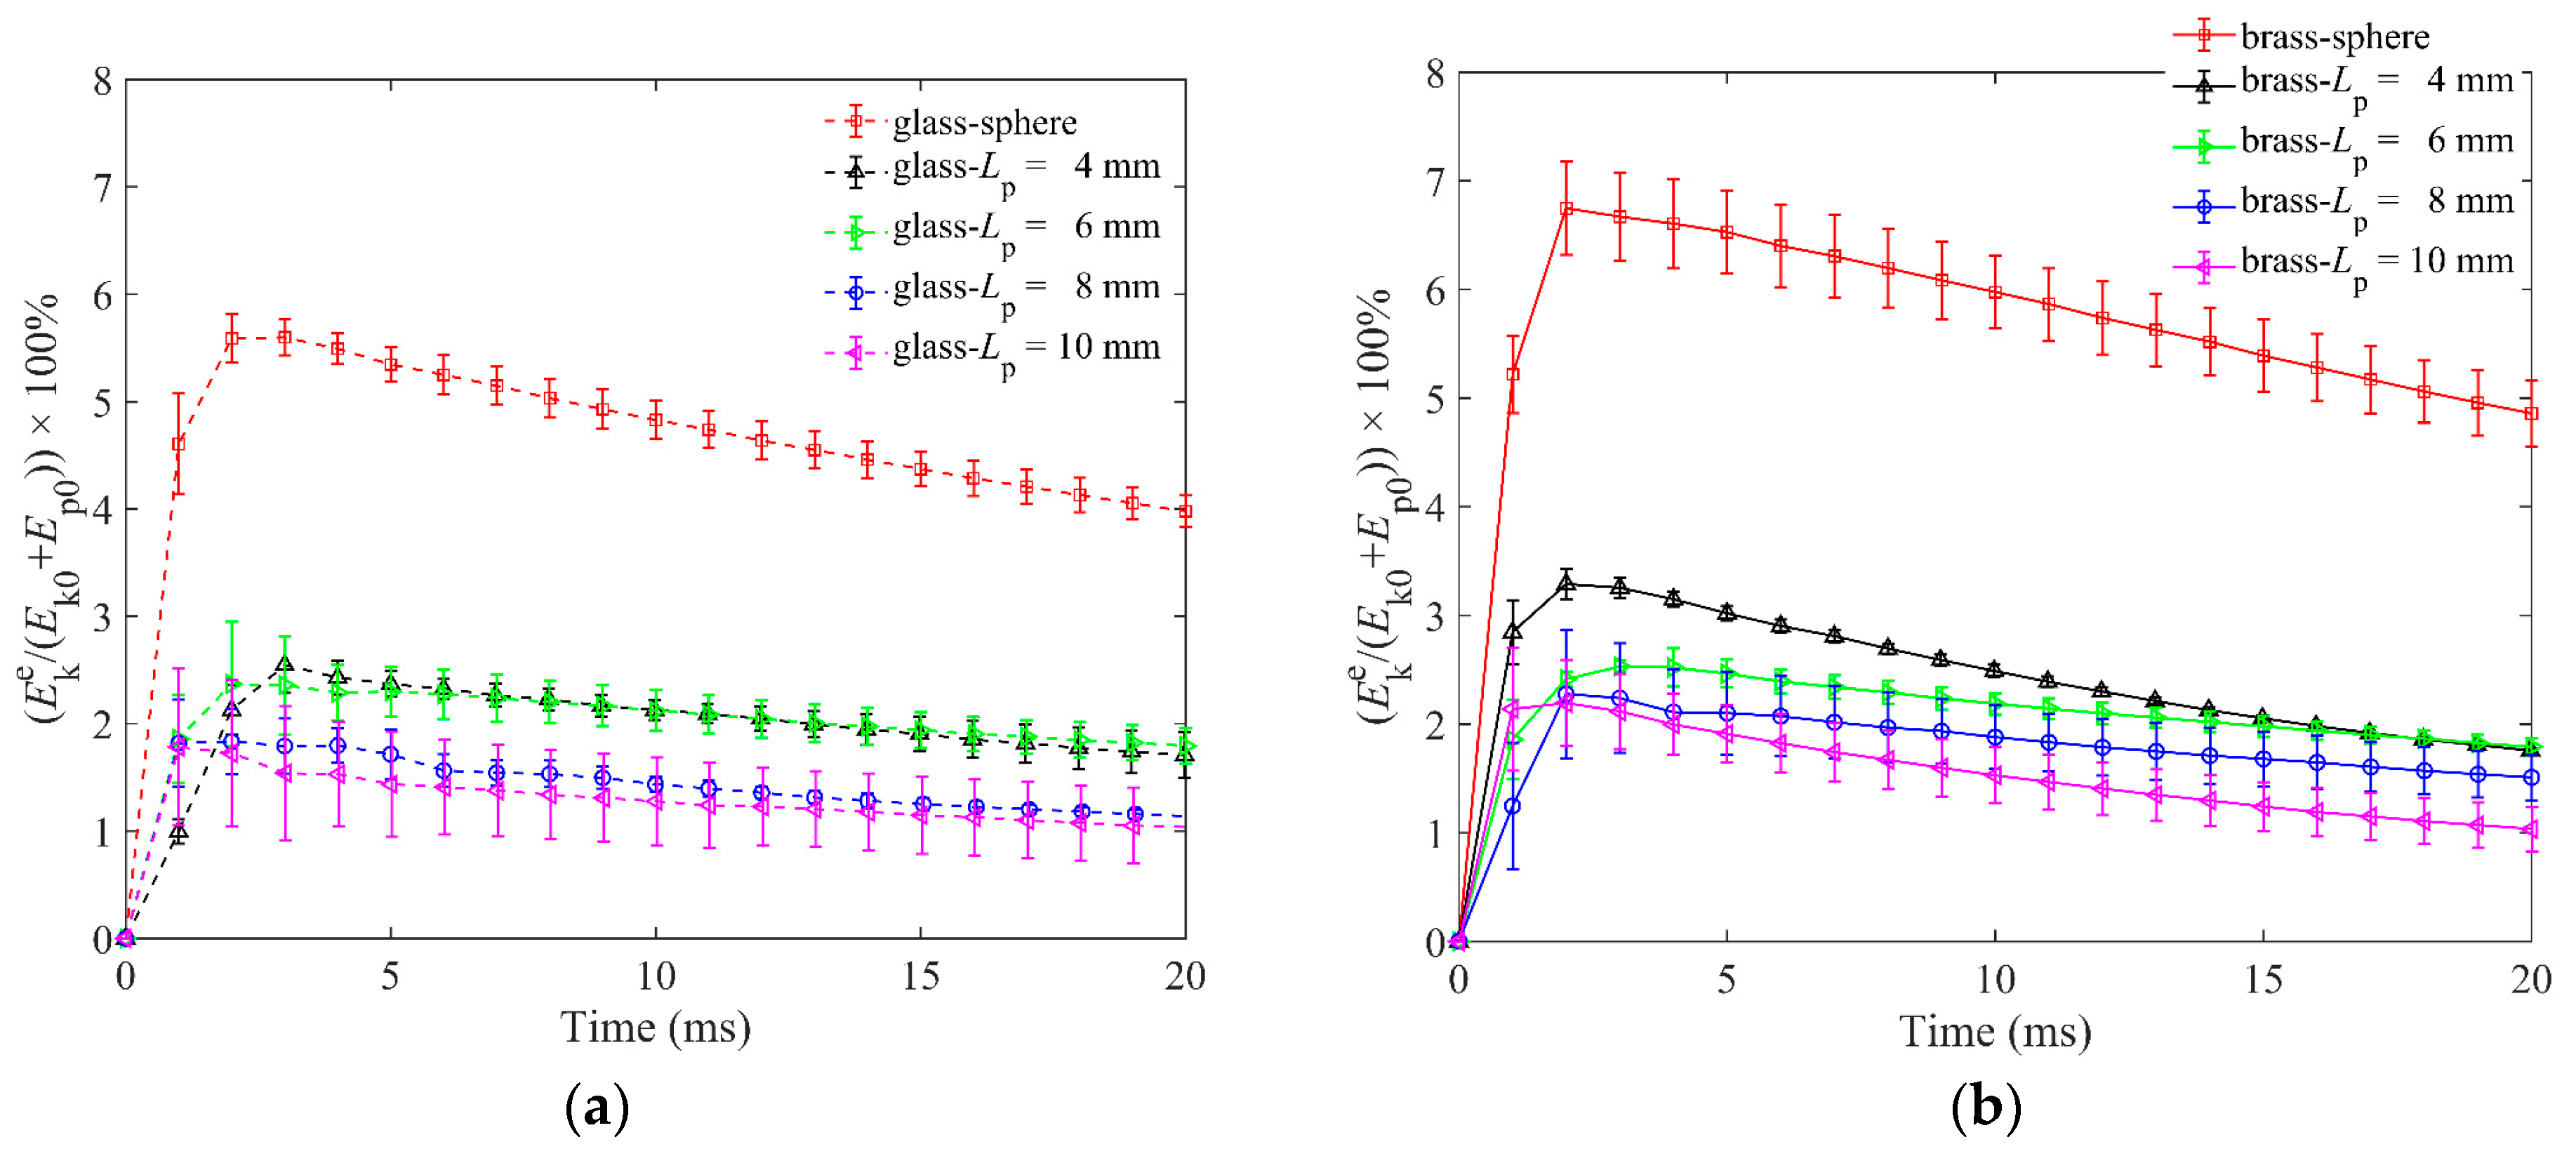
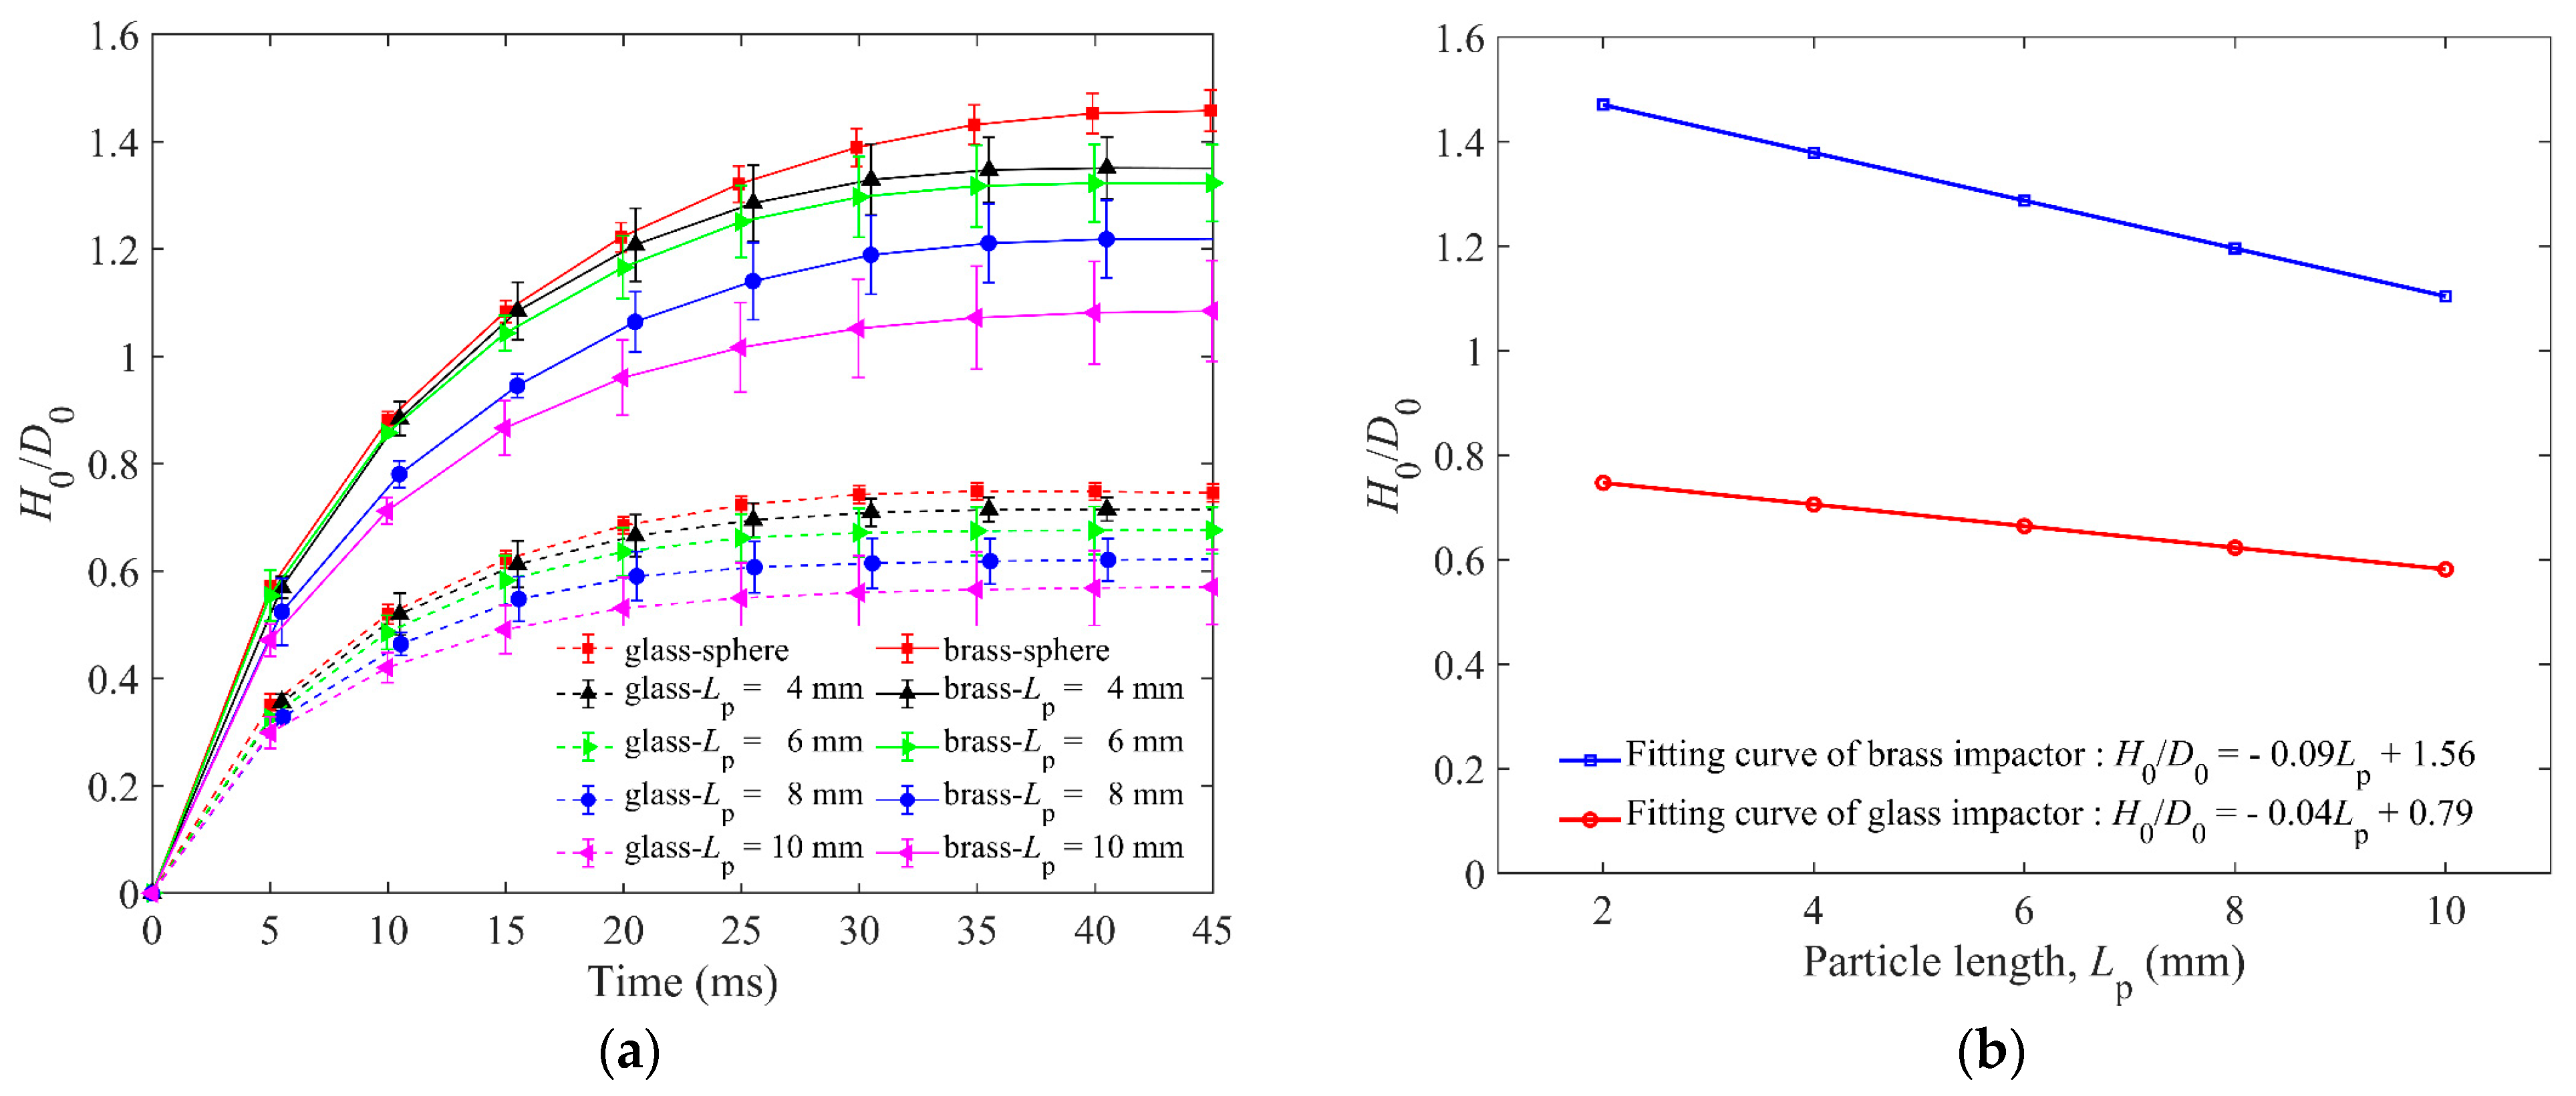
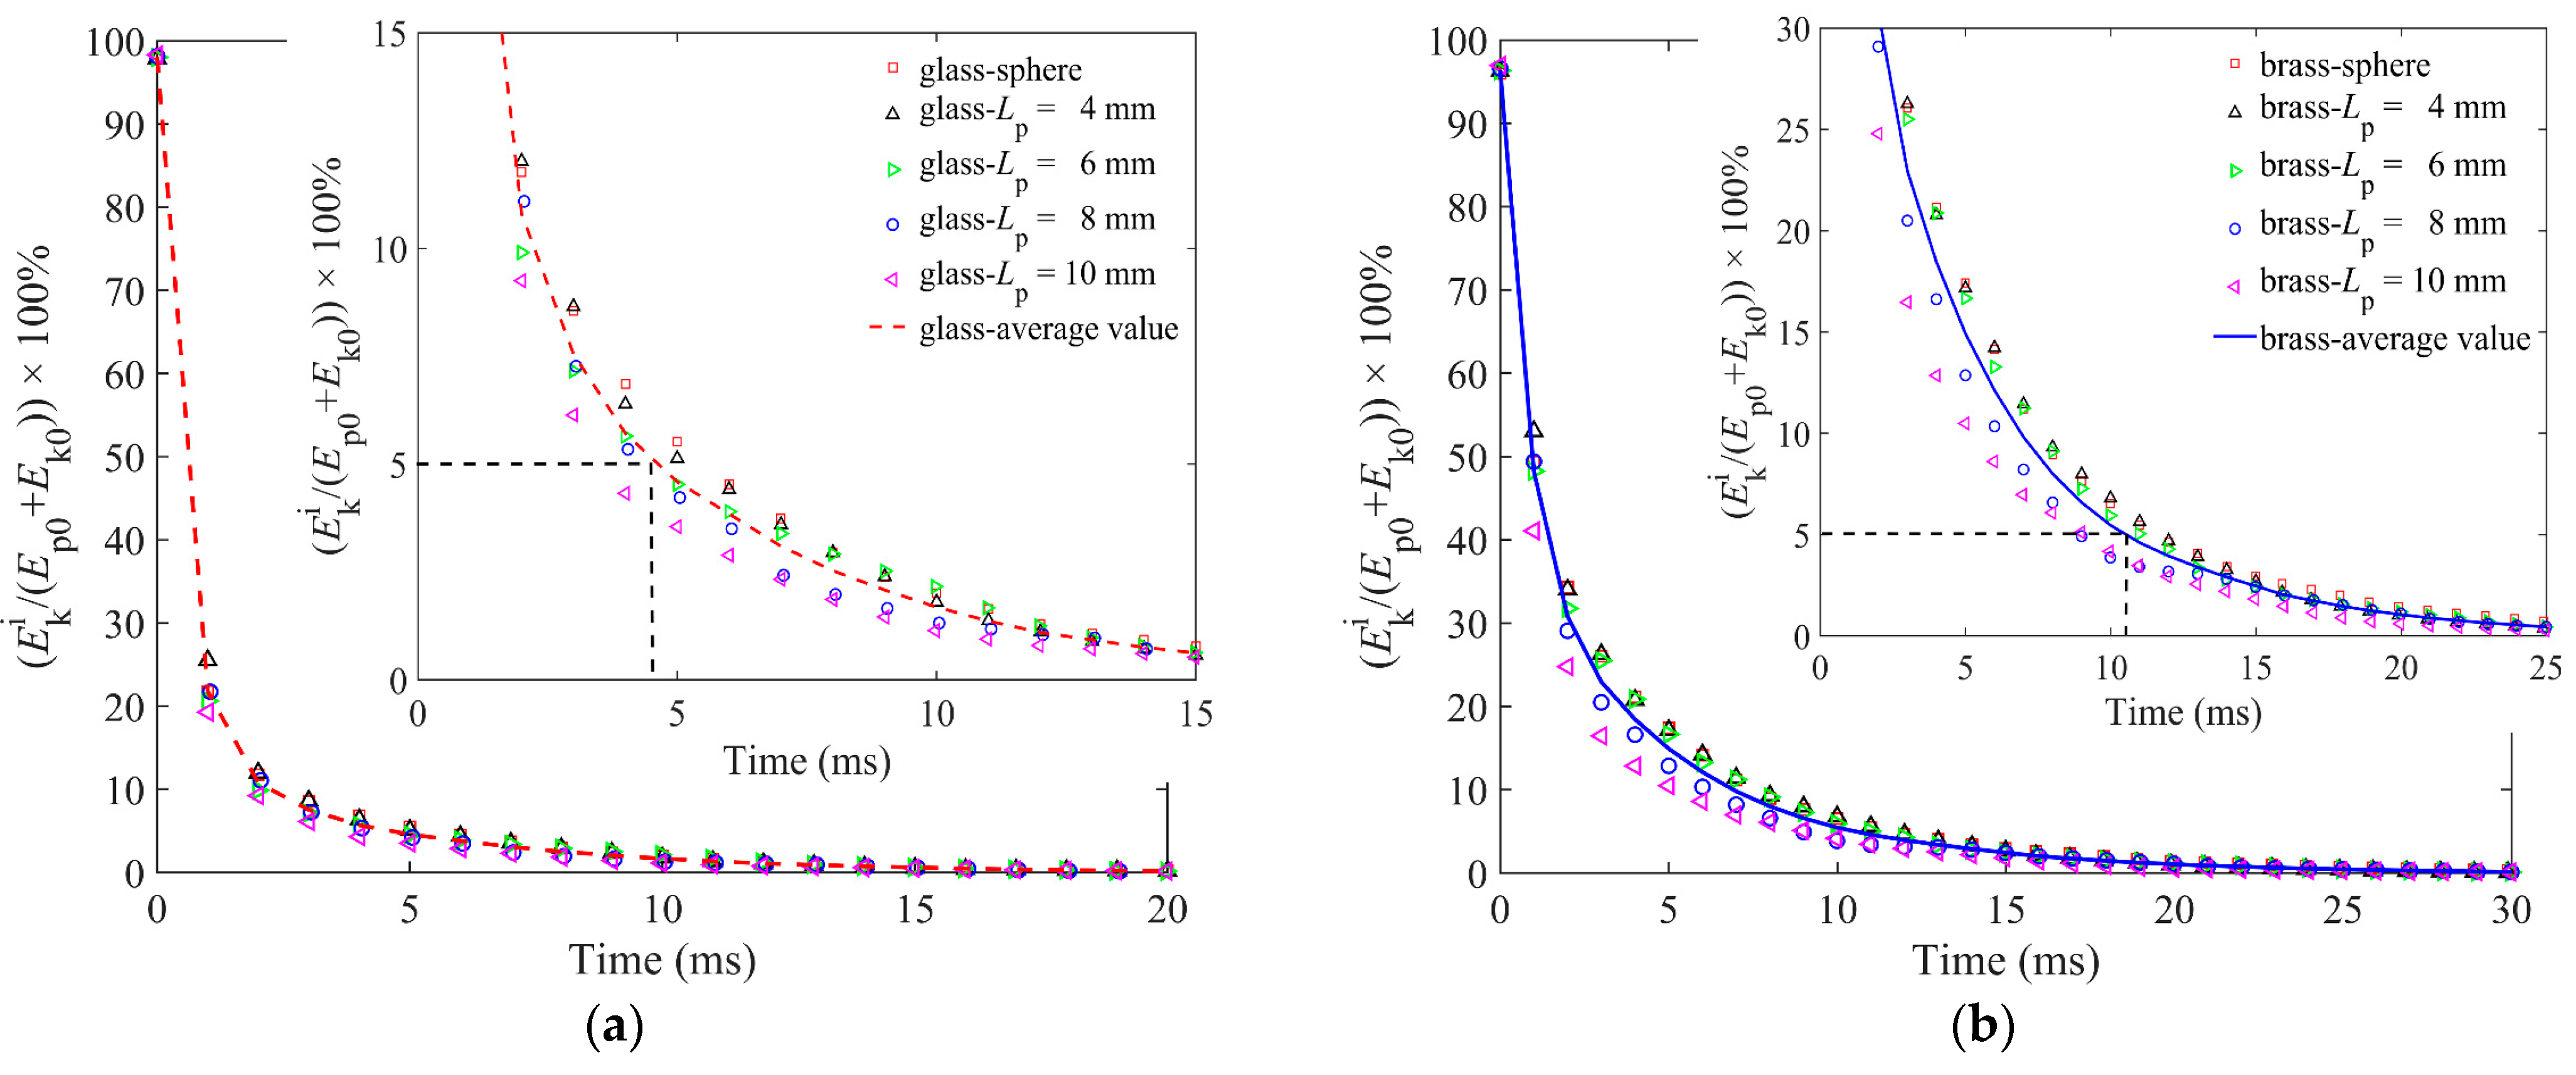
The ejecta mass and the kinetic energy of ejected particles E k e are shown in this section. Figure 4a,b show the ejecta masses for granular beds composed of spheres and elongated particles of different lengths with the same diameter in simulations and experiments.
Figure 4a is the dynamic change of ejecta mass and Figure 4b is the comparison of the final ejecta masses between simulations and experiments. In Figure 4a, we set the time that the impactor touches the top of the particle bed as t = 0 ms. The end time of particle ejection for brass and glass impactors is about 90 ms. It is obvious that the ejecta masses of the brass impactor are larger than those of the glass impactor due to higher impactor energy. For the brass impactor, the ejecta masses of Lp = 6 mm, 8 mm, and 10 mm elongated particles are closer and smaller than that of Lp = 4 mm. For the glass impactor, the ejecta masses of Lp = 4 mm, 6 mm, 8 mm, and 10 mm elongated particles are approximately equal and smaller than that of 2 mm spheres.
In Figure 4b, the agreement of solid volume fractions and ejecta masses between experiments and simulations can be found. The results show that the ejecta mass of spherical particles is much larger than that of elongated particles. In this simulation, the method of changing the aspect ratio is increasing the length of particles (keeping the diameter unchanged). In this way, the mass of a single particle also increases as a result of increasing particle length. When the length of particles increases to 6 mm, the impact energy of the glass impactor cannot make more elongated particles eject from the cup because of the large mass of a single particle. Therefore, the percentage of total ejecta mass of 6 mm particles is close to that of 4 mm, and their values are only 0.5%, indicating that the total mass of ejected particles is very small. Similarly, when the length of particles increases to 8 mm, the ejecta mass for the brass impactor is almost the same as that of 6 mm. By comparing the results of the two impactors, it can be concluded that when the mass of the elongated particle increases to a certain value, the transferred energy cannot support the ejection of more particles.
Figure 5a,b show the kinetic energy of ejected particles for two impactors. The E k e reached its peak value at about 2 ms when the particles collided with the impactor and gained the maximum velocities. Some particles began to launch upwards and fly in the air along parabolic trajectories. The ejected particles were moving upward along the parabolic trajectory before 20 ms, and their velocities were hence decreasing, resulting in the decreasing kinetic energy. It is easy to find that the peak values of E k e s for spherical particles are much larger than those of elongated particles for both glass and brass impactors because spherical particles roll more easily than elongated ones. Comparatively, the E k e s of different elongated particles lengths are obviously smaller than those of spherical particles, and E k e s are slightly smaller as the particles become longer, whether for the glass or brass impactor. We can suppose that the kinetic energy transferred to the ejected particles is to support their movement and more energy will be needed to drive a particle moving if its mass becomes larger. In this study, we changed the aspect ratio of a particle by lengthening the particle and kept its diameter unchanged. Therefore, the E k e s of longer particles (with larger masses) are smaller.

4.1.2. The Impactor

The responses of the impactor are investigated by DEM simulations here, including the penetration depth of the impactor (H0) and the energy of the impactor ( E k i ).
Figure 6 shows the normalized penetration depth of granular beds for spheres and elongated particles. Comparing the H0/D0 of brass and glass impactors in Figure 6a,b, it can be found that the final H0 is negatively correlated to the particle length of the granular bed. For the brass impactor, the largest H0 is about 1.5 D0 for the granular bed made of spheres, and the granular beds with Lp = 10 mm elongated particles have the smallest H0 of about 1.1 D0. The shape of the H0(t)/D0 function of the glass impactor is similar to that of the brass impactor, but its value is less than that of the brass impactor. In addition, the glass impactor stopped earlier than the brass impactor, indicating that the brass impactor with larger kinetic energy took more time to halt the penetration. The time of static state of the glass impactor is earlier than that of the brass impactor, and the static state is defined as the unchanged value of H0 of the impactor.
Because of the different penetration depths of the impactor, the initial potential energy is different, resulting in a slight difference of the Ek0 between the glass impactor and brass impactor. As shown in Figure 7a,b, the Ek0 for the glass and brass impactors at t = 0 ms are 98% and 96.5%, respectively, indicating that the initial total energy of the impactors dominated by Ek0 and its Ep0 is very small. It can also be found from Figure 7a,b that the kinetic energy of the impactor E k i decreases rapidly from 0 ms to 5 ms. For both glass and brass impactors, the decrease of E k i slightly increases with the increasing particle length, indicating that the dissipation of E k i is faster with a larger particle length. Furthermore, we quantify the average E k i of five lengths, and it shows that the average E k i obeys an exponential-like dissipation. In addition, the brass impactor dissipates 95% of E k i in more than 10 ms, while the glass impactor dissipates 95% of E k i in less than 5 ms. The main reason is that the initial total energy of the glass impactor is smaller than that of the brass impactor.

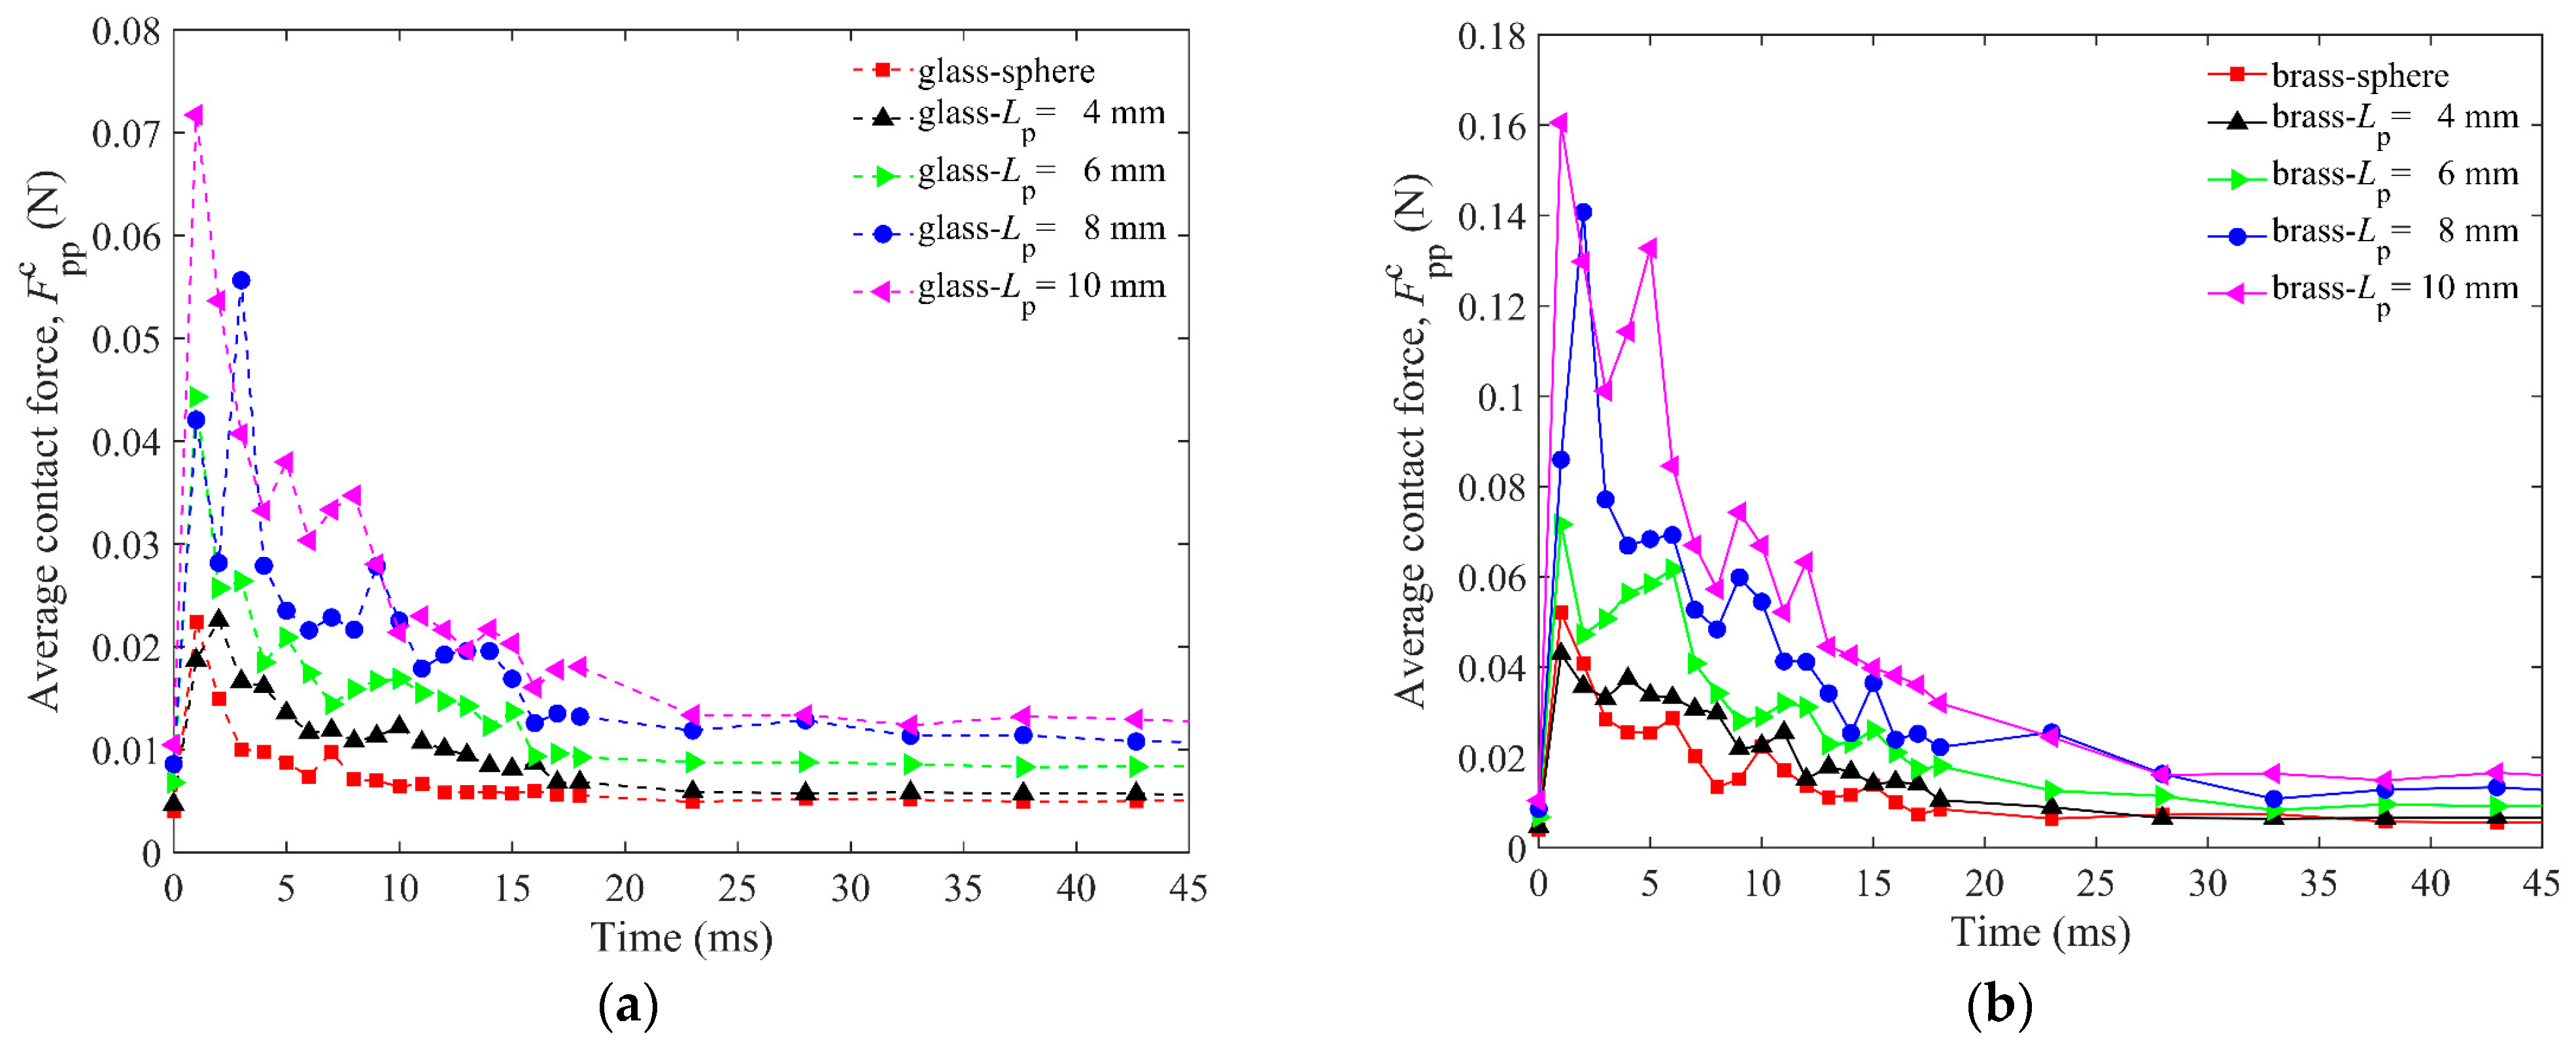
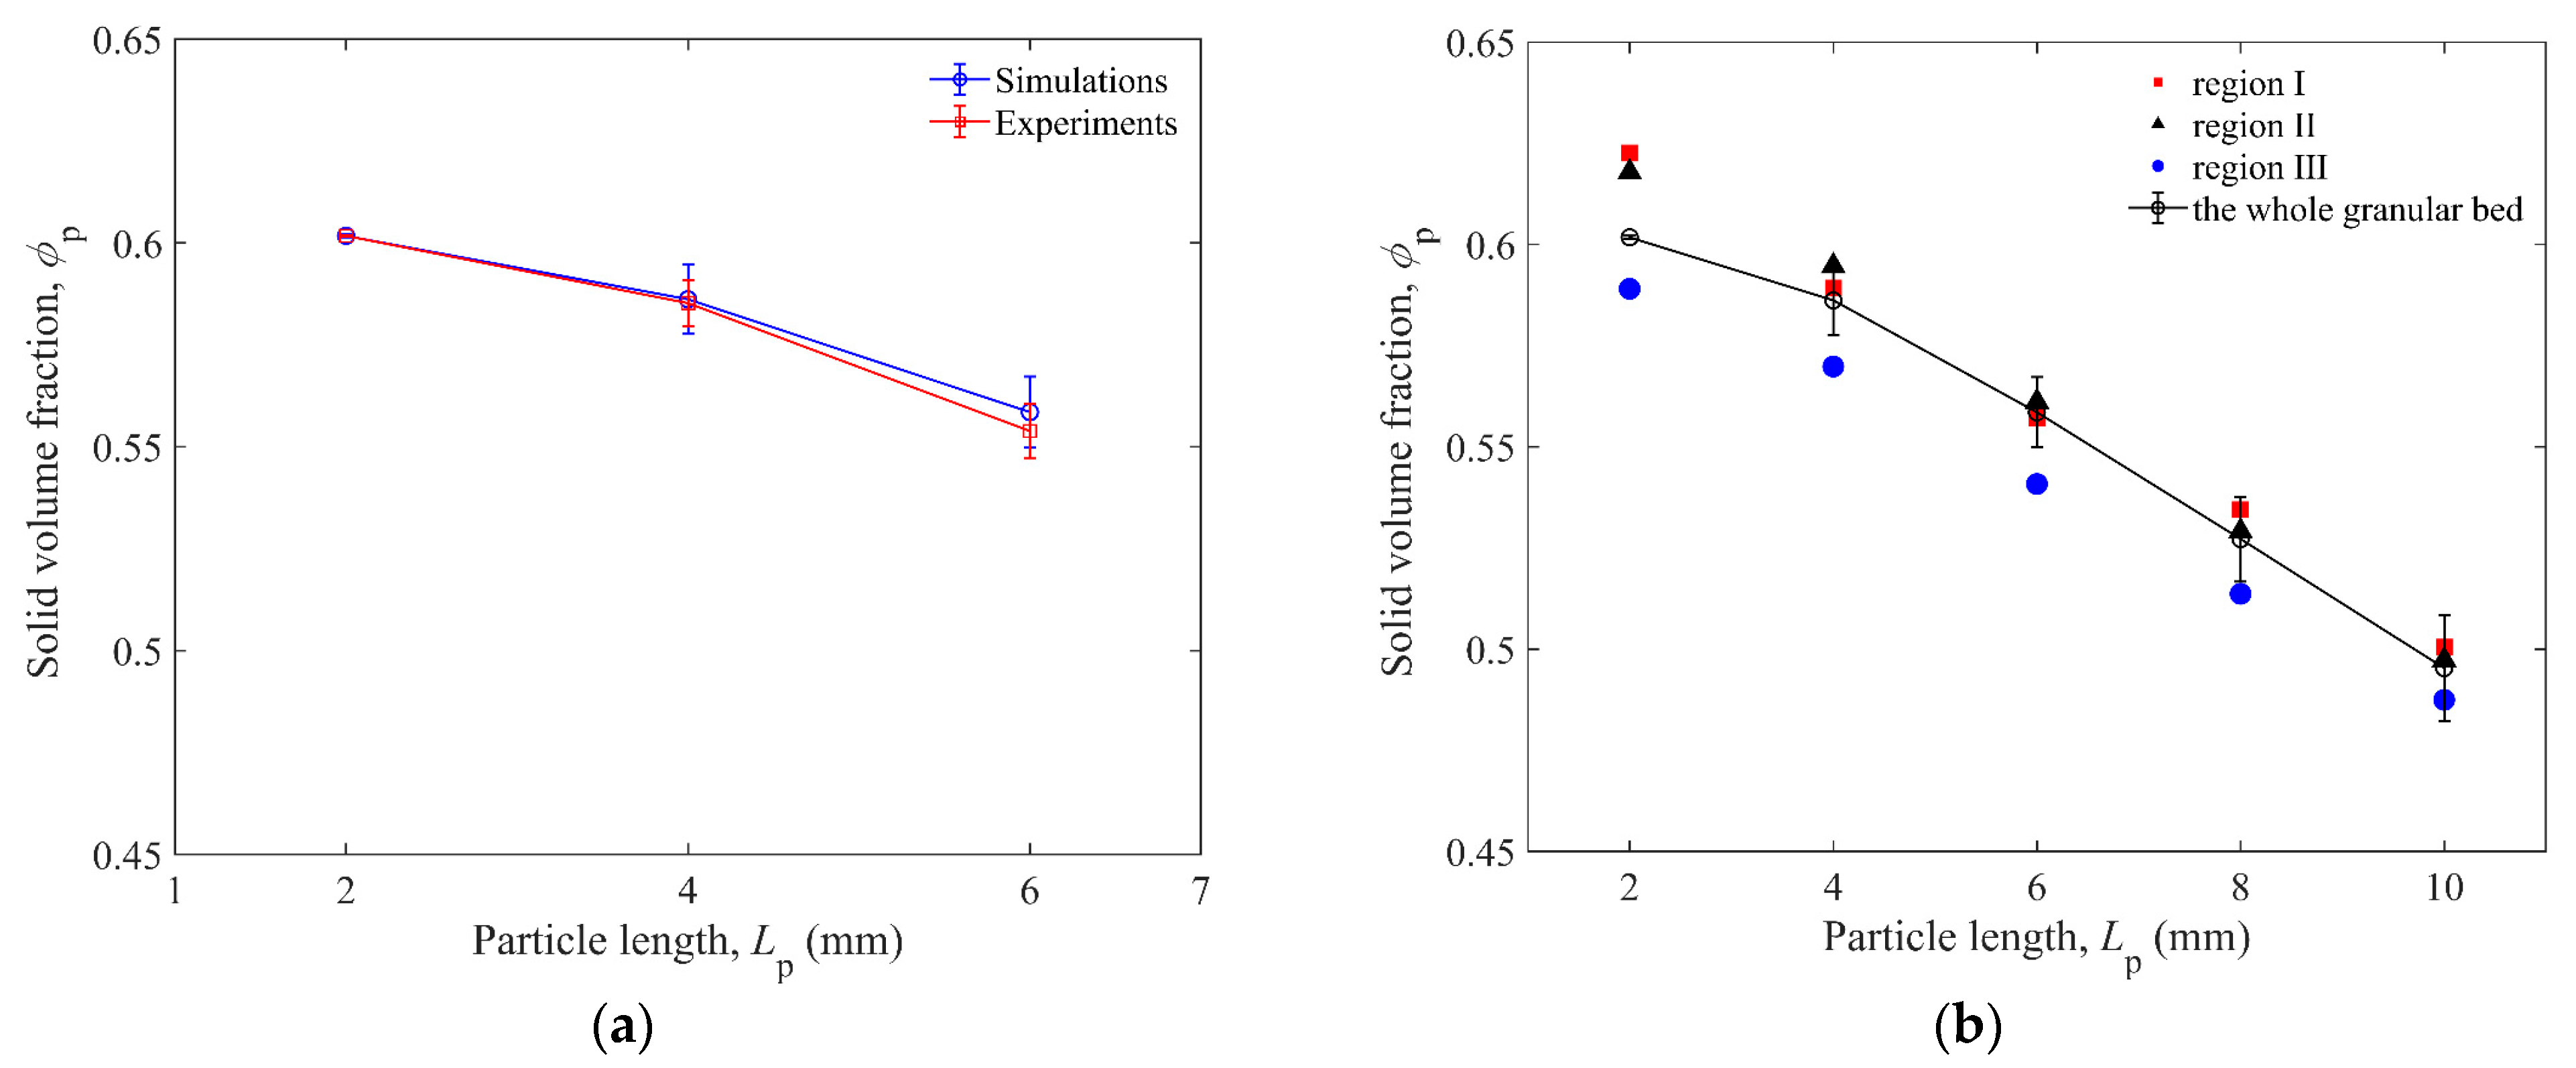
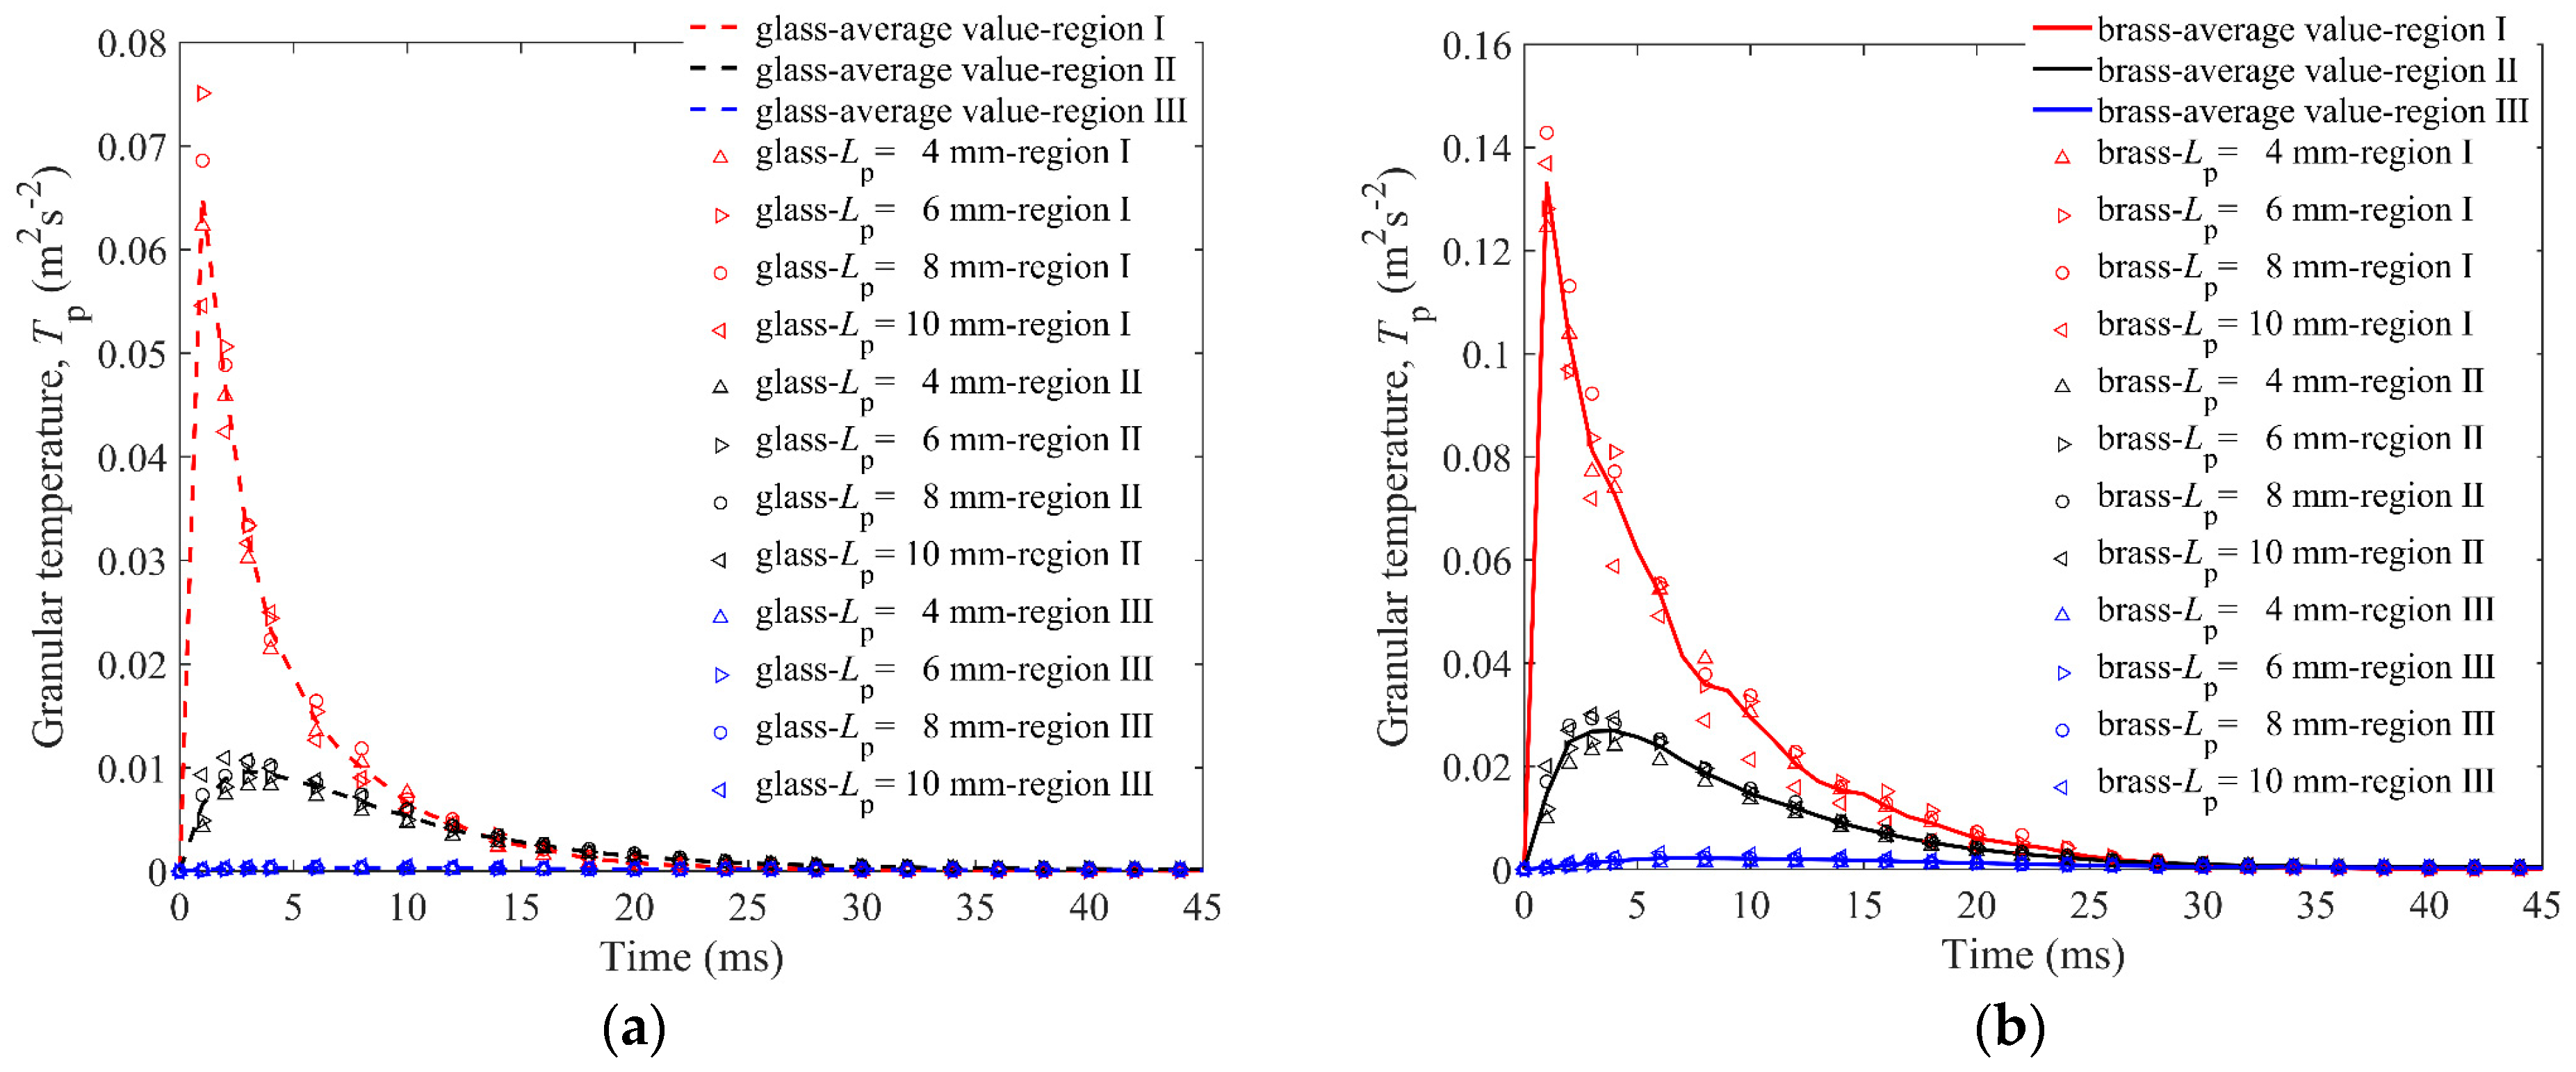
4.1.3. The Particles in the Cup

To study the dynamic response of the particles in the cup, the average contact force of the granular bed ( F pp c ), the solid volume fraction (ϕp), the granular temperature (Tp), and the kinetic energy are discussed.
The correlation between H0 and Lp can be explained by the average contact force between particles F pp c in the granular bed. F pp c is the average resultant force of the normal and tangential forces at all contact points, which can describe the strength to resist the penetration of the impactor, as shown in Figure 8. When the impactor penetrates the granular bed, the particles in the cup move randomly and intensively in the first 10 ms. During this period, the impactor and the particles in the granular bed will be in contact and separated from each other until most of the energy of the impactor is dissipated. In Figure 7, it is easy to find that the energy of the impactor sharply decreases in the first 10 ms. The contact forces show a zig-zagging change, which is a characteristic of the discontinuous medium after impact. The contact force is transmitted through the force chain. The particles are discrete, and the force chain structure in the granular system will change at every moment due to the frequent formation and breakage of the contact forces between particles, which leads to the zig-zagging change of the contact force. Furthermore, a longer particle can easily trigger stronger contact force between particles and has a stronger resistance to the penetration of the impactor, thus reducing the penetration depth of the impactor. This can be used to explain the phenomenon shown in Figure 6.
For the analysis of granular temperature, solid volume fraction, and kinetic energy, the granular bed was divided into three cylindrical regions to investigate the dynamic responses of the particles in the cup, as shown in Figure 9. To distinguish the particles right under the impactor and surrounding the impactor, the radius of region I is chosen to be close to the radius of the impactor. Meanwhile, the thickness of region III cannot be smaller than the length of the longest particle (~2/7Rc). Therefore, the radial widths of region I, II, and III are 2/7Rc, 3/7Rc, and 2/7Rc, respectively. The edge between two adjacent regions is fixed, and particles are free to enter or leave one region.
Figure 10a shows the comparison of solid volume fractions for granular beds composed of spheres, Lp = 4 mm, 6 mm elongated particles, impacted by glass and brass impactors in simulations and experiments. The initial solid volume fractions ϕps of the granular beds are compared in Figure 10b. It can be found that the ϕps of region I and II are closer, and those of region III are slightly smaller. It is interesting to find that the ϕp of the granular bed and the H0 of impactor both decrease with longer particles, which is different from previous studies on spherical particles [13,17]. Due to the random distribution of elongated particles, a 3D cage structure will be formed, and there will be more voids in the structure compared with the granular bed of spheres. Therefore, a smaller ϕp of the bed will be formed by the random packing of longer elongated particles.
Granular temperature [38] Tp is calculated to describe the fluctuation of translational velocities of the elongated particles in the cup, as shown in Figure 11. The granular temperature of all particles in the cup can be defined as follows:
T p = ( T p , x + T p , y + T p , z ) / 3
in which T p , x = ( u x u x ) 2 , T p , y = ( u y u y ) 2 , T p , z = ( u z u z ) 2 , and u u is the fluctuating velocities of the particles. The operator u is used to calculate the average velocity over all particles. The Tps of three regions are calculated respectively.
In Figure 11, it can be found that the difference between Tps and Lps is limited, indicating that Lp has no significant effect on particle movement. The particle temperature of region I experiences its peak value in the first 1 ms, and the other two regions are about 3 ms and 6 ms, respectively, which shows that the particles move from the middle to the periphery. The peak value of Tp of the brass impactor is about twice that of the glass impactor in region I and region II. In short, the granular temperature in region I experiences the most dramatic change, followed by region II and region III.
Figure 12a,b shows the kinetic energy of particles in the cup E k c , which is similar to granular temperature. The particle length has little effect on the dissipation of E k c for any region. The particles left in the cup did not move violently but slightly; therefore, the kinetic energy of the particles left in the cup will not be affected by the particle length. In addition, particle length has little effect on the dissipation of E k c for any region. Comparing the energy dissipation of the three regions, it can be found that the E k c of region I has the most drastic change, while that of region III has the smallest change. In addition, the total E k c of three regions of glass impactor is larger than that of brass impactor, which indicates that the impactor with less initial energy transfers its higher energy to the particles in the cup. The brass impactor with higher initial energy transfers more energy to the ejected particles, as shown in Figure 5b.

4.2. Effect of Friction Coefficient

To evaluate the influence of particle friction on penetration, the friction coefficients of the target particles (μp-p), impactor and particles (μi-p), and cup wall and particles (μw-p) were studied. We chose the steel elongated particles of Lp = 6 mm with initial friction coefficients and the brass impactor for the DEM simulation in this section. Figure 13 shows that the effect of μp-p is dominant. The ejecta mass decreases dramatically when μp-p ranges from 0 to 0.2, and it decreases gently as μp-p changes from 0.2 to 1.0 gradually, while μi-p and μw-p have very little effect on ejecta mass.
The non-dimensional penetration depth (H0/D0) is used to illustrate the correlation among various friction coefficients between particles, which is exhibited in detail in Figure 14a. It is interesting to find that the maximum H0 of the impactor is about 2D0 when μp-p = 0 for condition I, and H0 decreases with increasing μp-p. The impactor will rebound to the upside and not penetrate into the granular bed while μp-p ≥ 0.7. However, the friction coefficients of μi-p and μw-p have little effect on H0. The maximum values of H0 for different μi-ps are less than 0.5 D0, as shown in Figure 14b, and the H0 hardly changes for various μw-ps in Figure 14c. The vertical velocity of impactor V is shown in Figure 15a,b. When μp-p is less than 0.7, the decrease of V is positively correlated to μp-p, as shown in Figure 15a. The changes of V for different μi-ps and μw-ps are similar, as shown in Figure 15b.
Figure 16 shows the velocity profiles of particles with μp-p = 0.8 at different times impacted by the brass impactor. The color of the granular bed represents the velocity magnitude, which is mainly in the range of 0.3 m/s–1 m/s. From Figure 14a and Figure 16, it can be found that the impactor rebounds to the height of 0.5D0 at t = 50 ms. Then, the impactor starts falling under gravity, and its velocity reaches a small peak at t = 90 ms, as shown in Figure 15a. Some ejected particles will contact with the impactor during t = 90–100 ms, as shown in Figure 16, which slows the impactor slightly. The second penetration begins at t = 90 ms, corresponding to the decreasing velocity, and the contact position is higher because the surface of the granular bed is irregular after the first impact. The maximum H0 is kept at 0.15D0 when t = 150 ms, indicating the termination of the whole penetration. As a whole, the velocity direction of the impactor is not always downward during its penetration, resulting in the spatial curve of the actual penetration path of the impactor. In addition, when the impactor rebounds, the trajectory of the impactor is a parabola, which makes the drop-point of the second penetration depart from that of the first one.
Comparing the ejecta mass and penetration depth under different particle frictions (Figure 13 and Figure 14a), we presume that the objective particles would contact each other with a large contact force and build a strong quasi-continuous medium under a strong force chain to resist the penetration of the impactor, resulting in the decrease of V, as shown in Figure 15a. Therefore, we can say that the ejecta mass for a larger friction coefficient is decreased by the stronger force chain, because it takes more energy to separate the particles. Based on this consideration, we study the vertical contact force between the impactor and particles F ip c , and the average contact force between particles and particles F pp c , as shown in Figure 17a,b, respectively. It is obvious that the forces F ip c and F pp c increase with increasing μp-p, and the force chain is the strongest when μp-p = 1.

4.3. Effect of Particle Configuration

To find the effects of the shape of the cup and particle configuration, we chose steel elongated particles of Lp = 10 mm and the brass impactor to pack in the cylindrical and cuboid cup in the lateral and vertical directions, respectively, as shown in Figure 18. The friction coefficients and material parameters are shown in Table 2. In order to make the elongated particles more regular when they are arranged horizontally, the size of the cuboid cup is the integral multiple of the length of the elongated particles. The solid volume fractions ϕps are shown in Figure 19. It can be seen that the ϕps of the cuboid cup are larger than that of the cylindrical cup. The ϕp of vertical arrangement is the largest, and the ϕp of random packing is the smallest.
The orientational order of particles can be monitored by diagonalization of the symmetric traceless order tensor Q [38], as follows:
Q ij = 3 2 N n = 1 N l i n l j n 1 3 δ ij
where l i ( j ) n is the unit vector along the major axis of the elongated particle n among all N particles. The largest eigenvalue of Q is the primary order parameter Sr, which quantifies the degree of alignment. When i = j, δ ij = 1, or δ ij = 0, the order parameter Sr is equal to one if all particles are packed in the same direction, and Sr is zero if the orientation of every particle is different.
Although Sr can describe the order of particle configuration, it cannot show the direction of particle orientation. For example, if the major axes of all particles are all in the same inclined direction, the direction of particles cannot be specifically distinguished using Equation (12). Therefore, the average orientational parameter O of all particles is used as the quantitative analysis of the particle orientation. The orientational parameter [39] of a single elongated particle is calculated by the acute angle between the major axis of the elongated particle and the vertical axis. A larger O leads to a more vertical particle. Figure 20a,b show the order parameters Sr and orientational parameters O for three packing types in the cylindrical and cuboid cups. The values of Sr in the cuboid cup are all bigger than those in the cylindrical cup, which is caused by the restriction of the cylindrical wall.
As shown in Figure 21, the ejecta masses of the cylindrical cup are all larger than that of the cuboid cup. The ejecta mass of lateral arrangement is the largest, and that of vertical arrangement is the smallest. The elongated particles of lateral arrangement will easily roll out of the cup from the cup edge during impact, which leads to the larger ejecta masses of lateral arrangement. As shown in Figure 22, the H0 of the random packing is the largest, and the H0 of the vertical packing is the smallest in the two cups. In short, the cuboid cup has larger Sr and ϕp, which lead to the smaller ejecta mass and penetration depth of the cuboid cup compared to those of the cylindrical cup. In addition, the vertical arrangement of elongated particles is more regular and has a stronger ability to resist penetration than the lateral arrangement.

5. Conclusions

Three-dimensional DEM simulations and experiments of spheres impacting into elongated particles at a low speed are investigated in this study. By validating the numerical simulations with the experimental results, we demonstrate the feasibility of using the above code to understand the sphere impacting elongated particles. Close agreement between the DEM simulations and experimental results can be obtained in terms of ejecta masses and initial solid volume fraction. The effects of the particle length, the friction, and the configuration of the elongated particle bed on impact are discussed in this study.
The effect of the sphere and elongated particles of four particles lengths on penetration depth, ejecta mass, granular temperature, and contact force are studied. Then, the friction coefficients μp-p, μi-p, and μw-p ranging from 0 to 1 are discussed; the impactor rebounds when μp-p is larger than 0.7. As for the configuration of the elongated particle bed, three packing types and two different cups are compared, ejecta mass of particles and penetration depth of the impactor are studied. Based on the present studies, the following conclusions can be drawn:
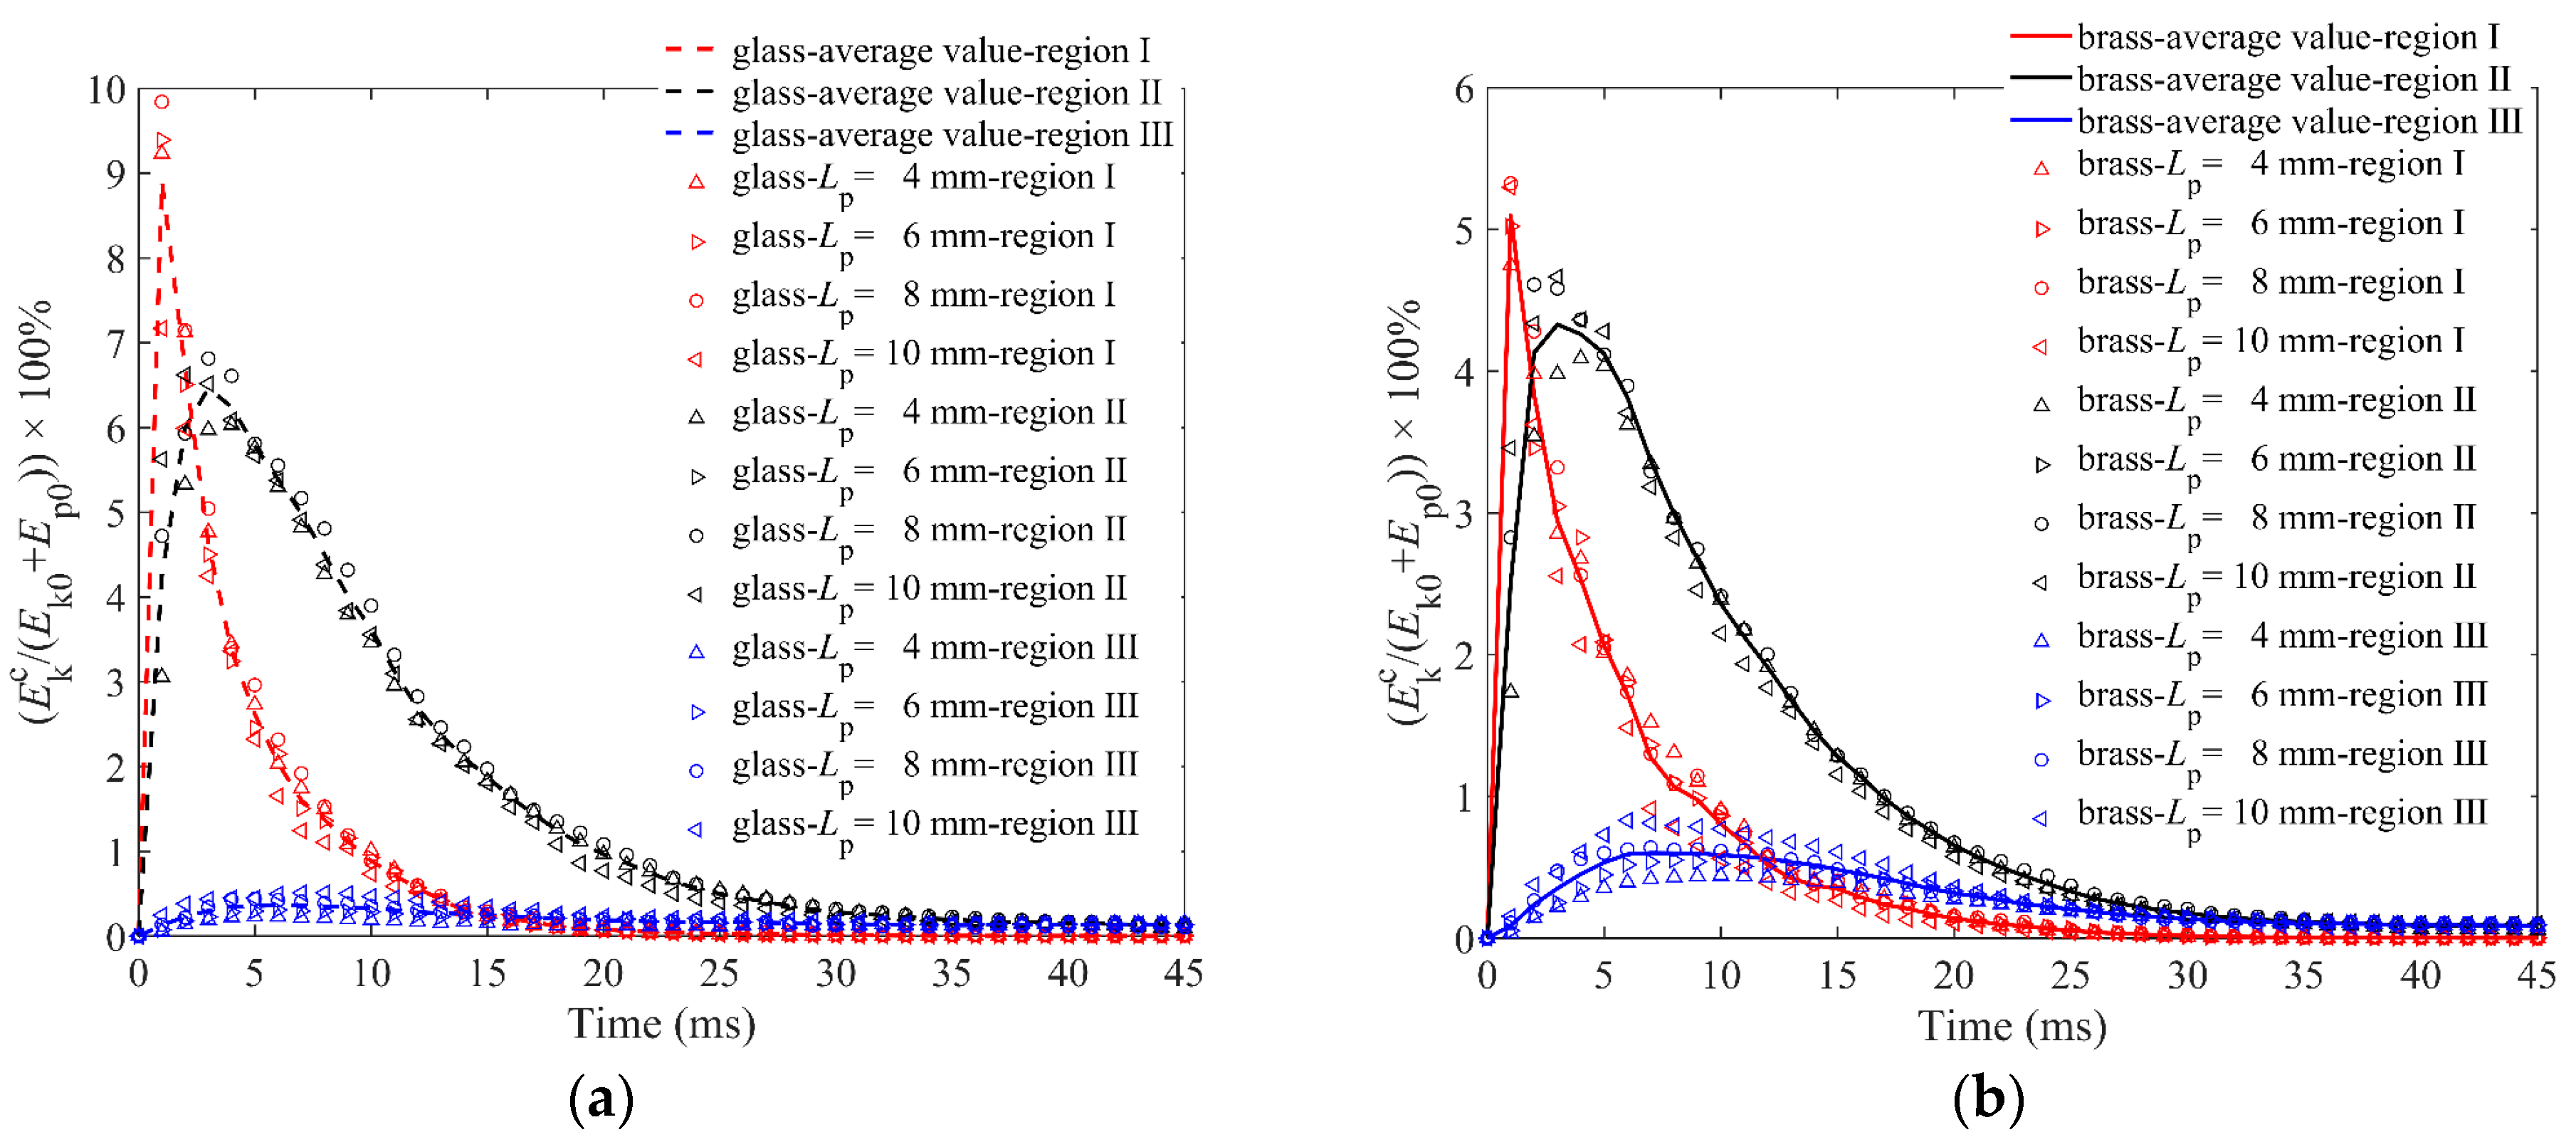
  • The effect of particle length. The ejecta mass of the spherical particle bed is obviously larger than that of the elongated particle bed. The granular bed of longer particles has a smaller penetration depth due to the spatial structure of elongated particles, although the solid volume fraction is smaller. In addition, the average contact force between particles is positively correlated to particle length. The average kinetic energy of the impactor obeys an exponential-like dissipation, and the particle length of the elongated particles has little effect on the energy allocation from the impactor to the ejected particles and particles in the cup.
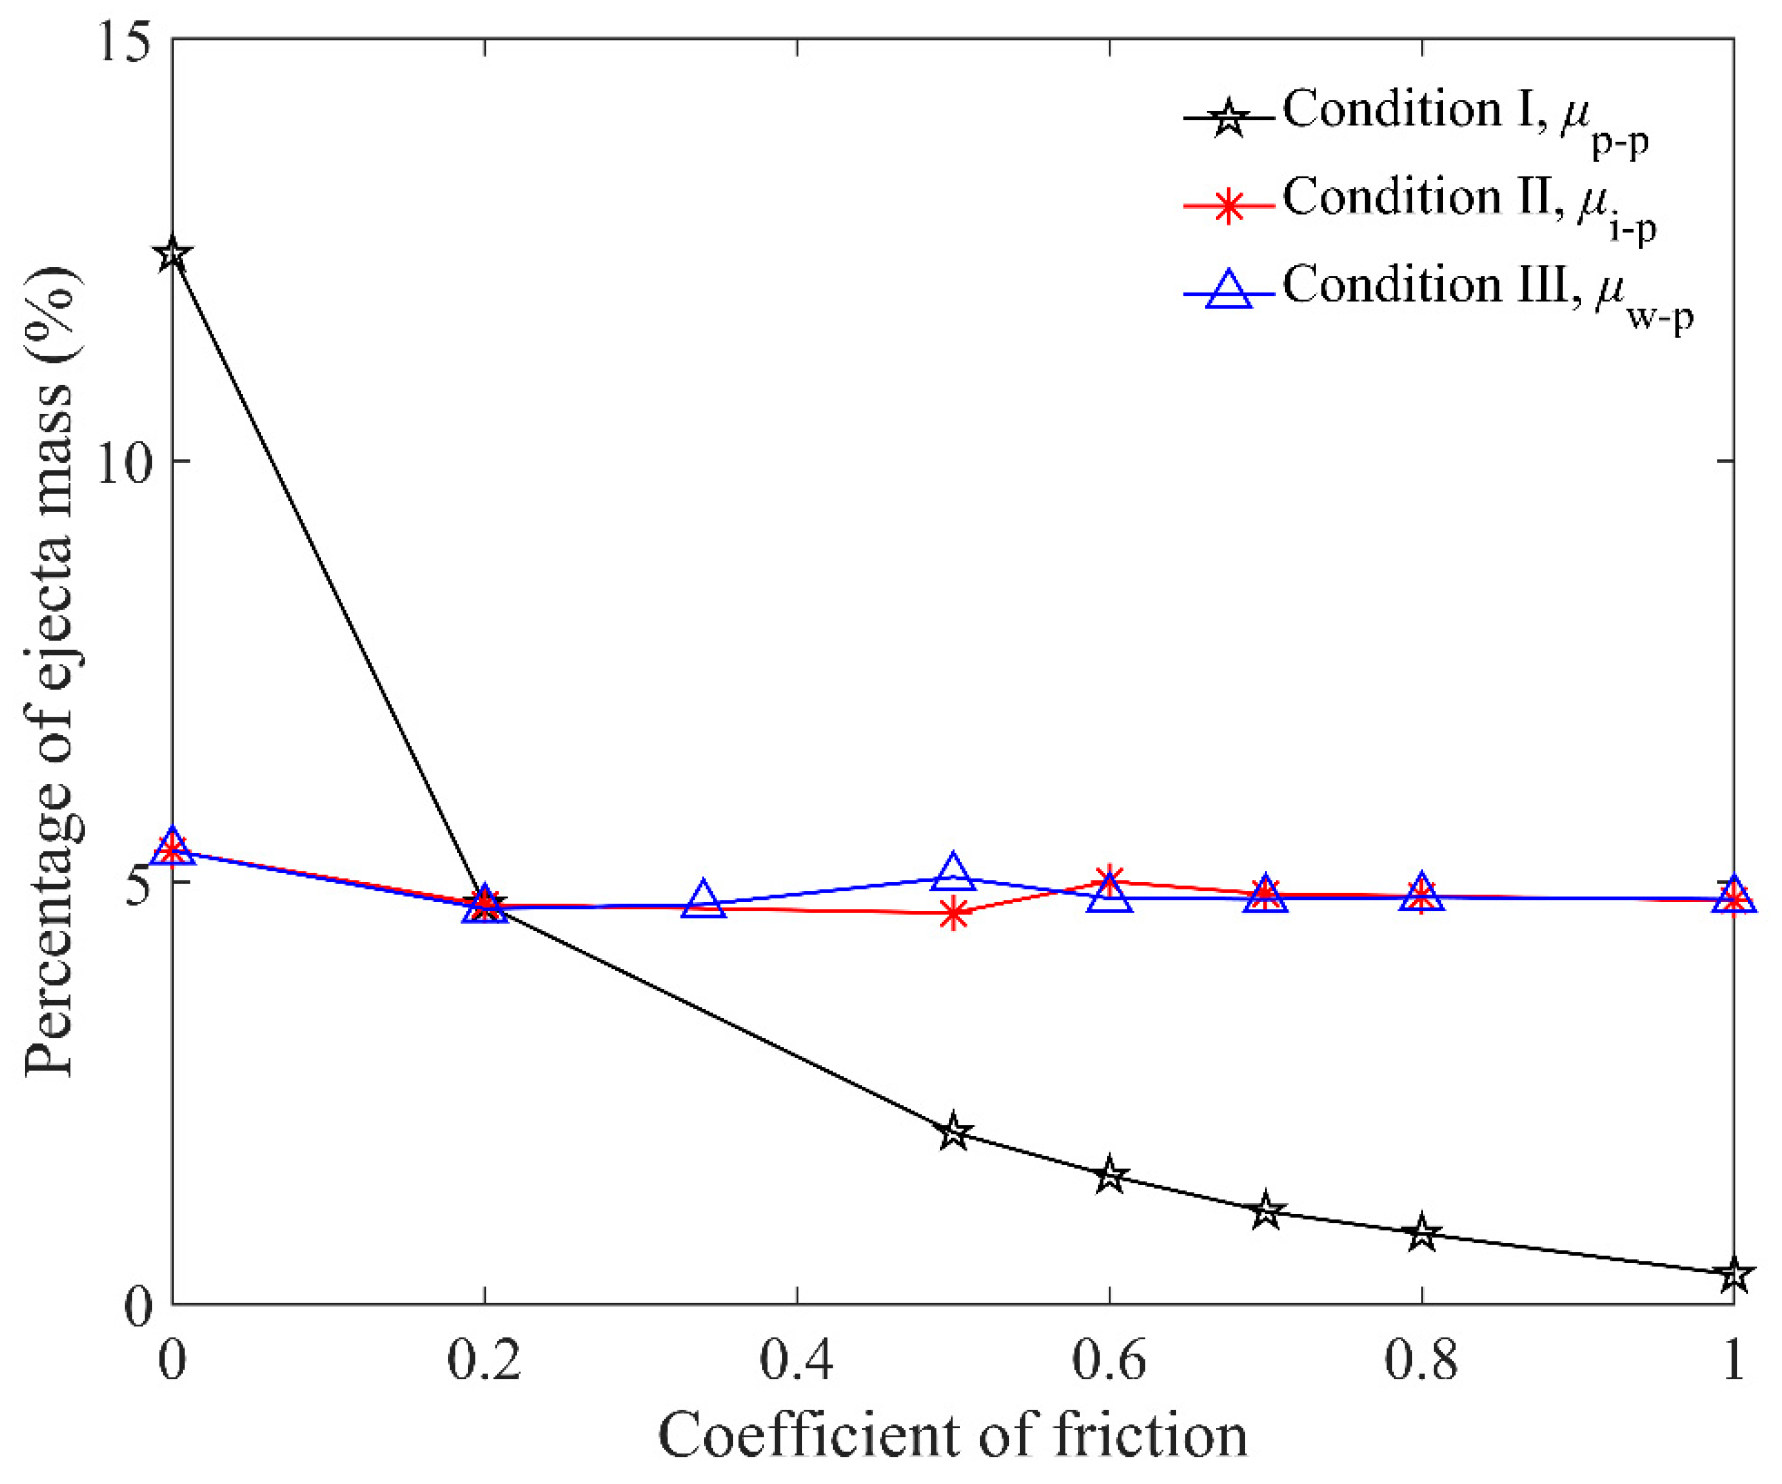
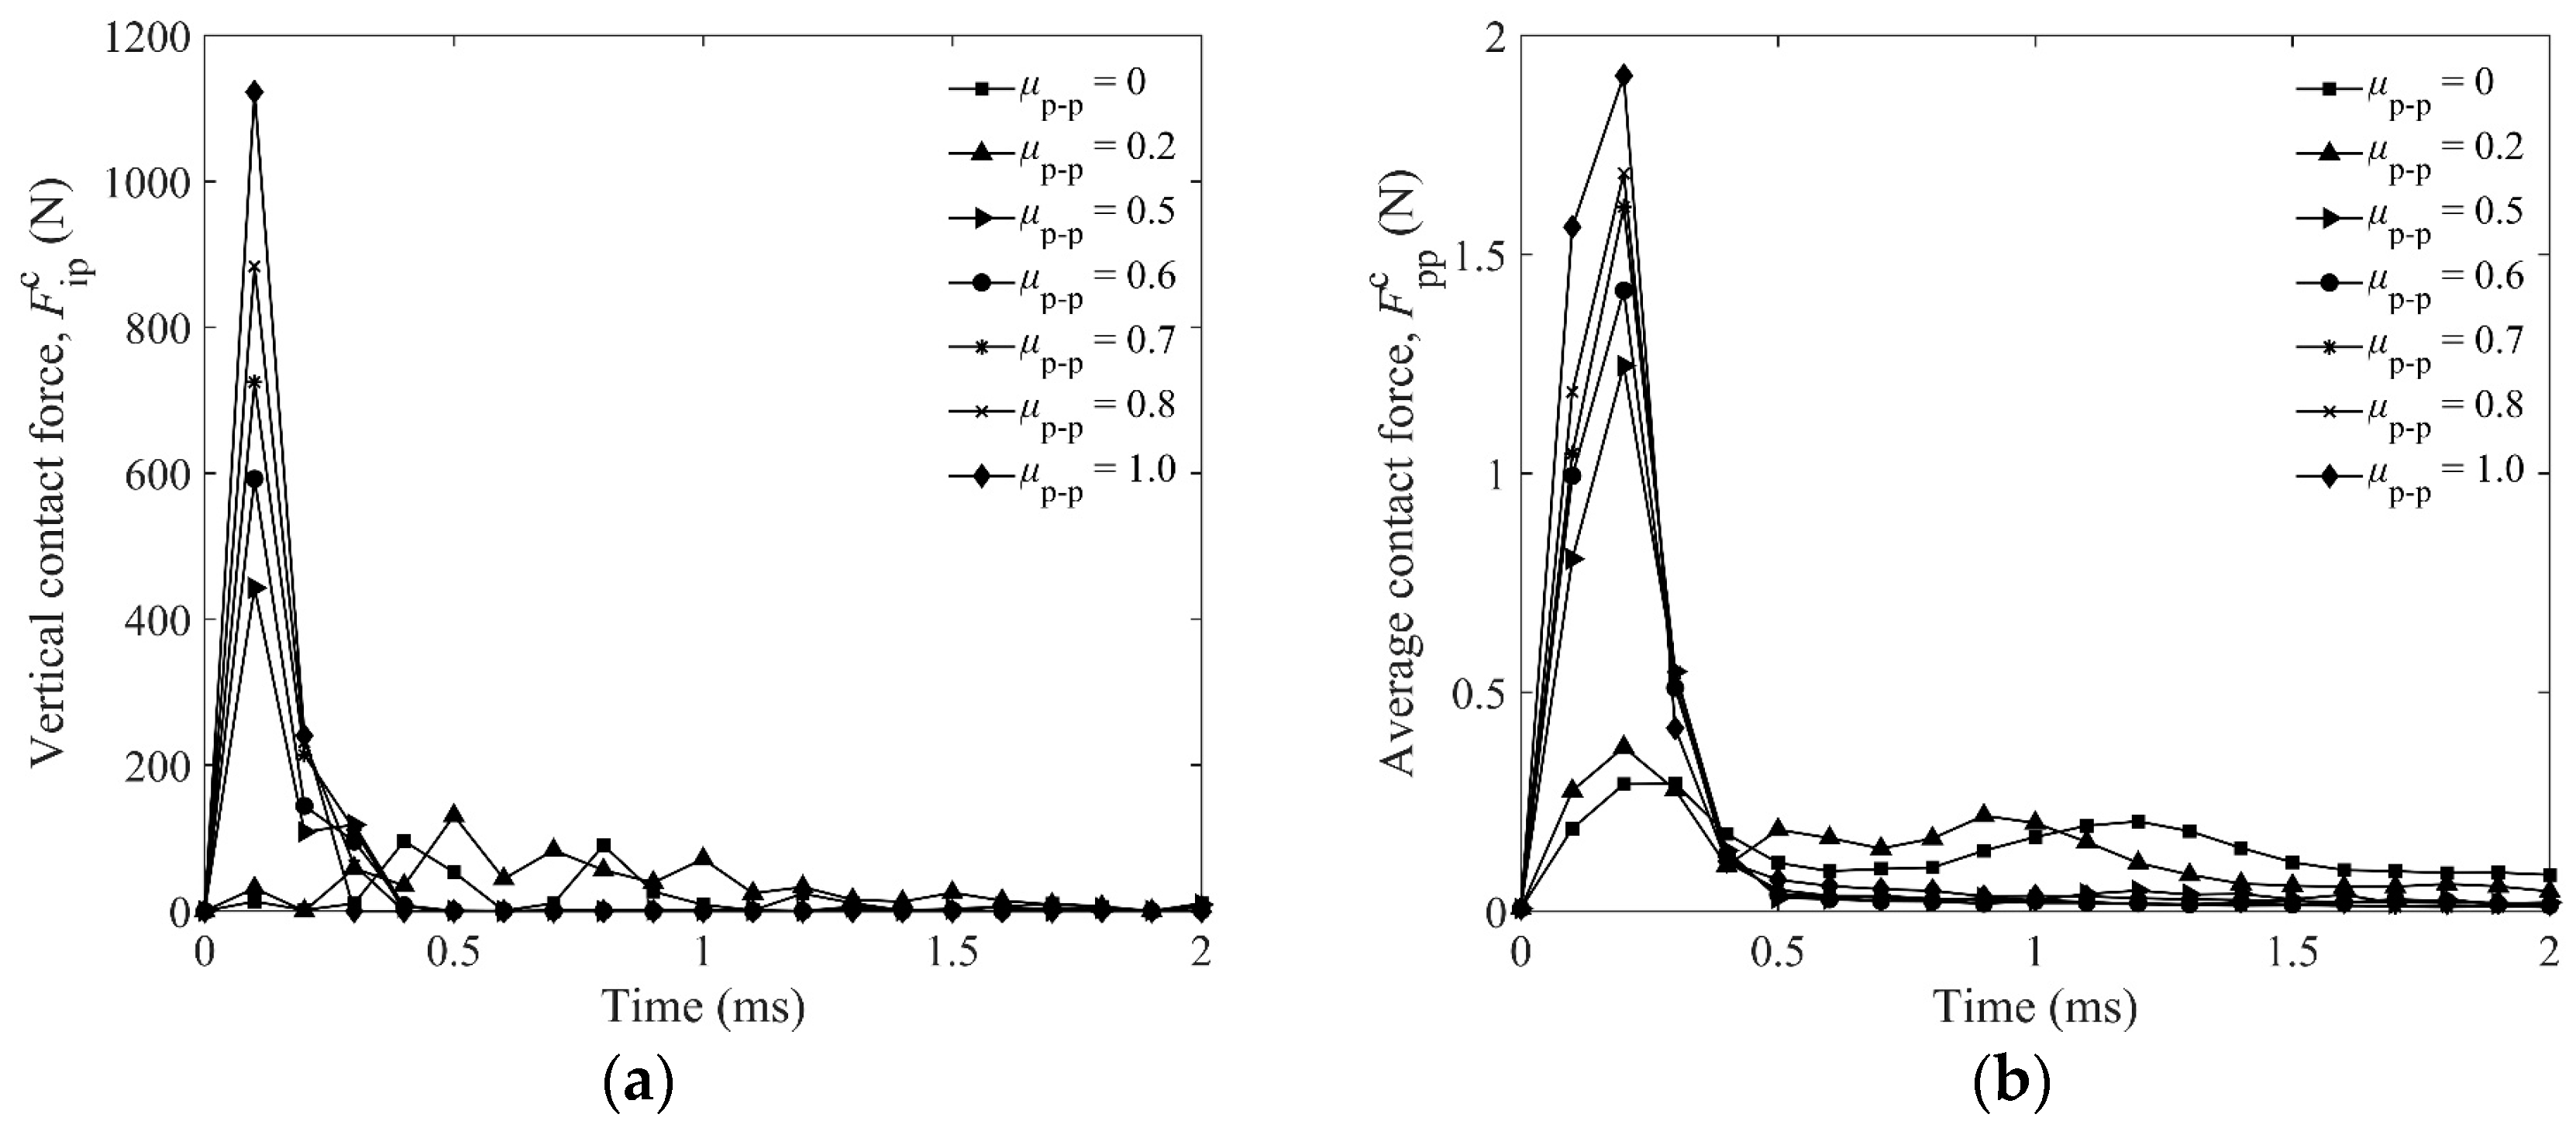
  • The effect of friction. The μp-p has a significant effect on the ejecta mass and penetration depth of the impactor, while μi-p and μw-p have a limited effect. The ejecta mass and penetration depth are negatively correlated to μp-p. The contact force between particles and particles or impactors are positively correlated to μp-p.
  • The effect of particle configuration. The cuboid cup can obtain a more dense and regular granular bed. The ejecta mass and penetration depth of vertical arrangement are the smallest. For the same arrangement of elongated particles, the penetration depth is negatively correlated to order parameters and solid volume fraction.

Author Contributions

Y.L.: conceptualization, methodology, resources, writing—review and editing, supervision, project administration, funding acquisition; P.L.: conceptualization, software, validation, formal analysis, investigation, data curation, writing—original draft, visualization. X.H.: writing—review and editing. Y.G.: conceptualization, methodology, software, writing—review and editing. J.S.C.: software. All authors have read and agreed to the published version of the manuscript.

Funding

The National Natural Science Foundation of China (grant numbers 31971803,11872333 and 12132015), the Fundamental Research Funds for the Central Universities (NO. 2021FZZX001-11) and the U.S. National Science Foundation (No. 2116140) are thanked for their financial support.

Institutional Review Board Statement

Not applicable.

Informed Consent Statement

Not applicable.

Data Availability Statement

No new data were created or analyzed in this study. Data sharing is not applicable to this article.

Conflicts of Interest

The authors declare no conflict of interest.

Nomenclature

Fiexternal forces of particle i (N)
Tiexternal torques of particle i (N·m)
mimass of particle i (g)
vitranslational velocity of particle i (m/s)
Iimoment of inertia of particle i (kg·m2)
ωirotational velocity of the particle i (rad/s)
δnoverlap in normal direction (mm)
Fnnormal contact force (N)
E*equivalent Young’s modulus
R*equivalent radius of two objects
Fnminnormal contact force when θ = 0° (N)
Fnmaxnormal contact force when θ = 90° (N)
llength of contact area along the major axis (mm)
bwidth of contact area (mm)
Fttangential contact force in the current time step (N)
Ft0tangential force vectors in the previous time step (N)
G*equivalent shear modulus
aeffective radius of contact (mm)
v c t dtincremental tangential displacement (mm)
F n d normal damping force (N)
F t d tangential damping force (N)
m*equivalent mass
vnnormal component of relative velocity (m/s)
vttangential component of relative velocity (m/s)
βcontact damping coefficient
Snnormal contact stiffness
Sttangential contact stiffness
Vvertical velocity of impactor (m/s)
gacceleration of gravity (N/kg)
m0total mass of particles in cup before impact (g)
m1total mass of particles in cup after impact (g)
Δmmass of ejected particles (g)
H0penetration depth of impactor (mm)
D0diameter of impactor(mm)
Lpparticle length (mm)
Ek0the initial kinetic energy of the impactor (J)
Ep0the initial potential energy of the impactor (J)
E k i kinetic energy of the impactor (J)
E k c kinetic energy of the particles in the cup (J)
E k e kinetic energy of the ejected particles (J)
Tpgranular temperature (m2/s2)
ϕpsolid volume fraction
F pp c average contact force between particles (N)
μp-pcoefficient of friction between target particles
μw-pcoefficient of friction between wall and particles
μi-pcoefficient of friction between impactor and particles
Tp,qgranular temperature of particles along q (q = x, y, z) direction (m2/s2)
F ip c vertical contact force between impactor and particles (N)
Oorientational parameter
Srthe order parameter

References

  1. Bötschi, S.; Rajagopalan, A.K.; Rombaut, I.; Morari, M.; Mazzotti, M. From needle-like toward equant particles: A controlled crystal shape engineering pathway. Comput. Chem. Eng. 2019, 131, 106581. [Google Scholar] [CrossRef]
  2. Aust, A.E.; Cook, P.M.; Dodson, R.F. Morphological and chemical mechanisms of elongated mineral particle toxicities. J. Toxicol. Environ. Health Part B 2011, 14, 40–75. [Google Scholar] [CrossRef] [PubMed] [Green Version]
  3. Doshi, N.; Mitragotri, S. Needle-shaped polymeric particles induce transient disruption of cell membranes. J. R. Soc. Interface 2010, 7, S403–S410. [Google Scholar] [CrossRef] [PubMed] [Green Version]
  4. Guidelli, E.J.; Ramos, A.P.; Zaniquelli, M.E.D.; Nicolucci, P.; Baffa, O. Synthesis and characterization of silver/alanine nanocomposites for radiation detection in medical applications: The influence of particle size on the detection properties. Nanoscale 2012, 4, 2884. [Google Scholar] [CrossRef] [PubMed]
  5. Khodadadian, A.; Noii, N.; Parvizi, M.; Abbaszadeh, M.; Wick, T.; Heitzinger, C. A Bayesian estimation method for variational phase-field fracture problems. Comput. Mech. 2020, 66, 827–849. [Google Scholar] [CrossRef]
  6. Noii, N.; Khodadadian, A.; Aldakheel, F. Probabilistic failure mechanisms via Monte Carlo simulations of complex microstructures. Comput. Methods Appl. Mech. Eng. 2022, 399, 115358. [Google Scholar] [CrossRef]
  7. Pop, N. A finite element solution for a three-dimensional quasistatic frictional contact problem. Rev Roum. Sci. Tech Ser. Mec Appliq Ed. L’Academie Roum. 1997, 42, 1–2. [Google Scholar]
  8. Scutaru, M.L.; Vlase, S.; Marin, M.; Modrea, A. New analytical method based on dynamic response of planar mechanical elastic systems. Bound. Value Probl. 2020, 2020, 104. [Google Scholar] [CrossRef]
  9. Cundall, P.A.; Strack, O.D.L. A discrete numerical model for granular assemblies. Géotechnique 1979, 29, 47–65. [Google Scholar] [CrossRef]
  10. Bester, C.S.; Cox, N.; Zheng, H.; Behringer, R.P. Dynamics of oblique impact in a quasi two-dimensional granular medium. Granul. Matter 2020, 22, 51. [Google Scholar] [CrossRef]
  11. Prieur, N.C.; Rolf, T.; Luther, R.; Wünnemann, K.; Xiao, Z.; Werner, S.C. The effect of target properties on transient crater scaling for simple craters: Target properties and simple craters. J. Geophys. Res. Planets 2017, 122, 1704–1726. [Google Scholar] [CrossRef]
  12. Seguin, A.; Bertho, Y.; Gondret, P.; Crassous, J. Sphere penetration by impact in a granular medium: A collisional process. EPL Europhys. Lett. 2009, 88, 44002. [Google Scholar] [CrossRef] [Green Version]
  13. Ye, X.; Wang, D.; Zheng, X. Effect of packing fraction on dynamic characteristics of granular materials under oblique impact. Powder Technol. 2018, 339, 211–222. [Google Scholar] [CrossRef]
  14. Escobar-Ortega, Y.Y.; Hidalgo-Caballero, S.; Marston, J.O.; Pacheco-Vázquez, F. The viscoelastic-like response of a repulsive granular medium during projectile impact and penetration. J. Non-Newton. Fluid Mech. 2020, 280, 104295. [Google Scholar] [CrossRef]
  15. Takada, S.; Hayakawa, H. Drag acting on an intruder in a three-dimensional granular environment. Granul. Matter 2020, 22, 6. [Google Scholar] [CrossRef] [Green Version]
  16. Miyai, S.; Kobayakawa, M.; Tsuji, T.; Tanaka, T. Influence of particle size on vertical plate penetration into dense cohesionless granular materials (large-scale DEM simulation using real particle size). Granul. Matter 2019, 21, 105. [Google Scholar] [CrossRef] [Green Version]
  17. Li, Y.; Dove, A.; Curtis, J.S.; Colwell, J.E. 3D DEM simulations and experiments exploring low-velocity projectile impacts into a granular bed. Powder Technol. 2016, 288, 303–314. [Google Scholar] [CrossRef]
  18. Huang, K.; Delfin, D.H.; Rech, F.; Dichtl, V.; Hidalgo, R.C. The role of initial speed in projectile impacts into light granular media. Sci. Rep. 2020, 10, 3207. [Google Scholar] [CrossRef] [Green Version]
  19. Holmen, J.K.; Olovsson, L.; Børvik, T. Discrete modeling of low-velocity penetration in sand. Comput. Geotech. 2017, 86, 21–32. [Google Scholar] [CrossRef]
  20. Güttler, C.; Hirata, N.; Nakamura, A.M. Cratering experiments on the self-armoring of coarse-grained granular targets. Icarus 2012, 220, 1040–1049. [Google Scholar] [CrossRef] [Green Version]
  21. Davison, T.M.; Collins, G.S.; Elbeshausen, D.; Wünnemann, K.; Kearsley, A. Numerical modeling of oblique hypervelocity impacts on strong ductile targets: Oblique hypervelocity impacts on ductile targets. Meteorit. Planet. Sci. 2011, 46, 1510–1524. [Google Scholar] [CrossRef] [Green Version]
  22. Horabik, J.; Sochan, A.; Beczek, M.; Mazur, R.; Ryżak, M.; Parafiniuk, P.; Kobyłka, R.; Bieganowski, A. Discrete Element Method simulations and experimental study of interactions in 3D granular bedding during low-velocity impact. Powder Technol. 2018, 340, 52–67. [Google Scholar] [CrossRef]
  23. Kodam, M.; Bharadwaj, R.; Curtis, J.; Hancock, B.; Wassgren, C. Cylindrical object contact detection for use in Discrete Element Method simulations. Part I—Contact detection algorithms. Chem. Eng. Sci. 2010, 65, 5852–5862. [Google Scholar] [CrossRef]
  24. Guo, Y.; Wassgren, C.; Curtis, J.S.; Xu, D. A bonded sphero-cylinder model for the discrete element simulation of elasto-plastic fibers. Chem. Eng. Sci. 2018, 175, 118–129. [Google Scholar] [CrossRef]
  25. Kidokoro, T.; Arai, R.; Saeki, M. Investigation of dynamics simulation of granular particles using sphero-cylinder model. Granul. Matter 2015, 17, 743–751. [Google Scholar] [CrossRef]
  26. Xie, C.; Song, T.; Zhao, Y. Discrete element modeling and simulation of non-spherical particles using polyhedrons and super-ellipsoids. Powder Technol. 2020, 368, 253–267. [Google Scholar] [CrossRef]
  27. Azéma, E.; Radjai, F.; Dubois, F. Packings of irregular polyhedral particles: Strength, structure, and effects of angularity. Phys. Rev. E 2013, 87, 062203. [Google Scholar] [CrossRef] [Green Version]
  28. Zhao, Y.; Xu, L.; Umbanhowar, P.B.; Lueptow, R.M. Discrete element simulation of cylindrical particles using super-ellipsoids. Particuology 2019, 46, 55–66. [Google Scholar] [CrossRef]
  29. You, Y.; Zhao, Y. Discrete element modelling of ellipsoidal particles using super-ellipsoids and multi-spheres: A comparative study. Powder Technol. 2018, 331, 179–191. [Google Scholar] [CrossRef]
  30. Liu, Z.; Ma, H.; Zhao, Y. Comparative study of discrete element modeling of tablets using multi-spheres, Multi-Super-Ellipsoids, and Polyhedrons. Powder Technol. 2021, 390, 34–49. [Google Scholar] [CrossRef]
  31. Liu, Z.; Zhao, Y. Multi-super-ellipsoid model for non-spherical particles in DEM simulation. Powder Technol. 2020, 361, 190–202. [Google Scholar] [CrossRef]
  32. Feng, Y.T.; Han, K.; Owen, D.R.J. Energy-conserving contact interaction models for arbitrarily shaped Discrete Elements. Comput. Methods Appl. Mech. Eng. 2012, 205–208, 169–177. [Google Scholar] [CrossRef]
  33. Tangri, H.; Guo, Y.; Curtis, J.S. Packing of cylindrical particles: DEM simulations and experimental measurements. Powder Technol. 2017, 317, 72–82. [Google Scholar] [CrossRef]
  34. Tangri, H.; Guo, Y.; Curtis, J.S. Hopper discharge of elongated particles of varying aspect ratio: Experiments and DEM simulations. Chem. Eng. Sci. X 2019, 4, 100040. [Google Scholar] [CrossRef]
  35. Wang, S.; Ji, S. Discrete element analysis of buffering capacity of non-spherical granular materials based on super-quadric method. Acta Phys. Sin. 2018, 67, 182–193. (In Chinese) [Google Scholar]
  36. Guo, Y.; Liu, Q.; Li, Y.; Li, Z.; Jin, H.; Wassgren, C.; Curtis, J.S. Discrete element method models of elastic and elastoplastic fiber assemblies. AIChE J. 2021, 67, e17296. [Google Scholar] [CrossRef]
  37. Shackelford, J.F.; Alexander, W. CRC materials science and engineering handbook (Third Edition). Chem. Eng. Sci. 1999, 11, 41. [Google Scholar] [CrossRef]
  38. Hao, J.; Li, Y.; Liu, Y.; Curtis, J.S.; Guo, Y. Jamming in granular shear flows of frictional, polydisperse cylindrical particles. Adv. Powder Technol. 2021, 32, 3746–3759. [Google Scholar] [CrossRef]
  39. Qian, Q.; An, X.; Zhao, H.; Dong, K.; Wu, Y.; Fu, H.; Zhang, H.; Yang, X. Particle scale study on the crystallization of mono-sized cylindrical particles subject to vibration. Powder Technol. 2019, 352, 470–477. [Google Scholar] [CrossRef]
Figure 1. Schematic drawing of the experimental apparatus. (The arrow represents the velocity direction of the impactor.)
Materials 16 01664 g001
Figure 2. Schematic diagram of numerical setup. (The arrow represents the velocity direction of the impactor.)
Materials 16 01664 g002
Figure 3. (a) Comparison of the penetration depth of glass impactor for five different time steps in DEM simulations. (b) Comparison of the penetration depth of glass impactor for five different cups in DEM simulations. (The length of elongated particles is 10 mm, the velocity of glass impactor is 3.60 m/s, and Dc and Hc are shown in Table 2).
Materials 16 01664 g003
Figure 4. (a) Influence of particle length on ejecta masses for both glass and brass impactors in DEM simulations. (b) Comparison of ejecta mass as a function of particle length between experiments and simulations. (The length of 2 mm represents the data of 2 mm spheres here and all the simulation parameters are from Table 2).
Materials 16 01664 g004
Figure 5. Kinetic energy E k e of ejected particles as a function of time for granular bed of spherical particles and elongated particles of four particle lengths in DEM simulations: (a) is for the glass impactor, and (b) is for the brass impactor.
Materials 16 01664 g005
Figure 6. (a) H0/D0 versus time for granular bed of spheres and elongated particles of four lengths. (b) The fitting curves of the H0/D0 and particle length Lp for glass and brass impactors. H0 and D0 represent the penetration depth and diameter of the impactor, respectively.
Materials 16 01664 g006
Figure 7. Kinetic energy of impactor E k i as a function of time for granular bed of spherical particles and elongated particles of four lengths: (a) is for the glass impactor, and (b) is for the brass impactor.
Materials 16 01664 g007
Figure 8. Average contact force of particles F pp c as a function of time for 2 mm sphere and Lp = 4 mm, 6 mm, 8 mm, 10 mm elongated particles for DEM simulations: (a) is for the glass impactor, and (b) is for the brass impactor.
Materials 16 01664 g008
Figure 9. Diagram of sub-region division for granular bed. Region I: 0 < R1 < 2/7Rc; region II: 2/7Rc < R2 < 5/7Rc; and region III: 5/7Rc < R3 < Rc. (The particles count in one region if their mass centers fall in this region; Rc is the radius of the cup).
Materials 16 01664 g009
Figure 10. (a) Comparison of solid volume fraction ϕp as a function of particle length Lp between experiments and simulations for both glass and brass impactors. (b) Initial solid volume fraction ϕp of the whole granular bed or three regions of granular bed as a function of particle length Lp before impact. The particle length of 2 mm represents the data of 2 mm spheres here.
Materials 16 01664 g010
Figure 11. Granular temperature Tp of particles in three regions versus time for granular bed with Lp = 4 mm, 6 mm, 8 mm, 10 mm elongated particles: (a) is for the glass impactor, and (b) is for the brass impactor.
Materials 16 01664 g011
Figure 12. Kinetic energy of particles in the cup E k c in three regions versus time for granular bed with Lp = 4 mm, 6 mm, 8 mm, 10 mm elongated particles: (a) is for the glass impactor, and (b) is for the brass impactor.
Materials 16 01664 g012
Figure 13. Relationship between percentage of ejecta mass and friction coefficient μp-p, μi-p, and μw-p for Lp = 6 mm elongated particles. Condition I: μi-p = 0.2, μw-p = 0.34 and various μp-ps; condition II: μp-p = 0.2, μw-p = 0.34 and various μi-ps; condition III: μp-p = 0.2, μi-p = 0.2 and various μw-ps.
Materials 16 01664 g013
Figure 14. Time evolution of the non-dimensional penetration depth H0/D0 of impacting into the granular bed of Lp = 6 mm particles: (a) condition I, (b) condition II, and (c) condition III. H0 and D0 represent the penetration depth and diameter of impactor, respectively. Condition I: μi-p = 0.2, μw-p = 0.34 and various μp-ps; condition II: μp-p = 0.2, μw-p = 0.34 and various μi-ps; condition III: μp-p = 0.2, μi-p = 0.2 and various μw-ps. (The dotted lines are used to clearly mark the position of the impactor at different times.)
Materials 16 01664 g014
Figure 15. Time evolution of vertical velocity of impactor with sphere impacting into the granular bed of Lp = 6 mm elongated particles: (a) condition I and (b) condition II and III. Condition I: μi-p = 0.2, μw-p = 0.34 and various μp-ps; condition II: μp-p = 0.2, μw-p = 0.34 and various μi-ps; condition III: μp-p = 0.2, μi-p = 0.2 and various μw-ps. (The dotted lines are used to clearly mark the velocity of the impactor at different times).
Materials 16 01664 g015
Figure 16. Velocity profiles of elongated particles (Lp = 6 mm) impacted by brass impactor. (Lp = 6 mm, μp-p = 0.8, arrow represents velocity of impactor, whose color remains unchanged.)
Materials 16 01664 g016
Figure 17. (a) F ip c as a function of time, F ip c is the vertical contact force between impactor and particles; and (b) F pp c as a function of time, F pp c is the average contact force between all particles.
Materials 16 01664 g017
Figure 18. Diagram of regular configuration of elongated particles (Lp = 10 mm): (a,b) are lateral arrangement and vertical arrangement in the cylindrical cup; (c,d) are the lateral arrangement and vertical arrangement in the cuboid cup.
Materials 16 01664 g018
Figure 19. Comparison between solid volume fractions for different packing types (type 1—lateral arrangement, type 2—vertical arrangement, and type 3—random arrangement). The length of particles in the cup is 10 mm.
Materials 16 01664 g019
Figure 20. The order parameters and orientational parameters of three packings in cylindrical cup and cuboid cup: (a) is the order parameters for three packing types; (b) is the orientational parameters for three packing types (type 1—lateral arrangement, type 2—vertical arrangement, and type 3—random arrangement). The length of particles in the cup is Lp = 10 mm.
Materials 16 01664 g020
Figure 21. Comparison between ejecta masses for three packing types in cylindrical cup and cuboid cup. The length of particles in the cup is AR = 5.
Materials 16 01664 g021
Figure 22. Comparison between H0/D0 for three packing types in cylindrical cup and cuboid cup. The length of particles in the cup is AR = 5; H0 and D0 represent the penetration depth of impactor and diameter of impactor, respectively.
Materials 16 01664 g022
Table 1. Contact force models used in the DEM simulations.
ScenariosModels
Group IMaterials 16 01664 i001 F n = 4 3 E * R * 1 2 δ n 3 2 (3)
in which δn is the overlap in normal direction, E* is equivalent Young’s modulus, and R* is equivalent radius of two objects in contact, which are defined as 1 E * = 1 ν 1 2 E 1 + 1 ν 2 2 E 2 and 1 R * = 1 R 1 + 1 R 2 , respectively, where E1 and E2, R1 and R2, ν1 and ν2 are the Young’s moduli, the radii, and the Poisson’s ratios of two contacting particles, respectively.
Group IIMaterials 16 01664 i002 F n = 8 R * 27 α 3 2 E * δ n 3 2 (4)
in which α is determined by the shape of contact area and determined to be 0.974 here.
Group IIIMaterials 16 01664 i003 F n = { F n max 10 ( F n max 2 F n min ) π θ ,       0 < θ < π 10 2 F n min 5 F n min 2 π ( θ 0.1 π ) ,       π 10 θ < π 2 (5)
in which θ is the angle between the two major axes of particles. F n min = 4 2 3 κ R * α 3 2 E * δ n 3 2 , when θ is equal to zero. F n max is the same as Equation (6).
Group IVMaterials 16 01664 i004 F n = κ π l 1.8864 + ln l 2 b E * δ n (6)
in which k is a constant determined as 2.5, l is the length of contact area along the major axis, b is the width of contact area, b = 2 R * δ n .
Tangential force model F t = F t 0 + 8 G * a · v c t · d t (7)
where Ft0 and Ft are the tangential force vectors in the previous time step and the current time step, respectively. G* is governed by 1 G * = 2 ν 1 G 1 + 2 ν 2 G 2 , in which G1 and G2 are the shear moduli of the two objects in contact, ν1 and ν2 are the corresponding Poisson’s ratios. a is the effective radius of contact, a = R * δ n , and v c t dt represents the incremental tangential displacement in the present time step.
Note: The equations are summarized according to the proposed models [36].
Table 2. Parameters used in the experiments and DEM simulations.
ParametersSteel Objective ParticlesImpactorGranular Cup
diameter (mm)Dp = 2.00Dgls = 19.71/Dbrs = 19.01Dc = 75.60
height (mm)//Hc = 46.10
length (mm)Lp = 4, 6, 8 *, 10 *//
Young’s modulus (GPa)
Poisson’s ratio
Ep = 182.00Egls = 71.70/Ebrs = 117.00Ec = 70.00
νp = 0.30νgls = 0.24/νbrs = 0.34νc = 0.35
density (kg/m3)ρp = 8000.45ρgls = 2478.36/ρbrs = 8700.20ρc = 2700.30
coefficient of frictionμp-p = 0.20/0 #μi-p = 0.20/0 #μw-p = 0.34/0 #
coefficient of restitutionep-p = 0.95ei-p = 0.88 (gls)/0.65(brs)ew-p = 0. 69
time step (s)t = 2.30 × 10⁻⁷
gravity (N/kg)g = 9.81
impact velocity (m/s)V0 = 3.60
Note: Values in bold font are the parameters used in base cases for simulations in this paper. The lengths marked with * are considered in DEM simulations only. The coefficients of friction marked with # are only used as the initial values in Section 4.2.
Disclaimer/Publisher’s Note: The statements, opinions and data contained in all publications are solely those of the individual author(s) and contributor(s) and not of MDPI and/or the editor(s). MDPI and/or the editor(s) disclaim responsibility for any injury to people or property resulting from any ideas, methods, instructions or products referred to in the content.

