
The Effect of the Energy Release Rate on the Local Damage Evolution in TRIP Steel Composite Reinforced with Zirconia Particles
 ,
,  , , and
Abstract
:1. Introduction
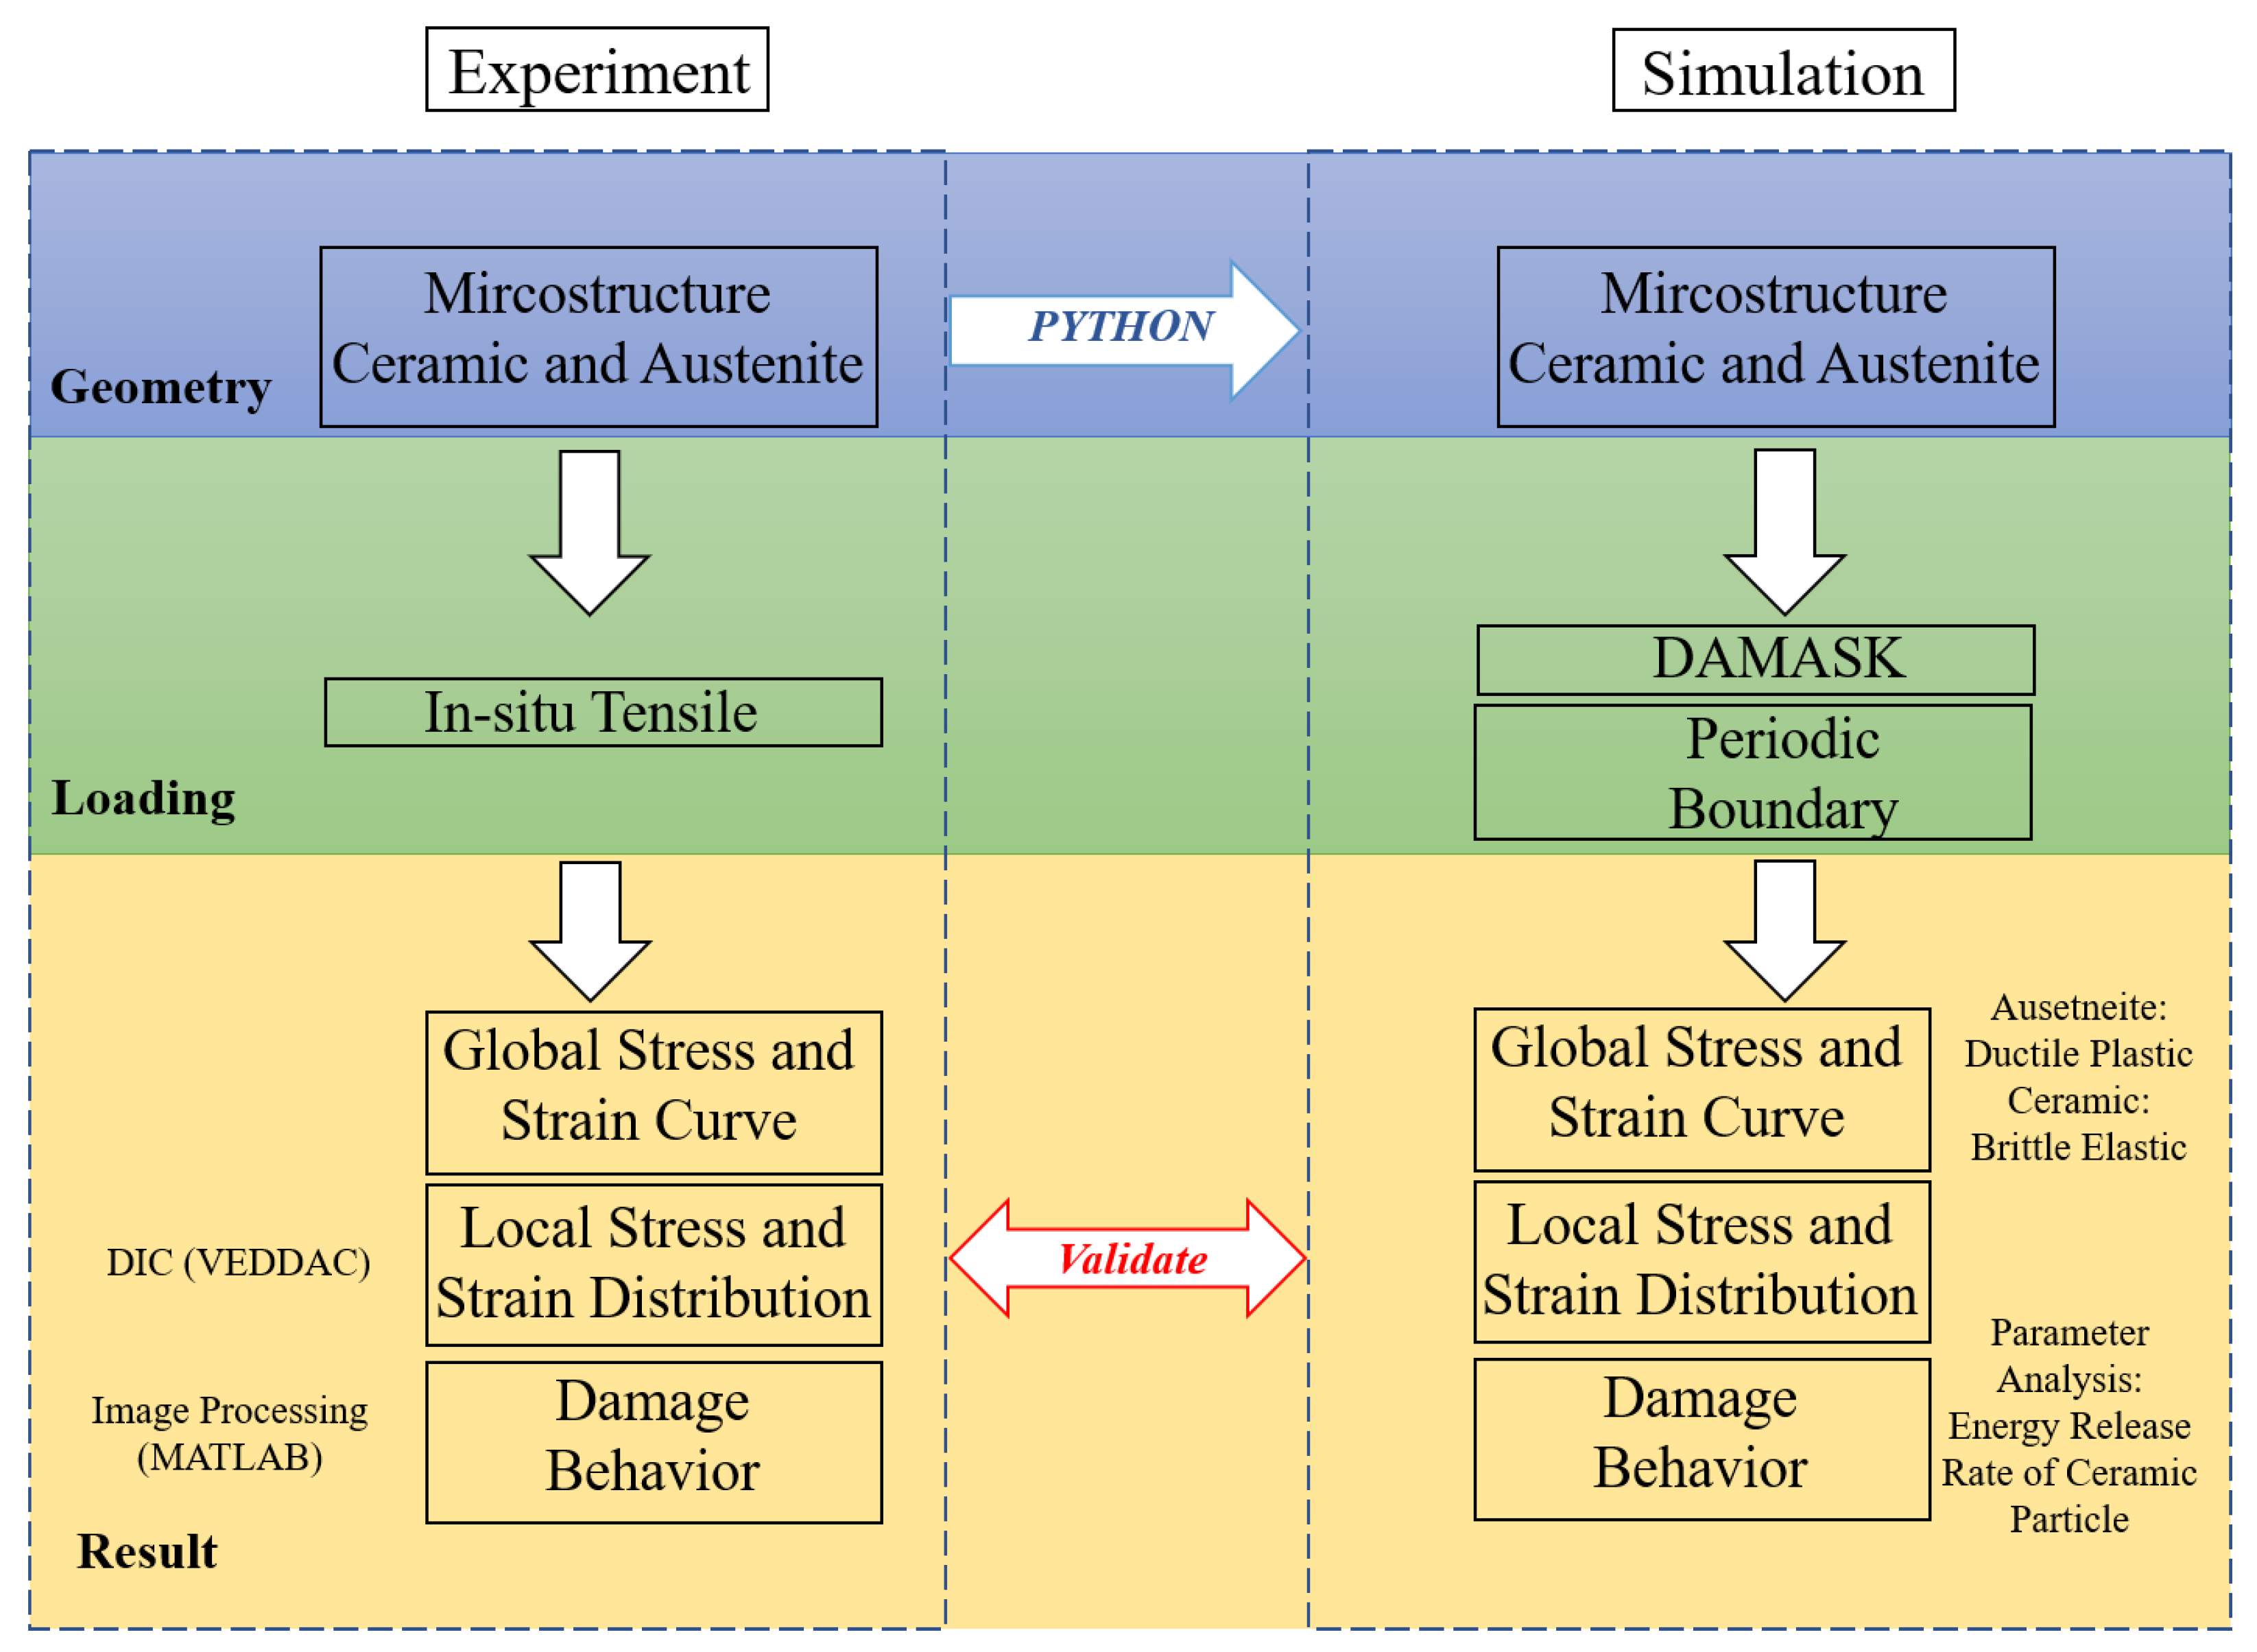
2. Methodology
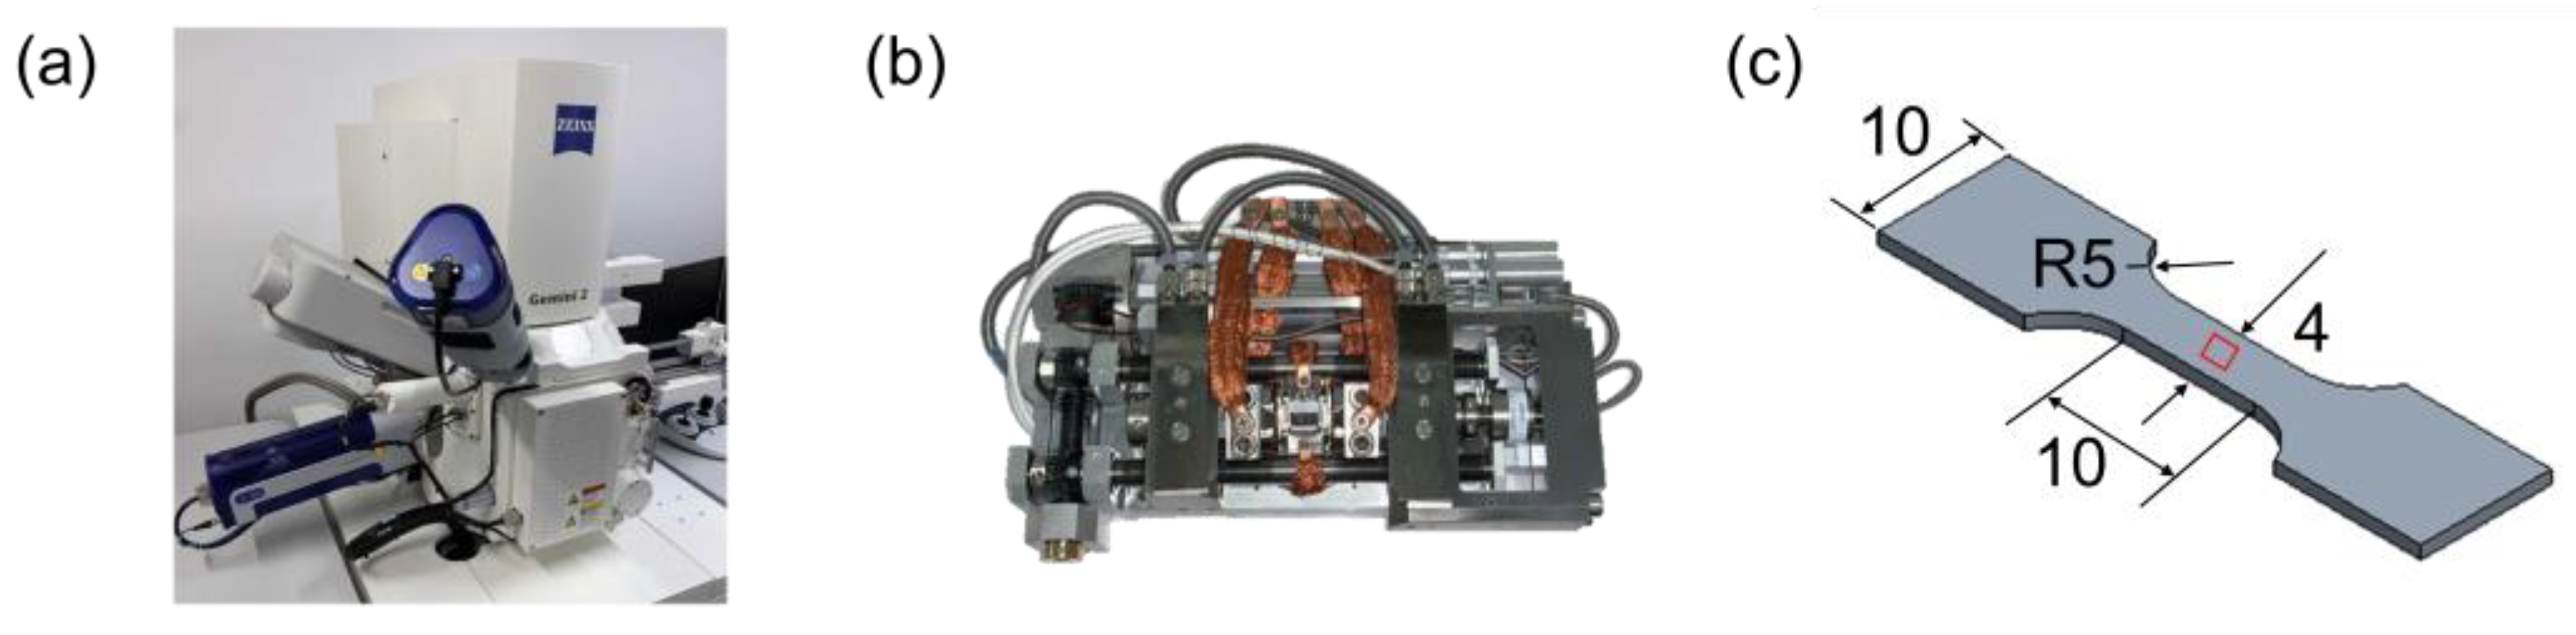
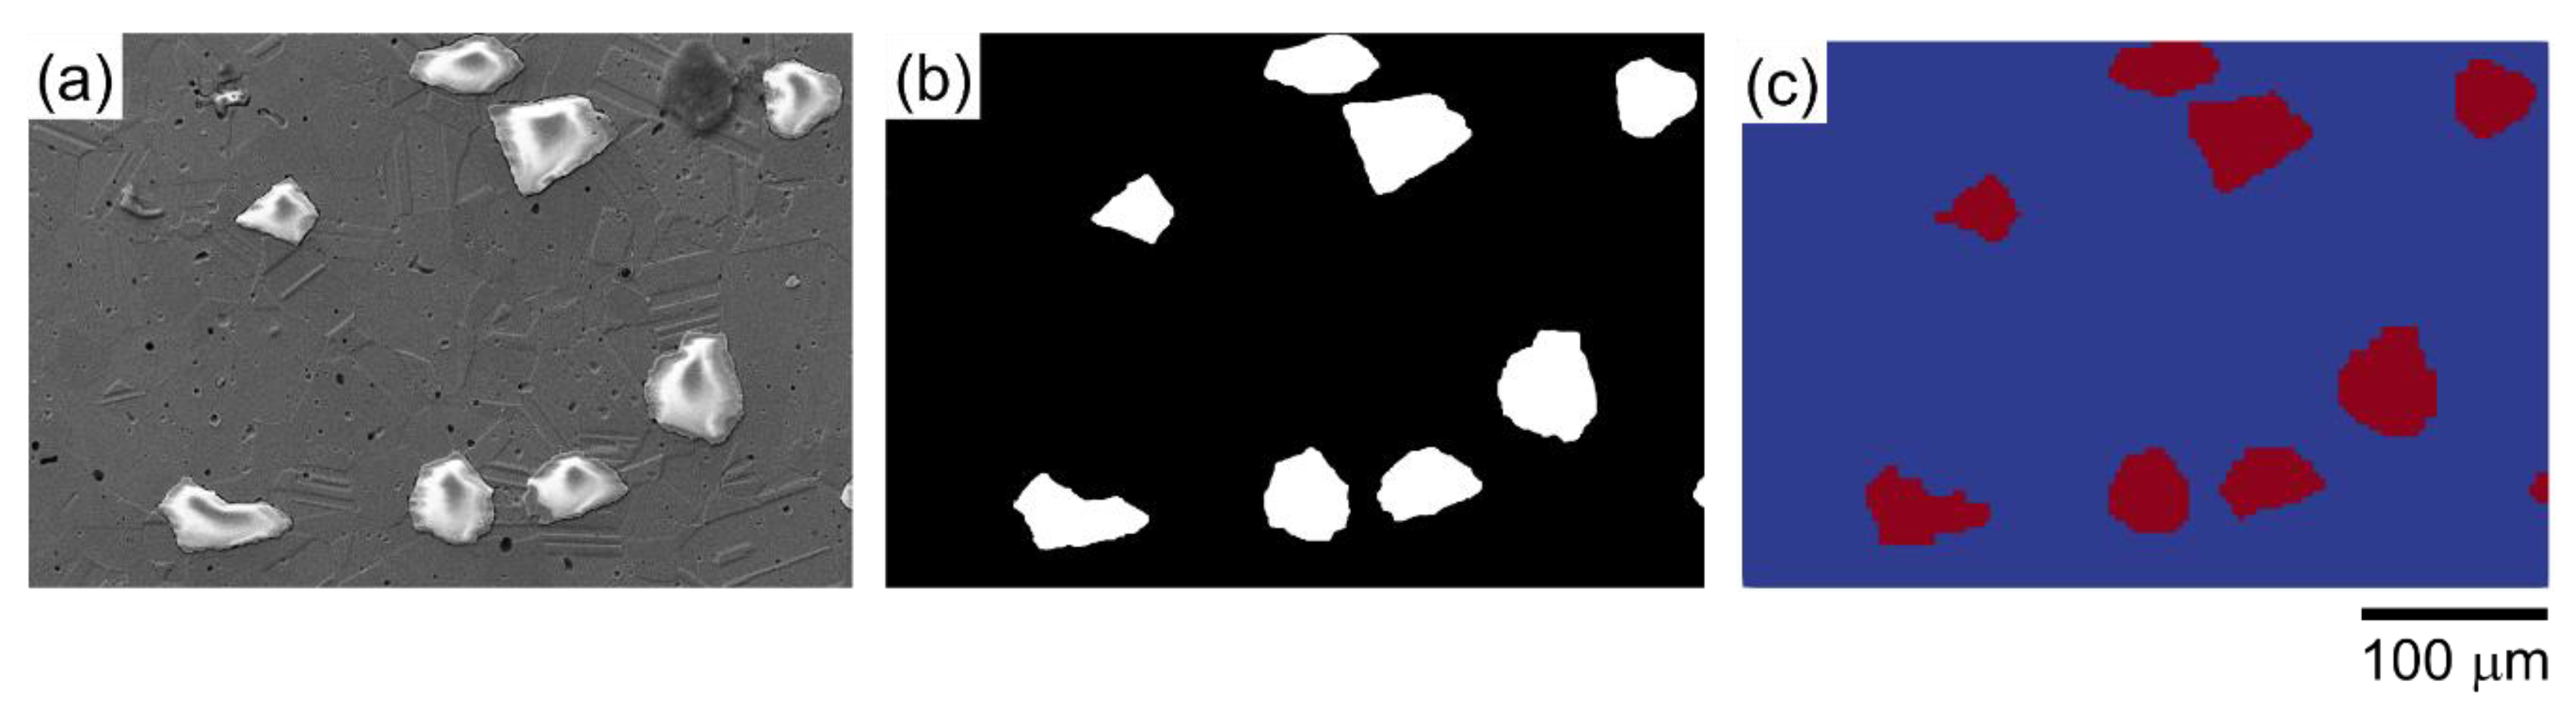
2.1. Experimentation
2.2. Simulation Method
2.2.1. Boundary Condition with DAMASK Simulation
2.2.2. Dislocation-Based Model and Damage Criteria for Crystal Simulation
3. Results
3.1. Global Behavior
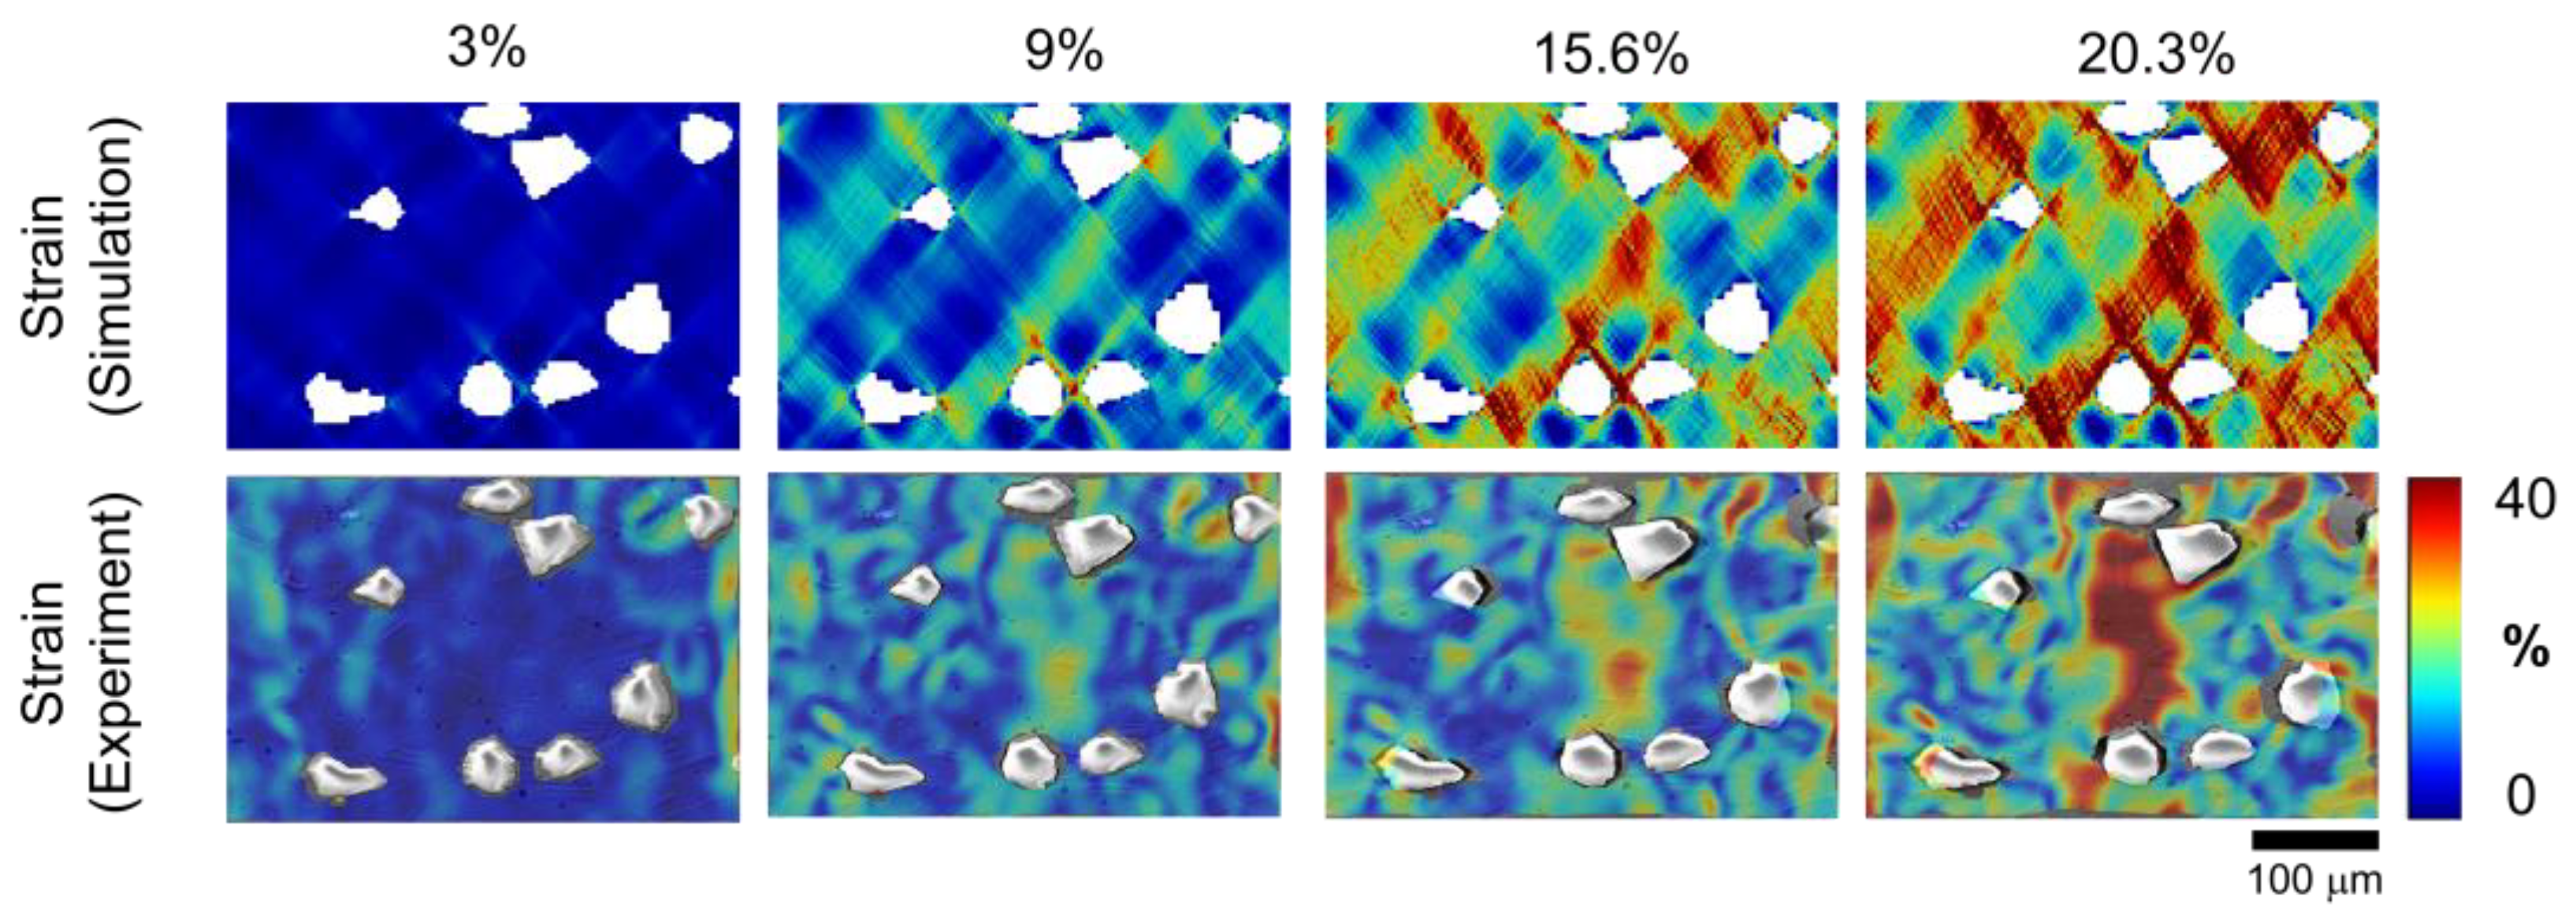
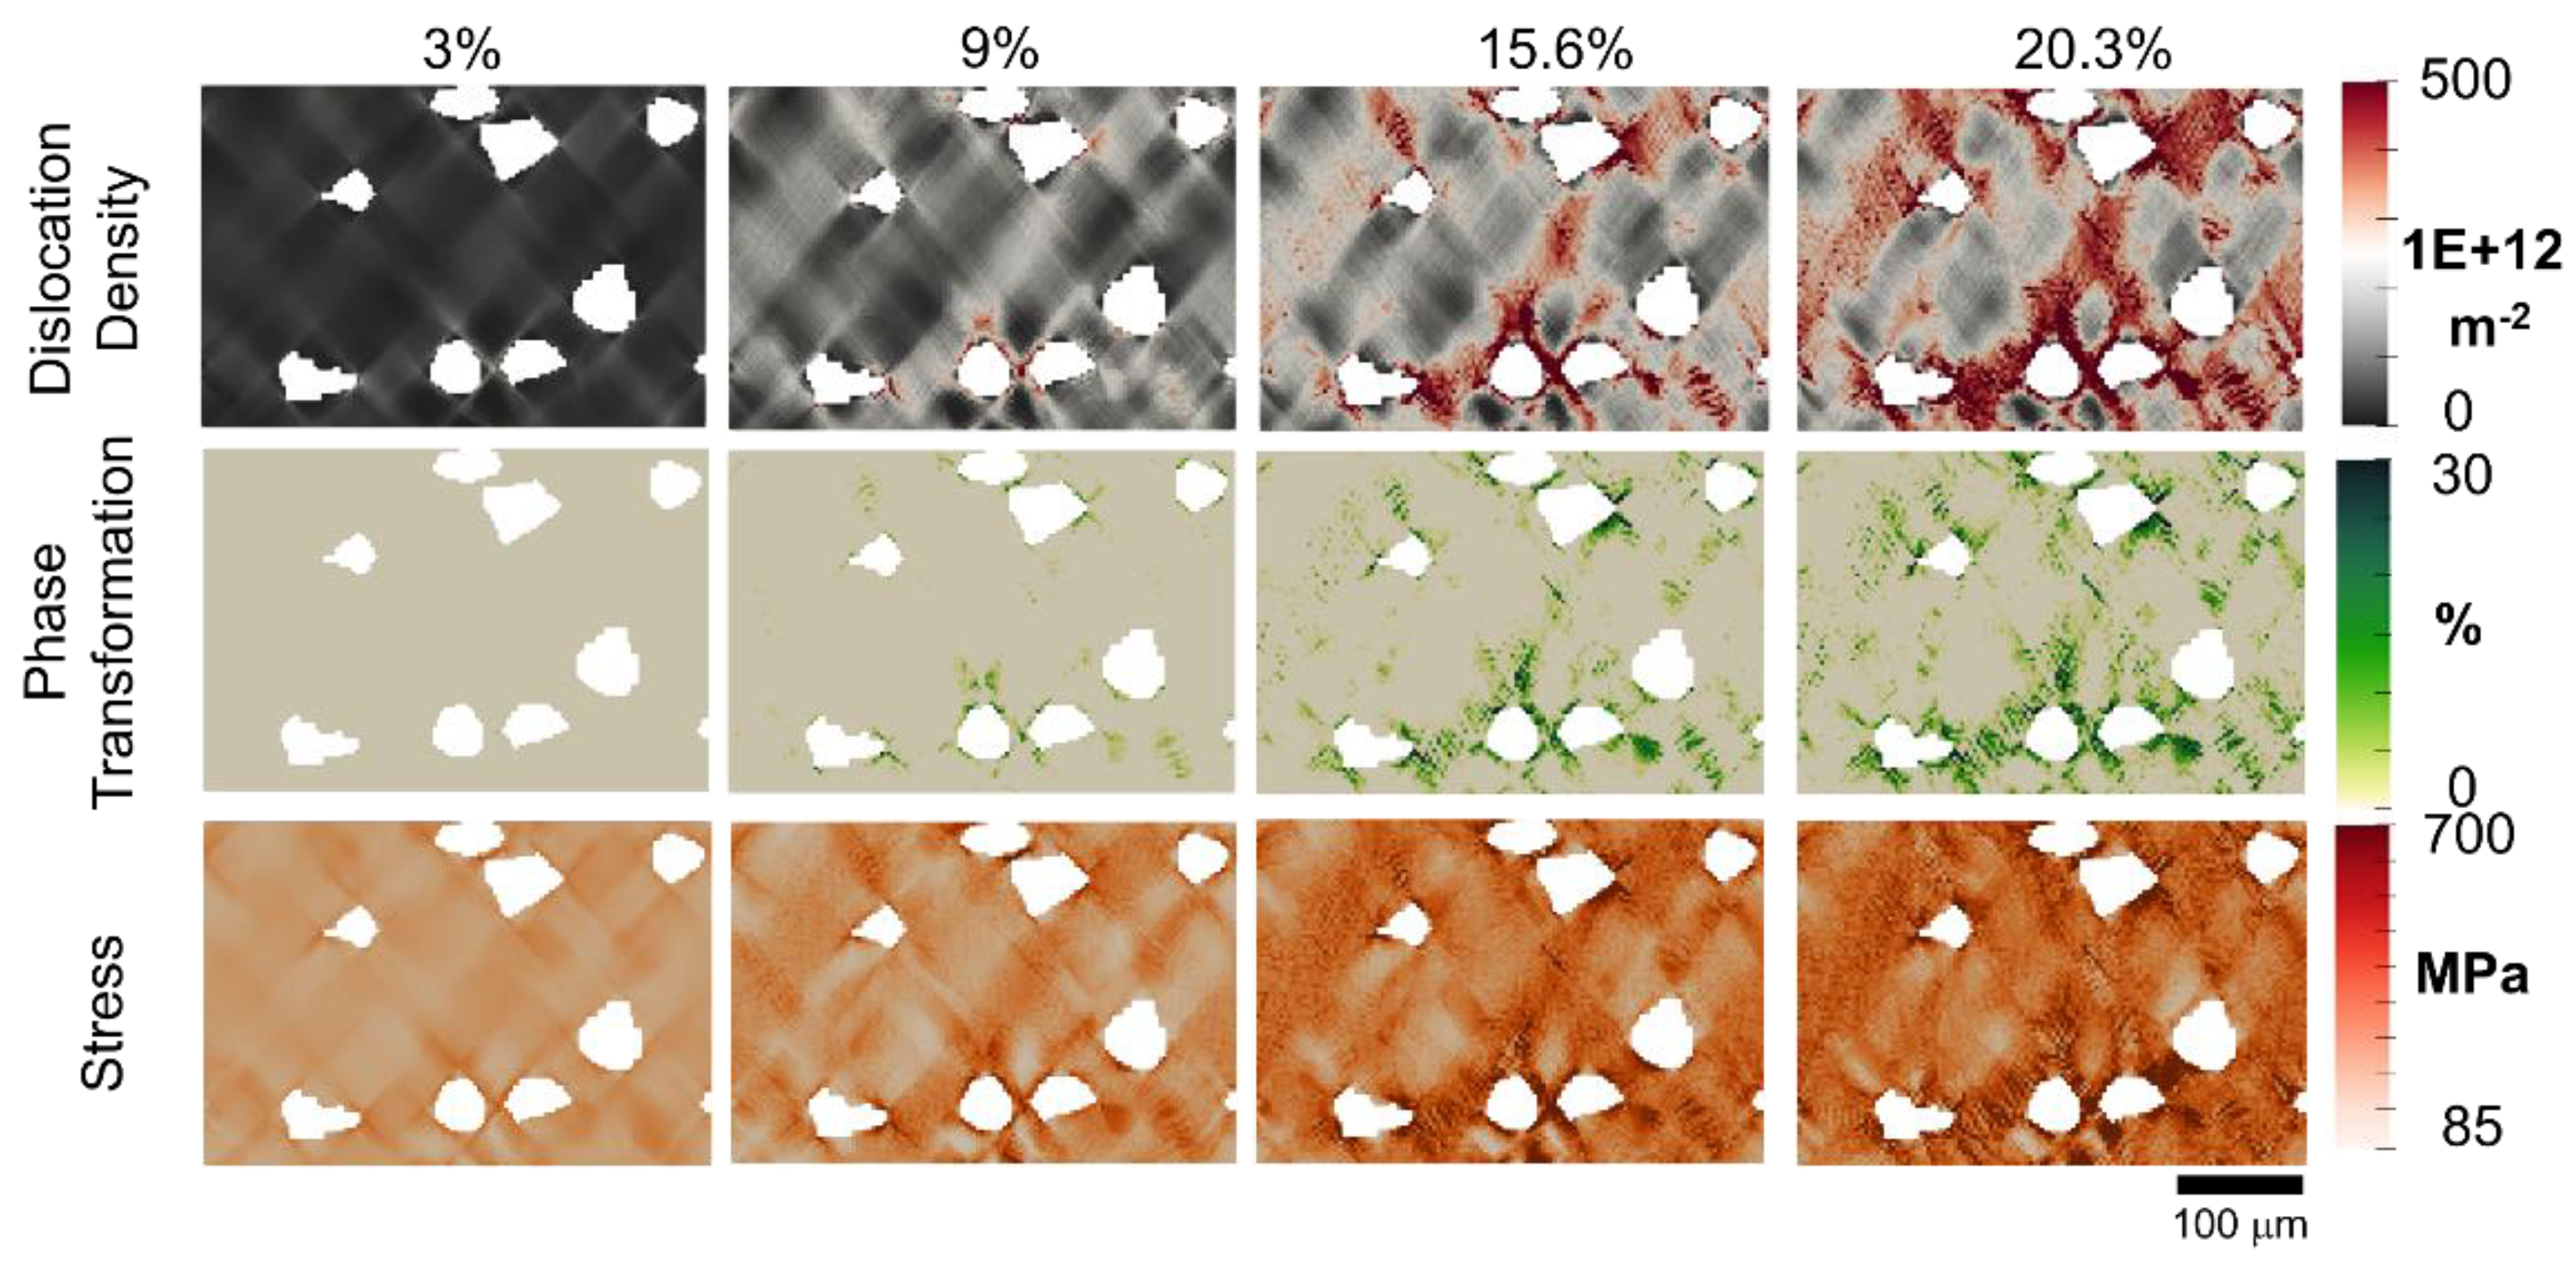
3.2. Local Result
3.3. Damage Behavior
3.3.1. Damage Behavior from Experiment
3.3.2. Damage Results from Simulation
4. Discussion
5. Conclusions
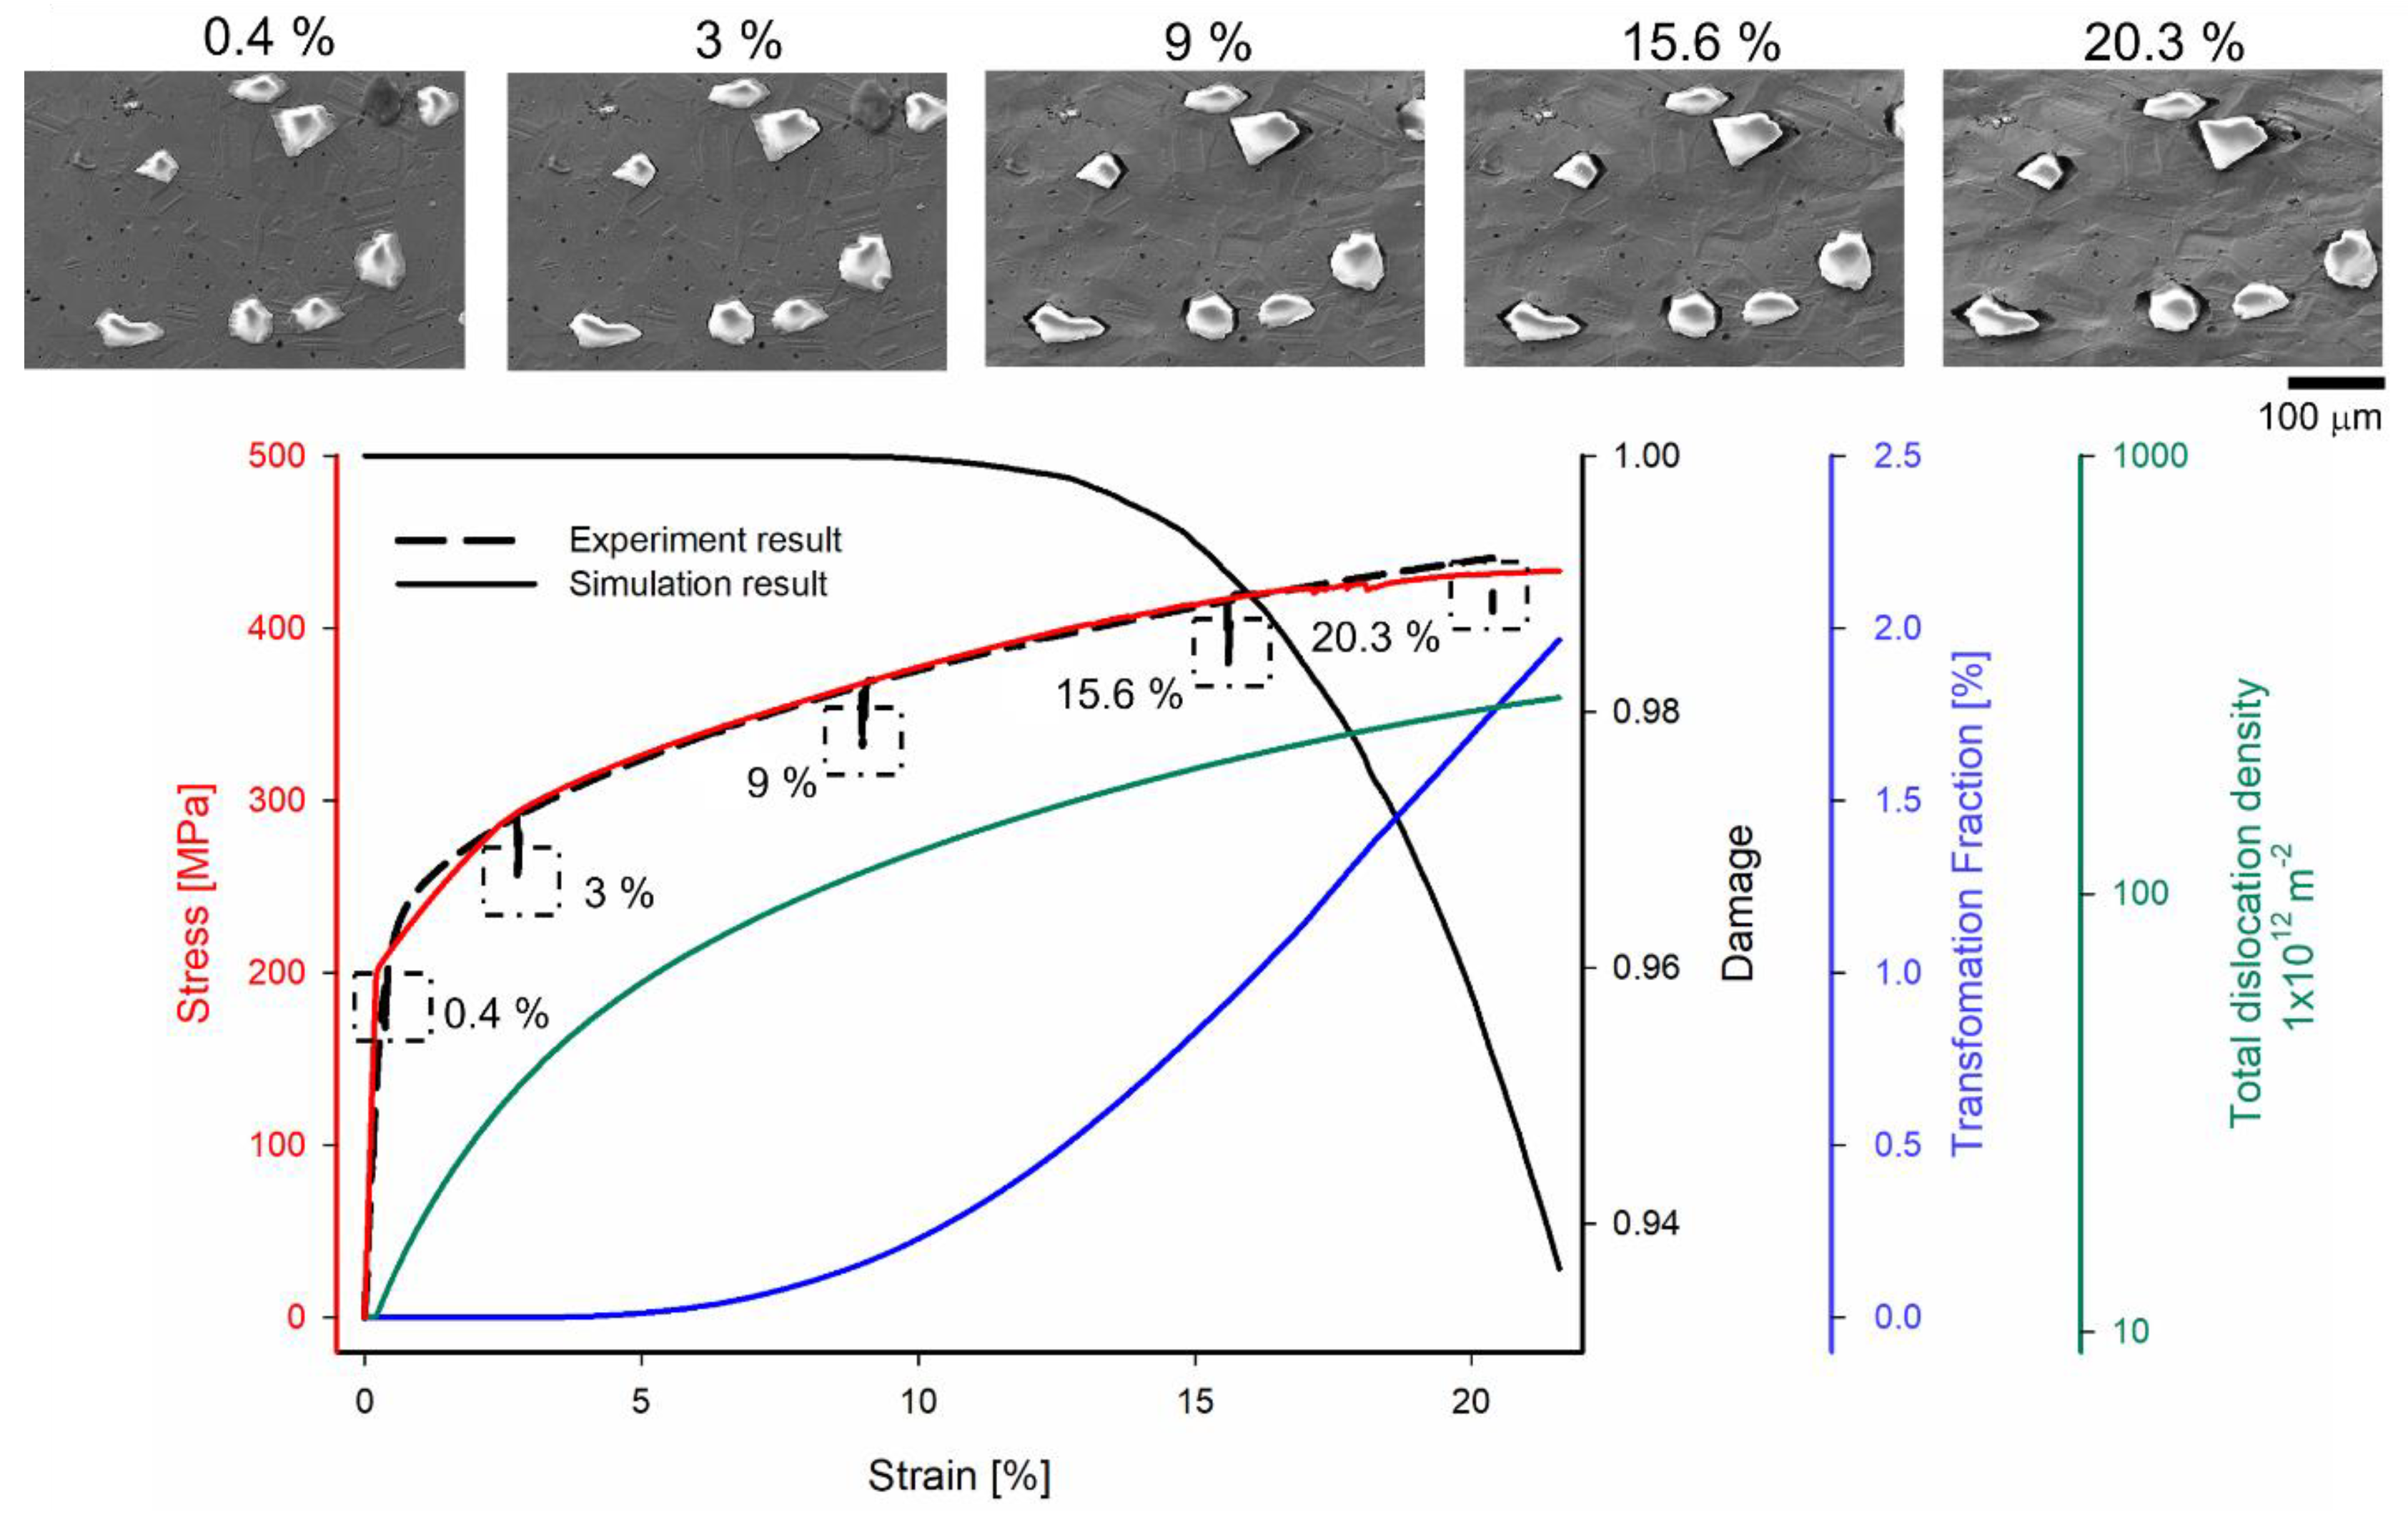
- When it is assumed that the critical plastic strain is 0.75 and the energy release rate is 1.0 × 10⁸ Jm−2, the global behavior of the stress and strain curve agrees well with the experiment and the simulation model.
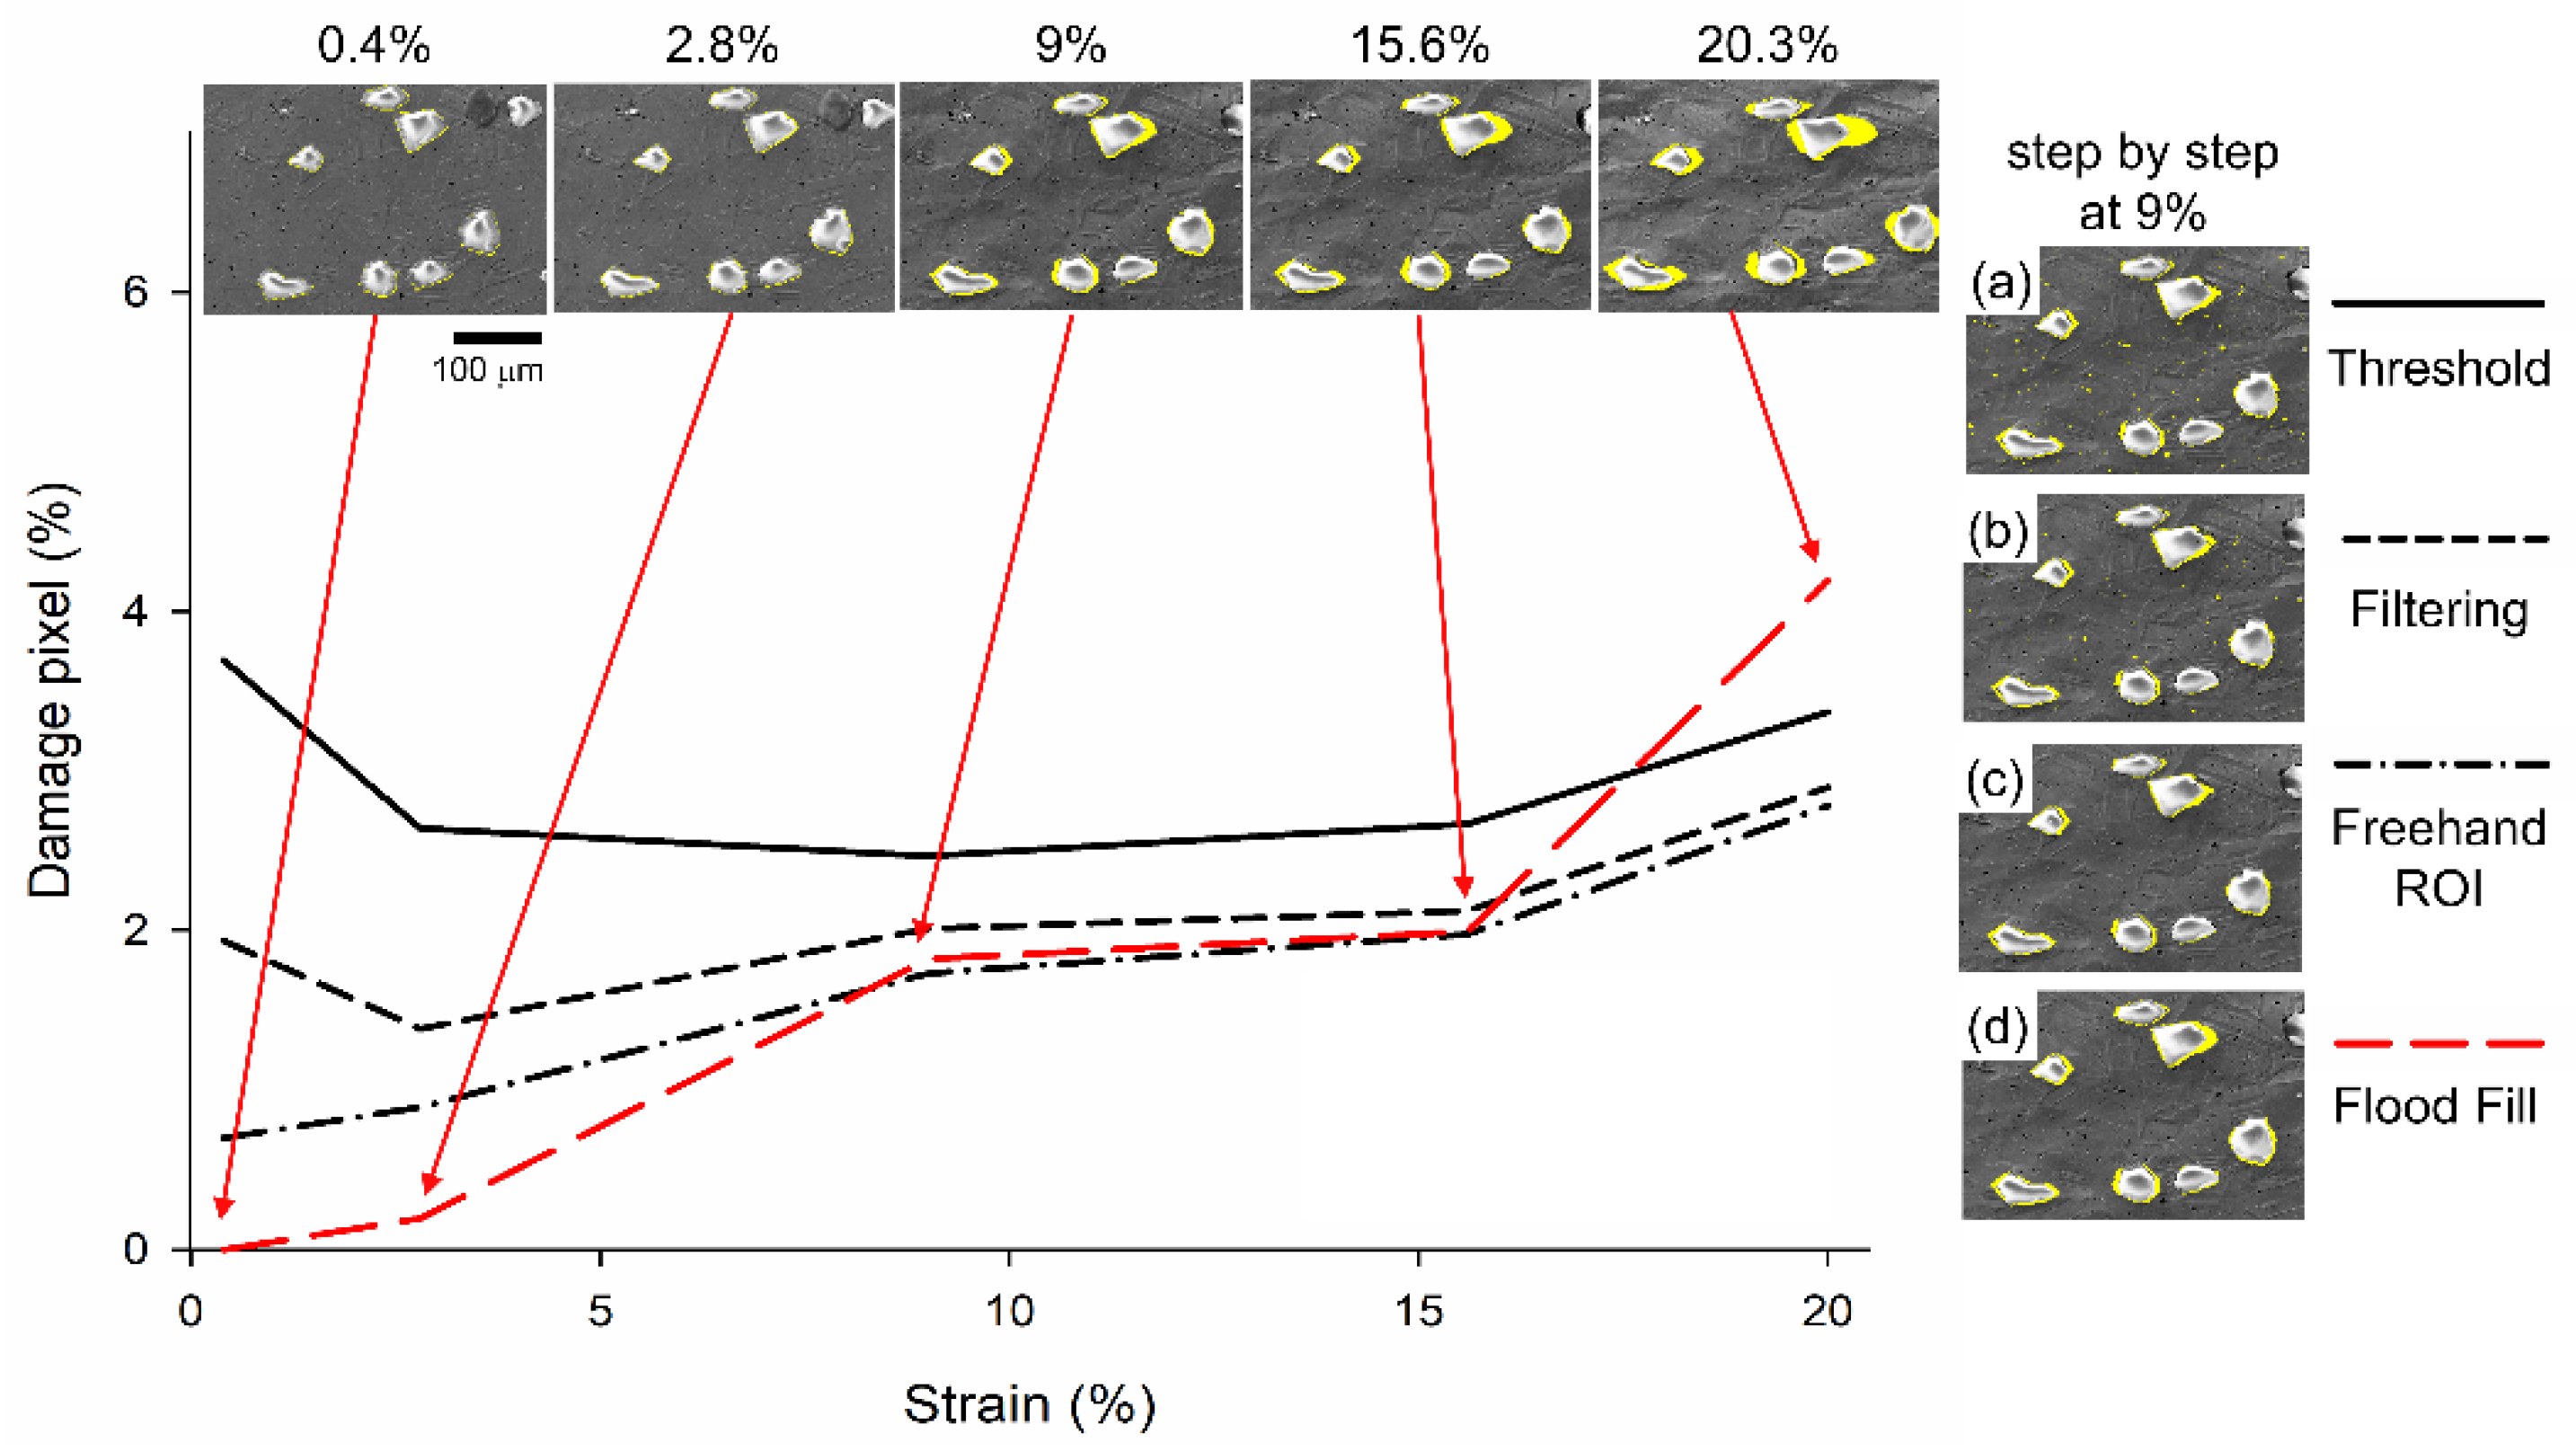
- Through the MATLAB image processing function, the damage region is detected in four steps, and the damage pixel is quantitatively analyzed. At 20.3% global strain, the damage pixels in the fourth step (flood fill) and third step (free-hand ROI) are 4.9% and 2.8%, respectively, which indicates that the fourth step is 2.1% higher than the third step. The damage pixel in the fourth step can be regarded as a more realistic condition.
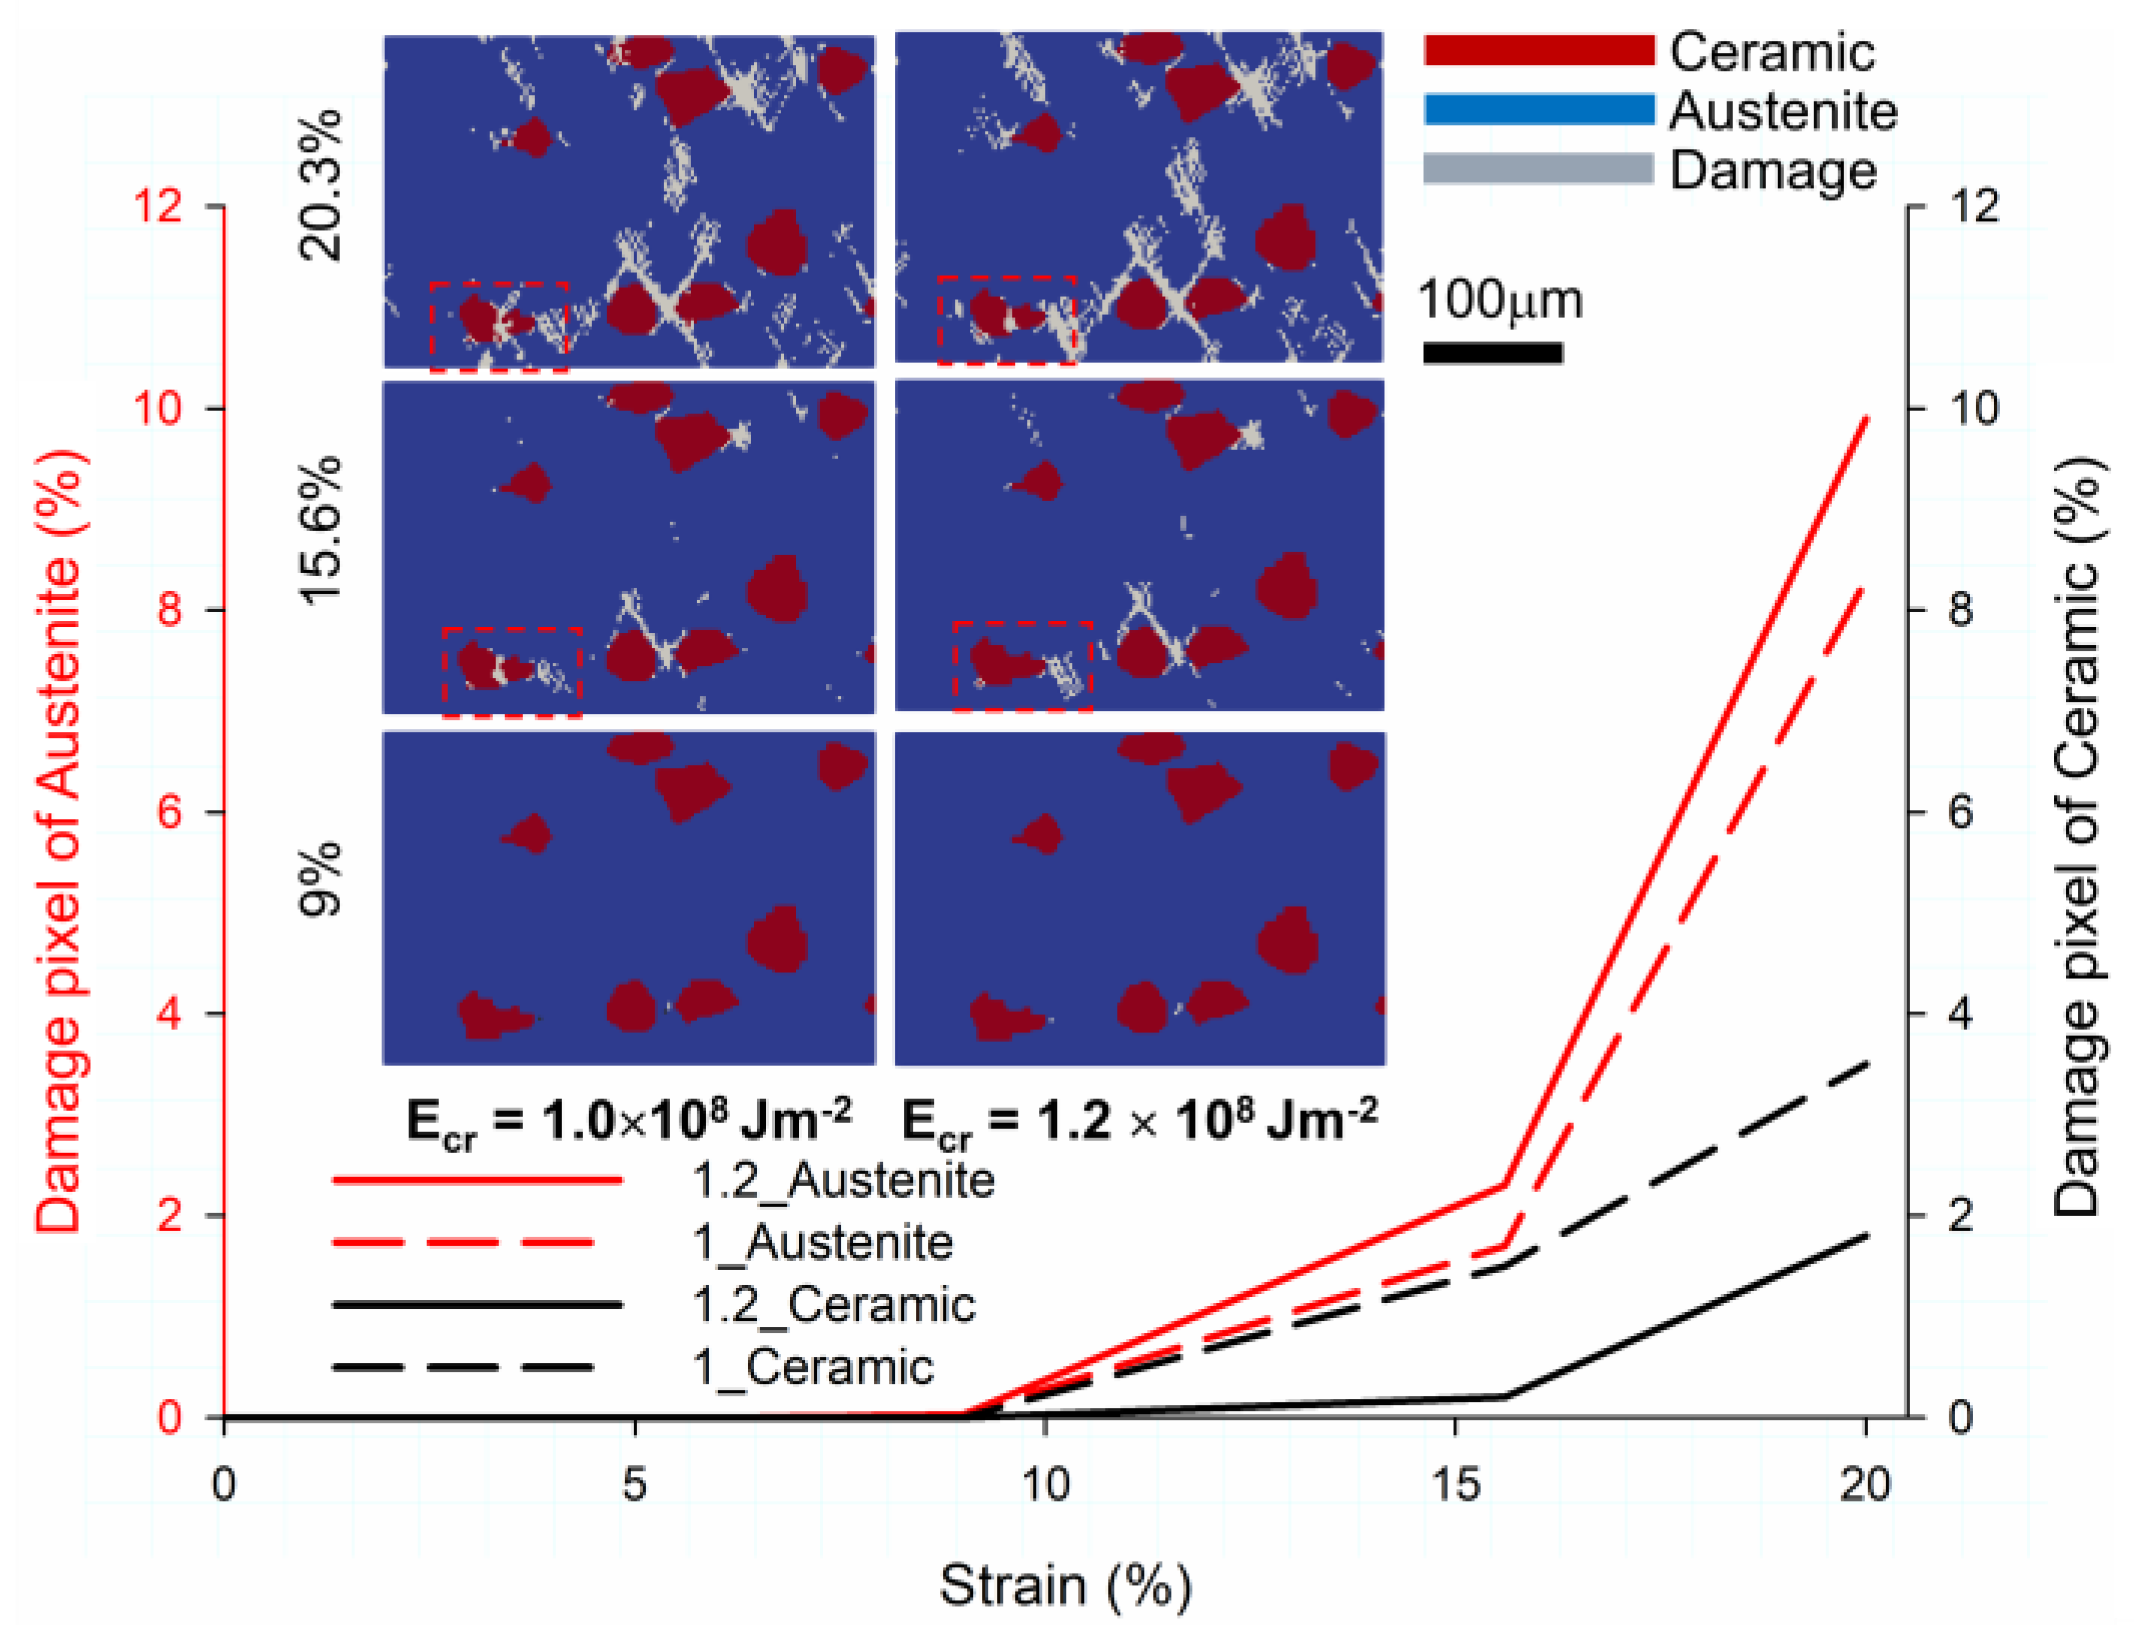
- The different energy release rates of the ceramic particles cause variations in the microstructure failure mechanism. This implies that the ceramic particles with severe damage are detected in the smaller Ecr (1.0 × 10⁸) case at 20.3% global strain. However, the austenitic matrix with severe damage is found in the larger Ecr (1.2 × 10⁸) case.
- Based on the quantitative damage result, at a global strain of 20.3%, the damage pixel of the Ecr (1.0 × 10⁸) case in ceramic particles is 1.7% larger than the Ecr (1.2 × 10⁸) case. As a consequence of premature brittle damage, the smaller Ecr (1.0 × 10⁸) case experiences stress relaxation and degradation of the driving force of crack evolution in the matrix region adjacent to the damaged particle. Conversely, the damage pixel of Ecr (1.0 × 10⁸) is 1.6% smaller than the Ecr (1.2 × 10⁸) case in the austenite matrix. Therefore, an increase in the strain release rate of the ceramic particles will result in severe damage to the matrix material. The damage pixel of the experiment, smaller Ecr (1.0 × 10⁸), and larger Ecr (1.2 × 10⁸) cases are 4.9%, 4.3%, and 5.1%, respectively. Furthermore, on a global strain of 20.3%, the relative errors between simulation and experimental validation of smaller Ecr (1.0 × 10⁸) and larger Ecr (1.2 × 10⁸) cases are –12.2% and 4%, respectively.
- It can be demonstrated that there is a slight difference in the qualitative damage and the local strain distribution between the crystal simulation and the experiment. The first difference is between the dimensions of the simulation (2D) and the experiment (3D). The absence of the initial grain orientation from EBSD is the second difference. Therefore, an initial grain orientation and a precise 3D microstructure in the composite material are required for further investigation.
Author Contributions
Funding
Data Availability Statement
Acknowledgments
Conflicts of Interest
Appendix A. Constitutive Laws of Dislocation-Based Model
Appendix B. Damage Criterion
References
- Thakare, V. Progress in synthesis and applications of zirconia. Int. J. Eng. Res. Dev. 2012, 5, 25–28. [Google Scholar]
- Larsen, D.C.; Adams, J.W. Property Screening and Evaluation of Ceramic Turbine Materials; IIT Research INST: Chicago, IL, USA, 1984; p. 331. [Google Scholar]
- Shahmiri, R.; Standard, O.C.; Hart, J.N.; Sorrell, C.C. Optical properties of zirconia ceramics for esthetic dental restorations: A systematic review. J. Prosthet. Dent. 2018, 119, 36–46. [Google Scholar] [CrossRef] [PubMed]
- Miriyev, A.; Grützner, S.; Krüger, L.; Kalabukhov, S.; Frage, N. Bonding of TRIP-steel/Al2O3-(3Y)-TZP composites and (3Y)-TZP ceramic by a spark plasma sintering (SPS) apparatus. Materials 2016, 9, 558. [Google Scholar] [CrossRef] [PubMed] [Green Version]
- Piconi, C.; Maccauro, G. Zirconia as a ceramic biomaterial. Biomaterials 1999, 20, 1–25. [Google Scholar] [CrossRef]
- Butler, E.P. Transformation-toughened zirconia ceramics. Mater. Sci. Technol. 1985, 1, 417–432. [Google Scholar] [CrossRef]
- Chiu, C.C.; Tseng, S.C.; Chao, C.K.; Li, M.D. Combined effect of thermally grown oxide growth and calcium-magnesium-alumino-silicate infiltration in thermal barrier coating system. Ceram. Int. 2022, 48, 37075–37084. [Google Scholar] [CrossRef]
- Biermann, H.; Aneziris, C.G. Austenitic TRIP/TWIP steels and steel-zirconia composites: Design of tough. In Transformation-Strengthened Composites and Structures; Springer: Berlin/Heidelberg, Germany, 2020; p. 298. [Google Scholar]
- Biermann, H.; Aneziris, C.G.; Kuna, M. Collaborative research center TRIP-matrix-composite. In Proceedings of the European Symposium on Martensitic Transformations, Prague, Czech Republic, 7–11 September 2009; p. 05002. [Google Scholar] [CrossRef] [Green Version]
- Marshall, D.B. Strength characteristics of transformation-toughened zirconia. J. Am. Ceram. Society 1986, 69, 173–180. [Google Scholar] [CrossRef]
- Rühle, M.; Kriven, W.M. Stress-induced transformations in composite zirconia ceramics. Ber. Der Bunsenges. Für Phys. Chem. 1983, 87, 222–228. [Google Scholar] [CrossRef]
- Biermann, H.; Martin, U.; Aneziris, C.G.; Kolbe, A.; Müller, A.; Schärfl, W.; Herrmann, M. Microstructure and compression strength of novel TRIP-steel/Mg-PSZ composites. Adv. Eng. Mater. 2009, 11, 1000–1006. [Google Scholar] [CrossRef]
- Weidner, A.; Berek, H.; Segel, C.; Aneziris, C.G.; Biermann, H. In situ tensile deformation of TRIP steel/Mg-PSZ composites. In Materials Science Forum; Trans Tech Publications Ltd.: Stafa, Switzerland, 2013; pp. 77–81. Available online: https://www.scientific.net/MSF.738-739.77 (accessed on 15 November 2022).
- Qayyum, F.; Guk, S.; Schmidtchen, M.; Kawalla, R.; Prahl, U. Modeling the local deformation and transformation behavior of cast X8CrMnNi16-6-6 TRIP steel and 10% Mg-PSZ composite using a continuum mechanics-based crystal plasticity model. Crystals 2020, 10, 221. [Google Scholar] [CrossRef]
- Guk, S.; Pranke, K.; Müller, W. Flow curve modelling of an Mg-PSZ reinforced TRIP-matrix-composite. ISIJ Int. 2014, 54, 2416–2420. [Google Scholar] [CrossRef] [Green Version]
- Guk, S.; Milisova, D.; Pranke, K. Influence of deformation conditions on the microstructure and formability of sintered Mg-PSZ reinforced TRIP-matrix-composites. Key Eng. Mater. 2016, 684, 86–96. [Google Scholar] [CrossRef]
- Opiela, M.; Fojt-Dymara, G.; Grajcar, A.; Borek, W. Effect of grain size on the microstructure and strain hardening behavior of solution heat-treated low-C high-Mn steel. Materials 2020, 13, 1489. [Google Scholar] [CrossRef] [PubMed] [Green Version]
- Fojt-Dymara, G.; Opiela, M.; Borek, W. Susceptibility of High-Manganese Steel to High-Temperature Cracking. Materials 2022, 15, 8198. [Google Scholar] [CrossRef] [PubMed]
- Olson, G.B.; Cohen, M. A mechanism for the strain-induced nucleation of martensitic transformations. J. Less Common Met. 1972, 28, 107–118. [Google Scholar] [CrossRef]
- Das, A.; Sivaprasad, S.; Ghosh, M.; Chakraborti, P.C.; Tarafder, S. Morphologies and characteristics of deformation induced martensite during tensile deformation of 304 LN stainless steel. Mater. Sci. Eng. A 2008, 486, 283–286. [Google Scholar] [CrossRef]
- Martin, S.; Ullrich, C.; Rafaja, D. Deformation of austenitic CrMnNi TRIP/TWIP steels: Nature and role of the ɛ− martensite. Mater. Today Proc. 2015, 2, 643–646. [Google Scholar] [CrossRef]
- Martin, S.; Wolf, S.; Decker, S.; Krueger, L.; Martin, U. Deformation bands in high-alloy austenitic 16Cr6Mn6Ni TRIP steel: Phase transformation and its consequences on strain hardening at room temperature. Steel Res. Int. 2015, 86, 1187–1196. [Google Scholar] [CrossRef]
- Qayyum, F.; Guk, S.; Prahl, U. Studying the damage evolution and the micro-mechanical response of X8CrMnNi16-6-6 TRIP steel matrix and 10% zirconia particle composite using a calibrated physics and crystal-plasticity-based numerical simulation model. Crystals 2021, 11, 759. [Google Scholar] [CrossRef]
- Wolf, S.; Martin, S.; Krüger, L.; Martin, U.; Lorenz, U. Mechanical behavior of deformation-induced α′-martensite and flow curve modeling of a cast CrMnNi TRIP-steel. Steel Res. Int. 2012, 83, 529–537. [Google Scholar] [CrossRef]
- Wolf, S.; Martin, S.; Krüger, L.; Martin, U. Constitutive modelling of the rate dependent flow stress of cast high-alloyed metastable austenitic TRIP/TWIP steel. Mater. Sci. Eng. A 2014, 594, 72–81. [Google Scholar] [CrossRef]
- Qayyum, F.; Umar, M.; Guk, S.; Schmidtchen, M.; Kawalla, R.; Prahl, U. Effect of the 3rd dimension within the representative volume element (Rve) on damage initiation and propagation during full-phase numerical simulations of single and multi-phase steels. Materials 2020, 14, 42. [Google Scholar] [CrossRef] [PubMed]
- Umar, M.; Qayyum, F.; Farooq, M.U.; Khan, L.A.; Guk, S.; Prahl, U. Analyzing the cementite particle size and distribution in heterogeneous microstructure of C45EC steel using crystal plasticity based DAMASK code. In Proceedings of the 2021 International Bhurban Conference on Applied Sciences and Technologies (IBCAST), Islamabad, Pakistan, 12–16 January 2021; pp. 15–20. [Google Scholar] [CrossRef]
- Vakili, S.; Shanthraj, P.; Roters, F.; Mianroodi, J.R.; Raabe, D. Phase-field modeling of coupled brittle-ductile fracture in aluminum alloys. arXiv 2022. [Google Scholar] [CrossRef]
- Chiu, C.; Tseng, S.; Qayyum, F.; Guk, S.; Chao, C.; Prahl, U. Local Deformation and Interfacial Damage Behavior of Partially Stabilized Zirconia-Reinforced Metastable Austenitic Steel Composites: Numerical Simulation and Validation. Mater. Des. 2022, 225, 111515. [Google Scholar] [CrossRef]
- Kirbach, C.; Lehmann, T.; Stockmann, M.; Ihlemann, J. Digital image correlation used for experimental investigations of Al/Mg compounds. Strain 2015, 51, 223–234. [Google Scholar] [CrossRef]
- Eisenlohr, P.; Diehl, M.; Lebensohn, R.A.; Roters, F. A spectral method solution to crystal elasto-viscoplasticity at finite strains. Int. J. Plast. 2013, 46, 37–53. [Google Scholar] [CrossRef]
- Wong, S.L.; Madivala, M.; Prahl, U.; Roters, F.; Raabe, D. A crystal plasticity model for twinning-and transformation-induced plasticity. Acta Mater. 2016, 118, 140–151. [Google Scholar] [CrossRef]
- Madivala, M.; Schwedt, A.; Wong, S.L.; Roters, F.; Prahl, U.; Bleck, W. Temperature dependent strain hardening and fracture behavior of TWIP steel. Int. J. Plast. 2018, 104, 80–103. [Google Scholar] [CrossRef]
- Roters, F.; Eisenlohr, P.; Hantcherli, L.; Tjahjanto, D.D.; Bieler, T.R.; Raabe, D. Overview of constitutive laws, kinematics, homogenization and multiscale methods in crystal plasticity finite-element modeling: Theory, experiments, applications. Acta Mater. 2010, 58, 1152–1211. [Google Scholar] [CrossRef]
- Kalidindi, S.R. Incorporation of deformation twinning in crystal plasticity models. J. Mech. Phys. Solids 1998, 46, 267–290. [Google Scholar] [CrossRef]
- Orowan, E. Zur kristallplastizität. I. Z. Phys. 1934, 89, 605–613. [Google Scholar] [CrossRef]
- Griffith, A.A. VI. The phenomena of rupture and flow in solids. Philos. Trans. R. Soc. London. Ser. A Contain. Pap. A Math. Phys. Character 1921, 221, 163–198. [Google Scholar] [CrossRef] [Green Version]
- Roters, F.; Diehl, M.; Shanthraj, P.; Eisenlohr, P.; Reuber, C.; Wong, S.L.; Maiti, T.; Ebrahimi, A.; Hochrainer, T.; Fabritius, H.O.; et al. DAMASK–The Düsseldorf Advanced Material Simulation Kit for modeling multi-physics crystal plasticity, thermal, and damage phenomena from the single crystal up to the component scale. Comput. Mater. Sci. 2019, 158, 420–478. [Google Scholar] [CrossRef]
- Garve, R.C.; Nicholson, P.S. Phase analysis in zirconia systems. J. Am. Ceram. Soc. 1972, 55, 303–305. [Google Scholar] [CrossRef]
- Fujita, N.; Ishikawa, N.; Roters, F.; Tasan, C.C.; Raabe, D. Experimental–numerical study on strain and stress partitioning in bainitic steels with martensite–austenite constituents. Int. J. Plast. 2018, 104, 39–53. [Google Scholar] [CrossRef]
- Sedighiani, K.; Traka, K.; Roters, F.; Sietsma, J.; Raabe, D.; Diehl, M. Crystal plasticity simulation of in-grain microstructural evolution during large deformation of IF-steel. Acta Mater. 2022, 237, 118167. [Google Scholar] [CrossRef]
- Bialobrzeska, B.; Konat, L.; Jasinski, R. The influence of austenite grain size on the mechanical properties of low-alloy steel with boron. Metals 2017, 7, 26. [Google Scholar] [CrossRef] [Green Version]
- Rafaja, D.; Krbetschek, C.; Ullrich, C.; Martin, S. Stacking fault energy in austenitic steels determined by using in situ X-ray diffraction during bending. J. Appl. Crystallogr. 2014, 47, 936–947. [Google Scholar] [CrossRef]
- Ackermann, S.; Martin, S.; Schwarz, M.R.; Schimpf, C.; Kulawinski, D.; Lathe, C.; Henkel, S.; Rafaja, D.; Biermann, H.; Weidner, A. Investigation of phase transformations in high-alloy austenitic TRIP steel under high pressure (up to 18 GPa) by in situ synchrotron X-ray diffraction and scanning electron microscopy. Metall. Mater. Trans. A 2016, 47, 95–111. [Google Scholar] [CrossRef]
- Lu, X.; Zhao, J.; Yu, C.; Li, Z.; Kan, Q.; Kang, G.; Zhang, X. Cyclic plasticity of an interstitial high-entropy alloy: Experiments, crystal plasticity modeling, and simulations. J. Mech. Phys. Solids 2020, 142, 103971. [Google Scholar] [CrossRef]
- Andersson, J.O.; Helander, T.; Höglund, L.; Shi, P.; Sundman, B. Thermo-Calc & DICTRA computational tools for materials science. Calphad 2002, 26, 273–312. [Google Scholar] [CrossRef]
- Grassi, M.; Soranzo, A. MLP: A MATLAB toolbox for rapid and reliable auditory threshold estimation. Behav. Res. Methods 2009, 41, 20–28. [Google Scholar] [CrossRef] [PubMed] [Green Version]
- Patel, N.; Mishra, A. Automated leukaemia detection using microscopic images. Procedia Comput. Sci. 2015, 58, 635–642. [Google Scholar] [CrossRef] [Green Version]
- Mukuda, N.; Fujii, S.; Inoue, C.; Fukunaga, T.; Tanabe, Y.; Itamochi, H.; Ogawa, T. Apparent diffusion coefficient (ADC) measurement in ovarian tumor: Effect of region-of-interest methods on ADC values and diagnostic ability. J. Magn. Reson. Imaging 2016, 43, 720–725. [Google Scholar] [CrossRef]
- Nosal, E.M. Flood-fill algorithms used for passive acoustic detection and tracking. In Proceedings of the 2008 New Trends for Environmental Monitoring Using Passive Systems, Hyeres, France, 14–17 October 2008; pp. 1–5. [Google Scholar] [CrossRef]
- Ehinger, D.; Weise, J.; Baumeister, J.; Funk, A.; Waske, A.; Krüger, L.; Martin, U. Microstructure and deformation response of TRIP-steel syntactic foams to quasi-static and dynamic compressive loads. Materials 2018, 11, 656. [Google Scholar] [CrossRef] [Green Version]
- Qayyum, F.; Chaudhry, A.A.; Guk, S.; Schmidtchen, M.; Kawalla, R.; Prahl, U. Effect of 3D representative volume element (RVE) thickness on stress and strain partitioning in crystal plasticity simulations of multi-phase materials. Crystals 2020, 10, 944. [Google Scholar] [CrossRef]
- Diehl, M.; An, D.; Shanthraj, P.; Zaefferer, S.; Roters, F.; Raabe, D. Crystal plasticity study on stress and strain partitioning in a measured 3D dual phase steel microstructure. Phys. Mesomech. 2017, 20, 311–323. [Google Scholar] [CrossRef]
- Diehl, M.; Shanthraj, P.; Eisenlohr, P.; Roters, F. Neighborhood influences on stress and strain partitioning in dual-phase microstructures. Meccanica 2016, 51, 429–441. [Google Scholar] [CrossRef]
- Tseng, S.; Qayyum, F.; Guk, S.; Chao, C.; Prahl, U. Transformation of 2D RVE Local Stress and Strain Distributions to 3D Observations in Full Phase Crystal Plasticity Simulations of Dual-Phase Steels. Crystals 2022, 12, 955. [Google Scholar] [CrossRef]
- Liu, H.T.; Sun, L.Z.; Ju, J.W. An interfacial debonding model for particle-reinforced composites. Int. J. Damage Mech. 2004, 13, 163–185. [Google Scholar] [CrossRef]


| Steel Alloy | C | Mn | Si | Cr | Ni | N | Fe |
| 16–7–6 | 0.03 | 7.2 | 1.0 | 16.3 | 6.6 | 0.09 | bal. |
| Ceramic | ZrO2 | MgO | Na2O | CaO | TiO2 | Fe2O3 | SiO2 |
| Mg-PSZ | 94.14 | 2.82 | 0.1 | 0.15 | 0.13 | 0.13 | 0.41 |
| Symbol | Description | Value | Unit | Ref. | |
|---|---|---|---|---|---|
| Dislocation Slip Parameters | bs | Burgers vector of slip | 2.56 × 10⁻¹⁰ | m | [32] |
| ρe | Edge dislocation density | 1.0 × 10¹² | m/m3 | [41] | |
| D0 | Self-diffusion coefficient for fcc Fe | 4.0 × 10⁻⁵ | m2/s | [32] | |
| v0 | Dislocation glide velocity | 1.0 × 10⁻⁴ | m/s | [32] | |
| q | Bottom of the obstacle profile | 1.0 | - | [32] | |
| p | Top of the obstacle profile | 1.15 | - | [32] | |
| Qc | Activation energy for the climb | 3.0 × 10⁻¹⁹ | J | [32] | |
| Qs | Activation energy for glide | 3.5 × 10⁻¹⁹ | J | [32] | |
| τsol | Solid solution strength | 5 × 10⁷ | Pa | ||
| λslip | parameter controlling dislocation mean free path | 55 | - | [23] | |
| d | Average Grain size | 2 × 10⁻⁵ | m | [42] | |
| Twinning Formation Parameters | btw | Burgers vector of twin system | 1.2 × 10⁻¹⁰ | m | [32] |
| ttw | Average twin thickness | 5 × 10⁻⁸ | m | [32] | |
| Vcs | Cross-slip activation volume | 1.67 × 10⁻²⁹ | m3 | [32] | |
| A | Twinning transition profile width exponent | 1.0 | - | [23] | |
| λsliptwin | Parameter controlling twin mean free path | 5 | - | [23] | |
| Parameter controlling twin threshold stress | 1.3 | MPa | [23] | ||
| Γsf | Stacking fault energy | 10 | mJ/m2 | [43] | |
| Martensite Transformation Parameters | btr | Burgers vector of the trans system | 1.47 × 10⁻¹⁰ | m | [32] |
| ttr | Average martensite thickness | 5 × 10⁻⁶ | m | [44] | |
| Vcs | Cross-slip activation volume | 1.67 × 10⁻²⁹ | m3 | [32] | |
| B | Transformation transition profile width exponent | 3.0 | - | [23] | |
| λsliptran | Parameter controlling trans. mean free path | 10 | - | [23] | |
| Parameter controlling trans threshold stress | 0.5 | MPa | [23] | ||
| h | Height of the hcp nucleus | 1.06 × 10⁻⁹ | [45] | ||
| ΔGγ→ε | Change in Gibbs free energy | −2.54 × 10⁷ | J/m3 | [46] |
| Austenite | Martensite | Ceramic | Unit |
|---|---|---|---|
| C11 = 175.0 | C11 = 191.0 | C11 = 191.0 | GPa |
| C12 = 115.0 | C12 = 80.0 | C12 = 80.0 | GPa |
| C44 = 135.0 | C13 = 40.0 | C44 = 40.0 | GPa |
| C33 = 315.0 | GPa | ||
| C44 = 40.5 | GPa |
| Parameter Definition | Property | Value | Unit |
|---|---|---|---|
| Characteristic length | l0 | 1.0 | μm |
| Damage mobility | M | 0.001 | - |
| Damage diffusion | D | 1.0 | - |
| Parameter Definition | Property | Value | Unit |
|---|---|---|---|
| Critical plastic strain | εp,crit | 0.75 | - |
| Characteristic length | l0 | 1.0 | μm |
| Damage mobility | M | 0.001 | - |
| Damage diffusion | D | 1.0 | - |
| Damage rate sensitivity | P | 35 | - |
Disclaimer/Publisher’s Note: The statements, opinions and data contained in all publications are solely those of the individual author(s) and contributor(s) and not of MDPI and/or the editor(s). MDPI and/or the editor(s) disclaim responsibility for any injury to people or property resulting from any ideas, methods, instructions or products referred to in the content. |
© 2022 by the authors. Licensee MDPI, Basel, Switzerland. This article is an open access article distributed under the terms and conditions of the Creative Commons Attribution (CC BY) license (https://creativecommons.org/licenses/by/4.0/).
Share and Cite
Tseng, S.-C.; Chiu, C.-C.; Qayyum, F.; Guk, S.; Chao, C.-K.; Prahl, U. The Effect of the Energy Release Rate on the Local Damage Evolution in TRIP Steel Composite Reinforced with Zirconia Particles. Materials 2023, 16, 134. https://doi.org/10.3390/ma16010134
Tseng S-C, Chiu C-C, Qayyum F, Guk S, Chao C-K, Prahl U. The Effect of the Energy Release Rate on the Local Damage Evolution in TRIP Steel Composite Reinforced with Zirconia Particles. Materials. 2023; 16(1):134. https://doi.org/10.3390/ma16010134
Chicago/Turabian StyleTseng, Shao-Chen, Chen-Chun Chiu, Faisal Qayyum, Sergey Guk, Ching-Kong Chao, and Ulrich Prahl. 2023. "The Effect of the Energy Release Rate on the Local Damage Evolution in TRIP Steel Composite Reinforced with Zirconia Particles" Materials 16, no. 1: 134. https://doi.org/10.3390/ma16010134