
How to Create Trusted Tribological Characterization Data of Soft Polymers as Input for FEM Simulations?
 , ,
, ,
Abstract
:1. Introduction
2. Materials and Methods
2.1. Materials
2.2. Methods
2.2.1. Designing Experimental Tests for Soft Polymers
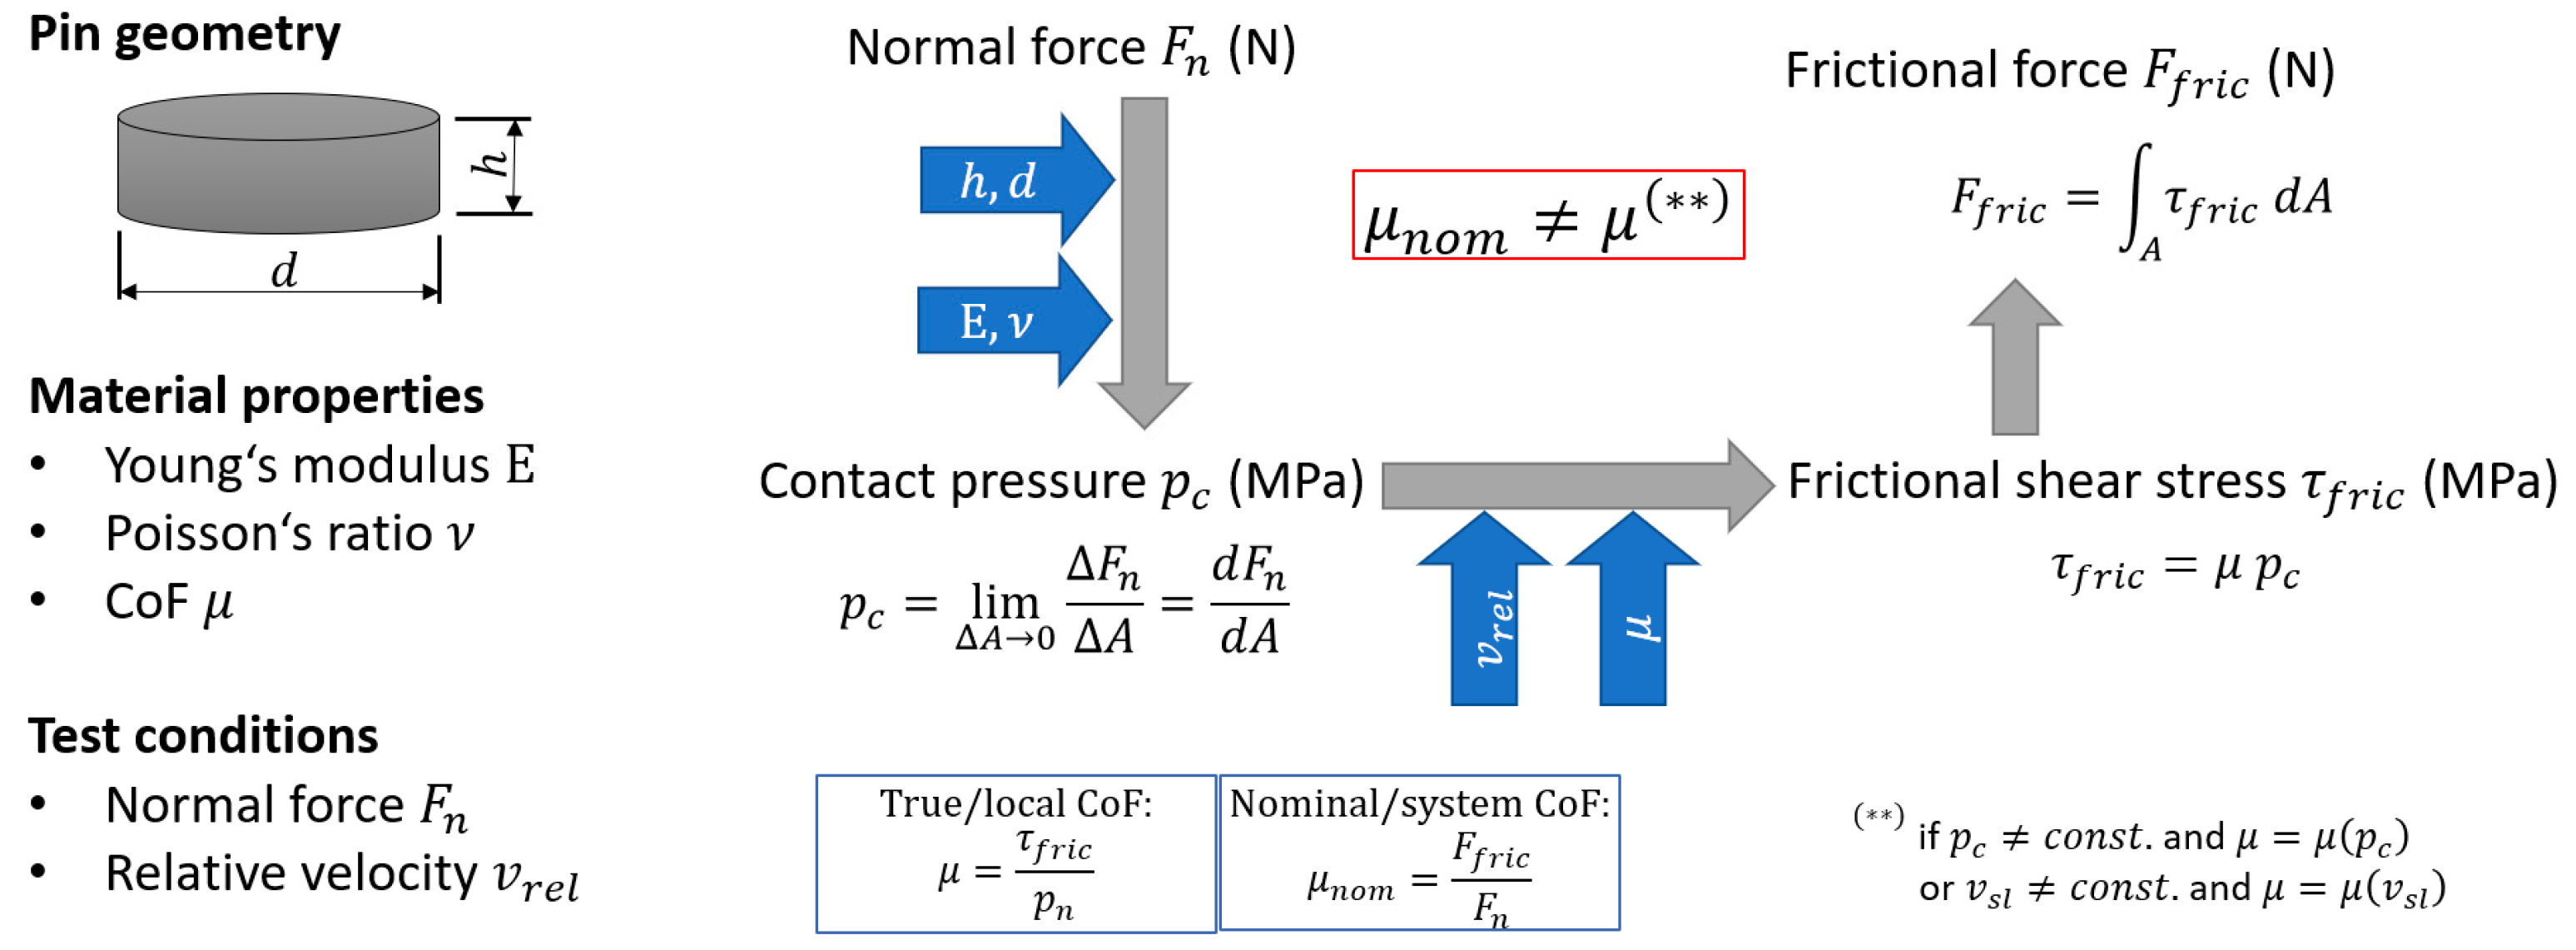
- the normal load ;
- the frictional force ;
- the relative velocity between sample and counter body;
- the loss of volume due to wear usually determined by the mass loss assuming constant material density.
- Height of polymer disc ;
- Diameter of polymer disc ;
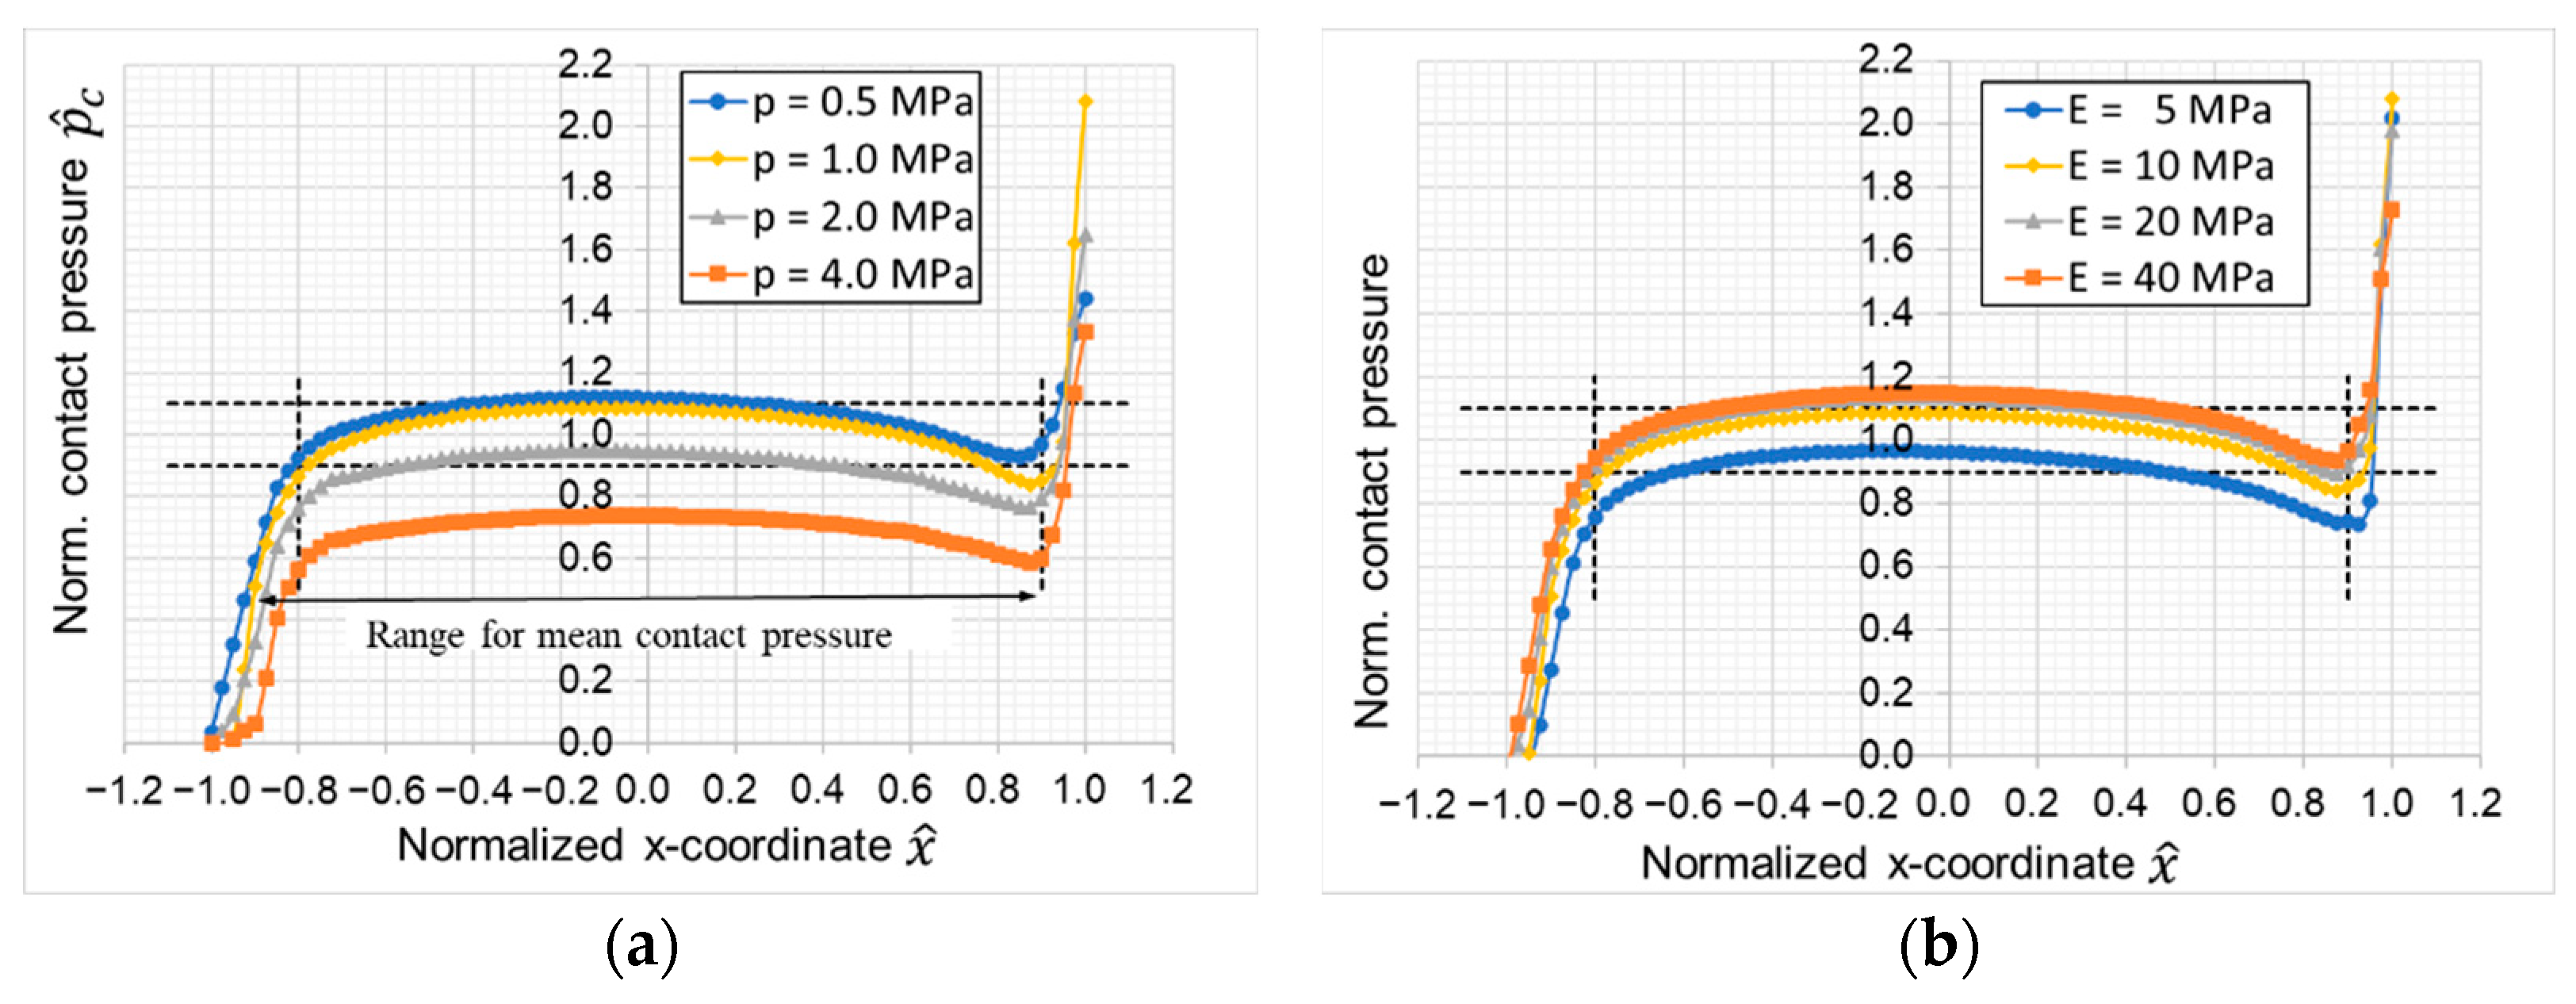
- Nominal contact pressure , given by normal load and the cross-sectional area : ;
- Young’s modulus ;
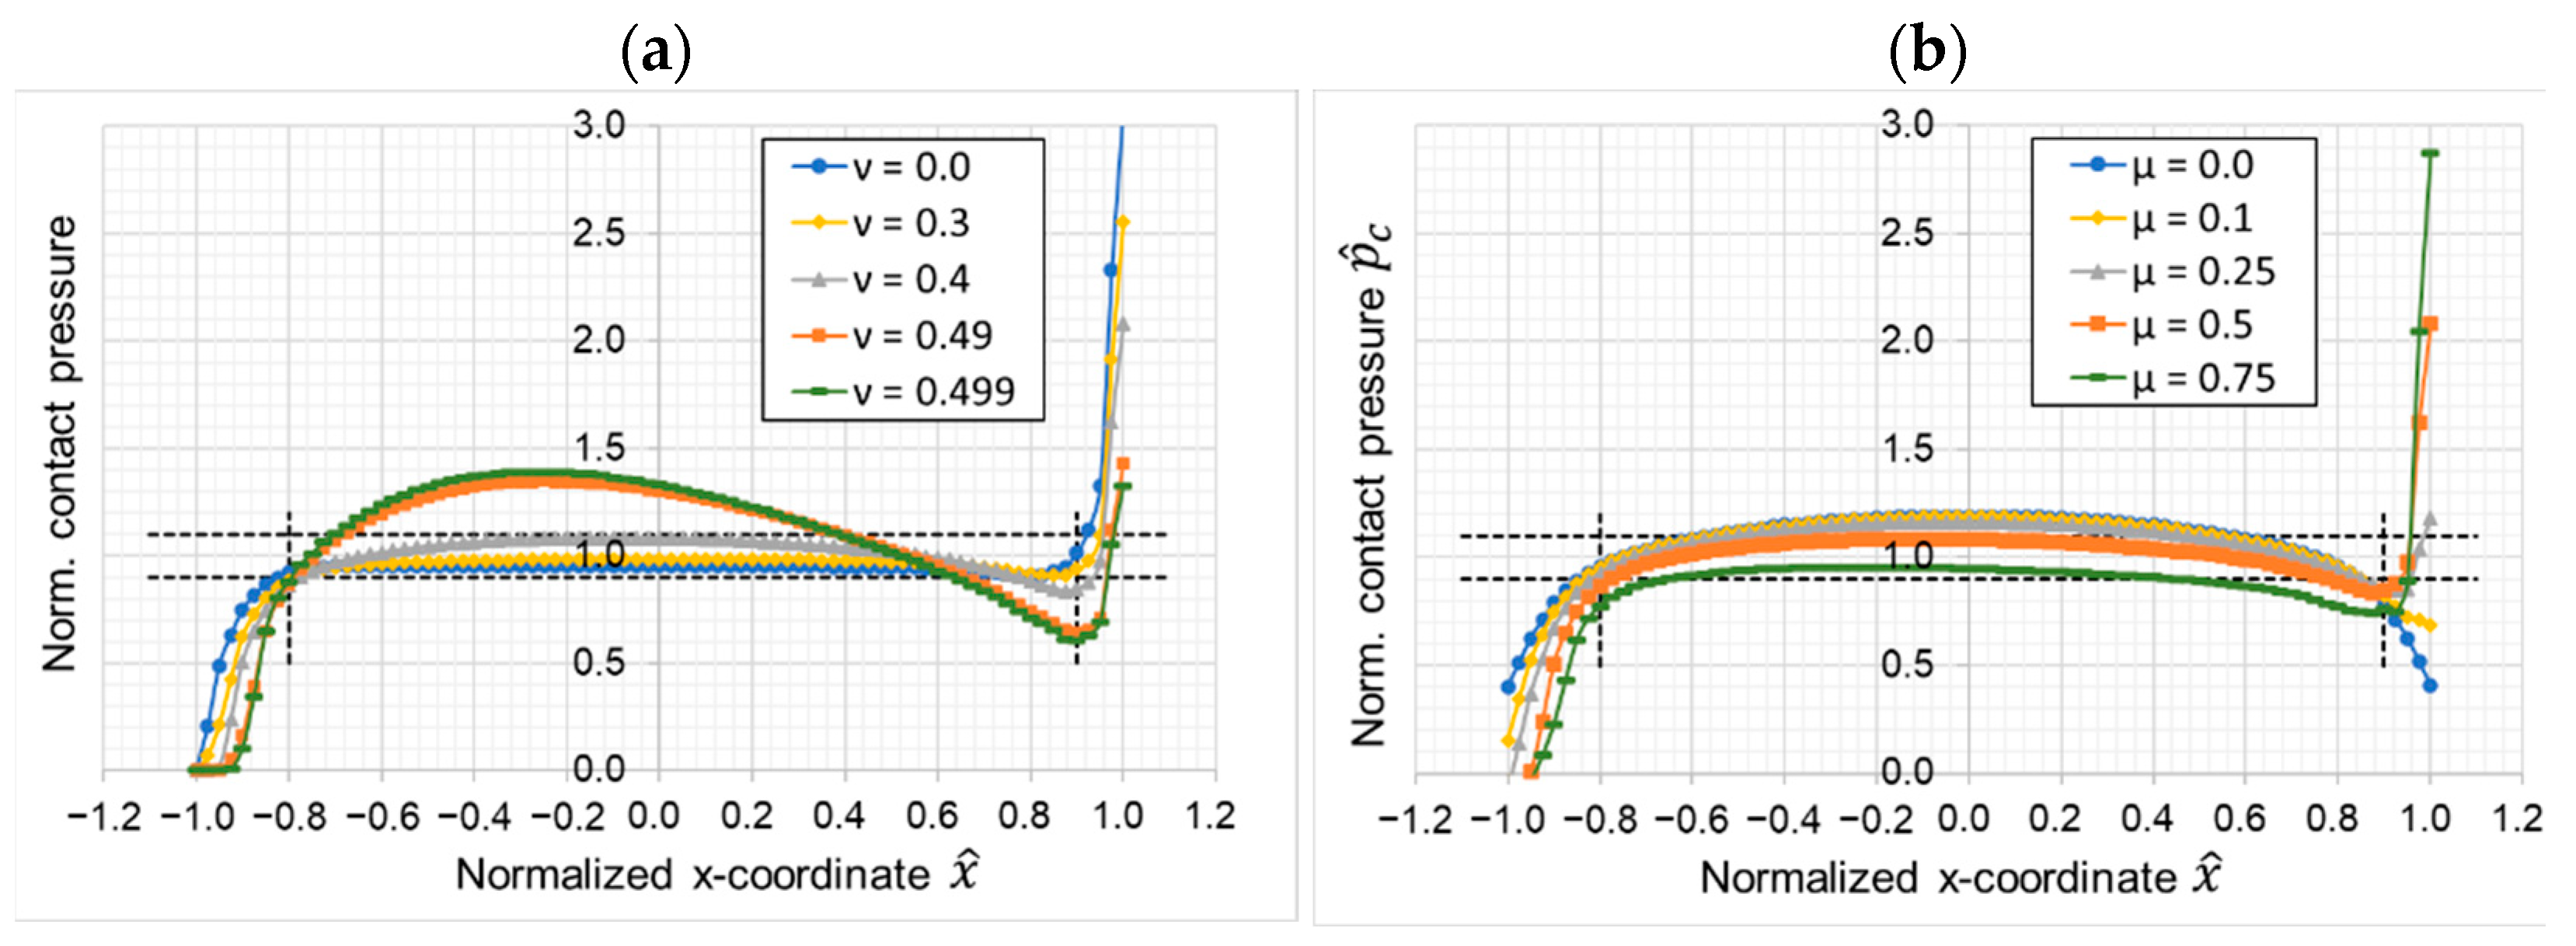
- Poisson’s ratio ν;
- CoF .
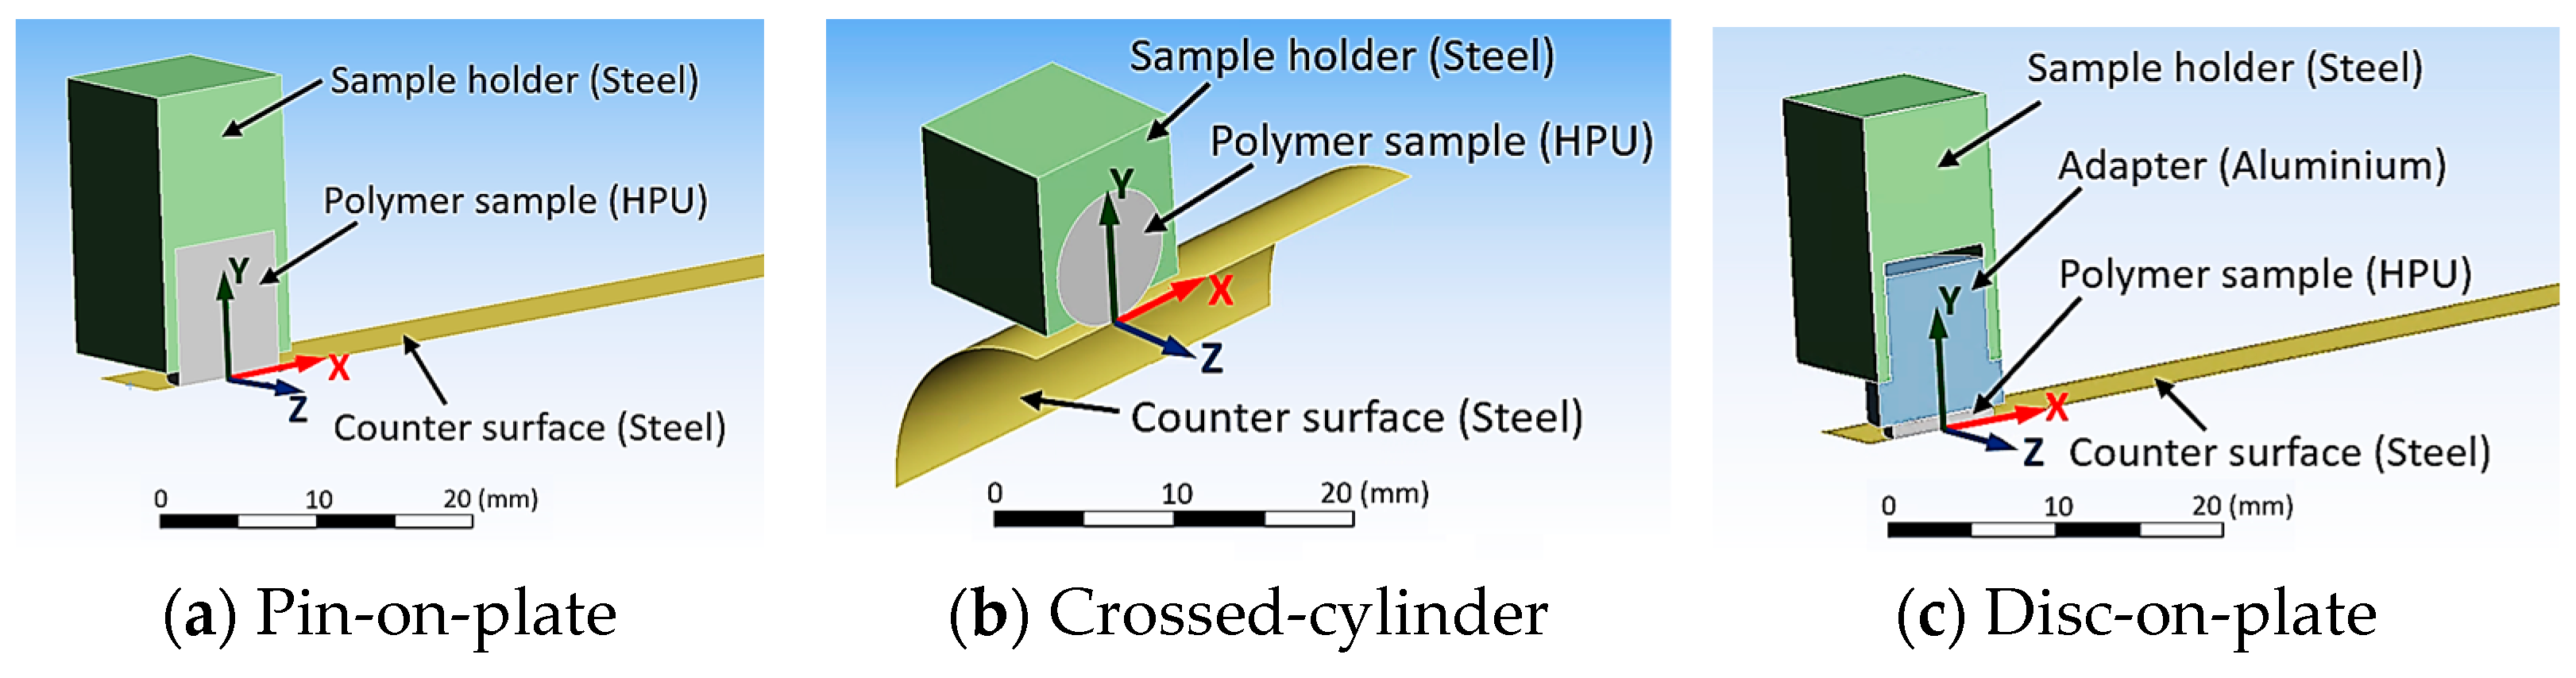
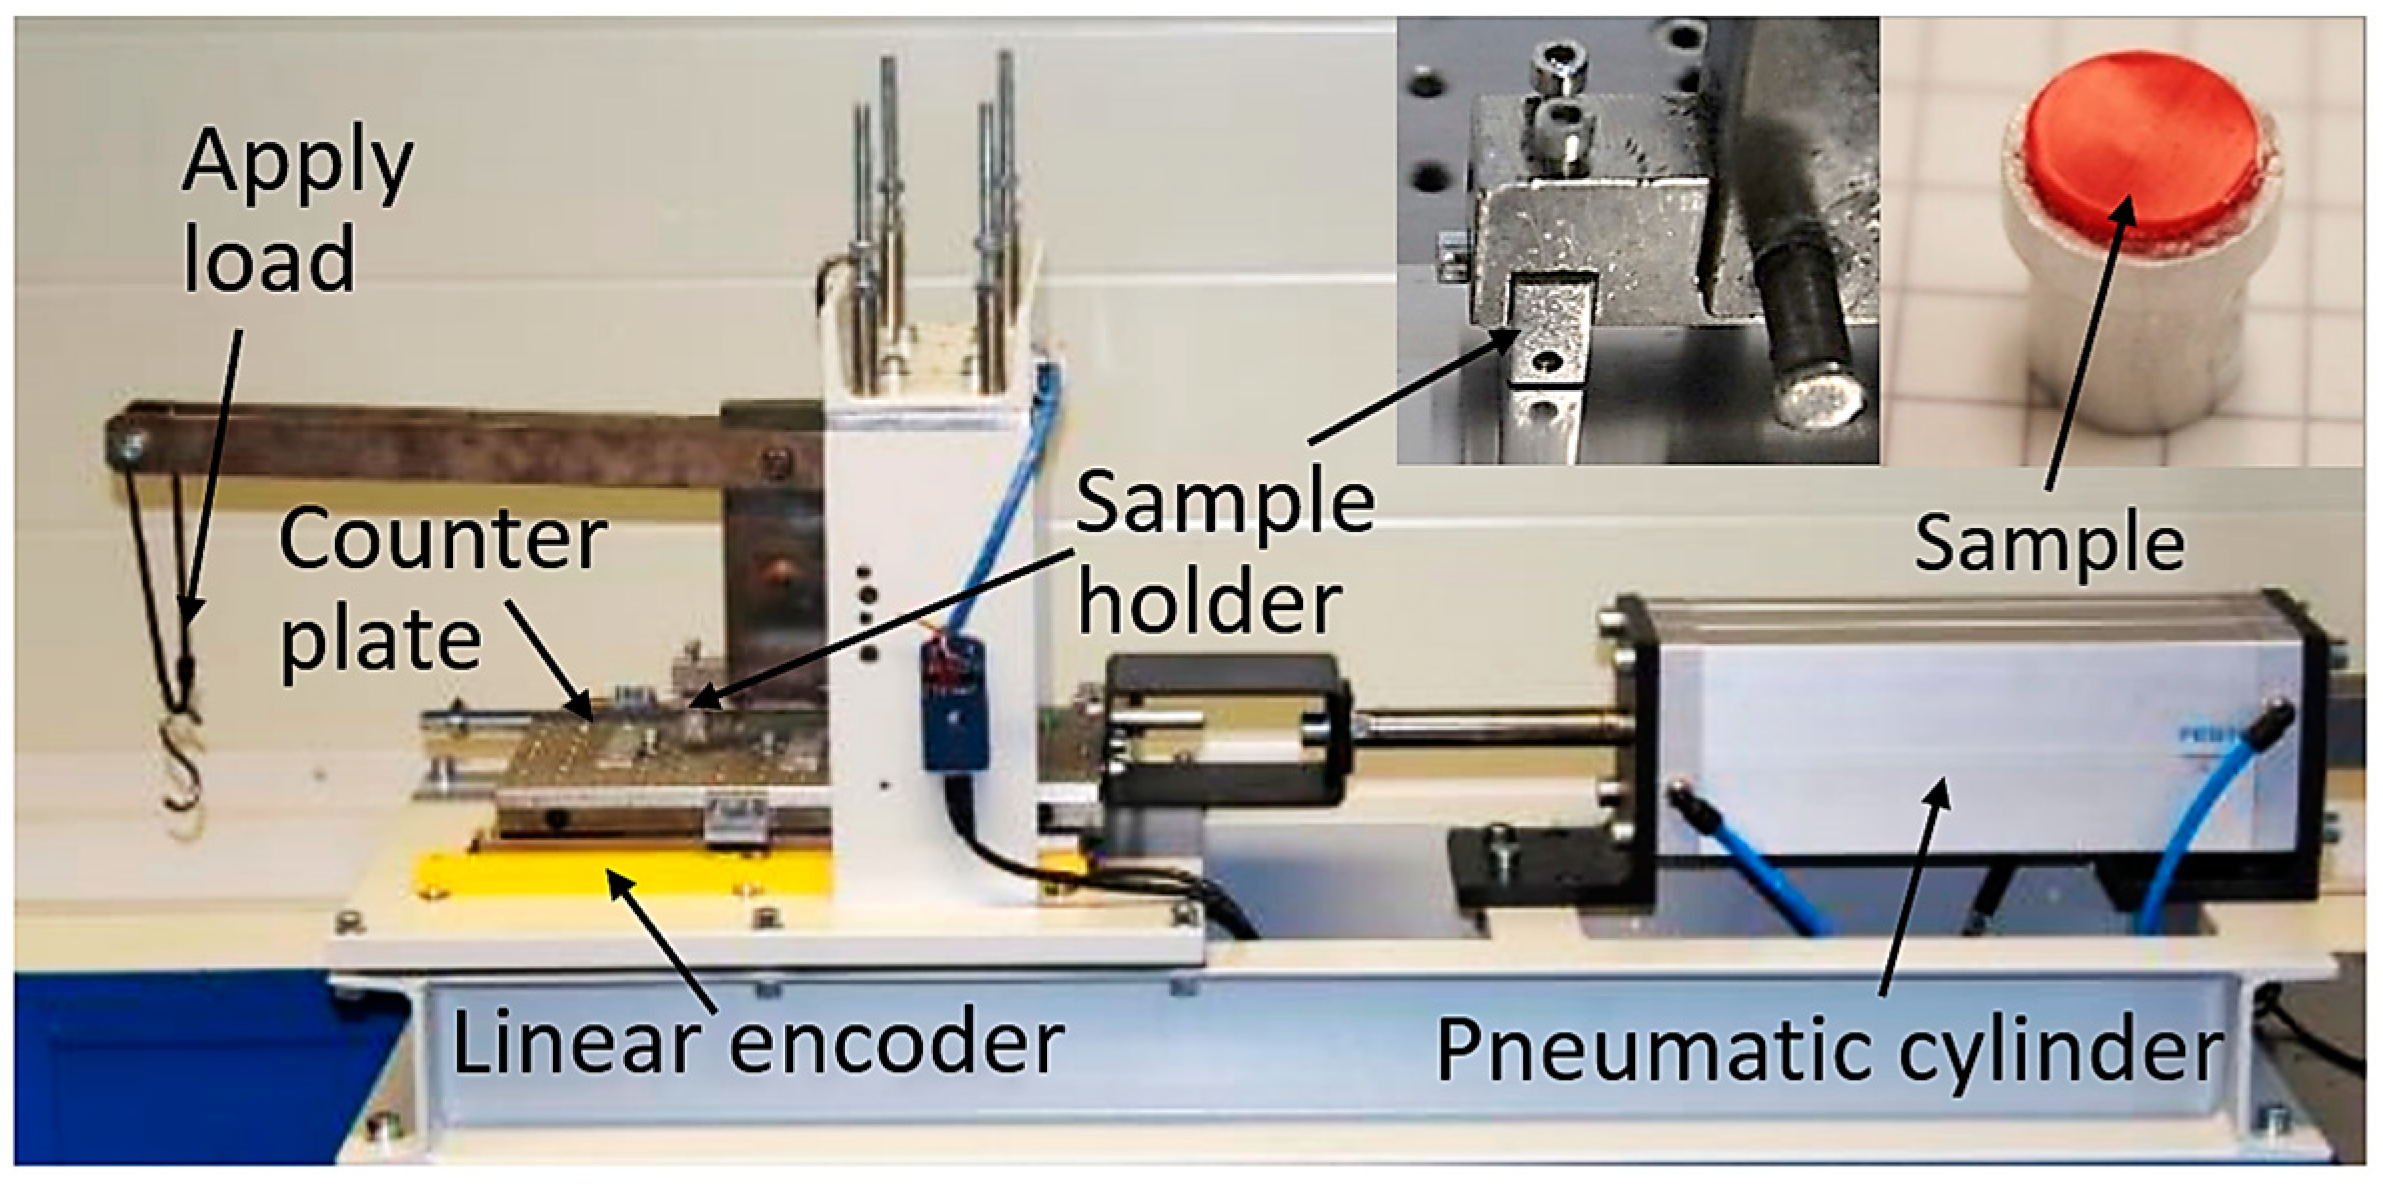
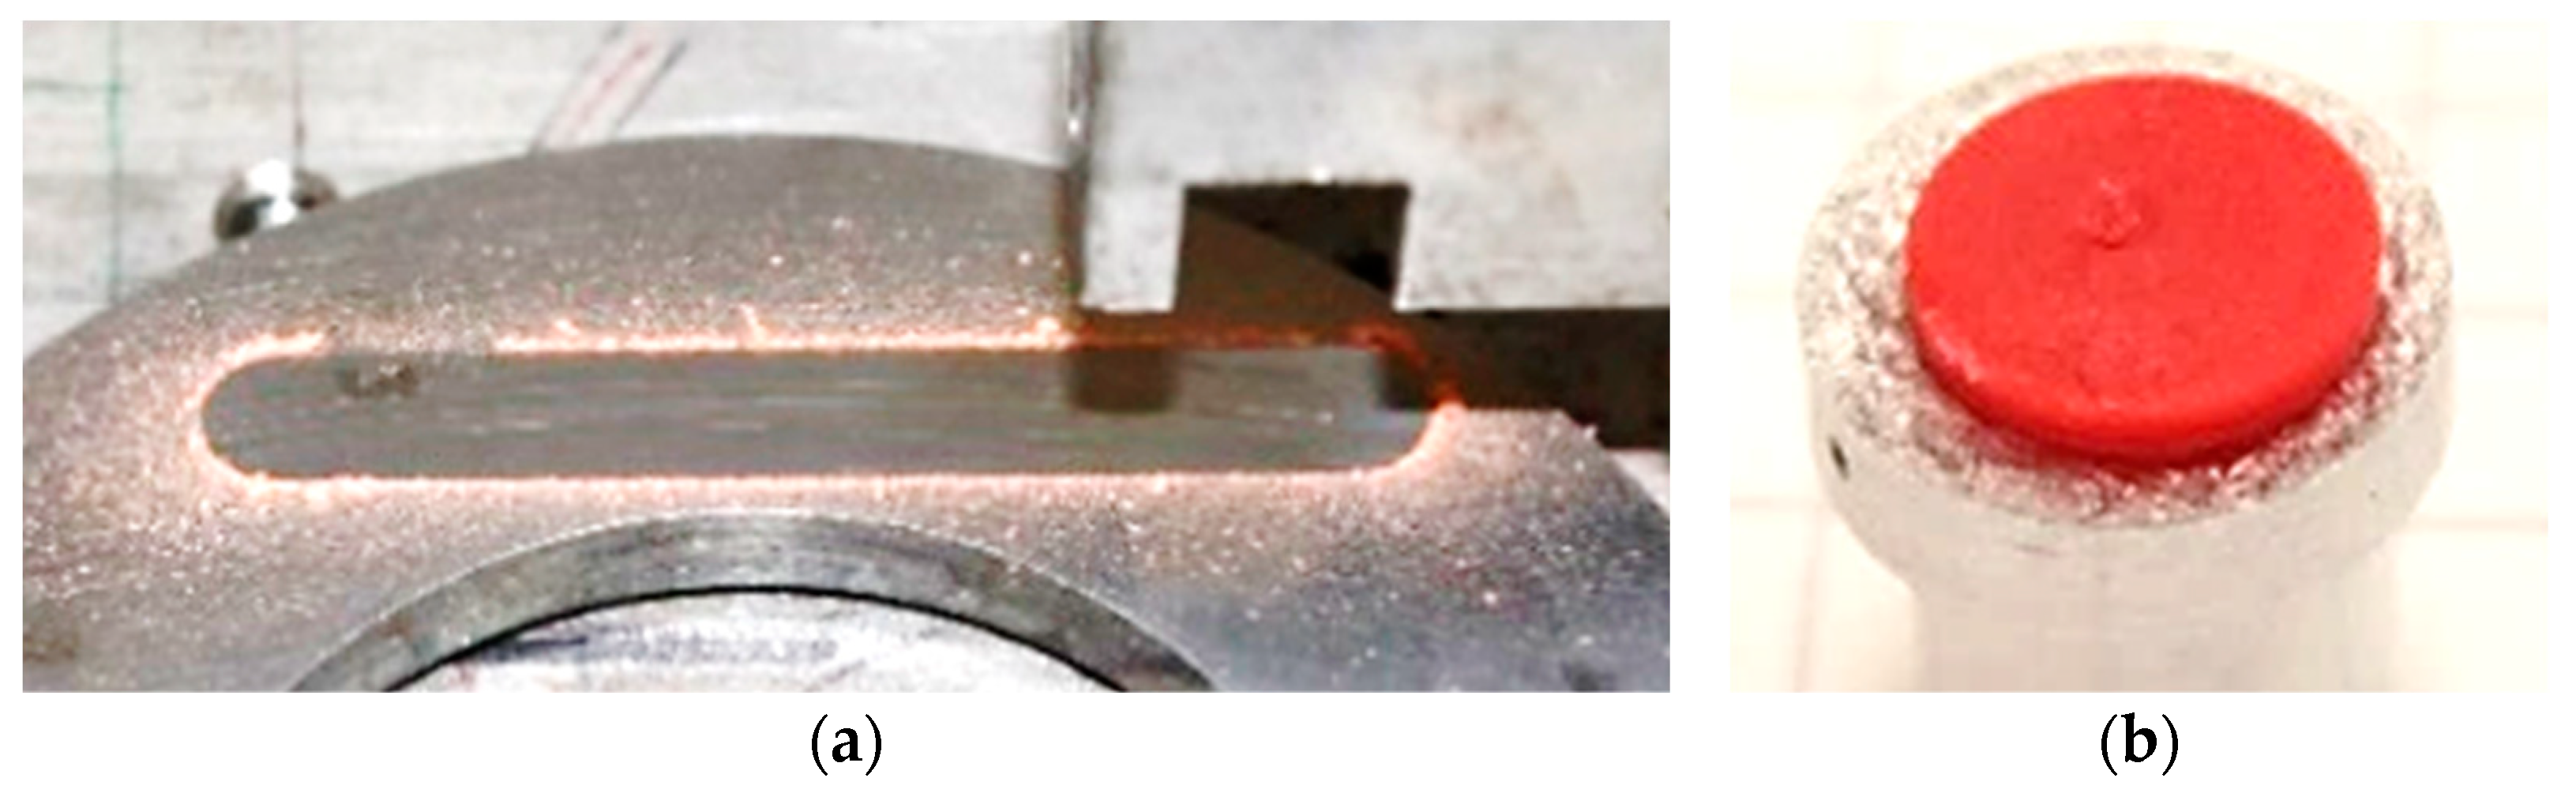
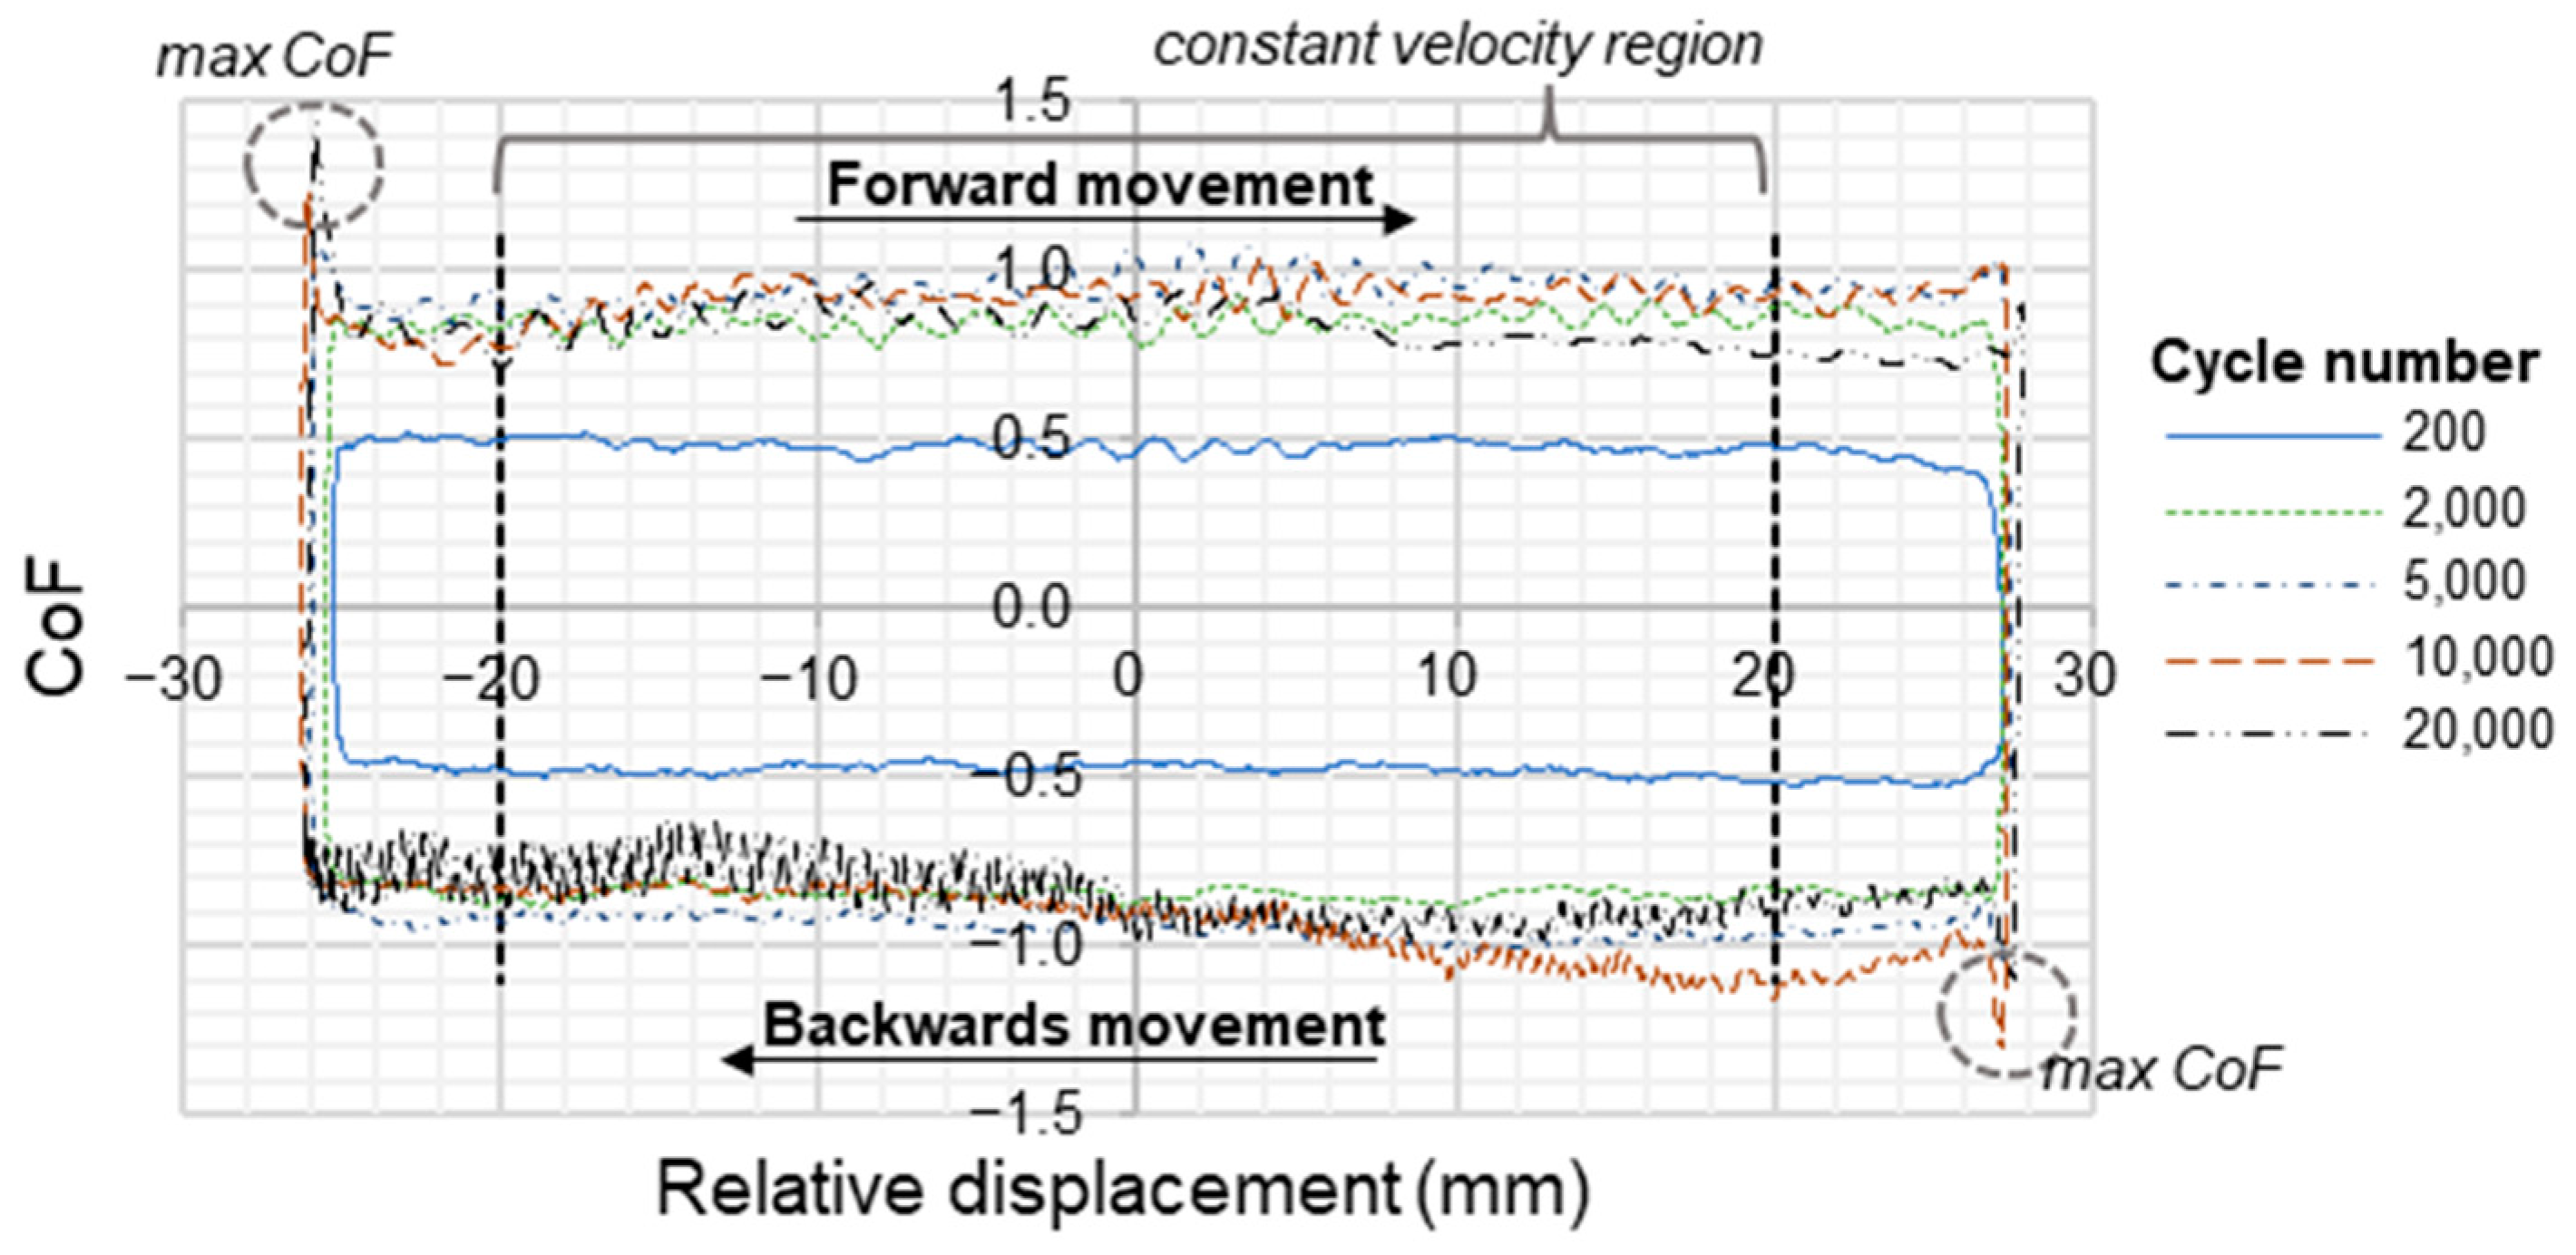
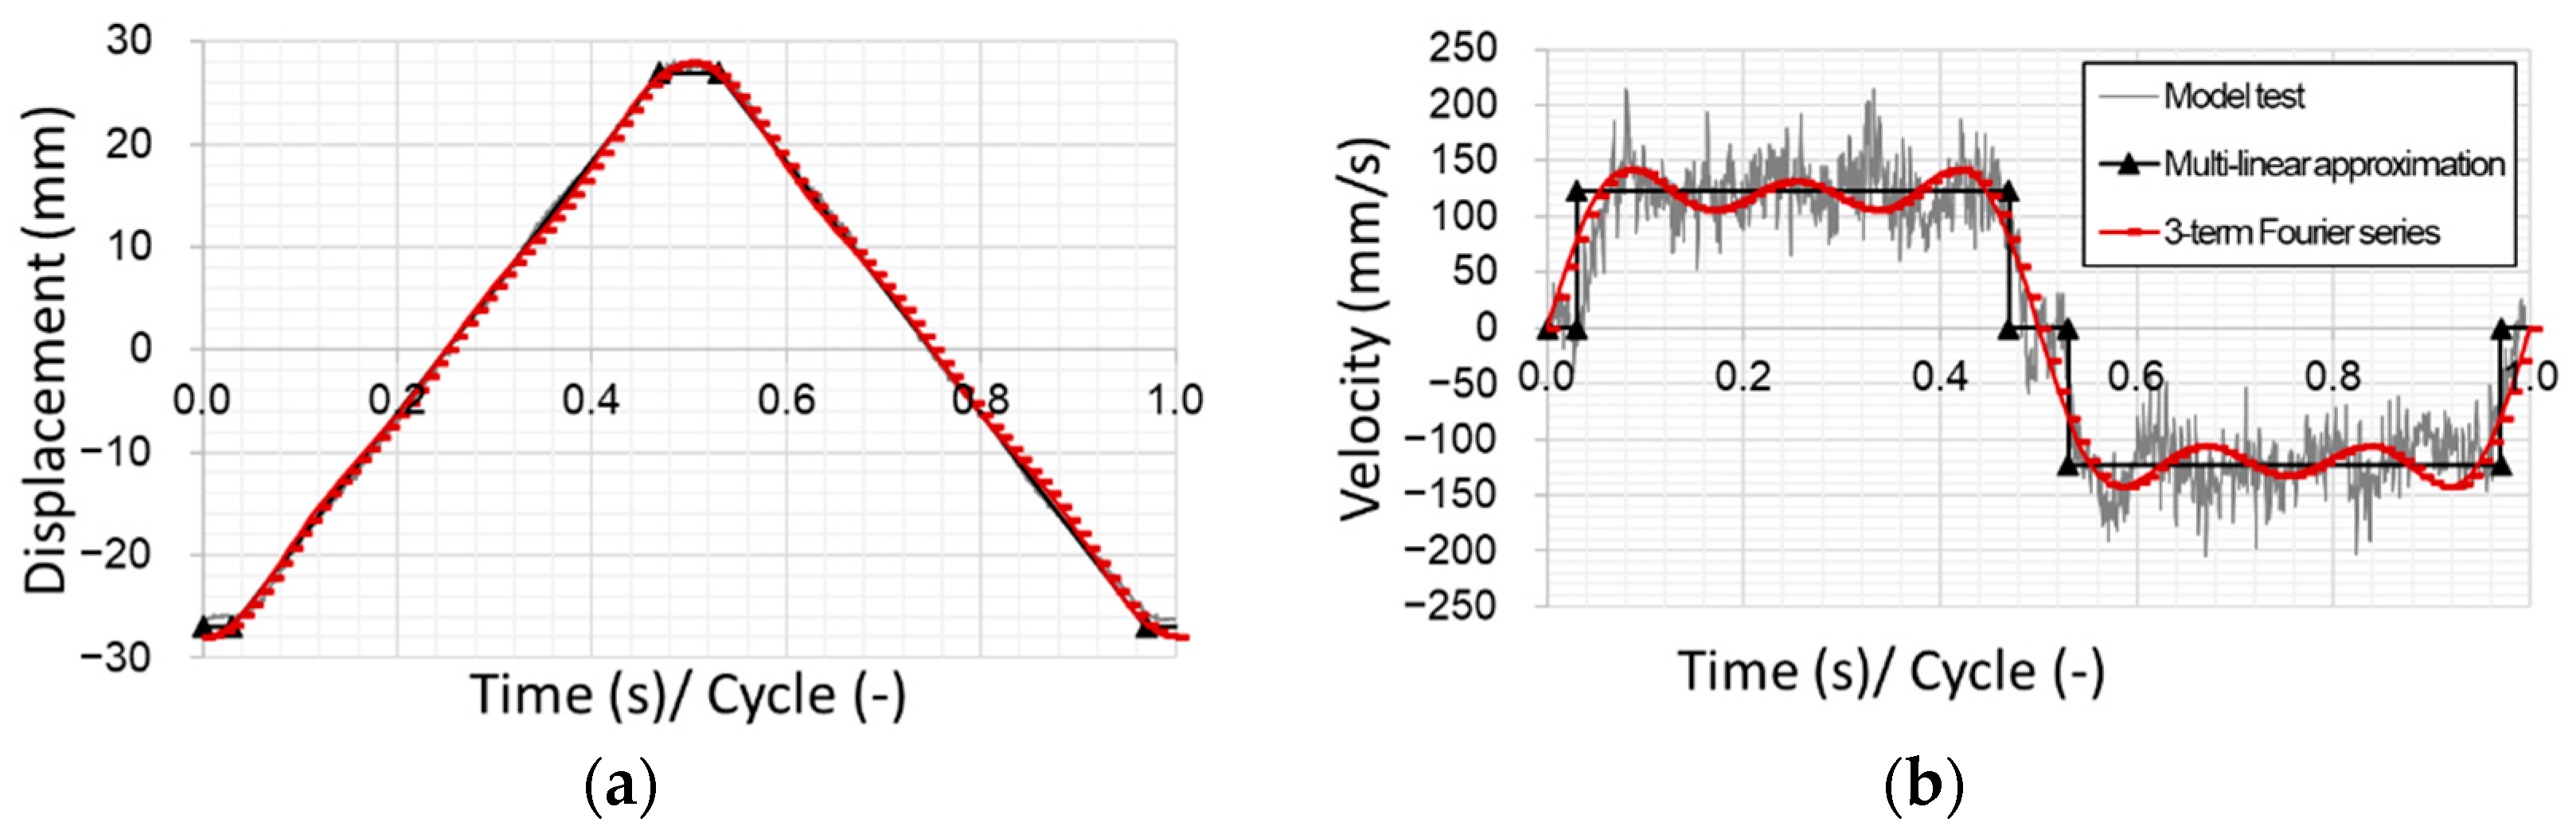
2.2.2. Experimental Tribological Model Tests
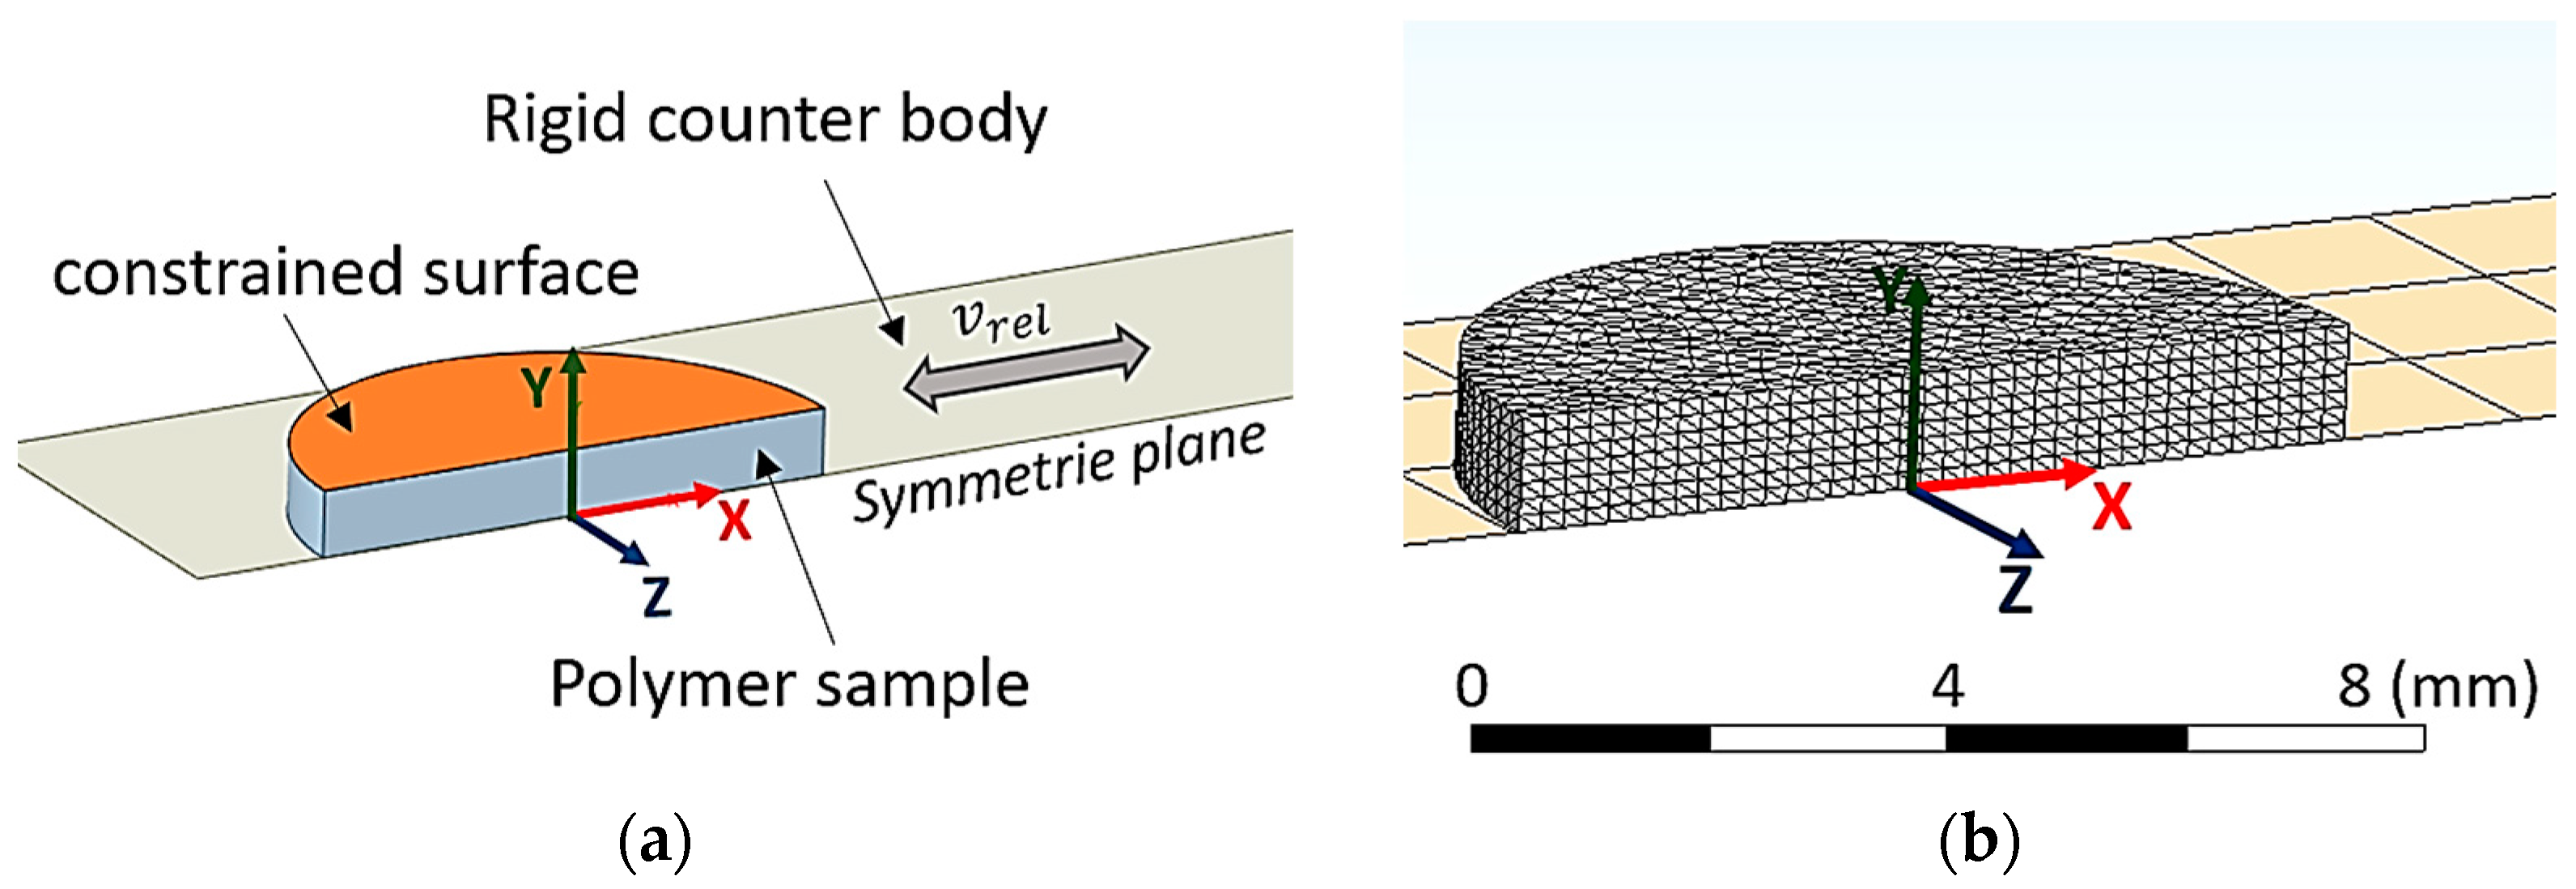
2.2.3. Verification of Model Test
3. Results
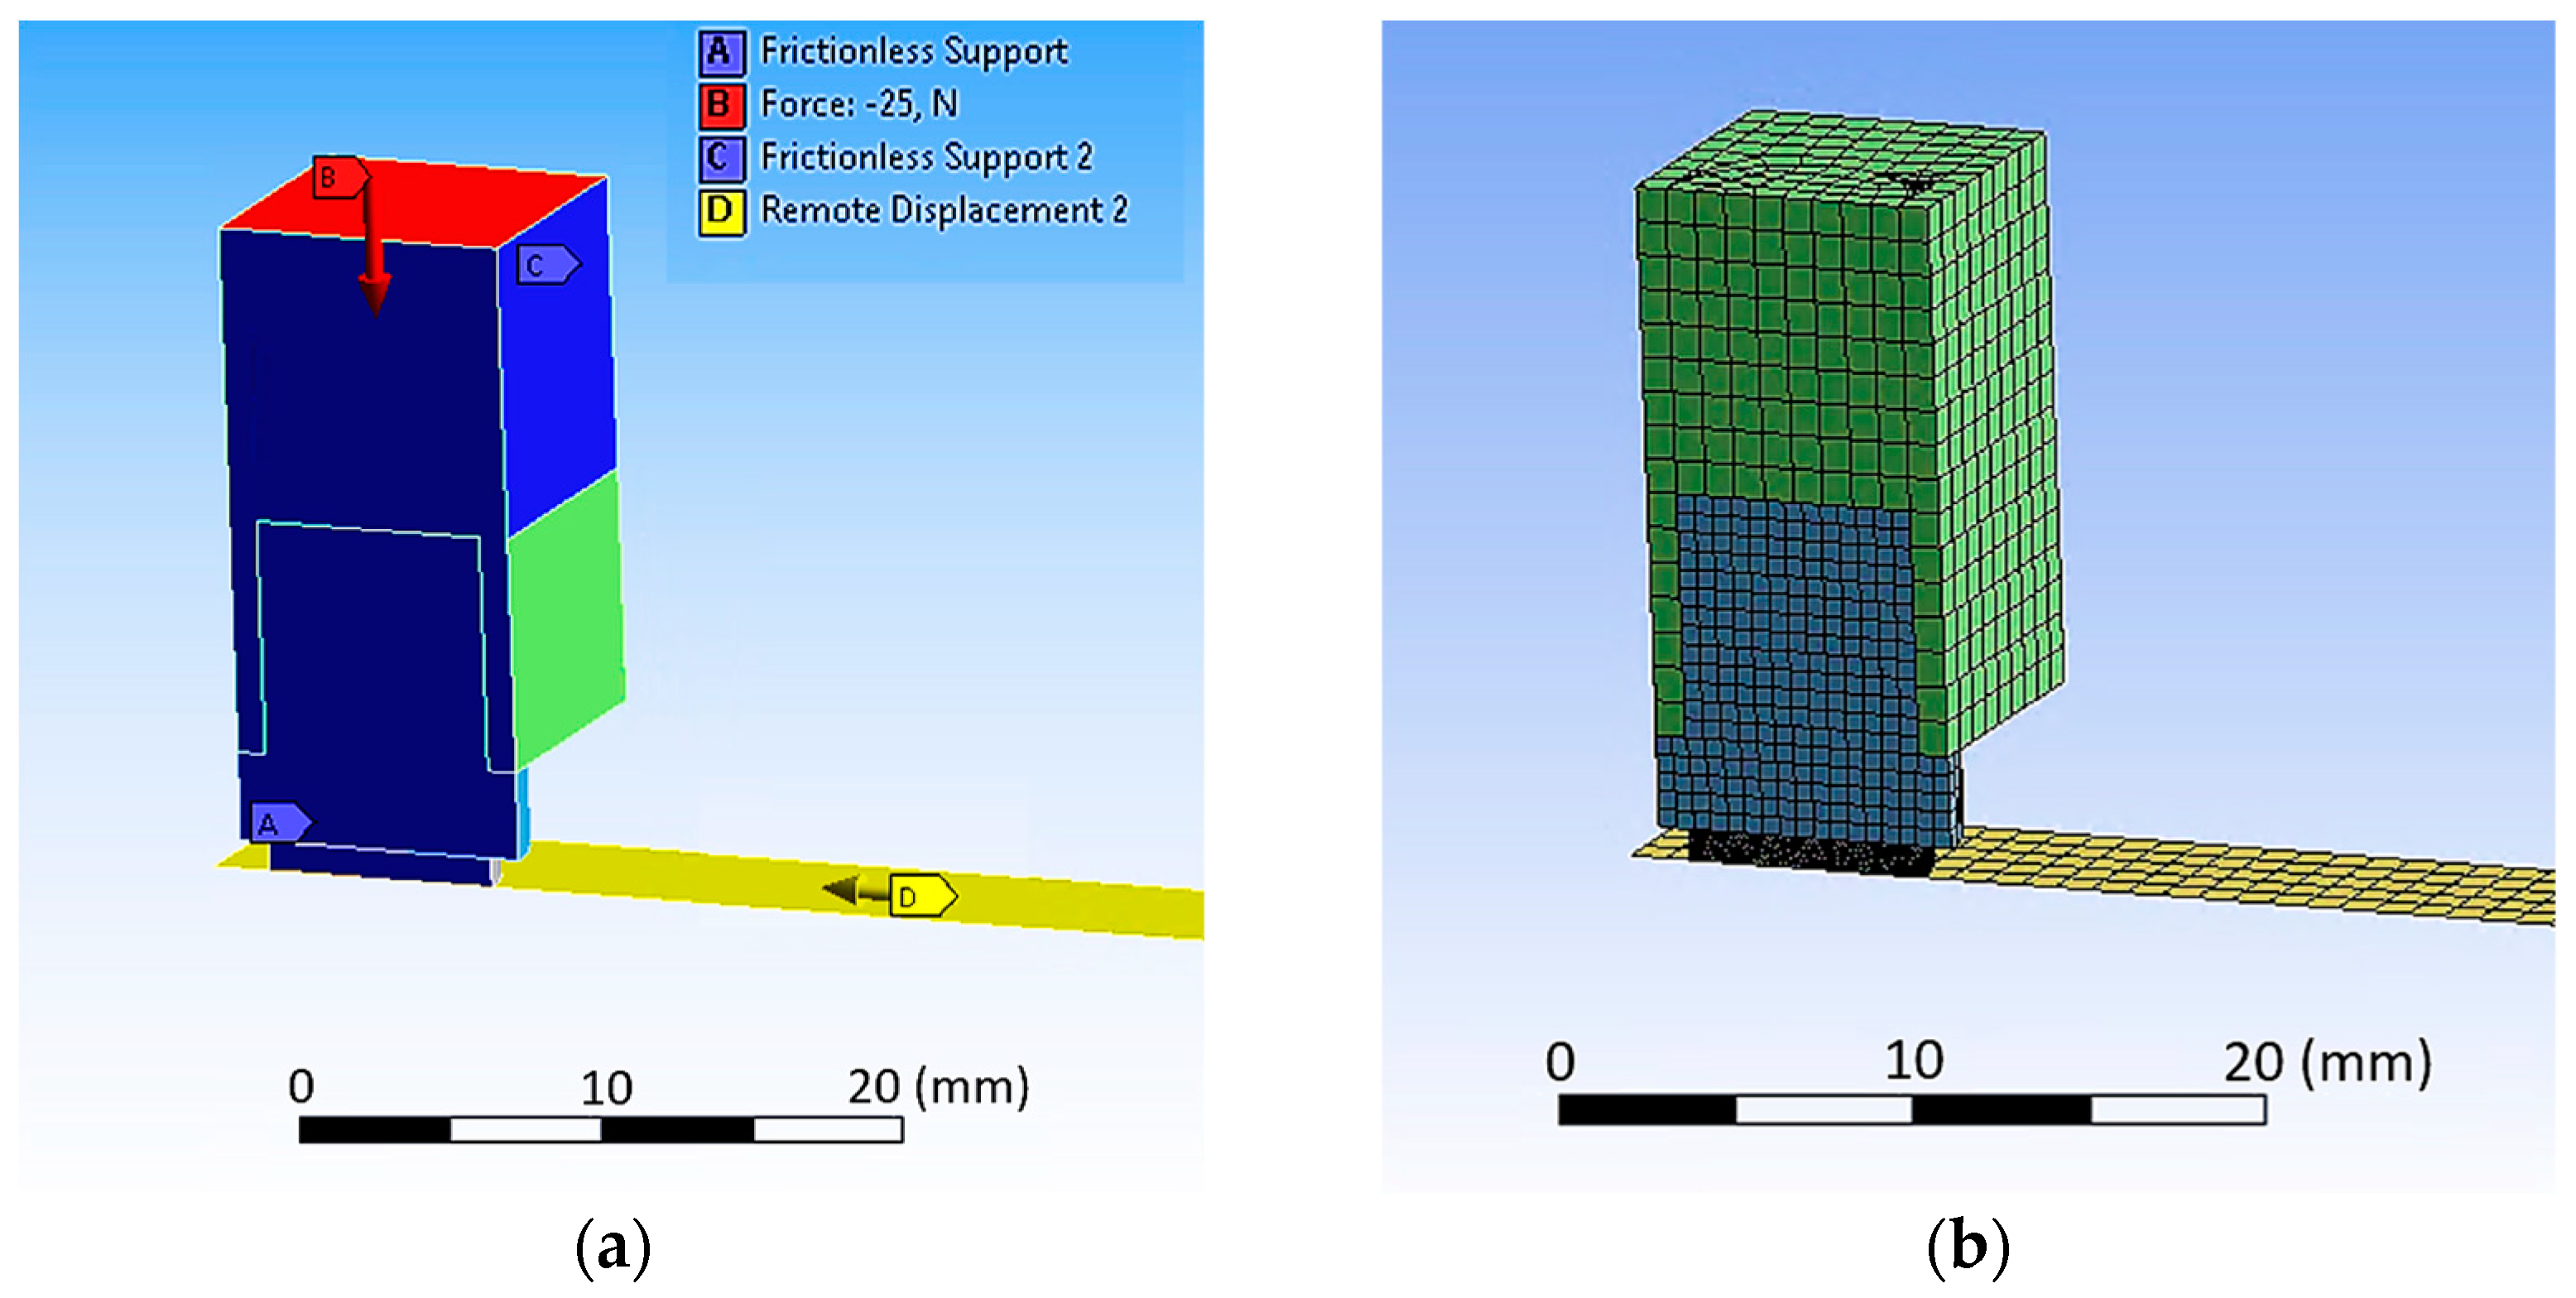
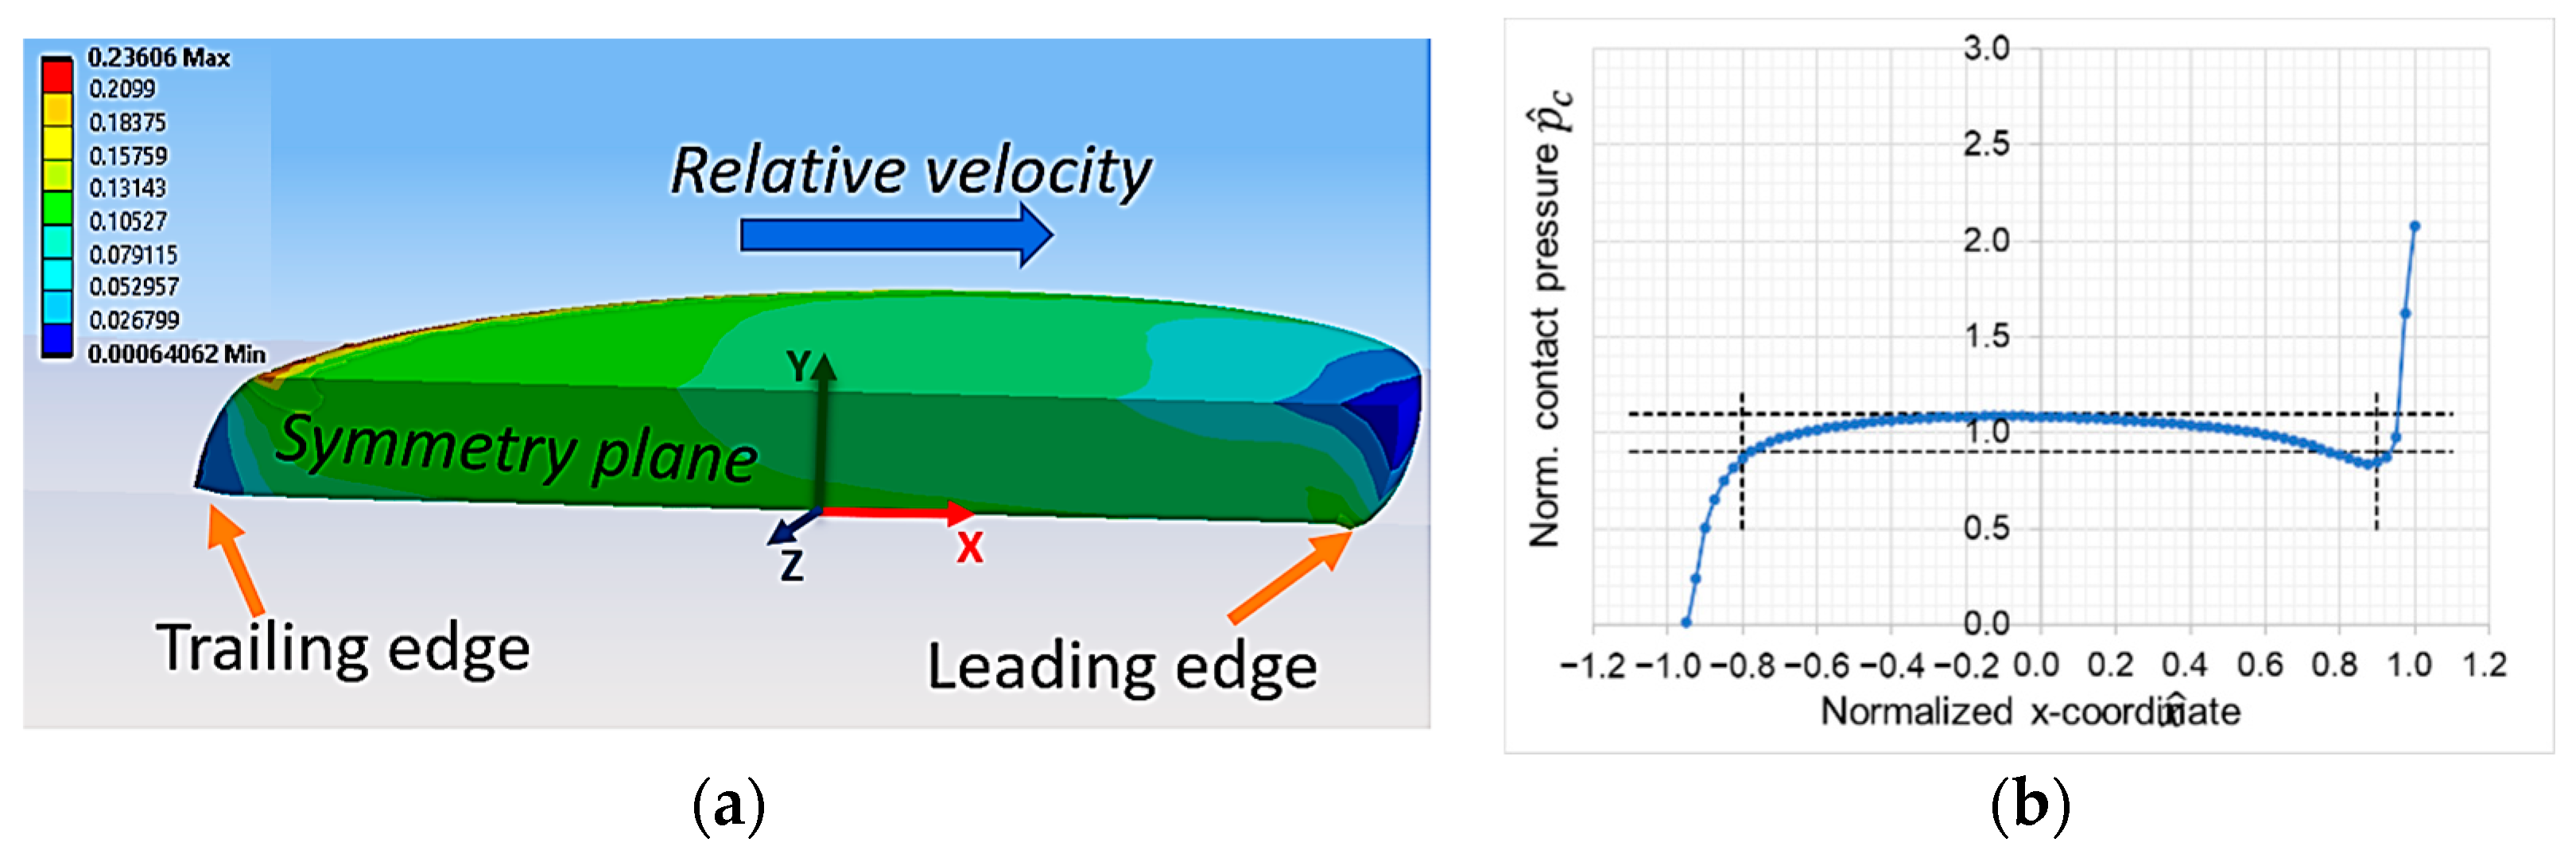
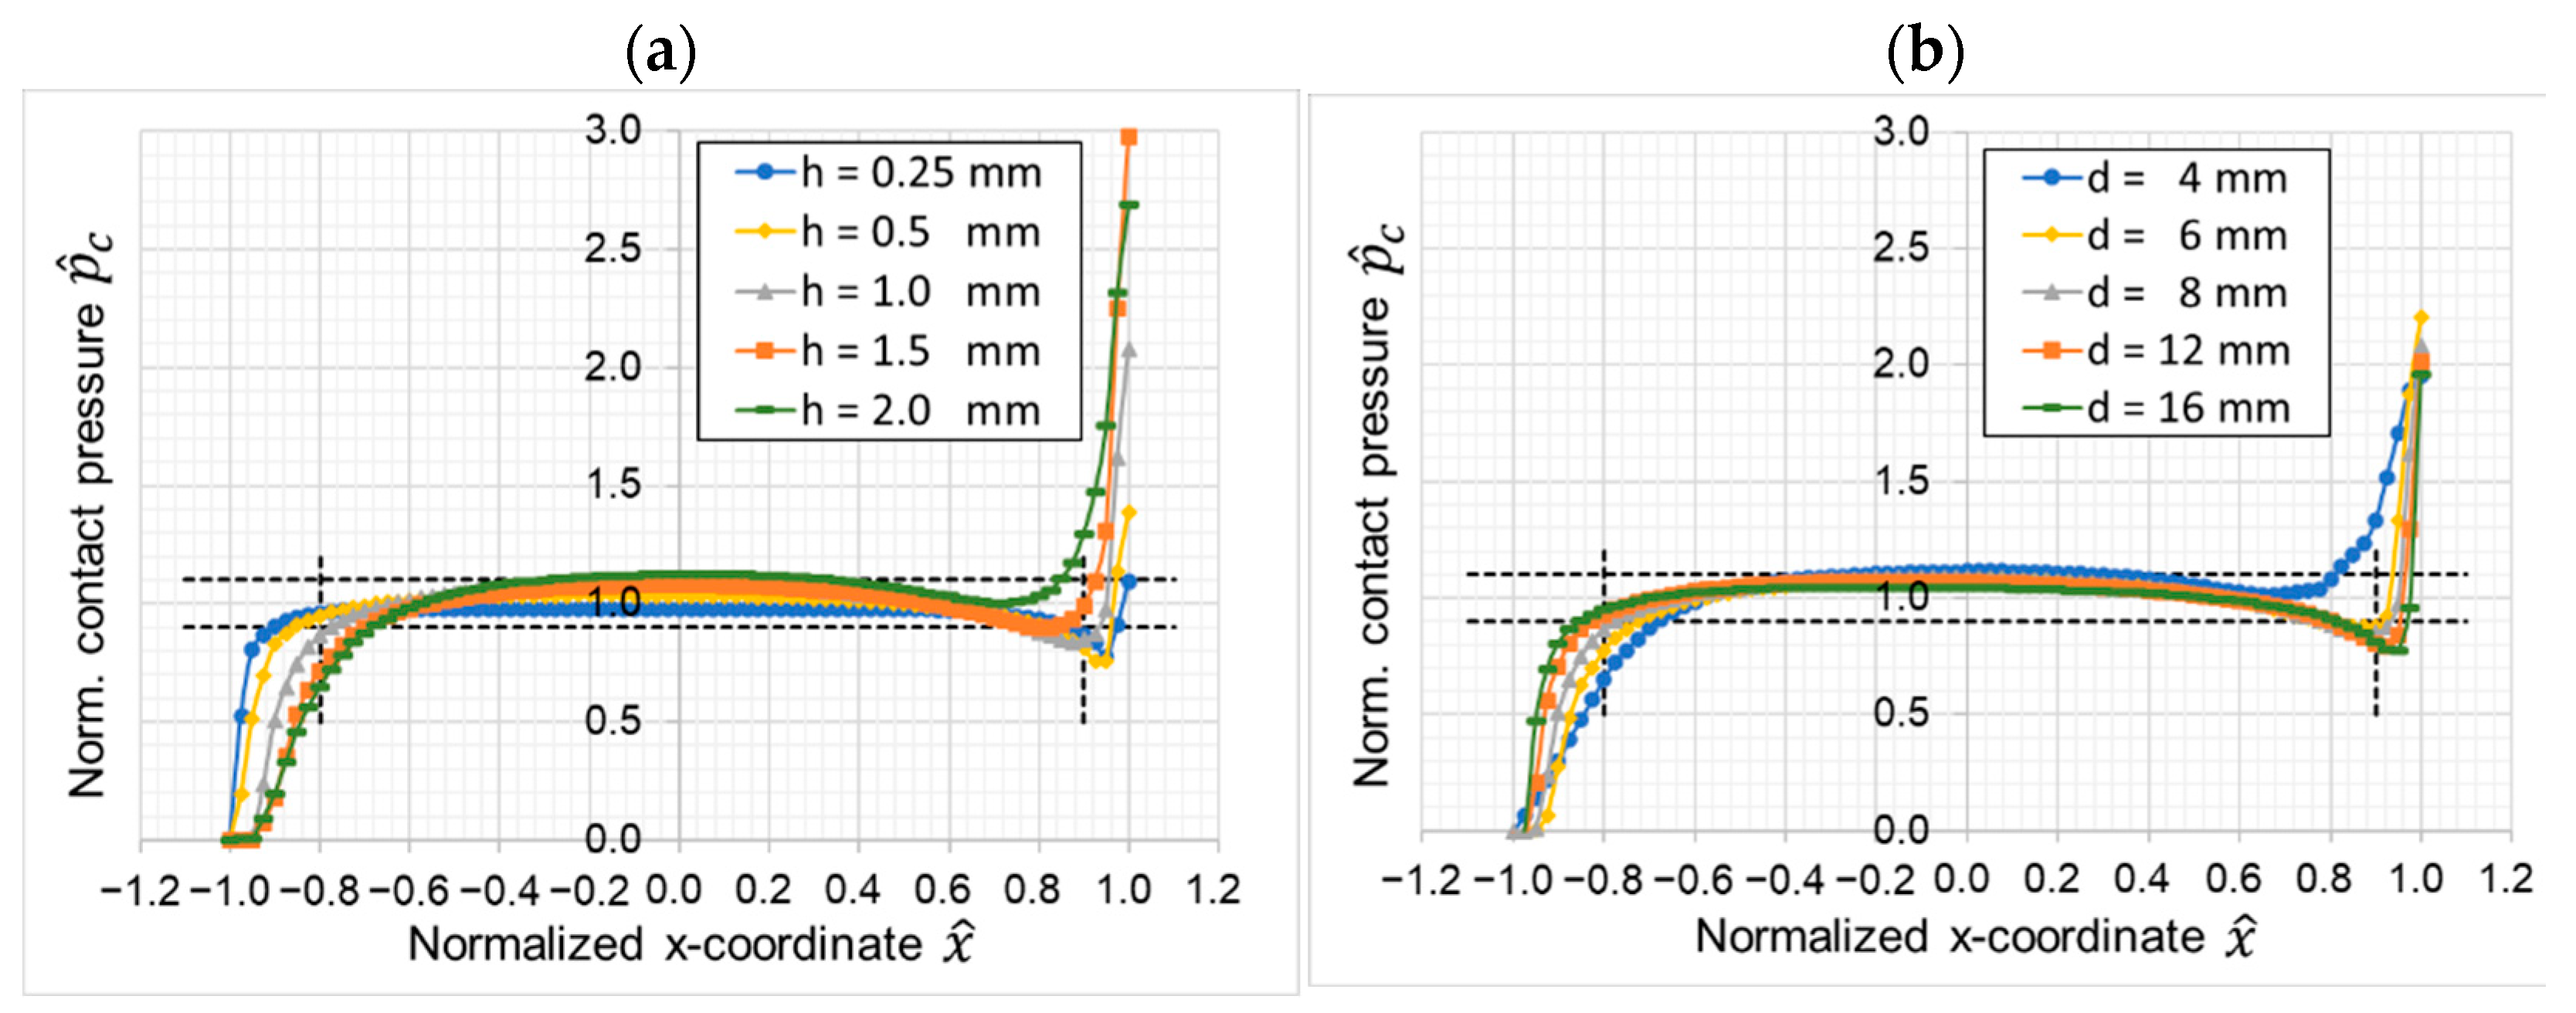
3.1. Design Study and Derived Empirical Relationships
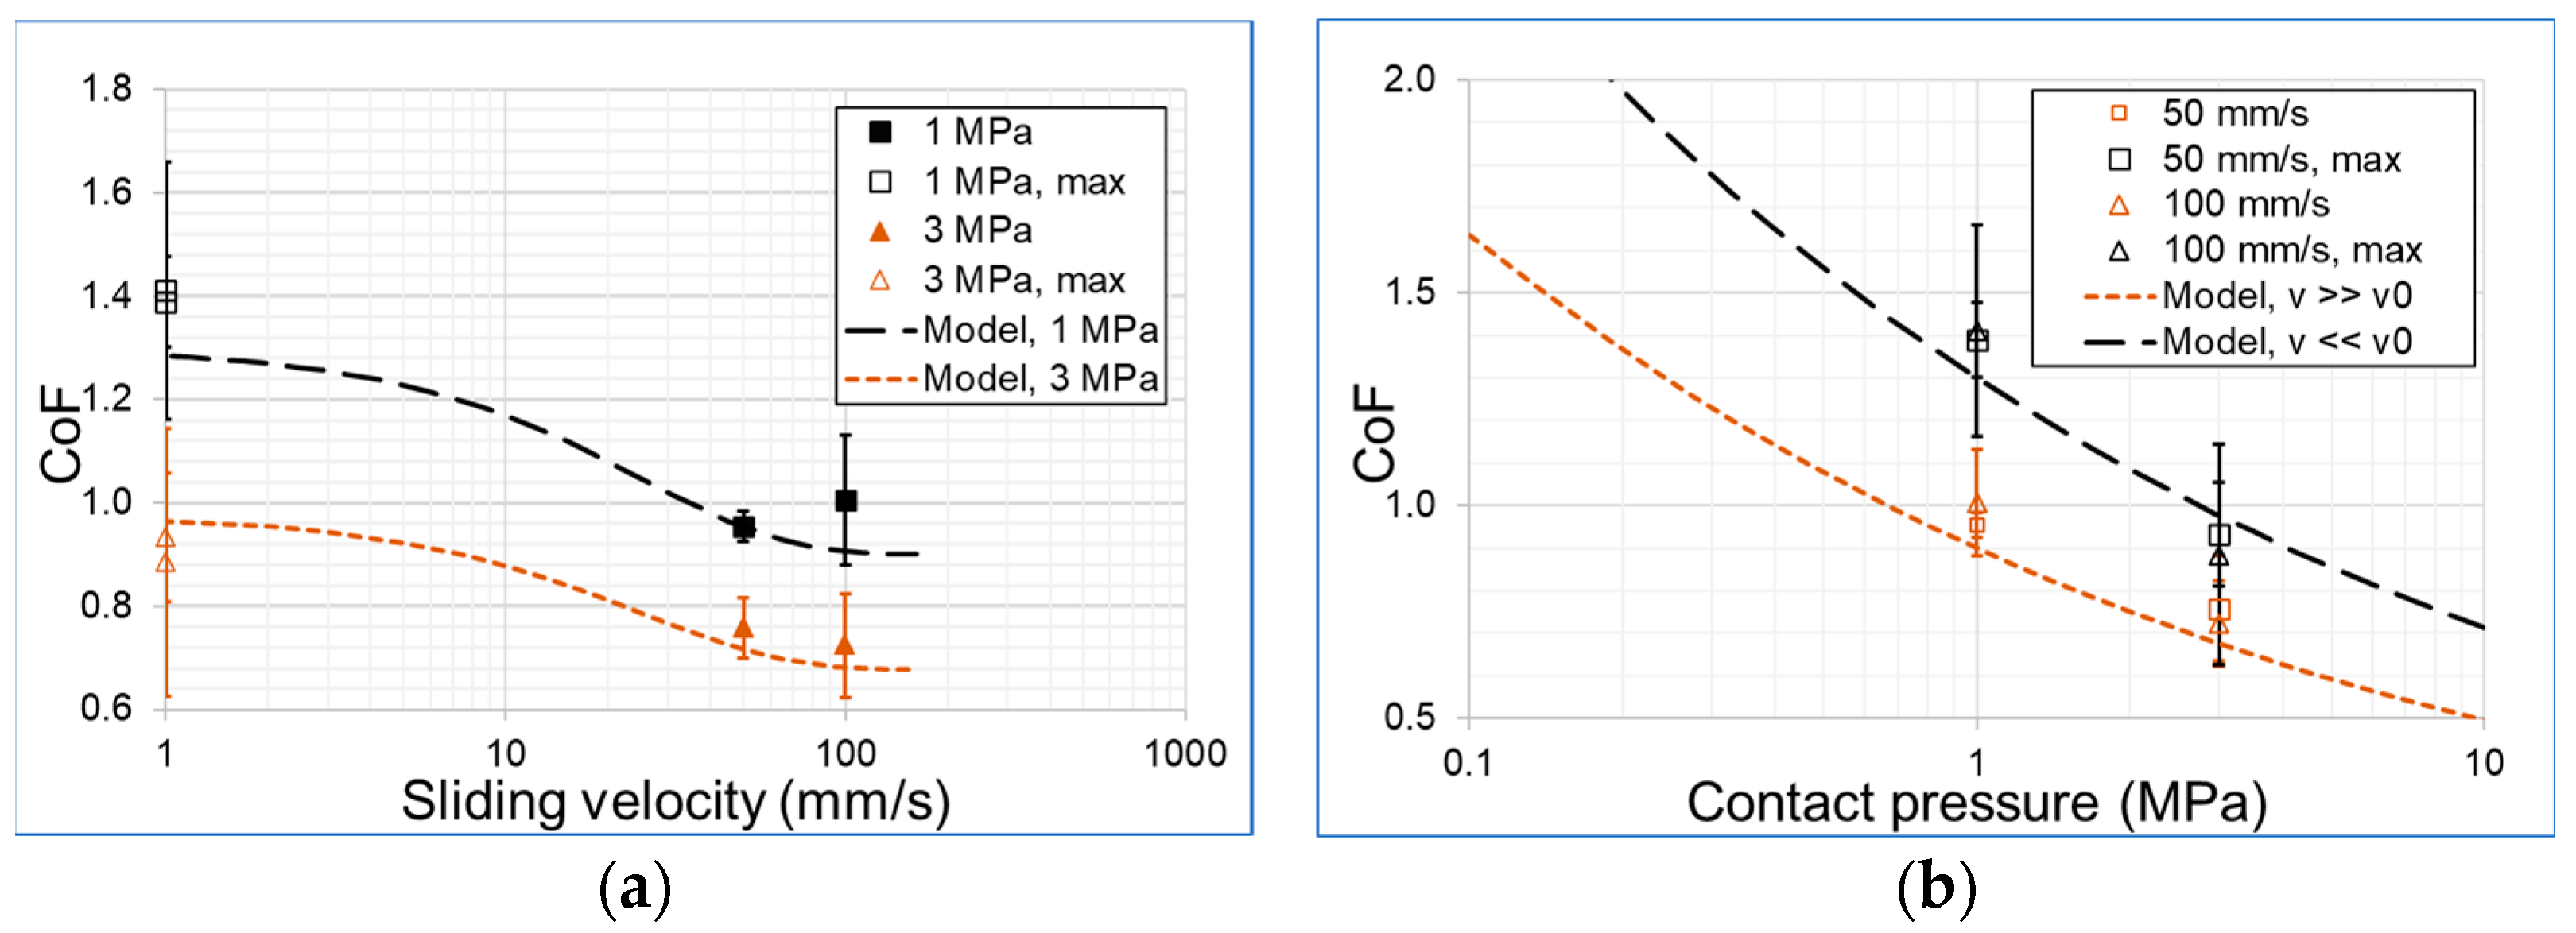
3.2. Experimental Results and Friction Model
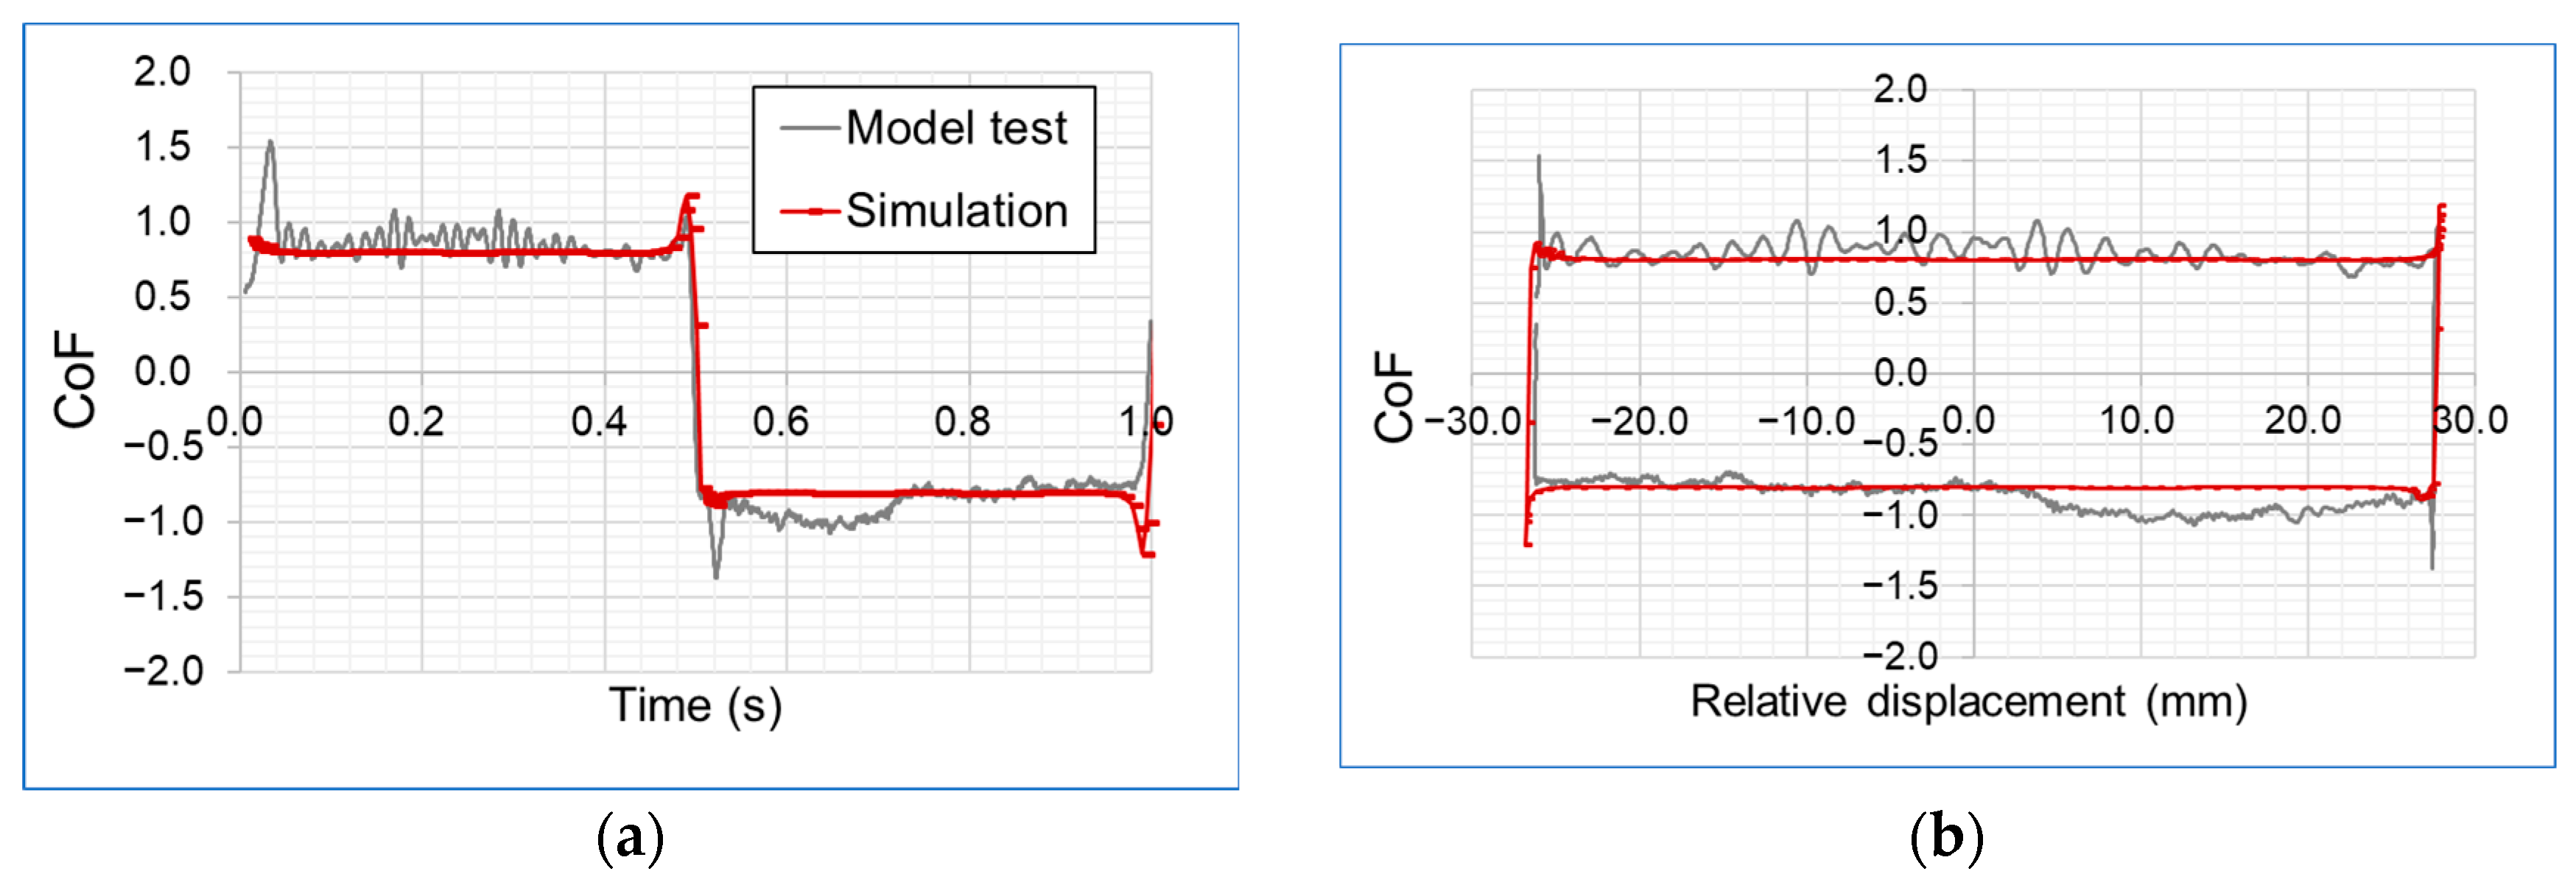
3.3. Verification
4. Discussion
4.1. Numerical Design Study and Verification of the Frictional Model
4.2. Standardization of Tests for Upscaling Material Performance
5. Conclusions
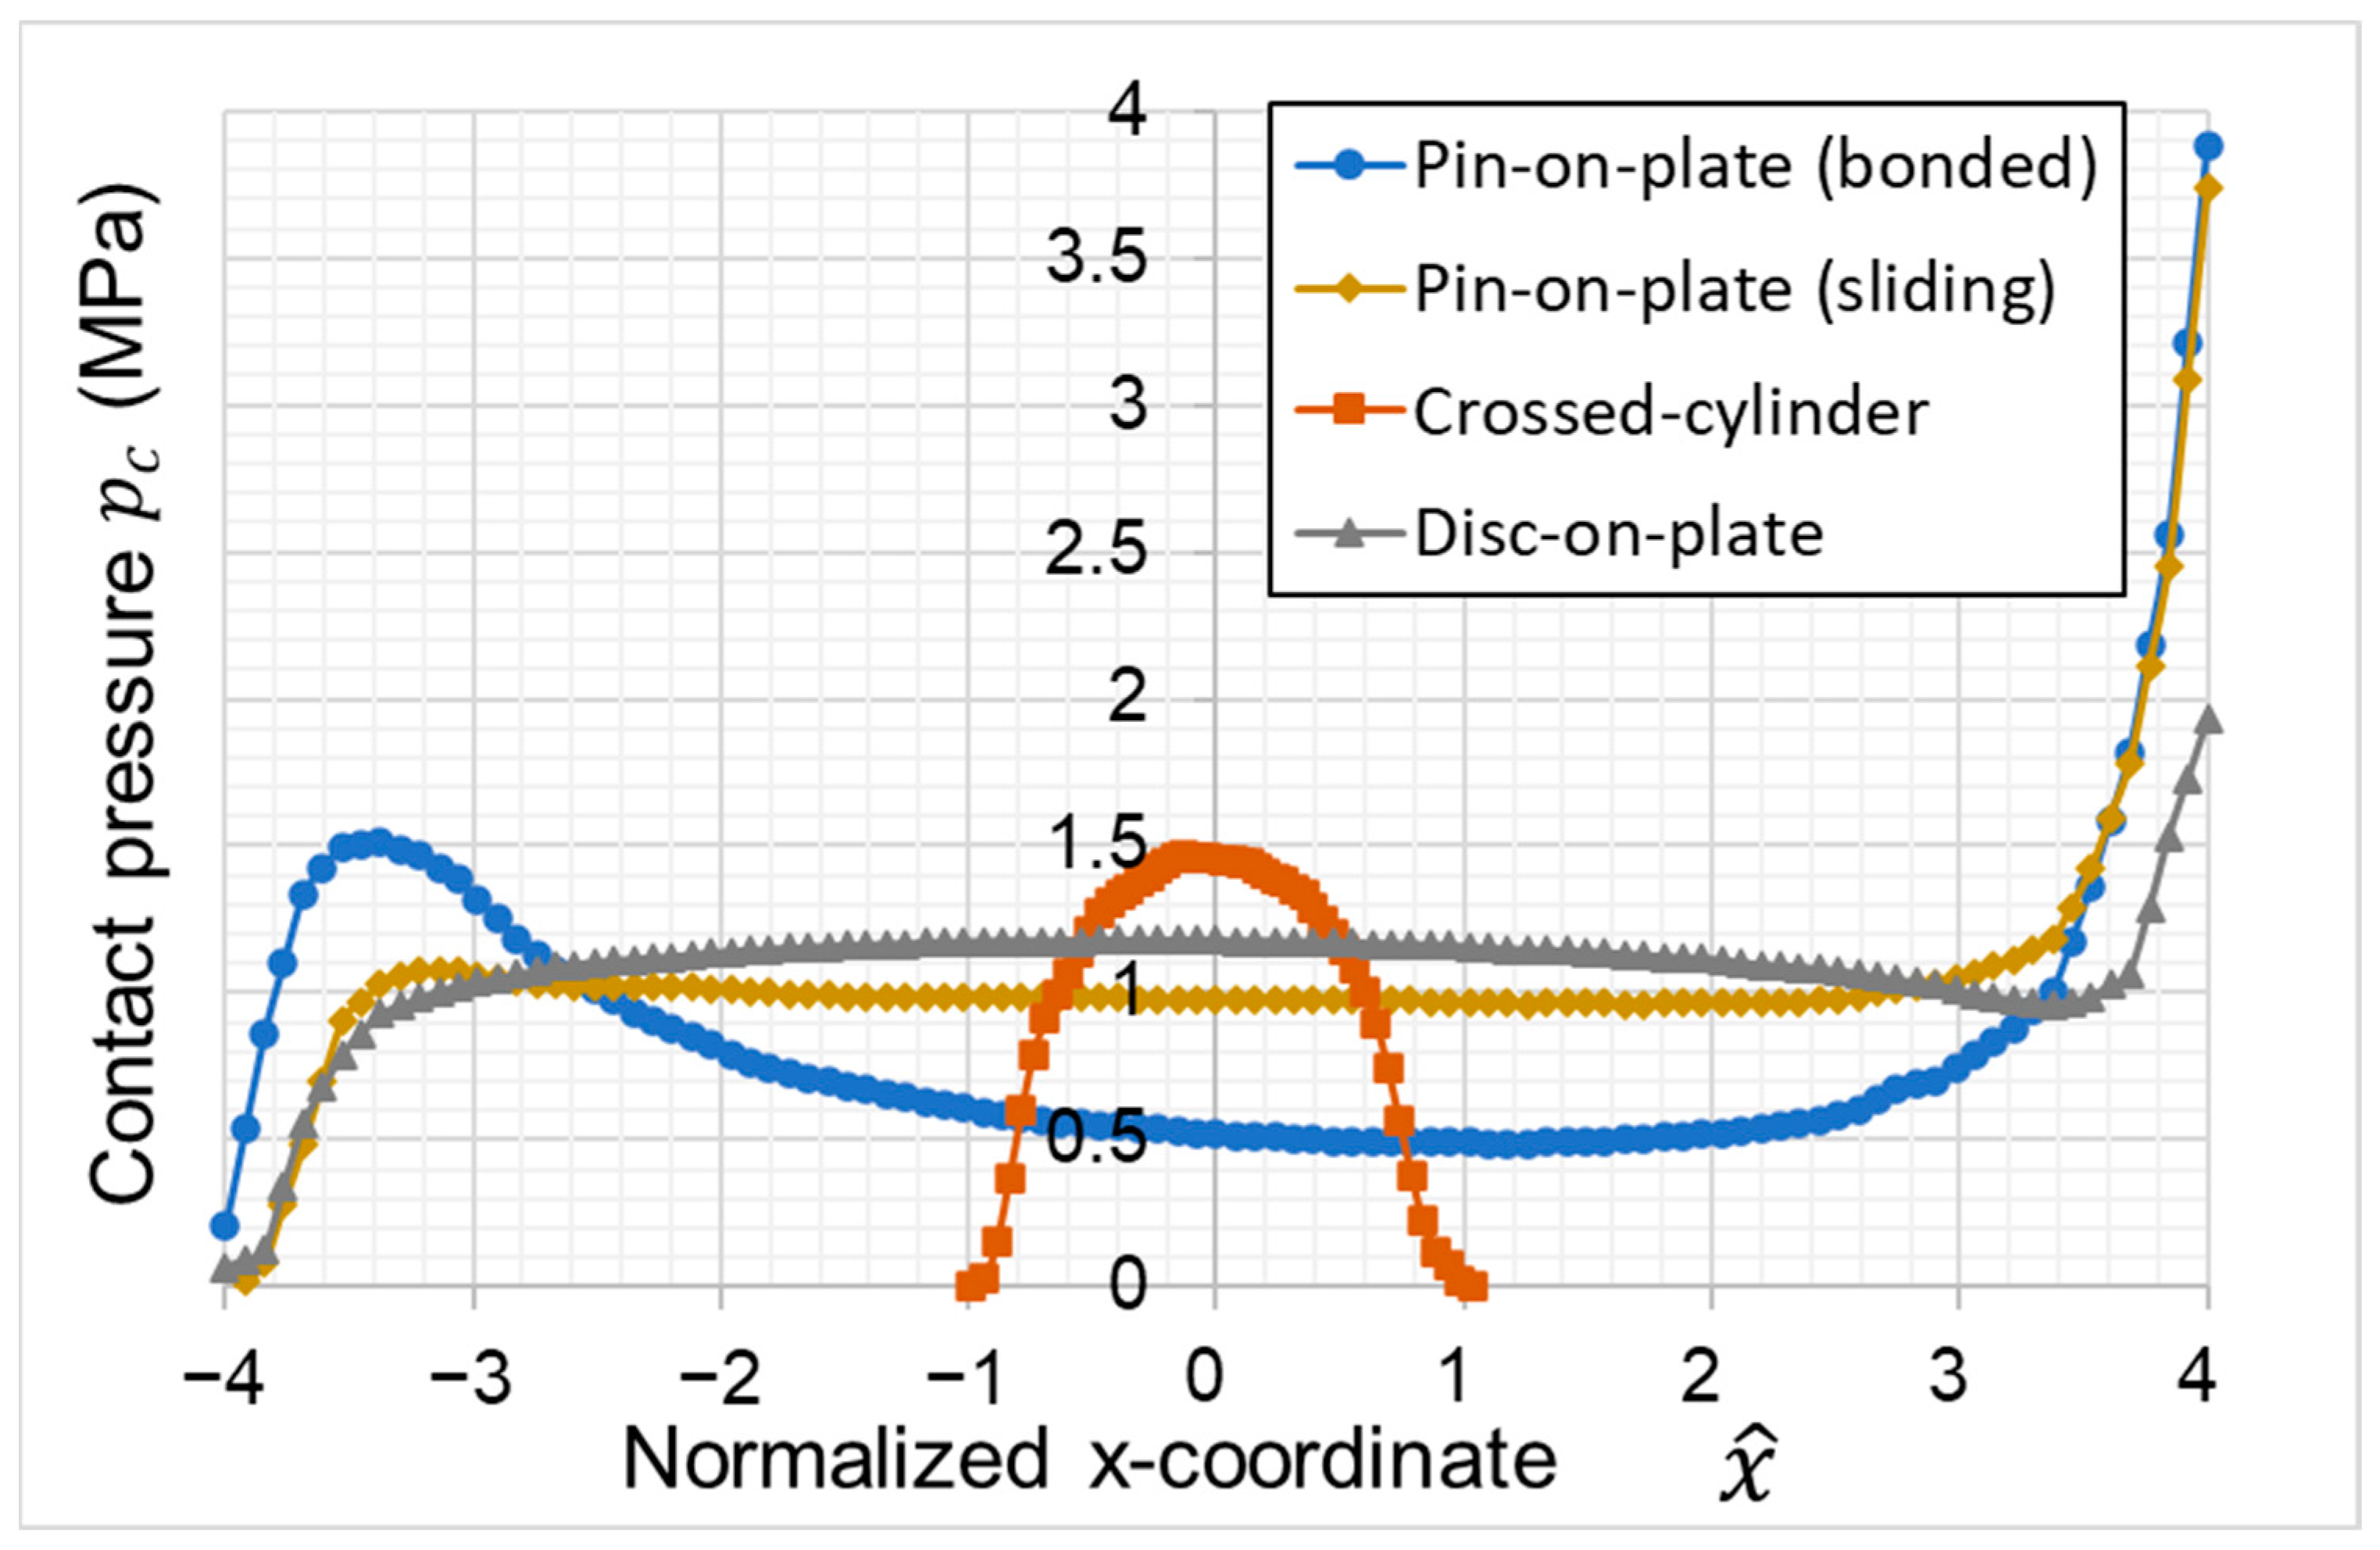
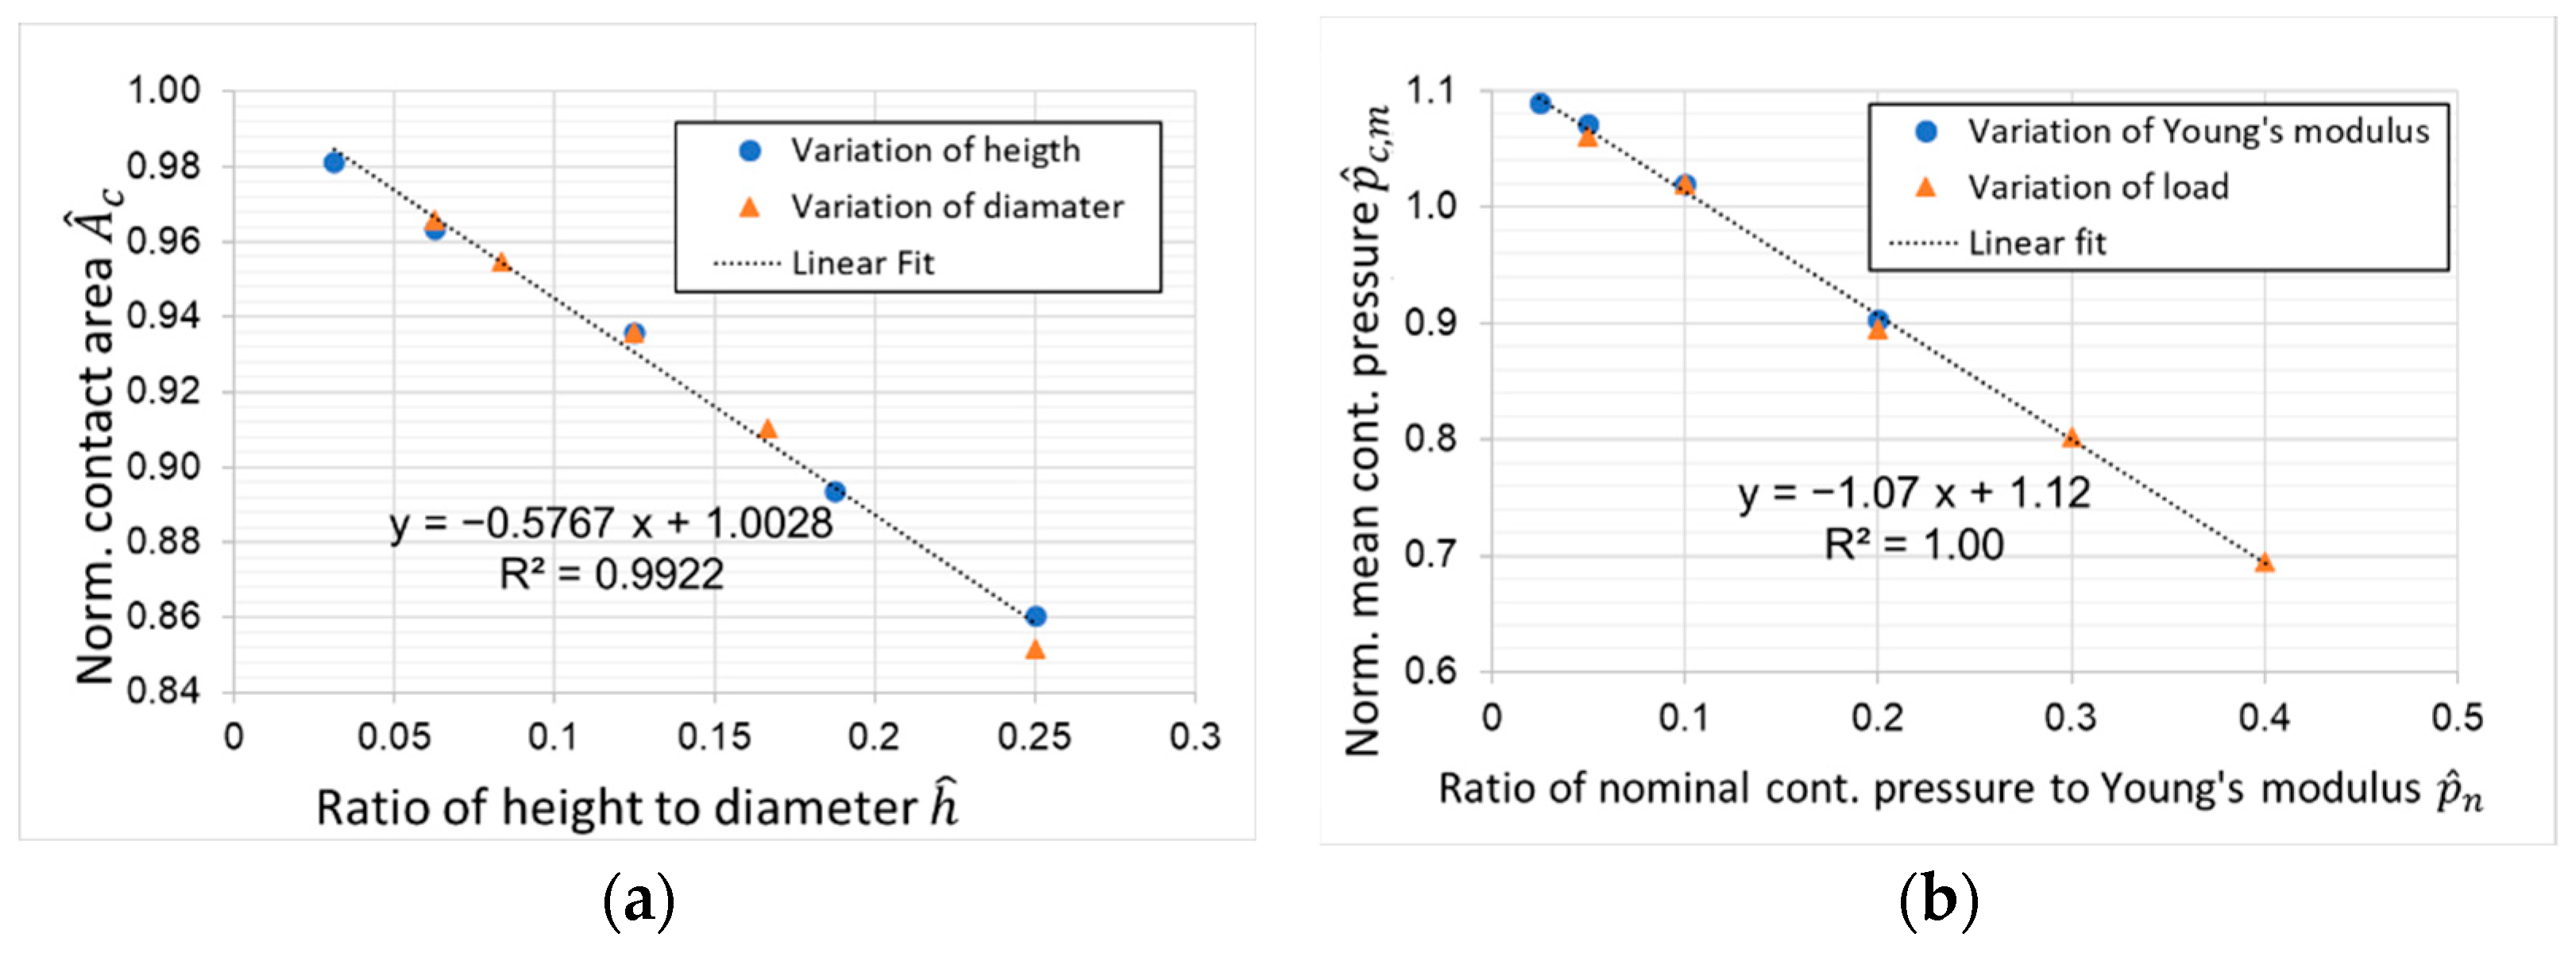
- A polymer disc with a height to diameter ratio of less than 1/6 was demonstrated to be most eligible for robust test procedures and uniform contact pressures. This ensures that occurring wear does not change contact pressure;
- The Young’s modulus, which is typically low for soft polyurethane, has little influence on the contact pressure distribution of the newly developed disc-on-plate configuration as long as the ratio of the nominal contact pressure and Young´s modus is below 0.1;
- Poisson’s ratios of the polymer above 0.4 significantly reduce the uniformity of the contact pressure distribution and lead to a maximum in contact pressure in the center of the polymer pin;
- The CoF mainly influences the contact pressure at the leading edge; the higher the CoF, the higher the maximal contact pressure at the leading edge. This effect could be minimized successfully in the disc setup presented in this paper.
Author Contributions
Funding
Institutional Review Board Statement
Informed Consent Statement
Data Availability Statement
Conflicts of Interest
References
- Klein, B. FEM: Grundlagen und Anwendungen der Finite-Element-Methode im Maschinen- und Fahrzeugbau; Lehrbuch; 10., verb. Aufl.; Springer: Wiesbaden, Germany, 2015; ISBN 978-3-658-06053-4. [Google Scholar]
- ASTM G65-04; Test Method for Measuring Abrasion Using the Dry Sand/Rubber Wheel Apparatus. ASTM International: West Conchhocken, PA, USA, 2010.
- DIN ISO 4649; Rubber, Vulcanized or Thermoplastic—Determination of Abrasion Resistance Using a Rotating Cylindrical Drum Device. Beuth Verlag GmbH: Berlin, Germany, 2017.
- Andersson, P. VAMAS Second Round Robin on Wear Test Methods; Valtion teknillinen tutkimuskeskus. Tiedotteita; VTT Technical Research Centre of Finland: Espoo, Finland, 1990; ISBN 978-951-38-3697-9. [Google Scholar]
- Imado, K.; Miura, A.; Kido, Y. Influence of Testing Method on the Contact Pressure Distribution and Its Effect on Coefficient of Friction in Polymeric Bearings. Tribol. Int. 2007, 40, 390–396. [Google Scholar] [CrossRef]
- Madenci, E.; Guven, I. The Finite Element Method and Applications in Engineering Using ANSYS®; Springer: Boston, MA, USA, 2015; ISBN 978-1-4899-7549-2. [Google Scholar]
- Llavori, I.; Zabala, A.; Aginagalde, A.; Tato, W.; Ayerdi, J.J.; Gómez, X. Critical Analysis of Coefficient of Friction Derivation Methods for Fretting under Gross Slip Regime. Tribol. Int. 2020, 143, 105988. [Google Scholar] [CrossRef]
- Boissonnet, L.; Duffau, B.; Montmitonnet, P. A Wear Particle-Based Model of Friction in a Polymer–Metal High Pressure Contact. Wear 2012, 286, 55–65. [Google Scholar] [CrossRef]
- Pinedo, B.; Hadfield, M.; Tzanakis, I.; Conte, M.; Anand, M. Thermal Analysis and Tribological Investigation on TPU and NBR Elastomers Applied to Sealing Applications. Tribol. Int. 2018, 127, 24–36. [Google Scholar] [CrossRef]
- Viswanathan, K.; Sundaram, N.K. Distinct Stick-Slip Modes in Adhesive Polymer Interfaces. Wear 2017, 376, 1271–1278. [Google Scholar] [CrossRef] [Green Version]
- Quaglini, V.; Dubini, P. Friction of Polymers Sliding on Smooth Surfaces. Adv. Tribol. 2011, 2011, 178943. [Google Scholar] [CrossRef]
- Panda, S.; Sarangi, M.; Roy Chowdhury, S.K. An Analytical Model of Mechanistic Wear of Polymers. J. Tribol. 2018, 140, 011609. [Google Scholar] [CrossRef]
- Unal, H.; Sen, U.; Mimaroglu, A. Dry Sliding Wear Characteristics of Some Industrial Polymers against Steel Counterface. Tribol. Int. 2004, 37, 727–732. [Google Scholar] [CrossRef]
- Kim, H.; Kim, R.-U.; Chung, K.-H.; An, J.-H.; Jeon, H.-G.; Kim, B.-J. Effect of Test Parameters on Degradation of Polyurethane Elastomer for Accelerated Life Testing. Polym. Test. 2014, 40, 13–23. [Google Scholar] [CrossRef]
- Feuchtmüller, O.; Hörl, L.; Bauer, F. An Empirical Study on the Friction of Reciprocating Rod Seals at Predefined Lubrication Conditions and Shear Rates. Lubricants 2022, 10, 56. [Google Scholar] [CrossRef]
- Feuchtmüller, O.; Hörl, L.; Bauer, F. A Novel Measurement Procedure to Analyse the Friction of Rod Seals in Relation to Pre-Defined Shear Rates and Starved Lubrication Conditions: A Novel Measurement Procedure to Analyse the Friction of Rod Seals in Relation to Pre-Defined Shear Rates and Starved Lubrication Conditions. Int. Colloq. Tribol. 2022, 23, 335–337. [Google Scholar]
- Blau, P.J. Friction Science and Technology, 2nd ed.; CRC Press: Boca Raton, FL, USA, 2008; ISBN 978-1-4200-5410-1. [Google Scholar]
- I-TRIBOMAT—Home. Available online: https://www.i-tribomat.eu/ (accessed on 16 September 2022).
- Voyer, J.; Klien, S.; Velkavrh, I.; Ausserer, F.; Diem, A. Static and Dynamic Friction of Pure and Friction-Modified PA6 Polymers in Contact with Steel Surfaces: Influence of Surface Roughness and Environmental Conditions. Lubricants 2019, 7, 17. [Google Scholar] [CrossRef] [Green Version]
- Nunez, E.E.; Polycarpou, A.A. The Effect of Surface Roughness on the Transfer of Polymer Films under Unlubricated Testing Conditions. Wear 2015, 326, 74–83. [Google Scholar] [CrossRef]
- Trygonal Group. HPU Premium—Hydrolysis-Resistant Polyurethane, Suitable for Foodstuff; Trygonal Kunstoffinnnovation GmbH: Sachsenheim, Germany, 2019; Available online: https://www.trygonal.com/file-download.hpu-premium.a-1782.pdf (accessed on 6 November 2022).
- Rühl, A. On the Time and Temperature Dependent Behaviour of Laminated Amorphous Polymers Subjected to Low-Velocity Impact; Springer Berlin Heidelberg: Berlin/Heidelberg, Germany, 2017; ISBN 978-3-662-54640-6. [Google Scholar]
- Holzweber, J.; Müller, J.; Çakmak, U.D.; Major, Z. Characterization and Modeling of the Fatigue Behavior of TPU. Mater. Today Proc. 2018, 5, 26572–26577. [Google Scholar] [CrossRef] [Green Version]
- Frick, A.; Borm, M.; Kaoud, N.; Kolodziej, J.; Neudeck, J. Microstructure and Thermomechanical Properties Relationship of Segmented Thermoplastic Polyurethane (TPU). In Proceedings of the AIP Conference, Nuremberg, Germany, 15 May 2014; pp. 520–525. [Google Scholar]
- Thompson, M.K.; Thompson, J.M. ANSYS Mechanical APDL for Finite Element Analysis; Butterworth-Heinemann, an Imprint of Elsevier: Oxford, UK, 2017; ISBN 978-0-12-812981-4. [Google Scholar]
- Novak, N.; Vesenjak, M.; Ren, Z. Auxetic Cellular Materials—a Review. Stroj. Vestn. J. Mech. Eng. 2016, 62, 485–493. [Google Scholar] [CrossRef] [Green Version]
- Acuna, D.; Gutiérrez, F.; Silva, R.; Palza, H.; Nunez, A.S.; Düring, G. A Three Step Recipe for Designing Auxetic Materials on Demand. Commun. Phys. 2022, 5, 113. [Google Scholar] [CrossRef]
- Zaplata, M.; Grudzinski, K.; Warda, B. Modelling And Computer Analysing The Stick-Slip Motion In A Mass-Spring System With Friction. WIT Trans. Eng. Sci. 1970, 7. Available online: https://www.witpress.com/Secure/elibrary/papers/CON95/CON95057FU.pdf (accessed on 6 November 2022).
- Benson, D.J.; Hallquist, J.O. A Single Surface Contact Algorithm for the Post-Buckling Analysis of Shell Structures. Comput. Methods Appl. Mech. Eng. 1990, 78, 141–163. [Google Scholar] [CrossRef]
- Xu, Y.-X.; Juang, J.-Y. Measurement of Nonlinear Poisson’s Ratio of Thermoplastic Polyurethanes under Cyclic Softening Using 2D Digital Image Correlation. Polymers 2021, 13, 1498. [Google Scholar] [CrossRef]
- Qi, H.J.; Boyce, M.C. Stress–Strain Behavior of Thermoplastic Polyurethanes. Mech. Mater. 2005, 37, 817–839. [Google Scholar] [CrossRef]
- Wilkinson, M.D.; Dumontier, M.; Aalbersberg, I.J.; Appleton, G.; Axton, M.; Baak, A.; Blomberg, N.; Boiten, J.-W.; da Silva Santos, L.B.; Bourne, P.E.; et al. The FAIR Guiding Principles for Scientific Data Management and Stewardship. Sci. Data 2016, 3, 160018. [Google Scholar] [CrossRef] [PubMed]


| Model Parameter | Symbol | Value 1 | ||||
|---|---|---|---|---|---|---|
| Polymer sample height | (mm) | 0.25 | 0.5 | 1.0 | 1.5 | 2.0 |
| Polymer sample diameter | (mm) | 4 | 6 | 8 | 12 | 16 |
| Nominal contact pressure | (MPa) | 0.5 | 1.0 | 2.0 | 4.0 | |
| Young’s modulus of polymer | (MPa) | 5 | 10 | 20 | 40 | |
| Poisson’s ratio of polymer | 0.0 | 0.3 | 0.4 | 0.49 | 0.499 | |
| CoF between polymer and counter body | 0.0 | 0.1 | 0.25 | 0.5 | 0.75 | |
| Dimensionless Parameter | Formula |
|---|---|
| Normalized x-coordinate | |
| Ratio of nominal contact pressure to Young’s modulus | |
| Ratio of height to diameter | |
| Normalized contact pressure | |
| Normalized contact area | |
| Normalized mean contact pressure |
| Study No. 1 | Loading Parameter | Value |
|---|---|---|
| 1–2 | Nominal contact pressure Average relative velocity | 1.0 MPa 3.0 MPa 50 mm/s 50 mm/s |
| 3–4 | Nominal contact pressure Average relative velocity | 1.0 MPa 3.0 MPa 100 mm/s 100 mm/s |
| Model Parameter | Symbol | Value |
|---|---|---|
| Static CoF | 1.3 | |
| Dynamic CoF | 0.9 | |
| Reference sliding velocity | 25 mm/s | |
| Reference contact pressure | 1 MPa | |
| Pressure exponent | 0.26 |
| Time (s) | Displacement (mm) |
|---|---|
| 0.0 | −27 |
| 0.03 | −27 |
| 0.47 | 27 |
| 0.53 | 27 |
| 0.97 | −27 |
| 1.0 | −27 |
Disclaimer/Publisher’s Note: The statements, opinions and data contained in all publications are solely those of the individual author(s) and contributor(s) and not of MDPI and/or the editor(s). MDPI and/or the editor(s) disclaim responsibility for any injury to people or property resulting from any ideas, methods, instructions or products referred to in the content. |
© 2022 by the authors. Licensee MDPI, Basel, Switzerland. This article is an open access article distributed under the terms and conditions of the Creative Commons Attribution (CC BY) license (https://creativecommons.org/licenses/by/4.0/).
Share and Cite
Herr, M.; Borras, F.X.; Spaltmann, D.; Kröll, M.; Pirker, F.; Cihak-Bayr, U. How to Create Trusted Tribological Characterization Data of Soft Polymers as Input for FEM Simulations? Materials 2023, 16, 131. https://doi.org/10.3390/ma16010131
Herr M, Borras FX, Spaltmann D, Kröll M, Pirker F, Cihak-Bayr U. How to Create Trusted Tribological Characterization Data of Soft Polymers as Input for FEM Simulations? Materials. 2023; 16(1):131. https://doi.org/10.3390/ma16010131
Chicago/Turabian StyleHerr, Marin, F. Xavier Borras, Dirk Spaltmann, Mirco Kröll, Franz Pirker, and Ulrike Cihak-Bayr. 2023. "How to Create Trusted Tribological Characterization Data of Soft Polymers as Input for FEM Simulations?" Materials 16, no. 1: 131. https://doi.org/10.3390/ma16010131