Article

Structure, Properties, and Corrosion Behavior of Ti-Rich TiZrNbTa Medium-Entropy Alloys with β+α″+α′ for Biomedical Application

1
Department of Chemical and Materials Engineering, National University of Kaohsiung, Kaohsiung 81148, Taiwan
2
Department of Dental Technology and Materials Science, Central Taiwan University of Science and Technology, Taichung 40601, Taiwan
*
Author to whom correspondence should be addressed.
These authors contributed equally to this work.
Materials 2022, 15(22), 7953; https://doi.org/10.3390/ma15227953
Submission received: 17 October 2022 / Revised: 7 November 2022 / Accepted: 9 November 2022 / Published: 10 November 2022
(This article belongs to the Special Issue Compositional Complex Alloys: From Amorphous to High-Entropy)

Abstract

:
Five Ti-rich β+α″+α′ Ti–Zr–Nb–Ta biomedical medium-entropy alloys with excellent mechanical properties and corrosion resistance were developed by considering thermodynamic parameters and using the valence electron concentration formula. The results of this study demonstrated that the traditional valence electron concentration formula for predicting phases is not entirely applicable to medium-entropy alloys. All solution-treated samples with homogeneous compositions were obtained at a low temperature (900 °C) and within a short period (20 min). All solution-treated samples exhibited low elastic moduli ranging from 49 to 57 GPa, which were significantly lower than those of high-entropy alloys with β phase. Solution-treated Ti65–Zr29–Nb3–Ta3 exhibited an ultra-high bending strength (1102 MPa), an elastic recovery angle (>30°), and an ultra-low elastic modulus (49 GPa), which are attributed to its α″ volume fraction as high as more than 60%. The pitting potentials of all samples were higher than 1.8 V, and their corrosion current densities were lower than 10–5 A/cm3 in artificially simulated body fluid at 37 °C. The surface oxide layers on Ti65–Zr29–Nb3–Ta3 comprised TiO2, ZrO2, Nb2O5, and Ta2O5 (as discovered through X-ray photoelectron spectroscopy) and provided the alloy with excellent corrosion and pitting resistance.

1. Introduction

High-entropy alloys (HEAs) have four core effects and excellent qualities that are applicable to various fields of engineering [1]. The structures of HEAs and medium-entropy alloys (MEAs) can be calculated and predicted through the calculation of thermodynamic parameters, and some parameters are directly related to the properties of these alloys [2]. For instance, the effect of lattice distortion on mechanical properties can be determined using the difference in atomic radius (δ) value of the alloy, and the mixing enthalpy (ΔHmix) value can also be used for evaluating the aggregation or separation between alloying elements [3]. Many scholars have developed biomedical HEAs and MEAs with high mechanical strength, ductility, corrosion resistance, and biocompatibility [3,4,5,6]. However, the elastic moduli of most biomedical HEAs and MEAs are still considerably higher than that of natural human bone (i.e., >30 GPa) [7]. A stress shielding effect may occur around an implant when the elastic modulus of the implant material is considerably greater than that of human bone [8].
In the development of biomedical alloys, metastable beta-titanium (β-Ti) alloys with ultra-low elastic modulus have been favored by numerous researchers [9,10,11]. The molybdenum equivalent ([Mo]eq) and valence electron concentration (VEC) methods are commonly used for calculating phase structures in Ti alloy systems. However, the metastable β-Ti alloys with low elastic modulus generally have low strength [9,12]. For instance, the elastic modulus of solution-treated Ti–33Nb–4Sn (36 GPa) was very similar to that of natural human bone, but its yield strength was as low as 107 MPa [9]. Implants with insufficient strength may fracture in the human body, which increases the risk of surgical failure.
A metastable Ti65–Zr18–Nb16–Mo1 MEA that combines the design concepts of metastable β-Ti alloys and MEAs was recently developed [13]. Ti65–Zr18–Nb16–Mo1 was discovered to exhibit high yield strength (1118 MPa), which was attributable to the contribution of the lattice distortion effect. The yield strength–elastic modulus ratio (×1000) of the alloy was even higher than 18.3. Nevertheless, the elastic modulus of Ti65–Zr18–Nb16–Mo1 was still 2 times that of natural human bone (<30 GPa). Conversely, Liu et al. [14] developed a Ti45–Zr37–Nb16–Fe1–Mo1 MEA with a metastable β phase and yield strength and elastic modulus of 703 MPa and 63 GPa, respectively. After 74–76% cold rolling, the alloy was transformed into a β+α″ phase, and its yield strength and elastic modulus were 1139 MPa and 74 GPa, respectively. Hence, obtaining an elastic modulus similar to that of natural human bone by incorporating metastable β-Ti alloys into MEAs may be difficult.
Regarding biomedical Ti alloys, some research has indicated that dual-phase and three-phase Ti alloys may have a lower elastic modulus than metastable β-Ti alloys [15,16,17]. In an investigation by Tan et al., the elastic moduli of Ti–33Nb–7Zr with β+α″ phase and Ti–23Nb–7Zr with β+α″+α′ phase were found to be as low as 29.0 GPa and 35.9 GPa, respectively, using a nanoindentation test [17]. Furthermore, the phase boundary in dual-phase and three-phase alloys can hinder the slip of a dislocation, improving the strength of the alloys [18]. Although some biomedical β+α″ MEAs were developed through a cold-rolling process [14], no biomedical dual-phase or three-phase HEAs or MEAs with low elastic modulus have been reported. Because of the interaction between the four core effects of HEAs and the dual-phase/three-phase design concept, alloys are expected to be developed that have high strength and low elastic modulus simultaneously.
In this study, five biomedical Ti-rich Ti–Zr–Nb–Ta MEAs with three-phase structure were developed using the thermodynamic empirical formula and VEC method. These MEAs were discovered to have high strength, low elastic modulus, and excellent corrosion resistance. The phase structure, microstructure, mechanical properties, and corrosion resistance of the Ti–Zr–Nb–Ta MEAs were evaluated.

2. Materials and Methods

2.1. Experimental Procedures

Ti65–Zr33–Nb1–Ta1, Ti65–Zr31–Nb2–Ta2, Ti65–Zr29–Nb3–Ta3, Ti65–Zr27–Nb4–Ta4, and Ti65–Zr25–Nb5–Ta5 MEAs were fabricated using a commercial vacuum arc-melting and casting system (A-028, DAWNSHINE, Taiwan). In the process, Ti (99.7 wt% pure), Zr (99.9 wt% pure), Nb (99.95 wt% pure), and Ta (99.95 wt% pure) were employed. The oxide layer on all metal sheets was thoroughly removed by using #200 sandpaper before melting. The metal materials for each alloying element were placed in the water-cooled copper crucible in descending order of melting point during melting. Before casting, alloy ingots were remelted and flipped more than six times to achieve constituent-element homogeneity. The dimensions of all the MEA samples were 30 mm × 5 mm × 1 mm. Solution treatment (ST) of each MEA sample was performed using a high-temperature tubular furnace (MTF 12/38/250, Carbolite Gero, Hope, UK) at 900 °C for 20 min under argon atmosphere, and then the sample was quenched in ice water. The surfaces of all MEAs were mechanically polished using colloidal SiO2 polishing suspension (0.06 μm) before all analyses were performed, according to ASTM E3 [19]. The samples used for optical microscopy (OM) and electron probe microanalysis (EPMA) were pre-etched in a solution of deionized water, nitric acid, and hydrofluoric acid in a ratio of 80:15:5 (vol.%), according to ASTM E407 [20].
Phase analysis was conducted using X-ray diffraction (XRD; D8-Advance, Bruker, Berlin, Germany) with Cu-Kα radiation at 40 kV, 40 mA, 2θ = 30°–80°, scanning speed = 4°/min, and step size = 0.02°/step. Electron backscatter diffraction (EBSD; SU5000, Hitachi, Tokyo, Japan) was used for grain orientation and phase structure analyses. The microstructures of the alloys were examined through OM (Zeiss, Oberkochen, Germany). Chemical compositions and elemental mapping analyses were performed using scanning electron microscopy (SEM; 6330, JEOL, Tokyo, Japan) with energy-dispersive X-ray spectroscopy (EDS) and EPMA (JXA-8530F, JEOL) with wavelength-dispersive spectroscopy (WDS). The five MEAs’ nominal and measured compositions, obtained through EDS–SEM, are detailed in Table 1. From a clinical practice viewpoint, implants are often subjected to flexural stresses instead of tensile loads during the movement of the human body [21,22]. The mechanical properties of all MEAs were evaluated through a three-point bending test according to ASTM E855 [23], which was performed using a desktop mechanical tester (HT-2102AP, Hung-Ta Instrument, Taichung, Taiwan). The three-point bending experiments were conducted in accordance with the procedure described in a previous study [13].
Potentiodynamic polarization tests were conducted using a potentiostat (PGSTAT12, Autolab, Utrecht, The Netherlands) in phosphate-buffered saline (PBS) at 37 °C and pH 7.4, according to ASTM G5 [24]. The MEA samples, a silver chloride electrode (Ag/AgCl), and a platinum plate were used as the working electrode, reference electrode, and auxiliary electrode, respectively. Before the test, the electrolyte solution was deaerated with nitrogen gas for 30 min. The scan rate and scan range were 0.001 V/s and –0.3 to 1.8 V, respectively, and the tests were begun after 1 h at the open circuit potential to ensure that the PBS solution had stabilized. The PBS solution comprised NaCl (8.0 g/L), KCl (0.2 g/L), Na2HPO4 (1.44 g/L), and KH2PO4 (0.24 g/L). The sample and electrolyte solution were stagnant during potentiodynamic polarization tests. The corrosion potential and corrosion current density were obtained using the Tafel curve extrapolation method [25]. In the polarization curve, the intersection of the anodic and cathodic curves is the corrosion potential of the alloy. Extrapolation of the linear portion of the anodic and cathodic curves to the corrosion potential is utilized to determine the corrosion current density. After the potentiodynamic polarization tests, the surface microstructures of the alloys were examined using SEM, and the surface chemical compositions of the alloys were analyzed using X-ray photoelectron spectroscopy (XPS; JAMP-9500F, JEOL) with a monochromatized Al-Kα excitation source (hν = 1486.6 eV) at 10 kV and 10 mA. The XPS binding energies were calibrated by measuring the reference peak of C 1s (binding energies = 284.6 eV).

2.2. Thermodynamic Parameter Calculation

The thermodynamic parameters of the Ti65–Zr33–Nb1–Ta1, Ti65–Zr31–Nb2–Ta2, Ti65–Zr29–Nb3–Ta3, Ti65–Zr27–Nb4–Ta4, and Ti65–Zr25–Nb5–Ta5 MEAs are detailed in Table 2. All the thermodynamic parameters were calculated as follows [2]: Δ S mix = R ln N , where ΔSmix is the mixing entropy, R is the ideal gas constant (8.3145 J·K–1·mol–1), and N is the number of component elements; Δ H mix = 4 i = 1 , i j n Δ H mix AB c i c j , where ΔHmix is the mixing enthalpy (–22 ≤ ΔHmix ≤ 7 kJ/mol) and Δ H mix AB is the mixing enthalpy of the binary A–B system; δ = i = 1 n c i ( 1 r i / r ¯ ) 2 , where δ is the difference in atomic radius (0 ≤ δ ≤ 8.5) and ci and ri are the atomic percentage and atomic radius of element i, respectively; Ω = T L Δ S mix | Δ H mix | , where TL and ΔSmix are the melting point and mixing entropy of the alloy, respectively; and VEC = i = 1 n c i ( VEC ) i , where VEC and (VEC)i are the valence electron concentration of the alloy and the VEC of element i, respectively. All the Greek letters and symbols used in the study are listed in Table 3.

3. Results and Discussion

3.1. Phase Identification

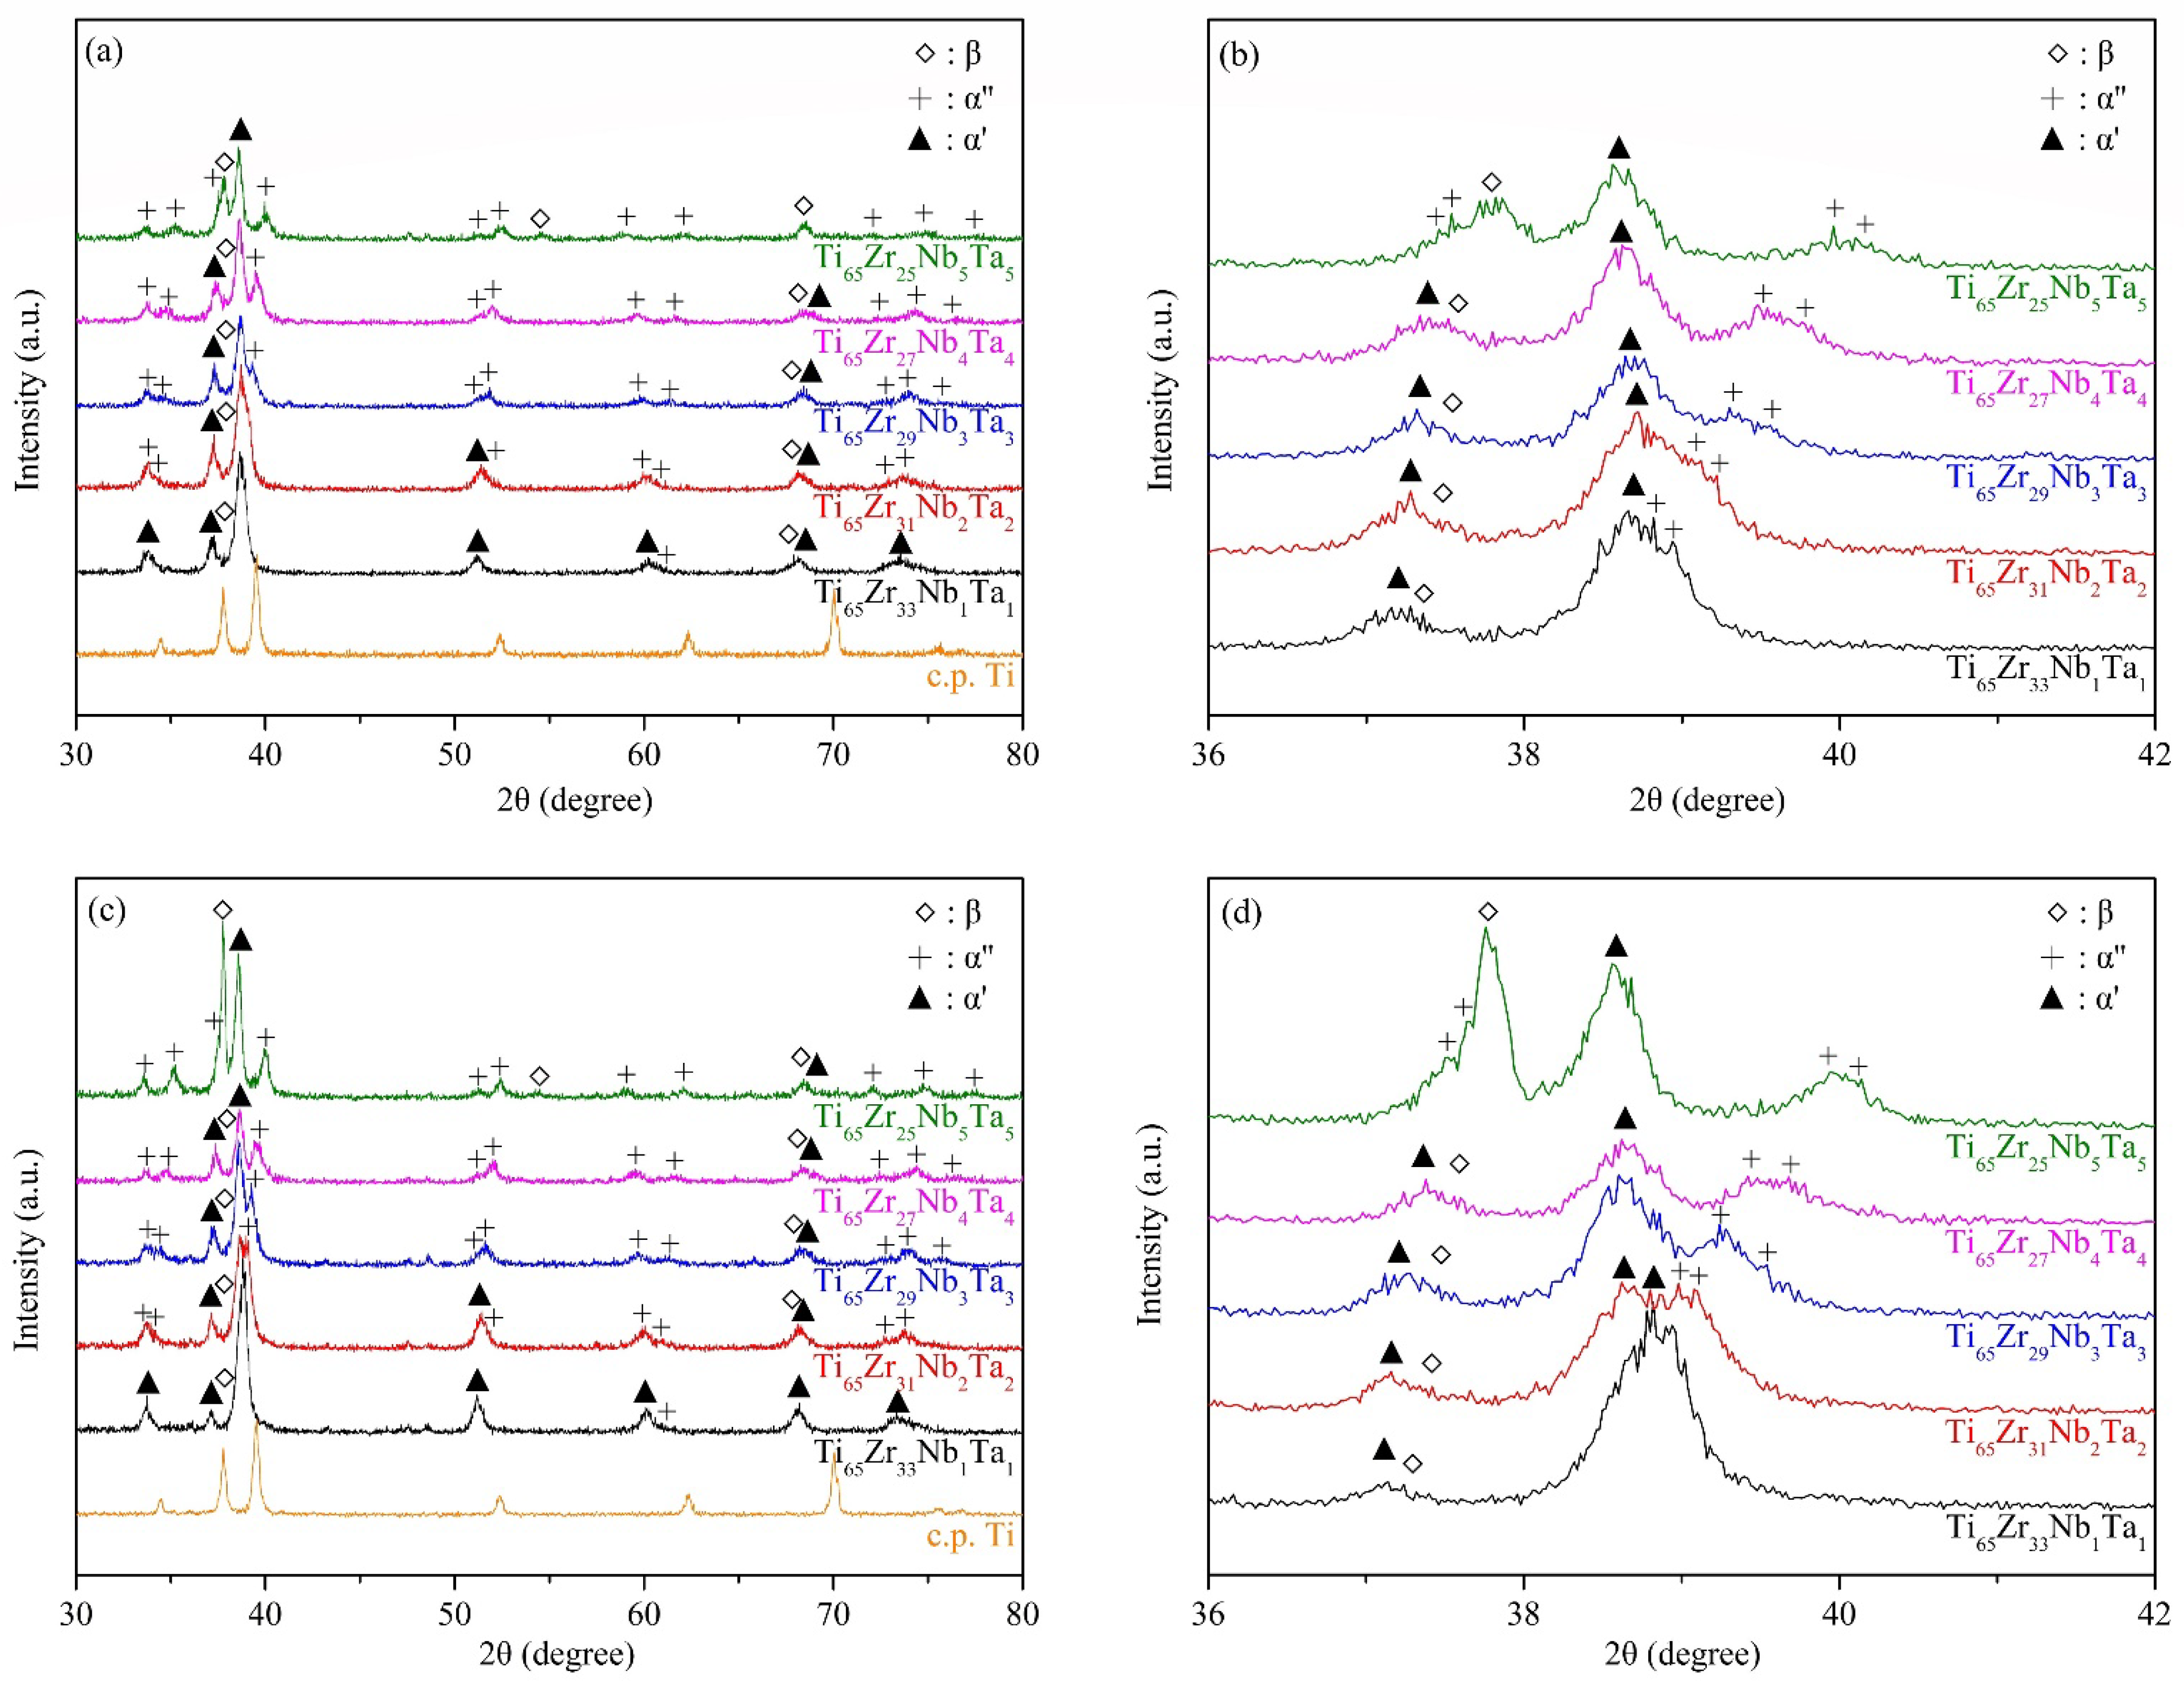
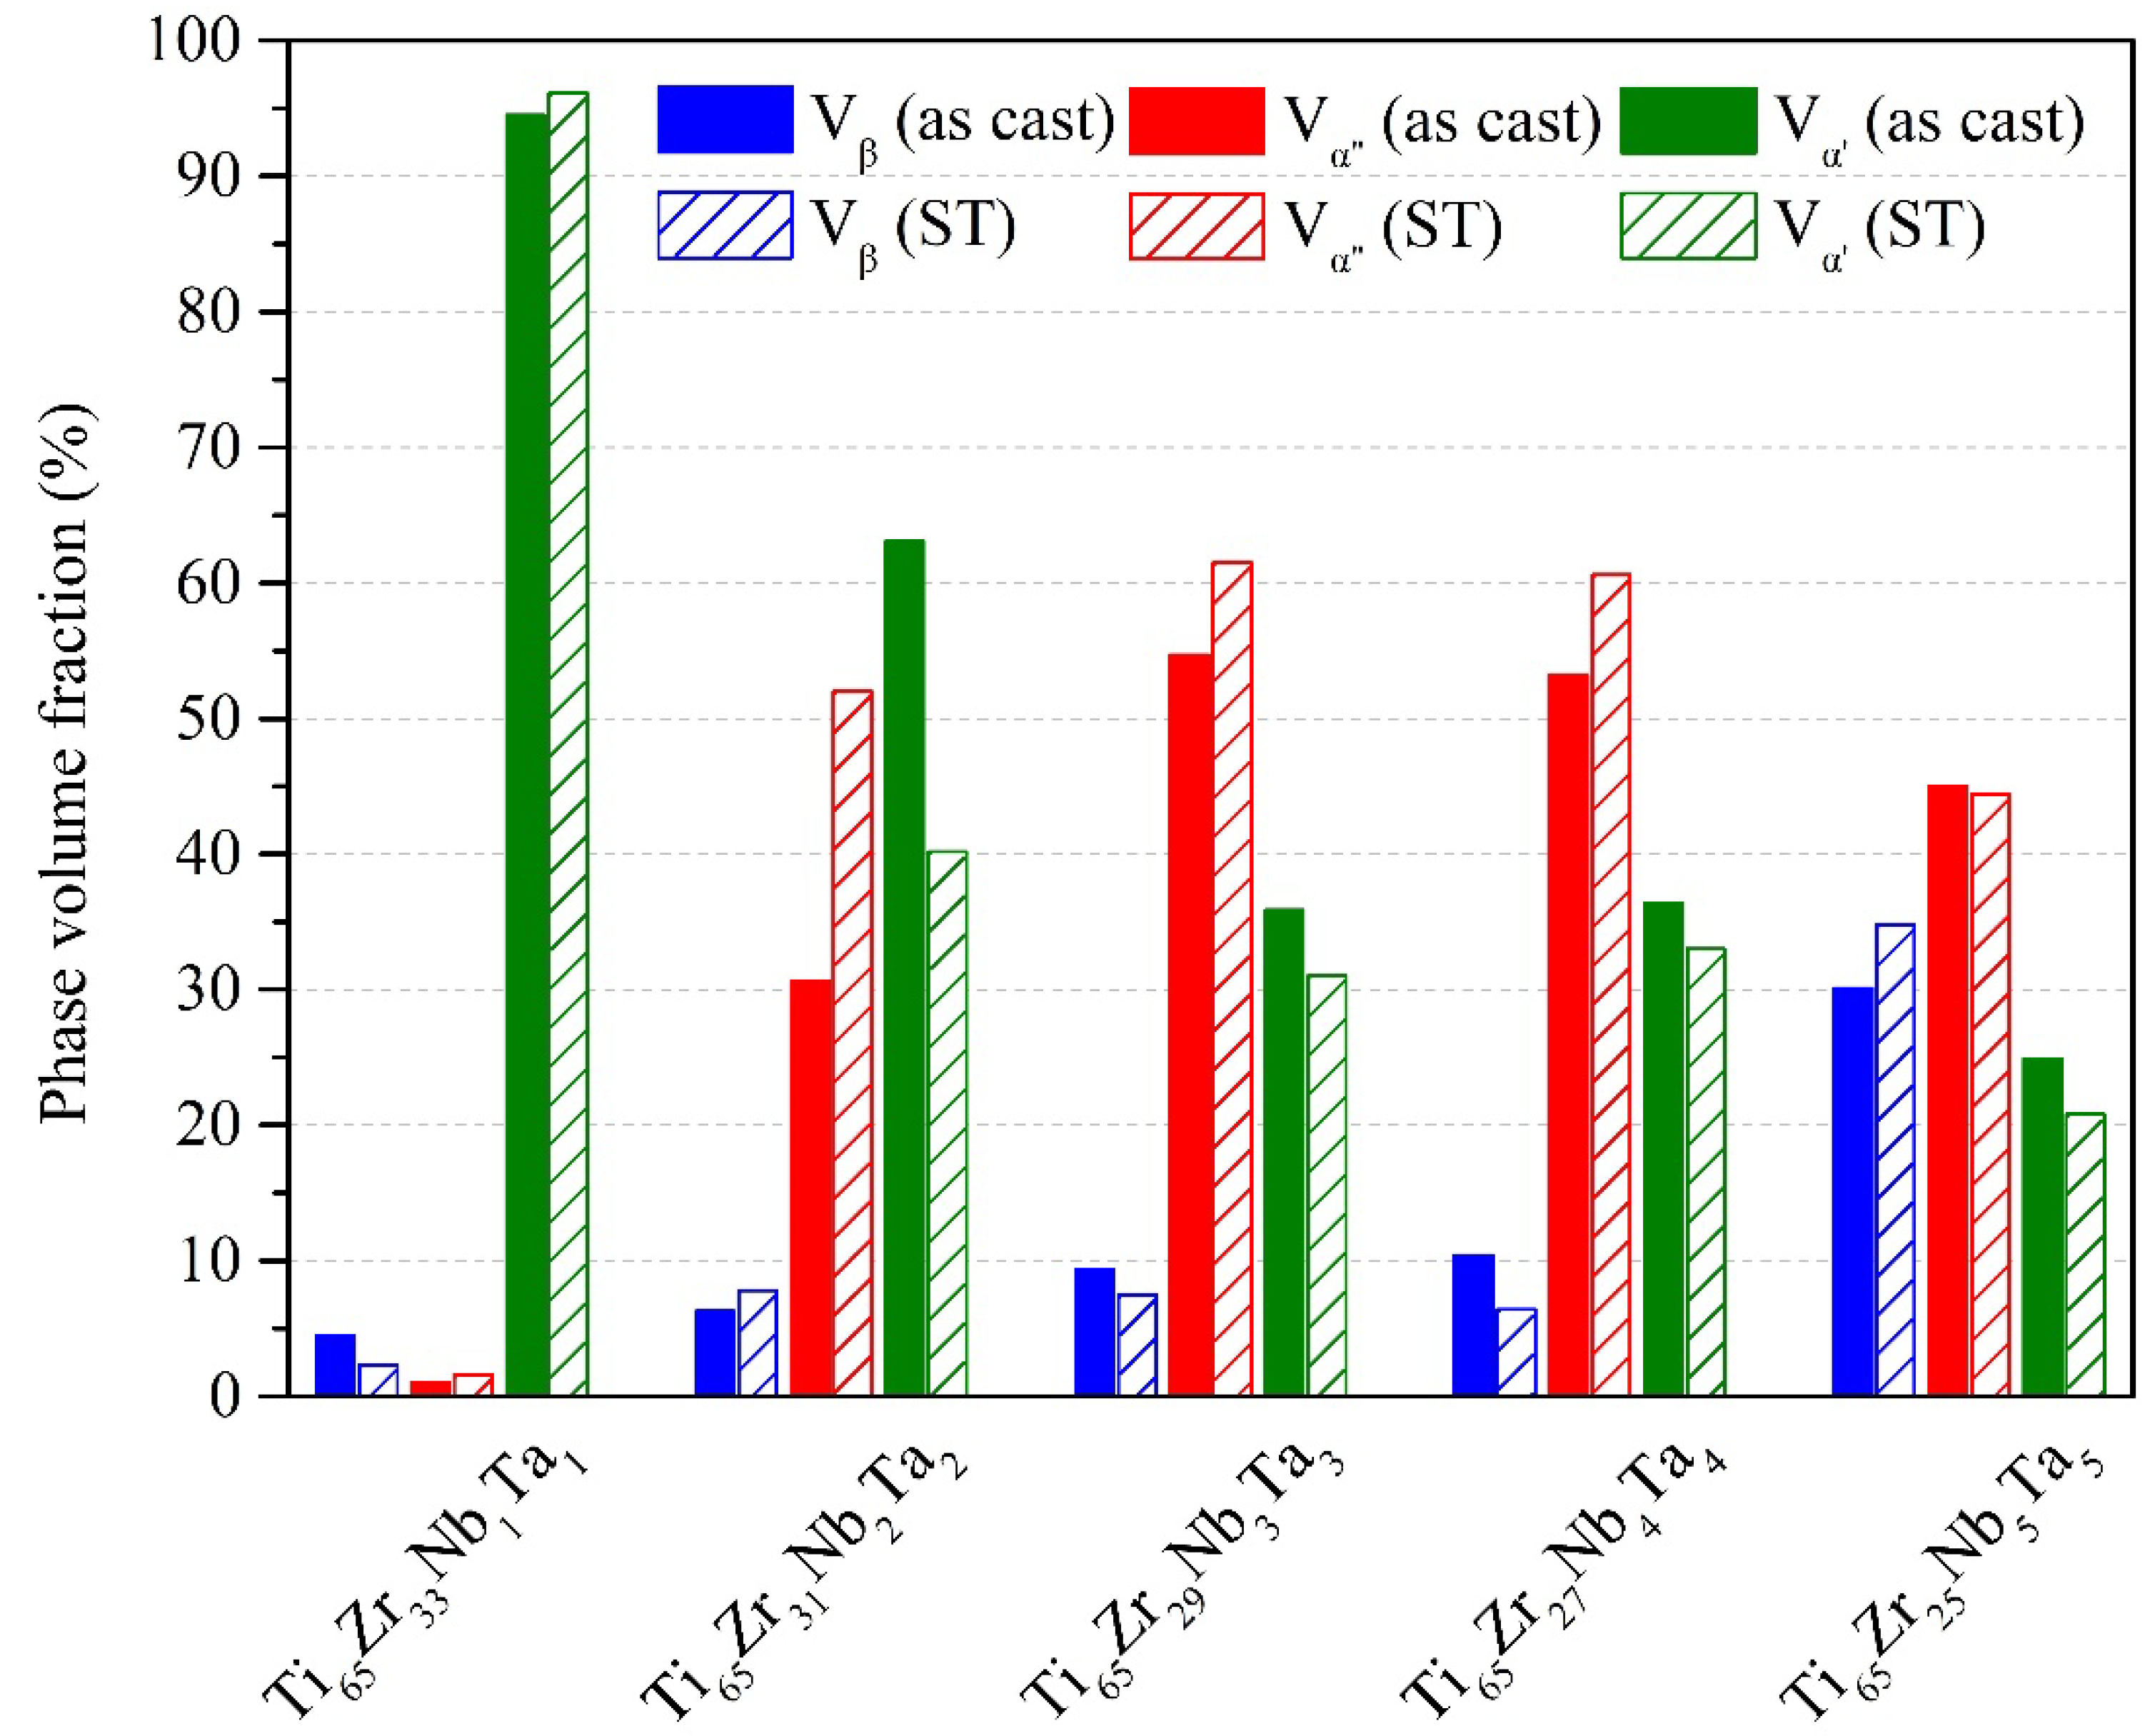
3.1.1. X-ray Diffraction Analysis

The XRD patterns of the five Ti–Zr–Nb–Ta MEAs under as-cast and ST conditions are presented in Figure 1a–d. All MEAs had a three-phase β+α″+α′ structure before and after ST. In Ti alloy systems, however, when the VEC is < 4.2, the alloy should be the pure HCP (α′) phase [26]. Yuan et al. [27] reported that in Ti/Zr-rich HEAs, when the VEC is < 4.09, the alloy must be the pure HCP (α′) phase. The results obtained in this study thus differ from the predictions made elsewhere [26,27]; the VECs of the five MEAs were all lower than 4.1, but the β and α″ phases were retained. This indicates that under the influence of the four core effects of HEAs, the applicable phase prediction formulas in different alloy systems or compositions may vary considerably. For example, the high-entropy effect promotes the formation of a simple and stable phase structure of the alloy [1] rather than a metastable state, and this eventually leads to a deviation of the alloy’s phase structure from the predicted results. Additionally, the severe composition segregation derived from the characteristics of the multielement composition of HEAs and MEAs may be another factor affecting the phase structure.
The phase volume fractions of the five β+α″+α′ MEAs before and after ST are listed in Figure 2. Ti65–Zr33–Nb1–Ta1 had the greatest α′-phase volume fraction because it had the lowest VEC (4.02). Moreover, the volume fraction of the β phase in Ti65–Zr25–Nb5–Ta5 with the highest VEC (4.1) was considerably higher than that of the other four MEAs. Ti65–Zr29–Nb3–Ta3, with a VEC of 4.06, exhibited the highest α″-phase volume fraction. Conversely, the volume fractions of the β, α″, and α′ phases in the MEAs were considerably different after ST. The volume fraction of the α′ phase of Ti65–Zr33–Nb1–Ta1 was slightly higher after ST. The volume fractions of the α″ phase of Ti65–Zr31–Nb2–Ta2, Ti65–Zr29–Nb3–Ta3, and Ti65–Zr27–Nb4–Ta4 were all considerably higher after ST. The β-phase volume fraction of Ti65–Zr25–Nb5–Ta5 was slightly higher after ST. Therefore, the phase structures of the alloys were affected by the segregation of alloy components, which ultimately affected the properties of the alloys.
All of the α′ diffraction peaks for the five MEAs were shifted to low diffraction angles relative to those of Ti (Figure 1a,c), which was attributable to an interlattice distance increase because of the high δ value of the alloy. Furthermore, the enlarged images of the 36–42° region (Figure 1b,d) indicate that the diffraction peaks corresponding to β, α″, and α′ were all shifted when the composition of the alloys was changed. The peaks corresponding to both β and α″ were shifted to high angles when there was more Nb and Ta because the interlattice distances of the β and α″ phases were reduced by the decrease in δ [28,29]. The diffraction peaks corresponding to α′ became separated as the alloy δ value was increased. As the amount of distortion of the cubic unit cell increased, a diffraction peak in the XRD pattern split into widely separated lines [30]. Moreover, in the region 58–63° (Figure 1a,c), the diffraction peaks corresponding to α″ gradually separated with an increase in the VEC. The α″ phase decomposed into an α″ phase with poor β-stabilizing elements and another α″ phase with rich β-stabilizing elements before transformation to β. The α″ phase with poor β-stabilizing elements had a different lattice constant than the α″ phase with rich β-stabilizing elements [31,32].

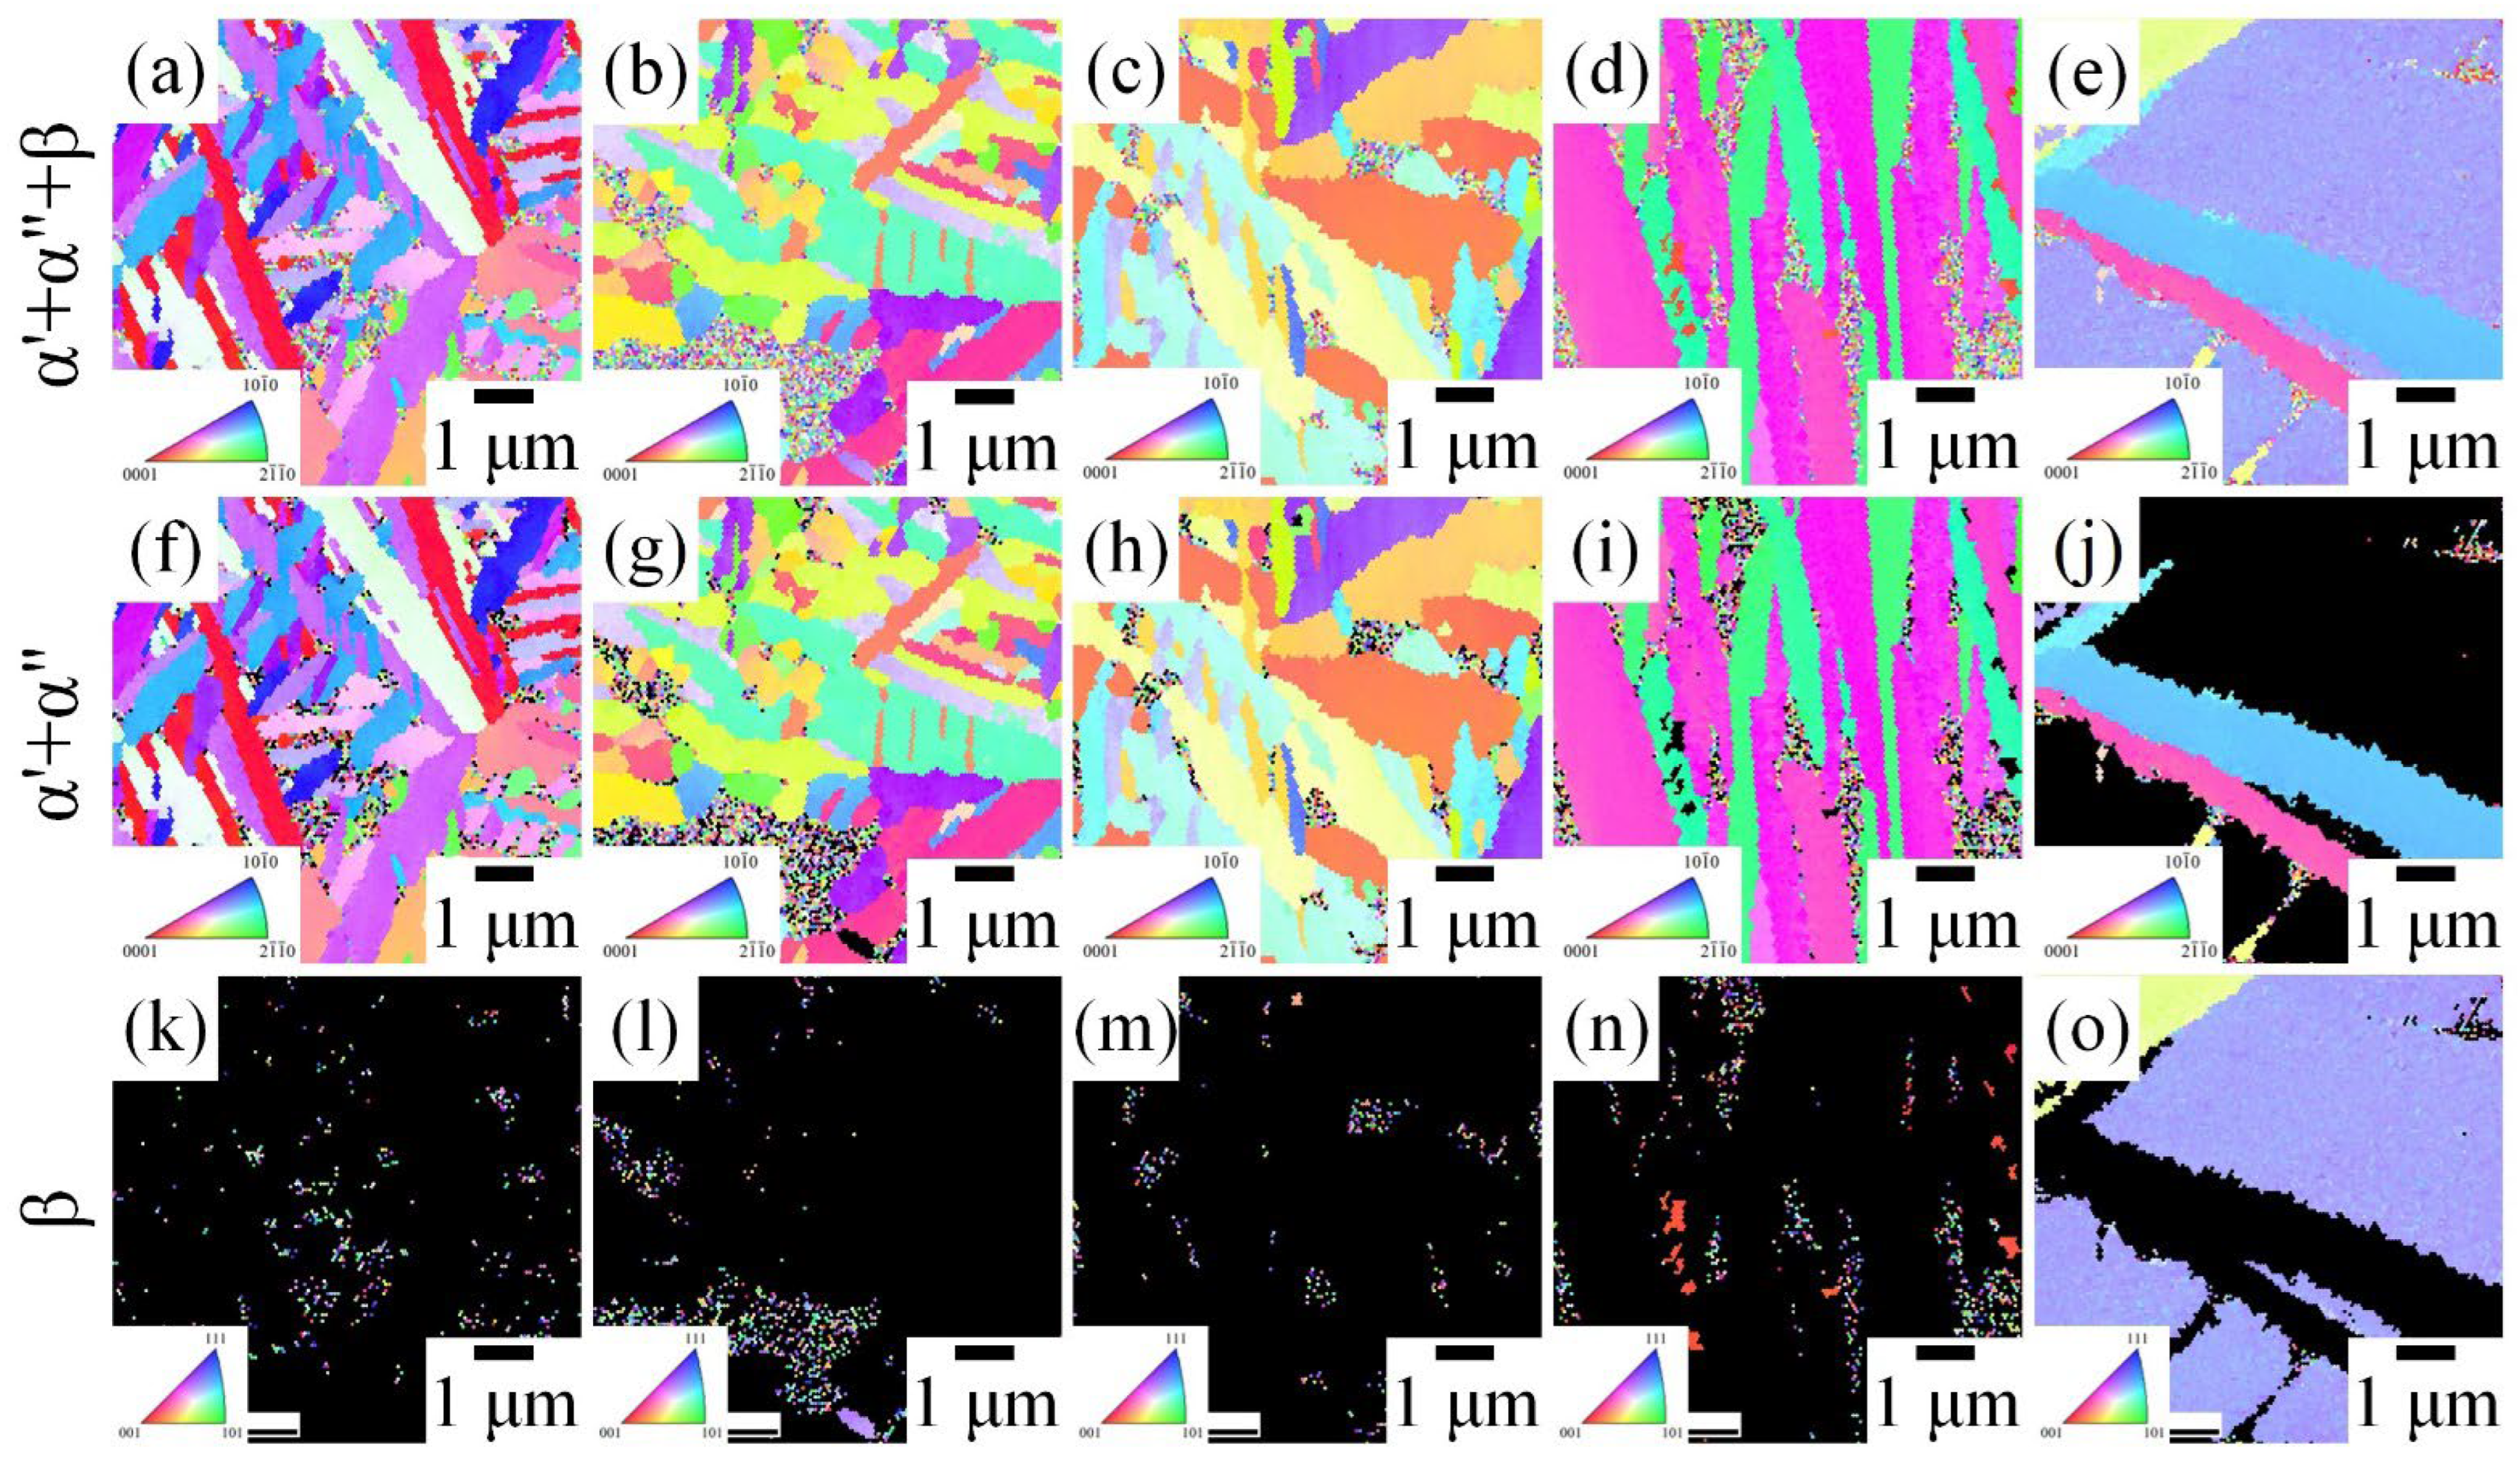
3.1.2. Electron Backscatter Diffraction Analysis

EBSD images (inverse pole figure and phase map) of the five MEAs after ST are presented in Figure 3. The α′ and α″ phases could not be distinguished in the EBSD images because of the similarity of the crystal structures of α′ and α″. In Ti65–Zr33–Nb1–Ta1, Ti65–Zr31–Nb2–Ta2, and Ti65–Zr29–Nb3–Ta3, a large amount of feather-like α′/α″ phases and a small amount of β grains could be observed. The α′/α″ phase in Ti65–Zr27–Nb4–Ta4 and Ti65–Zr25–Nb5–Ta5 exhibited a plate-like structure. When the stability of the β phase in the alloy increased, the shape of the α′/α″ phase transformed from feather-like to plate-like [33]. Additionally, the size of the α′/α″ phase increased as the VEC of the alloy increased. The grain sizes of the residual β phase achieved through the quenching process in Ti65–Zr33–Nb1–Ta1, Ti65–Zr31–Nb2–Ta2, and Ti65–Zr29–Nb3–Ta3 were approximately 0.05 μm. Furthermore, a larger β grain size (>8 μm) could be clearly observed in Ti65–Zr25–Nb5–Ta5, which was attributable to the relatively high β volume fraction of this alloy. In addition, the α′/α″ phase precipitated at the β grain boundary and grew vertically into the β grains (Figure 3g).

3.2. Phase Identification

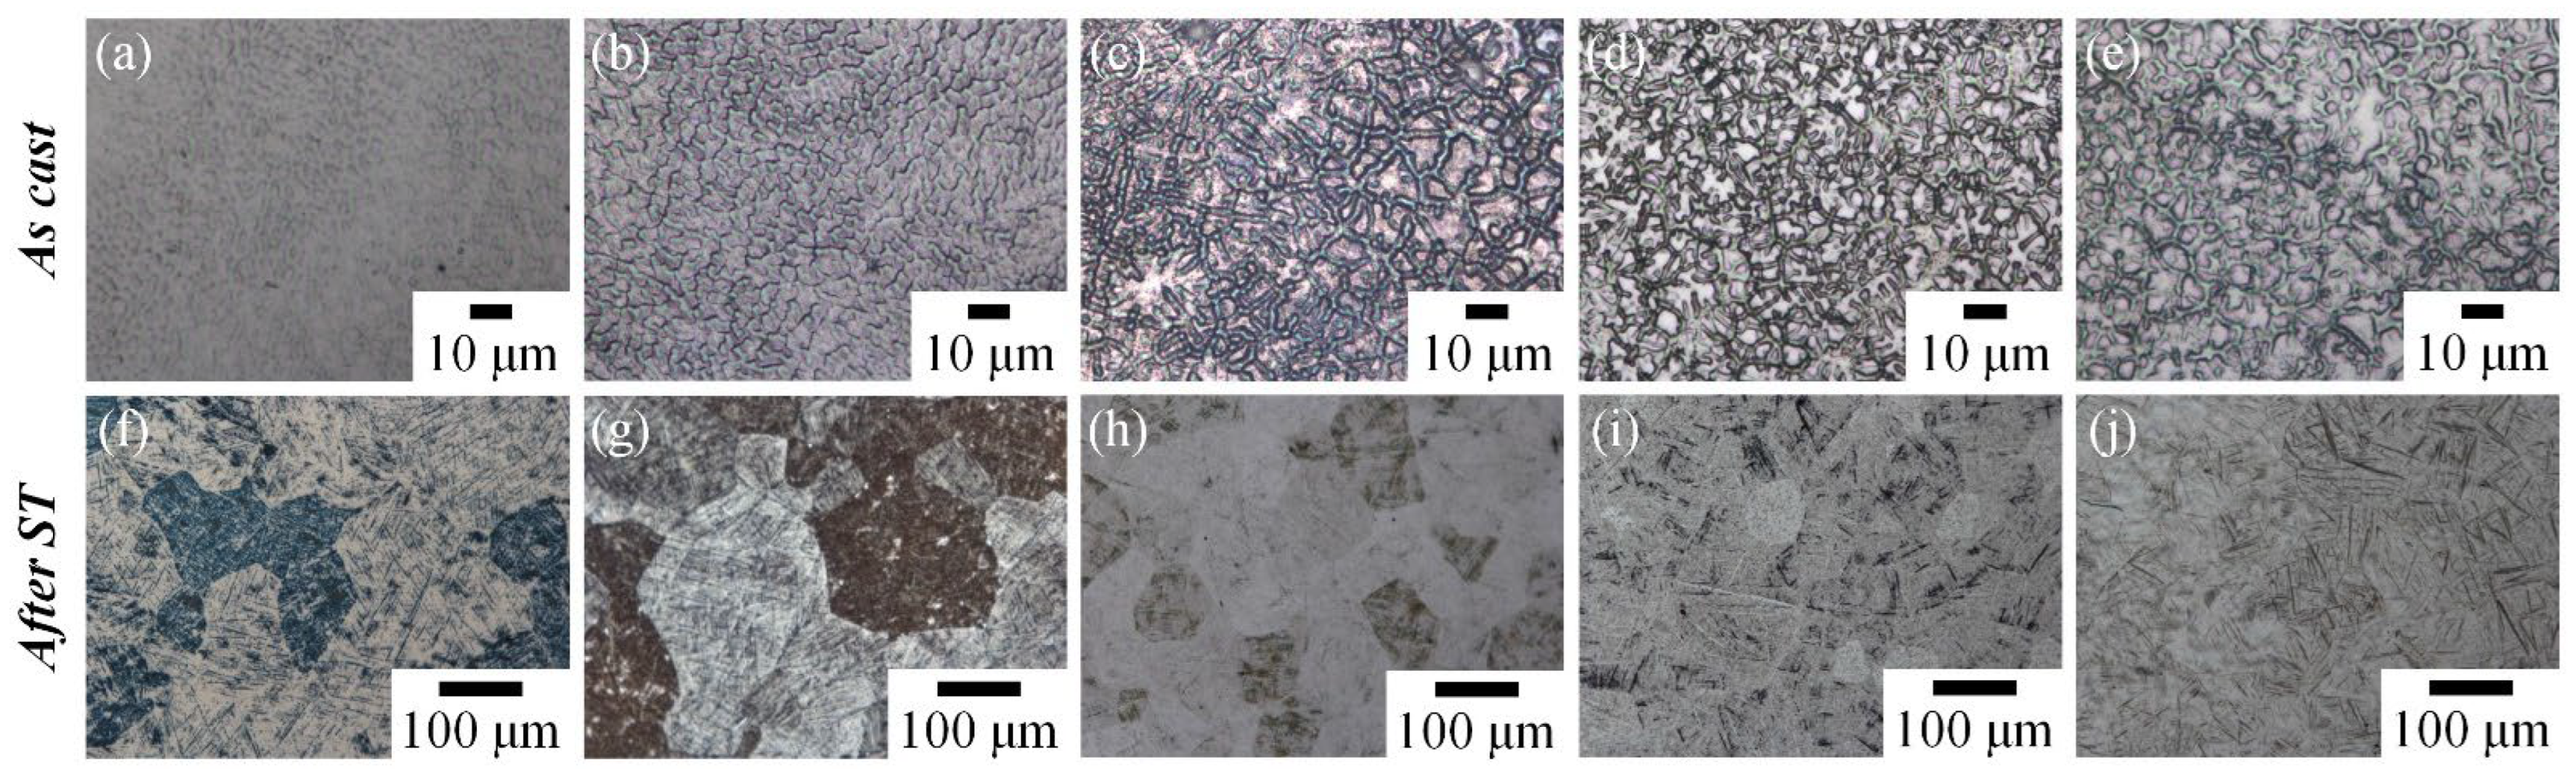
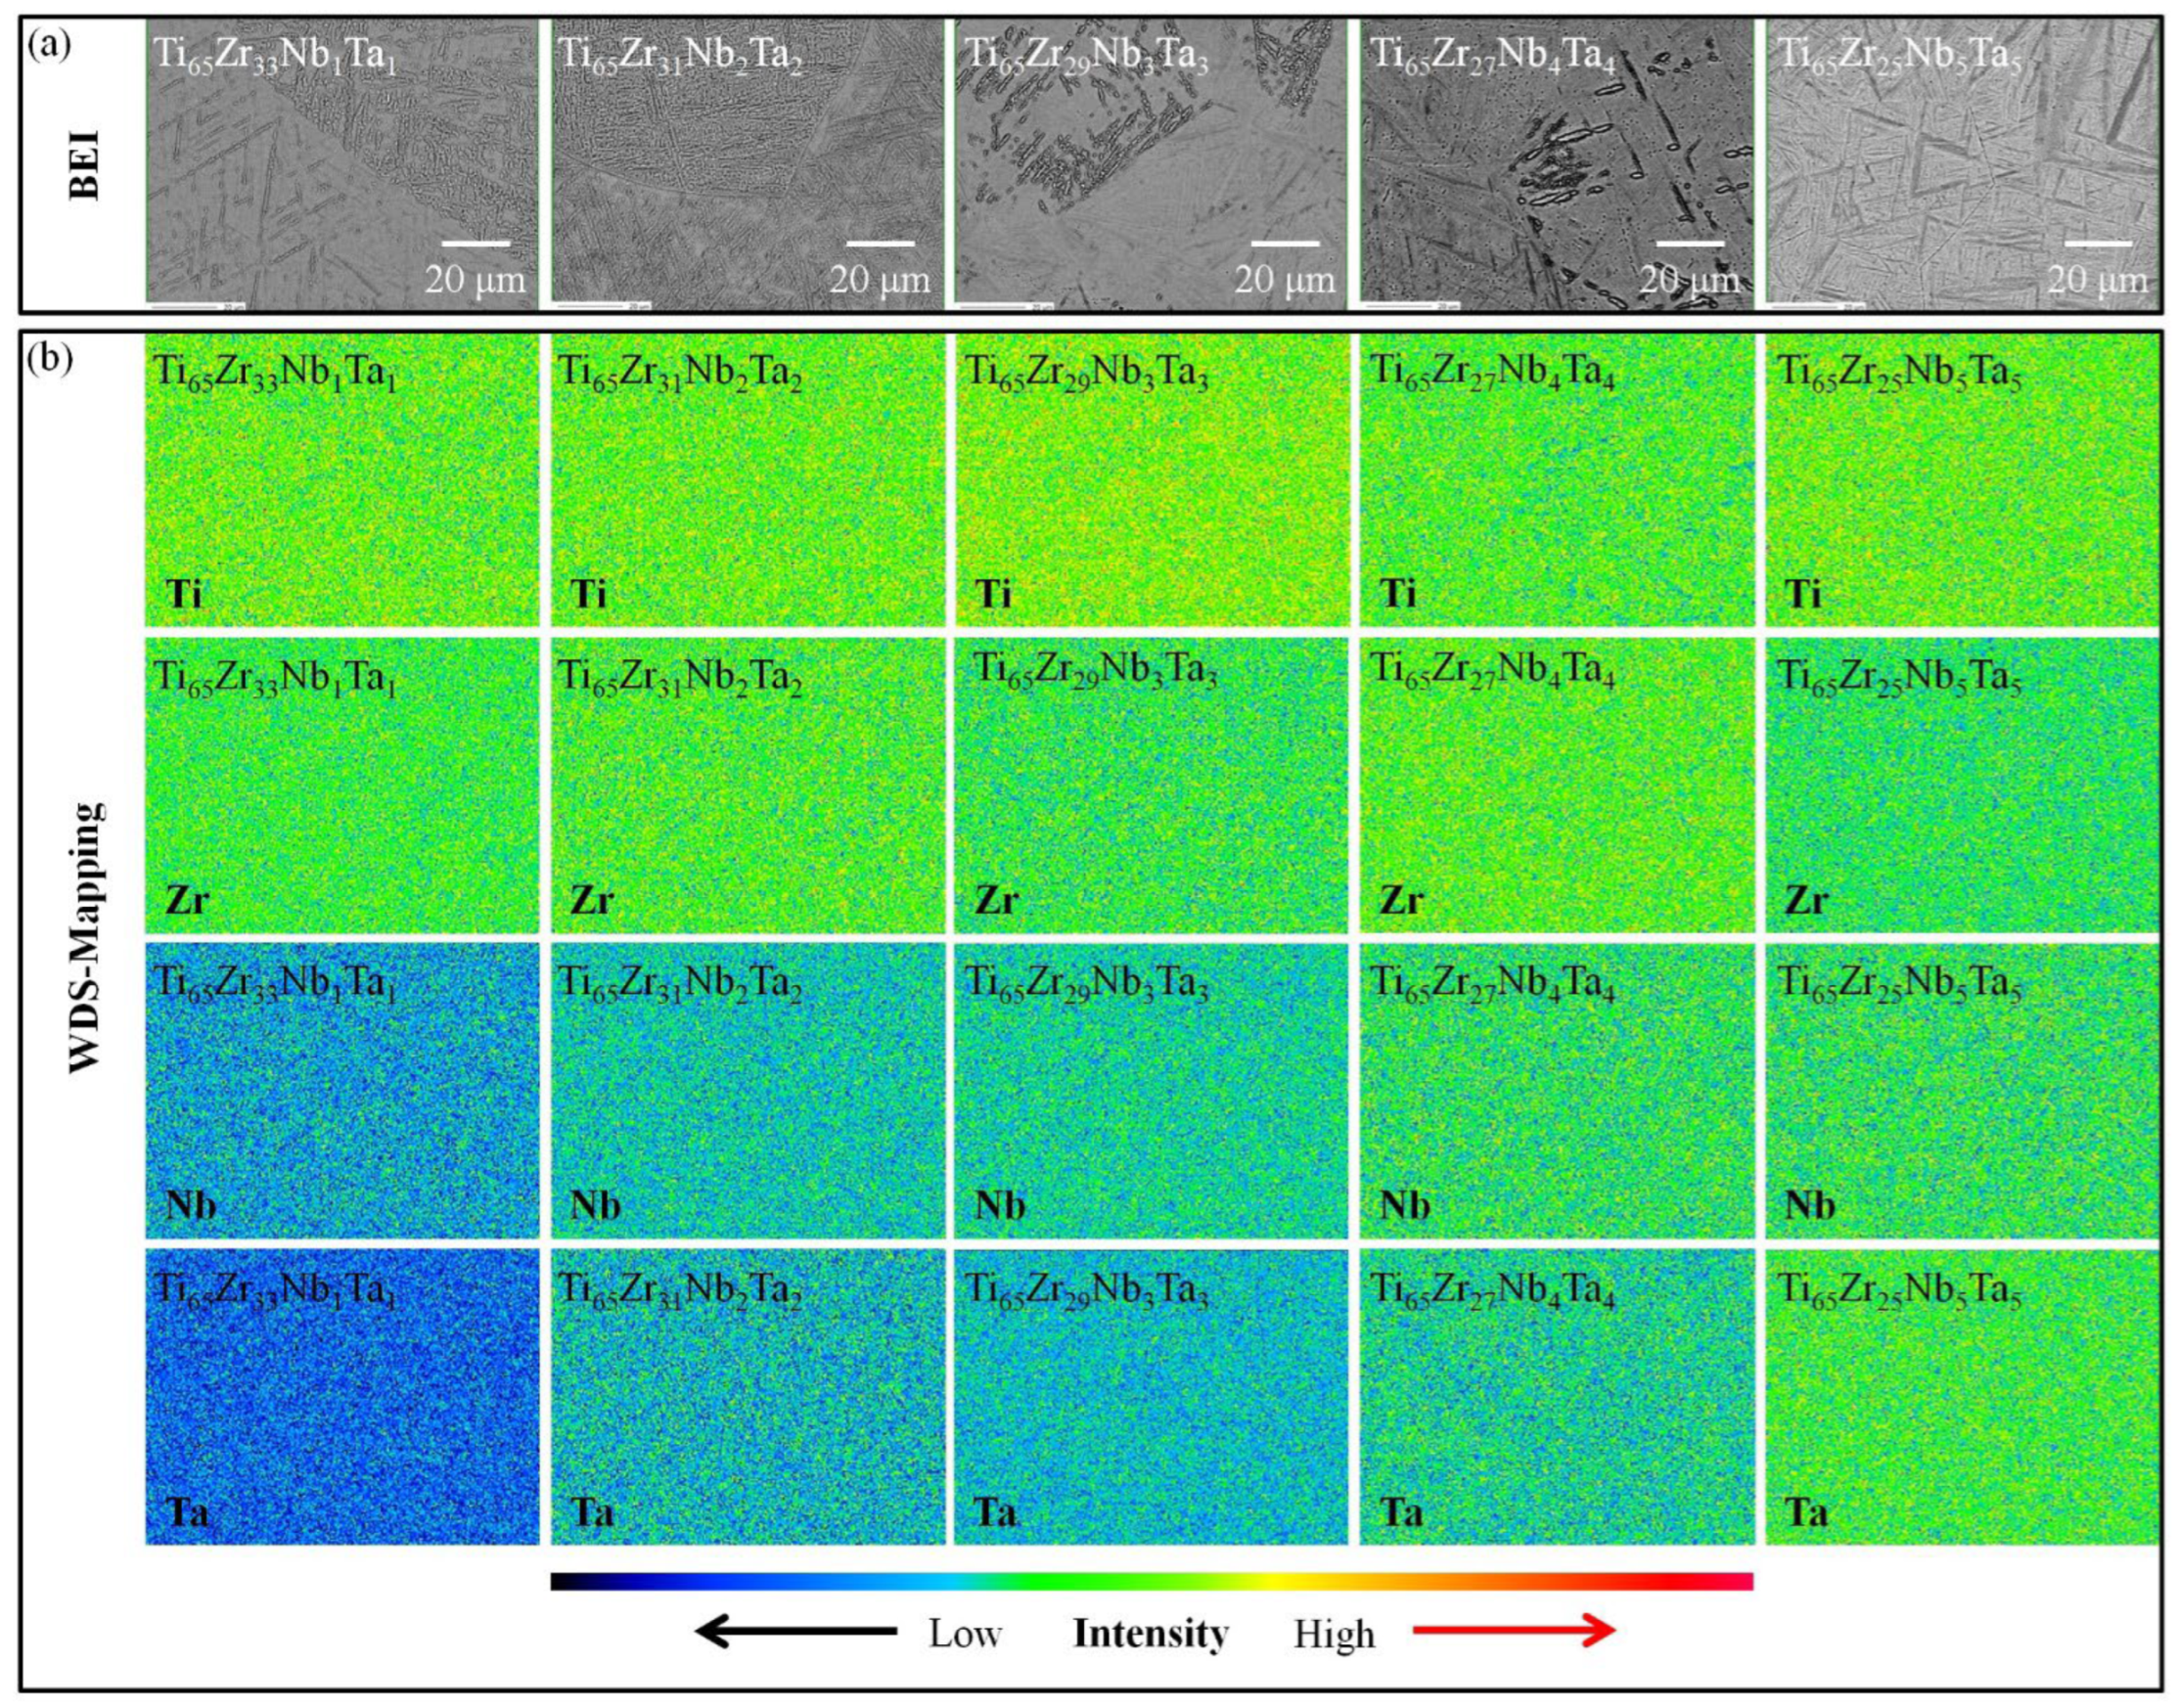
3.2.1. Optical Microscopy Analysis

OM images of the five Ti–Zr–Nb–Ta MEAs in as-cast and ST states are presented in Figure 4. In the as-cast state, all MEAs exhibited a dendritic structure. Among the as-cast MEAs, Ti65–Zr33–Nb1–Ta1 exhibited the smallest color contrast between the dendrite and interdendrite regions, attributable to its lower melting point (<1800 °C). By contrast, Ti65–Zr29–Nb3–Ta3, Ti65–Zr27–Nb4–Ta4, and Ti65–Zr25–Nb5–Ta5 exhibited the greatest color contrast between the dendrite and interdendrite regions; this was attributable to their higher melting point (>1800 °C). The degree of compositional segregation of an alloy in the as-cast state is related to the thermodynamic parameters [6,13,29]. For example, a low δ value can facilitate the uniform diffusion of alloying elements [29]. Although Ti65–Zr33–Nb1–Ta1 had the highest δ value (4.05), its melting point was the lowest, and ΔHmix was the closest to zero, which meant the lowest degree of compositional segregation in the alloy. The metallographic morphology of Ti65–Zr33–Nb1–Ta1 was still obscured by the dendritic structure because of the high δ value. In a previous study [13], as-cast Ti65–Zr18–Nb16–Mo1 exhibited both a low melting point and δ value; this indicated elemental uniformity comparable to that of the general ST state.
After ST treatment, the dendrites of the five MEAs were successfully eliminated, revealing an equiaxed and needle-like morphology. In the OM images of Ti65–Zr33–Nb1–Ta1 and Ti65–Zr31–Nb2–Ta2 in the ST state (Figure 4f,g), a large amount of needle-like structure could be clearly observed inside the equiaxed grains. In the results of EBSD, the needle-like and equiaxed grain structures were α′/α″ phase and residual β-phase grain boundaries, respectively. Furthermore, needle-like α′/α″ and numerous β-phase grain boundaries could be observed in the metallographic images of Ti65–Zr25–Nb5–Ta5 in the ST state.

3.2.2. Electron Probe Microanalysis

The WDS–EPMA mapping images of the five MEAs in the ST state are presented in Figure 5. The Ti, Zr, Nb, and Ta in the five MEAs were distributed uniformly. Because the melting points of Ta and Nb are much higher than those of Ti and Zr, we speculated that the alloy would have a wide solidification range (Tliquidus–Tsolidus) during solidification, which would lead to severe segregation of the alloy’s components [3]. Nguyen et al. [34] reported that Ti25–Zr25–Nb25–Ta25 must be annealed in a vacuum at 1200 °C for 24 h if a uniform composition is to be achieved. In the current study, Ti-rich MEAs with homogeneous alloy composition were obtained at a low temperature (900 °C) and within a short time (20 min). Furthermore, in the WDS mapping results, the five MEAs were not found to have considerably different compositions of α′, α″, and β phases after ST. However, the β phase of conventional Ti alloy systems contains more solute elements than the α′ or α″ phase; thus, the β phases should be easily resolvable in the mapping analysis. Because the phase structure of each alloy (β+α″+α′) in this study was not in a stable state, the compositions of the α′, α″, and β phases were not saturated, resulting in the small difference in the composition of α′, α″, and β phases.

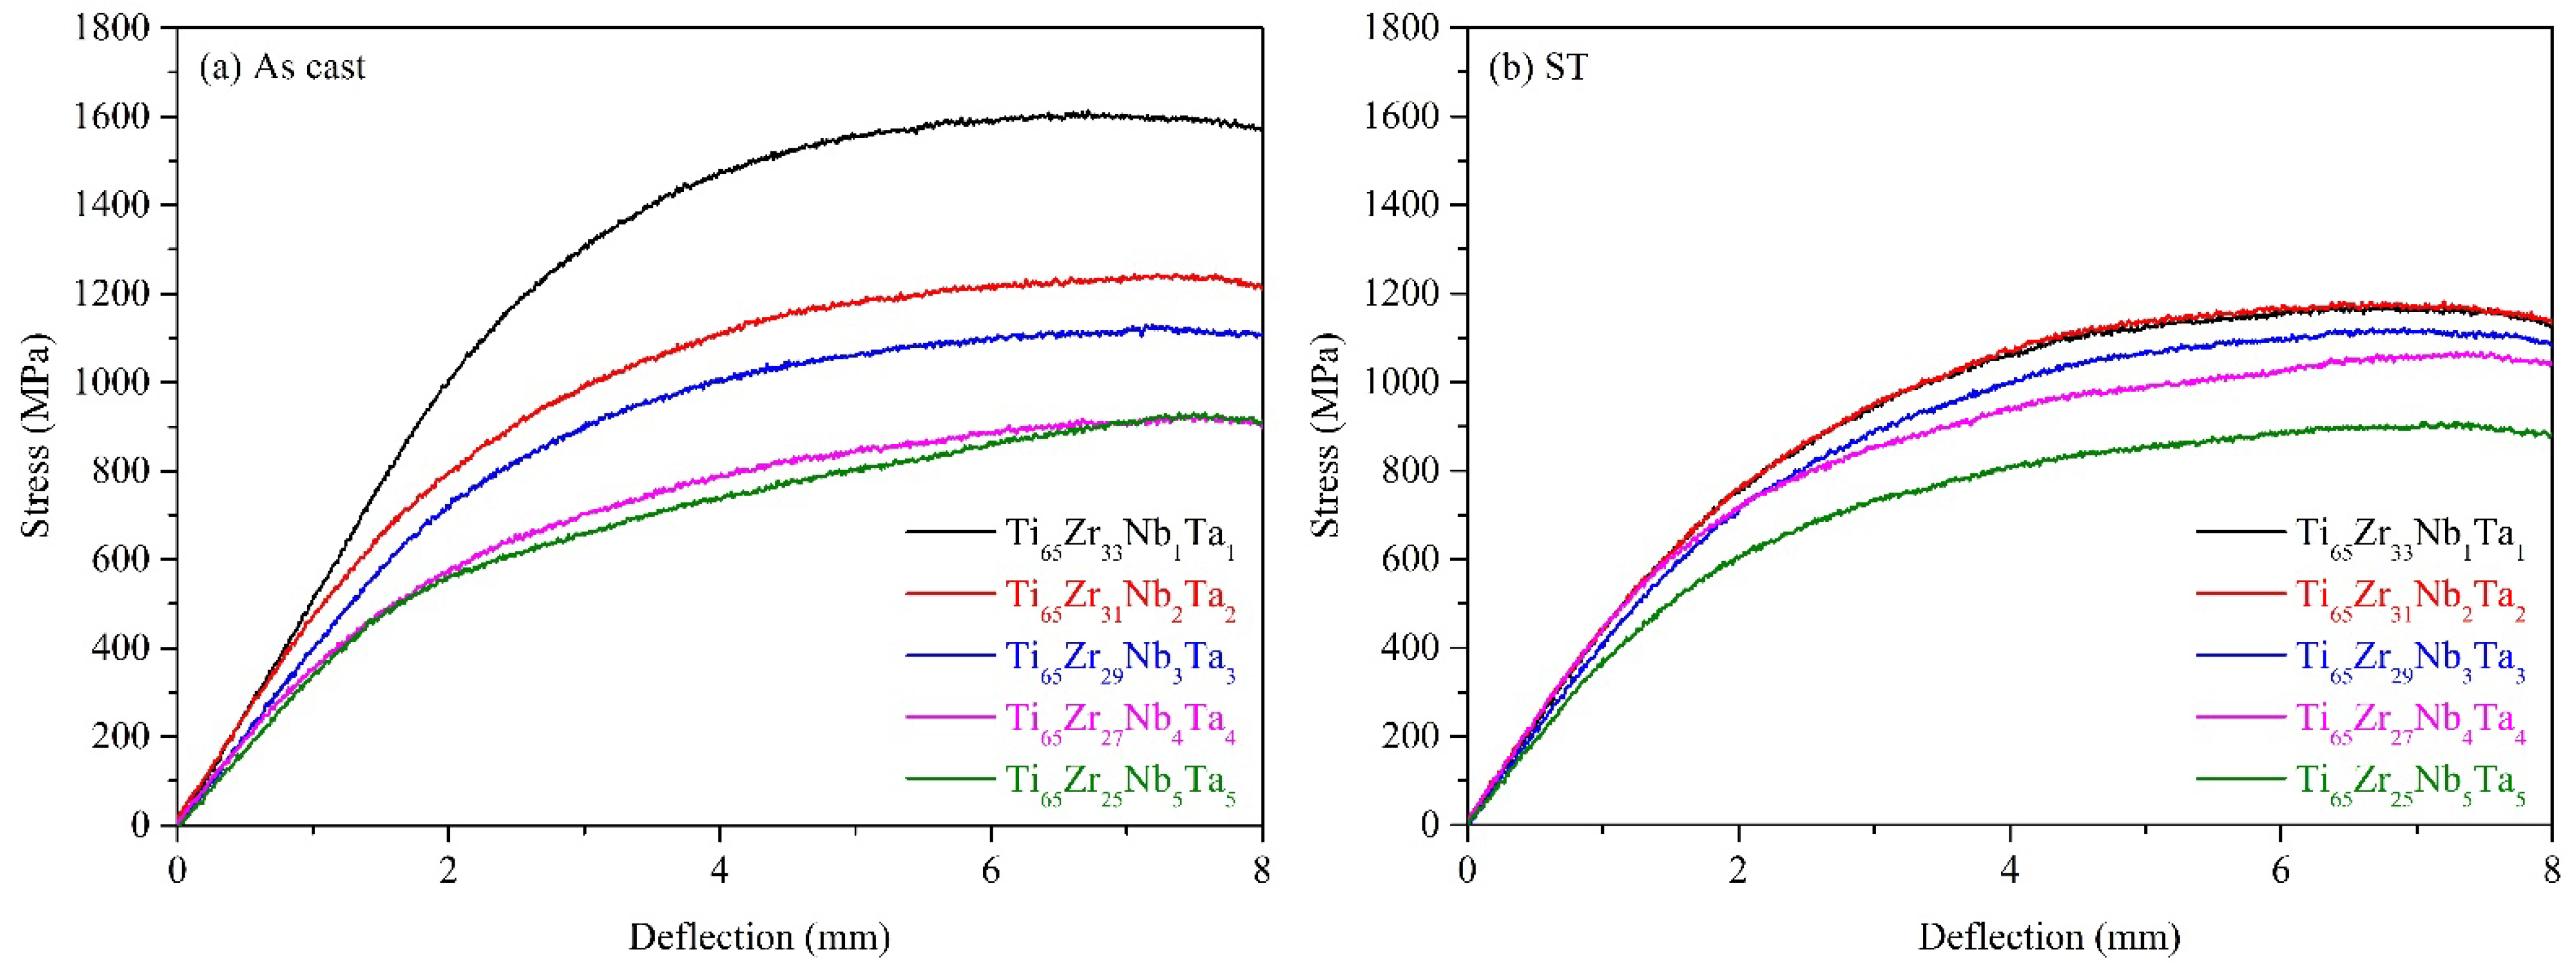
3.3. Mechanical Properties

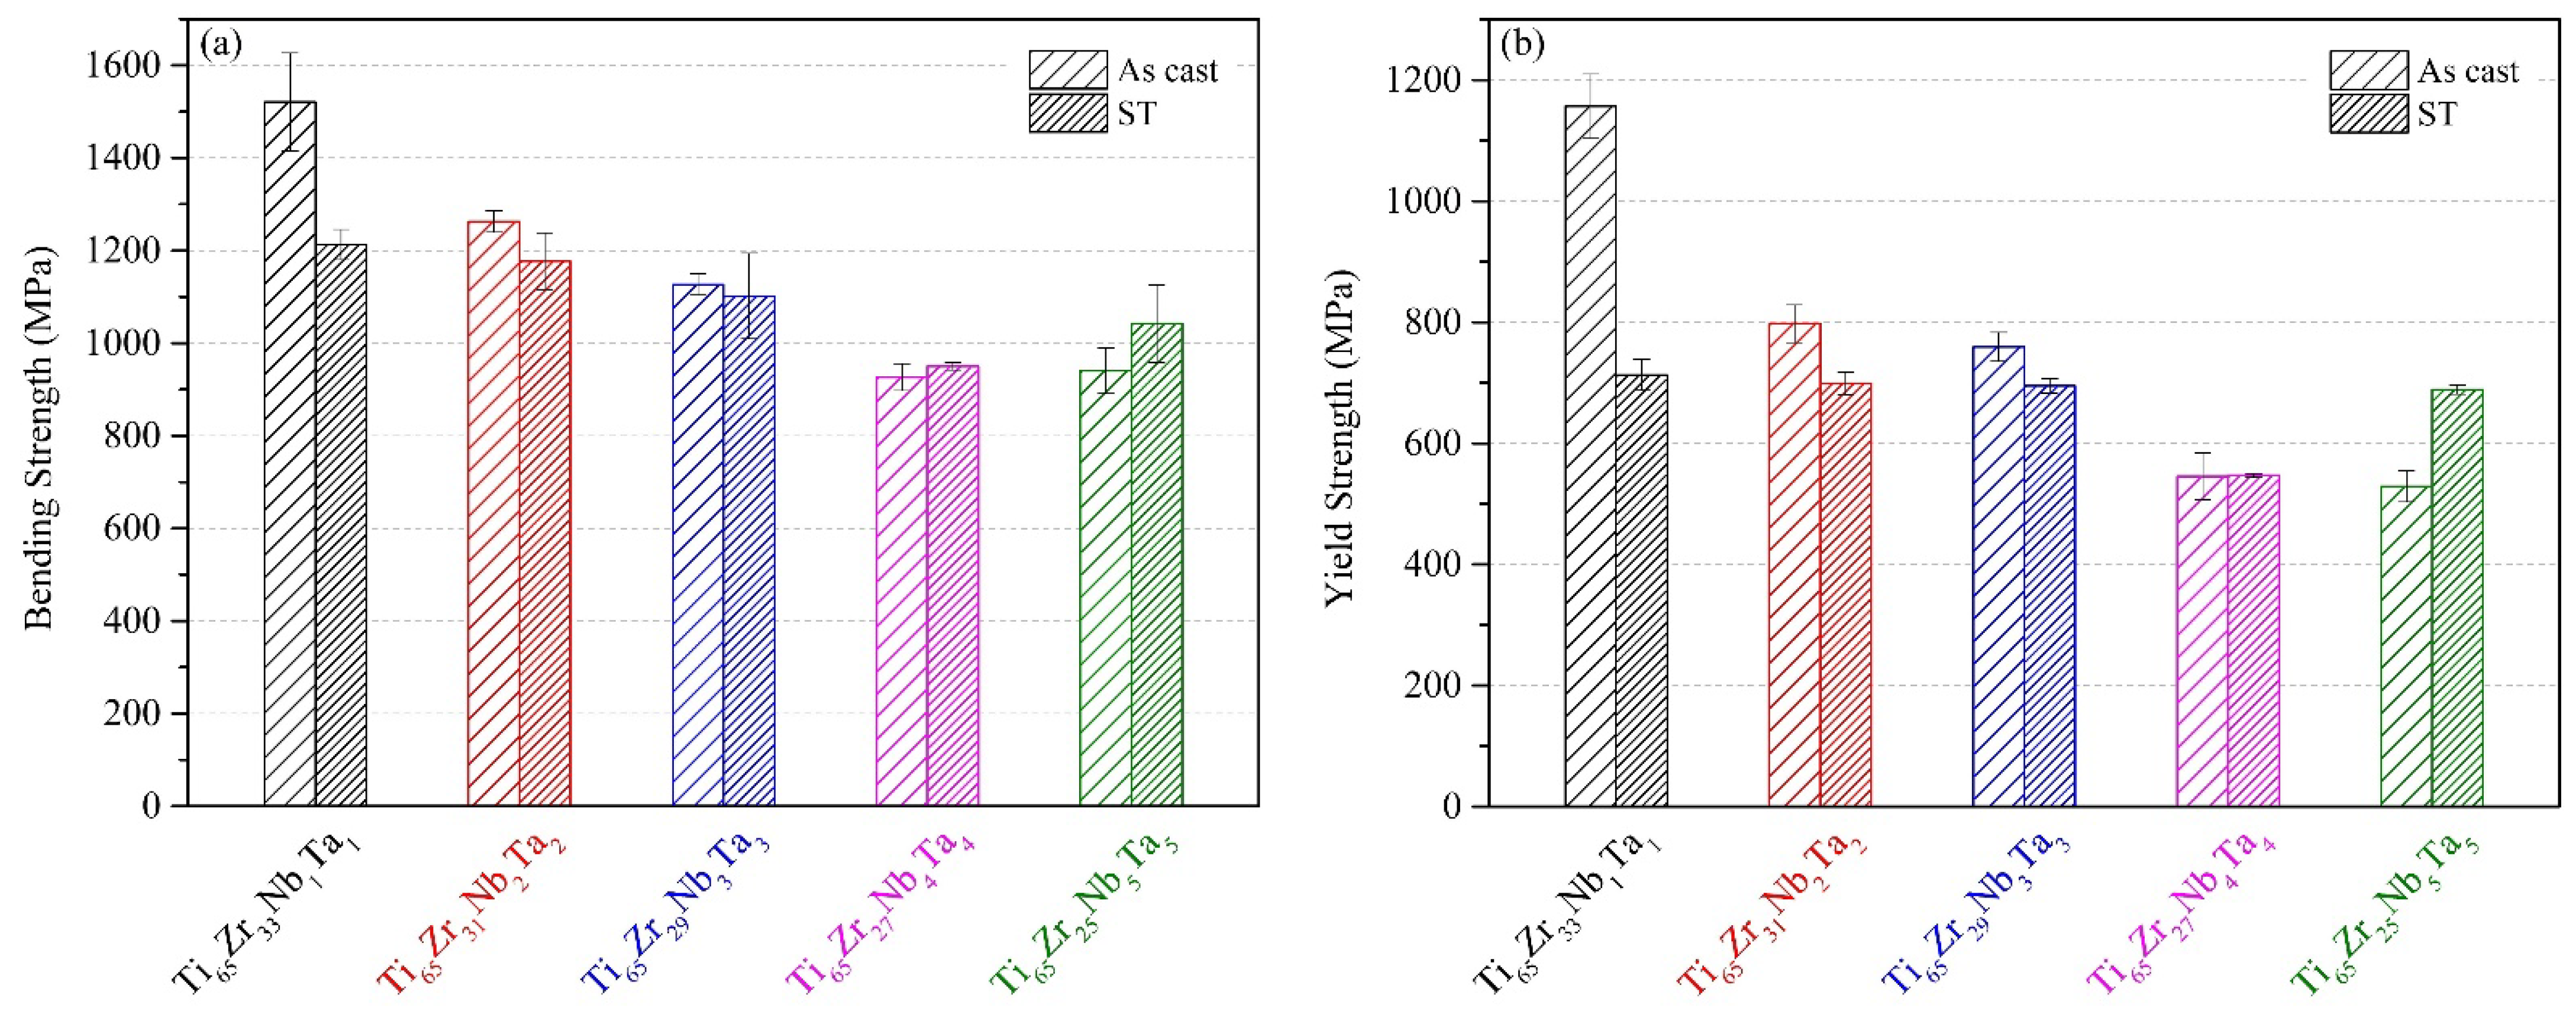
3.3.1. Bending Strength

The stress–deflection curves of the Ti–Zr–Nb–Ta MEAs in as-cast and ST states were obtained using the three-point bending test and are presented in Figure 6a,b, respectively. All MEAs reached the maximum deflection value (8 mm) in the three-point bending test, which was the same as those of Ti–6Al–4V (extra low interstitials) [29], Co–Cr–Mo [29], and 316L stainless steel [29]. The above results indicate that all MEAs had excellent deformability. Notably, double yielding was observed in the curves of both Ti65–Zr27–Nb4–Ta4 and Ti65–Zr25–Nb5–Ta5; this is characteristic of a stress-induced martensitic (SIM) transformation [35]. Because the VECs of Ti65–Zr27–Nb4–Ta4 and Ti65–Zr25–Nb5–Ta5 were close to the range 4.16–4.18 (metastable state), the SIM transformation occurred during the three-point bending test.
The bending and yield strengths of the MEAs obtained using three-point bending tests are presented in Figure 7a,b, respectively. The bending strengths of the MEAs under each condition were higher than 900 MPa, whereas the yield strengths were higher than 500 MPa. As-cast Ti65–Zr33–Nb1–Ta1 exhibited the highest bending strength (1521 MPa) and yield strength (1156 MPa). By contrast, as-cast Ti65–Zr27–Nb4–Ta4 exhibited the lowest bending strength (926 MPa), and as-cast Ti65–Zr25–Nb5–Ta5 exhibited the lowest yield strength (529 MPa). The highest strength of Ti65–Zr33–Nb1–Ta1 is mainly attributable to it having the highest δ value. However, the bending strength and yield strength of Ti65–Zr33–Nb1–Ta1 were 20% and 38% lower, respectively, after ST. As-cast Ti65–Zr33–Nb1–Ta1 exhibited abnormally high strength, which is presumed to be caused by the interaction between its high δ value and dislocation [36]. The bending strengths and yield strengths of Ti65–Zr31–Nb2–Ta2 and Ti65–Zr29–Nb3–Ta3 were lower after ST. By contrast, the bending strengths and yield strengths of Ti65–Zr27–Nb4–Ta4 and Ti65–Zr25–Nb5–Ta5 were higher after ST because the interaction between lattice distortion and the solid-solution strengthening effect was maximized after ST [37].

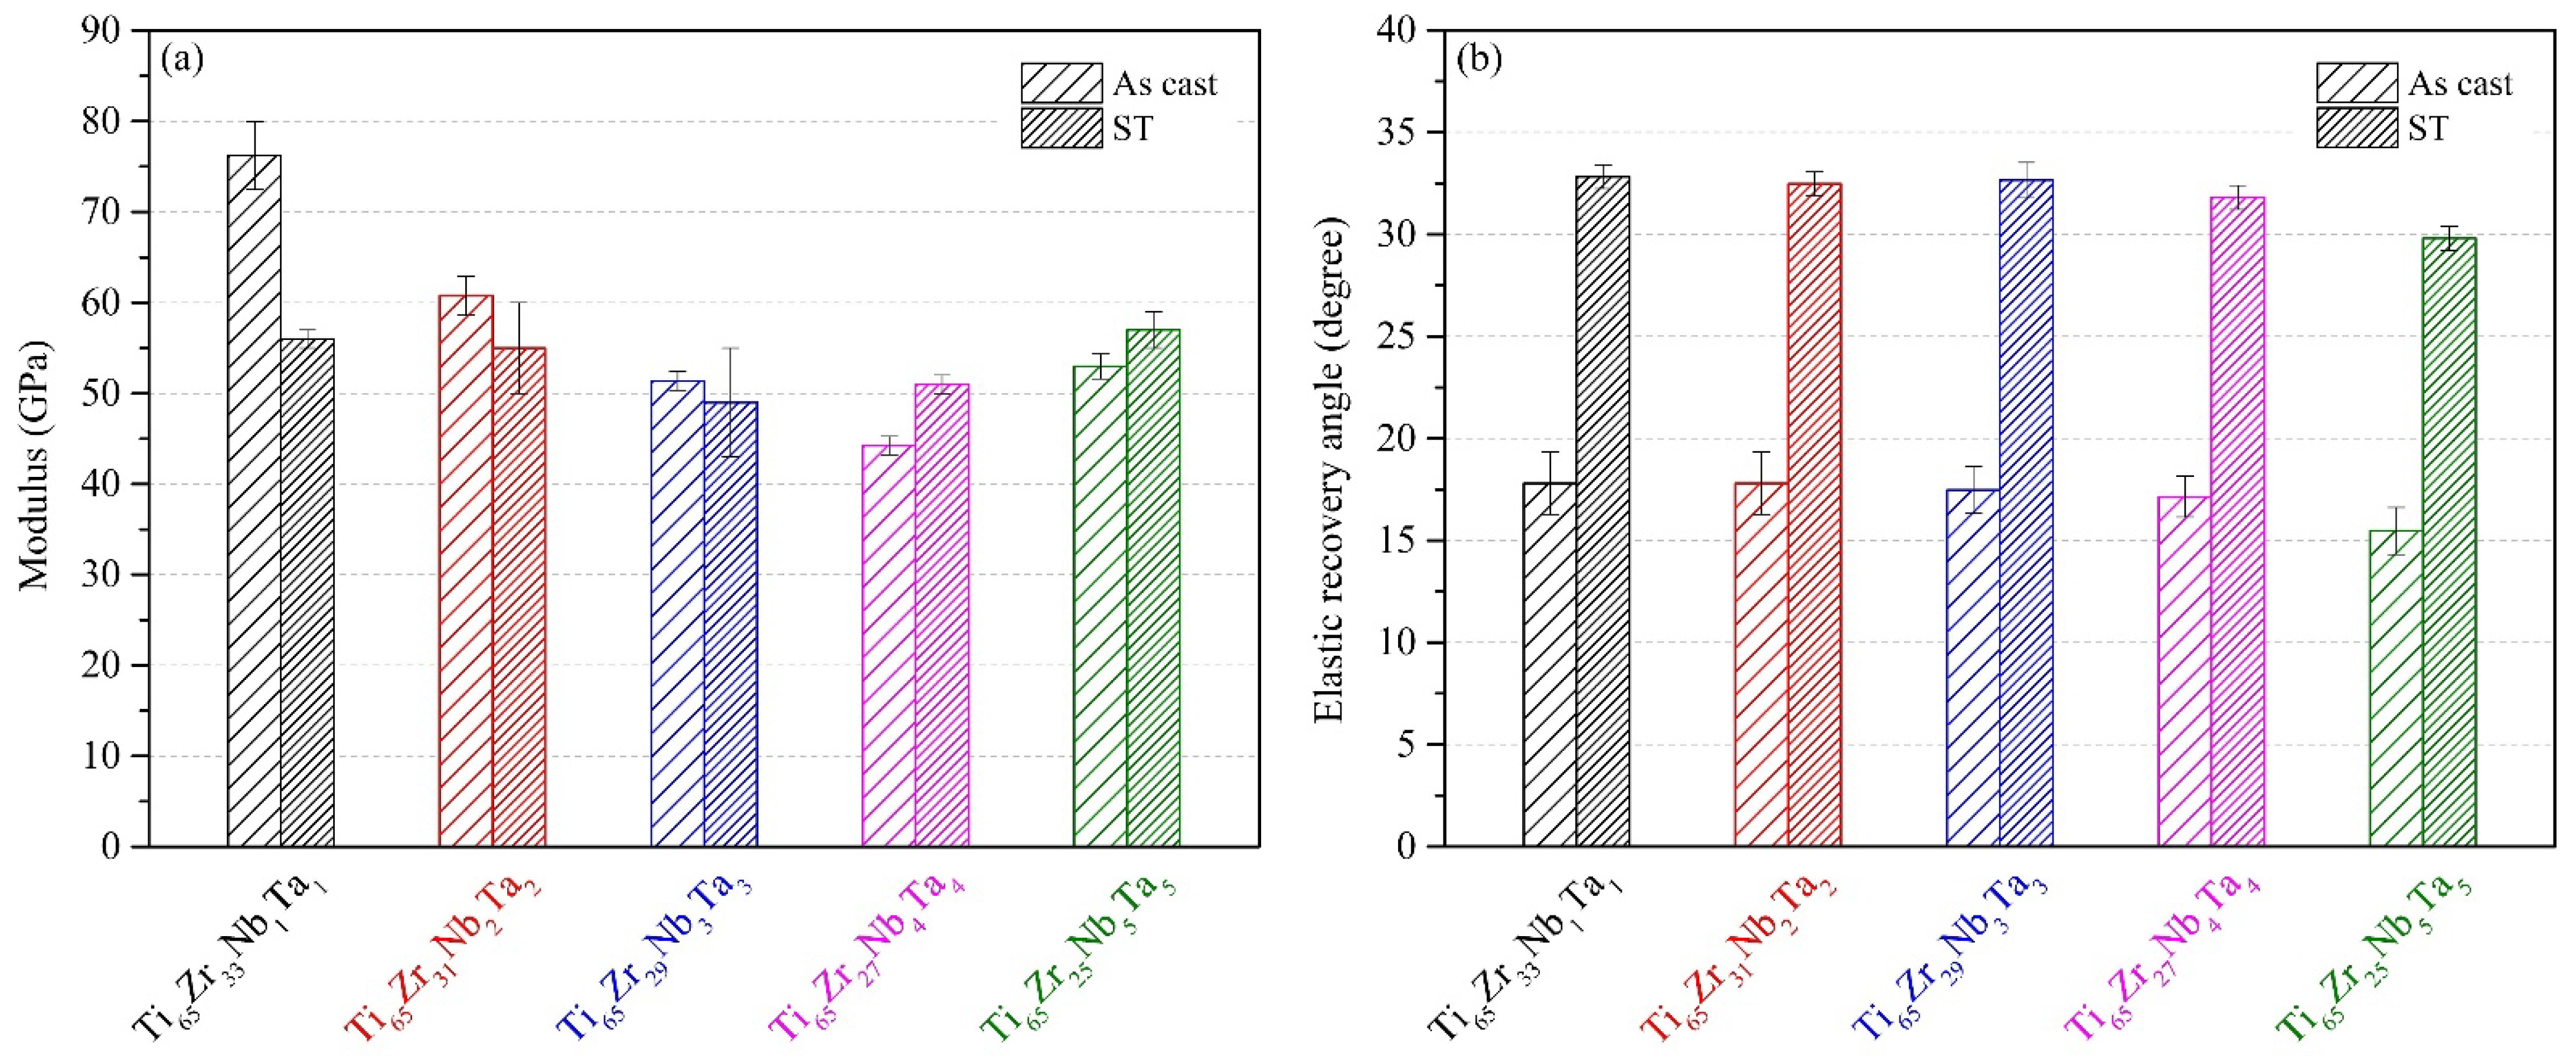
3.3.2. Elastic Properties

The elastic moduli and elastic recovery angles of the MEAs were obtained using three-point bending tests and are presented in Figure 8. The elastic moduli of the five MEAs had the same trend as their bending strength. Unsurprisingly, as-cast Ti65–Zr33–Nb1–Ta1, which had the highest bending strength and yield strength, also had the highest elastic modulus (76.2 GPa). Ti65–Zr29–Nb3–Ta3 after ST had the lowest elastic modulus (49 GPa), which was significantly lower than that of Ti65–Zr18–Nb16–Mo1 MEA (61 GPa) with metastable β phase [13]. The elastic moduli of Ti alloys are strongly related to their phase structure [38]. Studies have reported that the metastable β phase has a lower elastic modulus than the β+α″ or α″ phase [39,40], but others have found that the opposite is true [16,41]. This is because the elastic modulus of a specific phase in a Ti alloy can be highly dependent on the alloy’s composition [42,43]. Comparing the MEAs after ST, Ti65–Zr29–Nb3–Ta3 had an ultra-low elastic modulus (49.1 GPa) because of its large amount of α″ phase. A similar trend was discovered in the Ti–Nb–Sn–Zr/Fe system [41]. Both Ti–18Nb–8Sn–7Zr (wt.%) and Ti–19Nb–8Sn–0.5Fe (wt.%), which had the greatest amount of α″ phase, had low elastic moduli (~50 GPa) [41]. Conversely, Ti65–Zr33–Nb1–Ta1, which had the least amount of α′ phase, had a higher elastic modulus (56 GPa).
Ti65–Zr33–Nb1–Ta1 in as-cast and ST conditions had a large elastic recovery angle (17.8° and 32.8°, respectively), whereas Ti65–Zr25–Nb5–Ta5 in as-cast and ST conditions had a small elastic recovery angle (15.5° and 29.8°, respectively). Notably, the elastic recovery angles of the MEAs were 2-fold higher after ST because of the internal defects in the alloy being eliminated during the heat treatment. Furthermore, the elastic recovery angles of all solution-treated Ti–Zr–Nb–Ta MEAs (31.8°–32.8°) were significantly greater than those of CP–Ti (9°) and Ti–15Mo (27°) [44]. The elastic recovery ability of an alloy is strongly related to its elastic modulus, and Ti alloys with low elastic moduli generally have higher elastic recovery angles [43]. In the present study, however, Ti65–Zr33–Nb1–Ta1, which had a high elastic modulus, had the greatest elastic recovery angle. Furthermore, the elastic recovery angles of the MEAs were slightly lower than those of Ti alloys with similar elastic moduli. Both of these phenomena are attributable to the lattice distortion effect of HEAs, which hinders the elastic deformation of alloys. Because Ti65–Zr33–Nb1–Ta1 had the lowest δ value, its elastic deformability was negatively affected by lattice distortion to a smaller degree. The degrees of lattice distortion of the MEAs were much greater than those of Ti alloys, resulting in lower elastic deformation capacity. Nevertheless, all the MEAs still had small elastic moduli (49–57 GPa) and large elastic recovery angles (29.8–32.8°).

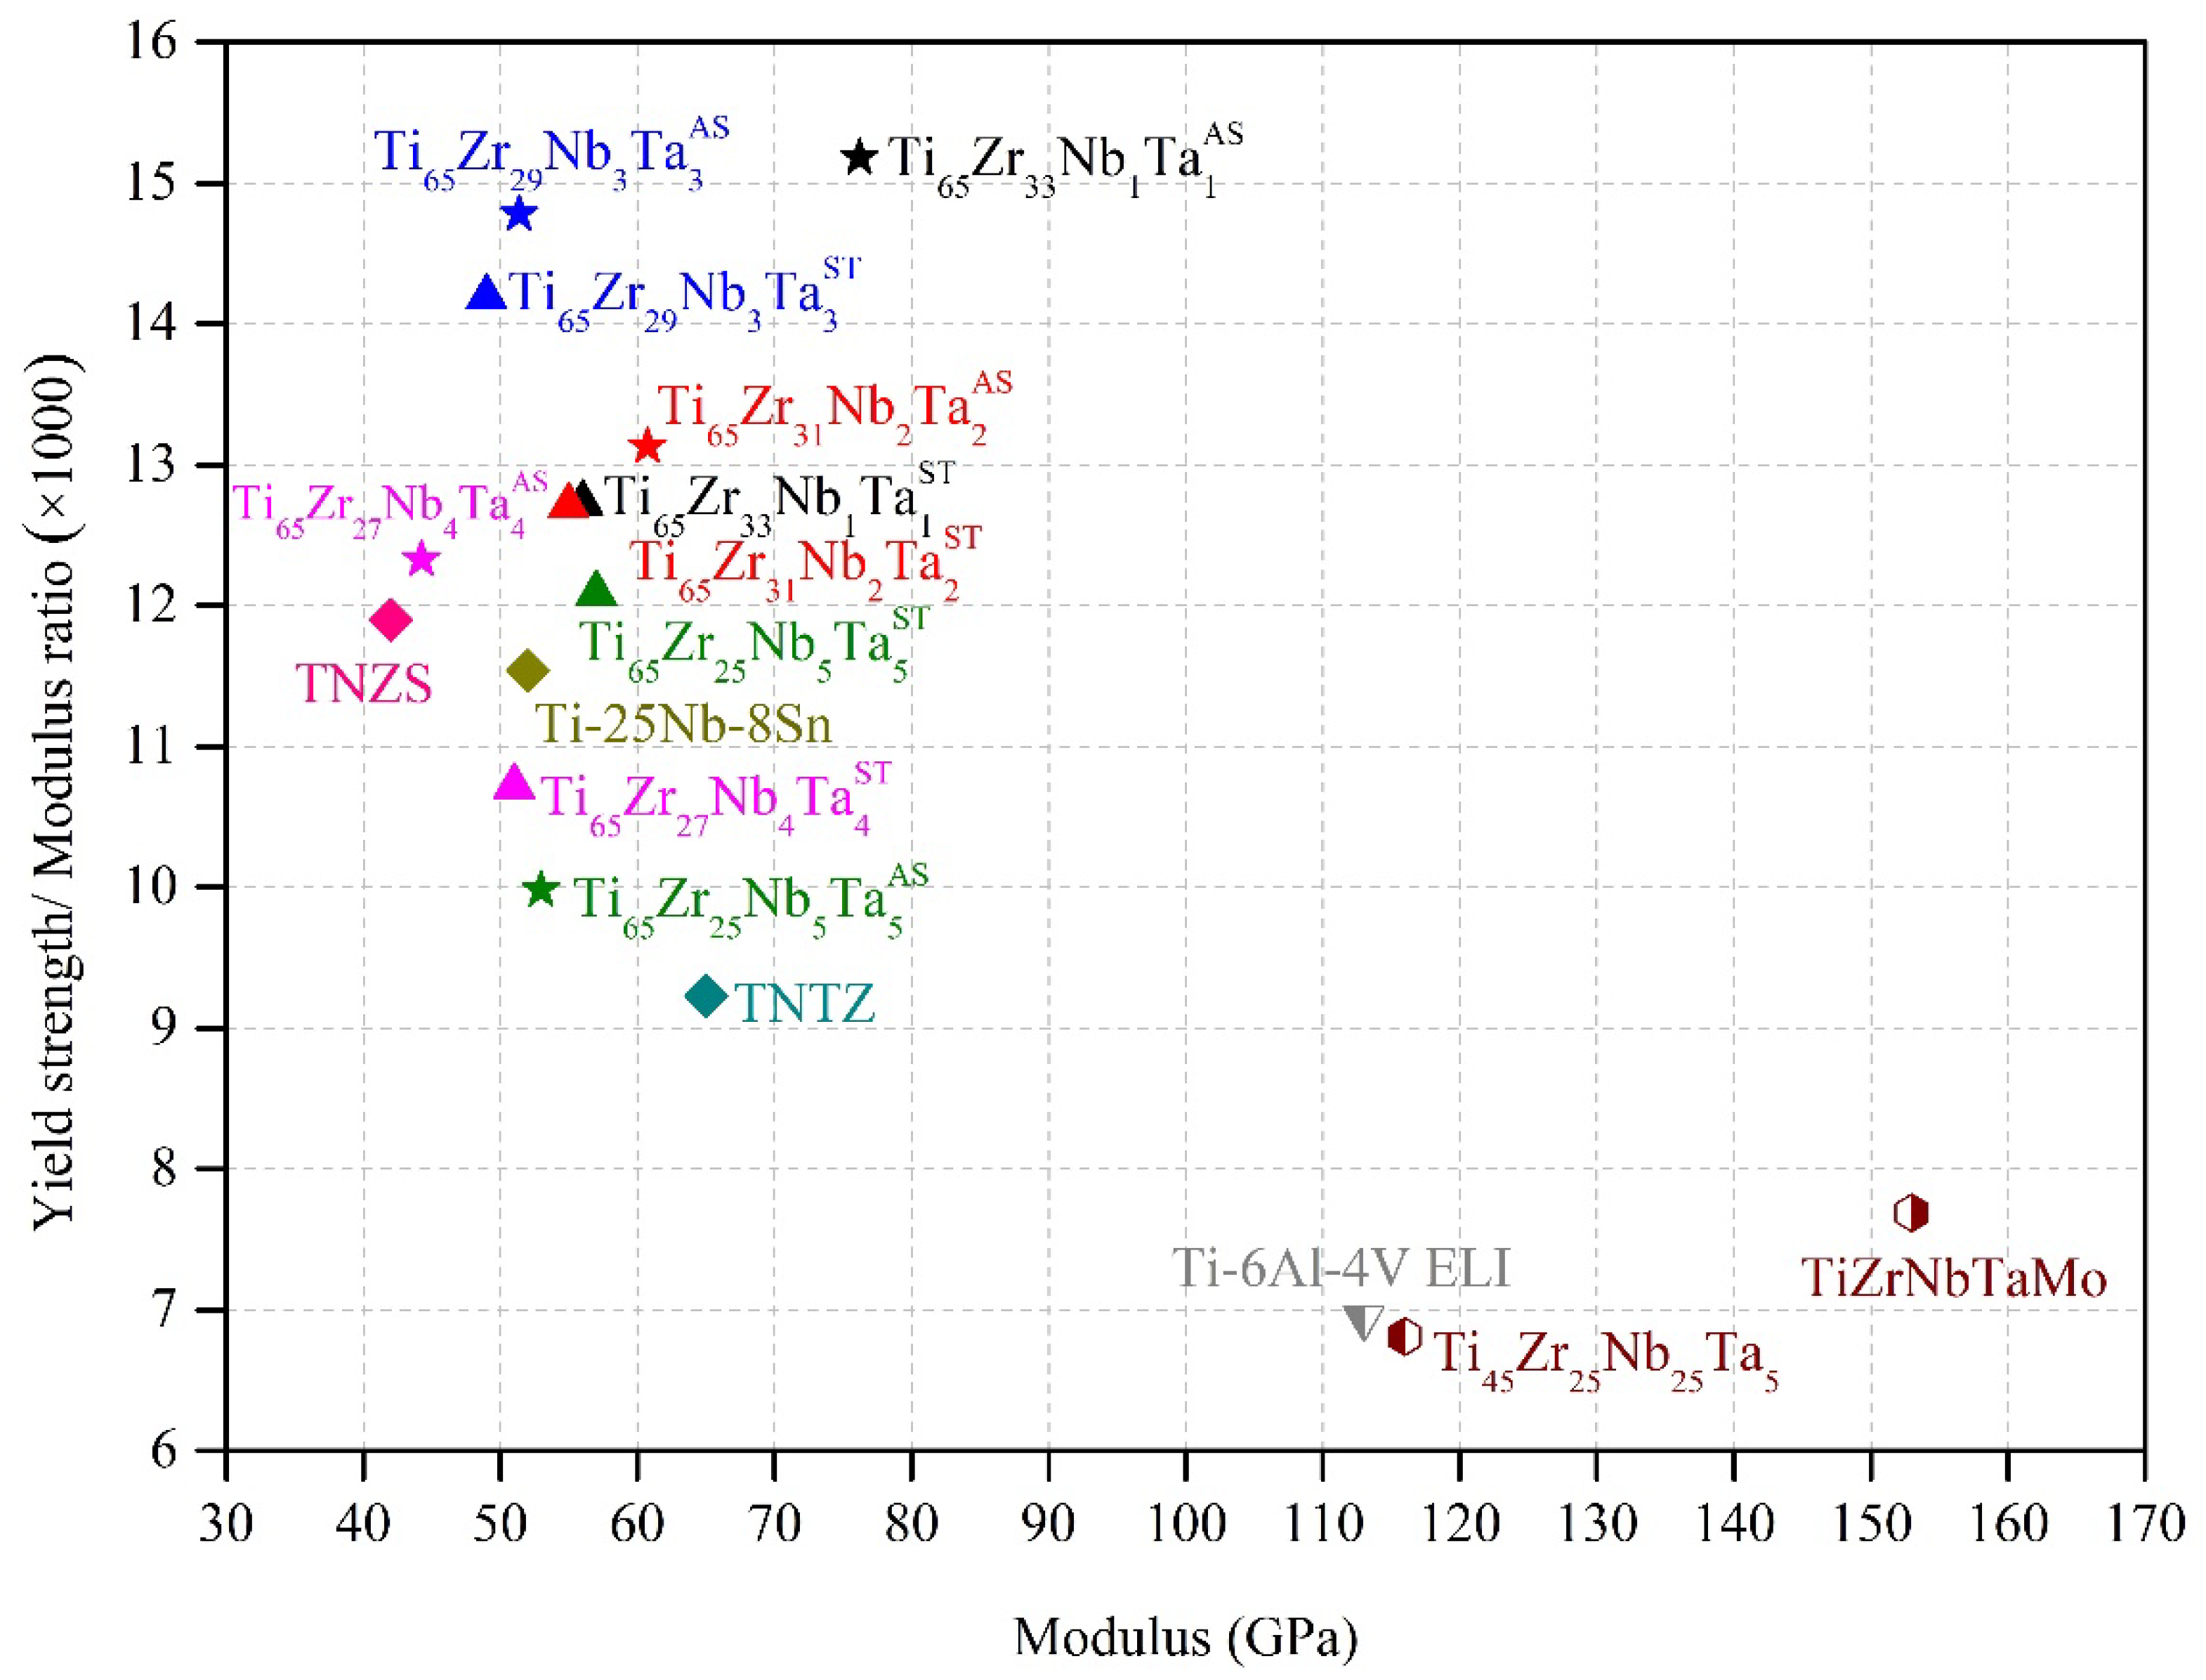
3.3.3. Yield Strength–Elastic Modulus Ratios (×1000)

The ideal biomedical implant has both high mechanical strength and a low elastic modulus. The yield strength–elastic modulus (σy/E) ratios (×1000) of all MEAs in this study are presented in Figure 9. All MEAs had ultra-high σy/E values (≥10) in both as-cast and ST conditions, and their values were considerably higher than those of Ti–6Al–4V extra-low interstitial (ELI) [13], biomedical HEAs and MEAs [3,45], and some metastable Ti alloys [46,47,48]. Among them, as-cast Ti65–Zr33–Nb1–Ta1 had the highest σy/E value (15.2), and as-cast Ti65–Zr29–Nb3–Ta3 had the second highest σy/E value (14.8). As-cast Ti65–Zr33–Nb1–Ta1 had a high σy/E value because of its high yield strength (>1500 MPa), whereas as-cast Ti65–Zr29–Nb3–Ta3 had a high σy/E value because of its low elastic modulus (~50 GPa). The σy/E values of as-cast Ti65–Zr33–Nb1–Ta1 and Ti65–Zr29–Nb3–Ta3 were 64% and 60% higher than that of Ti–29Nb–13Ta–4.6Zr [47], respectively. Ti65–Zr29–Nb3–Ta3 also had a very high σy/E value (15.2) after ST; therefore, it can potentially be used in biomedical implants.

3.4. Corrosion Properties

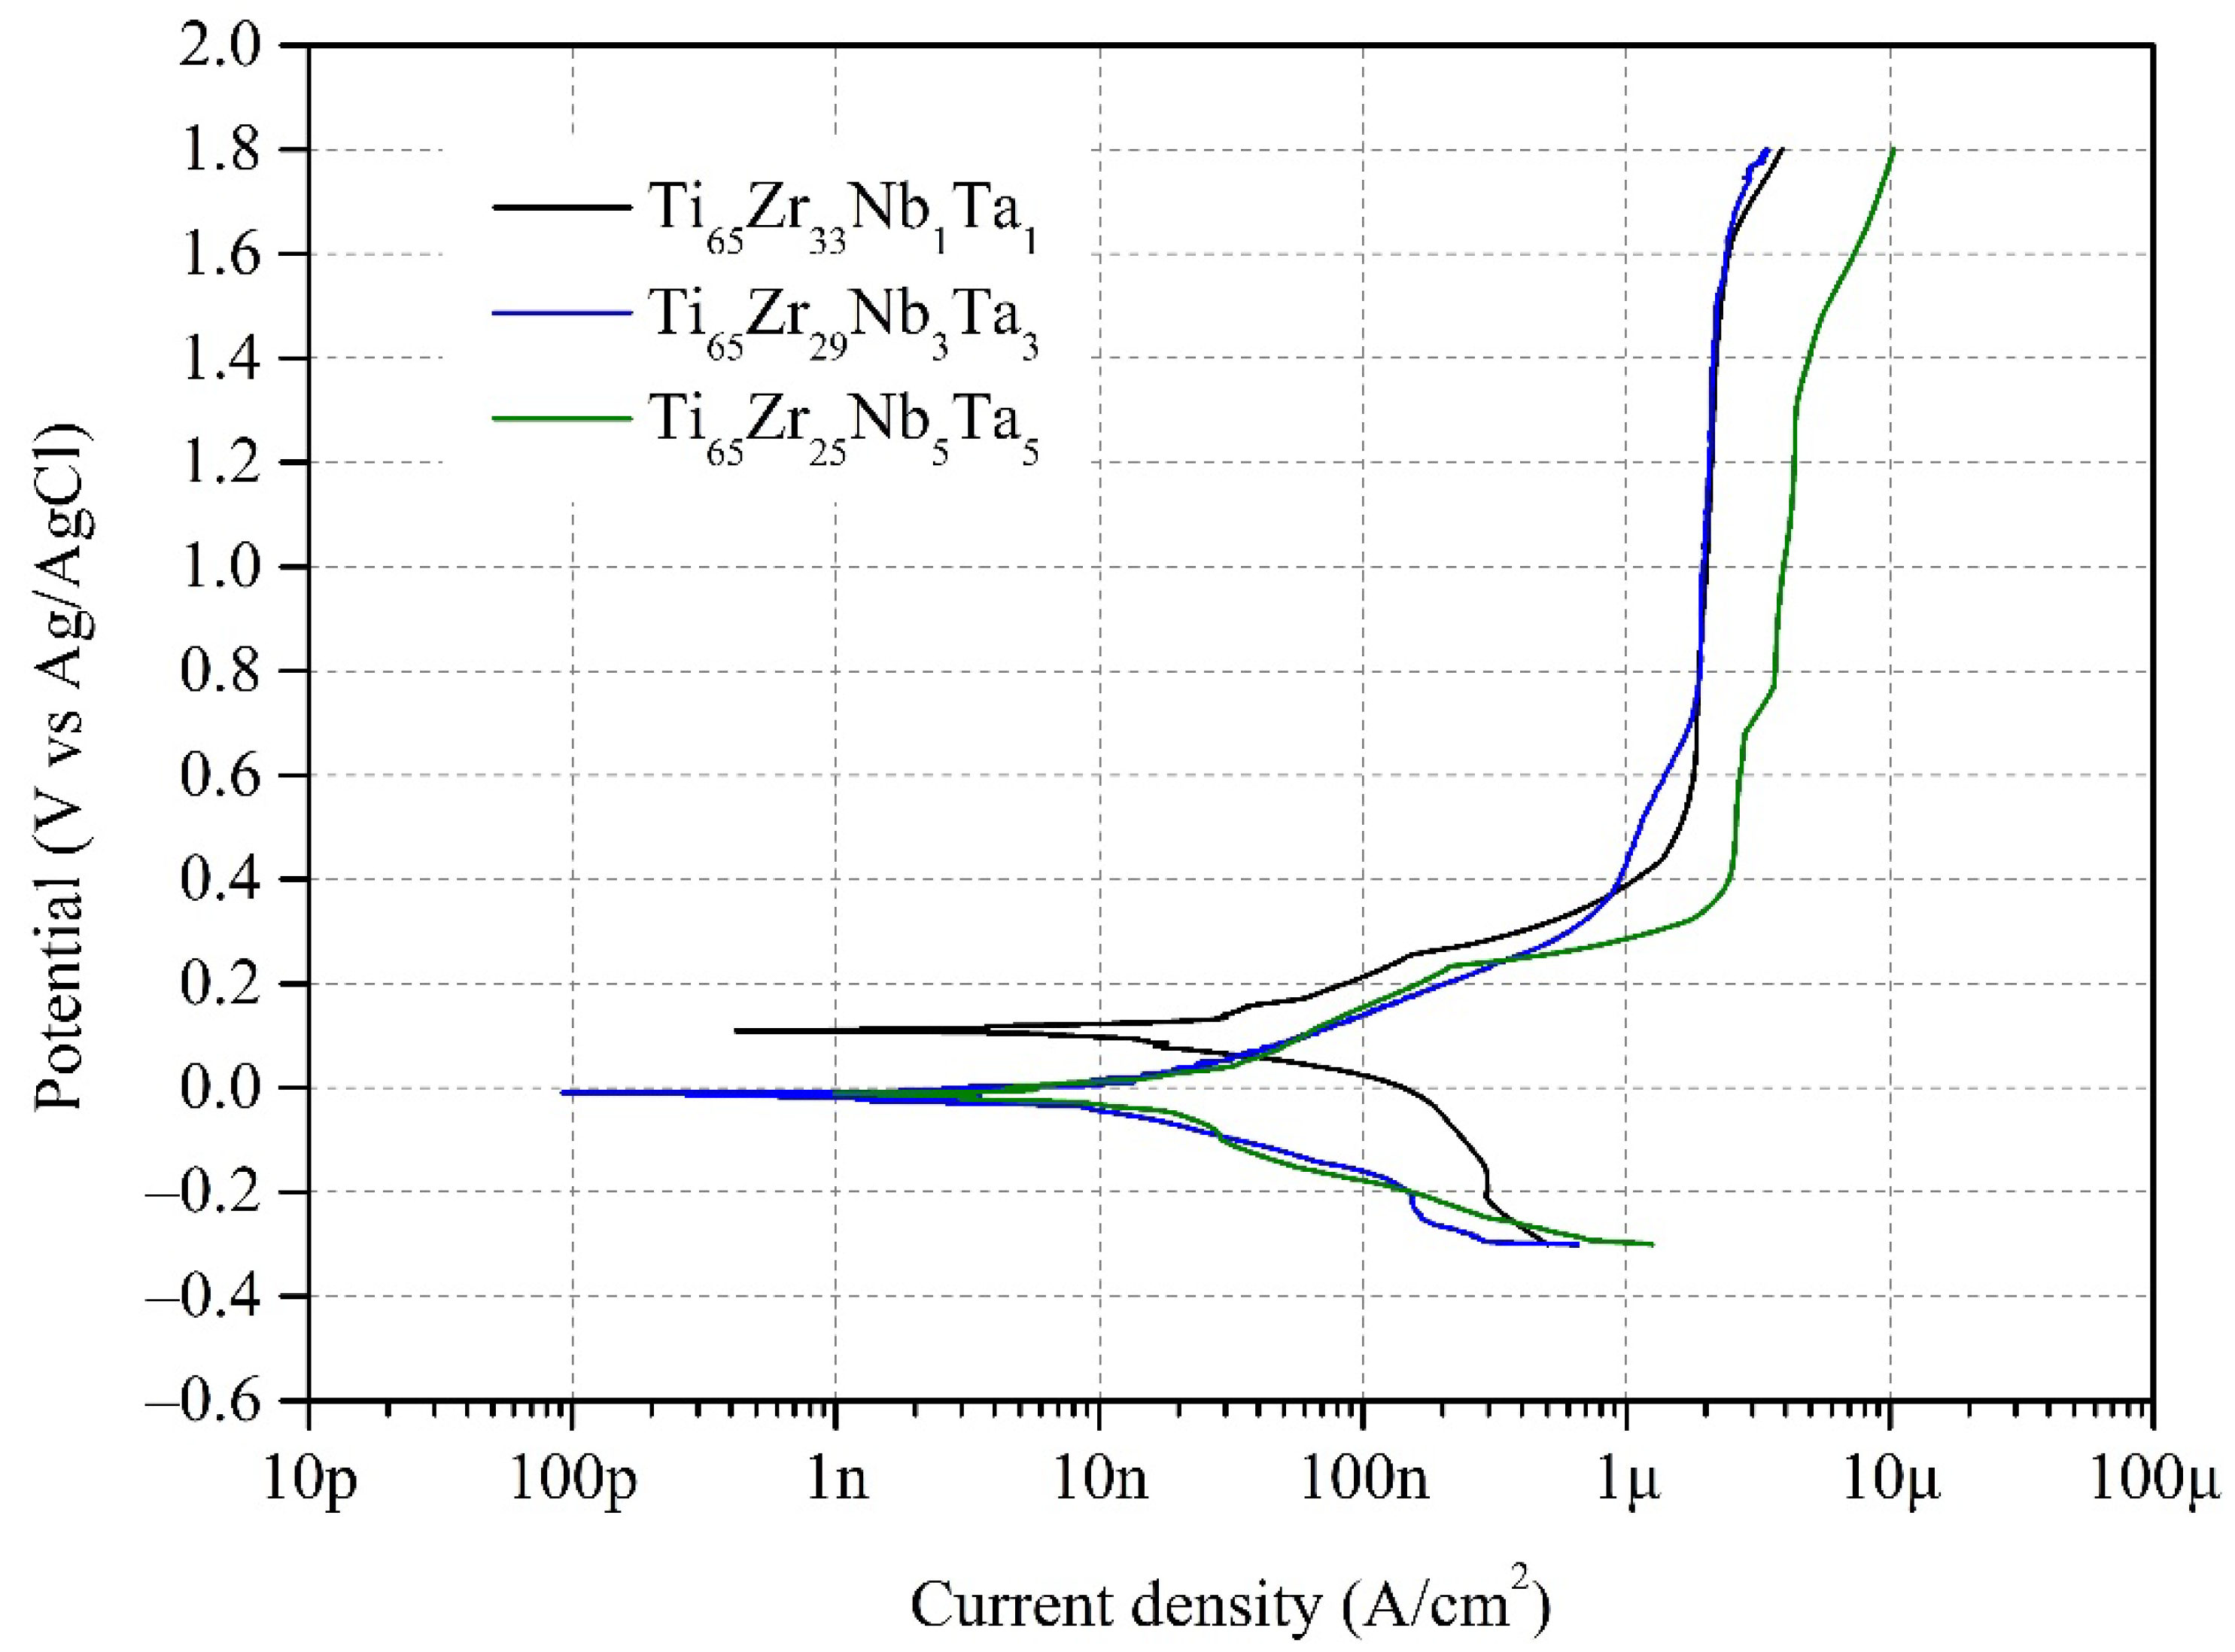
3.4.1. Potentiodynamic Polarization Test

The polarization curves of Ti65–Zr33–Nb1–Ta1, Ti65–Zr29–Nb3–Ta3, and Ti65–Zr25–Nb5–Ta5 were obtained using potentiodynamic polarization tests conducted in artificially simulated body fluid (PBS) at 37 °C and are shown in Figure 10. In addition, the corrosion potential Ecorr, corrosion current density Icorr, passivation potential Epass, and passive current density Ipass obtained in the potentiodynamic polarization tests are presented in Table 4. All three Ti–Zr–Nb–Ta MEAs exhibited excellent corrosion resistance. Among them, Ti65–Zr33–Nb1–Ta1 has the highest Ecorr (0.128 V), and the Ecorr values of Ti65–Zr29–Nb3–Ta3 and Ti65–Zr25–Nb5–Ta5 (–0.026 and –0.030 V, respectively) were close to 0 V. The high Ecorr value of Ti65–Zr33–Nb1–Ta1 may be related to its high δ value because severe lattice distortion reduces the electrical conductivity of an alloy [1], inhibiting electrochemical corrosion of the alloy. Furthermore, all three Ti–Zr–Nb–Ta MEAs exhibited very low Icorr values (<0.05 μA/cm2). The three Ti–Zr–Nb–Ta MEAs exhibited excellent pitting corrosion resistance, with their pitting potentials being higher than 1.8 V, and no pitting corrosion occurred during the test. Although the Ecorr values of Ti65–Zr29–Nb3–Ta3 and Ti65–Zr25–Nb5–Ta5 were lower than 0 V, their Epass values (0.364 V and 0.378 V, respectively) were considerably lower than that of Ti65–Zr33–Nb1–Ta1 (0.435 V). However, the Ipass (2.322 μA/cm2) of Ti65–Zr25–Nb5–Ta5 was considerably higher than those of the other MEAs. The high Ipass of Ti65–Zr25–Nb5–Ta5 may be related to its uniform phase composition because deleterious microgalvanic cells may form between different phase structures [48]. A passivation film rapidly forms on alloys with low Epass and Ipass during corrosion to resist the continuation of corrosion. Therefore, Ti65–Zr29–Nb3–Ta3 exhibited the best corrosion resistance.
In Ti alloy systems, the addition of elements (such as Zr or Nb) can considerably improve the corrosion resistance of the alloy. If the Ti in the alloy investigated in this study is regarded as the solvent atom, the three Ti–Zr–Nb–Ta MEAs have the same solute atom content but exhibit clearly different corrosion resistance, which is attributable to their different ratios of solute atoms (Zr, Nb, and Ta). Different alloying elements make different degrees of contribution to the corrosion resistance of an alloy. For example, the addition of the Zr element to Ti alloys can reduce the degree of composition segregation and refine the grains such that a more uniform oxide film forms on the surface of the alloy [49]. Many scholars have proposed that the addition of Nb to Ti alloys can enhance the stability of passivation films [50]. Moreover, the occurrence of activation and depassivation can be inhibited by the addition of Nb to Ti alloys, reducing the oxide layer’s dissolution rate [51]. The effect of Ta addition on uniform corrosion and pitting corrosion resistance in Ti alloys is currently unknown, but the effect is presumed to be similar to that of Nb. Therefore, Ti65–Zr29–Nb3–Ta3 exhibited higher pitting corrosion resistance than Ti65–Zr33–Nb1–Ta1 and Ti65–Zr25–Nb5–Ta5 because of the balance among the amounts of Zr, Nb, and Ta.

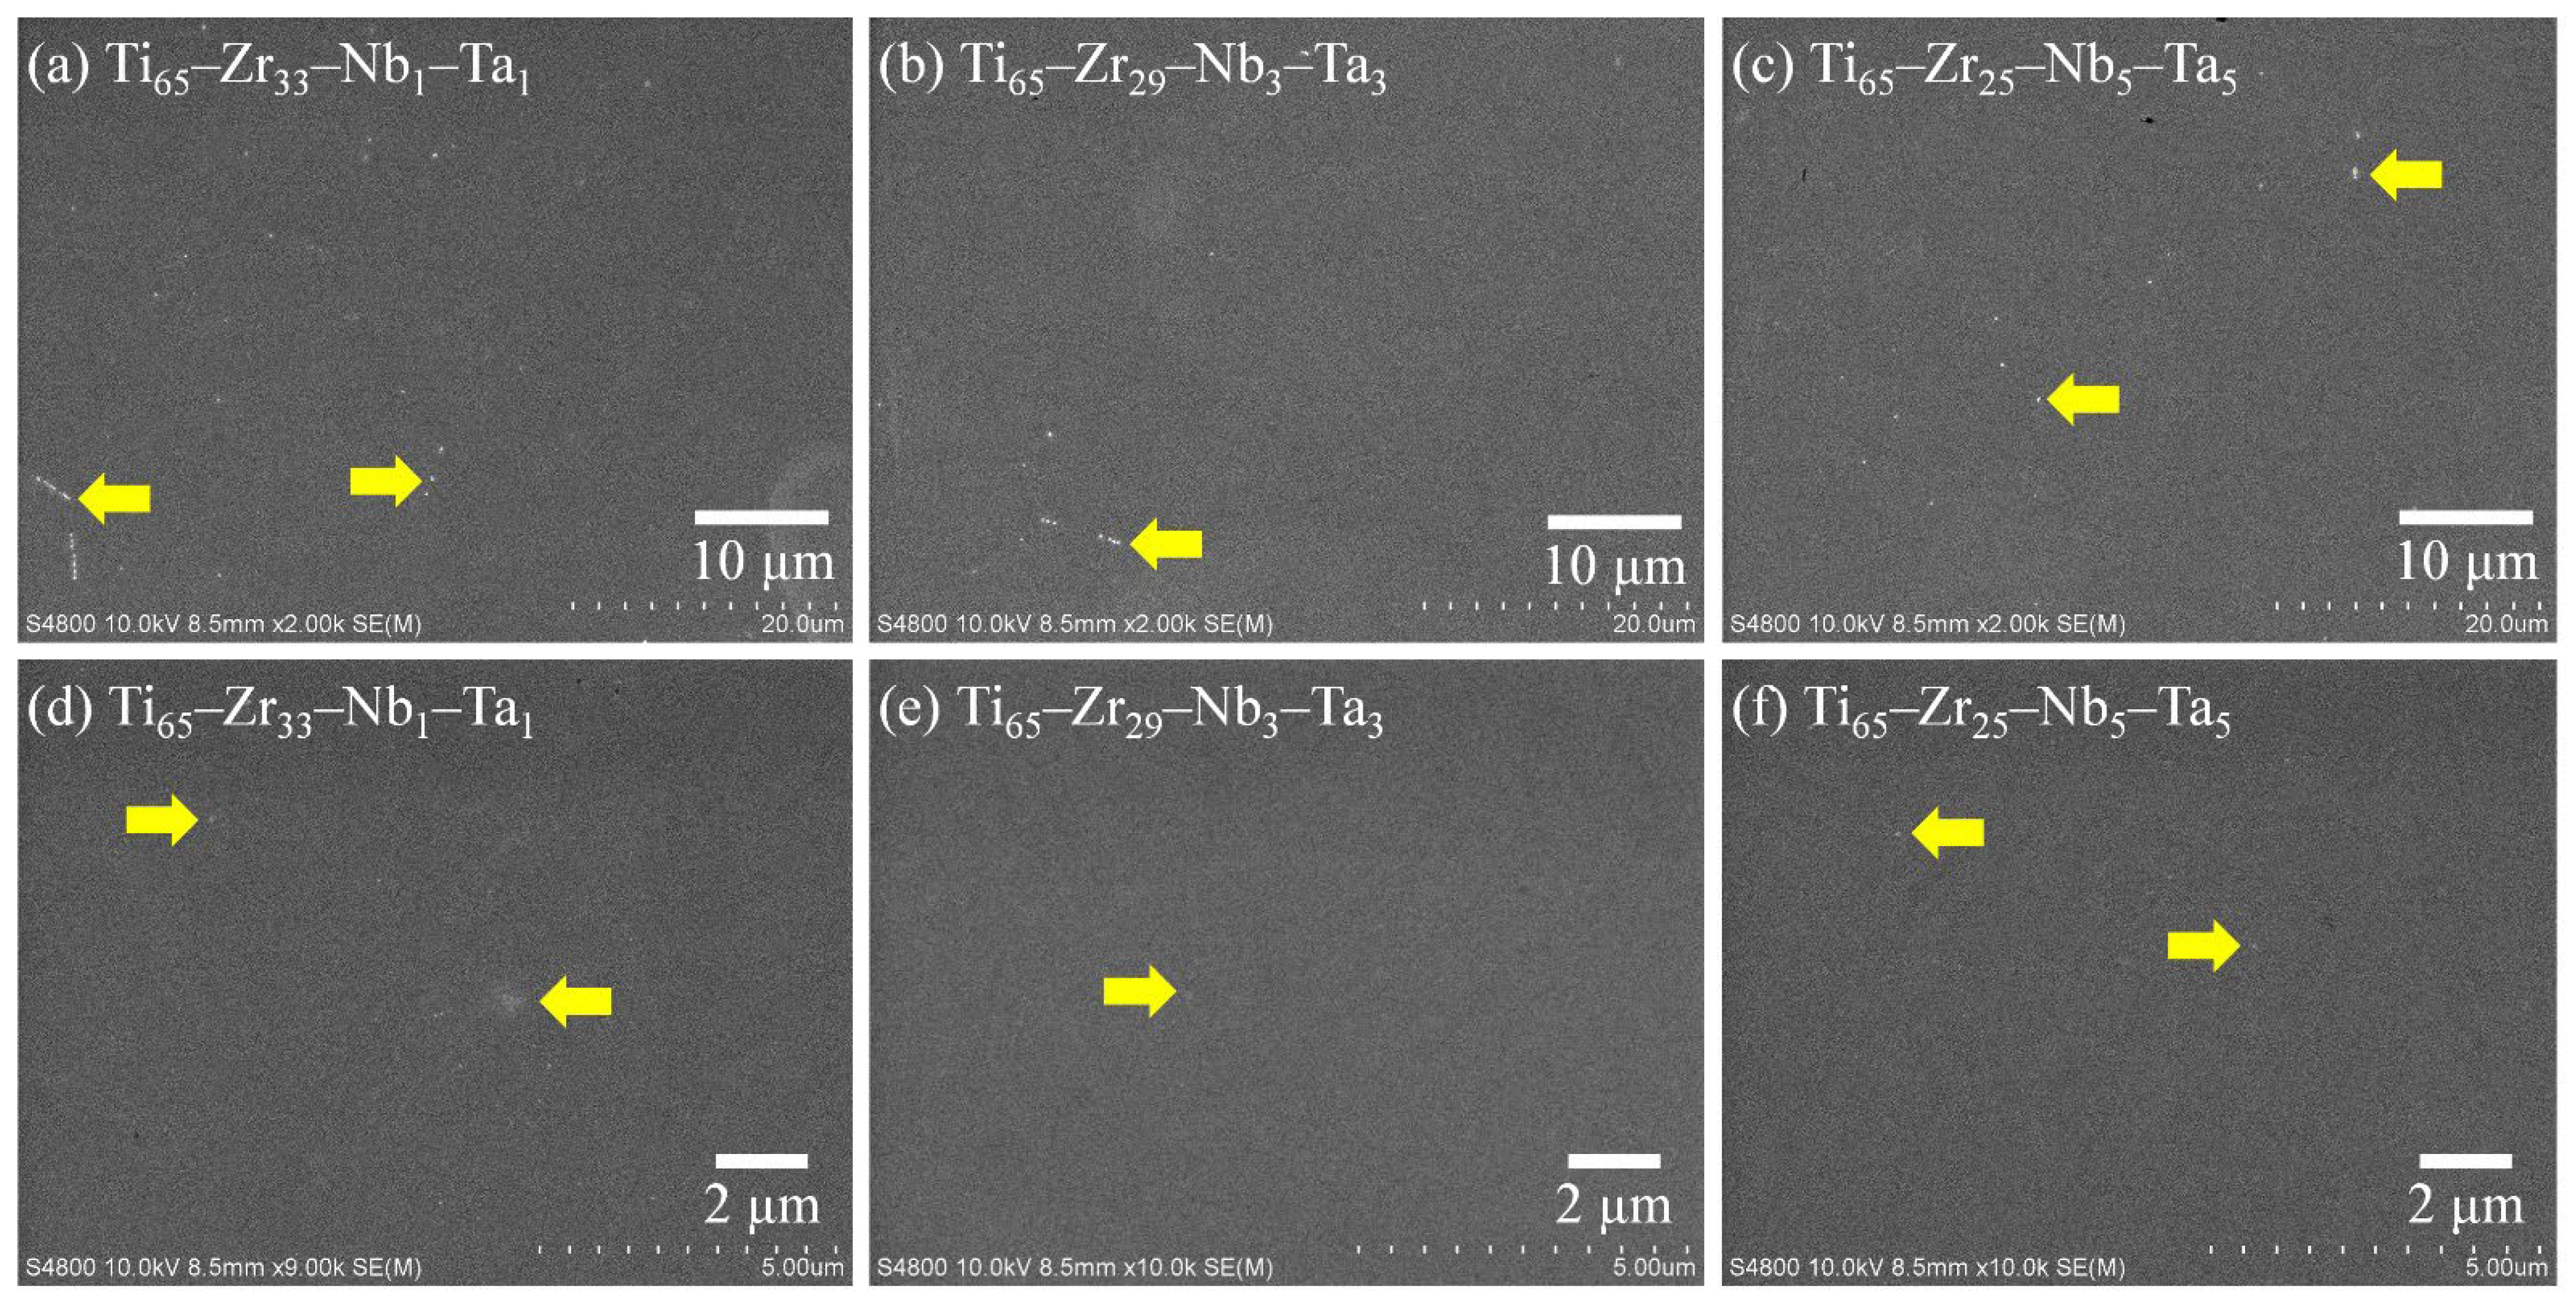
3.4.2. Scanning Electron Microscopy Analysis

SEM images of the Ti65–Zr33–Nb1–Ta1, Ti65–Zr29–Nb3–Ta3, and Ti65–Zr25–Nb5–Ta5 alloys after the potentiodynamic polarization tests had been performed are presented in Figure 11. In the low-magnification images (Figure 11a–c), the three MEAs have a smooth surface without clear large corrosion products and pitting holes. On the surface of Ti65–Zr33–Nb1–Ta1 (Figure 11a), small white microscopic corrosion products (yellow arrow) can be observed; they are arranged in a straight line along the grain boundary. Although Ti65–Zr33–Nb1–Ta1 had a higher Ecorr, its Icorr, Epass, and Ipass values were higher than those of the other two MEAs, resulting in more corrosion products on its surface. Conversely, a few tiny pores can be observed on the surface of Ti65–Zr25–Nb5–Ta5; these are attributable to this alloy having the highest melting point and the largest difference in melting point among alloying elements. These tiny pores were residual pores or shrinkage cavities formed during the casting process. However, the formation of a dense oxide/passivation layer on the tiny pores area of the surface is theoretically difficult, which meant that there was a preferential corrosion area. The pores may also be one of the reasons for the shift of the passivation curve of Ti65–Zr25–Nb5–Ta5 to higher values at high potentials (Figure 10). In the high-magnification images (Figure 11d–f), pitting holes cannot be observed on the surface of the three MEAs. Ti65–Zr29–Nb3–Ta3 was discovered to have small corrosion products and a void-free surface, showing that it had the highest corrosion resistance.

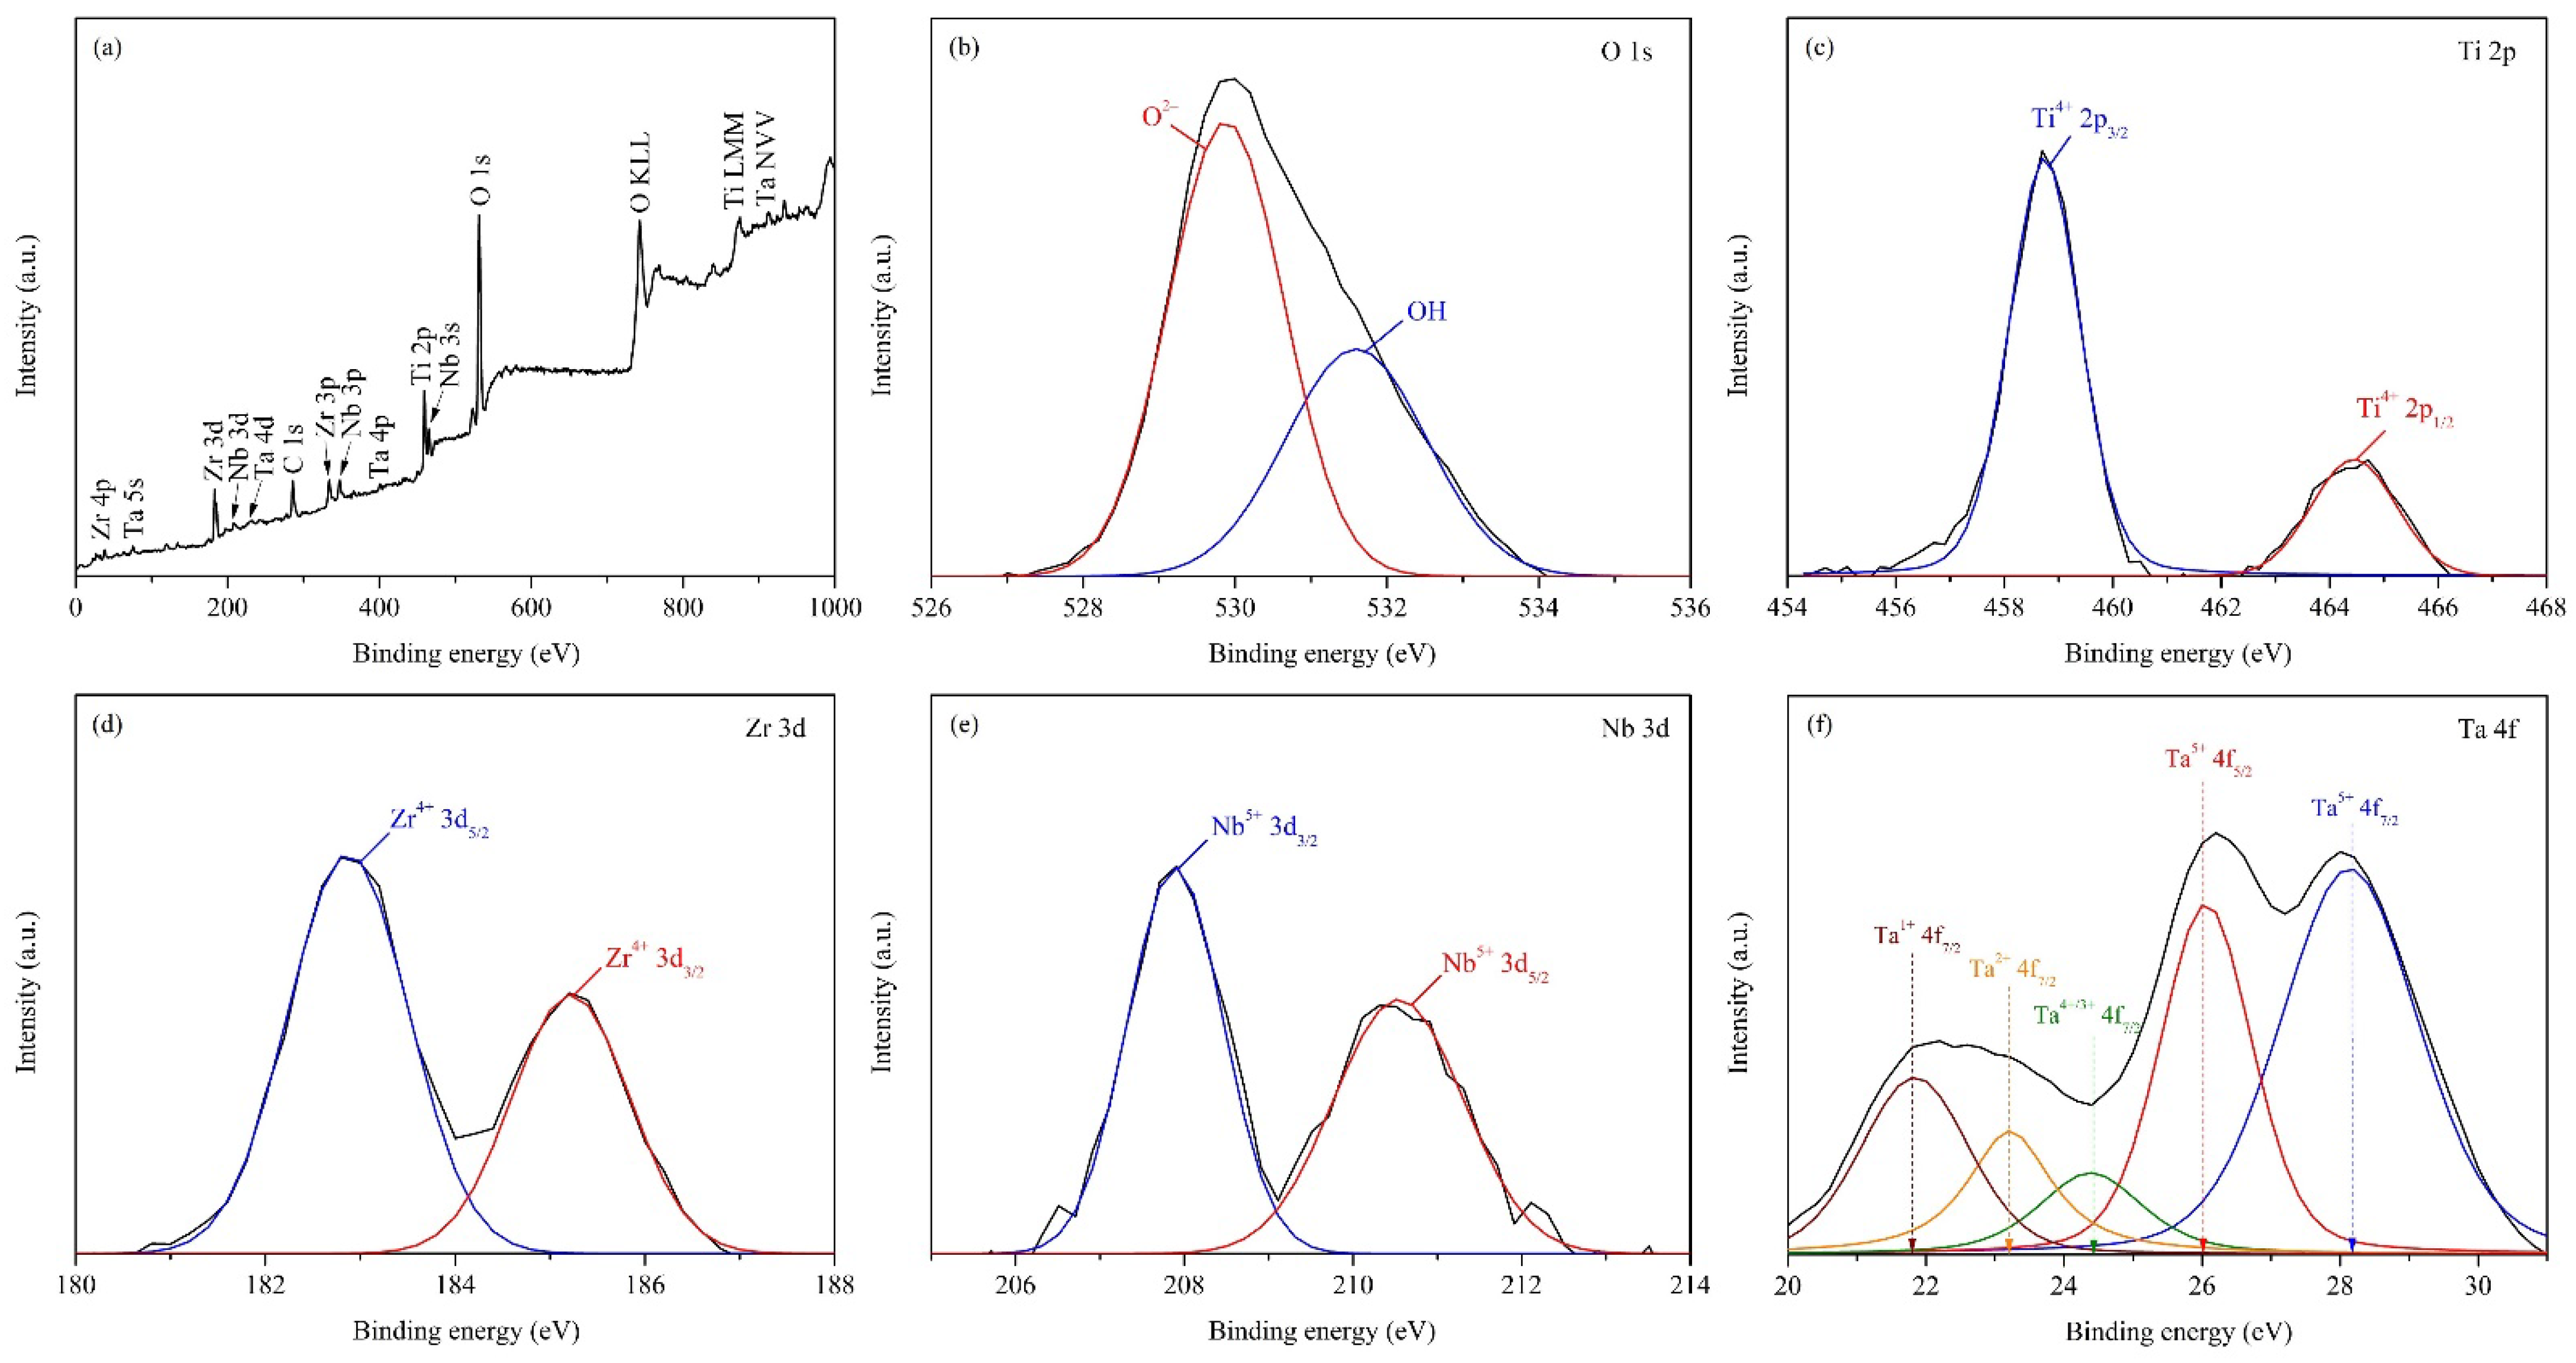
3.4.3. X-ray Photoelectron Spectroscopy Analysis

The surface of Ti65–Zr29–Nb3–Ta3 after the potentiodynamic polarization test was characterized using XPS to further elucidate the corrosion behavior of the alloy. The full XPS spectrum of the Ti65–Zr29–Nb3–Ta3 surface (Figure 12a) contained peaks corresponding to Ti, Zr, Nb, Ta, C, and O. The signals of C and O were caused by surface carbon contamination and surface oxidation, respectively [52]. The narrow scans of O 1s, Ti 2p, Zr 3d, Nb 3d, and Ta 4f for Ti65–Zr29–Nb3–Ta3 are displayed in Figure 12b–f, respectively. The Ti 2p peaks in the spectrum of Ti65–Zr29–Nb3–Ta3 correspond to the Ti4+ oxidation state; the Zr 3d spectrum corresponds to the oxidation state of Zr4+; the Nb 3d peaks correspond to the Nb5+ oxidation state; and the Ta 4f peaks correspond to the Ta1+, Ta2+, Ta3+, Ta4+, and Ta5+ oxidation states. The surface oxide layer of conventional Ti-alloys often comprised metallic states (such as Nb0 and Ta0) [52], which indicates that the oxide layer is very thin and might not be sufficiently resistant to Cl ion penetration. In summary, the surface passivation layer of Ti65–Zr29–Nb3–Ta3 mainly comprised TiO2, ZrO2, Nb2O5, and Ta2O5, which meant that the alloy had excellent corrosion resistance. Furthermore, the presence of ZrO2, Nb2O5, and Ta2O5 in the passivation layer of Ti65–Zr29–Nb3–Ta3 enhanced the alloy’s resistance to Cl ion penetration and improved the structural integrity of the passivation film [53].

4. Conclusions

Five Ti-rich biomedical Ti–Zr–Nb–Ta MEAs with β+α″+α′ structure were developed by considering thermodynamic parameters and using the VEC formula. Because of the influence of the lattice distortion effects and composition segregation of the MEAs, the conventional VEC formula used for predicting phases was not entirely applicable to the Ti–Zr–Nb–Ta MEAs. Through the Ti-rich MEA design, compositional segregations in Ti–Zr–Nb–Ta were eliminated using short-time and high-temperature ST. Because of the contribution of lattice distortion effects and the three-phase structure, each Ti–Zr–Nb–Ta had an ultra-high σy/E ratio. All MEA samples exhibited excellent pitting corrosion resistance; their pitting potentials were higher than 1.8 V. Ti65–Zr29–Nb3–Ta3 had excellent mechanical strength, a low elastic modulus, excellent elastic/plastic deformation ability, and excellent corrosion resistance; therefore, it can potentially be used for biomedical implants.

Author Contributions

Conceptualization, K.-K.W., H.-C.H. and W.-F.H.; methodology, K.-K.W., T.-L.H. and W.-F.H.; validation, K.-K.W., H.-C.H. and S.-C.W.; formal analysis, K.-K.W. and T.-L.H.; investigation, K.-K.W. and T.-L.H.; resources, H.-C.H. and W.-F.H.; data curation, K.-K.W., T.-L.H., and W.-F.H.; writing and original draft preparation, K.-K.W. and W.-F.H.; supervision and writing—review and editing, S.-C.W. and W.-F.H. All authors have read and agreed to the published version of the manuscript.

Funding

This research was funded partially by National University of Kaohsiung.

Institutional Review Board Statement

Not applicable.

Informed Consent Statement

Not applicable.

Data Availability Statement

Not applicable.

Acknowledgments

The authors acknowledge the partial financial support of National University of Kaohsiung.

Conflicts of Interest

The authors declare no conflict of interest.

References

  1. George, E.P.; Raabe, D.; Ritchie, R.O. High-entropy alloys. Nat. Rev. Mater. 2019, 4, 515–534. [Google Scholar] [CrossRef]
  2. Guo, S.; Ng, C.; Lu, J.; Liu, C.T. Effect of valence electron concentration on stability of fcc or bcc phase in high entropy alloys. J. Appl. Phys. 2011, 109, 103505. [Google Scholar] [CrossRef] [Green Version]
  3. Nguyen, V.T.; Qian, M.; Shi, Z.; Song, T.; Huang, L.; Zou, J. Compositional design of strong and ductile (tensile) Ti–Zr–Nb–Ta medium entropy alloys (MEAs) using the atomic mismatch approach. Mater. Sci. Eng. A 2019, 742, 762–772. [Google Scholar] [CrossRef]
  4. Nagase, T.; Mizuuchi, K.; Nakano, T. Solidification Microstructures of the Ingots Obtained by Arc Melting and Cold Crucible Levitation Melting in TiNbTaZr Medium-Entropy Alloy and TiNbTaZrX (X = V, Mo, W) High-Entropy Alloys. Entropy 2019, 21, 483. [Google Scholar] [CrossRef] [PubMed] [Green Version]
  5. Nagase, T.; Todai, M.; Nakano, T. Liquid Phase Separation in Ag-Co-Cr-Fe-Mn-Ni, Co Cr-Cu-Fe-Mn-Ni and Co-Cr-Cu-Fe-Mn-Ni-B High Entropy Alloys for Biomedical Application. Crystals 2020, 10, 527. [Google Scholar] [CrossRef]
  6. Song, H.; Lee, S.; Lee, K. Thermodynamic parameters, microstructure, and electrochemical properties of equiatomic TiMoVWCr and TiMoVNbZr high-entropy alloys prepared by vacuum arc remelting. Int. J. Refract. Hard. Met. 2021, 99, 105595. [Google Scholar] [CrossRef]
  7. Mustafi, L.; Nguyen, V.T.; Lu, S.L.; Song, T.; Murdoch, B.J.; Fabijanic, D.M.; Qian, M. Microstructure, tensile properties and deformation behaviour of a promising bio-applicable new Ti35Zr15Nb25Ta25 medium entropy alloy (MEA). Mater. Sci. Eng. A 2021, 824, 141805. [Google Scholar] [CrossRef]
  8. Arias-González, F.; Rodríguez-Contreras, A.; Punset, M.; Manero, J.M.; Barro, Ó.; Fernández-Arias, M.; Lusquiños, F.; Gil, J.; Pou, J. Laser-Deposited Beta Type Ti-42Nb Alloy with Anisotropic Mechanical Properties for Pioneering Biomedical Implants with a Very Low Elastic Modulus. Materials 2022, 15, 7172. [Google Scholar] [CrossRef]
  9. Guo, S.; Meng, Q.; Zhao, X.; Wei, Q.; Xu, H. Design and fabrication of a metastable β-type titanium alloy with ultralow elastic modulus and high strength. Sci. Rep. 2015, 5, 14688. [Google Scholar] [CrossRef] [Green Version]
  10. Kolli, R.P.; Devaraj, A. A Review of Metastable Beta Titanium Alloys. Metals 2018, 8, 506. [Google Scholar] [CrossRef]
  11. Nunes, A.R.V.; Borborema, S.; Araújo, L.S.; de Almeida, L.H.; Kaufman, M.J. Production of a Novel Biomedical β-Type Titanium Alloy Ti-23.6Nb-5.1Mo-6.7Zr with Low Young’s Modulus. Metals 2022, 12, 1588. [Google Scholar] [CrossRef]
  12. Sidhu, S.S.; Singh, H.; Gepreel, M.A. A review on alloy design, biological response, and strengthening of β-titanium alloys as biomaterials. Mater. Sci. Eng. C 2021, 121, 111661. [Google Scholar] [CrossRef] [PubMed]
  13. Wong, K.K.; Hsu, H.C.; Wu, S.C.; Ho, W.F. Novel Metastable Nonequiatomic Ti-Zr-Nb-Mo Medium-Entropy Alloys with High Yield-Strength-to-Elastic-Modulus Ratios. Met. Mater. Int. 2022, 868, 159137. [Google Scholar] [CrossRef]
  14. Liu, J.; Zhang, X.; Yuan, Z. Structures and properties of biocompatible Ti-Zr-Nb-Fe-Mo medium entropy alloys. Mater. Today Commun. 2022, 32, 103808. [Google Scholar] [CrossRef]
  15. You, L.; Song, X. A study of low Young′s modulus Ti–Nb–Zr alloys using d electrons alloy theory. Scr. Mater. 2012, 67, 57–60. [Google Scholar] [CrossRef]
  16. Fu, Y.; Xiao, W.; Wang, J.; Ren, L.; Zhao, X.; Ma, C. A novel strategy for developing α + β dual-phase titanium alloys with low Young’s modulus and high yield strength. J. Mater. Sci. Technol. 2021, 76, 122–128. [Google Scholar] [CrossRef]
  17. Tan, M.H.C.; Baghi, A.D.; Ghomashchi, R.; Xiao, W.; Oskouei, R.H. Effect of niobium content on the microstructure and Young’s modulus of Ti-xNb-7Zr alloys for medical implants. J. Mech. Behav. Biomed. Mater. 2019, 99, 78–85. [Google Scholar] [CrossRef] [PubMed]
  18. Chen, Y.; Du, Z.; Xiao, S.; Xu, L.; Tian, J. Effect of aging heat treatment on microstructure and tensile properties of a new β high strength titanium alloy. J. Alloys Compd. 2014, 586, 588–592. [Google Scholar] [CrossRef]
  19. ASTM E3-11; Standard Guide for Preparation of Metallographic Specimens. ASTM International: West Conshohocken, PA, USA, 2017.
  20. ASTM E407-07; Standard Practice for Microetching Metals and Alloys. ASTM International: West Conshohocken, PA, USA, 2015.
  21. White, T.D.; Folkens, P.A. The Human Bone Manual; Academic Press: Cambridge, MA, USA, 2005. [Google Scholar]
  22. Yang, P.F.; Sanno, M.; Ganse, B.; Koy, T.; Bruggemann, G.P.; Müller, L.P.; Rittweger, J. Torsion and Antero-Posterior Bending in the In Vivo Human Tibia Loading Regimes during Walking and Running. PLoS ONE 2014, 9, e94525. [Google Scholar] [CrossRef] [Green Version]
  23. ASTM E855-08; Standard Test Methods for Bend Testing of Metallic Flat Materials for Spring Applications Involving Static Loading. ASTM International: West Conshohocken, PA, USA, 2013.
  24. ASTM G5-14; Standard Reference Test Method for Making Potentiodynamic Anodic Polarization Measurements. ASTM International: West Conshohocken, PA, USA, 2014.
  25. Shi, Y.; Yang, B.; Xie, X.; Brechtl, J.; Dahmen, K.A.; Liaw, P.K. Corrosion of AlxCoCrFeNi high-entropy alloys: Al-content and potential scan-rate dependent pitting behavior. Corros. Sci. 2017, 119, 33–45. [Google Scholar] [CrossRef]
  26. Ikehata, H.; Nagasako, N.; Furuta, T.; Fukumoto, A.; Miwa, K.; Saito, T. First-principles calculations for development of low elastic modulus Ti alloys. Phys. Rev. B 2004, 70, 174113. [Google Scholar] [CrossRef]
  27. Yuan, Y.; Wu, Y.; Yang, Z.; Liang, X.; Lei, Z.; Huang, H.; Wang, H.; Liu, X.; An, K.; Wu, W.; et al. Formation, structure and properties of biocompatible TiZrHfNbTa high-entropy alloys. Mater. Res. Lett. 2019, 7, 225–231. [Google Scholar] [CrossRef] [Green Version]
  28. Ren, B.; Liu, Z.X.; Li, D.M.; Shi, L.; Cai, B.; Wang, M.X. Effect of elemental interaction on microstructure of CuCrFeNiMn high entropy alloy system. J. Alloys Compd. 2010, 493, 148–153. [Google Scholar] [CrossRef]
  29. Wong, K.K.; Hsu, H.C.; Wu, S.C.; Ho, W.F. Structure and properties of Ti-rich Ti–Zr–Nb–Mo medium-entropy alloys. J. Alloys Compd. 2021, 868, 159137. [Google Scholar] [CrossRef]
  30. Massa, W. Crystal Structure Determination; Springer: New York, NY, USA; Berlin/Heidelberg, Germany, 2004. [Google Scholar]
  31. Tang, B.; Kou, H.C.; Wang, Y.H.; Zhu, Z.S.; Zhang, F.S.; Li, J.S. Kinetics of orthorhombic martensite decomposition in TC21 alloy under isothermal conditions. J. Mater. Sci. 2012, 47, 521–529. [Google Scholar] [CrossRef]
  32. Jiang, X.J.; Jing, R.; Ma, M.Z.; Liu, R.P. The orthorhombic α″ martensite transformation during water quenching and its influence on mechanical properties of Ti-41Zr-7.3Al alloy. Intermetallics 2014, 52, 32–35. [Google Scholar] [CrossRef]
  33. Lu, J.W.; Ge, P.; Zhao, Y.Q.; Niu, H.Z. Structure and mechanical properties of Ti–6Al based alloys with Mo addition. Mater. Sci. Eng. A 2013, 584, 41–46. [Google Scholar] [CrossRef]
  34. Nguyen, V.T.; Qian, M.; Shi, Z.; Tran, X.Q.; Fabijanic, D.M.; Joseph, J.; Qu, D.D.; Matsumura, S.; Zhang, C.; Zhang, F.; et al. Cuboid-like nanostructure strengthened equiatomic Ti–Zr–Nb–Ta medium entropy alloy. Mater. Sci. Eng. A 2020, 798, 140169. [Google Scholar] [CrossRef]
  35. Hao, Y.L.; Li, S.J.; Sun, S.Y.; Yang, R. Effect of Zr and Sn on Young's modulus and superelasticity of Ti–Nb-based alloys. Mater. Sci. Eng. A 2006, 441, 112–118. [Google Scholar] [CrossRef]
  36. Chen, B.; Li, S.; Ding, J.; Ding, X.; Sun, J.; Ma, E. Correlating dislocation mobility with local lattice distortion in refractory multi-principal element alloys. Scr. Mater. 2023, 222, 115048. [Google Scholar] [CrossRef]
  37. Lee, H.C.; Chen, Y.J.; Chen, C.H. Effect of Solution Treatment on the Shape Memory Functions of (TiZrHf)50Ni25Co10Cu15 High Entropy Shape Memory Alloy. Entropy 2019, 21, 1027. [Google Scholar] [CrossRef] [Green Version]
  38. Çaha, I.; Alves, A.C.; Rocha, L.A.; Toptan, F. A review on bio-functionalization of β-Ti alloys. J. Bio Tribo Corros. 2020, 6, 1–31. [Google Scholar] [CrossRef]
  39. Eisenbarth, E.; Velten, D.; Muller, M.; Thull, R.; Breme, J. Biocompatibility of beta-stabilizing elements of titanium alloys. Biomaterials 2004, 25, 5705–5713. [Google Scholar] [CrossRef] [PubMed]
  40. Kirmanidou, Y.; Sidira, M.; Drosou, M.E.; Bennani, V.; Bakopoulou, A.; Tsouknidas, A.; Michailidis, N.; Michalakis, K. New Ti-Alloys and surface modifications to improve the mechanical properties and the biological response to orthopedic and dental implants: A review. Biomed. Res. Int. 2016, 2016, 2908570. [Google Scholar] [CrossRef] [Green Version]
  41. Hsu, H.C.; Wong, K.K.; Wu, S.C.; Chen, Y.X.; Ho, W.F. Metastable dual-phase Ti–Nb–Sn–Zr and Ti–Nb–Sn–Fe alloys with high strength-to-modulus ratio. Mater. Today Commun. 2022, 30, 103168. [Google Scholar] [CrossRef]
  42. Abdel-Hady, M.; Hinoshita, K.; Morinaga, M. General approach to phase stability and elastic properties of β-type Ti-alloys using electronic parameters. Scr. Mater. 2006, 55, 477–480. [Google Scholar] [CrossRef]
  43. Tane, M.; Akita, S.; Nakano, T.; Hagihara, K.; Umakoshi, Y.; Niinomi, M.; Morid, H.; Nakajima, H. Low Young’s modulus of Ti–Nb–Ta–Zr alloys caused by softening in shear moduli c′ and c44 near lower limit of body-centered cubic phase stability. Acta Mater. 2010, 58, 6790–6798. [Google Scholar] [CrossRef]
  44. Ho, W.F.; Ju, C.P.; Chern Lin, J.H. Structure and properties of cast binary Ti–Mo alloys. Biomaterials 1999, 20, 2115–2122. [Google Scholar] [CrossRef]
  45. Wang, S.P.; Xu, J. TiZrNbTaMo high-entropy alloy designed for orthopedic implants: As-cast microstructure and mechanical properties. Mater. Sci. Eng. C 2017, 73, 80–89. [Google Scholar] [CrossRef]
  46. Hao, Y.L.; Li, S.J.; Sun, S.Y.; Zheng, C.Y.; Hu, Q.M.; Yang, R. Super-elastic titanium alloy with unstable plastic deformation. Appl. Phys. Lett. 2005, 87, 091906. [Google Scholar] [CrossRef]
  47. Niinomi, M.; Hattori, T.; Morikawa, K.; Kasugam, T.; Suzuki, A.; Fukui, H.; Niwa, S. Development of Low Rigidity β-type Titanium Alloy for Biomedical Applications. Mater. Trans. 2002, 43, 2970–2977. [Google Scholar] [CrossRef] [Green Version]
  48. Hsu, H.C.; Wu, S.C.; Hsu, S.K.; Syu, J.Y.; Ho, W.F. The structure and mechanical properties of as-cast Ti–25Nb–xSn alloys for biomedical applications. Mater. Sci. Eng. A 2013, 568, 1–7. [Google Scholar] [CrossRef]
  49. Martins, D.Q.; Osório, W.R.; Souza, M.E.P.; Caram, R.; Garcia, A. Effects of Zr content on microstructure and corrosion resistance of Ti–30Nb–Zr casting alloys for biomedical applications. Electrochim. Acta. 2008, 53, 2809–2817. [Google Scholar] [CrossRef]
  50. Metiko¡-Huković, M.; Kwokal, A.; Piljac, J. The influence of niobium and vanadium on passivity of titanium-based implants in physiological solution. Biomaterials 2003, 24, 3765–3775. [Google Scholar] [CrossRef]
  51. Yu, S.Y.; Brodrick, C.W.; Ryan, M.P.; Scully, J.R. Effects of Nb and Zr alloying additions on the activation behavior of Ti in hydrochloric acid. J. Electrochem. Soc. 1999, 146, 4429–4438. [Google Scholar] [CrossRef]
  52. Tanaka, Y.; Nakai, M.; Akahori, T.; Niinomi, M.; Tsutsumi, Y.; Doi, H.; Hanawa, T. Characterization of air-formed surface oxide film on Ti–29Nb–13Ta–4.6Zr alloy surface using XPS and AES. Corros. Sci. 2008, 50, 2111–2116. [Google Scholar] [CrossRef]
  53. Guo, W.Y.; Sun, J.; Wu, J.S. Electrochemical and XPS studies of corrosion behavior of Ti–23Nb–0.7Ta–2Zr–O alloy in Ringer's solution. Mater. Chem. Phys. 2009, 113, 816–820. [Google Scholar] [CrossRef]
Figure 1. X-ray diffraction patterns of the Ti–Zr–Nb–Ta medium-entropy alloys (MEAs). (a) As cast (30–80°), (b) as cast (36–42°), (c) after solution treatment (ST) (30–80°), and (d) after ST (36–42°).
Materials 15 07953 g001
Figure 2. Phase volume fractions (%) of the Ti–Zr–Nb–Ta MEAs under various conditions.
Materials 15 07953 g002
Figure 3. Electron backscatter diffraction images (inverse pole figure and phase map) of the MEAs after ST. (a,f,k) Ti65–Zr33–Nb1–Ta1, (b,g,l) Ti65–Zr31–Nb2–Ta2, (c,h,m) Ti65–Zr29–Nb3–Ta3, (d,i,n) Ti65–Zr27–Nb4–Ta4, and (e,j,o) Ti65–Zr25–Nb5–Ta5.
Materials 15 07953 g003
Figure 4. Metallographic images of the Ti–Zr–Nb–Ta MEAs in as-cast and ST states. (a,f) Ti65–Zr33–Nb1–Ta1, (b,g) Ti65–Zr31–Nb2–Ta2, (c,h) Ti65–Zr29–Nb3–Ta3, (d,i) Ti65–Zr27–Nb4–Ta4, and (e,j) Ti65–Zr25–Nb5–Ta5.
Materials 15 07953 g004
Figure 5. Electron probe microanalysis images of the Ti–Zr–Nb–Ta MEAs after ST: (a) backscattered electron imaging and (b) wavelength dispersive spectroscopy mapping.
Materials 15 07953 g005
Figure 6. Stress–deflection curves of the Ti–Zr–Nb–Ta MEAs obtained through three-point bending tests under various conditions: (a) as cast and (b) ST.
Materials 15 07953 g006
Figure 7. Strengths of the Ti–Zr–Nb–Ta MEAs obtained through three-point bending tests: (a) bending strength and (b) yield strength.
Materials 15 07953 g007
Figure 8. Elastic properties of the Ti–Zr–Nb–Ta MEAs obtained through three-point bending tests: (a) elastic modulus and (b) elastic recovery angle.
Materials 15 07953 g008
Figure 9. Yield strength–elastic modulus ratios (×1000) of the Ti–Zr–Nb–Ta MEAs under various conditions, several metastable β-Ti alloys [46,47,48], a bio-high-entropy alloy [3,45], and biomedical alloys [13].
Materials 15 07953 g009
Figure 10. Polarization curves, obtained using potentiodynamic polarization tests, of Ti65–Zr33–Nb1–Ta1, Ti65–Zr29–Nb3–Ta3, and Ti65–Zr25–Nb5–Ta5 in artificially simulated body fluid (phosphate-buffered saline) at 37 °C.
Materials 15 07953 g010
Figure 11. Scanning electron microscopy images of Ti65–Zr33–Nb1–Ta1, Ti65–Zr29–Nb3–Ta3, and Ti65–Zr25–Nb5–Ta5 after potentiodynamic polarization tests.
Materials 15 07953 g011
Figure 12. Chemical characterization of the Ti65–Zr29–Nb3–Ta3 surface after potentiodynamic polarization test: (a) full spectrum and (bf) narrow scans.
Materials 15 07953 g012
Table 1. Energy-dispersive X-ray spectroscopy results for the Ti–Zr–Nb–Ta medium-entropy alloys (MEAs).
MEAs Ti (at%)Zr (at%)Nb (at%)Ta (at%)
Ti65Zr33Nb1Ta1Nominal653311
Actual65.41 ± 0.1332.14 ± 0.121.22 ± 0.111.23 ± 0.14
Ti65Zr31Nb2Ta2Nominal653122
Actual65.62 ± 0.2430.41 ± 0.212.03 ± 0.021.94 ± 0.04
Ti65Zr29Nb3Ta3Nominal652933
Actual65.79 ± 0.5428.00 ± 0.383.11 ± 0.123.11 ± 0.21
Ti65Zr27Nb4Ta4Nominal652744
Actual65.75 ± 0.1426.88 ± 0.313.95 ± 0.153.43 ± 0.16
Ti65Zr25Nb5Ta5Nominal652555
Actual65.87 ± 0.3924.34 ± 0.584.75 ± 0.185.04 ± 0.38
Table 2. Thermodynamic parameters of the Ti–Zr–Nb–Ta MEAs (R = 8.3145 J·K–1·mol–1).
MEAsΔSmix (J/K·mol)ΔHmix (KJ/mol)δTL (°C)ΩVEC
Ti65Zr33Nb1Ta10.73R0.174.05176463.534.02
Ti65Zr31Nb2Ta20.80R0.334.00178235.944.04
Ti65Zr29Nb3Ta30.85R0.483.94180026.624.06
Ti65Zr27Nb4Ta40.89R0.613.87181821.924.08
Ti65Zr25Nb5Ta50.93R0.743.79183519.104.1
Table 3. A list of nomenclature for all the Greek letters and symbols used in the study.
Greek Letters and SymbolsCommon Interpretation
ΔSmixMixing entropy
ΔHmixMixing enthalpy
δDifference in atomic radius of alloying elements
TLMelting point
Ω Ω = T L Δ S mix | Δ H mix |
βBody-centered cubic structure
α″Orthorhombic structure
α′Hexagonal closest packed structure
σyYield strength
Table 4. Corrosion potential Ecorr, corrosion current density Icorr, passivation potential Epass, and passivation current density Ipass, obtained through potentiodynamic polarization tests, of Ti65–Zr33–Nb1–Ta1, Ti65–Zr29–Nb3–Ta3, and Ti65–Zr25–Nb5–Ta5 after solution treatment (ST).
MEAsEcorr (V)Icorr (μA/cm2)Epass (V)Ipass (μA/cm2)
Ti65Zr33Nb1Ta10.1280.04140.4351.343
Ti65Zr29Nb3Ta3−0.0260.01160.3640.856
Ti65Zr25Nb5Ta5−0.0300.01500.3782.322
Publisher’s Note: MDPI stays neutral with regard to jurisdictional claims in published maps and institutional affiliations.

