
UV-Cured Green Polymers for Biosensorics: Correlation of Operational Parameters of Highly Sensitive Biosensors with Nano-Volumes and Adsorption Properties
 , , , , , , ,
Abstract
:1. Introduction
2. Experimental
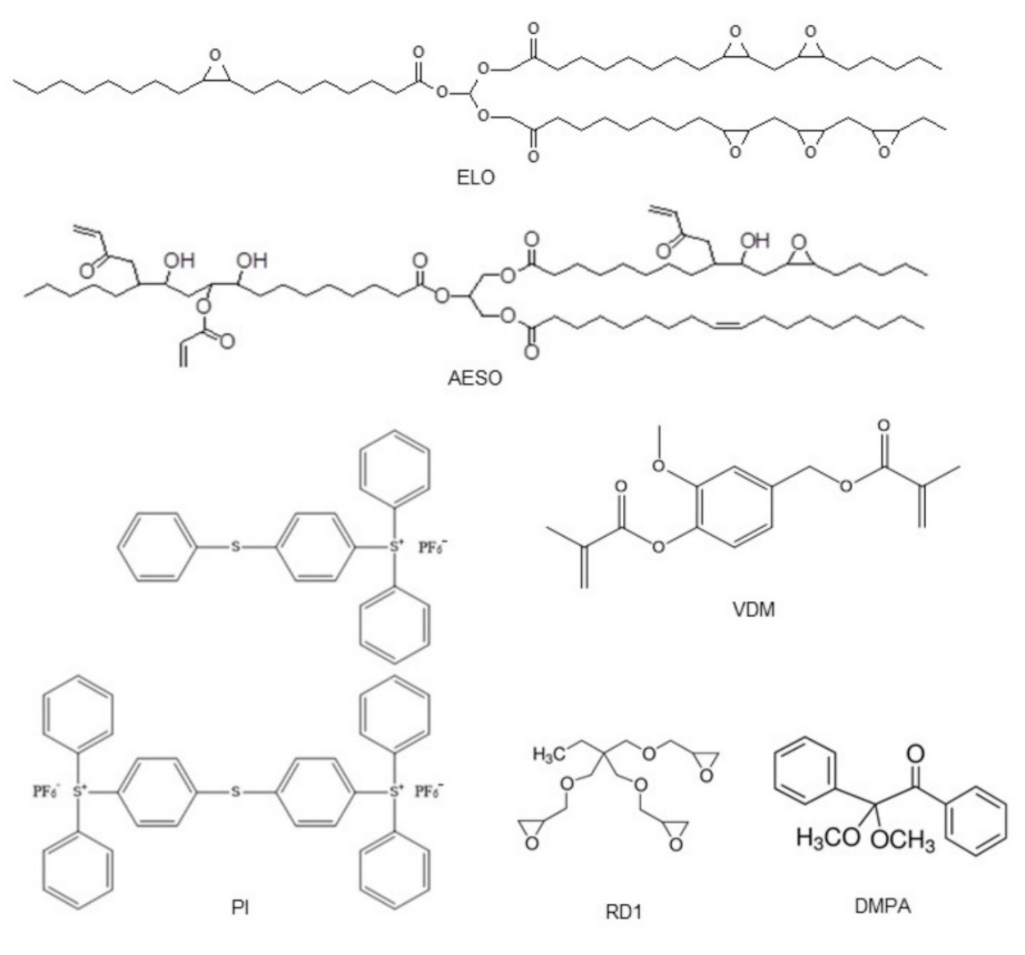
2.1. Materials
2.2. Preparation of Samples
2.3. PALS Technique
2.4. Swelling
2.5. PALS Spectrometer for Desorption Experiments after Swelling
2.6. Biosensors Preparation and Evaluation
3. Results and Discussion
3.1. Investigation of Sample Stability
3.2. Temperature Influence Analysis
3.3. Temperature Influence Analysis
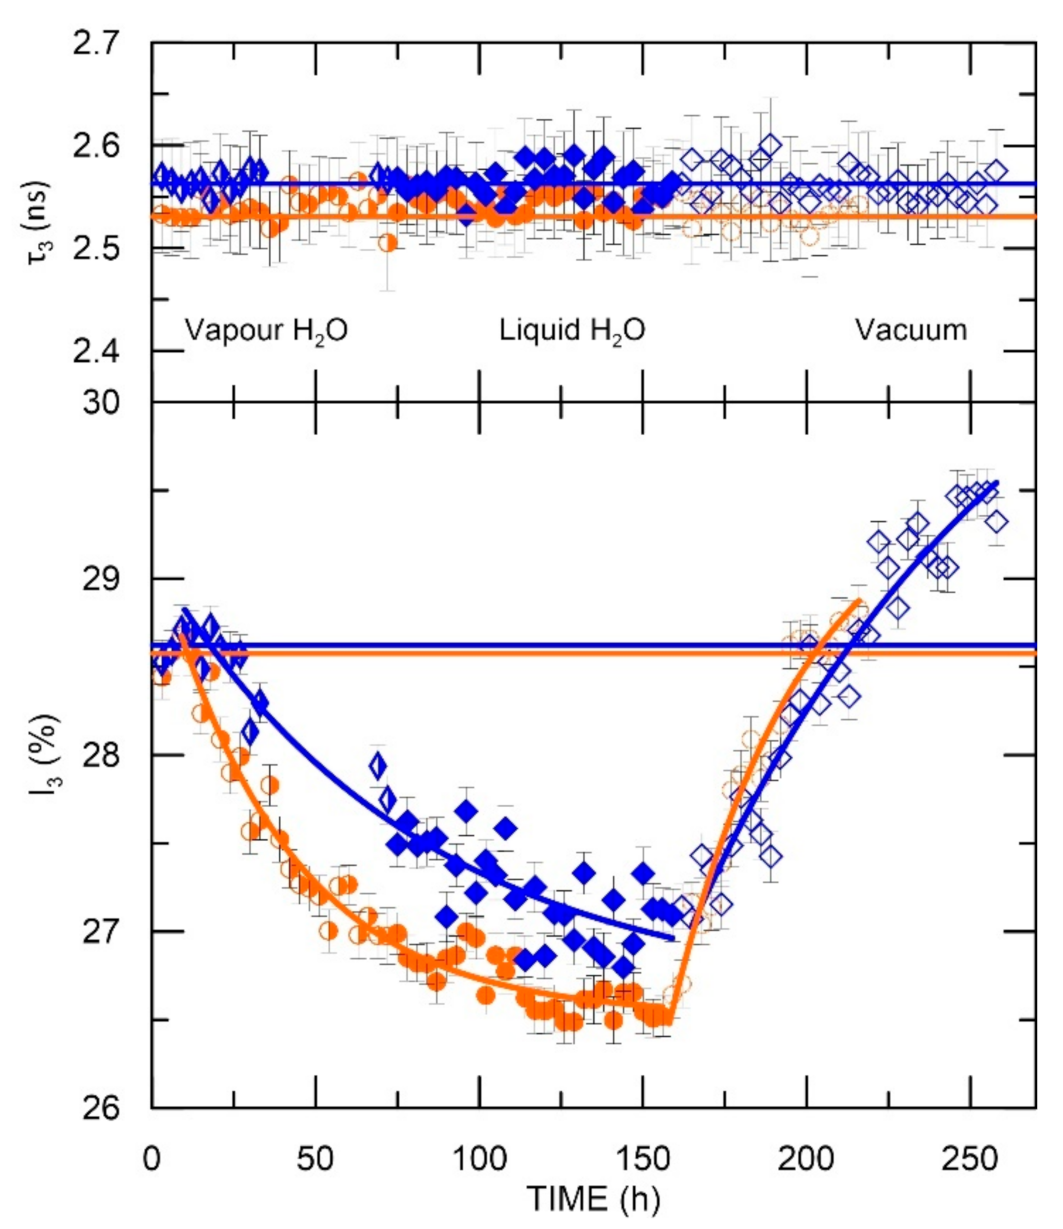
- At 18 °C, the samples were placed in H2O vapor, and the process of water sorption from vapor was examined;
- After 2–3 days, deionized water was poured into the chamber, and the evolution of the sample nanostructure over time was investigated;
- The last step was water removal from the sample chamber and vacuuming out the remaining (bound in the sample) water.
3.4. Swelling Process and Subsequent Water Desorption for PALS Analysis
3.5. Investigation of the Polymers as Immobilization Matrixes in Enzymatic Biosensors Construction
4. Conclusions
Supplementary Materials
Author Contributions
Funding
Institutional Review Board Statement
Informed Consent Statement
Data Availability Statement
Conflicts of Interest
References
- Xia, Y.; Larock, R.C. Vegetable oil-based polymeric materials: Synthesis, properties, and applications. Green Chem. 2010, 12, 1893–1909. [Google Scholar] [CrossRef]
- Danzo, B.J. The effects of environmental hormones on reproduction. Cell. Mol. Life Sci. CMLS 1998, 54, 1249–1264. [Google Scholar] [CrossRef] [PubMed]
- Roy, J.R.; Chakraborty, S.; Chakraborty, T.R. Estrogen-like endocrine disrupting chemicals affecting puberty in humans—A review. Med. Sci. Monit. 2009, 15, RA137–RA145. [Google Scholar] [PubMed]
- Rozati, R.; Reddy, P.P.; Reddanna, P.A.; Mujtaba, R. Role of environmental estrogens in the deterioration of male factor fertility. Fertil. Steril. 2002, 78, 1187–1194. [Google Scholar] [CrossRef]
- Aravindakshan, J.; Paquet, V.; Gregory, M.; Dufresne, J.; Fournier, M.; Marcogliese, D.J.; Cyr, D.G. Consequences of xenoestrogen exposure on male reproductive function in spottail shiners (Notropis hudsonius). Toxicol. Sci. 2004, 78, 156–165. [Google Scholar] [CrossRef] [PubMed]
- Patisaul, H.B.; Adewale, H.B. Long-term effects of environmental endocrine disruptors on reproductive physiology and behavior. Front. Behav. Neurosci. 2009, 3, 10. [Google Scholar] [CrossRef]
- Watson, C.S.; Jeng, Y.J.; Guptarak, J. Endocrine disruption via estrogen receptors that participate in nongenomic signaling pathways. J. Steroid Biochem. Mol. Biol. 2011, 127, 44–50. [Google Scholar] [CrossRef]
- Vom Saal, F.S.; Hughes, C. An extensive new literature concerning low-dose effects of bisphenol A shows the need for a new risk assessment. Environ. Health Perspect. 2005, 113, 926–933. [Google Scholar] [CrossRef]
- Fertier, L.; Koleilat, H.; Stemmelen, M.; Giani, O.; Joly-Duhamel, C.; Lapinte, V.; Robin, J.J. The use of renewable feedstock in UV-curable materials—A new age for polymers and green chemistry. Prog. Polym. Sci. 2013, 38, 932–962. [Google Scholar] [CrossRef]
- Golaz, B.; Michaud, V.; Månson, J.A. Photo-polymerized epoxy primer for adhesion improvement at thermoplastics/metallic wires interfaces. Compos. Part A Appl. Sci. Manuf. 2013, 48, 171–180. [Google Scholar] [CrossRef]
- Sangermano, M.; Razza, N.; Crivello, J.V. Cationic UV-curing: Technology and applications. Macromol. Mater. Eng. 2014, 299, 775–793. [Google Scholar] [CrossRef]
- Lebedevaite, M.; Ostrauskaite, J. Influence of photoinitiator and temperature on photocross-linking kinetics of acrylated epoxidized soybean oil and properties of the resulting polymers. Ind. Crops Prod. 2021, 161, 113210. [Google Scholar] [CrossRef]
- Zhu, Y.; Liu, Y.; Miller, K.A.; Zhu, H.; Egap, E. Lead Halide Perovskite Nanocrystals as Photocatalysts for PET-RAFT Polymerization under Visible and Near-Infrared Irradiation. ACS Macro Lett. 2020, 9, 725–730. [Google Scholar] [CrossRef] [PubMed]
- Zhao, M.; Zhu, S.; Yang, X.; Wang, Y.; Zhou, X.; Xie, X. A Porphyrinic Donor–Acceptor Conjugated Porous Polymer as Highly Efficient Photocatalyst for PET–RAFT Polymerization. Macromol. Rapid Commun. 2022, 2200173. Available online: https://onlinelibrary.wiley.co (accessed on 15 September 2022). [CrossRef]
- Kavetskyy, T.; Smutok, O.; Demkiv, O.; Kasetaite, S.; Ostrauskaite, J.; Švajdlenková, H.; Šauša, O.; Zubrytska, K.; Hoivanovych, N.; Gonchar, M. Dependence of operational parameters of laccase-based biosensors on structure of photocross-linked polymers as holding matrixes. Eur. Polym. J. 2019, 115, 391–398. [Google Scholar] [CrossRef]
- Kavetskyy, T.; Smutok, O.; Gonchar, M.; Demkiv, O.; Klepach, H.; Kukhazh, Y.; Šauša, O.; Petkova, T.; Boev, V.; Ilcheva, V.; et al. Laccase-containing ureasil-polymer composite as the sensing layer of an amperometric biosensor. J. Appl. Polym. Sci. 2017, 134, 45278. [Google Scholar] [CrossRef]
- Kavetskyy, T.; Šauša, O.; Čechová, K.; Švajdlenková, H.; Mat’ko, I.; Petkova, T.; Boev, V.; Ilcheva, V.; Smutok, O.; Kukhazh, Y.; et al. Network Properties of Ureasil-Based Polymer Matrixes for Construction of Amperometric Biosensors as Probed by PALS and Swelling Experiments. Acta Phys. Pol. A 2017, 132, 1515–1518. [Google Scholar] [CrossRef]
- Kavetskyy, T.; Kukhazh, Y.; Zubrytska, K.; Smutok, O.; Demkiv, O.; Gonchar, M.; Šauša, O.; Švajdlenková, H.; Kasetaite, S.; Ostrauskaite, J.; et al. Controlling the Network Properties of Polymer Matrices for Improvement of Amperometric Enzyme Biosensors: Contribution of Positron Annihilation. Acta Phys. Pol. A 2020, 137, 246. [Google Scholar] [CrossRef]
- Schrader, D.M.; Jean, Y.C. (Eds.) Studies in Physical and Theoretical Chemistry; Vol. 57: Positron and Positronium Chemistry; Elsevier: Amsterdam, The Netherlands, 1988. [Google Scholar]
- Brandt, W.; Dupasquier, A. Positrons Solid-State Physics; North-Holland: Amsterdam, The Netherlands, 1983. [Google Scholar]
- Goworek, T. Positronium as a probe of small free volumes in crystals, polymers and porous media. Ann. Univ. Mariae Curie-Sklodowska Sectio AA–Chemia 2015, 69, 1–110. [Google Scholar] [CrossRef]
- Mogensen, O.E. Positron Annihilation in Chemistry; Springer: Berlin/Heidelberg, Germany, 1995. [Google Scholar]
- Tao, S.J. Positronium Annihilation in Molecular Substances. J. Chem. Phys. 1972, 56, 5499–5510. [Google Scholar] [CrossRef]
- Eldrup, M.; Pedersen, N.J.; Sherwood, J.N. Positron Annihilation Study of Defects in Succinonitrile. Phys. Rev. Lett. 1979, 43, 1407. [Google Scholar] [CrossRef]
- Lightbody, D.; Sherwood, J.N.; Eldrup, M. The vacancy formation energy in crystalline adamantane determined by positron-annihilation techniques. Chem. Phys. Lett. 1980, 70, 487–491. [Google Scholar] [CrossRef]
- Eldrup, M.; Lightbody, D.; Sherwood, J.N. The temperature dependence of positron lifetimes in solid pivalic acid. Chem. Phys. 1981, 63, 51–58. [Google Scholar] [CrossRef]
- Lightbody, D.; Sherwood, J.N.; Eldrup, M. Vacancy formation energies in plastic crystals using positron-annihilation techniques. Mol. Cryst. Liq. Cryst. 1983, 96, 197–210. [Google Scholar] [CrossRef]
- Lightbody, D.; Sherwood, J.N. Temperature and phase dependence of positron lifetimes in solid cyclohexane. Chem. Phys. 1985, 93, 475–484. [Google Scholar] [CrossRef]
- Jasińska, B.; Kozioł, A.; Goworek, T. Ortho-positronium lifetimes in nonspherical voids. J. Radioanal. Nucl. Chem. 1996, 210, 617–623. [Google Scholar] [CrossRef]
- Jasińska, B.; Kozioł, A.; Goworek, T. Void shapes and o-Ps lifetime in molecular crystals. Acta Phys. Pol. A 1999, 4, 557–561. [Google Scholar] [CrossRef]
- Olson, B.G.; Prodpran, T.; Jamieson, A.M.; Nazarenko, S. Positron annihilation in syndiotactic polystyrene containing alpha and beta crystalline forms. Polymer 2002, 43, 6775–6784. [Google Scholar] [CrossRef]
- Zgardzińska, B. The size of smallest subnanometric voids estimated by positron annihilation method. Correction to the Tao-Eldrup model. Chem. Phys. Lett. 2015, 622, 20–22. [Google Scholar] [CrossRef]
- Wang, Y.Y.; Nakanishi, H.; Jean, Y.C.; Sandreczki, T.C. Positron-annihilation in amine-cured epoxy polymers—Pressure-dependence. J. Polym. Sci. B Polym. Phys. 1990, 28, 1431–1441. [Google Scholar] [CrossRef]
- Liu, J.; Deng, Q.; Jean, Y.C. Free-volume distributions of polystyrene probed by positron-annihilation—Comparison with free-volume theories. Macromolecules 1993, 26, 7149–7155. [Google Scholar] [CrossRef]
- Consolati, G.; Quasso, F.; Simha, R.; Olson, B.G. On the relation between positron annihilation lifetime spectroscopy and lattice-hole-theory free volume. J. Polym. Sci. B Polym. Phys. 2005, 43, 2225–2229. [Google Scholar] [CrossRef]
- Consolati, G.; Quasso, F. Morphology of Free-Volume Holes in Amorphous Polymers by Means of Positron Annihilation Lifetime Spectroscopy. In Polymer Physics: From Suspensions to Nanocomposites and beyond; Utracki, L.A., Jamieson, A.M., Eds.; John Wiley & Sons, Inc.: Hoboken, NJ, USA, 2010; pp. 393–419. [Google Scholar]
- Kavetskyy, T.; Smutok, O.; Demkiv, O.; Maťko, I.; Švajdlenková, H.; Šauša, O.; Novák, I.; Berek, D.; Čechová, K.; Pecz, M.; et al. Microporous carbon fibers as electroconductive immobilization matrixes: Effect of their structure on operational parameters of laccase-based amperometric biosensor. Mater. Sci. Eng. C 2020, 109, 110570. [Google Scholar] [CrossRef] [PubMed]
- Goździuk, M.; Zgardzińska, B.; Kavetskyy, T.; Zubrytska, K.; Smutok, O.; Šauša, O.; Lebedevaite, M.; Ostrauskaite, J.; Kiv, A. Nanostructure Research and Amperometric Testing to Determine Detection Capabilities of Biopolymer Matrices Based on Acrylated Epoxidized Soybean Oil. Acta Phys. Pol. A 2021, 139, 432–437. [Google Scholar] [CrossRef]
- Remeikyte, A.; Ostrauskaite, J.; Grazuleviciene, V. Synthesis and properties of photocross-linked polymers of epoxidized linseed oil with different reactive diluents. J. Appl. Polym. Sci. 2013, 129, 1290–1298. [Google Scholar] [CrossRef]
- Lebedevaite, M.; Ostrauskaite, J.; Skliutas, E.; Malinauskas, M. Photoinitiator Free Resins Composed of Plant-Derived Monomers for the Optical mu-3D Printing of Thermosets. Polymers 2019, 11, 116. [Google Scholar] [CrossRef]
- Lebedevaite, M.; Ostrauskaite, J.; Skliutas, E.; Malinauskas, M. Photocross-linked polymers based on plant-derived monomers for potential application in optical 3D printing. J. Appl. Polym. Sci. 2020, 137, 48708. [Google Scholar] [CrossRef]
- Kamoun, E.A.; El-Betany, A.; Menzel, H.; Chen, X. Influence of photoinitiator concentration and irradiation time on the crosslinking performance of visible-light activated pullulan-HEMA hydrogels. Int. J. Biol. Macromol. 2018, 120, 1884–1892. [Google Scholar] [CrossRef]
- Mucci, V.; Vallo, C. Efficiency of 2, 2-dimethoxy-2-phenylacetophenone for the photopolymerization of methacrylate monomers in thick sections. J. Appl. Polym. Sci. 2012, 123, 418–425. [Google Scholar] [CrossRef]
- Kansy, J. Microcomputer program for analysis of positron annihilation lifetime spectra. Nucl. Instrum. Methods Phys. Res. Sect. A 1996, 374, 235–244. [Google Scholar] [CrossRef]
- Shukla, A.; Peter, M.; Hoffmann, L. Analysis of positron lifetime spectra using quantified maximum-entropy and a general linear filter. Nucl. Instrum. Methods Phys. Res. Sect. A 1993, 335, 310–317. [Google Scholar] [CrossRef]
- Zaleski, R. Measurement and analysis of the positron annihilation lifetime spectra for mesoporous silica. Acta Phys. Pol. A 2006, 110, 729–738. [Google Scholar] [CrossRef]
- Kindl, P.; Reiter, Q. Investigations on the low-temperature transitions and time effects of branched polyethylene by the positron lifetime technique. Phys. Stat. Sol. (a) 1987, 104, 707–713. [Google Scholar] [CrossRef]
- Suzuki, T.; Miura, T.; Oki, Y.; Numajiri, M.; Kondo, K.; Ito, Y. Positron irradiation effects on polypropylene. J. Phys. IV 1993, 3, C4-283–C4-285. [Google Scholar] [CrossRef]
- Wang, C.L.; Hirade, T.; Maurer, F.H.J.; Eldrup, M.; Pedersen, N.J. Free-volume distribution and positronium formation in amorphous polymers: Temperature and positron-irradiation-time dependence. J. Chem. Phys. 1998, 108, 4654–4661. [Google Scholar] [CrossRef]
- Zgardzińska, B.; Hirade, T.; Goworek, T. Positronium formation on trapped electrons in n-heptadecane. Chem. Phys. Lett. 2007, 446, 309–312. [Google Scholar] [CrossRef]
- Zaleski, R.; Zgardzińska, B.; Pietrow, M.; Goworek, T. Positron irradiation effects in simple organic solids. Radiat. Phys. Chem. 2008, 77, 1306–1310. [Google Scholar] [CrossRef]
- Švajdlenková, H.; Šauša, O.; Steindl, J.; Koch, T.; Gorsche, C. Microstructural PALS study of regulated dimethacrylates: Thiol- versus β-allyl sulfone-based networks. J. Polym. Sci. B Polym. Phys. 2016, 54, 2476–2484. [Google Scholar] [CrossRef]
- Mishra, A.; Kumar, S. Kinetic studies of laccase enzyme of Coriolus versicolor MTCC 138 in an inexpensive culture medium. Biochem. Eng. J. 2009, 46, 252–256. [Google Scholar] [CrossRef]


| Sample | Process | Θ, h |
|---|---|---|
| ELO/PI | sorption | 39.0 |
| desorption | 40.4 | |
| ELO/10RD1/PI | sorption | 79.9 |
| desorption | 100.7 | |
| AESO/VDM | sorption | 28.1 |
| desorption | 20.8 |
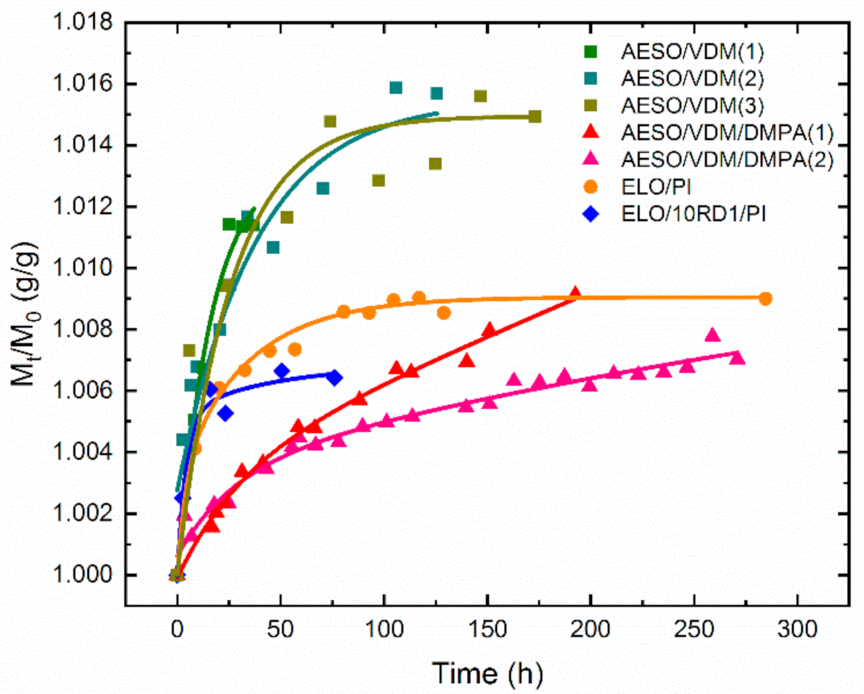
| Sample | M(t)max/M(0) (g/g), swell. | S, % |
|---|---|---|
| AESO/VDM (2) | 1.0150 | 1.432 |
| AESO/VDM/DMPA (1) | 1.0091 | 0.969 |
| ELO/PI | 1.0090 | 1.340 |
| ELO/10RD1/PI | 1.0065 | 0.911 |
| Sample | τ, h | D, m2·s−1 | Process |
|---|---|---|---|
| ELO/PI | 22.55 | 9.24 × 10⁻¹² | swelling |
| ELO/10RD1/PI | 8.96 | 2.33 × 10⁻¹¹ | swelling |
| AESO/VDM (3) | 28.3 | 7.36 × 10⁻¹² | swelling |
| AESO/VDM (3) | 27.5 | 7.58 × 10⁻¹² | desorption in air |
| AESO/VDM/DMPA | 40.4 | 5.16 × 10⁻¹² | swelling |
| Polymer Matrix | Imax, μA | KMapp, mM | Slope (B), μA·mM−1 | Sensitivity, A·M−1·m−2 | Linearity, mM |
|---|---|---|---|---|---|
| ELO/PI | 0.34 ± 0.05 | 0.54 ± 0.07 | 1.7 | 233 | 0.02–0.10 |
| ELO/10RD1/PI | 1.72 ± 0.3 | 0.35 ± 0.06 | 4.1 | 562 | 0.006–0.10 |
| AESO/VDM | 6.33 ± 0.19 | 0.29 ± 0.02 | 17.9 | 2452 | 0.006–0.10 |
| AESO/VDM/DMPA | – | – | – | – | – |
Publisher’s Note: MDPI stays neutral with regard to jurisdictional claims in published maps and institutional affiliations. |
© 2022 by the authors. Licensee MDPI, Basel, Switzerland. This article is an open access article distributed under the terms and conditions of the Creative Commons Attribution (CC BY) license (https://creativecommons.org/licenses/by/4.0/).
Share and Cite
Goździuk, M.; Kavetskyy, T.; Roquero, D.M.; Smutok, O.; Gonchar, M.; Královič, D.P.; Švajdlenková, H.; Šauša, O.; Kalinay, P.; Nosrati, H.; et al. UV-Cured Green Polymers for Biosensorics: Correlation of Operational Parameters of Highly Sensitive Biosensors with Nano-Volumes and Adsorption Properties. Materials 2022, 15, 6607. https://doi.org/10.3390/ma15196607
Goździuk M, Kavetskyy T, Roquero DM, Smutok O, Gonchar M, Královič DP, Švajdlenková H, Šauša O, Kalinay P, Nosrati H, et al. UV-Cured Green Polymers for Biosensorics: Correlation of Operational Parameters of Highly Sensitive Biosensors with Nano-Volumes and Adsorption Properties. Materials. 2022; 15(19):6607. https://doi.org/10.3390/ma15196607
Chicago/Turabian StyleGoździuk, Magdalena, Taras Kavetskyy, Daniel Massana Roquero, Oleh Smutok, Mykhailo Gonchar, David P. Královič, Helena Švajdlenková, Ondrej Šauša, Pavol Kalinay, Hamed Nosrati, and et al. 2022. "UV-Cured Green Polymers for Biosensorics: Correlation of Operational Parameters of Highly Sensitive Biosensors with Nano-Volumes and Adsorption Properties" Materials 15, no. 19: 6607. https://doi.org/10.3390/ma15196607