
Synthesis of Nano-Oxide Precipitates by Implantation of Ti, Y and O Ions in Fe-10%Cr: Towards an Understanding of Precipitation in Oxide Dispersion-Strengthened (ODS) Steels

 ,
,
Abstract
:1. Introduction
2. Materials and Methods
2.1. Material
2.2. Ion Implantation and Thermal Annealing Experiments
2.3. Transmission Electron Microscopy Experiments
2.4. Atom Probe Tomography Experiments
3. Results
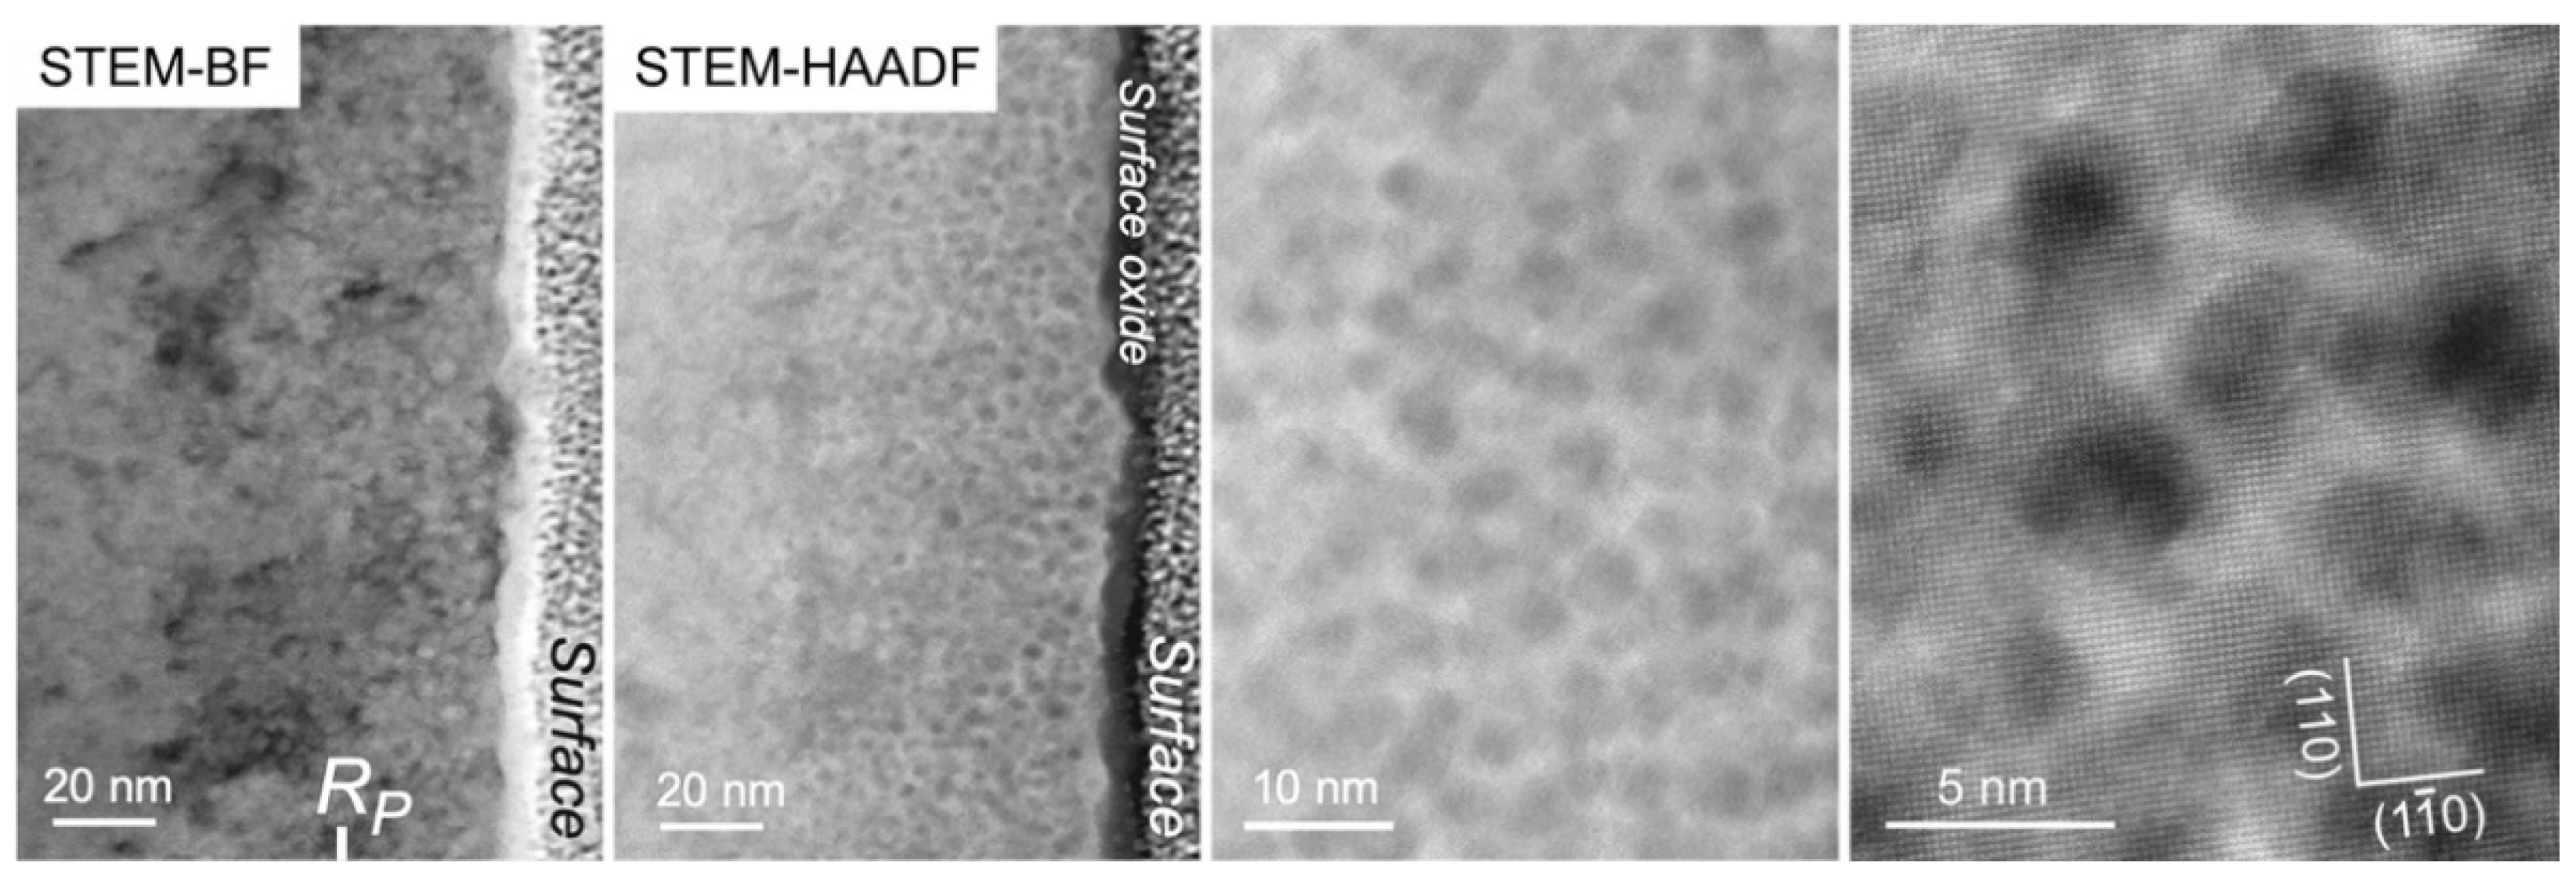
3.1. Different Morphologies of Synthesized Nanoprecipitates after Annealing at 800 °C
3.2. Case 1: Ti ➔ Y ➔ O Sequential Implantation
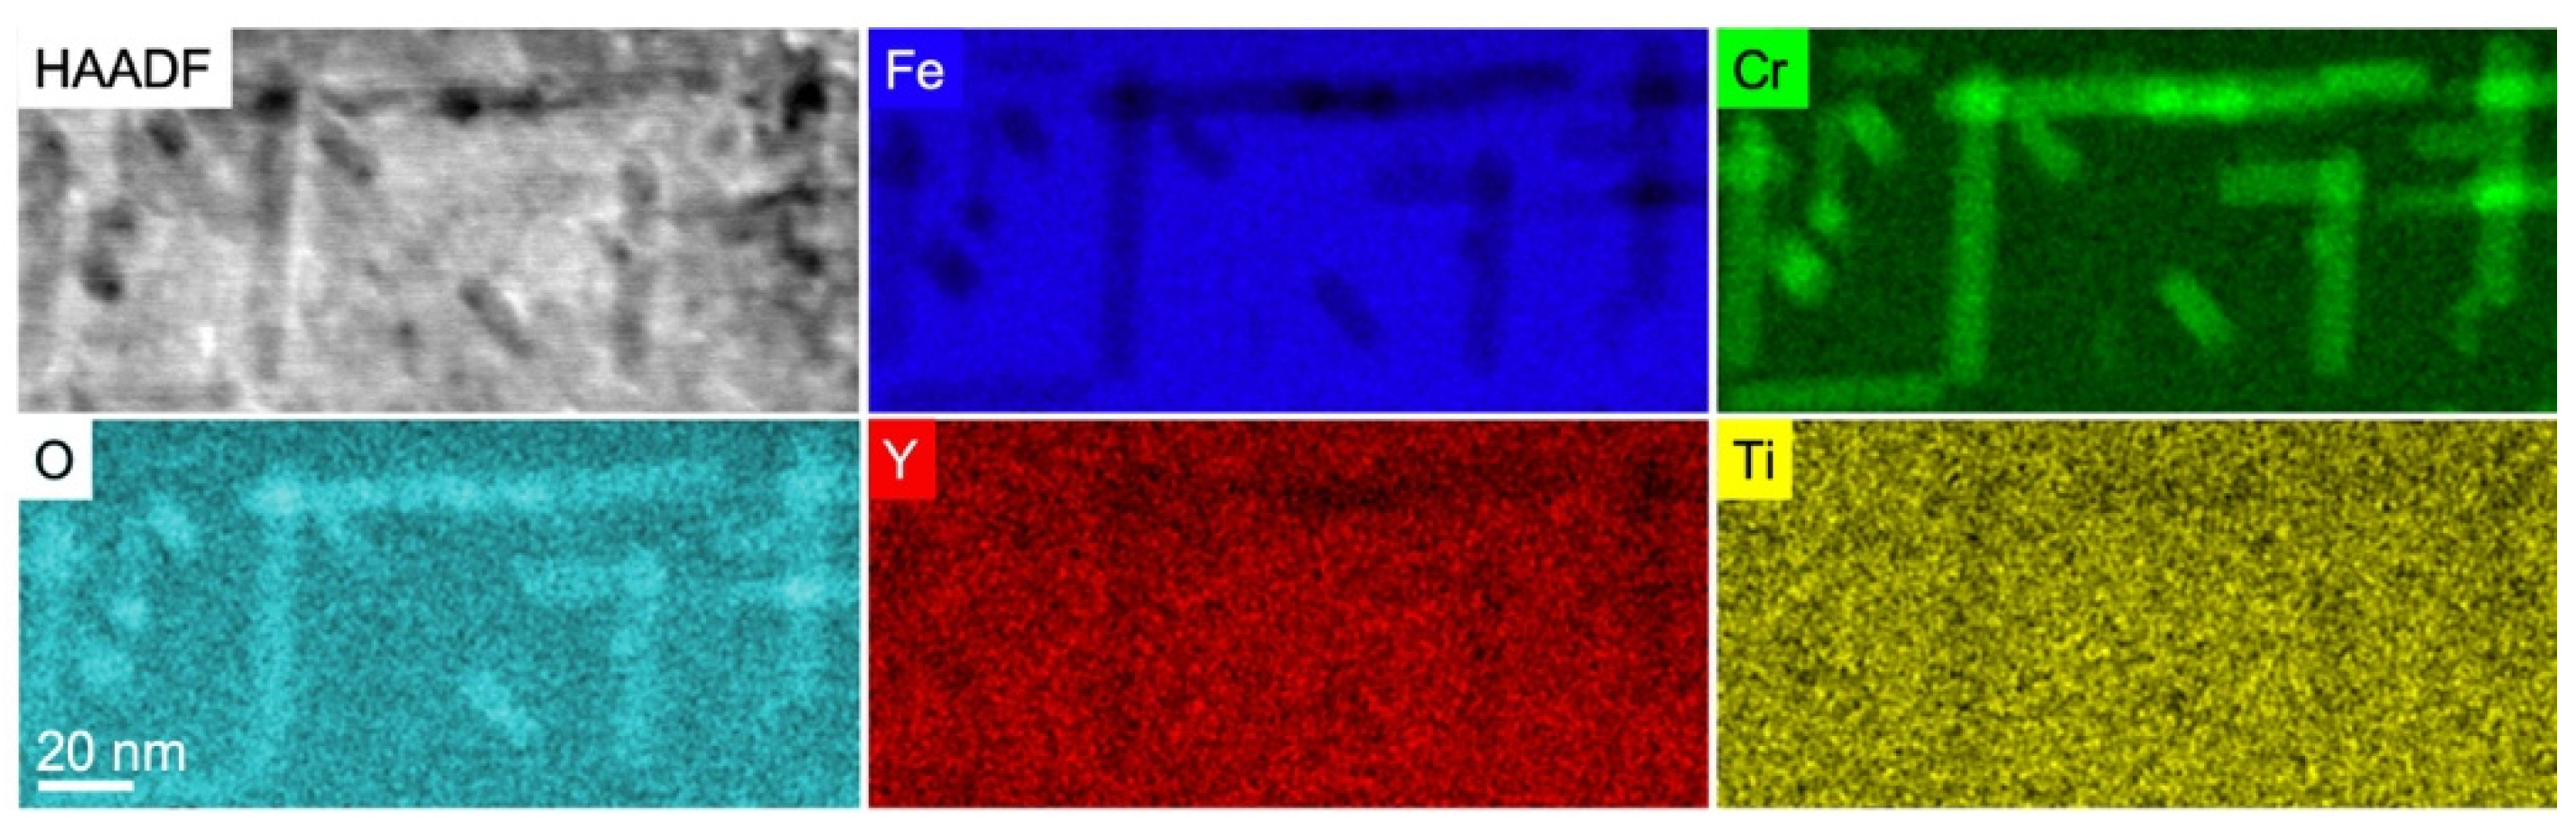
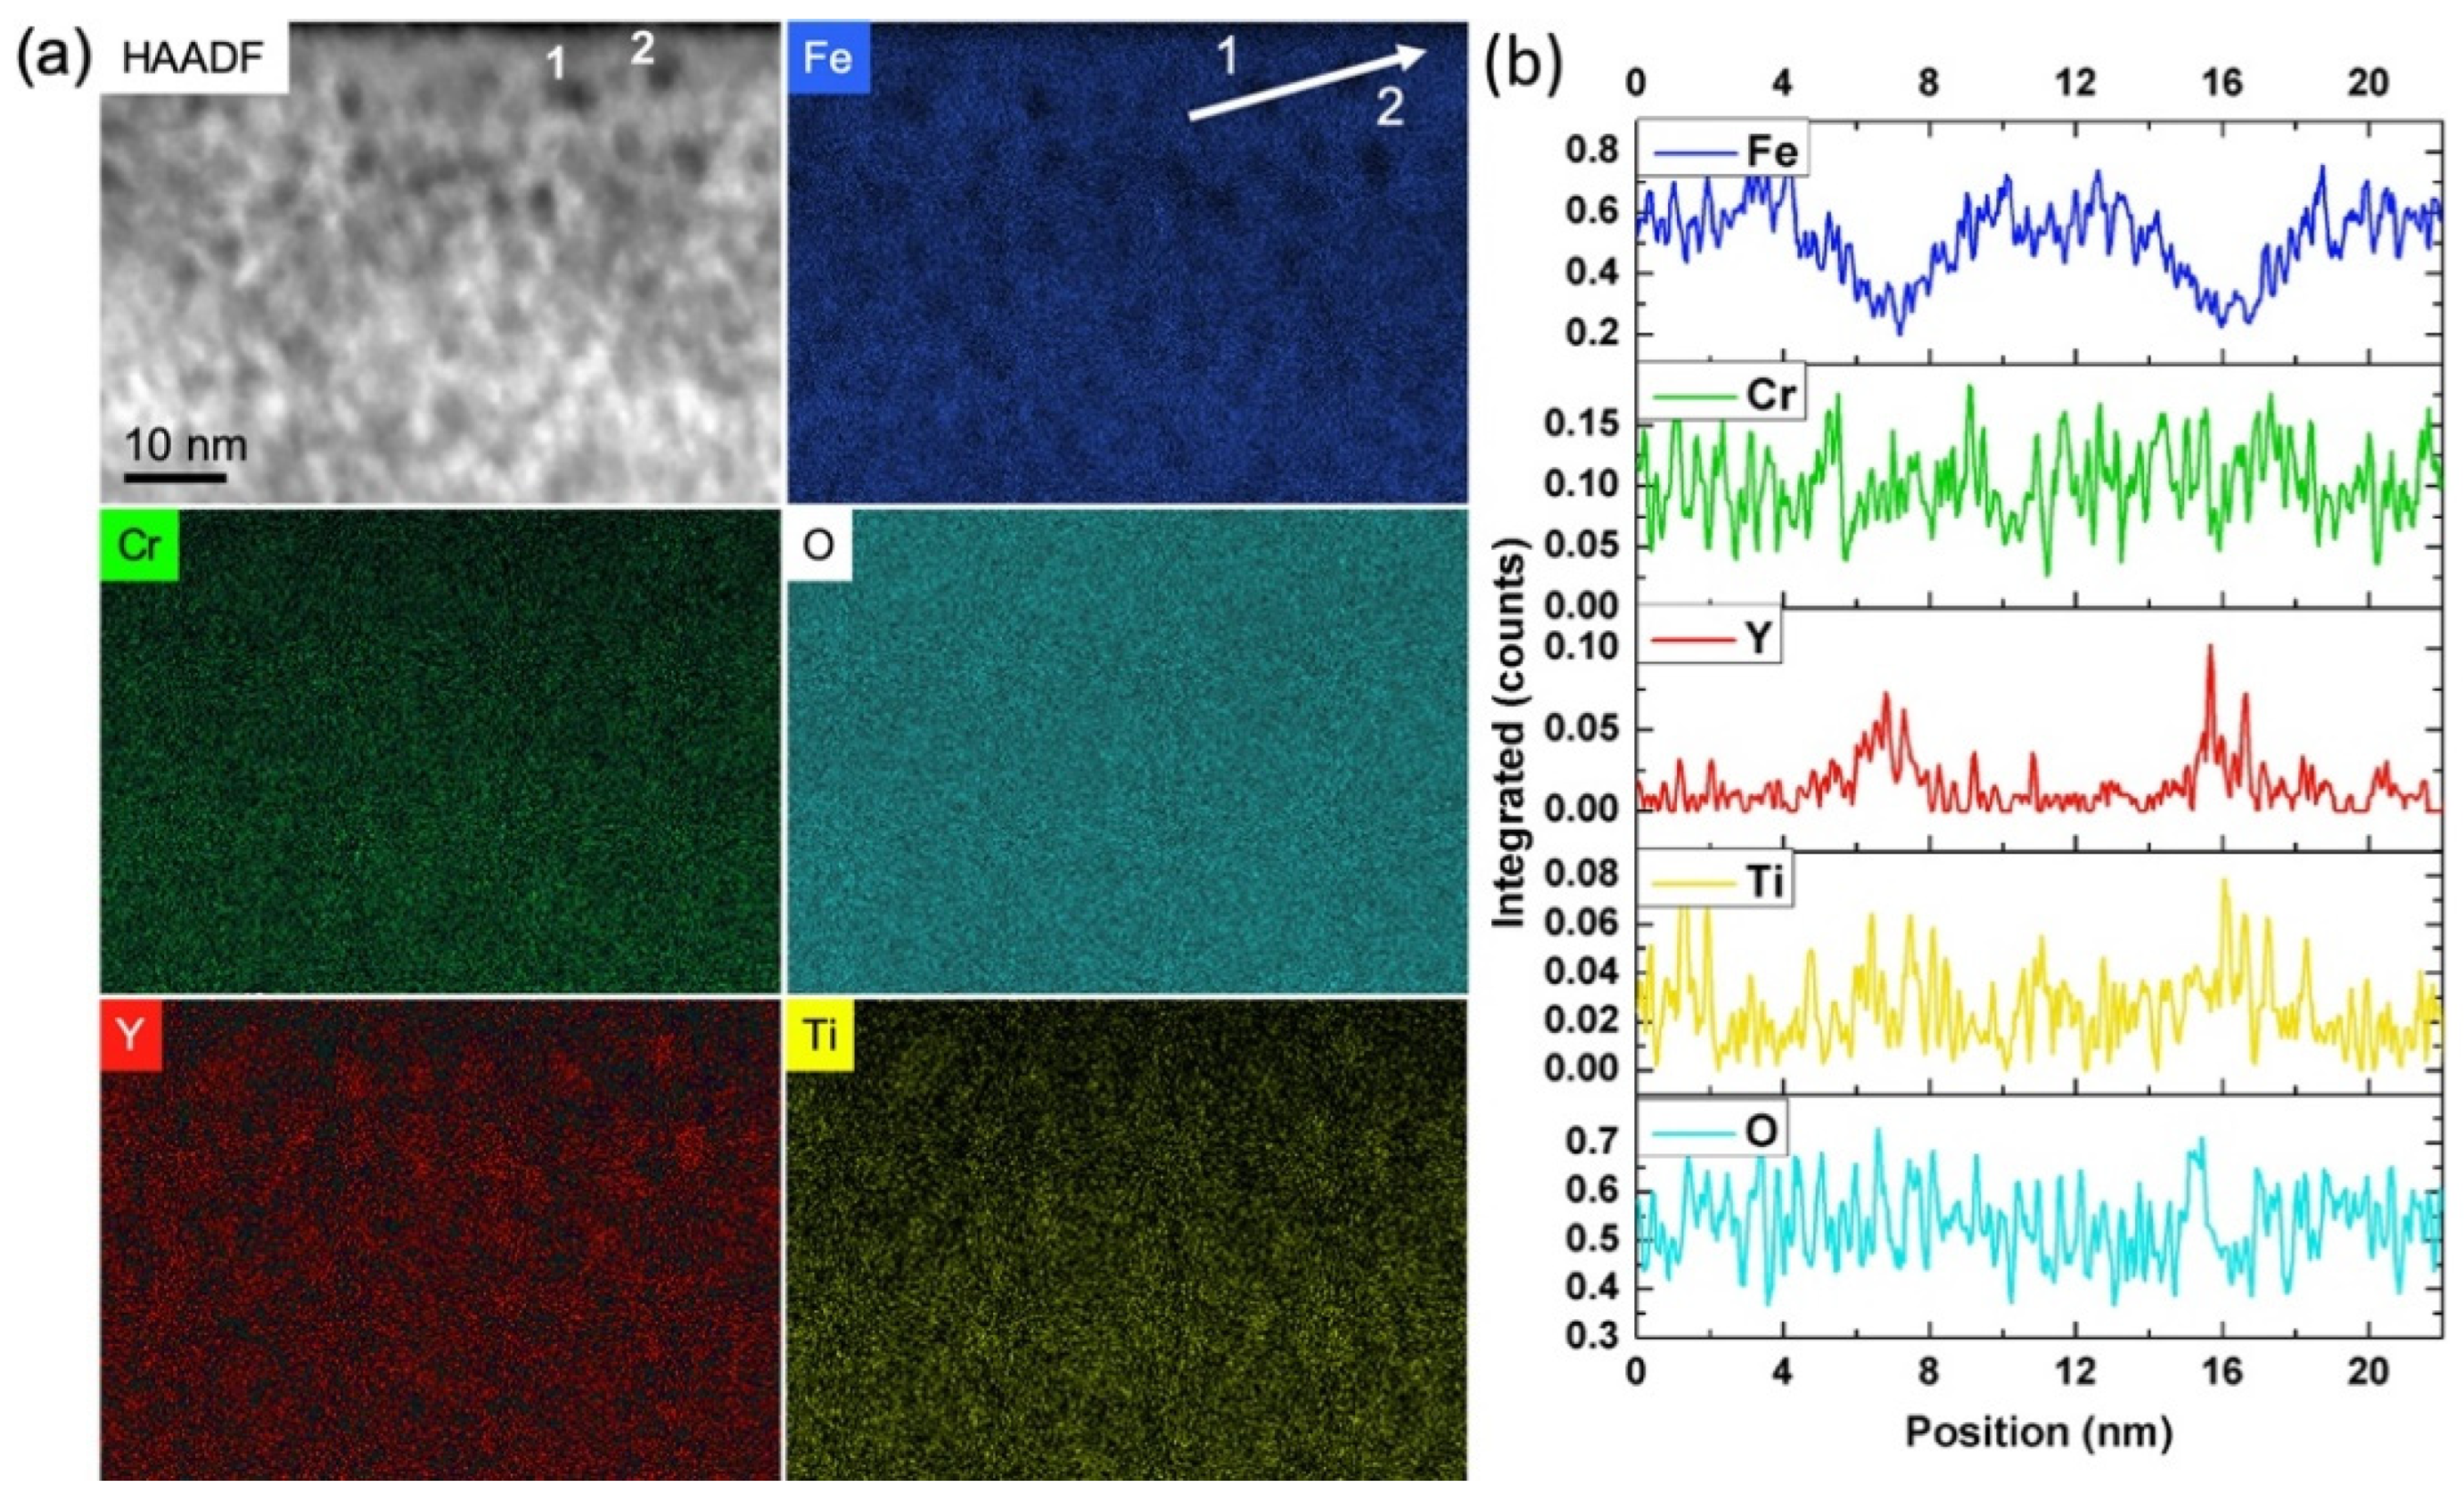
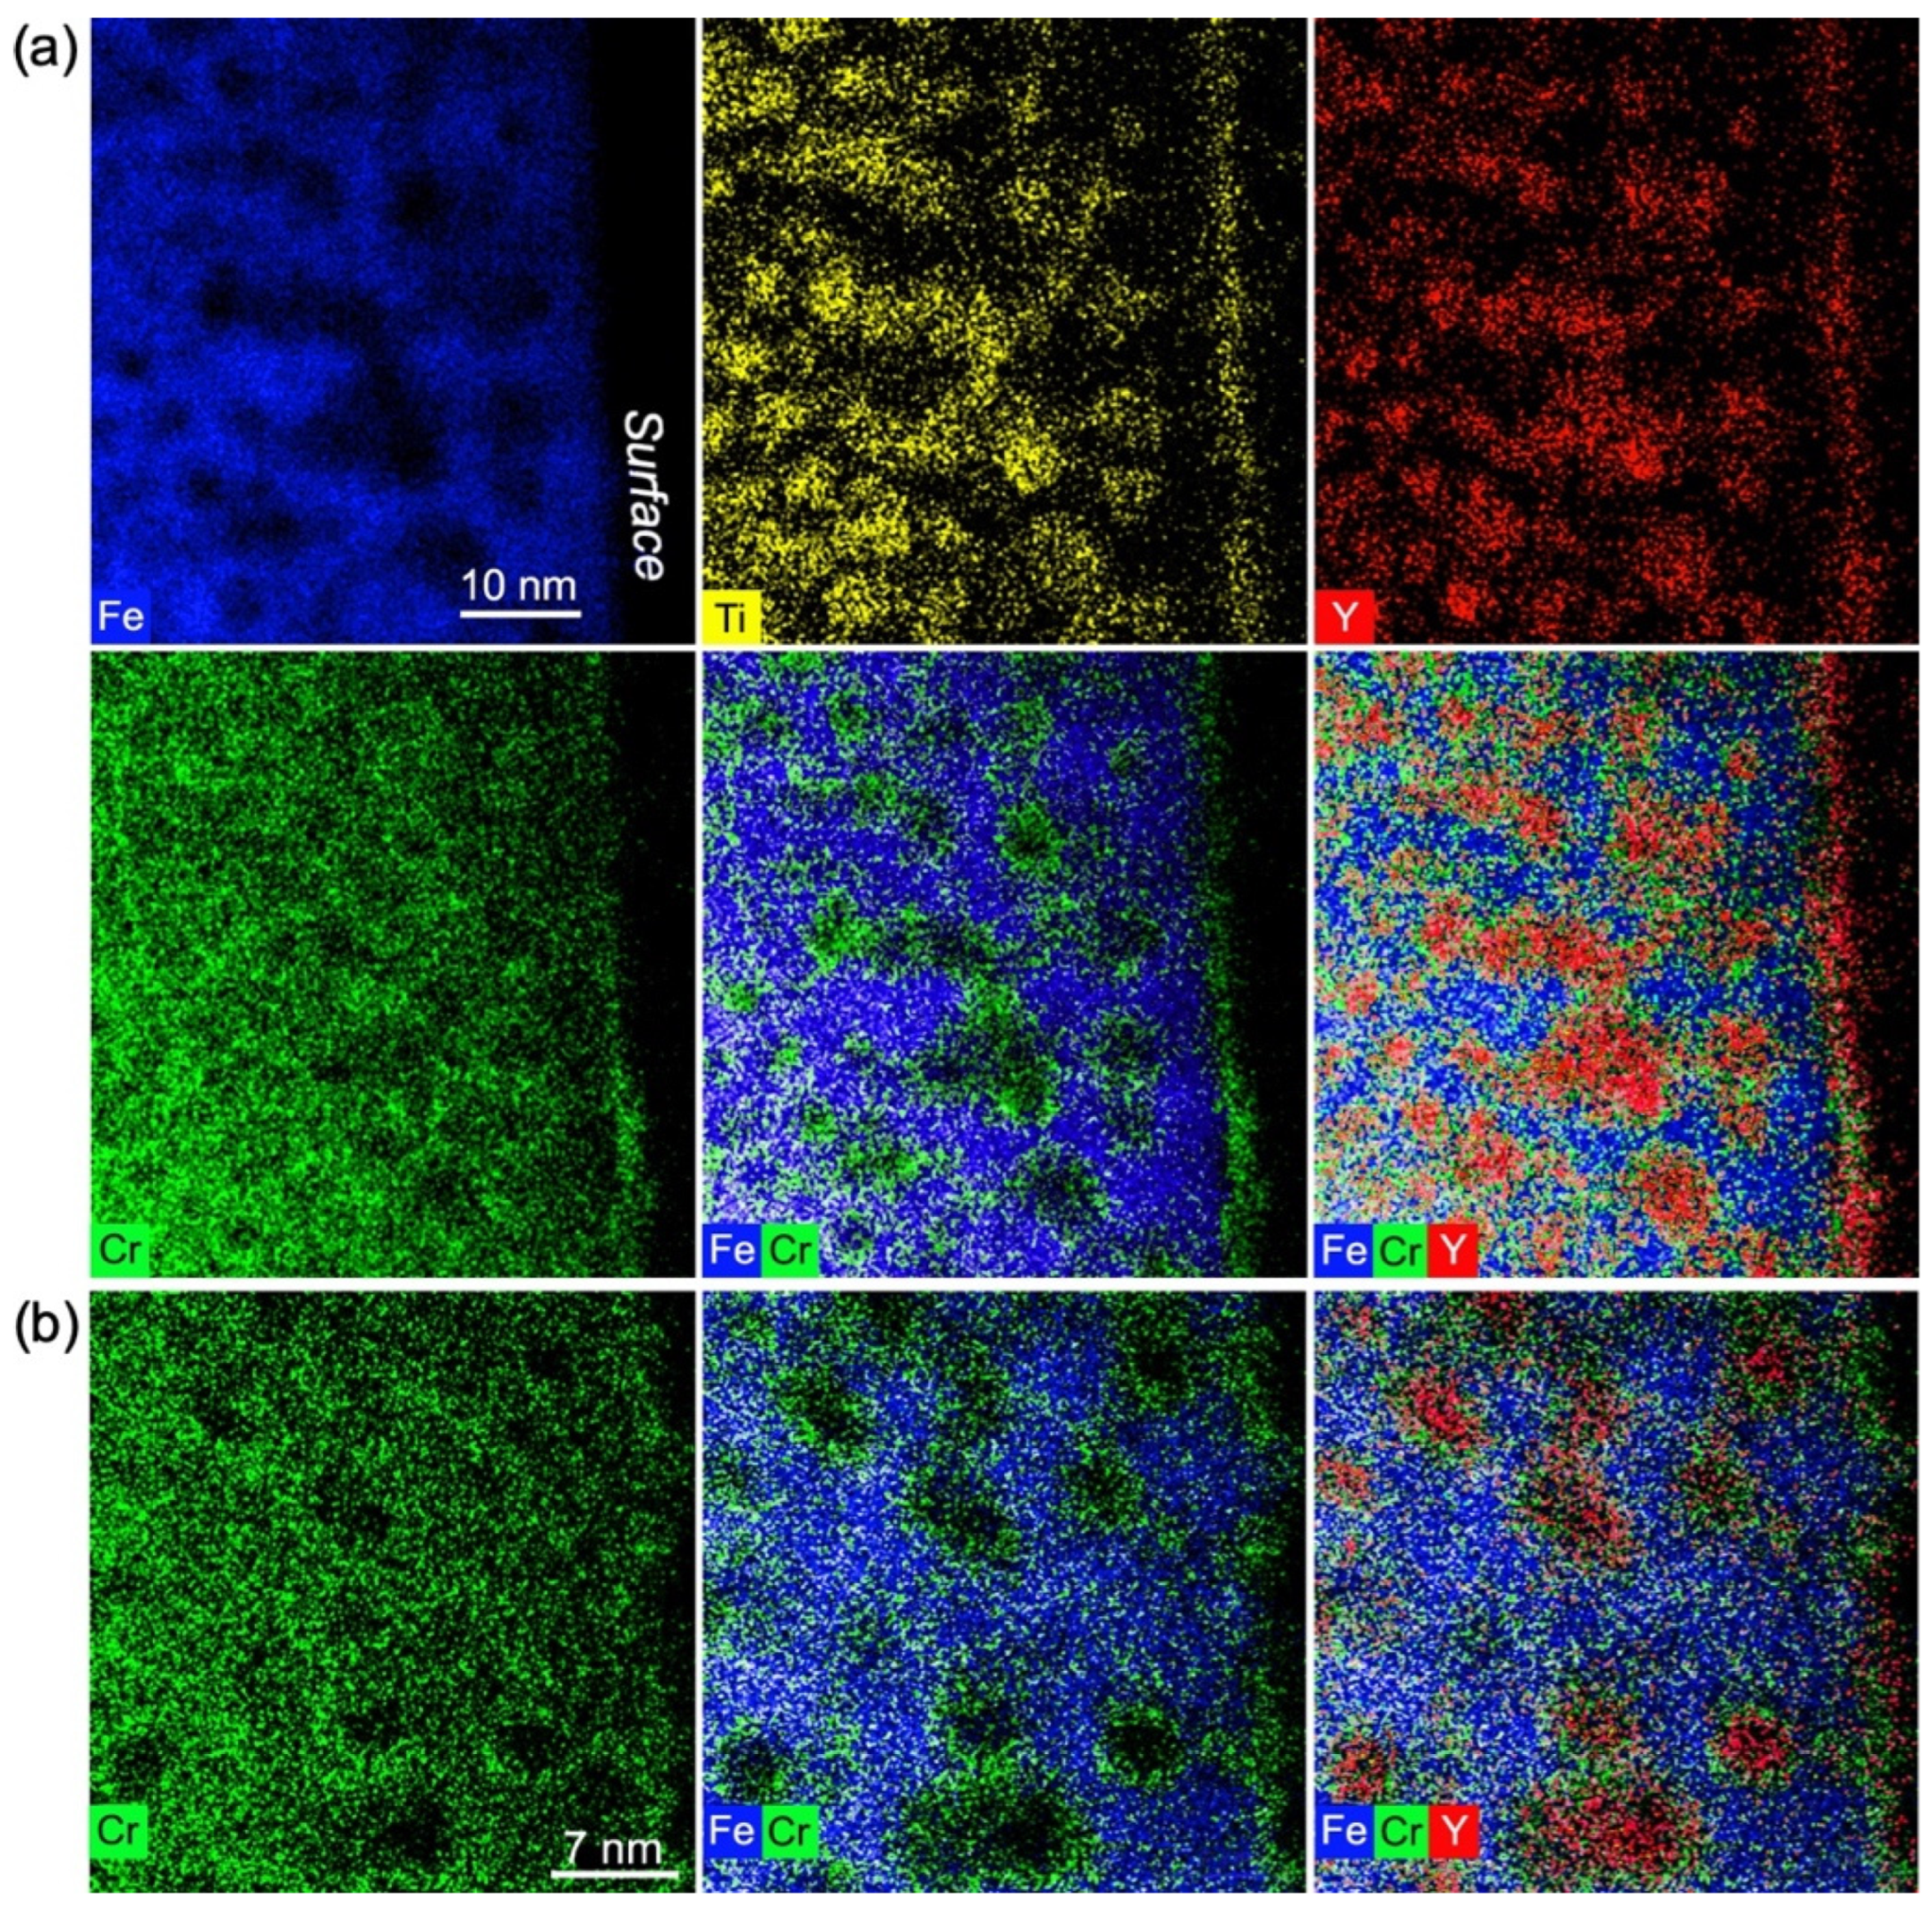
3.2.1. Compositional Analysis of the Ti ➔ Y ➔ O Nanoprecipitates after Annealing at 800 °C
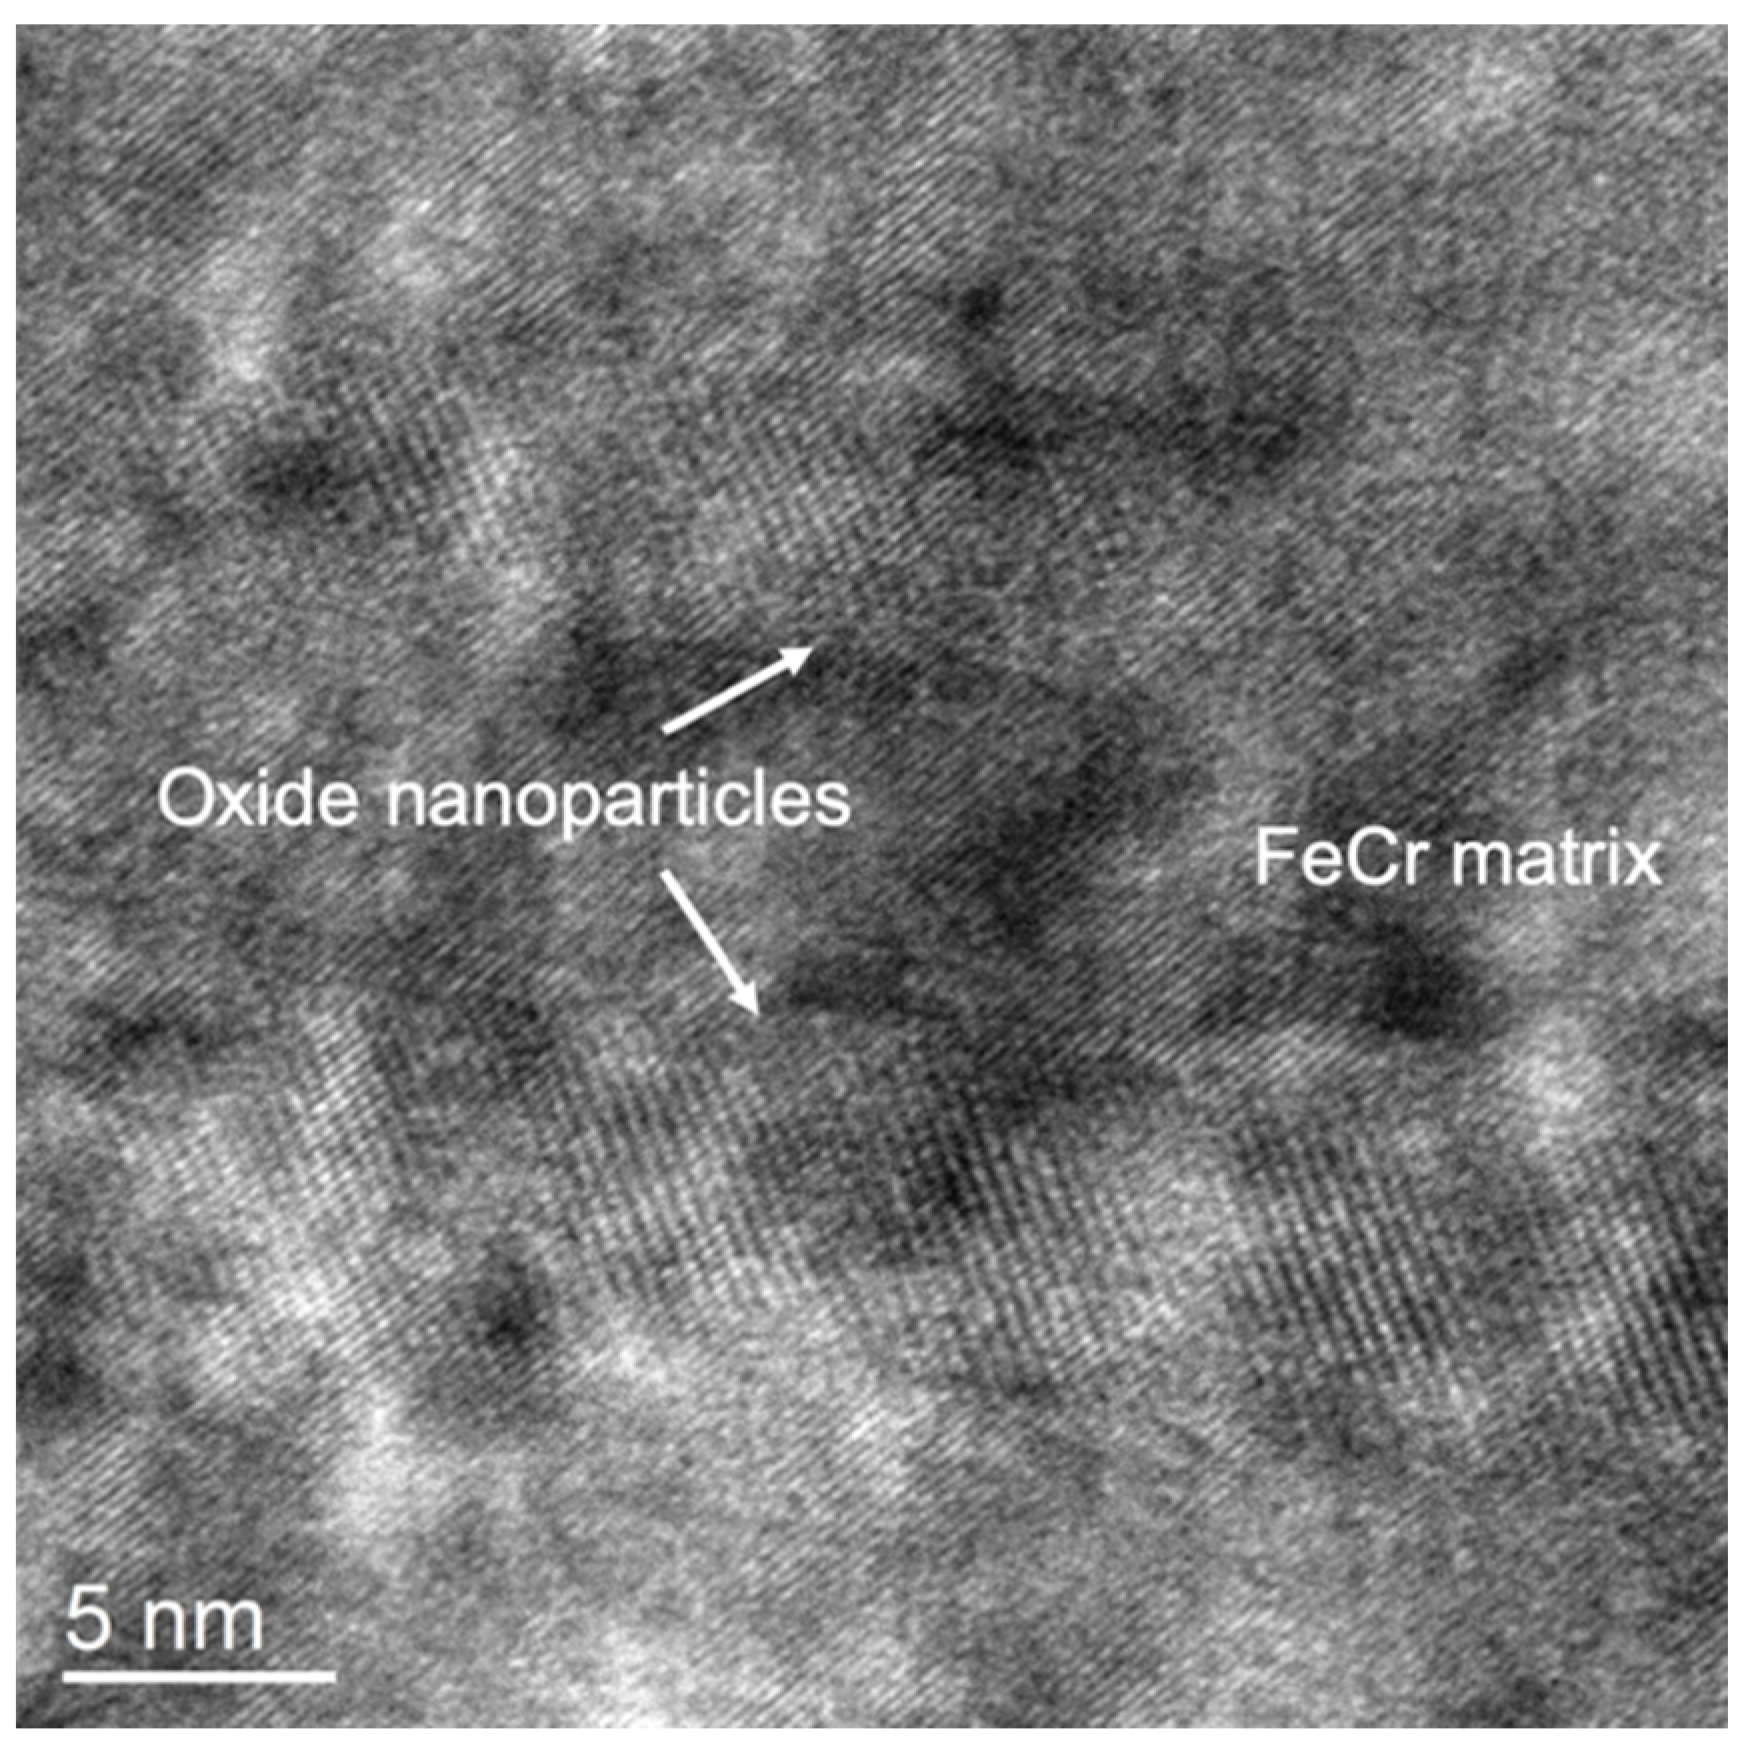
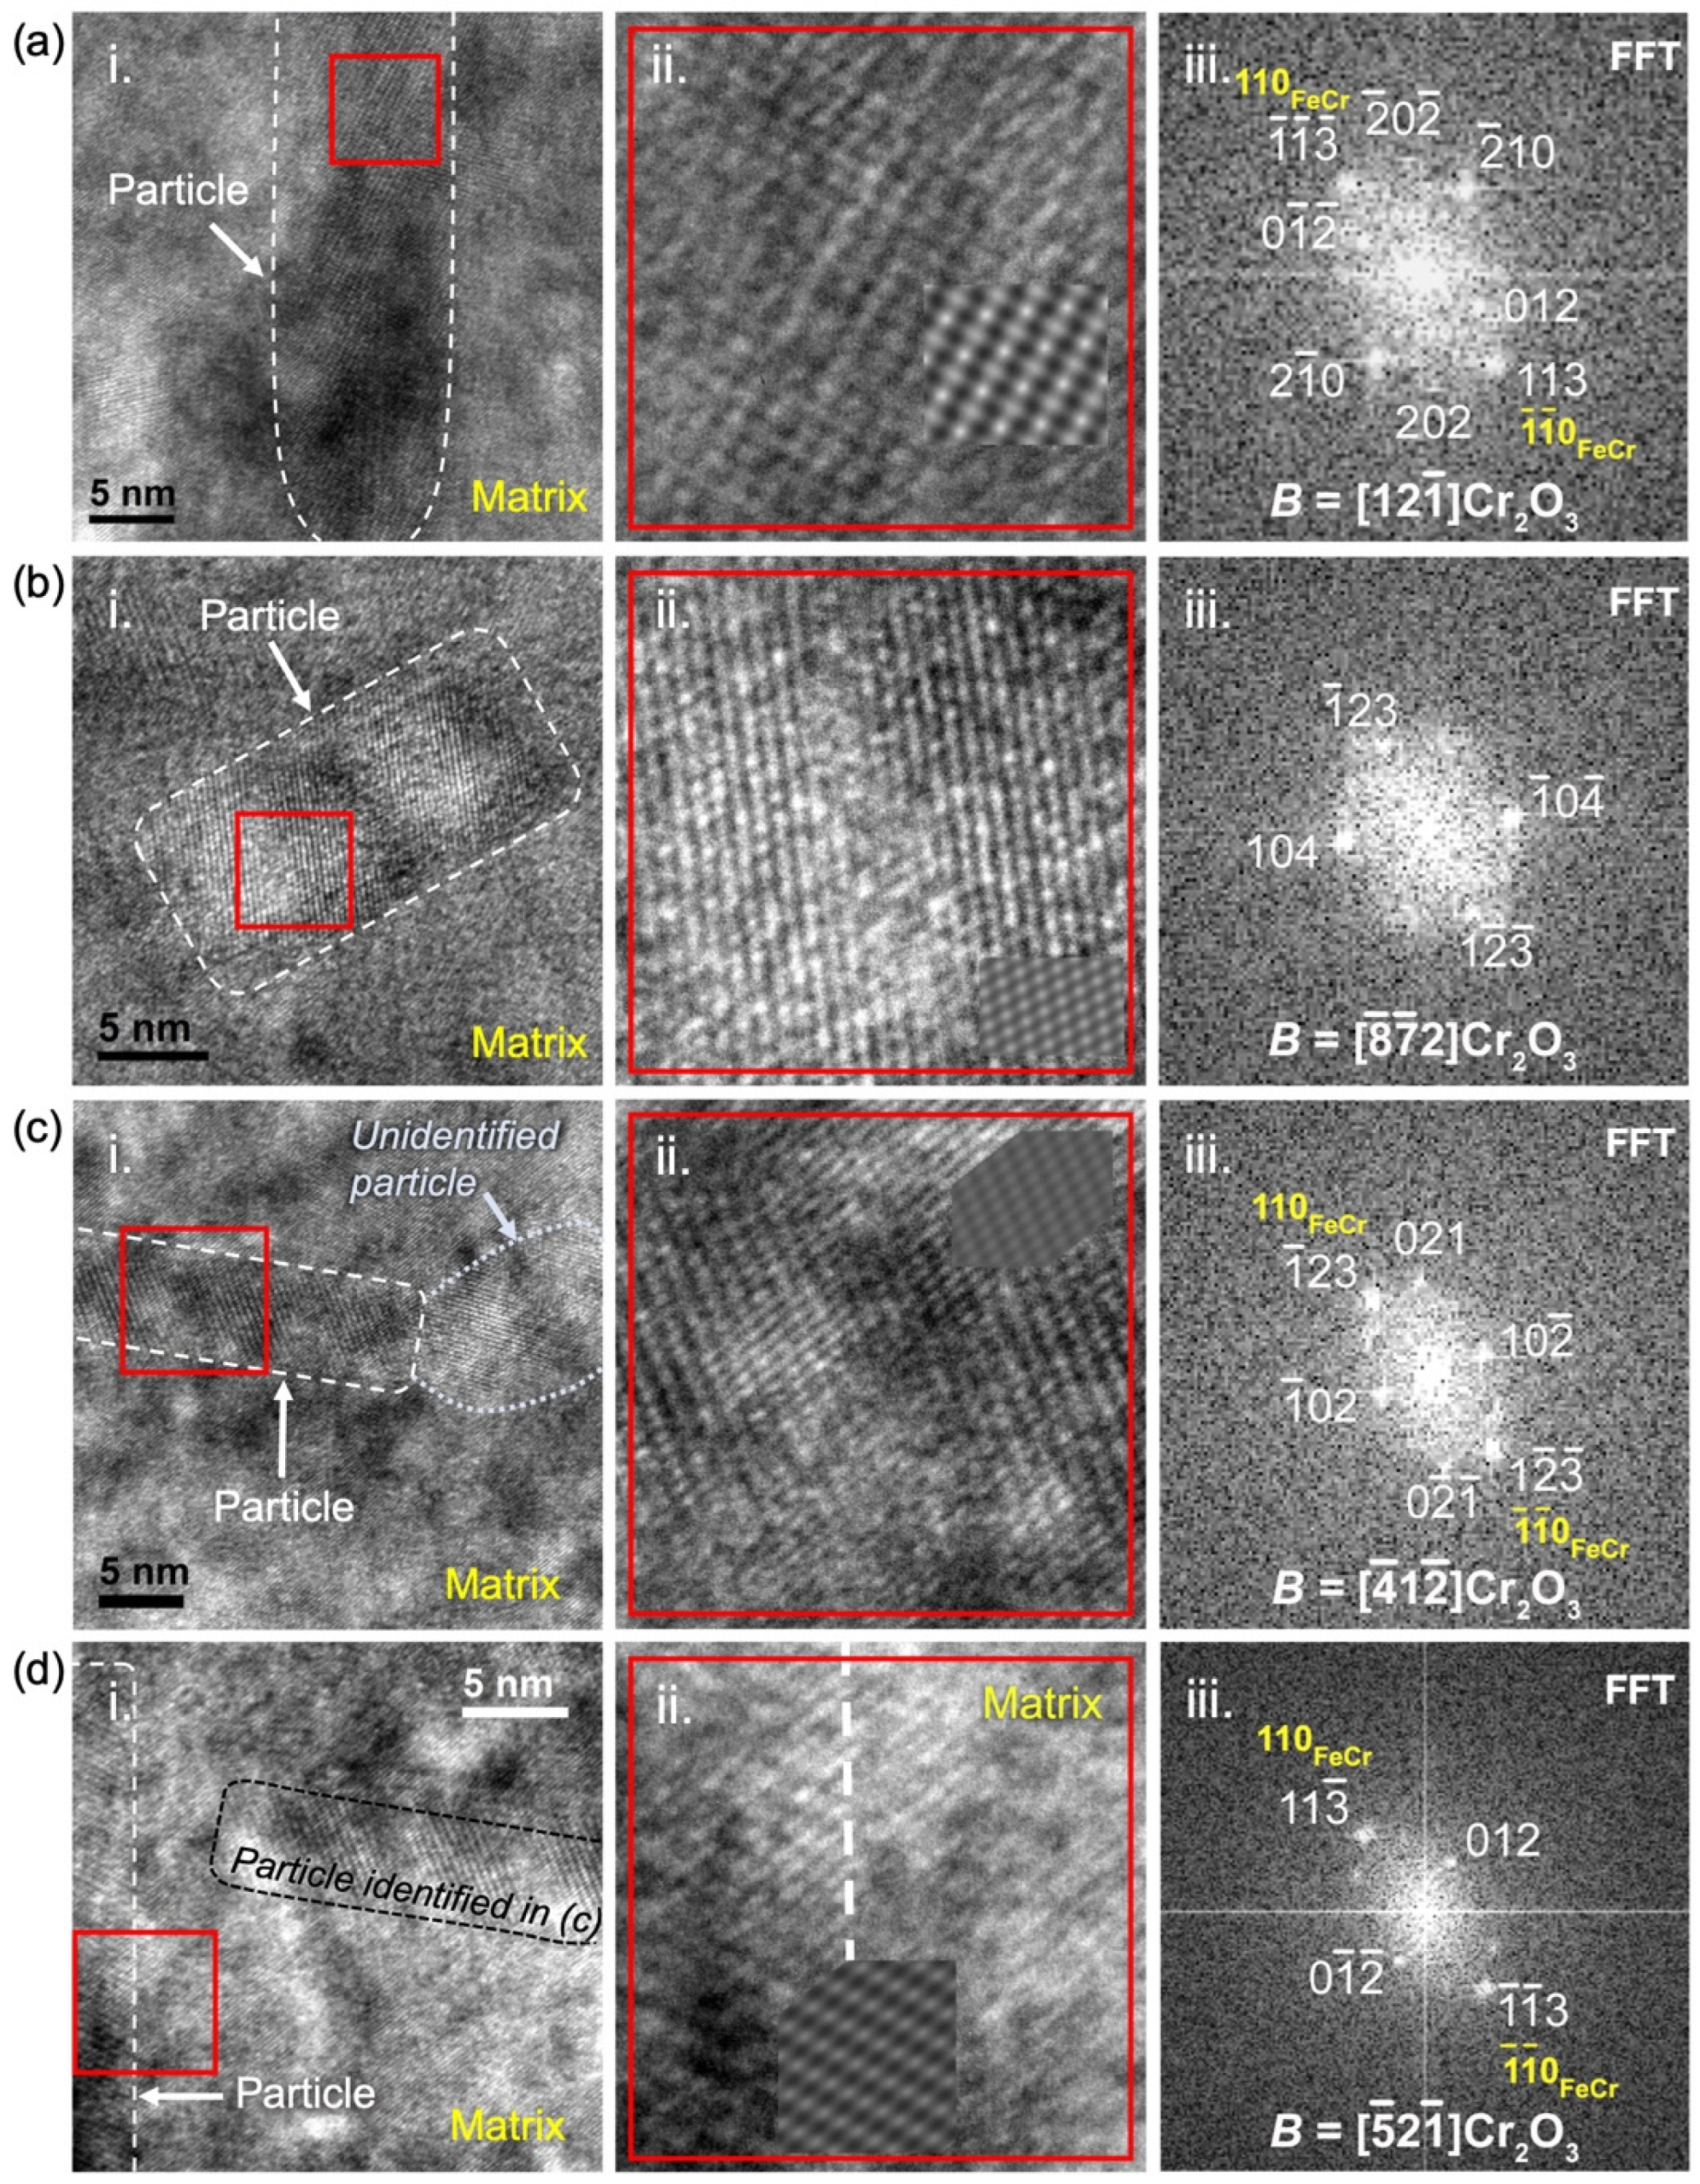
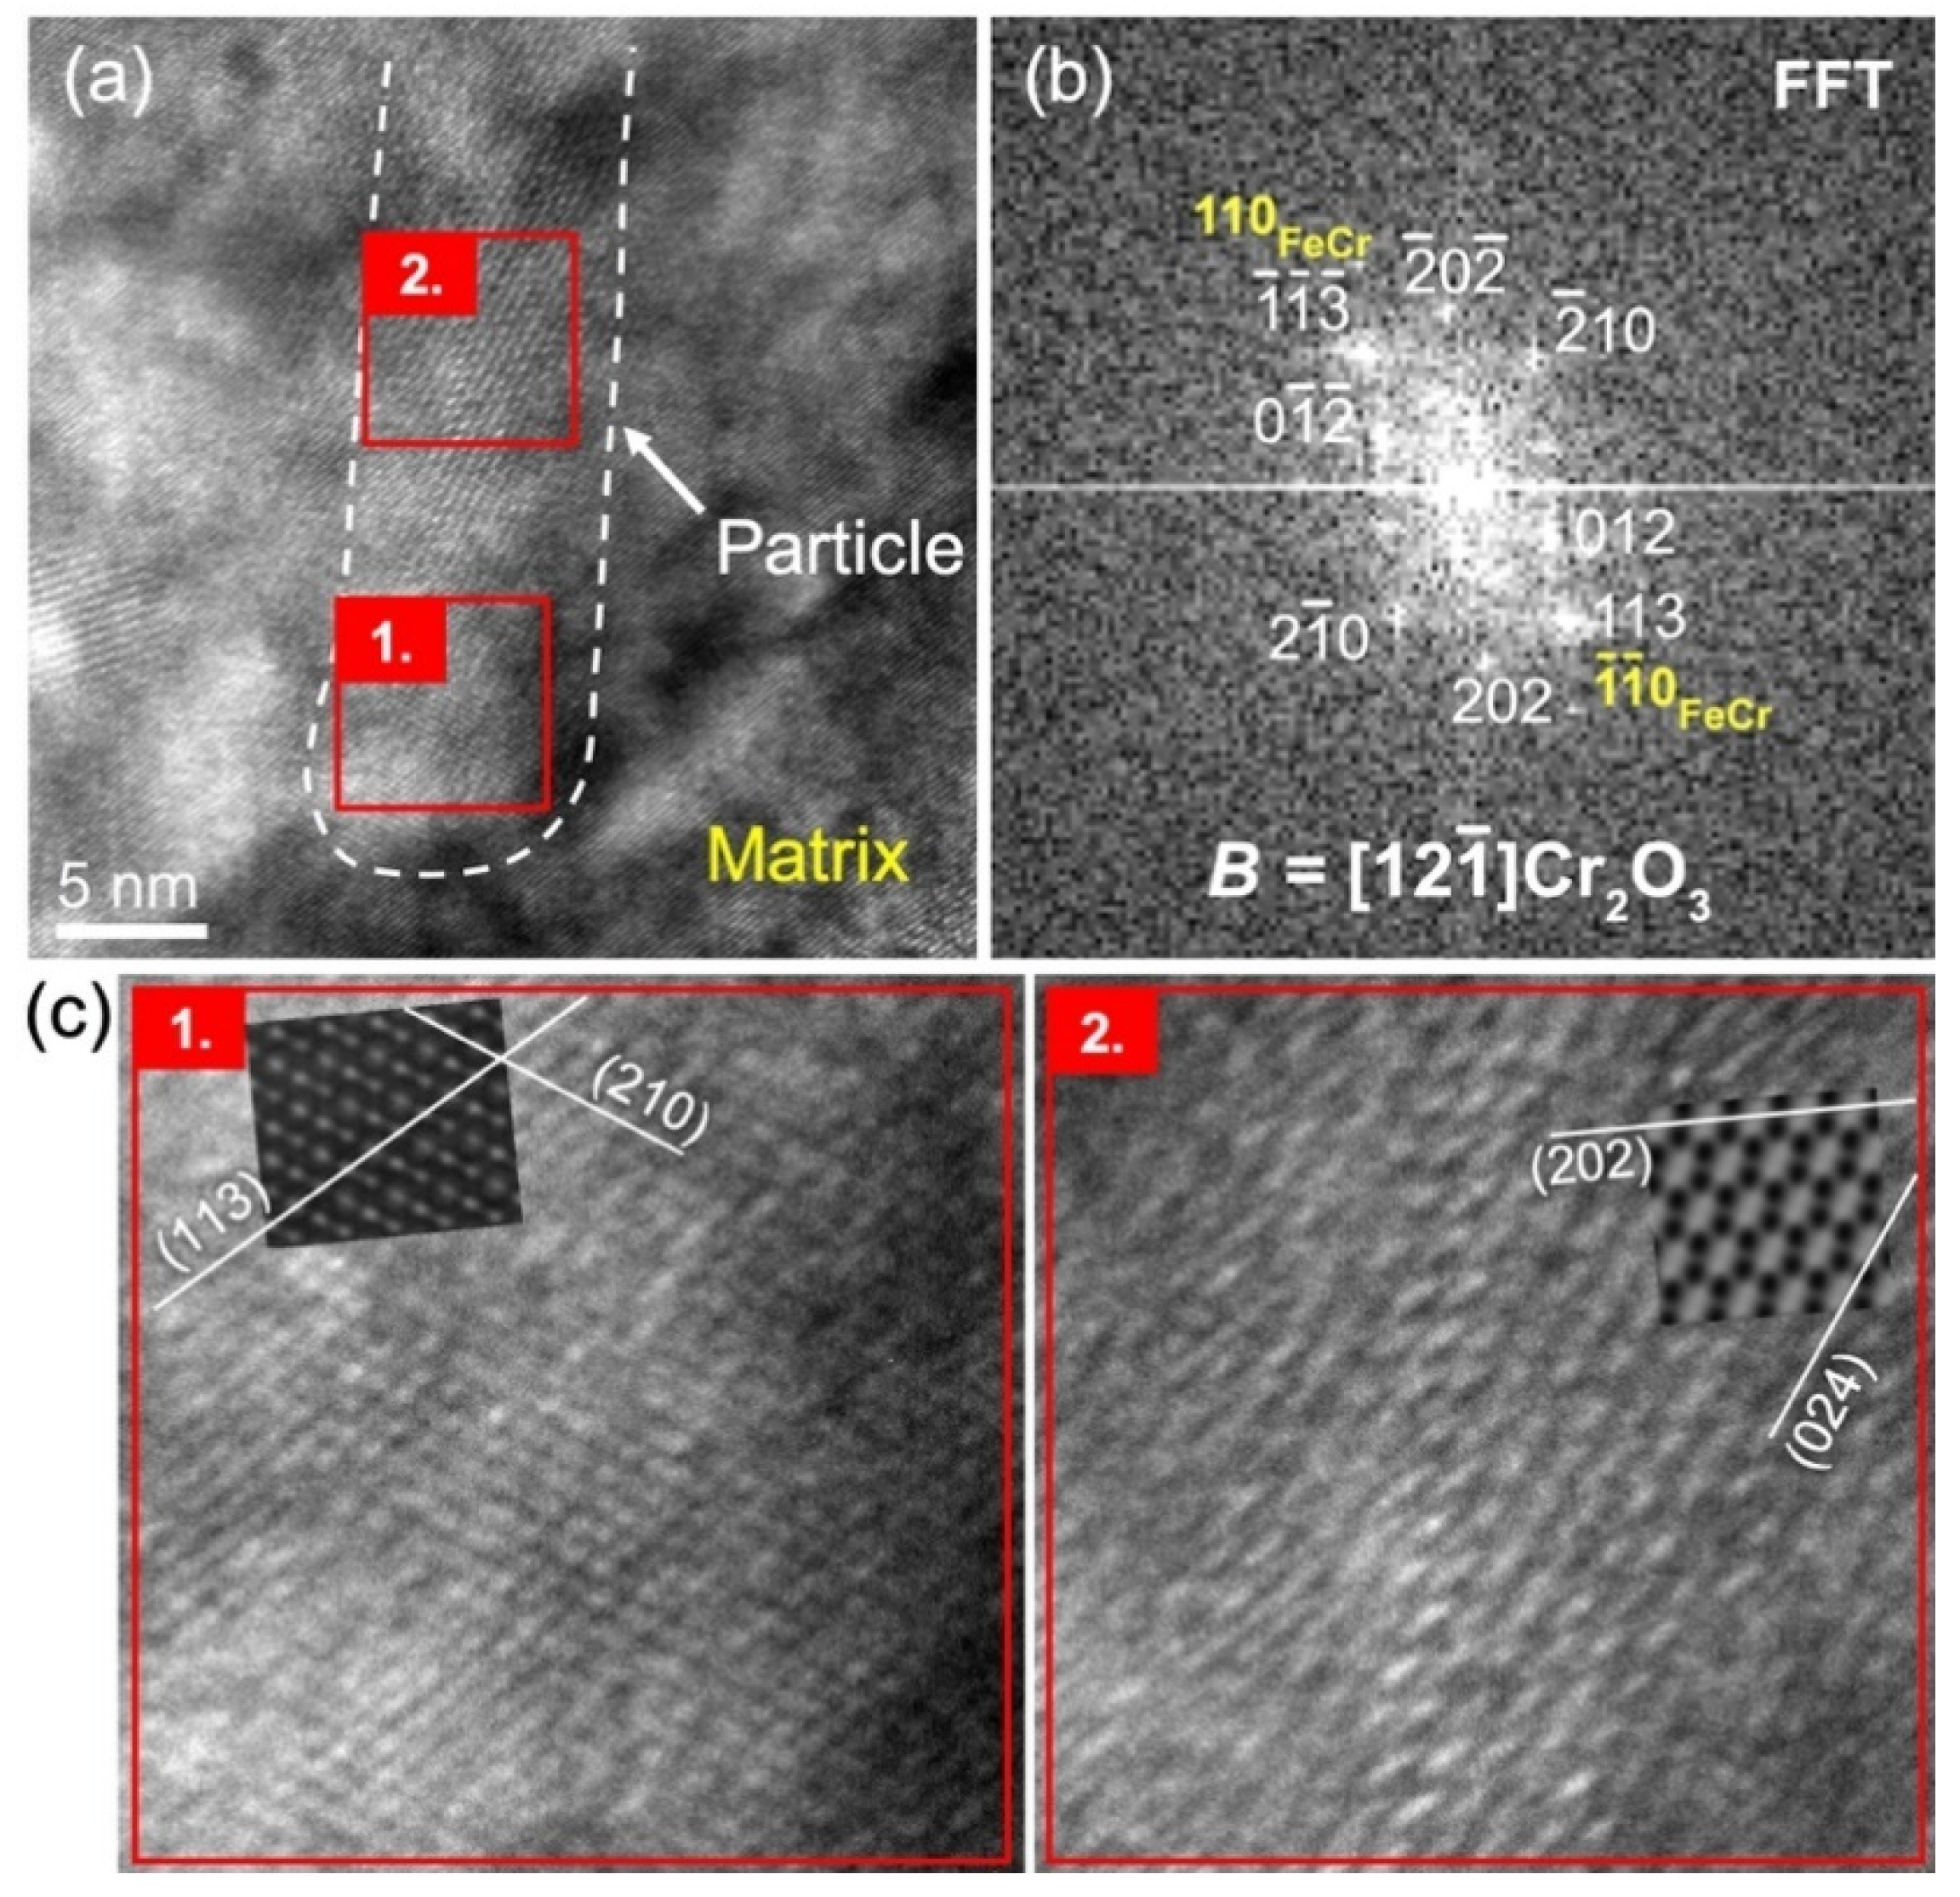
3.2.2. Crystallographic Structure of Ti ➔ Y ➔ O Nanoprecipitates after Annealing at 800 °C
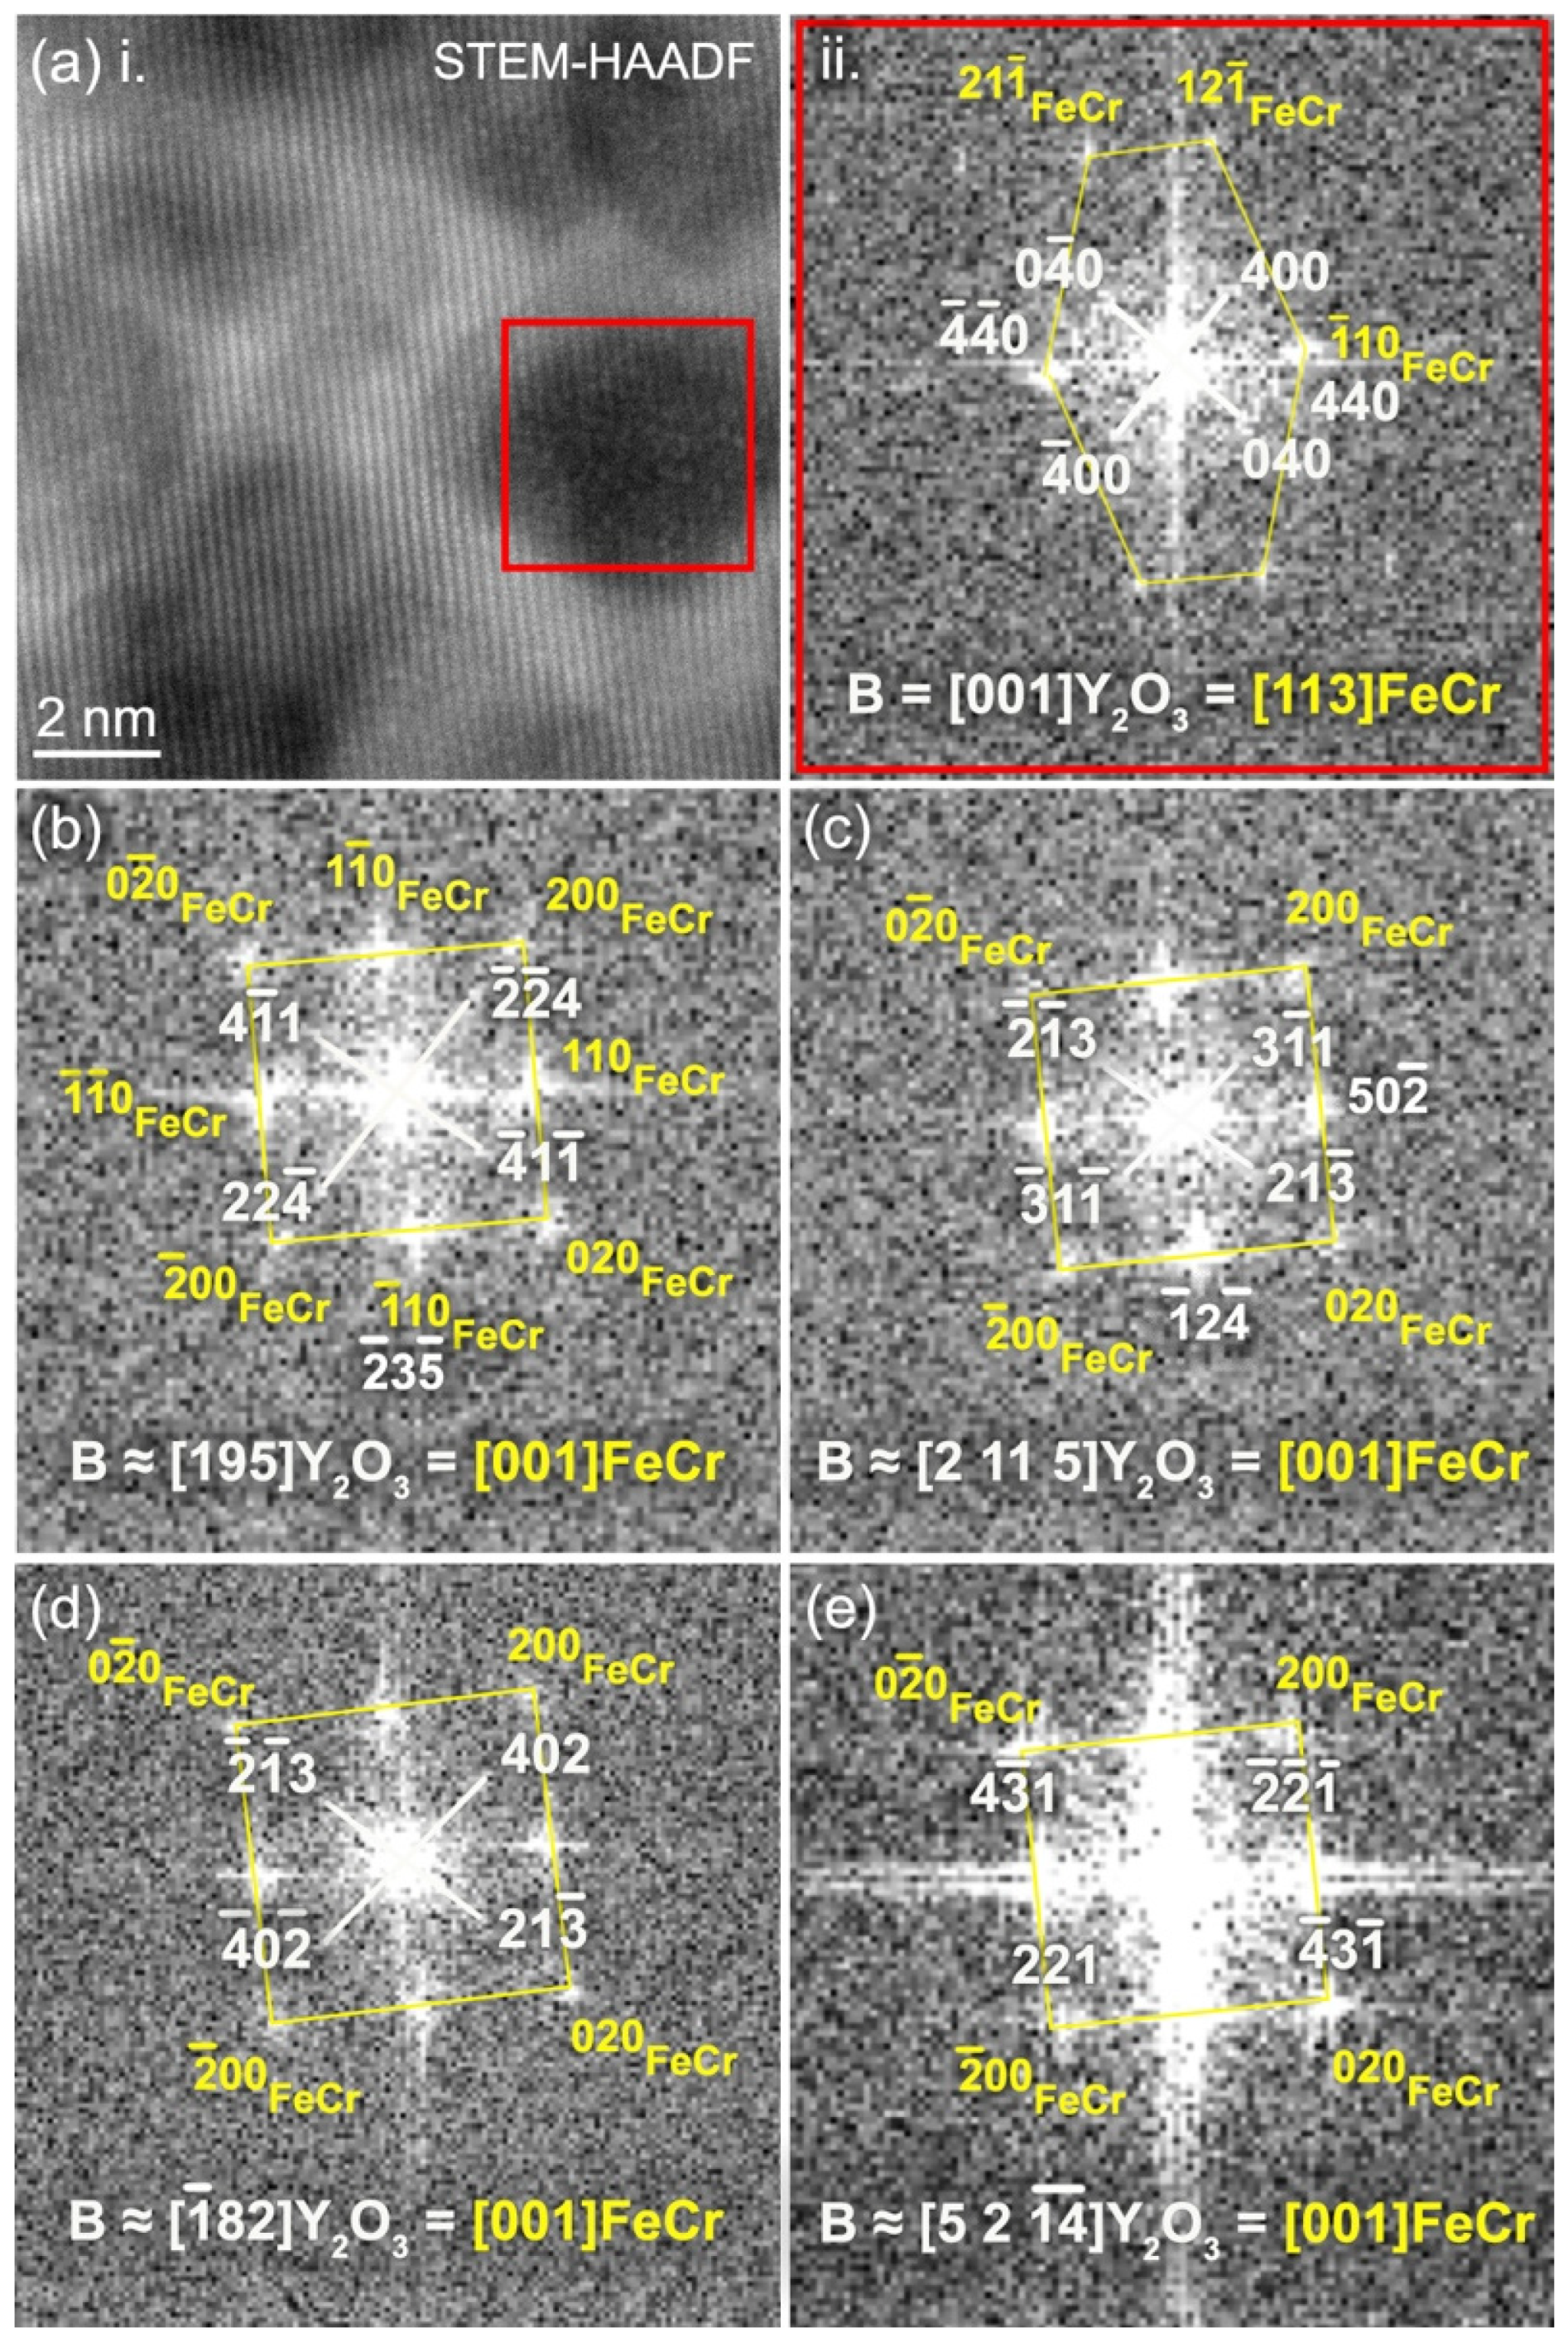
3.3. Case 2: Y ➔ Ti ➔ O Sequential Implantation
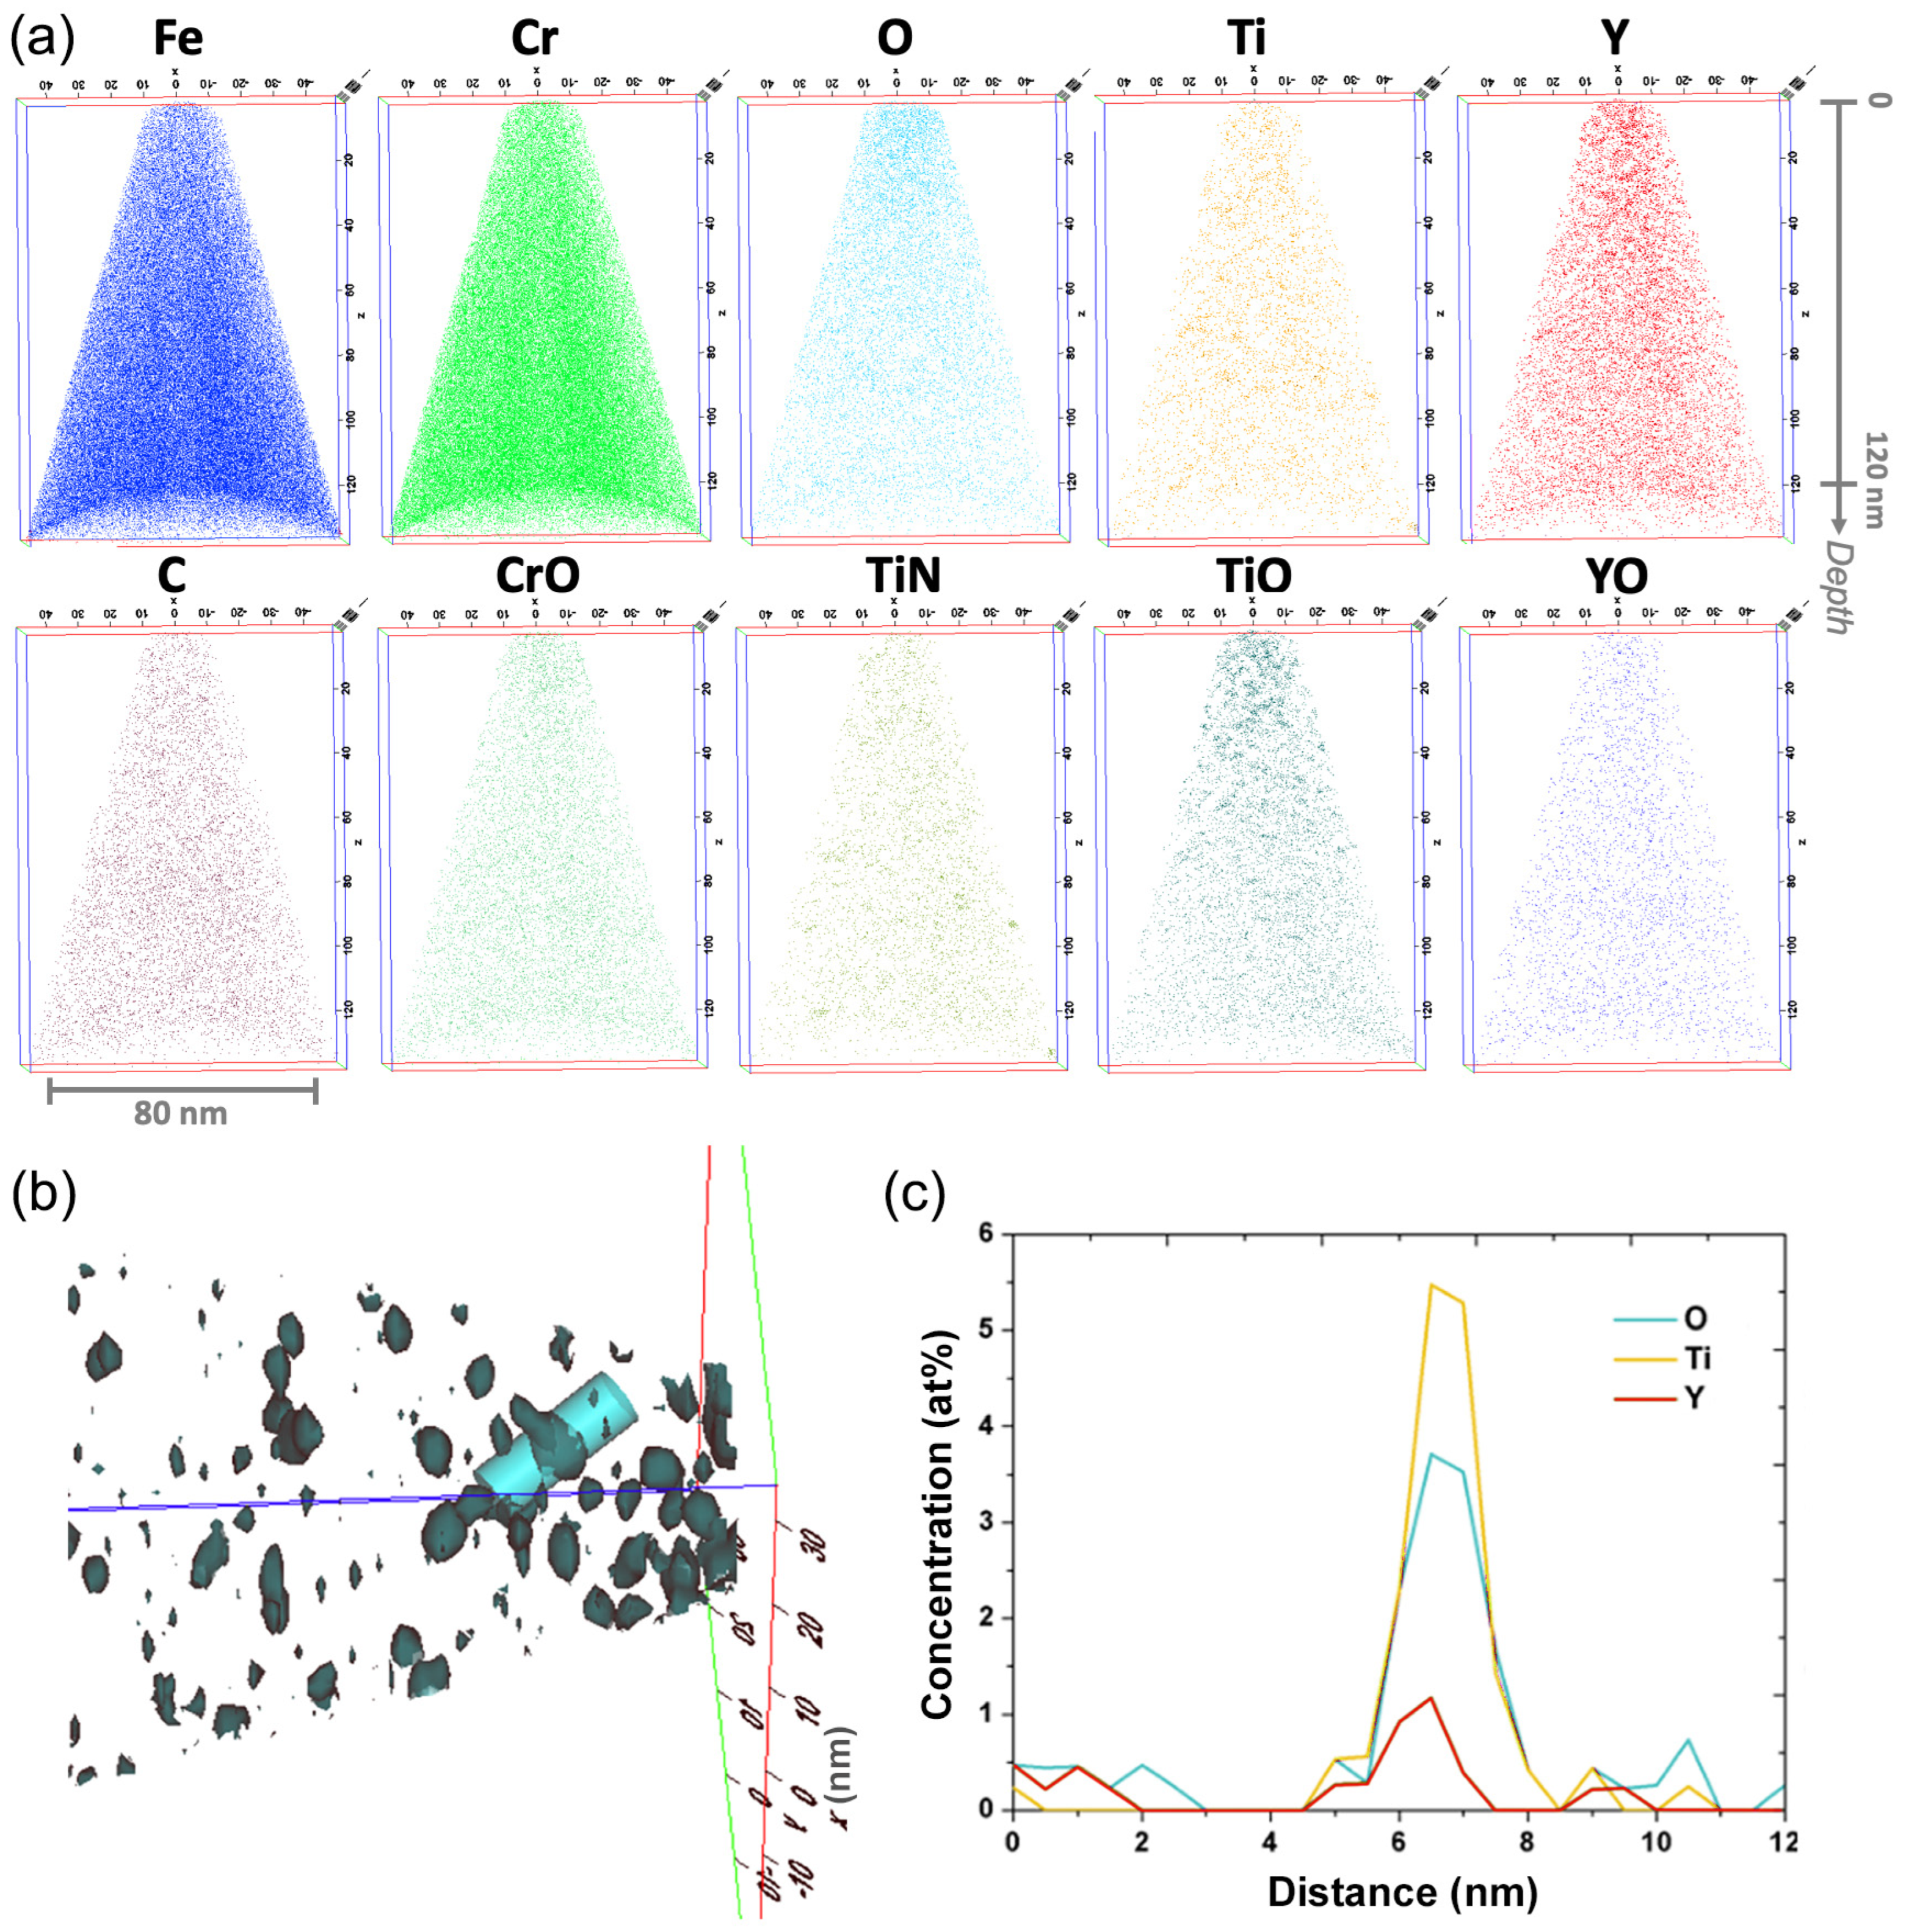
3.3.1. Compositional Analysis of Y ➔ Ti ➔ O Nanoprecipitates after Annealing at 800 °C
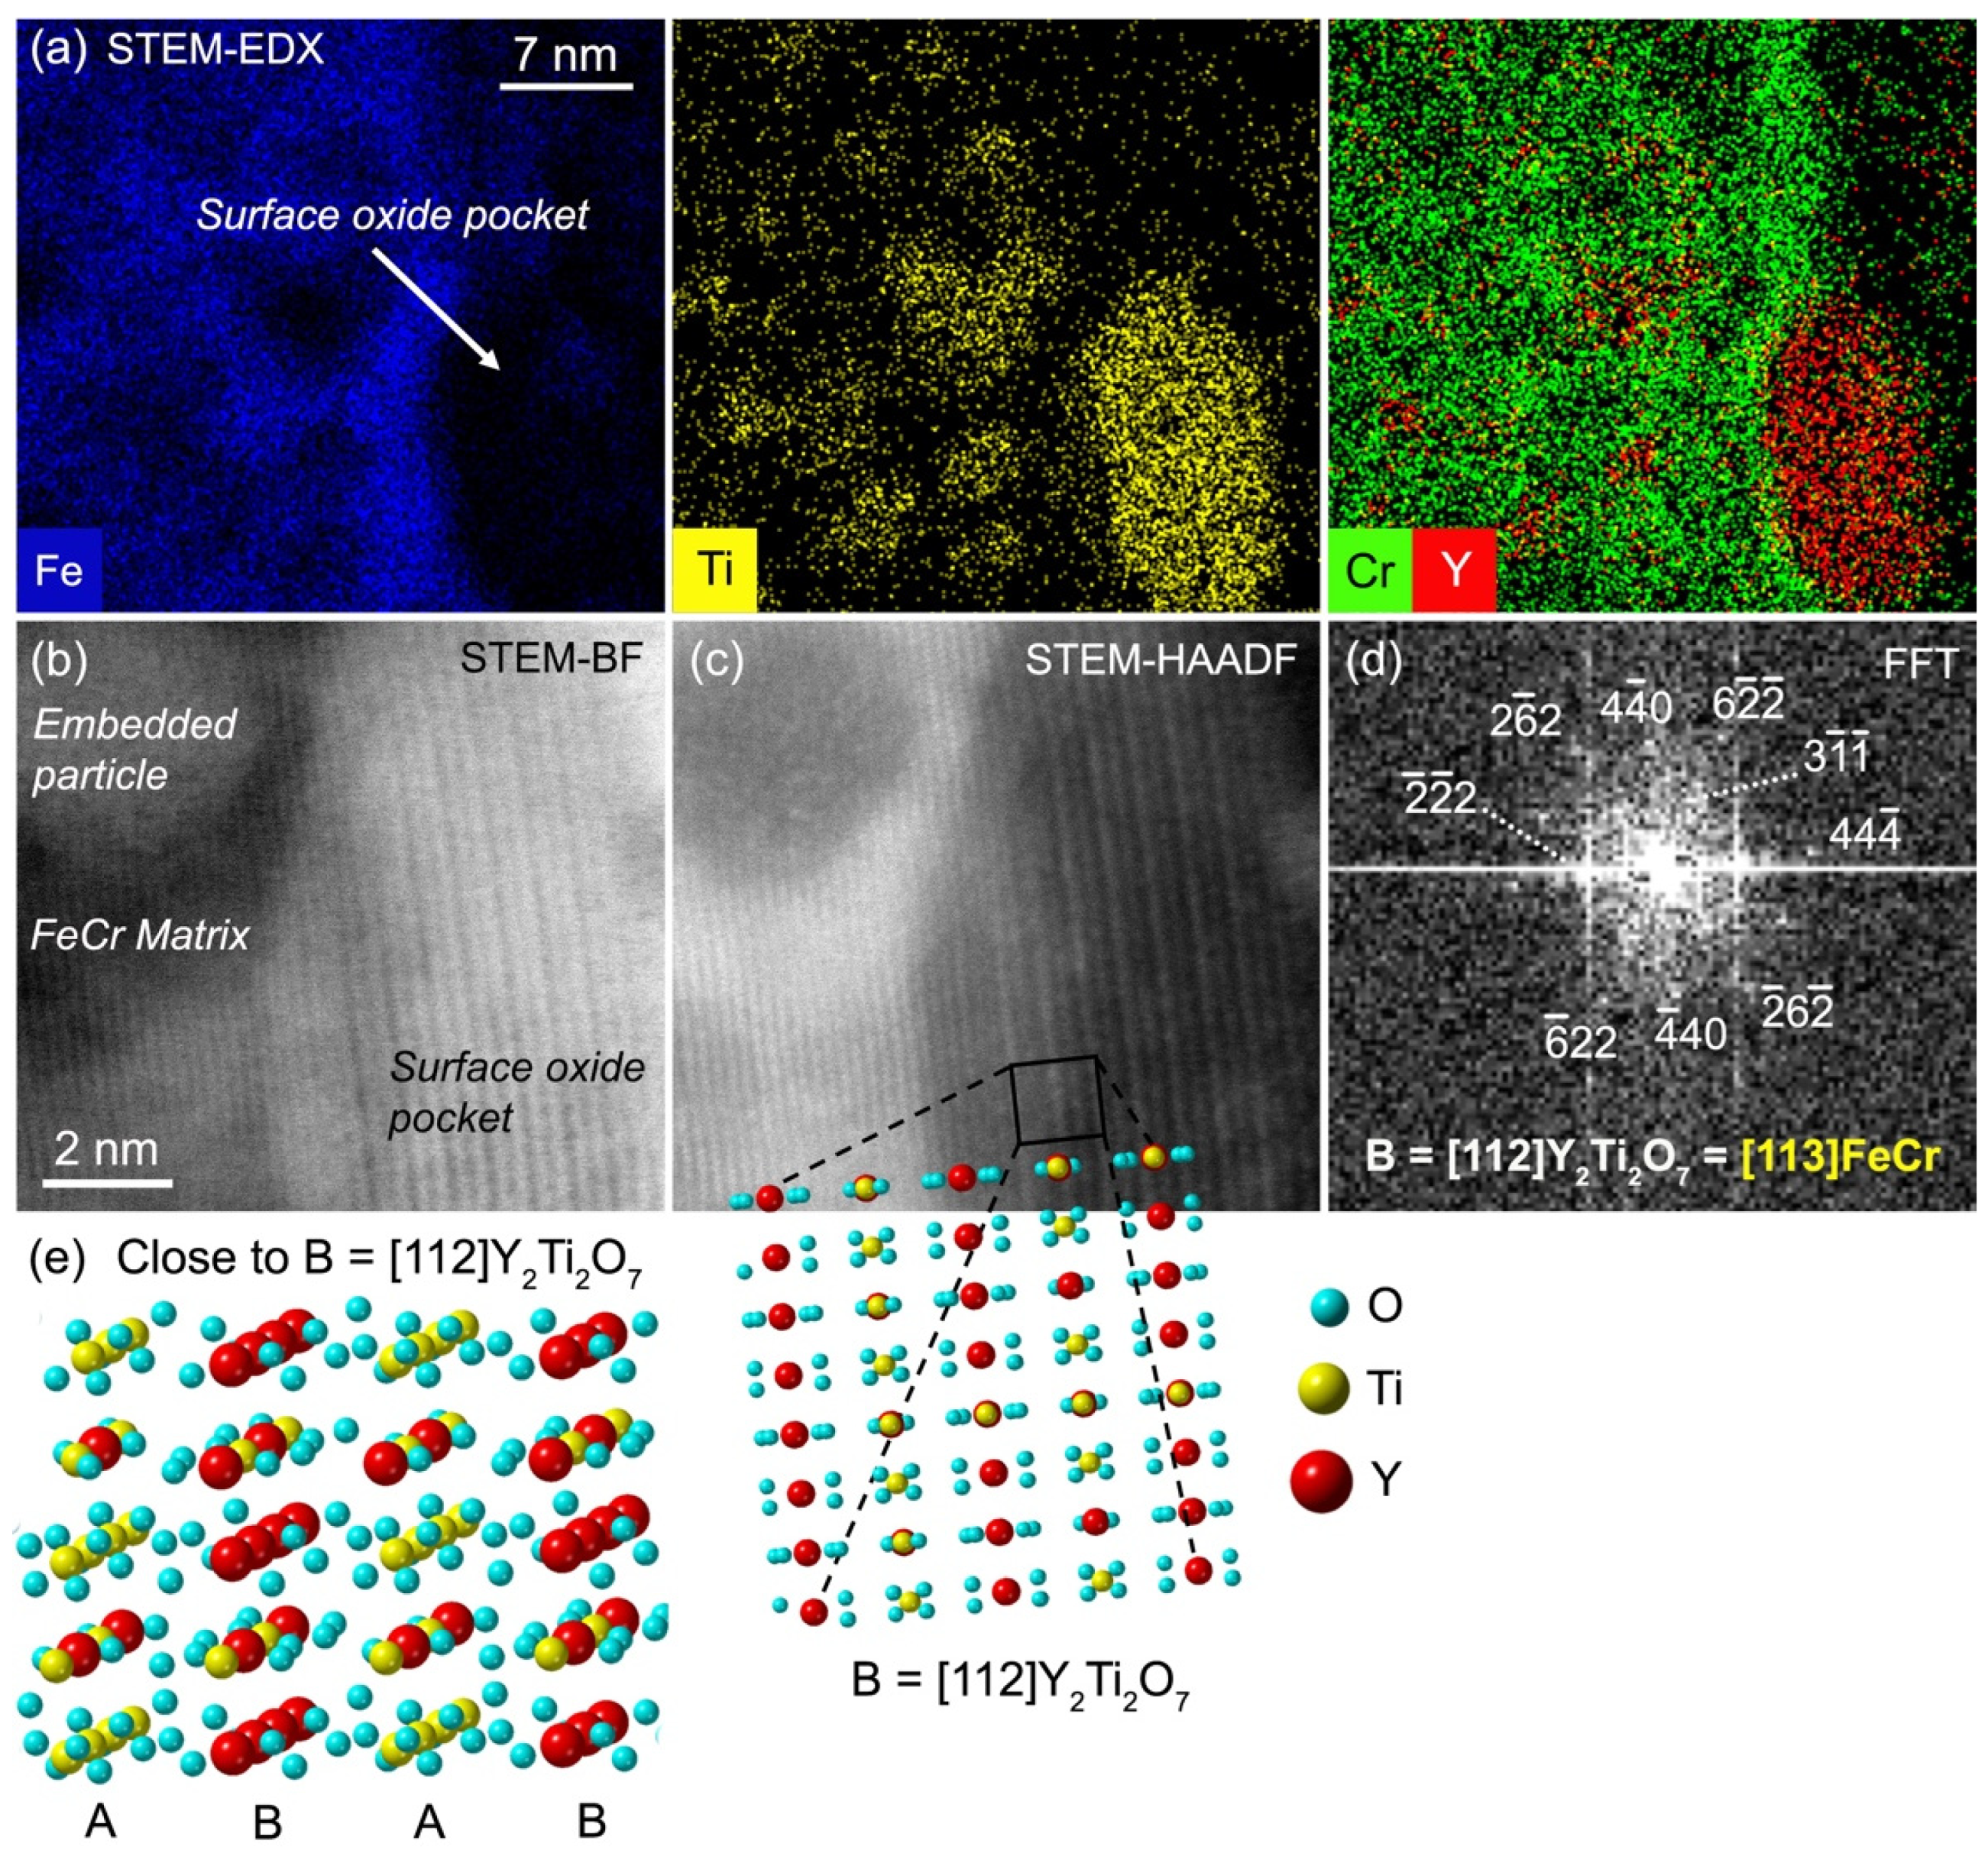
3.3.2. Y ➔ Ti ➔ O Nanoprecipitates Resulting from Annealing at 1100 °C
4. Discussion

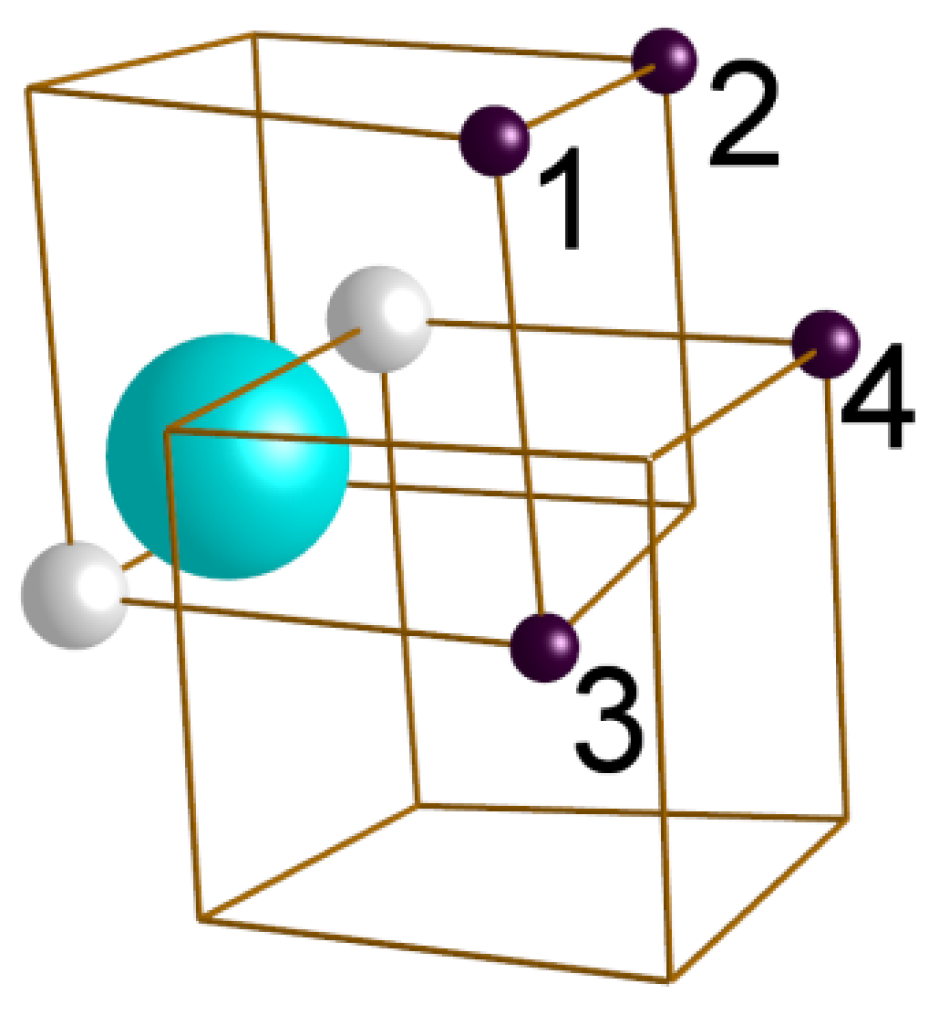
| Ti Atom Position in Figure 12 | Separation between Ti and the Nearest Site in Y-V Dumbbell | Binding Energy, Eb (eV) |
|---|---|---|
| 1 | 1 NN | 0.20 |
| 2 | 1 NN | 0.22 |
| 3 | 1 NN | −0.30 |
| 4 | 2 NN | −0.06 |

5. Conclusions
Author Contributions
Funding
Institutional Review Board Statement
Informed Consent Statement
Data Availability Statement
Acknowledgments
Conflicts of Interest
References
- Klueh, R.L.; Maziasz, P.J.; Kim, I.S.; Heatherly, L.; Hoelzer, D.T.; Hashimoto, N. Tensile and creep properties of an oxide dispersion-strengthened ferritic steel. J. Nucl. Mater. 2002, 307–311, 773–777. [Google Scholar] [CrossRef]
- Lindau, R.; Möslang, A.; Schirra, M.; Schlossmacher, P.; Klimenkov, M. Mechanical and microstructural properties of a hipped RAFM ODS-steel. J. Nucl. Mater. 2002, 307–311, 769–772. [Google Scholar] [CrossRef]
- McClintock, D.A.; Sokolov, M.A.; Hoelzer, D.T.; Nanstad, R.K. Mechanical properties of irradiated ODS-EUROFER and nanocluster strengthened 14YWT. J. Nucl. Mater. 2009, 392, 353–359. [Google Scholar] [CrossRef]
- Schaeublin, R.; Leguey, T.; Spätig, P.; Baluc, N.; Victoria, M. Microstructure and mechanical properties of two ODS ferritic/martensitic steels. J. Nucl. Mater. 2002, 307–311, 778–782. [Google Scholar] [CrossRef]
- Alamo, A.; Bertin, J.L.; Shamardin, V.K.; Wident, P. Mechanical properties of 9Cr martensitic steels and ODS-FeCr alloys after neutron irradiation at 325 °C up to 42 dpa. J. Nucl. Mater. 2007, 367–370, 54–59. [Google Scholar] [CrossRef]
- Lescoat, M.-L.; Ribis, J.; Gentils, A.; Kaïtasov, O.; de Carlan, Y.; Legris, A. In situ TEM study of the stability of nano-oxides in ODS steels under ion-irradiation. J. Nucl. Mater. 2012, 428, 176–182. [Google Scholar] [CrossRef]
- Ribis, J. Structural and chemical matrix evolution following neutron irradiation in a MA957 oxide dispersion strengthened material. J. Nucl. Mater. 2013, 434, 178–188. [Google Scholar] [CrossRef]
- Oka, H.; Watanabe, M.; Kinoshita, H.; Shibayama, T.; Hashimoto, N.; Ohnuki, S.; Yamashita, S.; Ohtsuka, S. In situ observation of damage structure in ODS austenitic steel during electron irradiation. J. Nucl. Mater. 2011, 417, 279–282. [Google Scholar] [CrossRef] [Green Version]
- London, A.J.; Santra, S.; Amirthapandian, S.; Panigrahi, B.K.; Sarguna, R.M.; Balaji, S.; Vijay, R.; Sundar, C.S.; Lozano-Perez, S.; Grovenor, C.R.M. Effect of Ti and Cr on dispersion, structure and composition of oxide nano-particles in model ODS alloys. Acta Mater. 2015, 97, 223–233. [Google Scholar] [CrossRef]
- Klimenkov, M.; Lindau, R.; Möslang, A. New insights into the structure of ODS particles in the ODS-Eurofer alloy. J. Nucl. Mater. 2009, 386–388, 553–556. [Google Scholar] [CrossRef]
- Hsiung, L.L.; Fluss, M.J.; Kimura, A. Structure of oxide nanoparticles in Fe–16Cr MA/ODS ferritic steel. Mater. Lett. 2010, 64, 1782–1785. [Google Scholar] [CrossRef] [Green Version]
- Sakasegawa, H.; Chaffron, L.; Legendre, F.; Boulanger, L.; Cozzika, T.; Brocq, M.; de Carlan, Y. Correlation between chemical composition and size of very small oxide particles in the MA957 ODS ferritic alloy. J. Nucl. Mater. 2009, 384, 115–118. [Google Scholar] [CrossRef]
- Williams, C.A.; Smith, G.D.W.; Marquis, E.A. Quantifying the composition of yttrium and oxygen rich nanoparticles in oxide dispersion strengthened steels. Ultramicroscopy 2013, 125, 10–17. [Google Scholar] [CrossRef] [PubMed]
- Ukai, S.; Mizuta, S.; Fujiwara, M.; Okuda, T.; Kobayashi, T. Development of 9Cr-ODS Martensitic Steel Claddings for Fuel Pins by means of Ferrite to Austenite Phase Transformation. J. Nucl. Sci. Technol. 2002, 39, 778–788. [Google Scholar] [CrossRef]
- Ribis, J.; Thual, M.A.; Guilbert, T.; de Carlan, Y.; Legris, A. Relaxation path of metastable nanoclusters in oxide dispersion strengthened materials. J. Nucl. Mater. 2017, 484, 183–192. [Google Scholar] [CrossRef]
- Hsiung, L.L.; Fluss, M.J.; Tumey, S.J.; Choi, B.W.; Serruys, Y.; Willaime, F.; Kimura, A. Formation mechanism and the role of nanoparticles in Fe-Cr ODS steels developed for radiation tolerance. Phys. Rev. B 2010, 82, 184103. [Google Scholar] [CrossRef]
- Murali, D.; Panigrahi, B.K.; Valsakumar, M.C.; Chandra, S.; Sundar, C.S.; Raj, B. The role of minor alloying elements on the stability and dispersion of yttria nanoclusters in nanostructured ferritic alloys: An ab initio study. J. Nucl. Mater. 2010, 403, 113–116. [Google Scholar] [CrossRef]
- Jiang, Y.; Smith, J.R.; Odette, G.R. Formation of Y-Ti-O nanoclusters in nanostructured ferritic alloys: A first-principles study. Phys. Rev. B 2009, 79, 064103. [Google Scholar] [CrossRef]
- Gopejenko, A.; Zhukovskii, Y.F.; Vladimirov, P.V.; Kotomin, E.A.; Möslang, A. Ab initio simulation of yttrium oxide nanocluster formation on fcc Fe lattice. J. Nucl. Mater. 2010, 406, 345–350. [Google Scholar] [CrossRef]
- Fu, C.L.; Krčmar, M.; Painter, G.S.; Chen, X.-Q. Vacancy Mechanism of High Oxygen Solubility and Nucleation of Stable Oxygen-Enriched Clusters in Fe. Phys. Rev. Lett. 2007, 99, 225502. [Google Scholar] [CrossRef]
- White, C.W.; Budai, J.D.; Zhu, J.G.; Withrow, S.P.; Aziz, M.J. Ion beam synthesis and stability of GaAs nanocrystals in silicon. Appl. Phys. Lett. 1996, 68, 2389. [Google Scholar] [CrossRef] [Green Version]
- Ruault, M.-O.; Fortuna, F.; Borodin, V.A.; Ganchenkova, M.G.; Kirk, M.A. Nucleation and growth of cobalt disilicide precipitates during in situ transmission electron microscopy implantation. J. Appl. Phys. 2008, 104, 033527. [Google Scholar] [CrossRef]
- Strobel, M.; Heinig, K.-H.; Möller, W.; Meldrum, A.; Zhou, D.S.; White, C.W.; Zuhr, R.A. Ion beam synthesis of gold nanoclusters in SiO2: Computer simulations versus experiments. Nucl. Inst. Methods Phys. Res. B 1999, 147, 343–349. [Google Scholar] [CrossRef]
- Owusu-Mensah, M.; Jublot-Leclerc, S.; Gentils, A.; Baumier, C.; Ribis, J.; Borodin, V.A. In situ TEM thermal annealing of high purity Fe-10wt%Cr alloy thin foils implanted with Ti and O ions. Nucl. Inst. Methods Phys. Res. B 2019, 461, 219–225. [Google Scholar] [CrossRef]
- Owusu-Mensah, M.; Gentils, A.; Jublot-Leclerc, S.; Ribis, J.; Schoell, R.; Kaoumi, D.; Borodin, V.A. Precipitation of chromium oxide and (Ti,Cr) oxide nano-particles in Fe-10%Cr alloy by ion implantation with titanium and oxygen. 2022; Submitted to Acta Mater. [Google Scholar]
- JANNuS (Joint Accelerators for Nano-Science and Nuclear Simulation). Available online: http://jannus.in2p3.fr; https://jannus-scalp.ijclab.in2p3.fr/en/home/ (accessed on 27 April 2022).
- Gentils, A.; Cabet, C. Investigating radiation damage in nuclear energy materials using JANNuS multiple ion beams. Nucl. Inst. Methods Phys. Res. B 2019, 447, 107–112. [Google Scholar] [CrossRef] [Green Version]
- Ziegler, J.F.; Ziegler, M.D.; Biersack, J.P. SRIM—The stopping and range of ions in matter. Nucl. Inst. Methods Phys. Res. B 2010, 268, 1818–1823. [Google Scholar] [CrossRef] [Green Version]
- Juslin, N.; Nordlund, K.; Wallenius, J.; Malerba, L. Simulation of threshold displacement energies in FeCr. Nucl. Instrum. Methods Phys. Res. B 2007, 255, 75–77. [Google Scholar] [CrossRef]
- JEMS. Available online: https://www.jems-swiss.ch/Home/jemsWebSite/jems.html (accessed on 27 April 2022).
- Jain, A.; Ong, S.P.; Hautier, G.; Chen, W.; Richards, W.D.; Dacek, S.; Cholia, S.; Gunter, D.; Skinner, D.; Ceder, G.; et al. The Materials Project: A materials genome approach to accelerating materials innovation. APL Mater. 2013, 1, 011002. [Google Scholar] [CrossRef] [Green Version]
- Owusu-Mensah, M. Understanding the First Formation Stages of (Y,Ti) Nano-Oxides in Oxide Dispersion Strengthened (ODS) Steels. Ph.D. Thesis, Université Paris Saclay, Paris, France, 2019. [Google Scholar]
- Jiang, Y.; Smith, J.R.; Odette, G.R. Prediction of structural, electronic and elastic properties of Y2Ti2O7 and Y2TiO5. Acta Mater. 2010, 58, 1536–1543. [Google Scholar] [CrossRef]
- Ribis, J.; de Carlan, Y. Interfacial strained structure and orientation relationships of the nanosized oxide particles deduced from elasticity-driven morphology in oxide dispersion strengthened materials. Acta Mater. 2012, 60, 238–252. [Google Scholar] [CrossRef]
- Inkson, B.J.; Threadgill, P.L. Y2O3 Morphology in an Oxide Dispersion Strengthened FeAl Alloy Prepared by Mechanical Alloying. Mater. Res. Soc. Symp. Proc. 1996, 460, 767–772. [Google Scholar] [CrossRef]
- Yu, Z.; Muller, D.A.; Silcox, J. Study of strain fields at a-Si/c-Si interface. J. Appl. Phys. 2004, 95, 3362–3371. [Google Scholar] [CrossRef]
- Villars, P.; Calvert, L.D. Pearson’s Handbook of Crystallographic Data for Intermetallic Phases, 2nd ed.; American Society for Metals: Materials Park, OH, USA, 1986. [Google Scholar]
- Bischoff, J.; Motta, A.T. Oxidation behavior of ferritic–martensitic and ODS steels in supercritical water. J. Nucl. Mater. 2012, 424, 261–276. [Google Scholar] [CrossRef]
- Da Cunha Belo, M.; Walls, M.; Hakiki, N.E.; Corset, J.; Picquenard, E.; Sagon, G.; Noël, D. Composition, structure and properties of the oxide films formed on the stainless steel 316L in a primary type PWR environment. Corros. Sci. 1998, 40, 447–463. [Google Scholar] [CrossRef]
- McIntyre, N.S.; Zetaruk, D.G.; Owen, D. X-Ray photoelectron Studies of the aqueous oxidation of Inconel-600 Alloy. J. Electrochem. Soc. 1979, 126, 750. [Google Scholar] [CrossRef]
- Stringer, J. The reactive element effect in high-temperature corrosion. Mater. Sci. Eng. A 1989, 120–121, 129–137. [Google Scholar] [CrossRef]
- Claisse, A.; Olsson, P. First-principles calculations of (Y, Ti, O) cluster formation in body centred cubic iron-chromium. Nucl. Instr. Methods Phys. Res. B 2013, 303, 18–22. [Google Scholar] [CrossRef]
- Dean, J.A.; Lange, N.A. Lange’s Handbook of Chemistry, 15th ed.; McGraw-Hill, Inc.: New York, NY, USA, 1999. [Google Scholar]
- Williams, C.A.; Marquis, E.A.; Cerezo, A.; Smith, G.D.W. Nanoscale characterisation of ODS–Eurofer 97 steel: An atom-probe tomography study. J. Nucl. Mater. 2010, 400, 37–45. [Google Scholar] [CrossRef]
- Marquis, E.A. Core/shell structures of oxygen-rich nanofeatures in oxide-dispersion strengthened Fe–Cr alloys. Appl. Phys. Lett. 2008, 93, 181904. [Google Scholar] [CrossRef]
- Yamashita, S.; Ohtsuka, S.; Akasaka, N.; Ukai, S.; Ohnuki, S. Formation of nanoscale complex oxide particles in mechanically alloyed ferritic steel. Phil. Mag. 2004, 84, 525–529. [Google Scholar] [CrossRef]
- Ohnuma, M.; Suzuki, J.; Ohtsuka, S.; Kim, S.W.; Kaito, T.; Inoue, M.; Kitazawa, H. A new method for the quantitative analysis of the scale and composition of nanosized oxide in 9Cr-ODS steel. Acta Mater. 2009, 57, 5571–5581. [Google Scholar] [CrossRef]
- Klimiankou, M.; Lindau, R.; Möslang, A. TEM characterization of structure and composition of nanosized ODS particles in reduced activation ferritic-martenstic steels. J. Nucl. Mater. 2004, 329–333, 347–351. [Google Scholar] [CrossRef]
- Yamashita, S.; Akasaka, N.; Ohnuki, S. Nano-oxide particle stability of 9–12 Cr grain morphology modified ODS steels under neutron irradiation. J. Nucl. Mater. 2004, 329–333, 377–381. [Google Scholar] [CrossRef]
- Cayron, C.; Montani, A.; Venet, D.; de Carlan, Y. Identification of new phases in annealed Fe–18CrWTi ODS powders. J. Nucl. Mater. 2010, 399, 219–224. [Google Scholar] [CrossRef]
- London, A.J.; Lozano-Perez, S.; Santra, S.; Amirthapandian, S.; Panigrahi, B.K.; Sundar, C.S.; Grovenor, C.R.M. Comparison of atom probe tomography and transmission electron microscopy analysis of oxide dispersion strengthened steels. J. Phys. Conf. Ser. 2014, 522, 012028. [Google Scholar] [CrossRef] [Green Version]
- Dou, P.; Jiang, S.; Qiu, L.; Kimura, A. Effects of contents of Al, Zr and Ti on oxide particles in Fe–15Cr–2W–0.35Y2O3 ODS steels. J. Nucl. Mater. 2020, 531, 152025. [Google Scholar] [CrossRef]
- Shen, J.; Li, Y.; Li, F.; Yang, H.; Zhao, Z.; Kano, S.; Matsukawa, Y.; Satoh, Y.; Abe, H. Microstructural characterization and strengthening mechanisms of a 12Cr-ODS steel. Mater. Sci. Eng. A 2016, 673, 624–632. [Google Scholar] [CrossRef]
- Zhao, Q.; Yu, L.; Liu, Y.; Huang, Y.; Ma, Z.; Li, H. Effects of aluminum and titanium on the microstructure of ODS steels fabricated by hot pressing. Int. J. Miner. Metall. 2018, 25, 1156–1165. [Google Scholar] [CrossRef]
- Ukai, S.; Harada, M.; Okada, H.; Inoue, M.; Nomura, S.; Shikakura, S.; Asabe, K.; Nishida, T.; Fujiwara, M. Alloying design of oxide dispersion strengthened ferritic steel for long life FBRs core materials. J. Nucl. Mater. 1993, 204, 65–73. [Google Scholar] [CrossRef]
- Alinger, M.J.; Odette, G.R.; Hoelzer, D.T. On the role of alloy composition and processing parameters in nanocluster formation and dispersion strengthening in nanostuctured ferritic alloys. Acta Mater. 2009, 57, 392–406. [Google Scholar] [CrossRef]
- Rogozhkin, S.; Bogachev, A.; Korchuganova, O.; Nikitin, A.; Orlov, N.; Aleev, A.; Zaluzhnyi, A.; Kozodaev, M.; Kulevoy, T.; Chalykh, T.; et al. Nanostructure evolution in ODS steels under ion irradiation. Nucl. Mater. Energy 2016, 9, 66–74. [Google Scholar] [CrossRef] [Green Version]
- London, A.J.; Lozano-Perez, S.; Moody, M.P.; Amirthapandian, S.; Panigrahi, B.K.; Sundar, C.S.; Grovenor, C.R.M. Quantification of oxide particle composition in model oxide dispersion strengthened steel alloys. Ultramicroscopy 2015, 159, 360–367. [Google Scholar] [CrossRef] [PubMed]
- Kresse, G.; Furthmuller, J. Efficiency of ab-initio total energy calculations for metals and semiconductors using a plane-wave basis set. Comput. Mater. Sci. 1996, 6, 15–50. [Google Scholar] [CrossRef]
- Kresse, G.; Joubert, D. From ultrasoft pseudopotentials to the projector augmented-wave method. Phys. Rev. B 1999, 59, 1758–1775. [Google Scholar] [CrossRef]
- Monkhorst, H.J.; Pack, J.D. Special points for Brillouin-zone integrations. Phys. Rev. B 1976, 13, 5188–5192. [Google Scholar] [CrossRef]
- Bhattacharyya, D.; Dickerson, P.; Odette, G.R.; Maloy, S.A.; Misra, A.; Nastasi, M.A. On the structure and chemistry of complex oxide nanofeatures in nanostructured ferritic alloy U14YWT. Philos. Mag. 2012, 92, 2089–2107. [Google Scholar] [CrossRef]
- Brandes, M.C.; Kovarik, L.; Miller, M.K.; Mills, M.J. Morphology, structure, and chemistry of nanoclusters in a mechanically alloyed nanostructured ferritic steel. J. Mater. Sci. 2012, 47, 3913–3923. [Google Scholar] [CrossRef]
- Gale, W.F.; Totemeir, T.C. Smithells Metals Reference Book, 8th ed.; Butterworth-Heinemann: Waltham, MA, USA, 2004. [Google Scholar]
- Chinnappan, R. Thermodynamic Stability of Oxide Phases of Fe-Cr based ODS Steels via Quantum Mechanical Calculations. Procedia Eng. 2014, 86, 788–798. [Google Scholar] [CrossRef] [Green Version]


| Ion Implantation Sequence | Annealing Temperature | Observations |
|---|---|---|
| Ti ➔ Y ➔ O | 800 °C | Cr2O3 rod-shaped precipitates |
| Y ➔ Ti ➔ O | 800 °C | Y, Ti, O-rich precipitates |
| 1100 °C | Ti-enriched Y2O3 cuboidal precipitates with a Cr-enriched shell + Y2Ti2O7 surface pockets |
Publisher’s Note: MDPI stays neutral with regard to jurisdictional claims in published maps and institutional affiliations. |
© 2022 by the authors. Licensee MDPI, Basel, Switzerland. This article is an open access article distributed under the terms and conditions of the Creative Commons Attribution (CC BY) license (https://creativecommons.org/licenses/by/4.0/).
Share and Cite
Jublot-Leclerc, S.; Owusu-Mensah, M.; Borodin, V.A.; Ribis, J.; Largeau, L.; Schoell, R.; Kaoumi, D.; Descoins, M.; Mangelinck, D.; Gentils, A. Synthesis of Nano-Oxide Precipitates by Implantation of Ti, Y and O Ions in Fe-10%Cr: Towards an Understanding of Precipitation in Oxide Dispersion-Strengthened (ODS) Steels. Materials 2022, 15, 4857. https://doi.org/10.3390/ma15144857
Jublot-Leclerc S, Owusu-Mensah M, Borodin VA, Ribis J, Largeau L, Schoell R, Kaoumi D, Descoins M, Mangelinck D, Gentils A. Synthesis of Nano-Oxide Precipitates by Implantation of Ti, Y and O Ions in Fe-10%Cr: Towards an Understanding of Precipitation in Oxide Dispersion-Strengthened (ODS) Steels. Materials. 2022; 15(14):4857. https://doi.org/10.3390/ma15144857
Chicago/Turabian StyleJublot-Leclerc, Stéphanie, Martin Owusu-Mensah, Vladimir A. Borodin, Joël Ribis, Ludovic Largeau, Ryan Schoell, Djamel Kaoumi, Marion Descoins, Dominique Mangelinck, and Aurélie Gentils. 2022. "Synthesis of Nano-Oxide Precipitates by Implantation of Ti, Y and O Ions in Fe-10%Cr: Towards an Understanding of Precipitation in Oxide Dispersion-Strengthened (ODS) Steels" Materials 15, no. 14: 4857. https://doi.org/10.3390/ma15144857