
Aqueous Corrosion of Aluminum-Transition Metal Alloys Composed of Structurally Complex Phases: A Review


Abstract
:1. Introduction
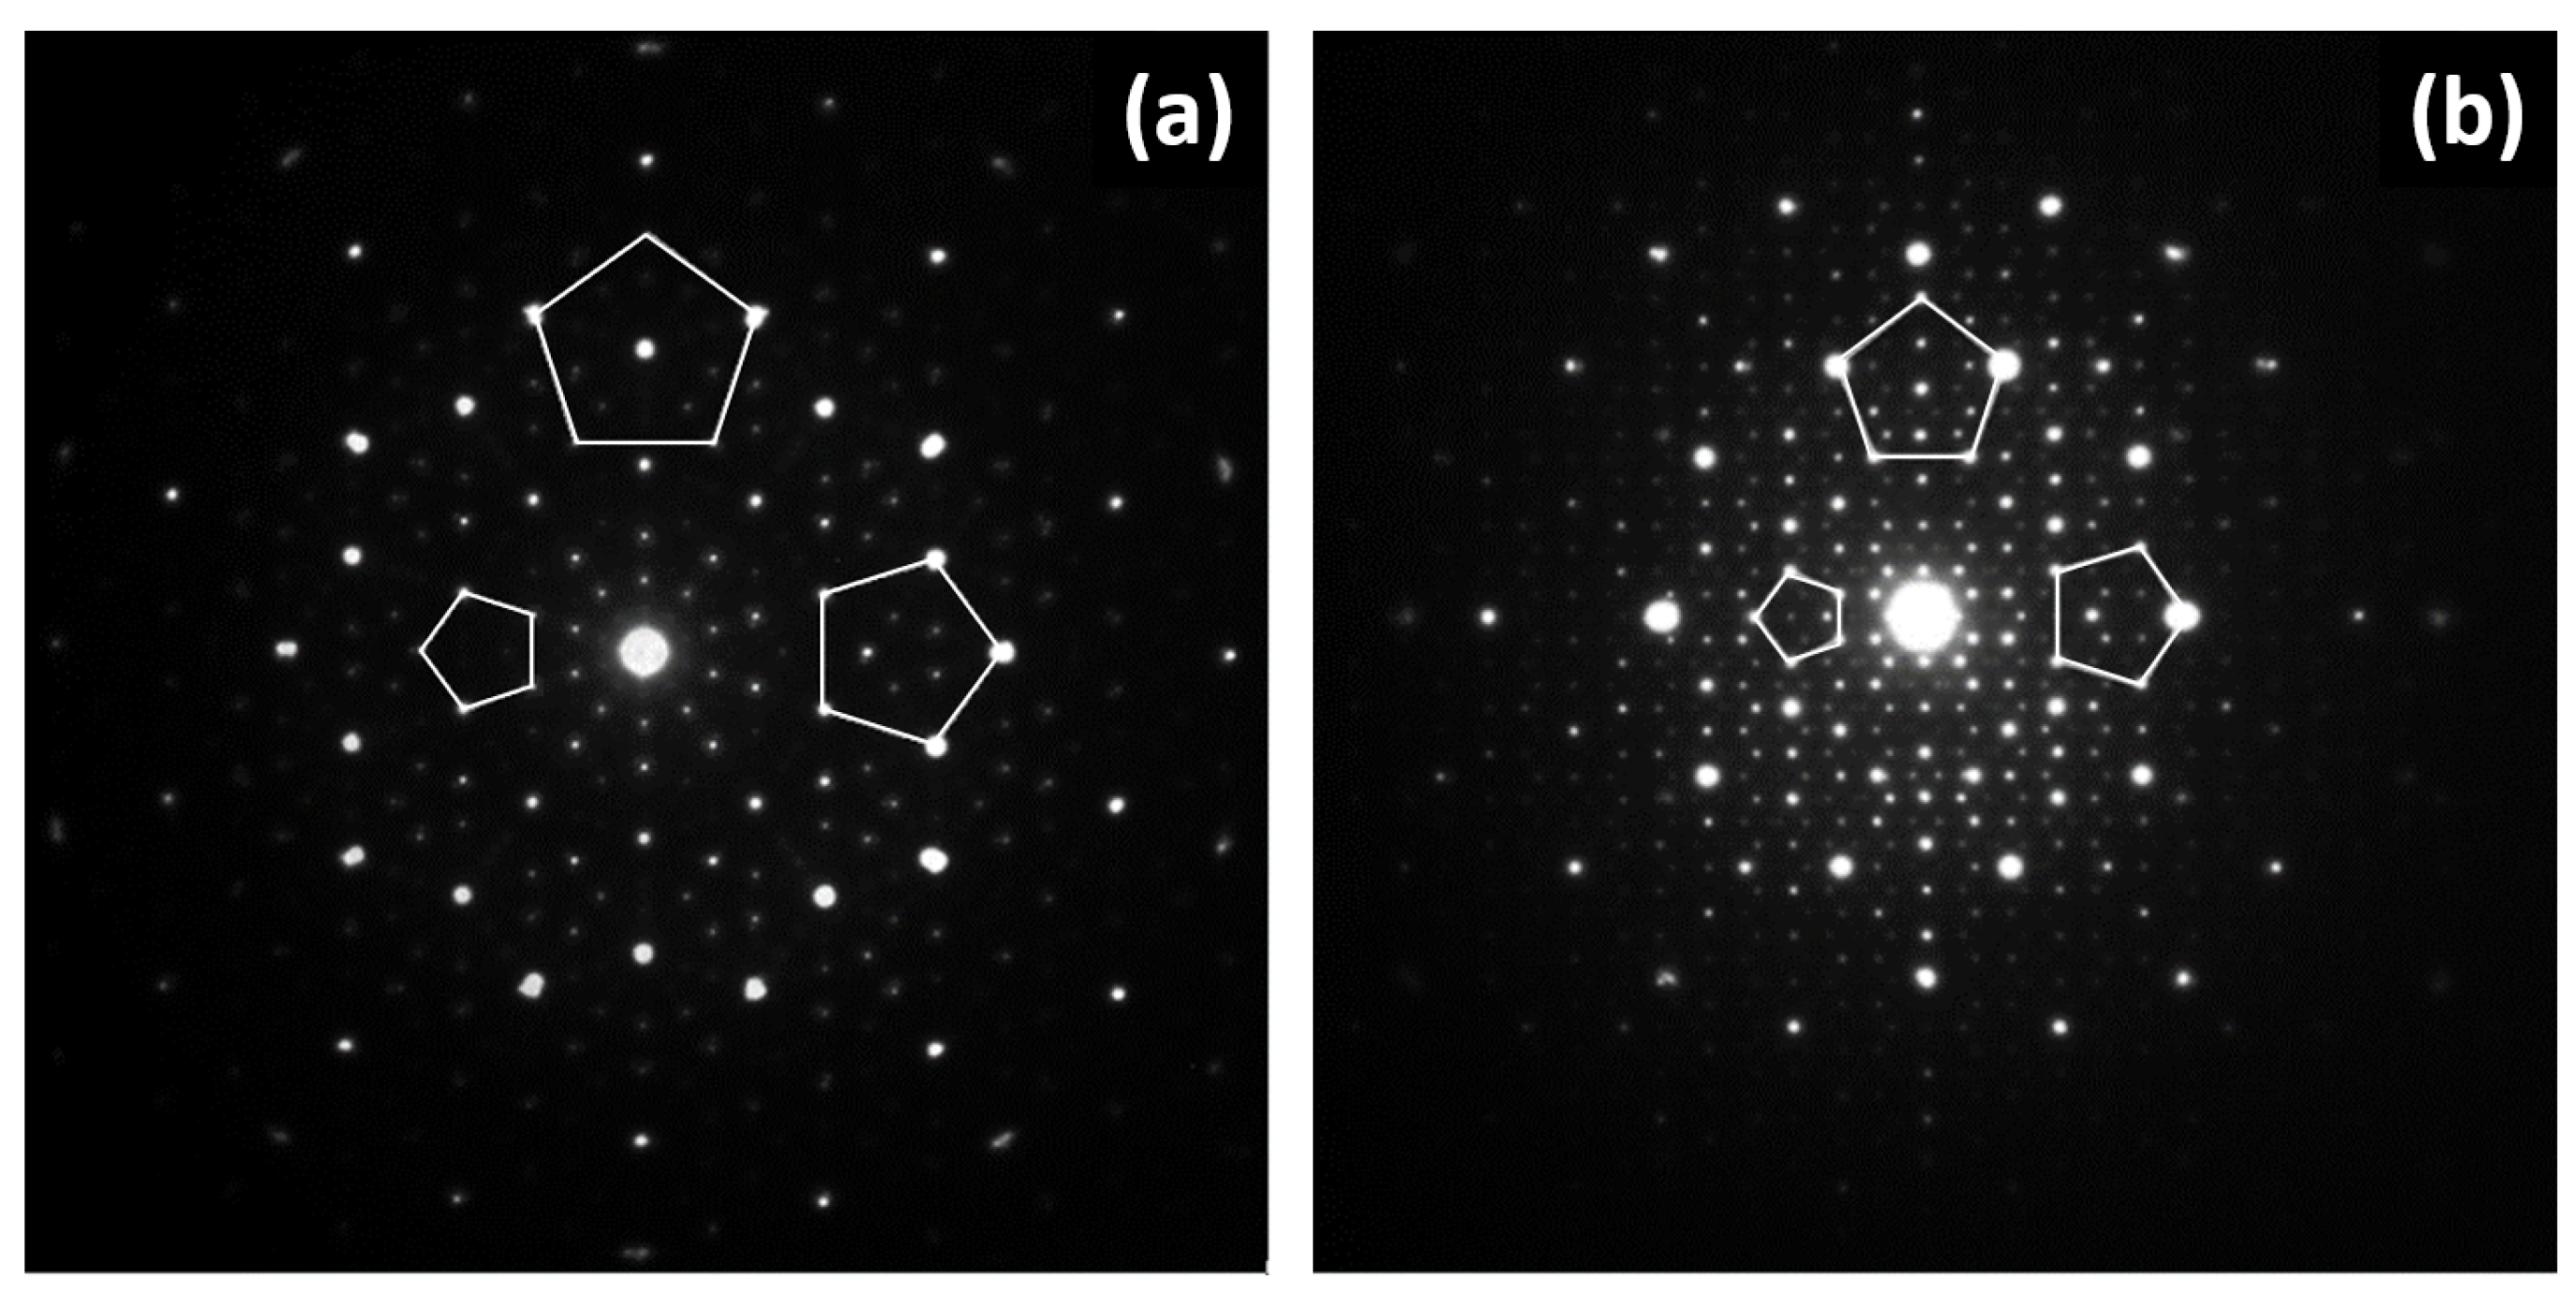
2. Crystal Structure of Quasicrystals and Their Approximants
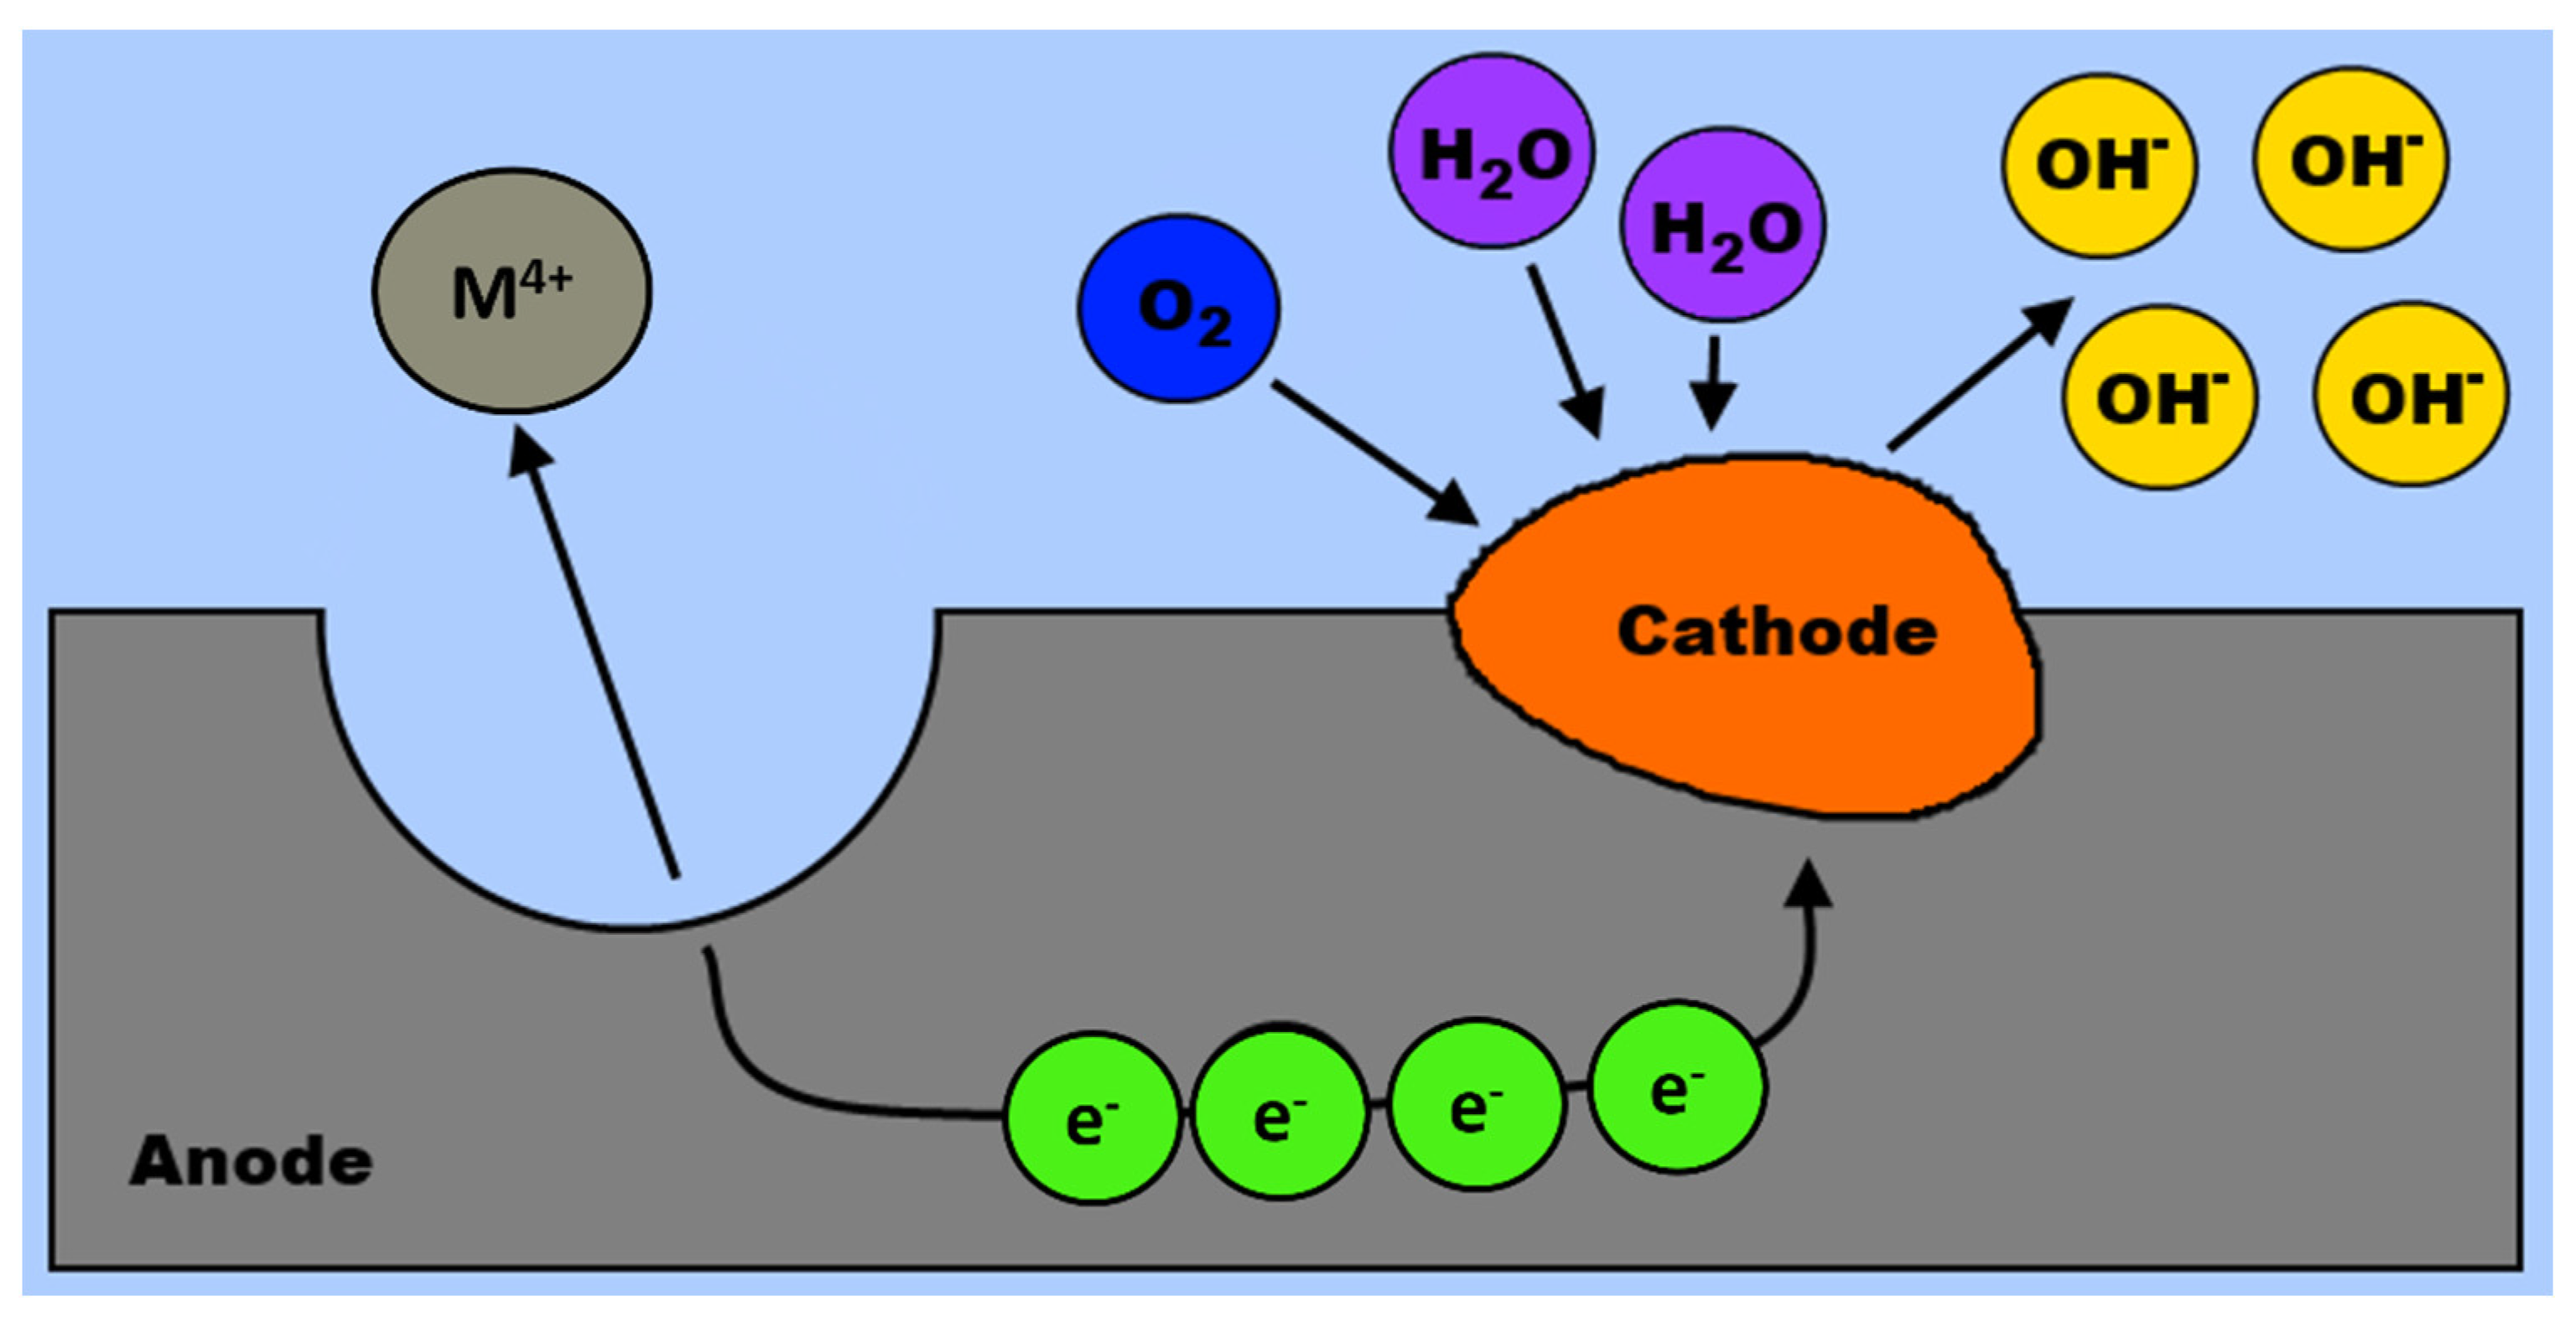
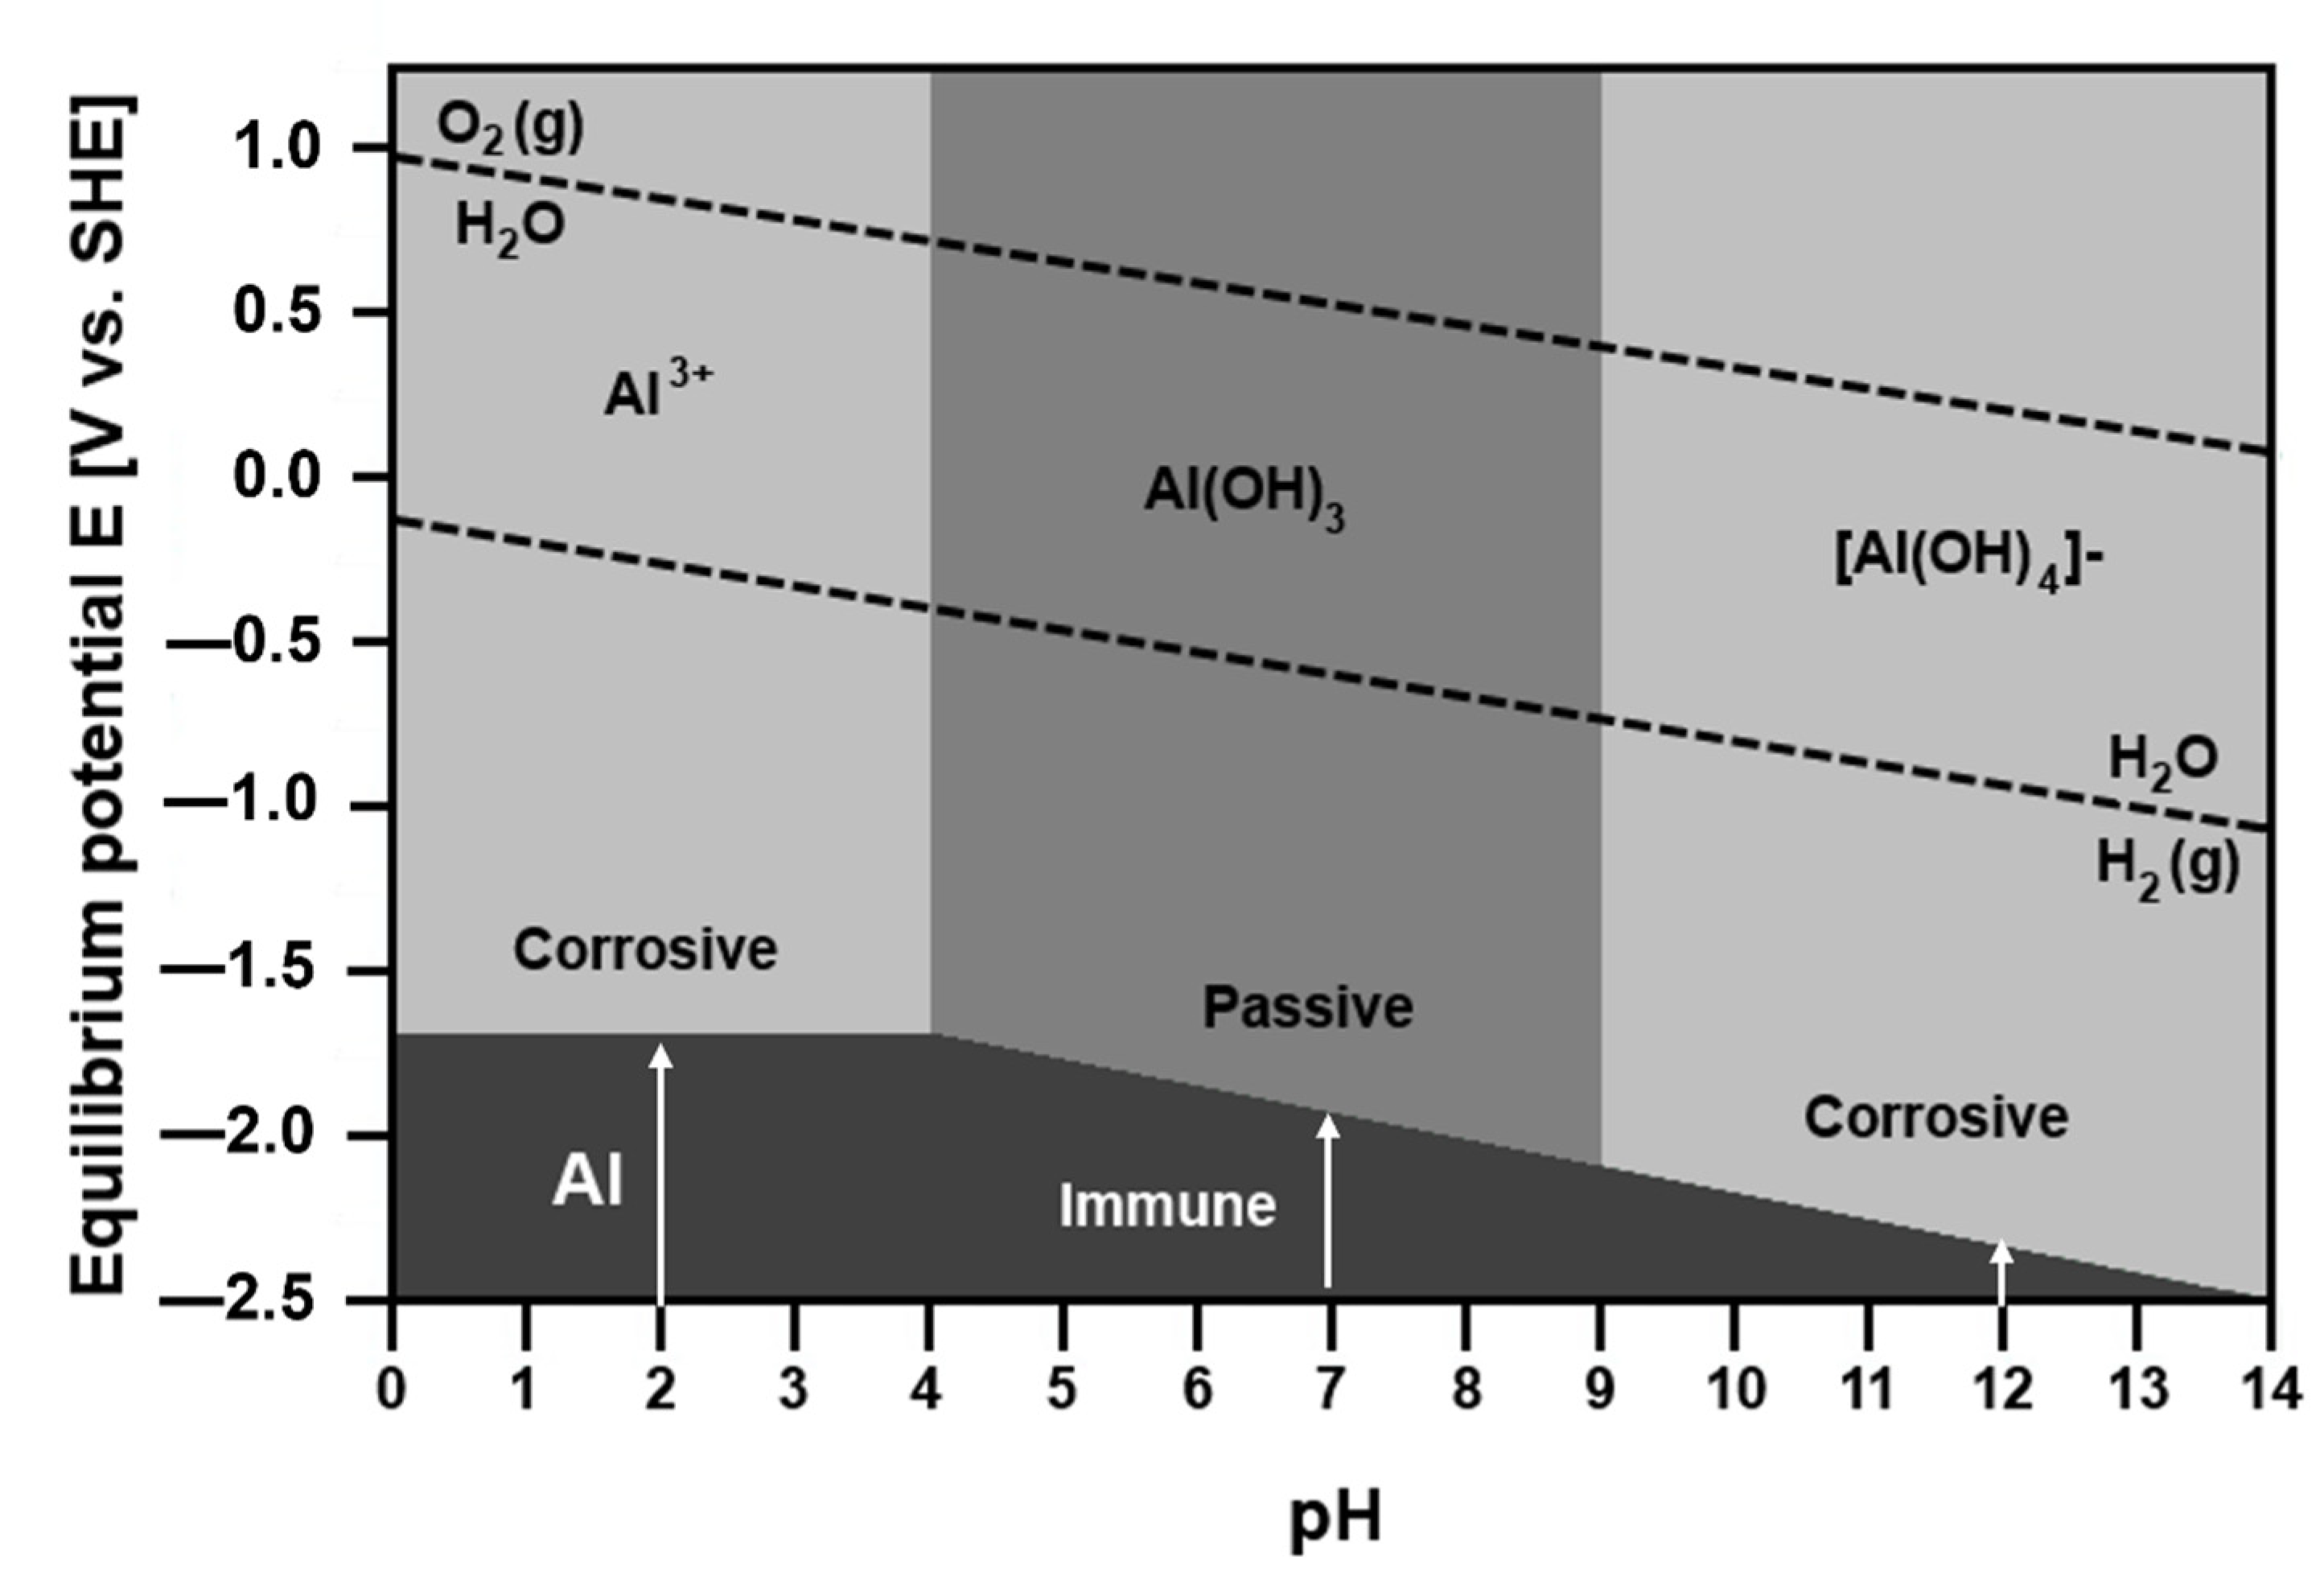
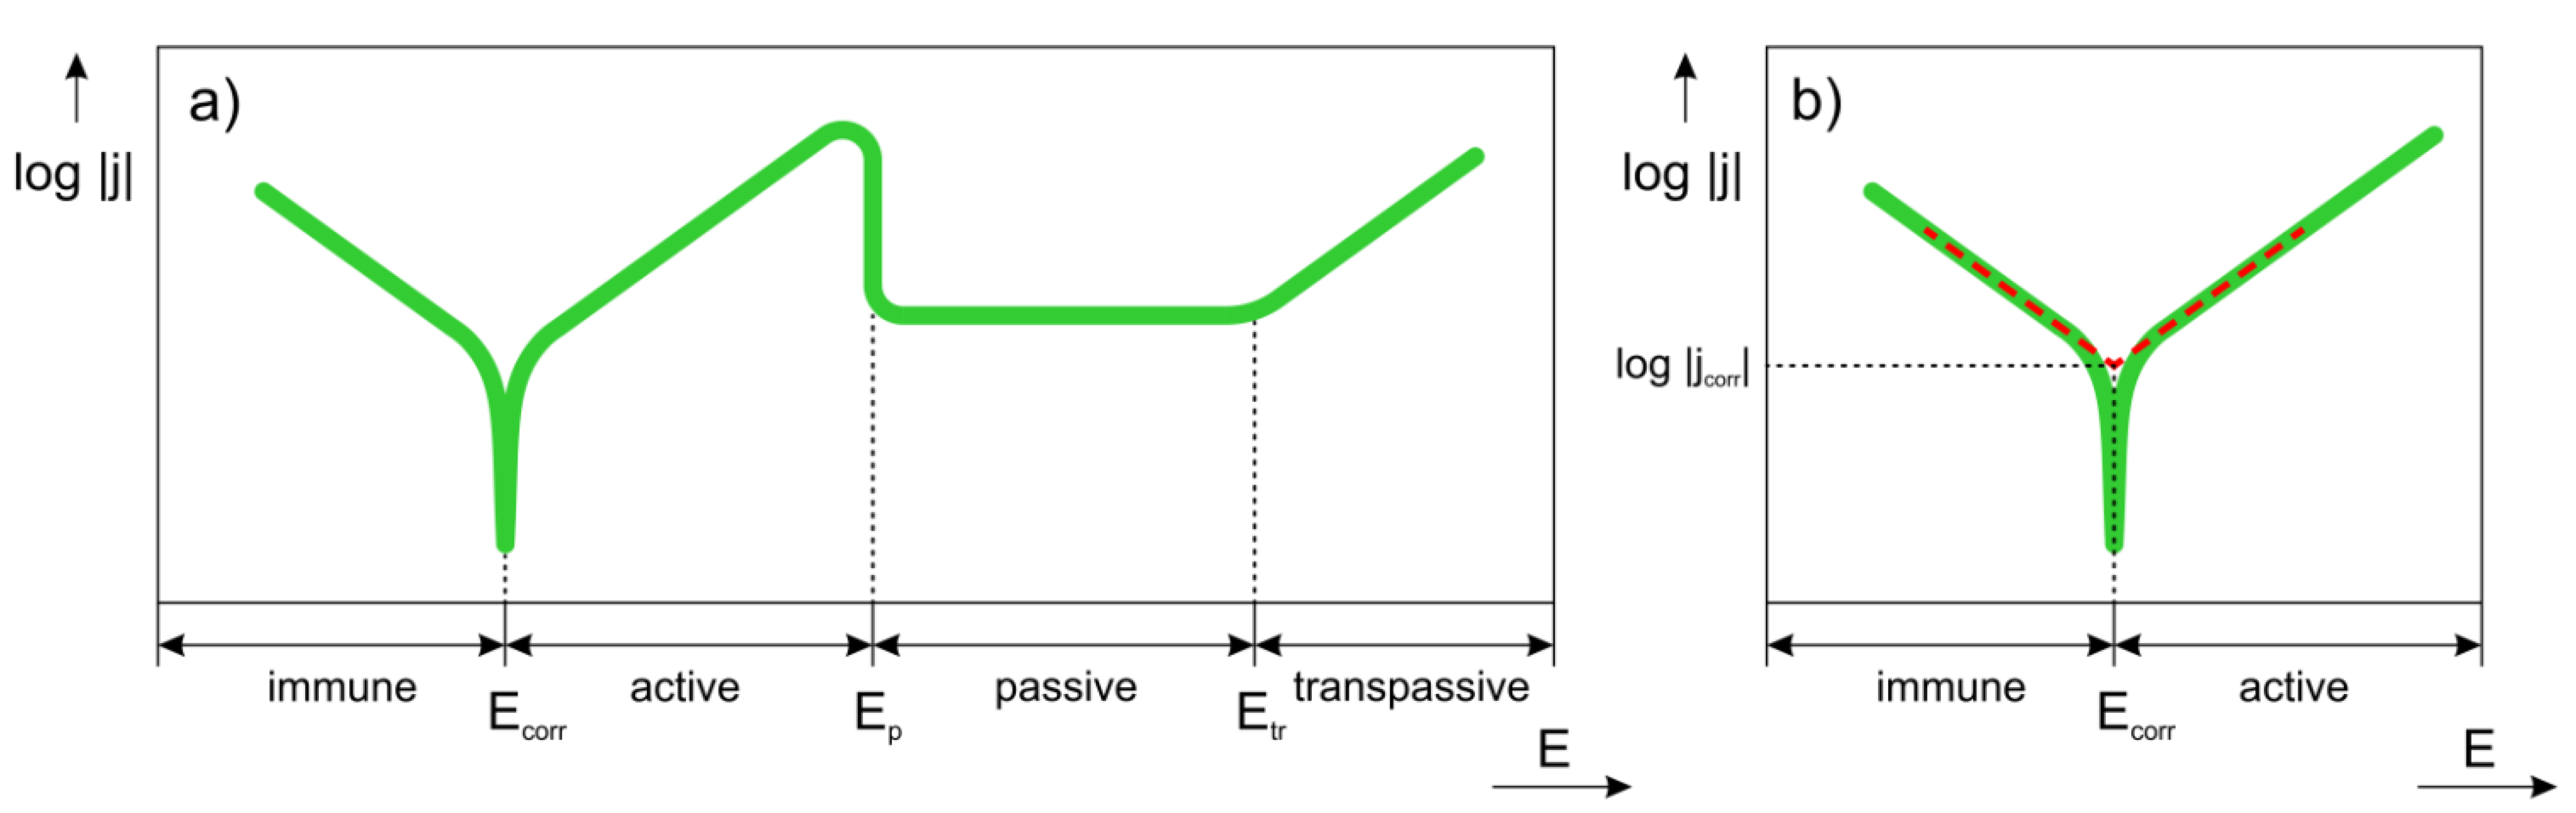
3. Overview of Electrochemical Corrosion
- Which SCIP of the alloy has the highest tendency to corrode?
- Which factors influence the positions of anodic and cathodic sites on the metal surface?
- Which factors affect the corrosion rate?
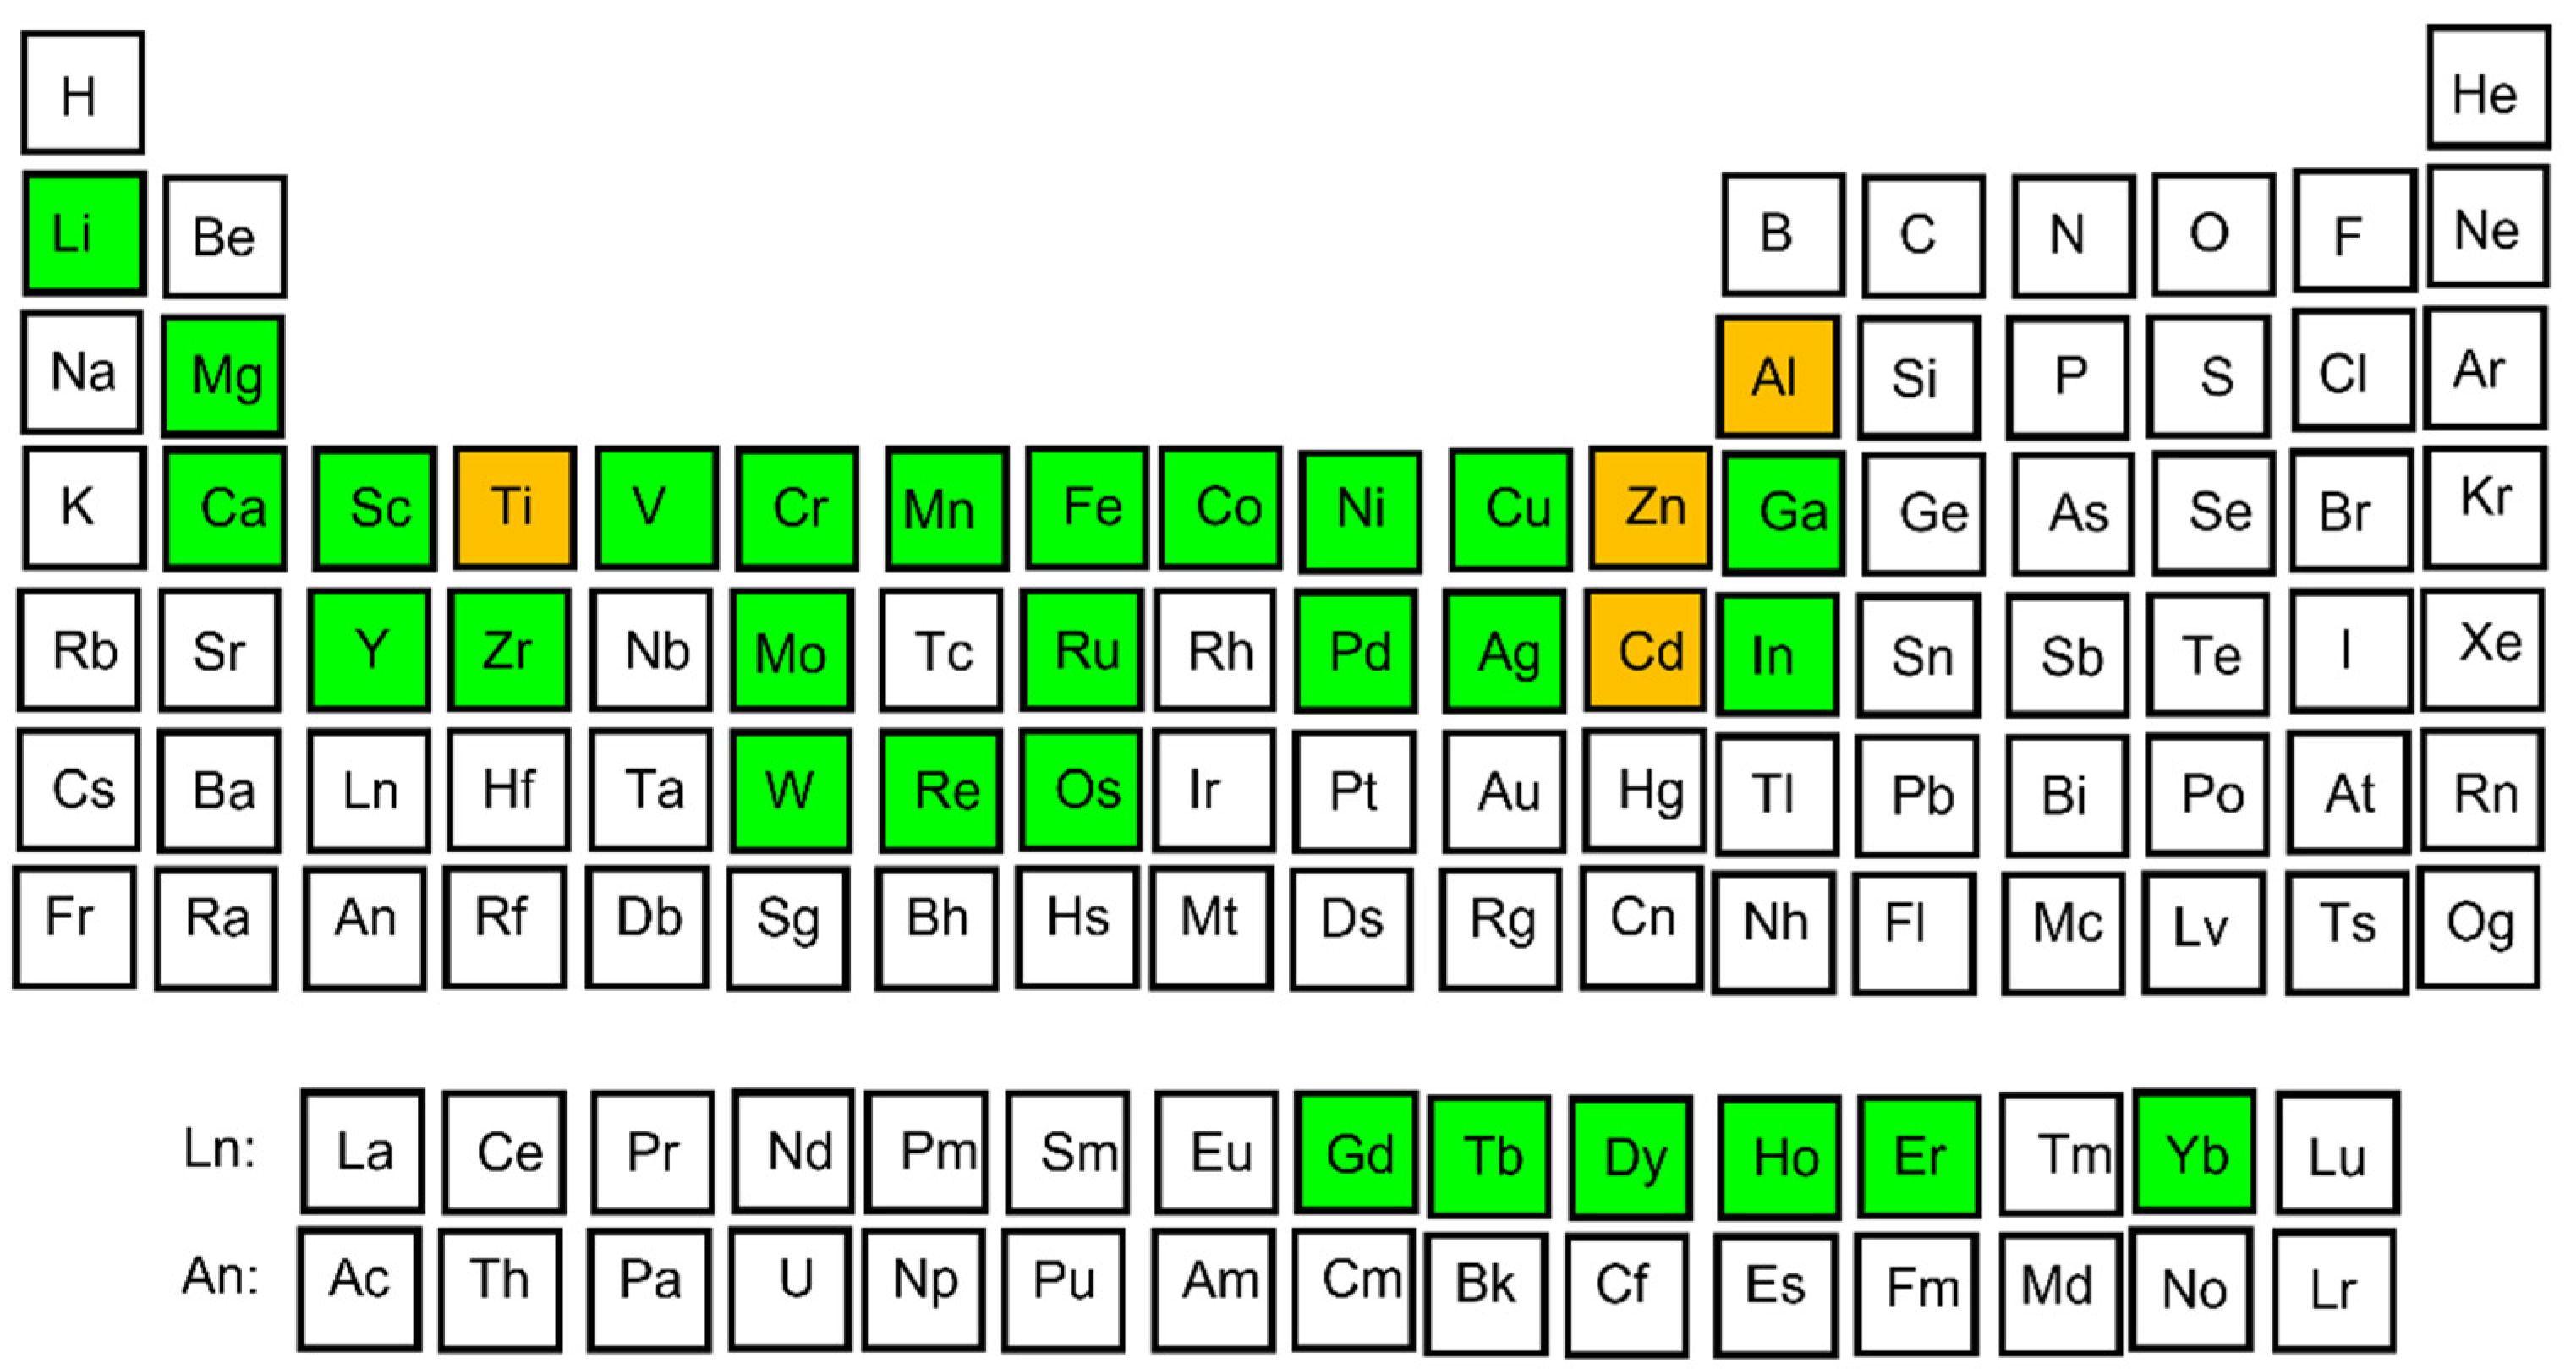
- In this paper the complex Al–TM alloys have been sorted according to their chemical composition.
4. Al–Co Alloys
- 1.
- Active dissolution of Al(ss)
- 2.
- Passivation of Al(ss)
- 3.
- Breakdown of the passive film at the Al9Co2/Al(ss) interface and dissolution of the Al(ss) due to galvanic interaction with the nobler intermetallic (IMC)
- 4.
- Passivation of Al9Co2
5. Al–Cr Alloys
6. Al–Noble-Metal Alloys
7. Comparison of Al–TM Alloys with Different Chemical Composition
8. Conclusions
Author Contributions
Funding
Institutional Review Board Statement
Informed Consent Statement
Data Availability Statement
Conflicts of Interest
References
- Georgantzia, E.; Gkantou, M.; Kamaris, G.S. Aluminium alloys as structural material: A review of research. Eng. Struct. 2021, 227, 111372. [Google Scholar] [CrossRef]
- Starke, E.A., Jr.; Staley, J.T. Application of modern aluminium alloys to aircraft. In Fundamentals of Aluminum Metallurgy; Lumley, R., Ed.; Woodhead Publishing: Cambridge, UK, 2011; pp. 747–783. [Google Scholar] [CrossRef]
- Davis, J.R. Aluminum and aluminum alloys. In Alloying: Understanding the Basics; ASM International: Materials Park, OH, USA, 2001; pp. 351–416. [Google Scholar] [CrossRef]
- Shechtman, D.; Blech, I.; Gratias, D.; Cahn, J.W. Metallic phase with long-range orientational order and no translational symmetry. Phys. Rev. Lett. 1984, 53, 1951–1953. [Google Scholar] [CrossRef] [Green Version]
- Dubois, J.M. Quasicrystals. J. Phys. Condens. Matter 2001, 13, 7753–7762. [Google Scholar] [CrossRef]
- Dubois, J.M. Useful Quasicrystals; World Scientific Publishing: Singapore, 2005; pp. 30–34. ISBN 978-9812561886. [Google Scholar]
- Steurer, W.; Deloudi, S. Crystallography of Quasicrystals—Concepts, Methods, and Structures; Springer: Berlin/Heidelberg, Germany, 2009; pp. 258–293. ISBN 978-3-642-01899-2. [Google Scholar] [CrossRef] [Green Version]
- Janot, C. Quasicrystals, 2nd ed.; Clarendon Press: Oxford, UK, 1994; ISBN 0-19-851778-5. [Google Scholar] [CrossRef]
- Dubois, J.M.; Ferré, E.B.; Feuerbacher, M. Introduction to the Science of Complex Metallic Alloys. In Complex Metallic Alloys: Fundamentals and Applications; Dubois, J.-M., Belin-Ferré, E., Eds.; Wiley-VCH: Hoboken, NJ, USA, 2011; pp. 1–39. [Google Scholar] [CrossRef]
- Priputen, P.; Liu, T.; Černičková, I.; Janičkovič, D.; Kolesár, V.; Janovec, J. Experimental study of Al-Co-Cu phase diagram in temperature range of 800–1050 °C. J. Phase Equilib. Diff. 2013, 34, 425–429. [Google Scholar] [CrossRef]
- Priputen, P.; Černičková, I.; Lejček, P.; Janičkovič, D.; Janovec, J. A partial isothermal section at 1000 °C of Al-Mn-Fe phase diagram in vicinity of Taylor phase and decagonal quasicrystal. J. Phase Equilib. Diff. 2016, 37, 130–134. [Google Scholar] [CrossRef]
- Socolar, J.E.S. Simple octagonal and dodecagonal quasicrystals. Phys. Rev. B 1989, 39, 10519–10551. [Google Scholar] [CrossRef] [PubMed]
- Wang, N.; Cen, H.; Kuo, K.H. Two-dimensional quasicrystal with eightfold rotational symmetry. Phys. Rev. Lett. 1987, 59, 1010–1013. [Google Scholar] [CrossRef] [Green Version]
- Cao, W.; Ye, H.Q.; Kuo, K.H. A new octagonal quasicrystal and related crystalline phases in rapidly solidified Mn4Si. Phys. Stat. Solidi 1988, A107, 511–519. [Google Scholar] [CrossRef]
- Wang, N.; Fung, K.K.; Kuo, K.H. Symmetry study of the Mn-Si-Al octagonal quasicrystal by convergent beam electron-diffraction. Appl. Phys. Lett. 1988, 52, 2120–2121. [Google Scholar] [CrossRef]
- Wang, Z.M.; Kuo, K.H. The octagonal quasilattice and electron-diffraction patterns of the octagonal phase. Acta Crystallogr. 1988, A44, 857–863. [Google Scholar] [CrossRef]
- He, L.X.; Zhang, Z.; Wu, Y.K.; Kuo, K.H. Stable decagonal quasicrystals with different periodicities along the tenfold axis in Al65Cu20Co15. Inst. Phys. Conf. Ser. 1988, 93, 501–502. [Google Scholar]
- Tsai, A.P.; Inoue, A.; Masumoto, T. Stable decagonal quasicrystals with a periodicity of 1.6 nm in Al-Pd-(Fe, Ru or Os) alloys. Philos. Mag. Lett. 1991, 64, 163–167. [Google Scholar] [CrossRef]
- Ge, S.P.; Kuo, K.H. Icosahedral and stable decagonal quasicrystals in Ga46Fe23Cu23Si8, Ga50Co25Cu25 and Ga46V23Ni23Si8. Phil. Mag. Lett. 1997, 75, 245–253. [Google Scholar] [CrossRef]
- Yokoyama, Y.; Yamada, Y.; Fukaura, K.; Sunada, H.; Inoue, A.; Note, R. Stable decagonal quasicrystal in an Al-Mn-Fe-Ge system. Jpn. J. Appl. Phys. 1997, 36, 6470–6474. [Google Scholar] [CrossRef]
- Sato, T.J.; Abe, E.; Tsai, A.P. A novel decagonal quasicrystal in Zn-Mg-Dy system. Jpn. J. Appl. Phys. 1997, 36, L1038–L1039. [Google Scholar] [CrossRef]
- Yang, Q.B.; Wei, W.D. Description of the dodecagonal quasicrystal by a projection method. Phys. Rev. Lett. 1987, 58, 1020–1023. [Google Scholar] [CrossRef] [PubMed]
- Chen, H.; Li, D.X.; Kuo, K.H. New type of two-dimensional quasicrystal with twelvefold rotational symmetry. Phys. Rev. Lett. 1988, 60, 1645–1648. [Google Scholar] [CrossRef] [PubMed]
- Ďuriška, L. Phase-Constitutional, Thermodynamic, and Electrochemical Studies of Al-Base Complex Metallic Alloys. Ph.D. Thesis, Slovak University of Technology, Trnava, Slovakia, 2017. Available online: https://opac.crzp.sk/?fn=detailBiblioForm&sid=7F4700268CB7D7D1FF59AFA53547 (accessed on 6 July 2021).
- Yokoyama, Y.; Miura, T.; Tsai, A.P.; Inoue, A.; Masumoto, T. Preparation of a large Al70Pd20Mn10 single-quasicrystal by the Czochralski method and its electrical resistivity. Mater. Trans. JIM 1992, 33, 97–101. [Google Scholar] [CrossRef] [Green Version]
- Dubois, J.M.; Kang, S.S.; Stebut, J. Quasicrystalline low-friction coatings. J. Mater. Sci. Lett. 1991, 10, 537–541. [Google Scholar] [CrossRef]
- Rabson, D.A. Toward theories of friction and adhesion on quasicrystals. Prog. Surf. Sci. 2012, 87, 253–271. [Google Scholar] [CrossRef]
- Tsai, A.P.; Suenaga, H.; Ohmori, M.; Yokoyama, Y.; Ioue, A.; Masumoto, T. Temperature dependence of hardness and expansion in an icosahedral Al-Pd-Mn alloy. Jpn. J. Appl. Phys. 1992, 31, 2530–2531. [Google Scholar] [CrossRef]
- Köster, U.; Liu, W.; Liebertz, H.; Michel, M. Mechanical properties of quasicrystalline and crystalline phases in Al-Cu-Fe alloys. J. Non-Cryst. Sollids 1993, 153–154, 446–452. [Google Scholar] [CrossRef]
- Yokoyama, Y.; Inoue, A.; Masumoto, T. Mechanical properties, fracture mode and deformation behavior of Al70Pd20Mn10 single-quasicrystal. Mater. Trans. JIM 1993, 34, 135–145. [Google Scholar] [CrossRef] [Green Version]
- Dubois, J.M.; Kang, S.S.; Perrot, A. Towards applications of quasicrystals. Mater. Sci. Eng. A 1994, A179–A180, 122–126. [Google Scholar] [CrossRef]
- Masumoto, T.; Inoue, A. YKK Corporation, Honda Giken Kogyo Kabushiki Kaisha. European Patent 94115137.5.
- Jenks, C.J.; Thiel, P.A. Comments on quasicrystals and their potential use as catalysts. J. Mol. Catal. A—Chem. 1998, 131, 301–306. [Google Scholar] [CrossRef]
- Dubois, J.M. New prospects from potential applications of quasicrystalline materials. Mater. Sci. Eng. A 2000, 294–296, 4–9. [Google Scholar] [CrossRef]
- Massiani, Y.; Yaazza, S.A.; Croussier, J.P.; Dubois, J.M. Electrochemical behaviour of quasicrystalline alloys in corrosive solutions. J. Non-Cryst. Solids 1993, 159, 92–100. [Google Scholar] [CrossRef]
- Asami, K.; Tsai, A.-P.; Hashimoto, K. Electrochemical behavior of a quasicrystalline Al-Pd-Mn alloy in a chloride-containing solution. Mater. Sci. Eng. A 1994, 181, 1141. [Google Scholar] [CrossRef]
- Rüdiger, A.; Köster, U. Corrosion behavior of Al-Cu-Fe quasicrystals. Mater. Sci. Eng. A 2000, 294–296, 890–893. [Google Scholar] [CrossRef]
- Torres, A.; Serna, S.; Patiño, C.; Rosas, G. Corrosion Behavior of W and b Quasicrystalline Al–Cu–Fe Alloy. Acta Metall. Sin. 2015, 28, 1117–1122. [Google Scholar] [CrossRef]
- Veys, D.; Rapin, C.; Li, X.; Aranda, L.; Fournee, V.; Dubois, J.-M. Electrochemical behavior of approximant phases in the Al–(Cu)–Fe–Cr system. J. Non-Cryst. Solids 2004, 347, 1–10. [Google Scholar] [CrossRef]
- Wehner, B.I.; Köster, U.; Rüdiger, A.; Pieper, C.; Sordelet, D.J. Oxidation of Al–Cu–Fe and Al–Pd–Mn quasicrystals. Mater. Sci. Eng. A 2000, 294–296, 830–833. [Google Scholar] [CrossRef]
- Rampulla, D.M.; Mancinelli, C.M.; Brunell, I.F.; Gellman, A.J. Oxidative and Tribological Properties of Amorphous and Quasicrystalline Approximant Al-Cu-Fe Thin Films. Langmuir 2005, 21, 4547–4553. [Google Scholar] [CrossRef]
- Yamasaki, M.; Pang Tsai, A. Oxidation behavior of quasicrystalline Al63Cu25Fe12 alloys with additional elements. Mater. Sci. Eng. A 2000, 294-296, 890–893. [Google Scholar] [CrossRef]
- Pinhero, P.J.; Anderegg, J.W.; Sordelet, D.J.; Besser, M.F.; Thiel, P.A. Surface oxidation of Al-Cu-Fe alloys: A comparison of quasicrystalline and crystalline phases. Philos. Mag. B 1999, 79, 91–110. [Google Scholar] [CrossRef]
- Šulhánek, P.; Drienovský, M.; Černičková, I.; Ďuriška, L.; Skaudžius, R.; Gerhátová, Ž.; Palcut, M. Oxidation of Al-Co alloys at high temperatures. Materials 2020, 13, 3152. [Google Scholar] [CrossRef] [PubMed]
- Graef, M.; McHenry, M. Structure of Materials: An Introduction to Crystallography, Diffraction, and Symmetry, 3rd ed.; Cambridge University Press: New York, NY, USA, 2008; ISBN 978-0-521-65151-6. [Google Scholar] [CrossRef]
- Taylor, J.E.; Teich, E.G.; Damasceno, P.F.; Kallus, Y.; Senechal, M. On the form and growth of complex crystals: The case of Tsai-type clusters. Symmetry 2017, 9, 188. [Google Scholar] [CrossRef] [Green Version]
- Livio, M. Zlatý Řez, 1st ed.; Dokořán: Prague, Czech Republic, 2006; ISBN 80-7363-064-8. [Google Scholar]
- Smontara, A.; Smiljanić, I.; Bilušić, A.; Grushko, B.; Balanetskyy, S.; Jagličić, Z.; Vrtnik, S.; Dolinšek, J. Complex ε-phases in the Al-Pd-transition-metal systems. J. Alloys Compd. 2008, 450, 92–102. [Google Scholar] [CrossRef]
- Bancel, P.A.; Heiney, P.A. Icosahedral aluminum-transition-metal alloys. Phys. Rev. B 1986, 33, 7917–7922. [Google Scholar] [CrossRef]
- Create and Colour a Penrose Tiling. Available online: https://craftdesignonline.com/penrose/ (accessed on 6 July 2021).
- Periodic Rhombus Tiling with Penrose Tiles. Available online: https://sk.pinterest.com/pin/268245721535341551/?d=t&mt=login (accessed on 6 July 2021).
- Černičková, I.; Švec, P.; Watanabe, S.; Čaplovič, Ľ.; Mihalkovič, M.; Kolesár, V.; Priputen, P.; Bednarčík, J.; Janičkovič, D.; Janovec, J. Fine structure of phases of epsilon-family in Al73.8Pd11.9Co14.3 alloy. J. Alloys Compd. 2014, 609, 73–79. [Google Scholar] [CrossRef]
- Černičková, I.; Priputen, P.; Liu, T.; Zemanová, A.; Illeková, E.; Janičkovič, D.; Švec, P.; Kusý, M.; Čaplovič, Ľ.; Janovec, J. Evolution of phases in Al-Pd-Co alloys. Intermetallics 2011, 19, 1586–1593. [Google Scholar] [CrossRef]
- Černičková, I.; Ďuriška, L.; Priputen, P.; Janičkovič, D.; Janovec, J. Isothermal section of the Al-Pd-Co phase diagram at 850 °C delimited by homogeneity ranges of phases epsilon, U, and F. J. Phase Equilib. Diff. 2016, 37, 301–307. [Google Scholar] [CrossRef]
- Černičková, I.; Ďuriška, L.; Drienovský, M.; Janičkovič, D.; Janovec, J. Phase transitions in selected Al-Pd-Co alloys during continuous cooling. Kovové Mater. 2017, 55, 403–411. [Google Scholar] [CrossRef] [Green Version]
- Ďuriška, L.; Černičková, I.; Čička, R.; Janovec, J. Contribution to thermodynamic description of Al-Pd system. J. Phys. Conf. Ser. 2017, 809, 012008. [Google Scholar] [CrossRef] [Green Version]
- Adamech, M.; Černičková, I.; Ďuriška, L.; Kolesár, V.; Drienovský, M.; Bednarčík, J.; Svoboda, M.; Janovec, J. Formation of less-know structurally complex zéta b and orthorhombic quasicrystalline approximant epsilon n on solidification of selected Al-Pd-Cr alloys. Mater. Charact. 2014, 97, 189–198. [Google Scholar] [CrossRef]
- Priputen, P.; Kusý, M.; Drienovský, M.; Janičkovič, D.; Čička, R.; Černičková, I.; Janovec, J. Experimental reinvestigation of Al-Co phase diagram in vicinity of Al13Co4 family of phases. J. Alloys Compd. 2015, 647, 486–497. [Google Scholar] [CrossRef]
- Kolesár, V.; Priputen, P.; Bednarčík, J.; Černičková, I.; Svoboda, M.; Drienovský, M.; Janovec, J. Evolution of phases in Al55Ni30Pd15 alloy at temperatures up to 600 °C. Intermetallics 2014, 46, 141–146. [Google Scholar] [CrossRef]
- Jenks, C.J.; Thiel, P.A. Quasicrystals: A Short Review from a Surface Science Perspective. Langmuir 1998, 14, 1392–1397. [Google Scholar] [CrossRef] [Green Version]
- Fournée, V.; Ledieu, J.; Park, J.Y. Surface Science of Complex Metallic Alloys. In Complex Metallic Alloys: Fundamentals and Applications; Dubois, J.-M., Belin-Ferré, E., Eds.; Wiley-VCH: Hoboken, NJ, USA, 2011; pp. 155–206. [Google Scholar] [CrossRef]
- Ebert, P.H.; Feuerbacher, M.; Tamura, N.; Wollgarten, M.; Urban, K. Evidence for a Cluster-Based Structure of AlPdMn Single Quasicrystals. Phys. Rev. Lett. 1996, 77, 3827–3830. [Google Scholar] [CrossRef]
- Papadopolos, Z.; Kasner, G.; Ledieu, J.; Cox, E.J.; Richardson, N.V.; Chen, Q.; Diehl, R.D.; Lograsso, T.A.; Ross, A.R.; McGrath, R. Bulk termination of the quasicrystalline fivefold surface of Al70Pd21Mn9. Phys. Rev. B 2002, 66, 184207. [Google Scholar] [CrossRef] [Green Version]
- Krajčí, M.; Hafner, J. Structure, stability, and electronic properties of the i-AlPdMn quasicrystalline surface. Phys. Rev. B 2005, 71, 054202. [Google Scholar] [CrossRef] [Green Version]
- Hafner, J. Ab initio density-functional calculations in materials science: From quasicrystals over microporous catalysts to spintronics. J. Phys. Condens. Matter 2010, 22, 384205. [Google Scholar] [CrossRef] [PubMed]
- Krajčí, M.; Hafner, J. Surfaces of Complex Intermetallic Compounds: Insights from Density Functional Calculations. Acc. Chem. Res. 2014, 47, 3378–3384. [Google Scholar] [CrossRef]
- Stansbury, E.E.; Buchanan, R.A. Introduction and overview of electrochemical corrosion. In Fundamentals of Electrochemical Corrosion; ASM International: Materials Park, OH, USA, 2000; pp. 1–21. [Google Scholar] [CrossRef]
- Perez, N. Electrochemistry. In Electrochemistry and Corrosion Science; Kluwer Academic Publishers: New York, NY, USA, 2004; pp. 27–70. [Google Scholar] [CrossRef]
- Pourbaix, M. Atlas of Electrochemical Equilibria in Aqueous Solution; National Association of Corrosion Engineers: Houston, TX, USA, 1974. [Google Scholar]
- Hasannaeimi, V.; Sadeghilaridjani, M.; Mukherjee, S. Electrochemical and Corrosion Behavior of Metallic Glasses; MDPI: Basel, Switzerland, 2021. [Google Scholar] [CrossRef]
- Burgleigh, T.D. Corrosion of aluminum and its alloys. In Handbook of Aluminum. Alloys Production and Materials Manufacturing; Totten, G.E., Mackenzie, D.S., Eds.; ASM International: Materials Park, OH, USA, 2003; Volume 2, pp. 421–463. [Google Scholar] [CrossRef]
- ISO 17475:2005 Corrosion of Metals and Alloys—Electrochemical Test Methods—Guidelines for Conducting Potentiostatic and Potentiodynamic Polarization Measurements. Available online: https://www.iso.org/standard/31392.html (accessed on 6 August 2021).
- ASTM G102–89 Standard Practice for Calculation of Corrosion Rates and Related Information from Electrochemical Measurements; ASTM International: West Conshohocken, PA, USA, 2015; Available online: https://www.astm.org/Standards/G102.htm (accessed on 6 August 2021).
- Sukiman, N.L.; Zhou, X.; Birbilis, N.; Hughes, A.E.; Mol, J.M.C.; Garcia, S.J.; Zhou, X.; Thompson, G.E. Durability and Corrosion of Aluminium and Its Alloys: Overview, Property Space, Techniques and Developments. In Aluminium Alloys—New Trends in Fabrication and Applications; Ahmad, Z., Ed.; Intechopen: London, UK, 2012; pp. 47–97. [Google Scholar]
- Szklarska-Smialowska, Z. Pitting Corrosion of aluminum. Corros. Sci. 1999, 41, 1743–1767. [Google Scholar] [CrossRef]
- Li, J.; Dang, J. A Summary of Corrosion Properties of Al-Rich Solid Solution and Secondary Phase Particles in Al Alloys. Metals 2017, 7, 84. [Google Scholar] [CrossRef]
- Li, J.; Hurley, B.; Buchheit, R. Effect of temperature on the localized corrosion of AA2024-t3 and the electrochemistry of intermetallic compounds during exposure to a dilute NaCl solution. Corrosion 2016, 72, 1281–1291. [Google Scholar] [CrossRef]
- Zhu, Y.; Sun, K.; Frankel, G.S. Intermetallic Phases in Aluminum Alloys and Their Roles in Localized Corrosion. J. Electrochem. Soc. 2018, 165, C807–C820. [Google Scholar] [CrossRef]
- Lekatou, A.G.; Sfikas, A.K.; Karantzalis, A.E. The influence of the fabrication route on the microstructure and surface degradation properties of Al reinforced by Al9Co2. Mater. Chem. Phys. 2017, 200, 33–49. [Google Scholar] [CrossRef]
- Sfikas, A.K.; Lekatou, A.G. Electrochemical Behavior of Al–Al9Co2 Alloys in Sulfuric Acid. Corros. Mater. Degrad. 2020, 1, 249–272. [Google Scholar] [CrossRef]
- Lekatou, A.; Sfikas, A.K.; Petsa, C.; Karantzalis, A.E. Al-Co alloys prepared by vacuum arc melting: Correlating microstructure evolution and aqueous corrosion behavior with Co content. Metals 2016, 6, 46. [Google Scholar] [CrossRef] [Green Version]
- Lekatou, A.; Sfikas, A.K.; Karantzalis, A.E.; Sioulas, D. Microstructure and corrosion performance of Al-32%Co alloys. Corros. Sci. 2012, 63, 193–209. [Google Scholar] [CrossRef]
- Palcut, M.; Priputen, P.; Kusý, M.; Janovec, J. Corrosion behaviour of Al-29at%Co alloy in aqueous NaCl. Corros. Sci. 2013, 75, 461–466. [Google Scholar] [CrossRef]
- Palcut, M.; Priputen, P.; Šalgó, K.; Janovec, J. Phase constitution and corrosion resistance of Al-Co alloys. Mater. Chem. Phys. 2015, 166, 95–104. [Google Scholar] [CrossRef]
- Eckert, J.; Scudino, S.; Stoica, M.; Kenzari, S.; Sales, M. Mechanical engineering properties of CMAs. In Complex Metallic Alloys: Fundamentals and Applications; Dubois, J.-M., Belin-Ferré, E., Eds.; Wiley-VCH: Hoboken, NJ, USA, 2011; pp. 273–315. [Google Scholar] [CrossRef]
- Priputen, P.; Palcut, M.; Babinec, M.; Mišík, J.; Černičková, I.; Janovec, J. Correlation between microstructure and corrosion behavior of near-equilibrium Al-Co alloys in various environments. J. Mater. Eng. Perform. 2017, 26, 3970–3976. [Google Scholar] [CrossRef]
- Meier, M.; Ledieu, J.; De Weerd, M.-C.; Huang, Y.-T.; Abreu, G.J.P.; Pussi, K.; Diehl, R.; Mazet, T.; Fournée, V.; Gaudry, E. Interplay between bulk atomic clusters and surface structure in complex intermetallic compounds: The case study of the Al5Co2(001) surface. Phys. Rev. B 2015, 91, 085414. [Google Scholar] [CrossRef] [Green Version]
- Anand, K.; Fournée, V.; Prevot, G.; Ledieu, J.; Gaudry, E. Nonwetting Behavior of Al-Co Quasicrystalline Approximants Owing to Their Unique Electronic Structures. ACS Appl. Mater. Interfaces 2020, 12, 15793–15801. [Google Scholar] [CrossRef] [PubMed]
- Demange, V.; Machizaud, F.; Dubois, J.M.; Anderegg, J.W.; Thiel, P.A.; Sordelet, D.J. New approximants in the Al–Cr–Fe system and their oxidation resistance. J. Alloys Compd. 2002, 342, 24–29. [Google Scholar] [CrossRef]
- Li, R.T.; Murugan, V.K.; Dong, Z.L.; Khor, K.A. Comparative Study on the Corrosion Resistance of Al–Cr–Fe Alloy Containing Quasicrystals and Pure Al. J. Mater. Sci. Technol. 2016, 32, 1054–1058. [Google Scholar] [CrossRef]
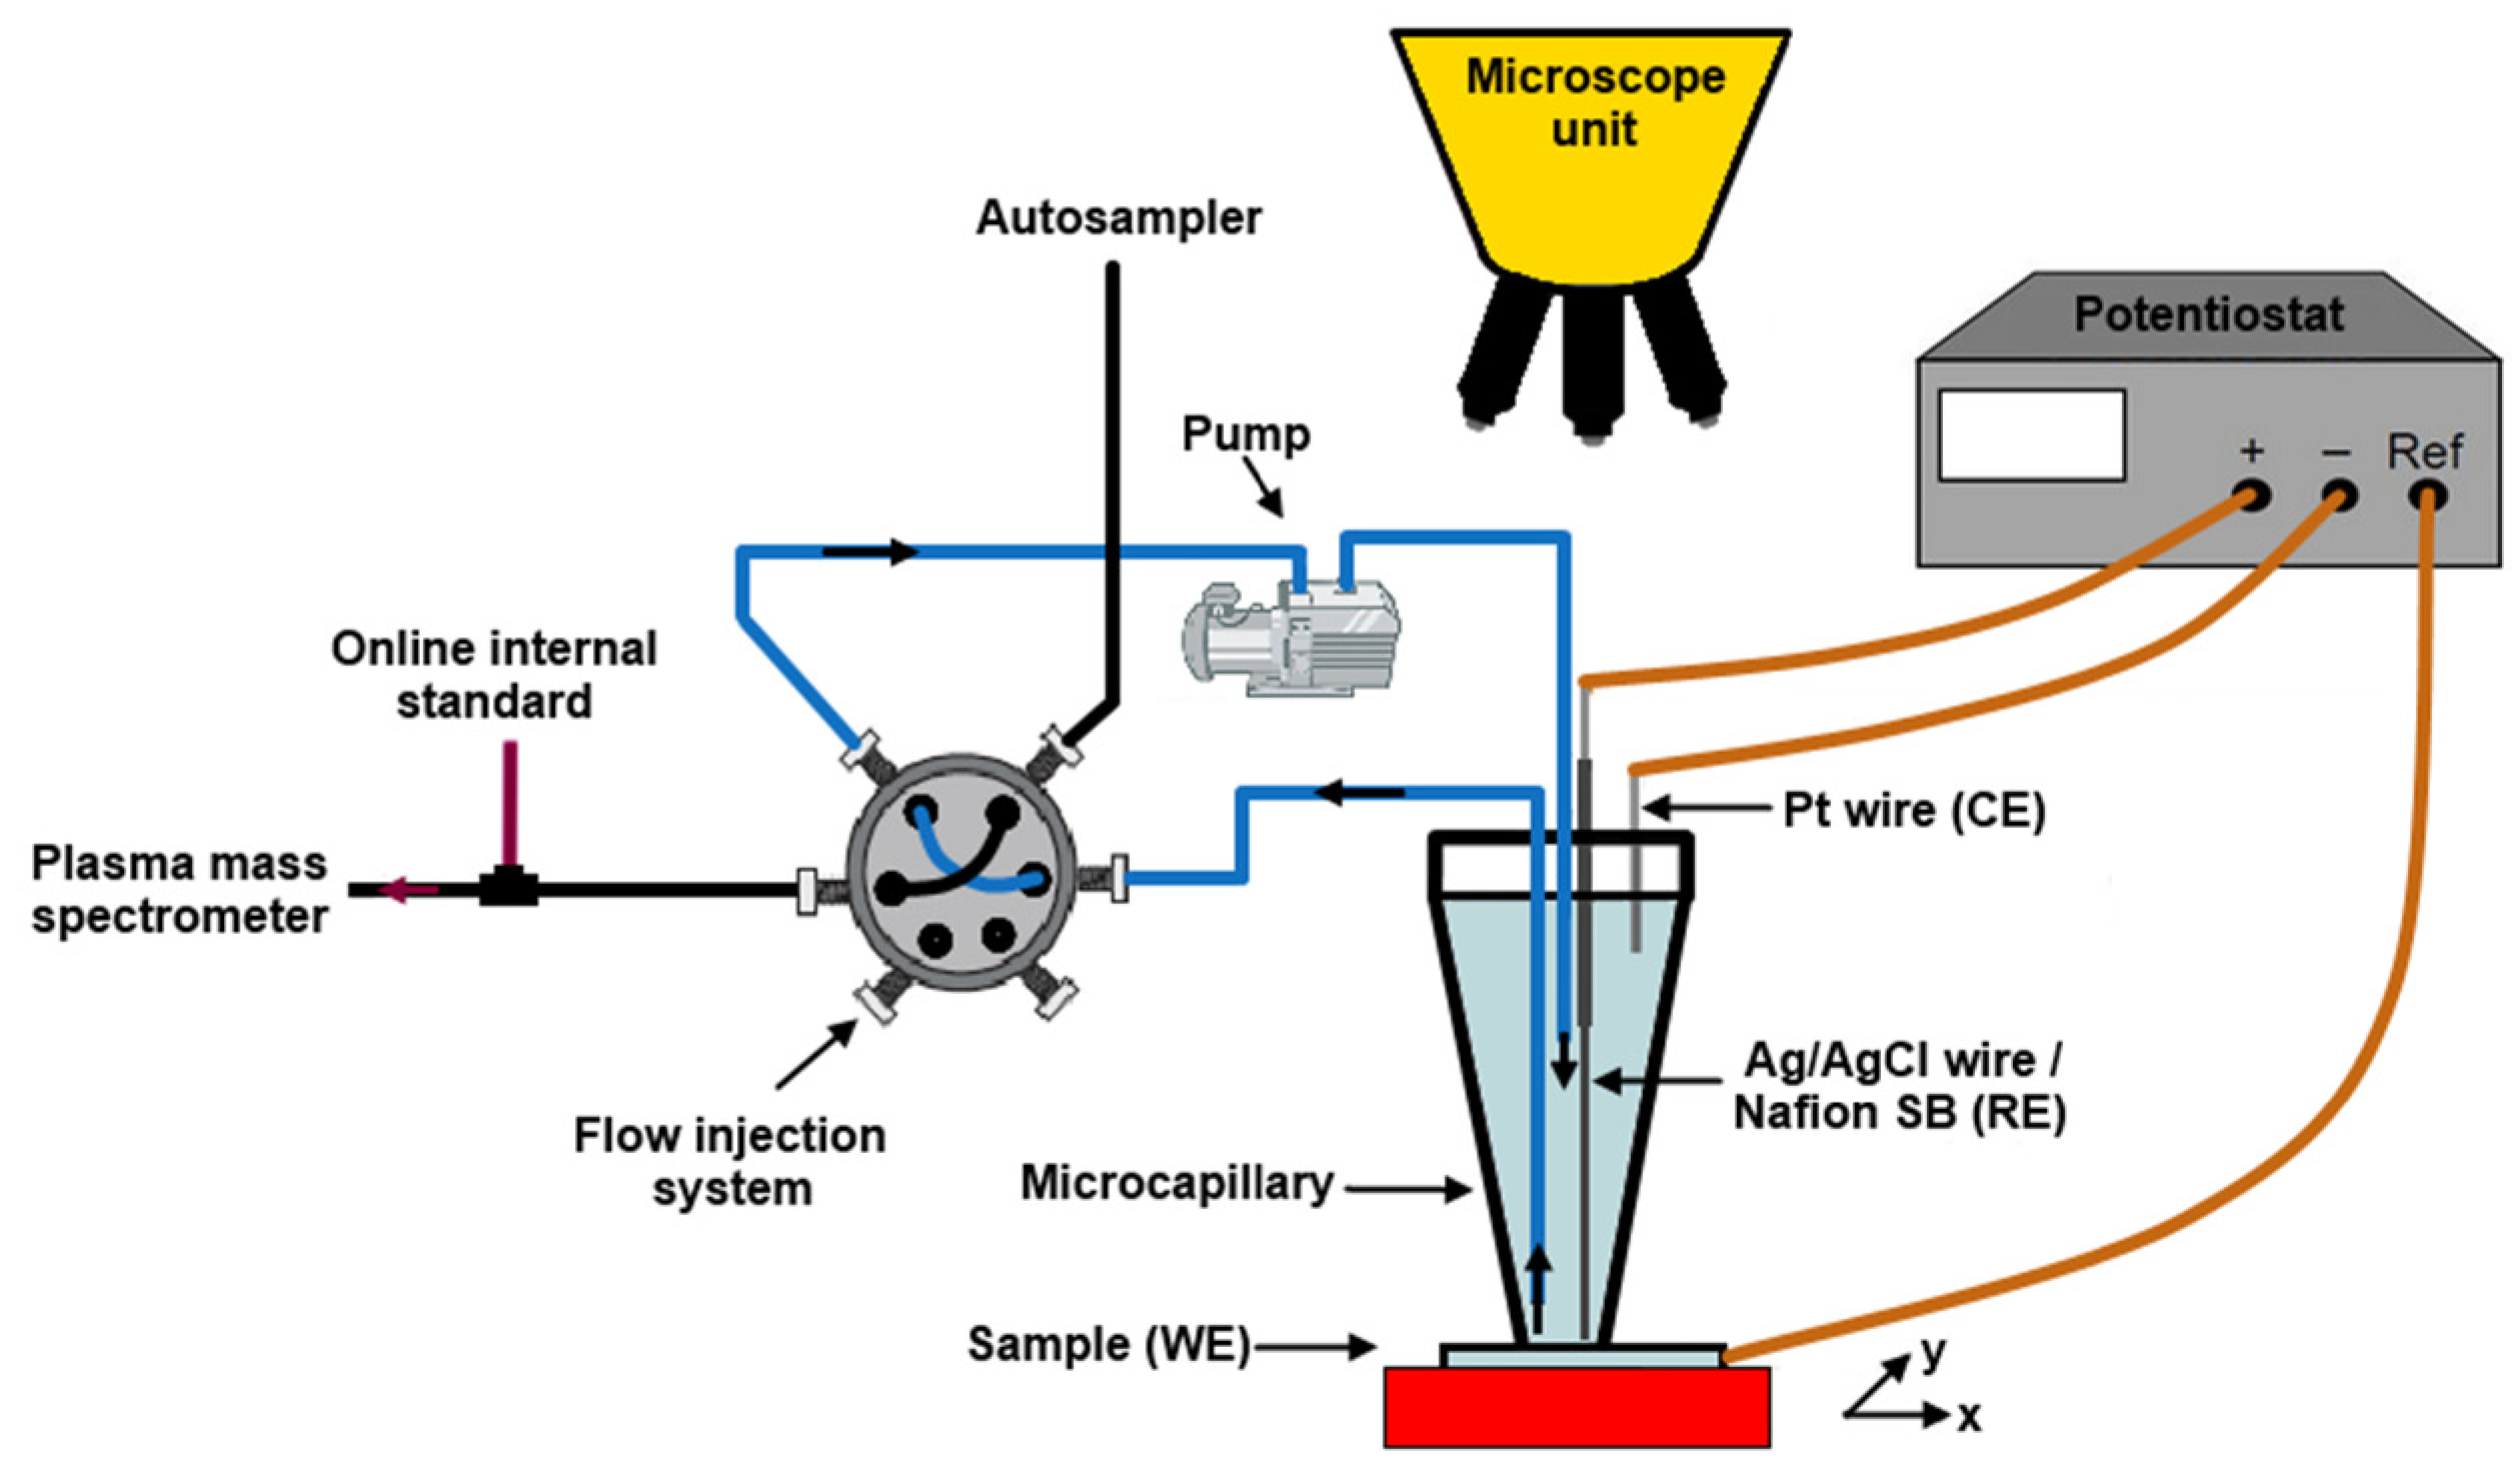
- Ott, N.; Beni, A.; Ulrich, A.; Ludwig, C.; Schmutz, P. Flow microcapillary plasma mass spectrometry-based investigation of new Al–Cr–Fe complex metallic alloy passivation. Talanta 2014, 120, 230–238. [Google Scholar] [CrossRef]
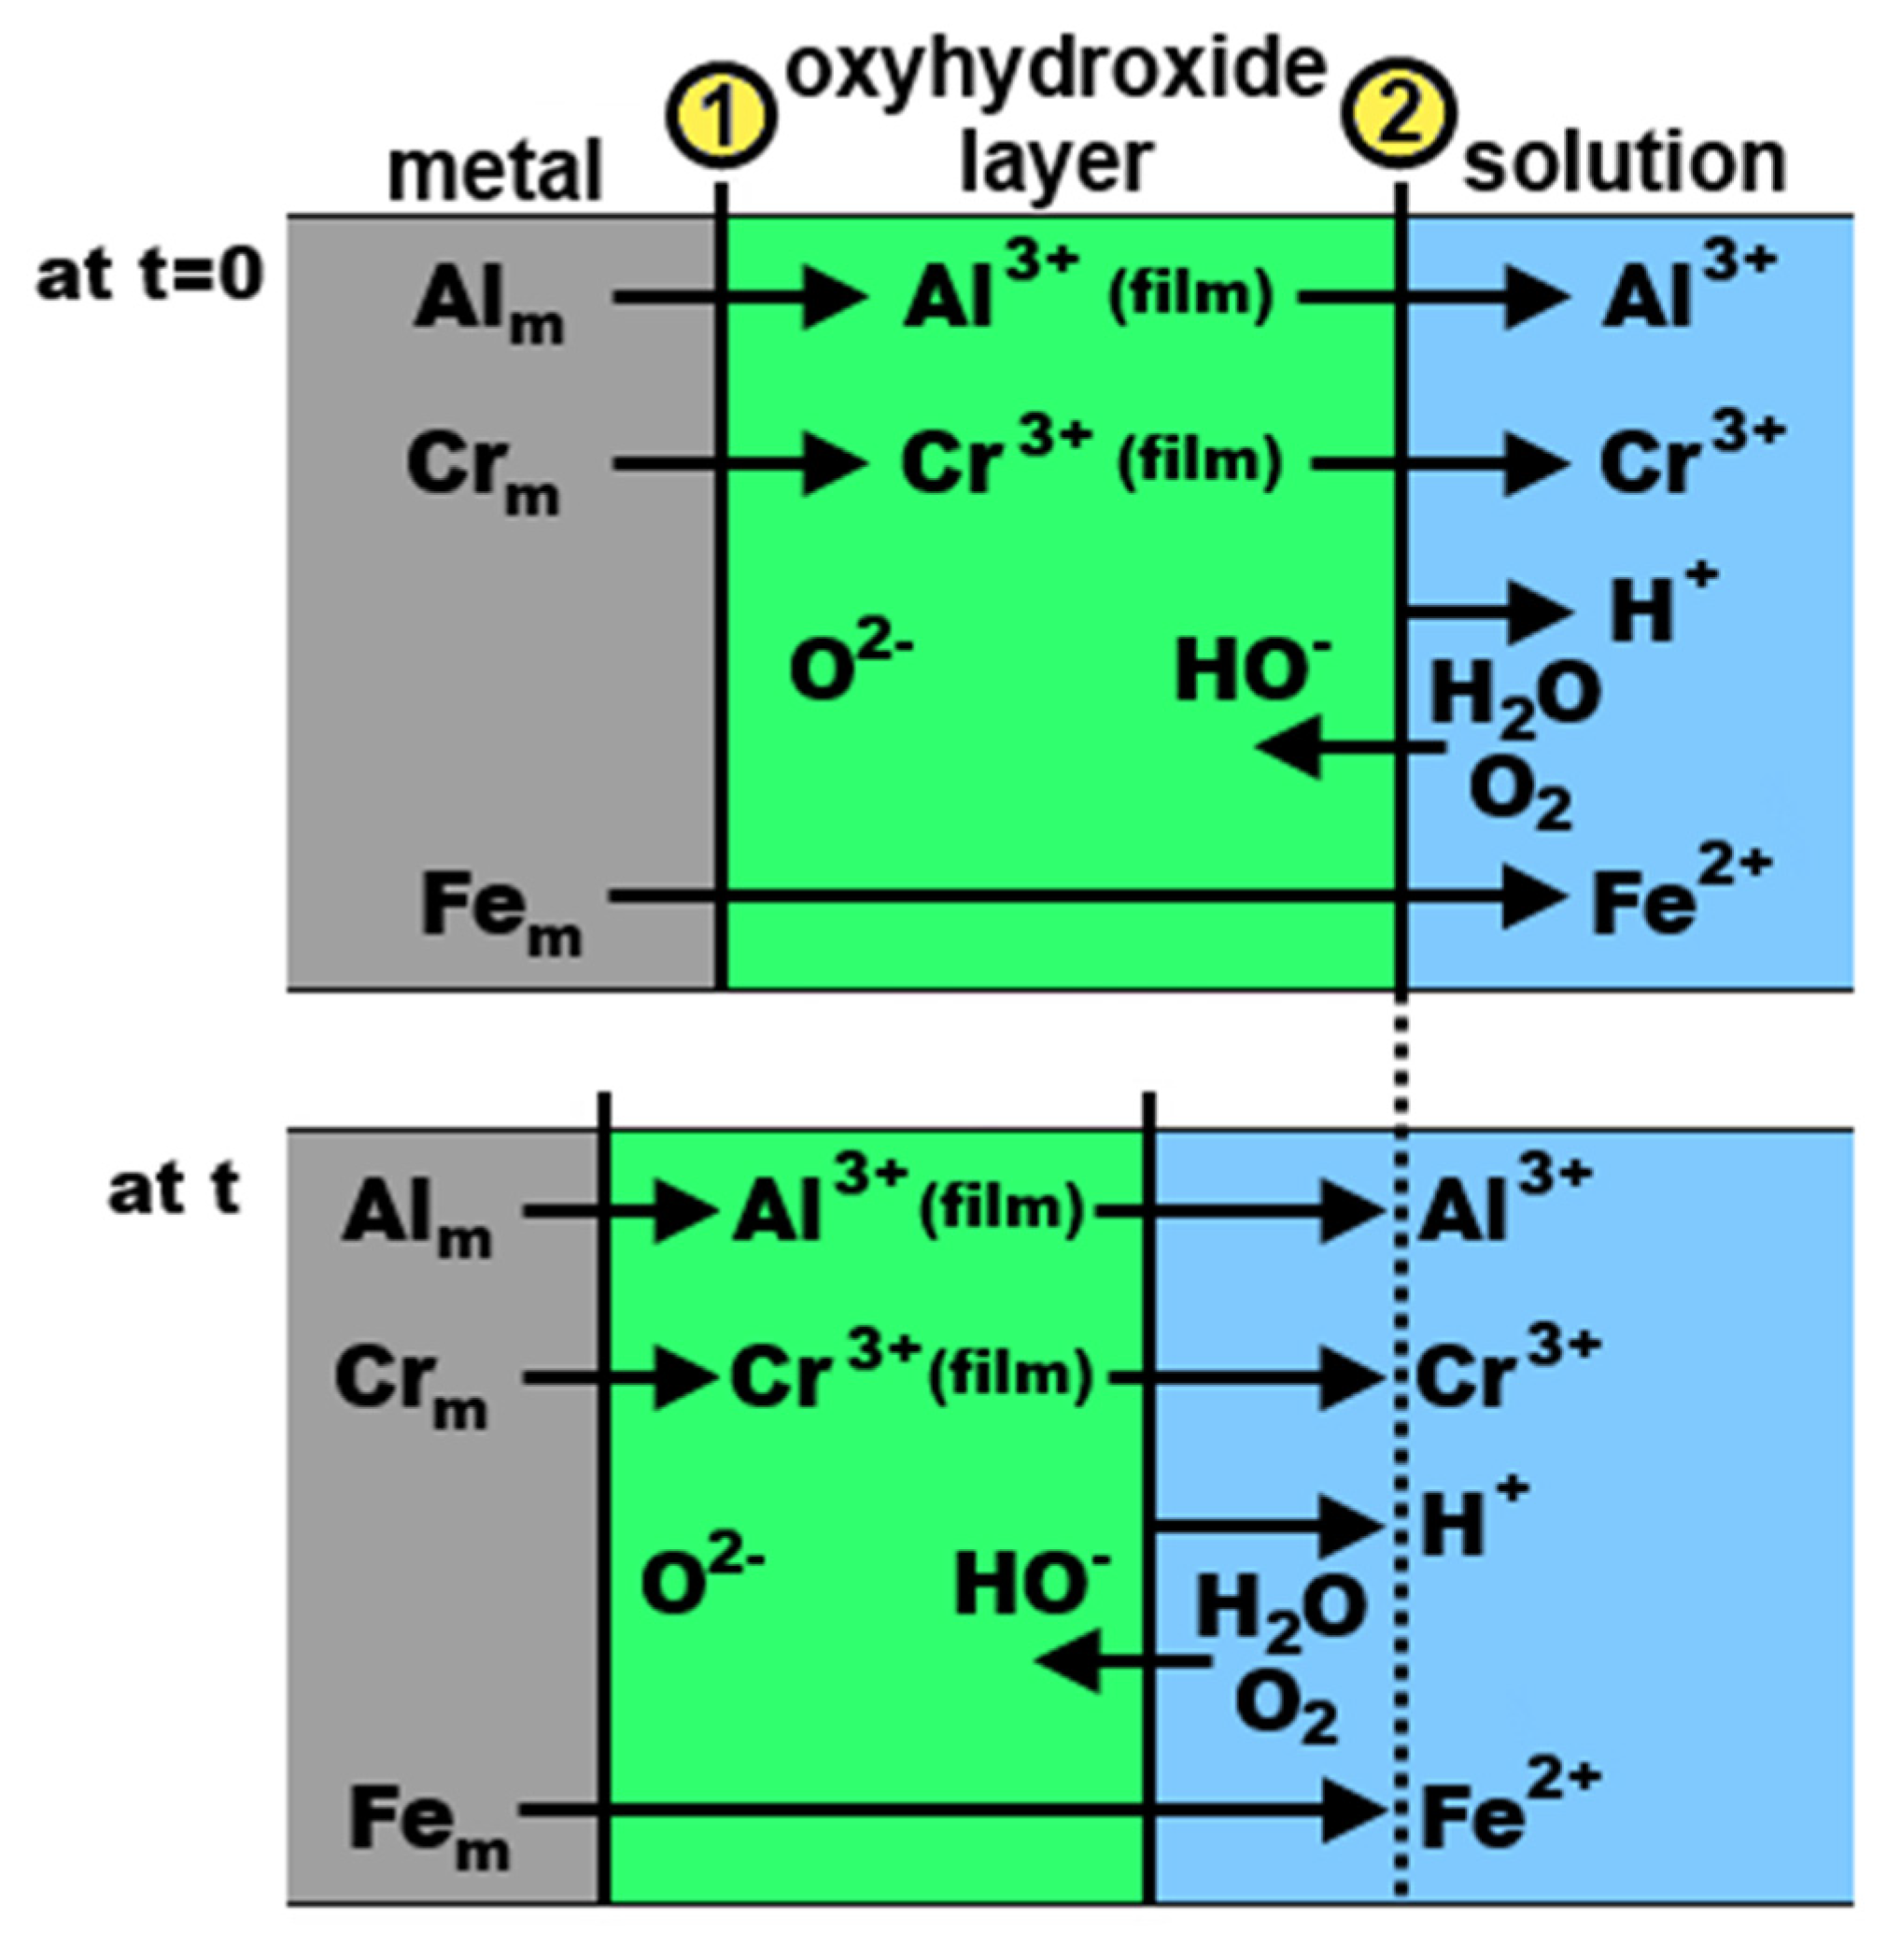
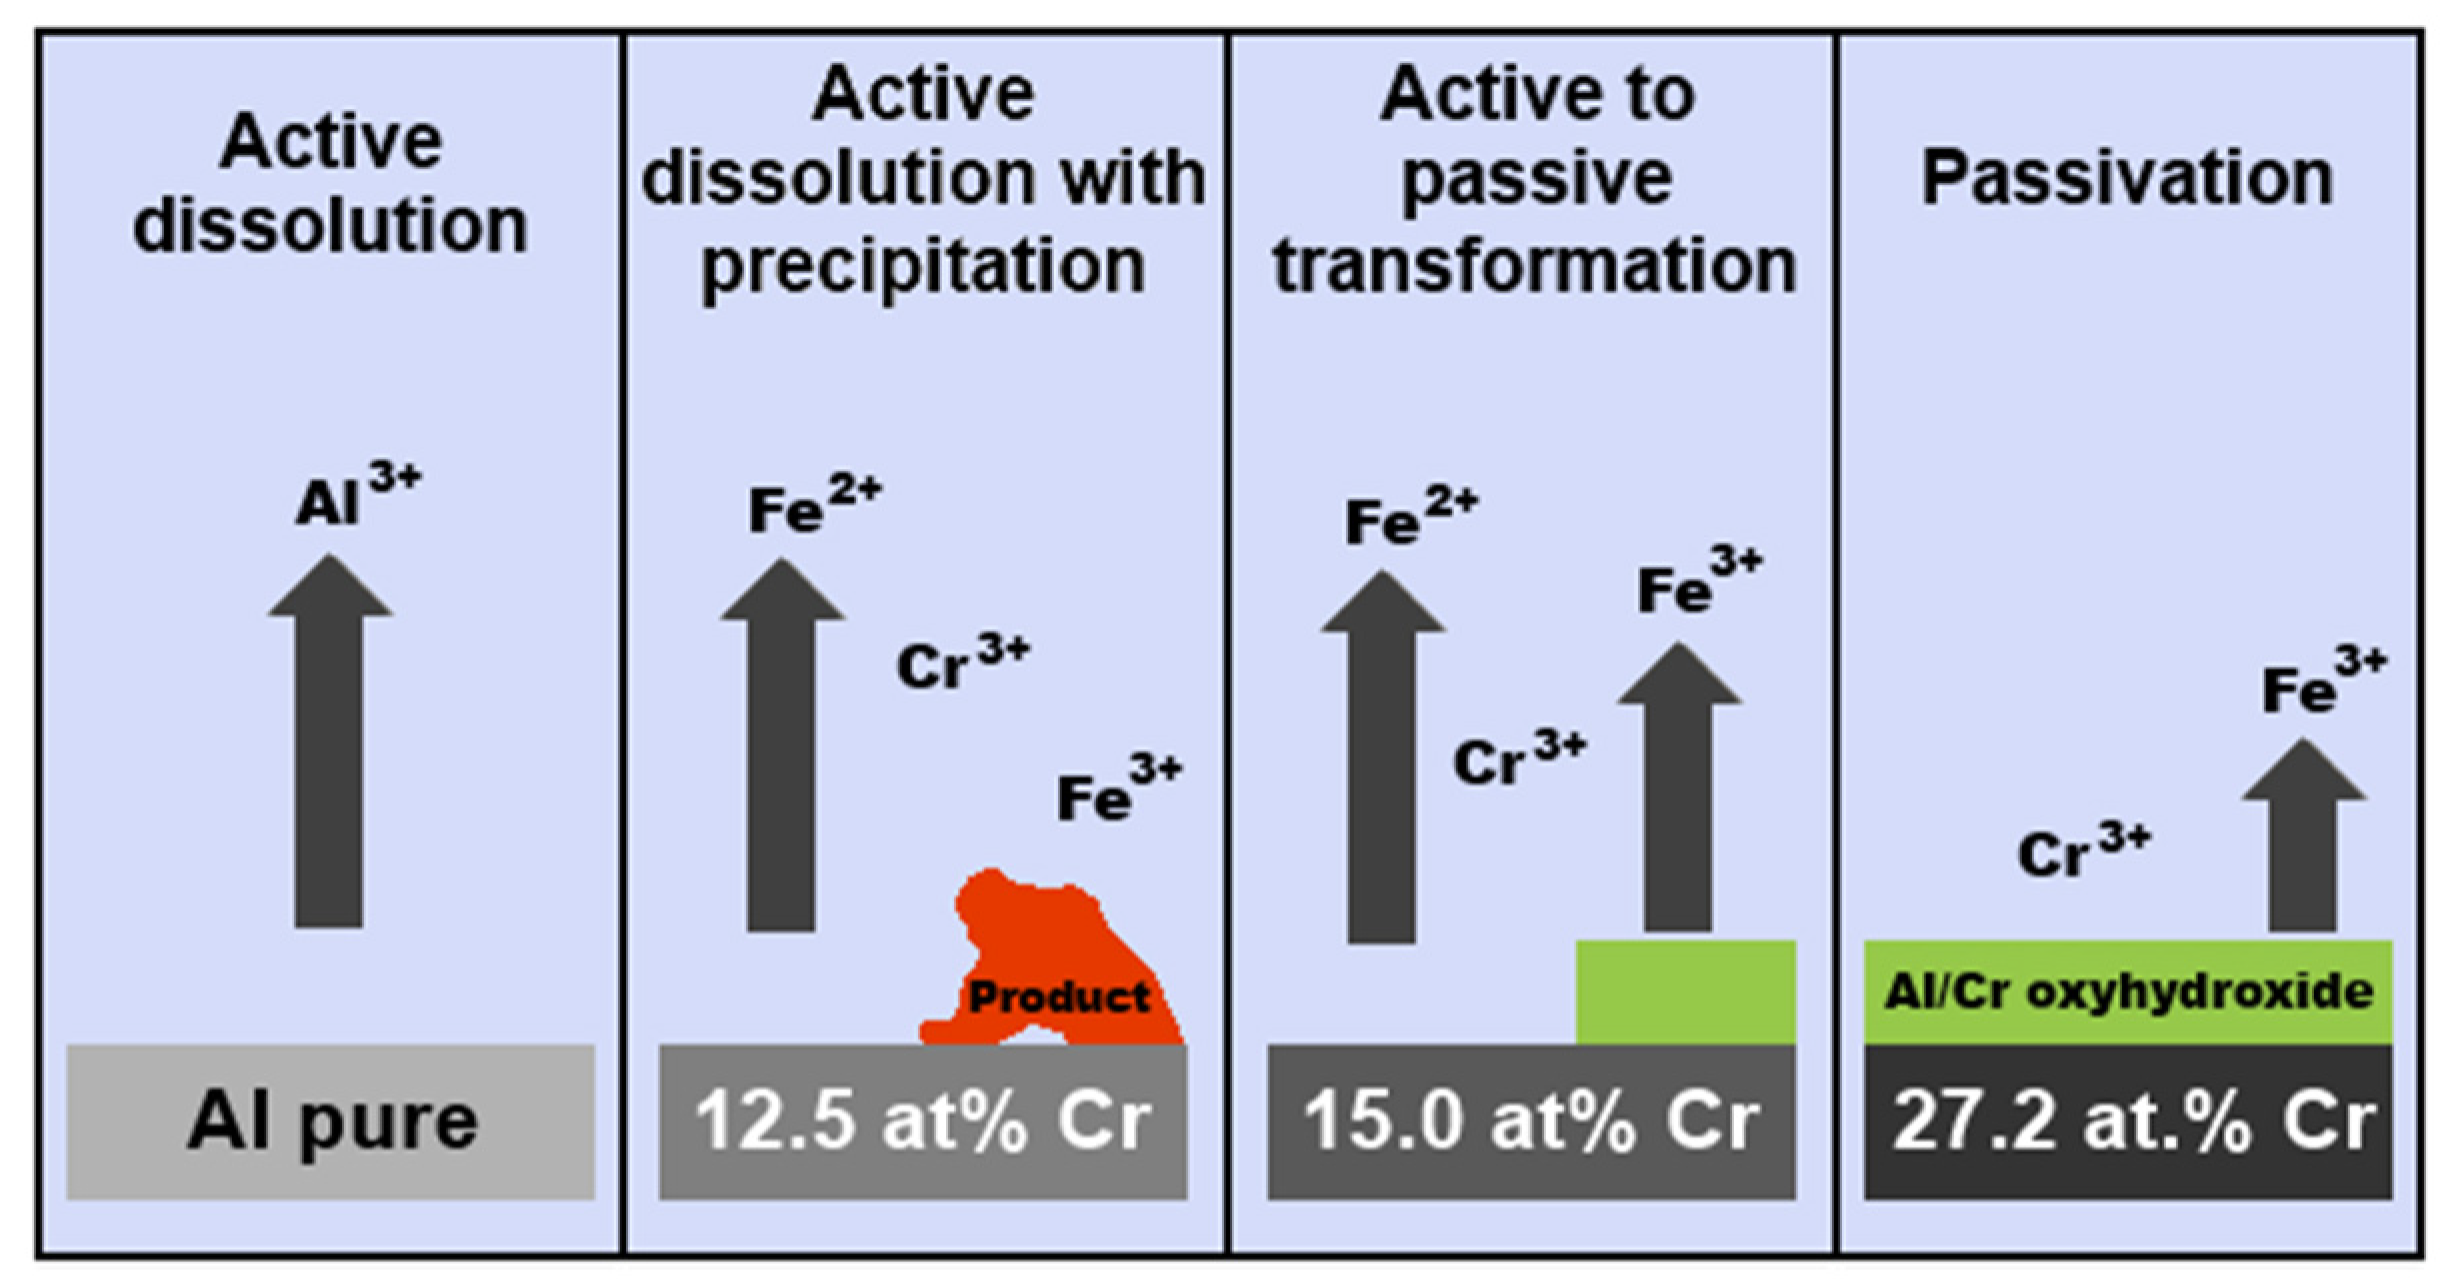
- Beni, A.; Ott, N.; Caporali, S.; Guseva, O.; Schmutz, P. Passivation/precipitation mechanisms of Al-Cr-Fe complex metallic alloys in acidic chloride containing electrolyte. Electrochim. Acta 2015, 179, 411–422. [Google Scholar] [CrossRef]
- Ura-Bińczyk, E.; Homazava, N.; Ulrich, A.; Hauert, R.; Lewandowska, M.; Kurzydlowski, K.J.; Schmutz, P. Passivation of Al-Cr-Fe and Al-Cu-Fe-Cr complex metallic alloys in 1 M H2SO4 and 1 M NaOH solutions. Corros. Sci. 2011, 53, 1825–1837. [Google Scholar] [CrossRef]
- Rüdiger, A.; Köster, U. Corrosion of Al-Cu-Fe quasicrystals and related crystalline phases. J. Non-Cryst. Solids 1999, 250–252, 898–902. [Google Scholar] [CrossRef]
- Huttunen-Saarivirta, E.; Tiainen, T. Corrosion behaviour of Al-Cu-Fe alloys containing a quasicrystalline phase. Mater. Chem. Phys. 2004, 85, 383–395. [Google Scholar] [CrossRef] [Green Version]
- Huttunen-Saarivirta, E. Microstructure, fabrication and properties of quasicrystalline Al–Cu–Fe alloys: A review. J. Alloys Compd. 2004, 363, 150–174. [Google Scholar] [CrossRef]
- Erlebacher, J.; Aziz, M.J.; Karma, A.; Dimitrov, N.; Sieradzki, K. Evolution of nanoporosity in dealloying. Nature 2001, 410, 450–453. [Google Scholar] [CrossRef] [PubMed]
- Battezzati, L.; Scaglione, F. De-alloying of rapidly solidified amorphous and crystalline alloys. J. Alloys Compd. 2011, 509S, S8–S12. [Google Scholar] [CrossRef] [Green Version]
- Yu, J.; Ding, Y.; Xu, C.; Inoue, A.; Sakurai, T.; Chen, M. Nanoporous Metals by Dealloying Multicomponent Metallic Glasses. Chem. Mater. 2008, 20, 4548–4550. [Google Scholar] [CrossRef]
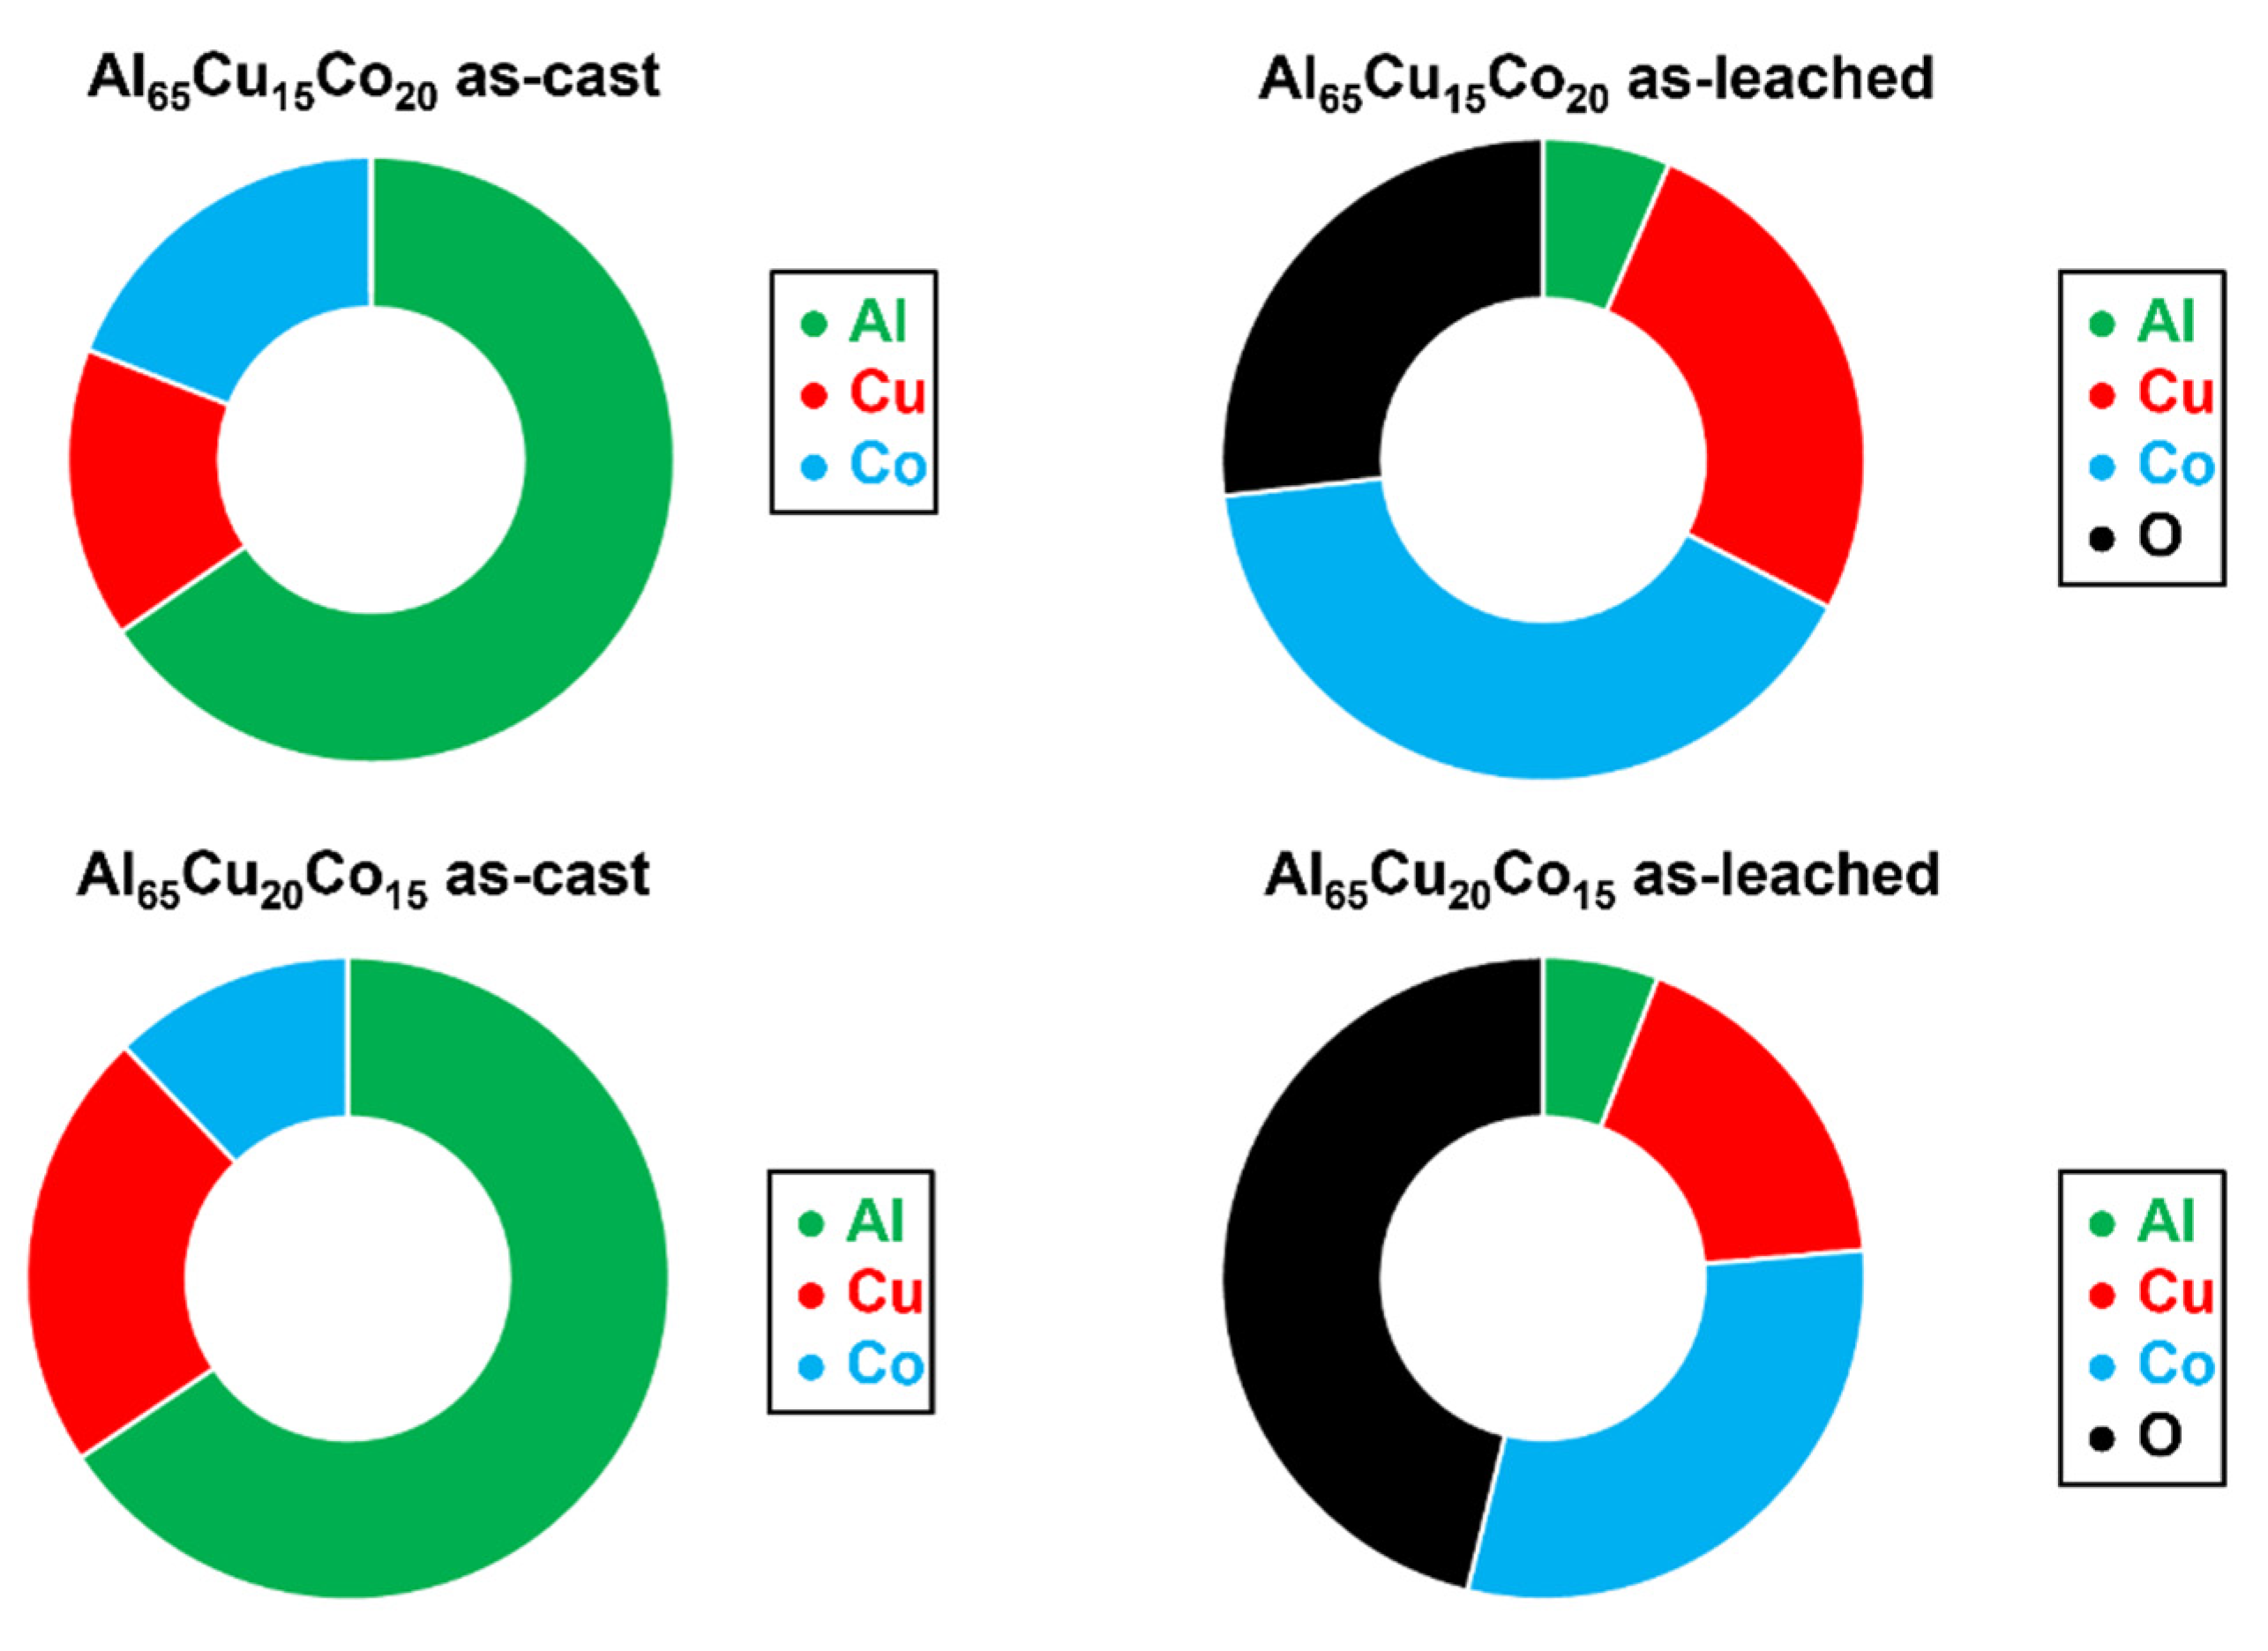
- Mishra, S.S.; Pandey, S.K.; Yadav, T.P.; Srivastava, O.N. Influence of chemical leaching on Al-Cu-Co decagonal quasicrystals. Mater. Chem. Phys. 2017, 200, 23–32. [Google Scholar] [CrossRef]
- Kalai Vani, V.; Kwon, O.J.; Hong, S.M.; Fleury, S.M. Synthesis of porous Cu from Al-Cu-Co decagonal quasicrystalline alloys. Philos. Mag. 2011, 91, 2920–2928. [Google Scholar] [CrossRef]
- Zhang, Q.; Zhang, Z. On the electrochemical dealloying of Al-based alloys in a NaCl aqueous solution. Phys. Chem. Chem. Phys. 2010, 12, 1453–1472. [Google Scholar] [CrossRef]
- Sieradzki, K.; Dimitrov, N.; Movrin, D.; McCall, C.; Vasiljevic, N.; Erlebacher, J. The Dealloying Critical Potential. J. Electrochem. Soc. 2002, 149, B370–B377. [Google Scholar] [CrossRef]
- Palcut, M.; Ďuriška, L.; Špoták, M.; Vrbovský, M.; Gerhátová, Ž.; Černičková, I.; Janovec, J. Electrochemical corrosion of Al-Pd alloys in HCl and NaOH solutions. J. Min. Metall. B 2017, 53, 333–340. [Google Scholar] [CrossRef] [Green Version]
- Ďuriška, L.; Palcut, M.; Špoták, M.; Černičková, I.; Gondek, J.; Priputen, P.; Čička, R.; Janičkovič, D.; Janovec, J. Microstructure, phase occurrence and corrosion behavior of as-solidified and as-annealed Al–Pd alloys. J. Mater. Eng. Perform. 2018, 27, 1601–1613. [Google Scholar] [CrossRef]
- Kelly, R.G.; Scully, J.R.; Shoesmith, D.W.; Buchheit, R.G. Electrochemical Techniques in Corrosion Science and Engineering; Marcel Dekker Inc.: New York, NY, USA, 2003. [Google Scholar] [CrossRef]
- Palcut, M.; Ďuriška, L.; Černičková, I.; Brunovská, S.; Gerhátová, Ž.; Sahul, M.; Čaplovič, Ľ.; Janovec, J. Relationship between Phase Occurrence, Chemical Composition, and Corrosion Behavior of as-Solidified Al–Pd–Co Alloys. Materials 2019, 12, 1661. [Google Scholar] [CrossRef] [Green Version]
- Sukhova, O.V.; Polonskyy, V.A. Structure and corrosion of quasicrystalline cast Al-Co-Ni and Al-Fe-Ni alloys in aqueous NaCl solution. East Eur. J. Phys. 2020, 3, 5–10. [Google Scholar] [CrossRef]
- Babilas, R.; Bajorek, A.; Spilka, M.; Radoń, A.; Łoński, W. Structure and corrosion resistance of Al–Cu–Fe alloys. Prog. Nat. Sci. Mater. 2020, 30, 393–401. [Google Scholar] [CrossRef]
- Debili, M.Y.; Sassane, N.; Boukhris, N. Structure and corrosion behavior of Al-Co-Ti alloy system. Anti Corros. Methods Mater. 2017, 64, 443–451. [Google Scholar] [CrossRef]
- Birbilis, N.; Buchheit, R.G. Electrochemical Characteristics of Intermetallic Phases in Aluminum Alloys: An experimental survey and discussion. J. Electrochem. Soc. 2005, 152, B140–B151. [Google Scholar] [CrossRef] [Green Version]


| Quasiperiodicity | Alloy Systems |
|---|---|
| one-dimensional quasiperiodic arrangement | Al–Ni–Si, Al–Cu–Co, Al–Cu–Mn, Mo–V |
| two-dimensional octagonal quasiperiodic arrangement | Cr–Ni–Si, V–Ni–Si, Mn–Si–Al, Mn–Si, Mn–Fe–Si |
| two-dimensional decagonal quasiperiodic arrangement | Al–Pd, Al–Ir, Al–Os, Al–Pt, Al–Rh, Al–Ru, Al–Fe, Al–Mn, Al–Ni, Al–Ni(Si), Al–Cr(Si), Al–Co, Al–Cu–Mn, Al–Mn–Fe, Al–Cu–Ni, Al–Cu–Co, Al–Co–Ni, V–Ni–Si, Al–Pd–Mn, Al–Pd–Co, Al–Pd–Fe, Al–Pd–Cr, Al–Pd–Os, Al–Pd–Ru, Ga–Fe-Cu–Si, Al–Mn–Fe-Ge, Zn–Ge–Dy |
| two-dimensional dodecagonal quasiperiodic arrangement | V–Ni, Cr–Ni, V–Ni–Si |
| three-dimensional icosahedral quasiperiodic arrangement | Al–Fe, Al–Mn, Al–Re, Al–Ru, Al–W, Al–Mo, Ti–Ni, Al–Cr–Ru, Mn–Ni–Si, Ni–Nb, Al–Cu–Mn, Al–Cu–Fe, Al–Pd–Mn, Zn–Mg–Y |
| Electrode | E0[VSHE] a | Electrode | E0[VSHE] | Electrode | E0[VSHE] |
|---|---|---|---|---|---|
| Au/Au3+ | +1.498 | Ni/Ni2+ | −0.250 | Zn/Zn2+ | −0.763 |
| Pt/Pt2+ | +1.200 | Co/Co2+ | −0.277 | Ti/Ti2+ | −1.630 |
| Pd/Pd2+ | +0.978 | Cd/Cd2+ | −0.403 | Al/Al3+ | −1.662 |
| Ag/Ag+ | +0.799 | Fe/Fe2+ | −0.440 | Mg/Mg2+ | −2.363 |
| Cu/Cu2+ | +0.337 | Cr/Cr3+ | −0.744 | Li/Li+ | −3.045 |
| Electrolyte | pH | Ageing Time[h] | Applied Potential [VSCE] a | Dissolved Passive Film Thickness [nm] | Formed Passive Film Thickness [nm] |
|---|---|---|---|---|---|
| H2SO4 | 0 | 0.5 | OCP b | 106 | |
| H2SO4 | 0 | 0.5 | 0.18 | 55.6 | 8.4 |
| H2SO4 | 0 | 0.5 | 0.68 | 153 | 6.9 |
| H2SO4 | 0 | 3 | OCP | 116 | |
| HCl | 2 | 0.5 | OCP | 880 | |
| HCl | 2 | 0.5 | 0.18 | 147 | 24.6 |
| Alloy | θ–Al2Cu | ψ–Al65Cu20Fe15 | β–AlFe | λ–Al13Fe4 | ||||||||
|---|---|---|---|---|---|---|---|---|---|---|---|---|
| Al | Cu | Fe | Al | Cu | Fe | Al | Cu | Fe | Al | Cu | Fe | |
| Al60Cu27.5Fe12.5 | 49.8 | 49.5 | 0.7 | 65.2 | 22.5 | 12.3 | 67.6 | 32.2 | 0.2 | 73.4 | 4.5 | 22.1 |
| Al62.5Cu25Fe12.5 | 47.2 | 52.3 | 0.5 | 62.0 | 27.4 | 10.6 | 65.7 | 33.9 | 0.4 | 71.8 | 7.5 | 20.7 |
| Al65Cu20Fe15 | 51.5 | 47.7 | 0.8 | 65.3 | 22.9 | 11.8 | 68.3 | 31.4 | 0.3 | 73.7 | 4.3 | 22.0 |
| Al67.5Cu20Fe12.5 | 66.4 | 33.0 | 0.6 | 70.3 | 20.1 | 9.6 | 93.8 | 5.8 | 0.4 | 73.7 | 3.4 | 22.9 |
| Alloy | Condition | Electrolyte | Ecorr [mV vs. Ag/AgCl] | jcorr [A m−2] | Reference |
|---|---|---|---|---|---|
| Al96.7Co3.3 | Cast | Aerated NaCl (0.6 mol dm−3) | −838 ± 20 | 0.7 ± 0.1 | [79] |
| Al96.7Co3.3 | Arc-melted | Aerated NaCl (0.6 mol dm−3) | −820 ± 36 | 0.3 ± 0.1 | [79] |
| Al96.7Co3.3 | Powder-metallurgy sintered | Aerated NaCl (0.6 mol dm−3) | −890 ± 50 | 0.9 ± 0.2 | [79] |
| Al96.7Co3.3 | Cast | Aerated NaCl (0.6 mol dm−3) | −820 ± 36 | 0.3 ± 0.1 | [81] |
| Al95.1Co4.9 | Cast | Aerated NaCl (0.6 mol dm−3) | −823 ± 23 | 0.6 ± 0.1 | [81] |
| Al92.5Co7.5 | Cast | Aerated NaCl (0.6 mol dm−3) | −799 ± 23 | 0.7 ± 0.1 | [81] |
| Al89.7Co10.3 | Cast | Aerated NaCl (0.6 mol dm−3) | −816 ± 23 | 0.9 ± 0.1 | [81] |
| Al82.3Co17.7 | Cast | Aerated NaCl (0.6 mol dm−3) | −843 ± 16 | 1.6 ± 0.1 | [82] |
| Al82.3Co17.7 | Arc-melted | Aerated NaCl (0.6 mol dm−3) | −825 ± 18 | 0.8 ± 0.1 | [82] |
| Al82.3Co17.7 | Powder-metallurgy sintered | Aerated NaCl (0.6 mol dm−3) | −877 ± 23 | 5.8 ± 0.6 | [82] |
| Al99.1Co0.9 | Arc-melted | Aerated H2SO4 (1 mol dm−3) | −400 ± 7 | 1.9 ± 0.3 | [80] |
| Al97.6Co2.4 | Arc-melted | Aerated H2SO4 (1 mol dm−3) | −406 ± 2 | 3.6 ± 0.6 | [80] |
| Al96.7Co3.3 | Arc-melted | Aerated H2SO4 (1 mol dm−3) | −388 ± 10 | 2.6 ± 0.6 | [80] |
| Al95.1Co4.9 | Arc-melted | Aerated H2SO4 (1 mol dm−3) | −390 ± 5 | 1.9 ± 0.6 | [80] |
| Al92.5Co7.5 | Arc-melted | Aerated H2SO4 (1 mol dm−3) | −381 ± 18 | 3.1 ± 0.8 | [80] |
| Al89.3Co10.3 | Arc-melted | Aerated H2SO4 (1 mol dm−3) | −372 ± 7 | 2.9 ± 0.4 | [80] |
| Al76Co24 | Cast | Aerated NaCl (0.6 mol dm−3) | −706 | 0.13 | [84] |
| Al75Co25 | Cast | Aerated NaCl (0.6 mol dm−3) | −729 | 0.039 | [84] |
| Al74Co26 | Cast | Aerated NaCl (0.6 mol dm−3) | −515 | 0.58 | [84] |
| Al73Co27 | Cast | Aerated NaCl (0.6 mol dm−3) | −646 | 0.05 | [84] |
| Al72Co28 | Cast | Aerated NaCl (0.6 mol dm−3) | −672 | 0.04 | [84] |
| Al71Co29 | Cast | Aerated NaCl (0.6 mol dm−3) | −530 | 0.10 | [83] |
| Al74Co26 | Annealed in Ar 1050 °C 330 h | Aerated NaCl (0.6 mol dm−3) | −651 | 0.051 | [86] |
| Al74Co26 | Annealed in Ar 1050 °C 330 h | Aerated HCl (0.01 mol dm−3) | −314 | 0.032 | [86] |
| Al74Co26 | Annealed in Ar 1050 °C 330 h | Aerated NaOH (0.01 mol dm−3) | −1026 | 2.6 | [86] |
| Al72Fe15Ni13 | Cast | Aerated NaCl (0.87 mol dm−3) | - | 1.4 | [108] |
| Al69Co21Ni10 | Cast | Aerated NaCl (0.87 mol dm−3) | - | 1.2 | [108] |
| Al70Cr20Fe10 | Powder metallurgy sintered | Aerated NaCl (0.6 mol dm−3) | −938 | 0.018 | [90] |
| Al65Cu20Fe15 | Cast | NaCl (0.6 mol dm−3) | −638 ± 100 | 0.37 | [109] |
| Al78Cu7Fe15 | Cast | NaCl (0.6 mol dm−3) | −586 ± 100 | 0.056 | [109] |
| Al80Cu5Fe14Si1 | Cast | NaCl (0.6 mol dm−3) | −570 ± 100 | 0.14 | [109] |
| Al70Cu9Fe10.5Cr10.5 | Cast | Na2SO4 (0.5 mol dm−3) | −556 | 1.6 × 10⁻² | [35] |
| Al64Cu24Fe12 | Cast | Na2SO4 0.5 mol dm−3) | −555 | 7.3 × 10⁻² | [35] |
| Al63Cu20Co15Si2 | Cast | Na2SO4 (0.5 mol dm−3) | −635 | 2.2 × 10⁻² | [35] |
| Al70Cu9Fe10.5Cr10.5 | Cast | Na2SO4 (0.5 mol dm−3) + H2SO4 (pH 2) | −496 | 1.4 × 10⁻² | [35] |
| Al64Cu24Fe12 | Cast | Na2SO4 (0.5 mol dm−3) + H2SO4 (pH 2) | −512 | 0.8 × 10⁻² | [35] |
| Al63Cu20Co15Si2 | Cast | Na2SO4 (0.5 mol dm−3) + H2SO4 (pH 2) | −186 | 0.6 × 10⁻² | [35] |
| Al70Cu9Fe10.5Cr10.5 | Cast | NaOH (0.1 mol dm−3) | −921 | 1.6 × 10⁻² | [35] |
| Al64Cu24Fe12 | Cast | NaOH (0.1 mol dm−3) | −1508 | 336 × 10−2 | [35] |
| Al63Cu20Co15Si2 | Cast | NaOH (0.1 mol dm−3) | −1441 | 462 × 10−2 | [35] |
| Al72Pd20Mn8 | Annealed in Ar
800 °C 12 h | Deaerated NaCl (0.5 mol dm−3) | −355 | 0.5 | [36] |
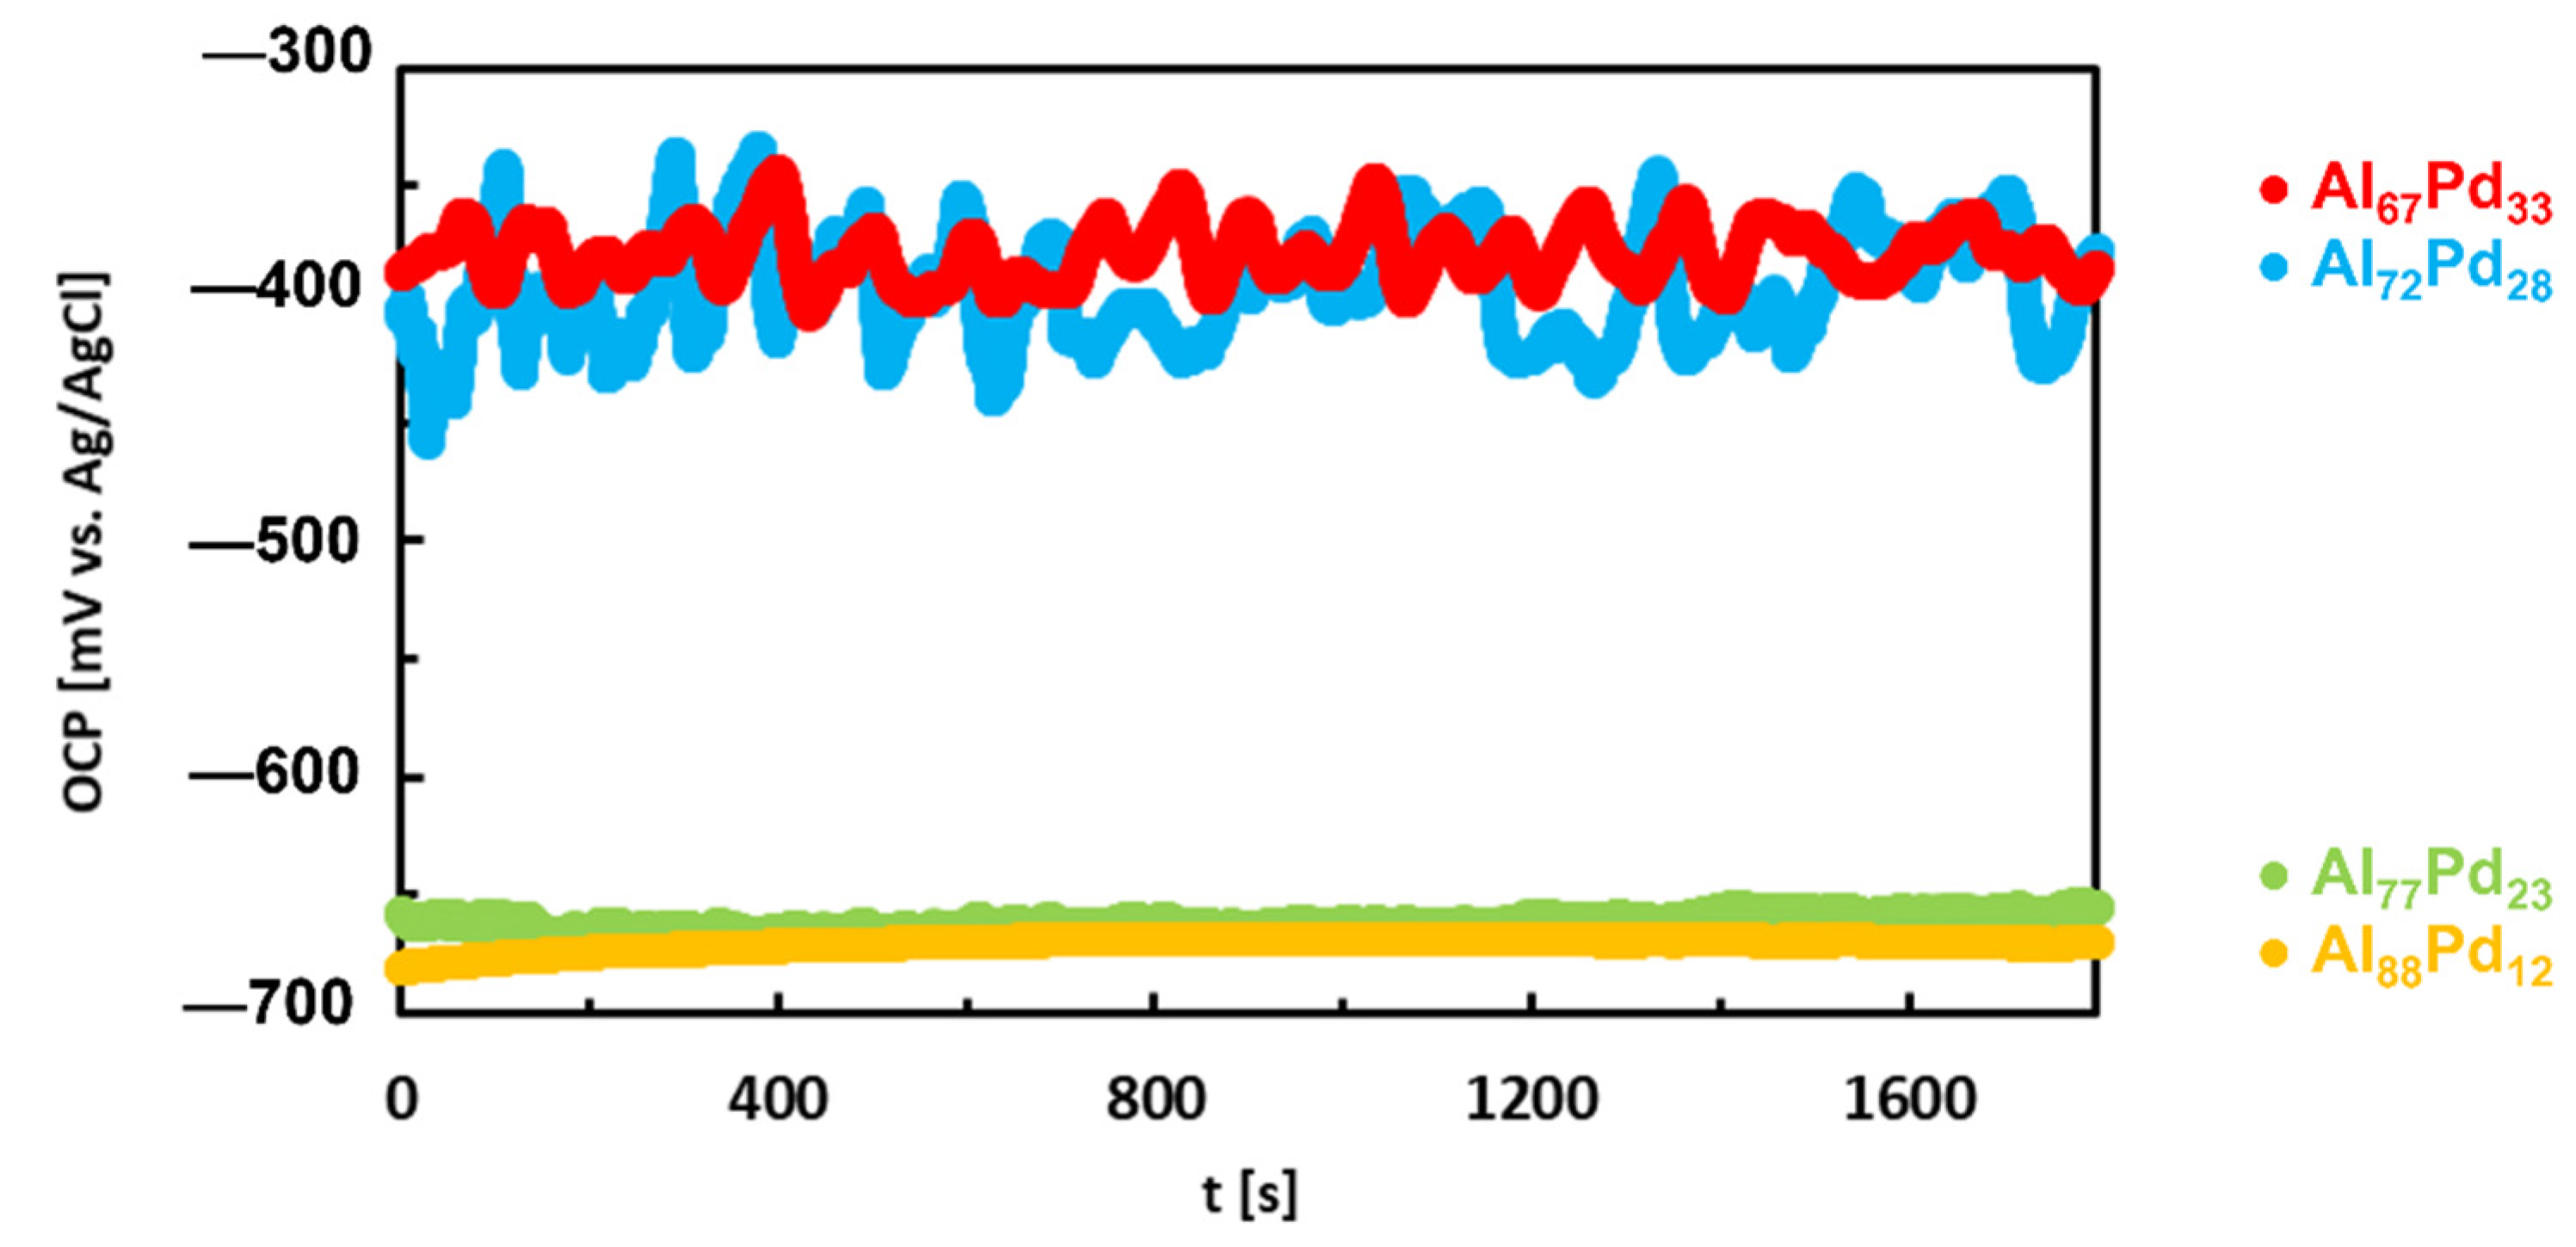
| Al88Pd12 | Cast | Aerated NaCl (0.6 mol dm−3) | −794 | 0.89 | [105] |
| Al77Pd23 | Cast | Aerated NaCl (0.6 mol dm−3) | −809 | 0.82 | [105] |
| Al72Pd28 | Cast | Aerated NaCl (0.6 mol dm−3) | −797 | 0.63 | [105] |
| Al67Pd33 | Cast | Aerated NaCl (0.6 mol dm−3) | −798 | 0.62 | [105] |
| Al77Pd23 | Annealed in Ar 700 °C 500 h | Aerated NaCl (0.6 mol dm−3) | −763 | 0.75 | [105] |
| Al72Pd28 | Annealed in Ar 700 °C 500 h | Aerated NaCl (0.6 mol dm−3) | −841 | 0.68 | [105] |
| Al67Pd33 | Annealed in Ar 700 °C 500 h | Aerated NaCl (0.6 mol dm−3) | −783 | 0.72 | [105] |
| Al88Pd12 | Cast | Aerated HCl (0.01 mol dm−3) | −478 | 0.26 | [104] |
| Al77Pd23 | Cast | Aerated HCl (0.01 mol dm−3) | −450 | 0.27 | [104] |
| Al72Pd28 | Cast | Aerated HCl (0.01 mol dm−3) | −253 | 0.03 | [104] |
| Al67Pd33 | Cast | Aerated HCl (0.01 mol dm−3) | −200 | 0.17 | [104] |
| Al88Pd12 | Cast | Aerated NaOH (0.01 mol dm−3) | −1019 | 0.42 | [104] |
| Al77Pd23 | Cast | Aerated NaOH (0.01 mol dm−3) | −1033 | 0.25 | [104] |
| Al72Pd28 | Cast | Aerated NaOH (0.01 mol dm−3) | −879 | 0.25 | [104] |
| Al67Pd33 | Cast | Aerated NaOH (0.01 mol dm−3) | −892 | 0.34 | [104] |
| Al70Pd25Co5 | Cast | Aerated NaCl (0.6 mol dm−3) | −677 | 0.10 | [107] |
| Al74Pd12Co14 | Cast | Aerated NaCl (0.6 mol dm−3) | −758 | 0.18 | [107] |
| Al93Co5Ti2 | Powder metallurgy sintered | Aerated NaCl (0.6 mol dm−3) | −707 | 1.1 | [110] |
| Al88Co10Ti2 | Powder metallurgy sintered | Aerated NaCl (0.6 mol dm−3) | −676 | 14 | [110] |
| Al83Co15Ti2 | Powder metallurgy sintered | Aerated NaCl (0.6 mol dm−3) | −490 | 4.0 × 10⁻⁴ | [110] |
| Al78Co20Ti2 | Powder metallurgy sintered | Aerated NaCl (0.6 mol dm−3) | −669 | 2.39 | [110] |
| Al73Co25Ti2 | Powder metallurgy sintered | Aerated NaCl (0.6 mol dm−3) | −661 | 0.64 | [110] |
| Al68Co30Ti2 | Powder metallurgy sintered | Aerated NaCl (0.6 mol dm−3) | −649 | 7.0 | [110] |
Publisher’s Note: MDPI stays neutral with regard to jurisdictional claims in published maps and institutional affiliations. |
© 2021 by the authors. Licensee MDPI, Basel, Switzerland. This article is an open access article distributed under the terms and conditions of the Creative Commons Attribution (CC BY) license (https://creativecommons.org/licenses/by/4.0/).
Share and Cite
Ďuriška, L.; Černičková, I.; Priputen, P.; Palcut, M. Aqueous Corrosion of Aluminum-Transition Metal Alloys Composed of Structurally Complex Phases: A Review. Materials 2021, 14, 5418. https://doi.org/10.3390/ma14185418
Ďuriška L, Černičková I, Priputen P, Palcut M. Aqueous Corrosion of Aluminum-Transition Metal Alloys Composed of Structurally Complex Phases: A Review. Materials. 2021; 14(18):5418. https://doi.org/10.3390/ma14185418
Chicago/Turabian StyleĎuriška, Libor, Ivona Černičková, Pavol Priputen, and Marián Palcut. 2021. "Aqueous Corrosion of Aluminum-Transition Metal Alloys Composed of Structurally Complex Phases: A Review" Materials 14, no. 18: 5418. https://doi.org/10.3390/ma14185418