Article

Effect of Metal Content on Ethanol Decomposition over Ni-Co Catalysts Supported on La-Ce Oxides

by
Harold R. Vergara
1,
Maria H. Brijaldo
1,2,
José J. Martinez
1,
Hugo A. Rojas
1,
José Pedraza
2,
Fabio B. Passos
3,
Luiz Pereira da Costa
4,
Daniela Gonzalez-Vera
5 and
Paula Osorio-Vargas
5,6,*
1
Grupo de Catálisis (GC-UPTC), Universidad Pedagógica y Tecnológica de Colombia UPTC, Avenida Central del Norte, Vía Paipa, Tunja 150001, Colombia
2
Grupo de Investigación en Gestión Administrativa y Empresarial Sostenible (GIGAS), Universidad Pedagógica y Tecnológica de Colombia UPTC, Avenida Central del Norte, Vía Paipa, Tunja 150001, Colombia
3
Laboratório de Reatores, Cinética e Catalise (RECAT), Departamento de Engenharia Química e de Petróleo, Universidade Federal Fluminense, Niterói 24210-240, Brazil
4
Graduate Program in Science and Technology for Amazon Resources (PPGCTRA)-Institute of Exact Sciences and Technology (ICET/UFAM), ItcRua: Nossa Senhora do Rosario, 3863, Tiradentes, Itacoatiara-Amazonas 69103-208, Brazil
5
Grupo de Investigación en Fotocatálisis y Estado Sólido (GIFES), Escuela de Química, Universidad Tecnológica de Pereira, 660003 Pereira, Colombia
6
Laboratory of Thermal and Catalytic Processes (LPTC), Department of Chemical Engineering, University of Bío-Bío, Concepción 4081112, Chile
*
Author to whom correspondence should be addressed.
Materials 2020, 13(3), 759; https://doi.org/10.3390/ma13030759
Submission received: 16 December 2019 / Revised: 23 January 2020 / Accepted: 3 February 2020 / Published: 7 February 2020

Abstract

:
The search for catalysts with features that can improve coke resistance and decrease byproduct formation is a current goal in H2 production from renewable sources. In this work, the effect of the presence of Ni nanoparticles over Co/La-Ce oxides on the ethanol decomposition reaction was studied. Catalysts were synthetized using as precursor a La0.8Ce0.2NixCo1-xO3 perovskite-type material to ensure a low segregation of phases and a high dispersion of metals. After reduction at 873 K, the perovskite structure was destroyed, and metal Co-Ni particles were supported over a lanthanum-cerium oxide. The materials were characterized by different techniques before and after reaction. Solids exhibited metal particle sizes between 5 and 15 nm demonstrating the advantages of the preparation method to obtain Ni-Co alloys. Although the results of adsorption of ethanol followed by diffuse reflectance infrared fourier transformed spectroscopy (DRIFTS) showed acetate species strongly adsorbed on the catalyst’s surface, the material (Ni0.7Co0.3/La0.8Ce0.2) with the lowest particle size was the most stable system leading to the lowest amount of carbon deposits during ethanol decomposition. This catalyst showed the better performance, with a higher ethanol conversion (98.4%) and hydrogen selectivity (75%). All catalysts exhibited carbonaceous deposits, which were an ordered and disordered carbon phase mixture.

1. Introduction

Currently, fossil fuels such as coal, oil, and natural gas are the conventional energy sources. Their continuous use can negatively affect the environment. For this reason, sustainable and renewable energy sources are necessary in order to reduce pollutant emissions and preserve the environment. Within these renewable energies, H2 seems to be a promising fuel which can be obtained from several byproducts originated from biomass conversion. For instance, ethanol, which can be produced by simultaneous saccharification and fermentation (SSF) [1], exhibits interesting features as a H2 source. Several chemical processes such as ethanol steam reforming (ESR), partial oxidation (POE), oxidative steam reforming (OSPE), and catalytic ethanol decomposition (ED) have been evaluated for H2 production. In particular, ED (Equation (1)) shows interesting characteristics since it is an endothermic reaction (∆H° = 49.6 kJ mol−1) requiring less energy than the more widely studied ESR process (∆H° = 173.5 kJ mol−1). However, as is the case with ESR, ED exhibits some drawbacks related to the existence of simultaneous reactions such as the Boudouard reaction (Equation (2)) and methane decomposition (Equation (3)), which could lead to catalyst deactivation by deposition of carbonaceous species [2].
C H 3 C H 2 O H     C H 4 + C O + H 2 Δ H ° = kJ   mol 1
2 C O     C O 2 + C Δ H ° = 172.6   kJ   mol 1
C H 4     C + 2 H 2 Δ H ° = 74.9   kJ   mol 1
At low temperatures, where reaction (2) is more important, the catalyst can be deactivated through the formation of amorphous carbon deposits covering the metal particles. When the reaction is carried out at high temperatures (>600 °C), reaction (3) becomes important, participating as well in the formation of carbonaceous species. However, on Ni and Co particles, this deposited carbon nucleates the growth of carbon filaments do not lead to total catalyst deactivation, since these filaments can push off the metal particles from the support leaving the metal accessible to reactants and exhibiting a minor deactivating effect [3].
Therefore, one of the main drawbacks to overcome so that this kind of process can be considered a viable route for the clean production of H2 is related to the stability and resistance of the catalysts toward coke formation. This can be achieved by a catalyst tailored to reduce coke formation or favor its rapid conversion into gaseous byproducts. In the literature, several approaches have been proposed to achieve this goal: (i) use of a support which can help carbon removal, (ii) particle ensemble size control, and (iii) addition of a second metal in order to improve modifications in catalytic performance. Regarding this last approach, a recent study highlighted a marked improvement in catalyst stability when 1%Rh was added to 10%Ni/Al2O3 promoted with La2O3 and CeO2 [4]. In that case, deposition of carbon decreased by 560 times compared with the Ni catalyst. In contrast, controlling the ensemble size seeks to inhibit carbon formation since a critical ensemble size is necessary for its formation. ESR measurements performed by Rostrup-Nielsen [5] showed that this reaction needs ensembles of 3 or 4 atoms, whereas carbon formation requires 6 or 7 atoms. Hence, particle size can influence carbon nucleation. In the search to control the particle ensemble size, catalysts using layered double hydroxide (LDH) and perovskite-type structures (ABO3) as precursors have been investigated [6,7,8,9,10]. Reduction of LDH or perovskite-type structures leads to high dispersion on corresponding oxides. Manukyan et al. [7] obtained a Ni/Al2O3 system from the reduction of a Ni-Al hydrotalcite-type material. Those authors evaluated the deactivation of Ni-Al2O3-LDH and Ni/Al2O3 catalysts in the ethanol decomposition reaction. The XPS results showed that the amount of carbon increased up to 48% after 100 h time on stream (TOS) and 2 h TOS for Ni-Al2O3-LDH and Ni/Al2O3, respectively, which was related to the load and size of the metal particles. The 80%Ni-Al2O3-LDH catalyst exhibited nickel with small particle sizes having diameters around 3–5 nm, whereas Ni particles on the 10%Ni/Al2O3 catalyst were around 7–15 nm. Gallego et al. [9] also obtained Ni nanoparticles (15 nm, mean diameter) highly dispersed on La2O3 when prepared by reduction of LaNiO3 perovskite. This catalyst was very active for the ethanol decomposition reaction to H2 production and carbon nanotubes. In general, an important number of studies based on supported metal catalysts (Ni, Co, and Fe) on different supports such as La2O3, CeZrO2, MgO, Al2O3, CeO2, and graphite for H2 production by ethanol decomposition have been published [7,8,9,11,12,13,14,15,16,17,18,19,20]. In fact, some studies have been focusing on both H2 production and carbon nanotube (CNT) production instead of the removal of carbonaceous deposits on metallic particles [9,15,16,17,18,19].
Taking into account the above-mentioned strategies to improve catalyst activity and stability by decreasing carbon deposition, the goal of this research was to study the effect of a second metal presence (Ni) in Co/La-Ce oxide catalysts prepared from a perovskite-type La0.8Ce0.2NixCo1-xO3 precursor for the ethanol decomposition reaction. This preparation method may favor the formation of small metal particles. The active phase was modified with different Ni and Co amounts to study a possible synergistic effect between both metals, since each one has already exhibited a good performance individually on catalytic ethanol decomposition. Their oxophilic nature favors O-H bond activation of ethanol [21]. Mixed La-Ce oxides were selected in the search for supports that increase catalyst stability, as both oxides have been used with excellent results in this type of reaction [9,20,22]. The lattice oxygen of CeO2 can react with adsorbed hydrocarbons on surface, producing synthesis gas and thus preventing the formation of carbon species from hydrocarbon decomposition reactions (CmHm → nC + m/2H2) [20]. The effect of Co and Ni metal amounts on the physico-chemical catalyst properties, H2 production, and carbon depositions in the reaction of ethanol decomposition at a temperature range from 303 K to 973 K was evaluated.

2. Materials and Methods

2.1. Catalyst Synthesis and Characterization

Perovskites were prepared by the polymeric precursor method or Pechini method [23] that allows, in general, to obtain a homogeneous organometallic polymer where metal is located in the polymer’s main chain. The cation salts (La(NO3)3·6H2O, Ce(NO3)3·6H2O, NiCl2·6H2O, and CoCl2·6H2O) were mixed with the suitable amounts to obtain the La0.8Ce0.2NixCo1-xO3 (x = 0, 0.1, 0.4, and 0.7) perovskites and then were added to a solution of citric acid (CA) and ethylene glycol (EG). The ratio molar of CA:EG:metal ions was of 6:3:1. The prepared solution was slowly heated to 353 K under constant stirring until gel formation. The resulting resin containing cations was further heated to 623 K for 3 h yielding a fine powder. This material was calcined at 773 K for 1 h and then at 973 K for 6 h (5 K min−1). Perovskite precursors were subsequently transformed to metal catalysts supported on oxides of Ce and La, by reduction under H2 flow (30 mL min−1) at 873 K for 2 h. After this, the samples were passivated, using an O2(1%)/He mixture for 0.5 h at N2 liquid temperature to carry out some characterization techniques.
The textural properties were obtained from N2 physisorption analysis at 77 K in an ASAP 2020 Micromeritics instrument (Micromeritics Instrument Corp., Norcross, GA, USA). The passivated catalysts were treated at 593 K for 12 h and outgassed at 393 K for 2 h under N2 flow. The surface area values were determined from the Brunauer-Emmett-Teller model (BET model) and the pore-size distributions were calculated from the N2 adsorption branch using the Barrett, Joyner, and Halenda method (BJH method). X-ray diffraction (XRD) analyses were performed on a Rigaku Miniflex II instrument (Rigaku Corporation, Tokyo, Japan) with Cu K radiation (kα = 0.154 nm) using a 0.05° step size. H2 chemisorption was studied to determine metallic dispersion assuming an adsorption stoichiometry of H/M = 1. A typical protocol was followed, the solids dried at 473 K for 1 h (30 mL min−1) were posteriorly reduced under in situ H2 (30 mL min−1) for 2 h at 873 K in a Micromeritics ASAP 2020 instrument (Micromeritics Instrument Corp.). Afterward, the surface was cleaned under He flow at the same temperature for 1 h at 873 K. Then, the systems were brought to room temperature and total hydrogen isotherms were acquired. To determine the total acidity, the solids previously purged were submitted to adsorption of ammonia saturated at 383 K in 10%NH3/He flow (30 mL min−1). Temperature-programmed desorption was performed using a heating rate of 10 K min−1, from room temperature until reaching 1173 K.
Temperature-programmed reduction (TPR) analysis was performed in a Micromeritics Autochem 2920 analyzer (Micromeritics Instrument Corp.). The catalysts (100 mg) were dried under He flow at 573 K for 0.5 h and the TPR profiles were obtained by heating the samples under a 10% H2/Ar flow (30 mL min−1) from 298 to 1173 K (10 K min−1). Transmission electron microscopy (TEM) micrographs were obtained on a Jeol JEM 2100 HTP apparatus (Jeol Ltd., Tokyo, Japan) operating at 200 kV. The samples were suspended in isopropanol and ultrasonicated for 0.5 h. A drop of the suspension was dropped onto carbon-coated copper grids, allowing the solvent to evaporate at 353 K in vacuum. X-ray photoelectron spectroscopy (XPS) analysis was carried out in a Thermo Scientific Escalab 250 XI model (Thermo Fisher Scientific, Waltham, MA, USA) with monochromatic Al Kα radiation. The measurements were performed at room temperature and a pressure of 7.8 × 10⁻⁸ mbar. The scans were measured at a pass energy of 25 eV and a step size of 0.05 eV. In all experiments, Ar+ ion etching was used and the conditions were as follows: ion energy, 3000 eV; etch time, 60 seconds; and current, medium. Binding energies (BE) were calibrated to the C1s peak (284.6 eV) and the spectra were examined with CasaXPS software (version 2.3.16 PR 1.6).

2.2. Catalytic Ethanol Decomposition Experiments

Ethanol decomposition was performed in gas phase in a continuous-flow, atmospheric- pressure reactor. Prior to reaction, the catalyst samples (100 mg) were dried at 473 K under He and reduced with H2 at 873 K for 2 h, followed by heating until reaching 973 K under He flow. The reactant mixture (5% ethanol and 95% He, 100 mL min−1) was acquired by bubbling He through a saturator containing ethanol at 293 K. The reactions were studied under isothermal conditions at 873 K for 13 h. The ethanol and decomposition products were followed by gas chromatography (Varian 3400, Palo Alto, CA, USA) using Carboxen 1010 plot and Porabond Q capillary columns. Ethanol conversion (X) and hydrogen selectivity (S) were determined employing the following equations, where yj is the molar fraction of compound j in the exit stream:
X C 2 H 5 O H = y C O + y C H 4 + y C O 2 + 2 y C 2 H 4 O 2 y C 2 H 5 O H + y C O + y C H 4 + y C O 2 + 2 y C 2 H 4 O × 100 S H 2 = y H 2 y H 2 + 2 y C H 4 + y H 2 O + 2 y C 2 H 4 O × 100

2.3. In Situ Diffuse Reflectance Infrared Spectroscopy (DRIFTS) Measurements

Diffuse reflectance infrared spectroscopy (DRIFTS) analysis was carried out in an FTIR spectrometer (VERTEX 70–Bruker, Billerica, MA, USA) with a DRIFTS cell (Harrick Scientific, HVC-DRP-4, New York, NY, USA) and a praying mantis mirror assembly (Harrick Scientific). Prior to C2H5OH-DRIFTS analysis, the passivated catalysts were dried at 473 K under He flow for 30 min, reduced at 673 K under H2 flow (30 mL min−1), and cooled under He flow (30 mL min−1) until reaching 303 K. At this temperature, a background interferogram was collected, as well as at 573, 473, 373, and 303 K. The adsorption of ethanol was conducted at 293 K using an ethanol/He mixture, which was obtained by flowing He through a saturator ethanol at 293 K. After adsorption, the samples were purged under He flow and a new interferogram was taken, which related to the background reference to acquire the spectrum of adsorbed ethanol.

2.4. Spent Catalyst Characterization

The amount of the coke deposited on the spent catalysts was quantified by thermogravimetry (TGA/DTA, Shimadzu-60H, Kyoto, Japan) through the mass loss during the analysis. The samples were dried up to 423 K for 1 h in He flow (30 mL min−1) to remove water and physisorbed species on the catalyst surface and cooled under He flow until reaching 303 K. At this temperature, TGA was carried out under airflow until reaching 1200 K (10 K min−1). Quantification of carbon was calculated according to the following equation:
C = mcoke/mspent catalyst
The spent catalysts were studied by Raman spectroscopy using a Confocal Raman Microscope alpha300 (Witec, Ratingen, Germany) with a 50× objective lens, a laser with 532 nm wavelength, and 450 scans.

3. Results

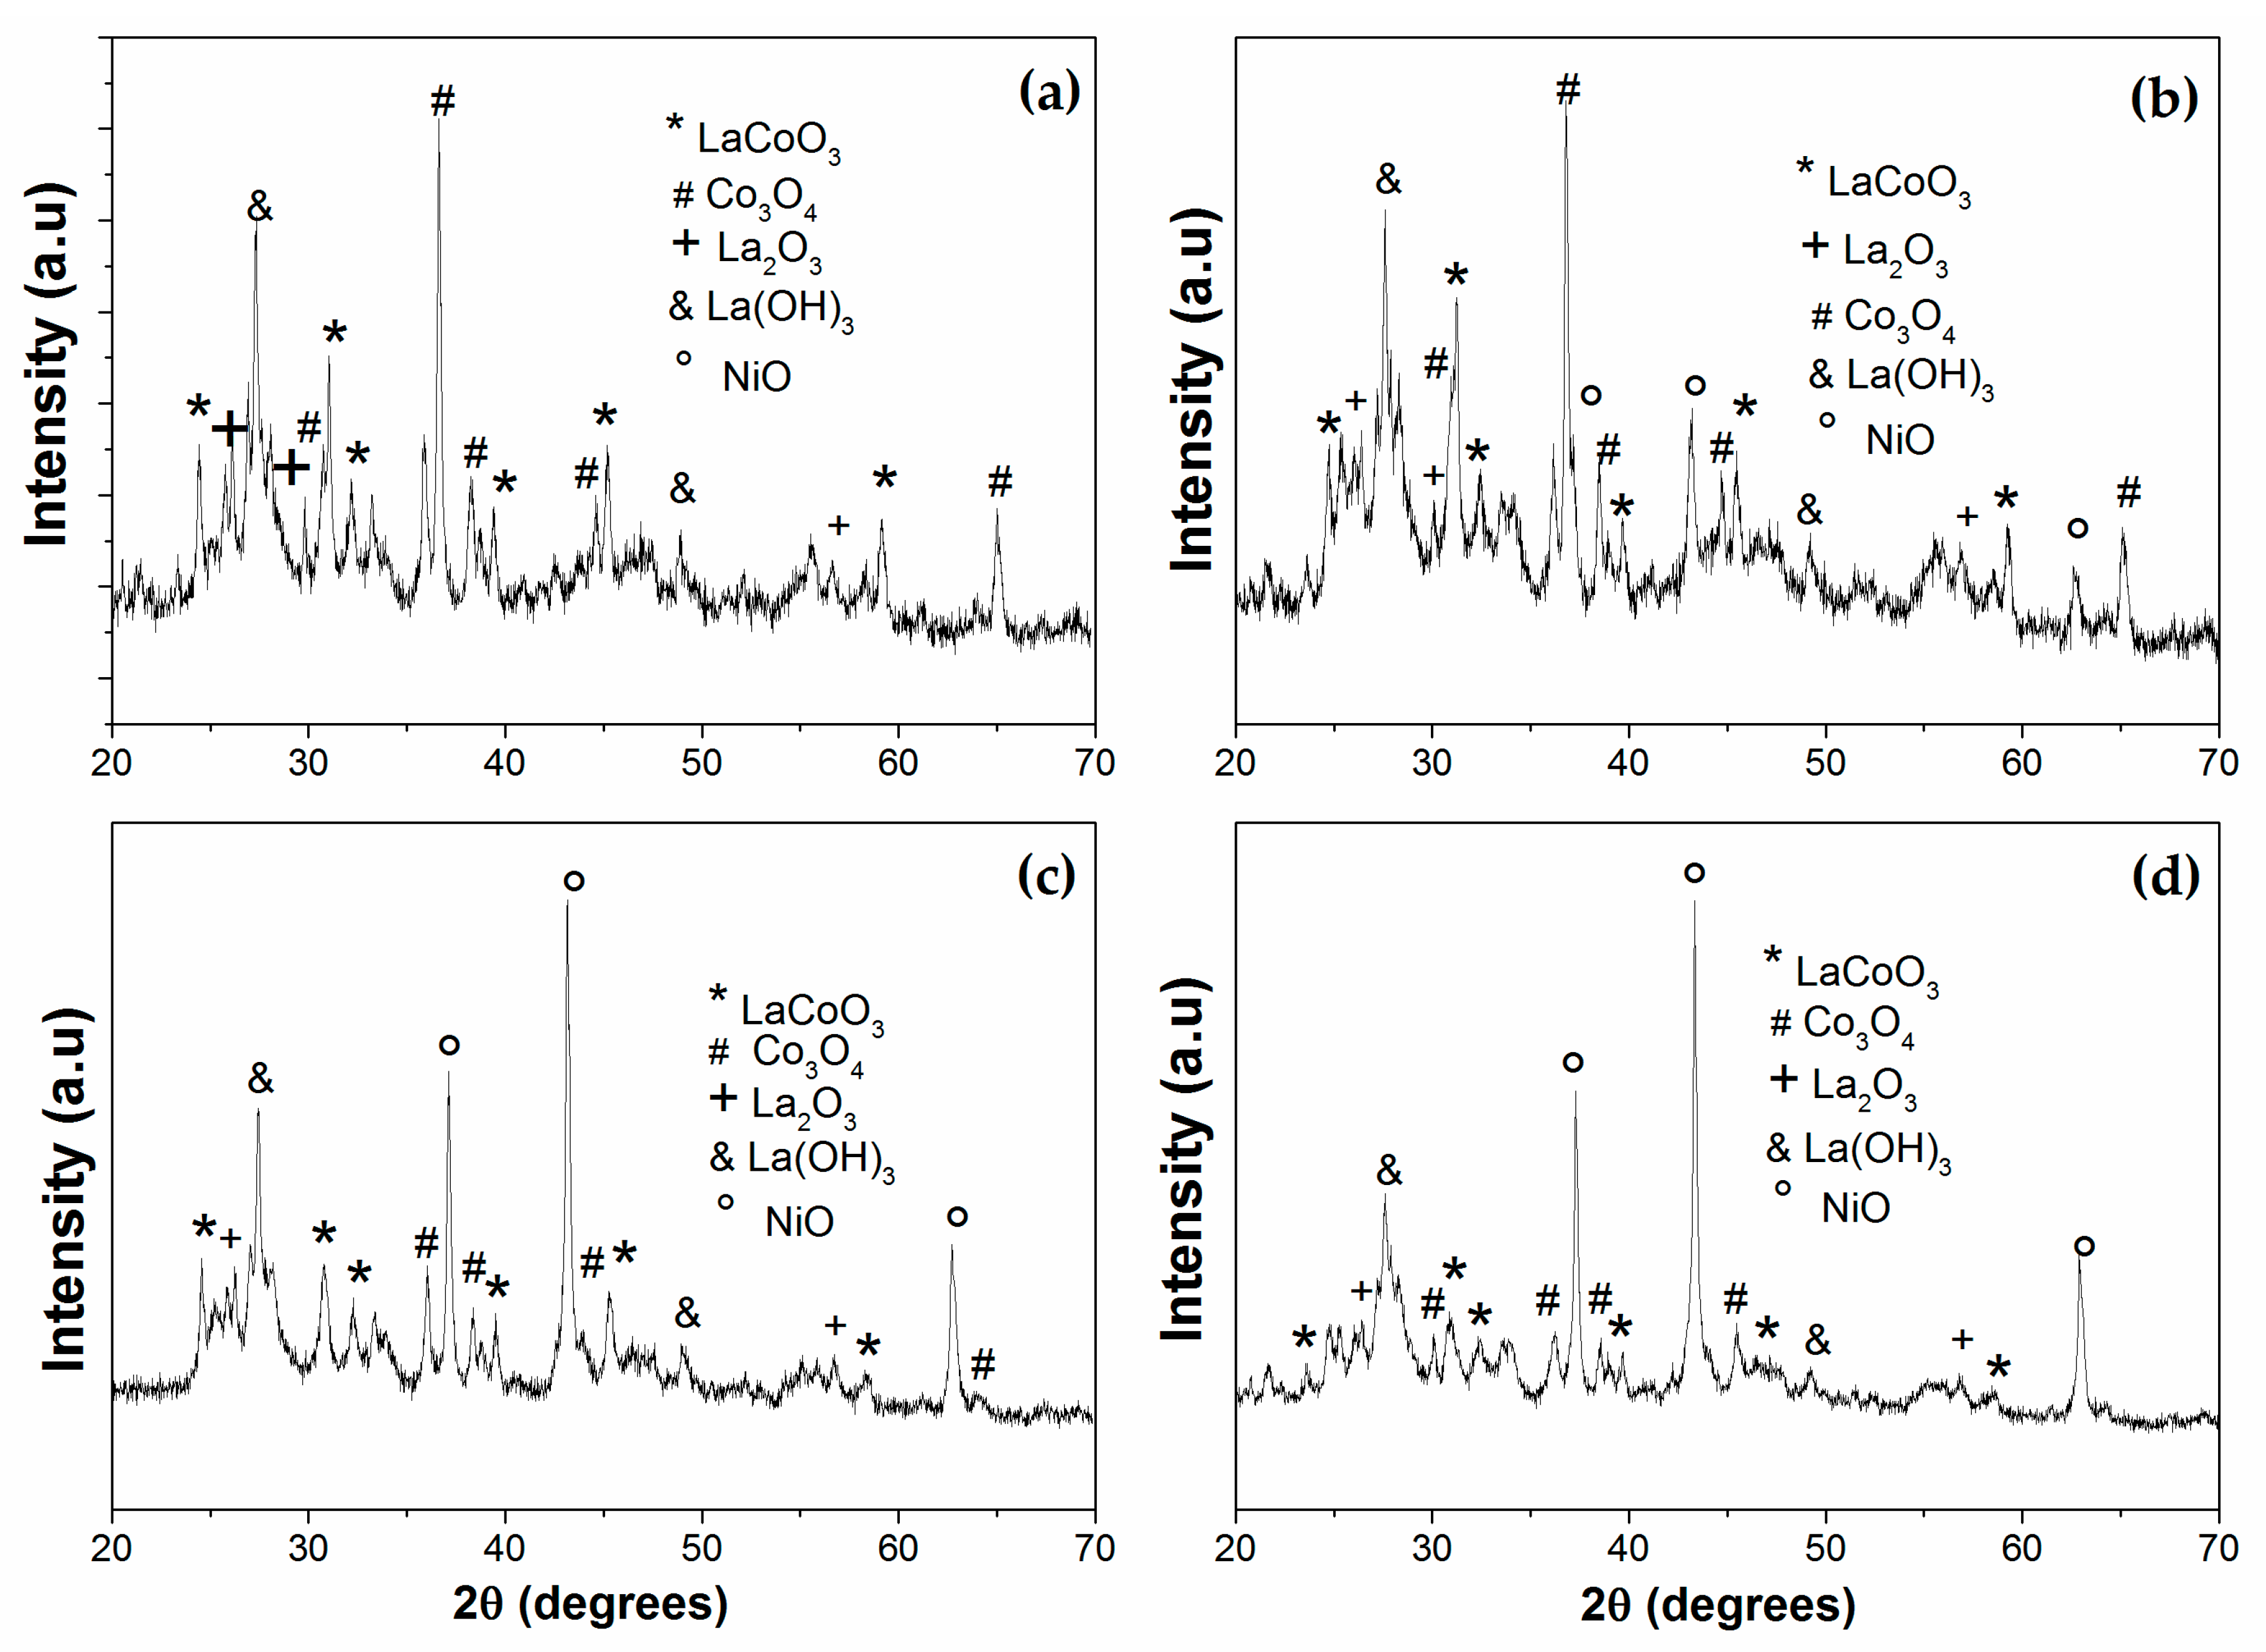
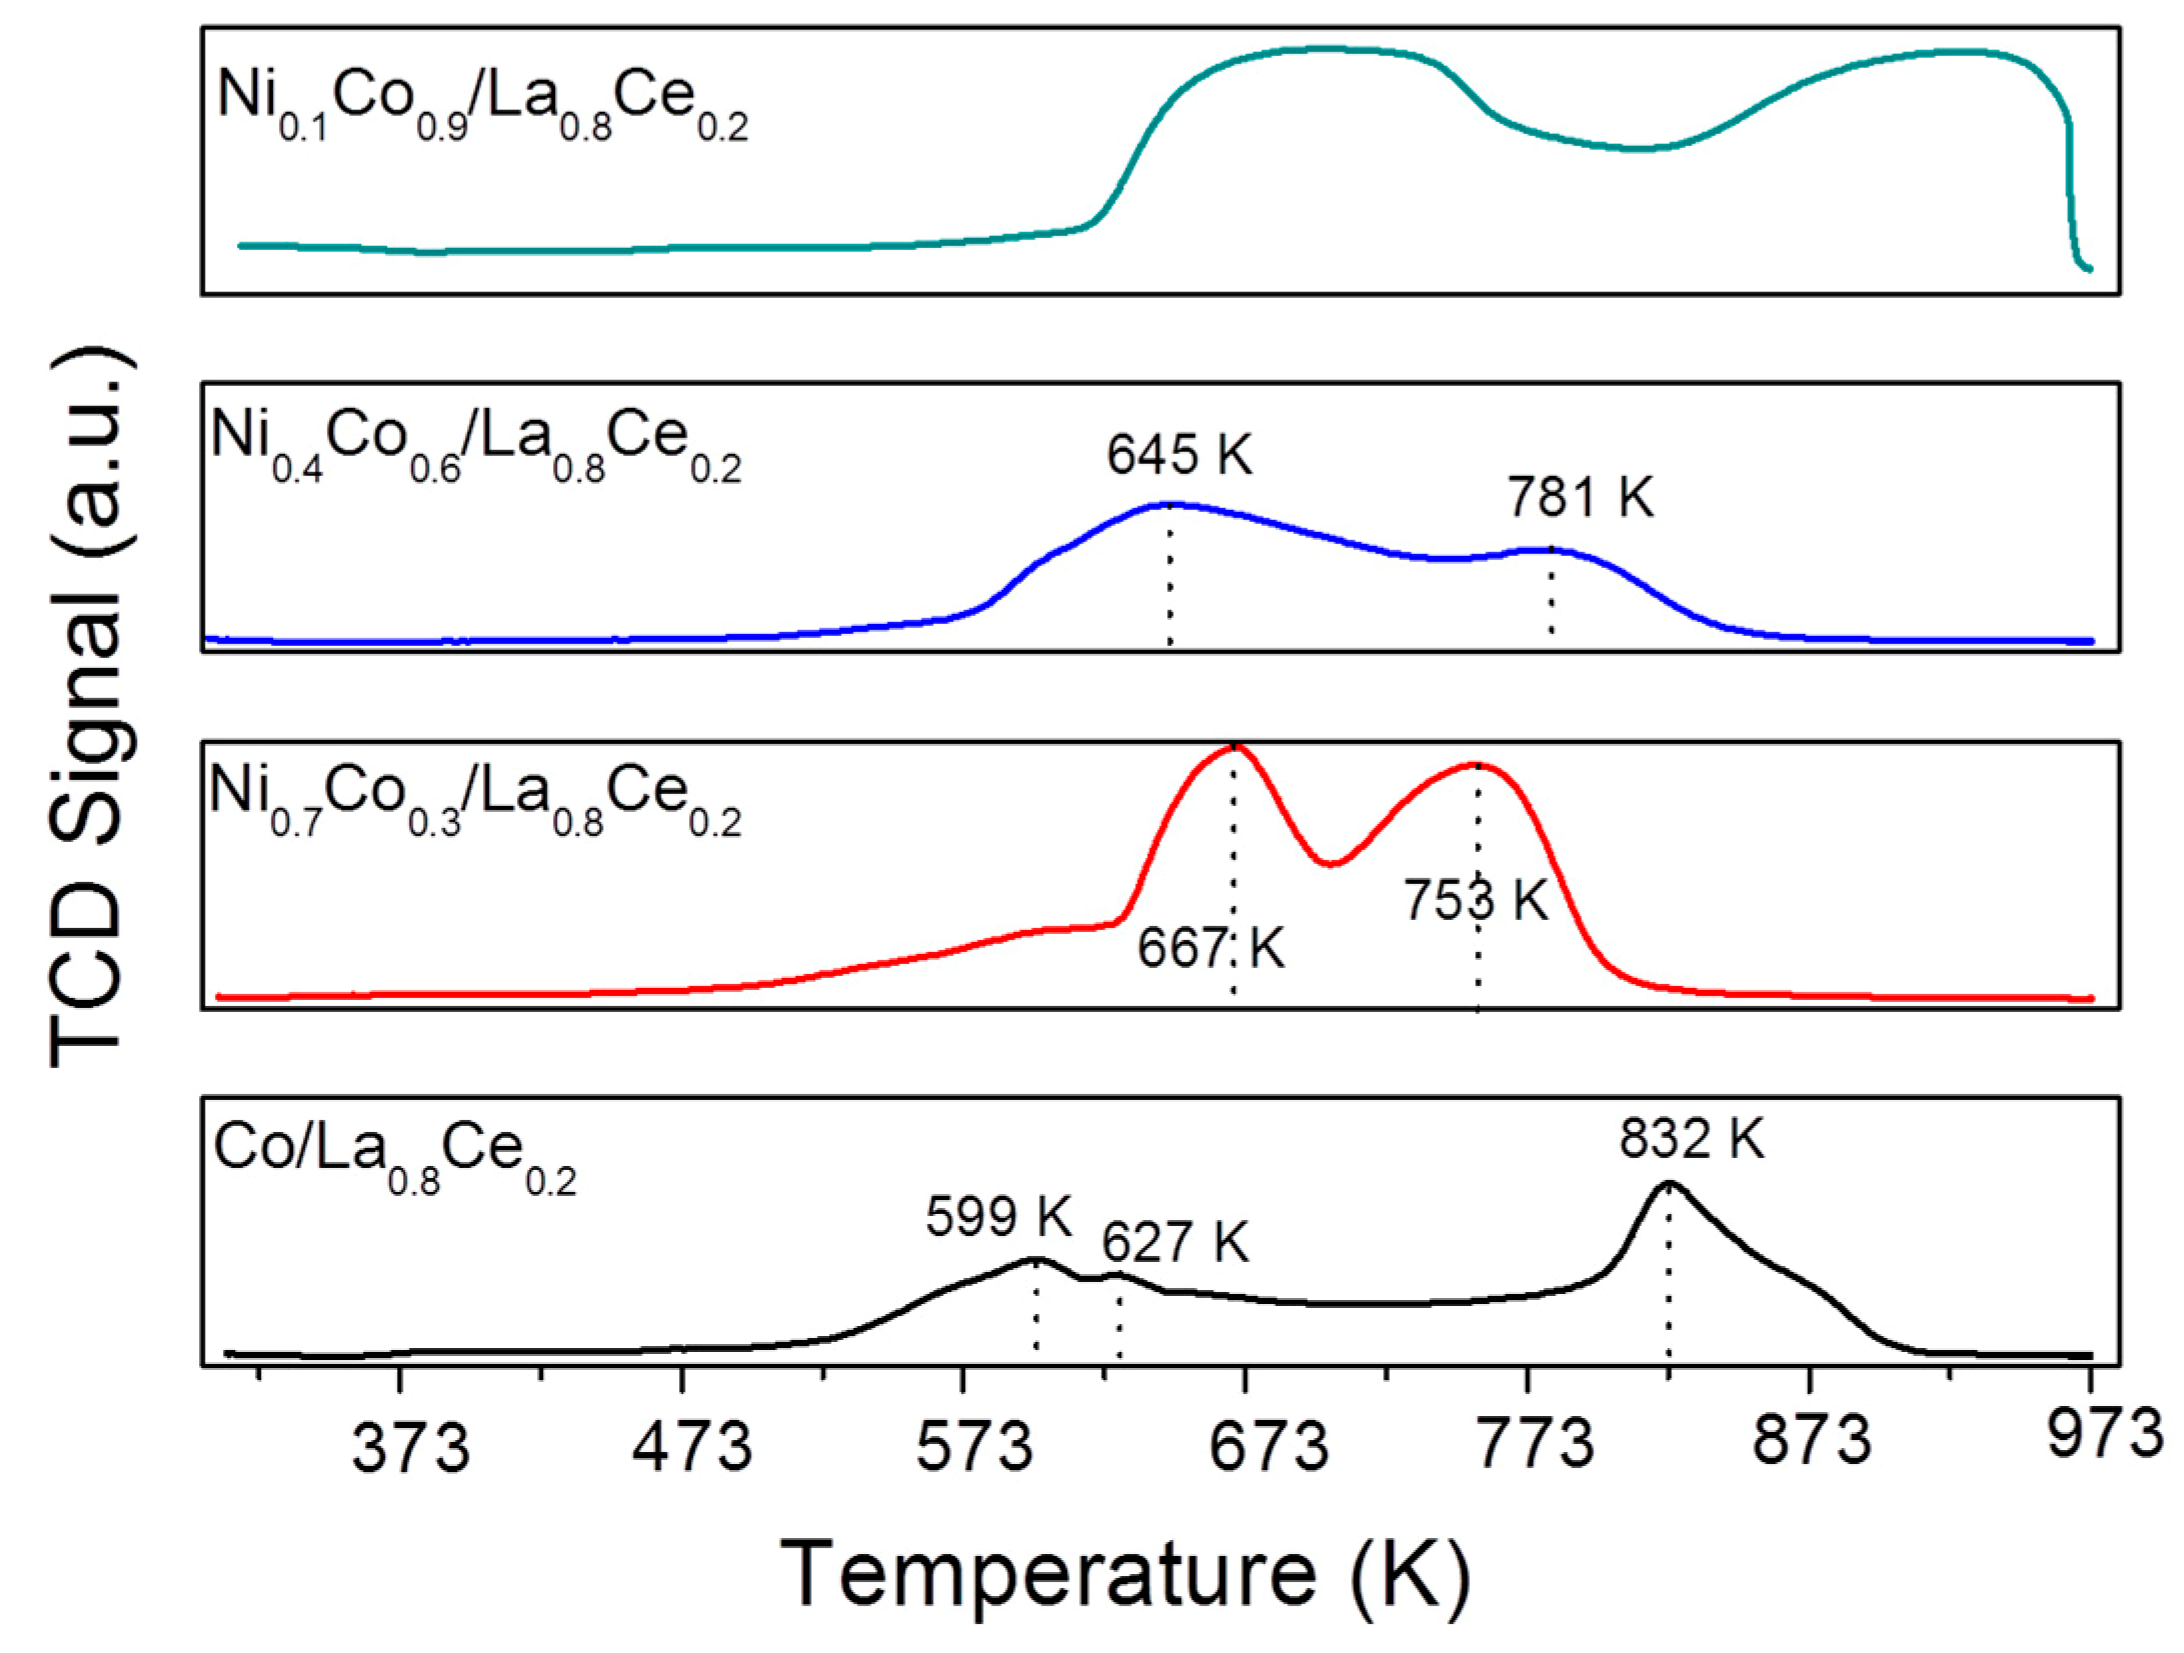
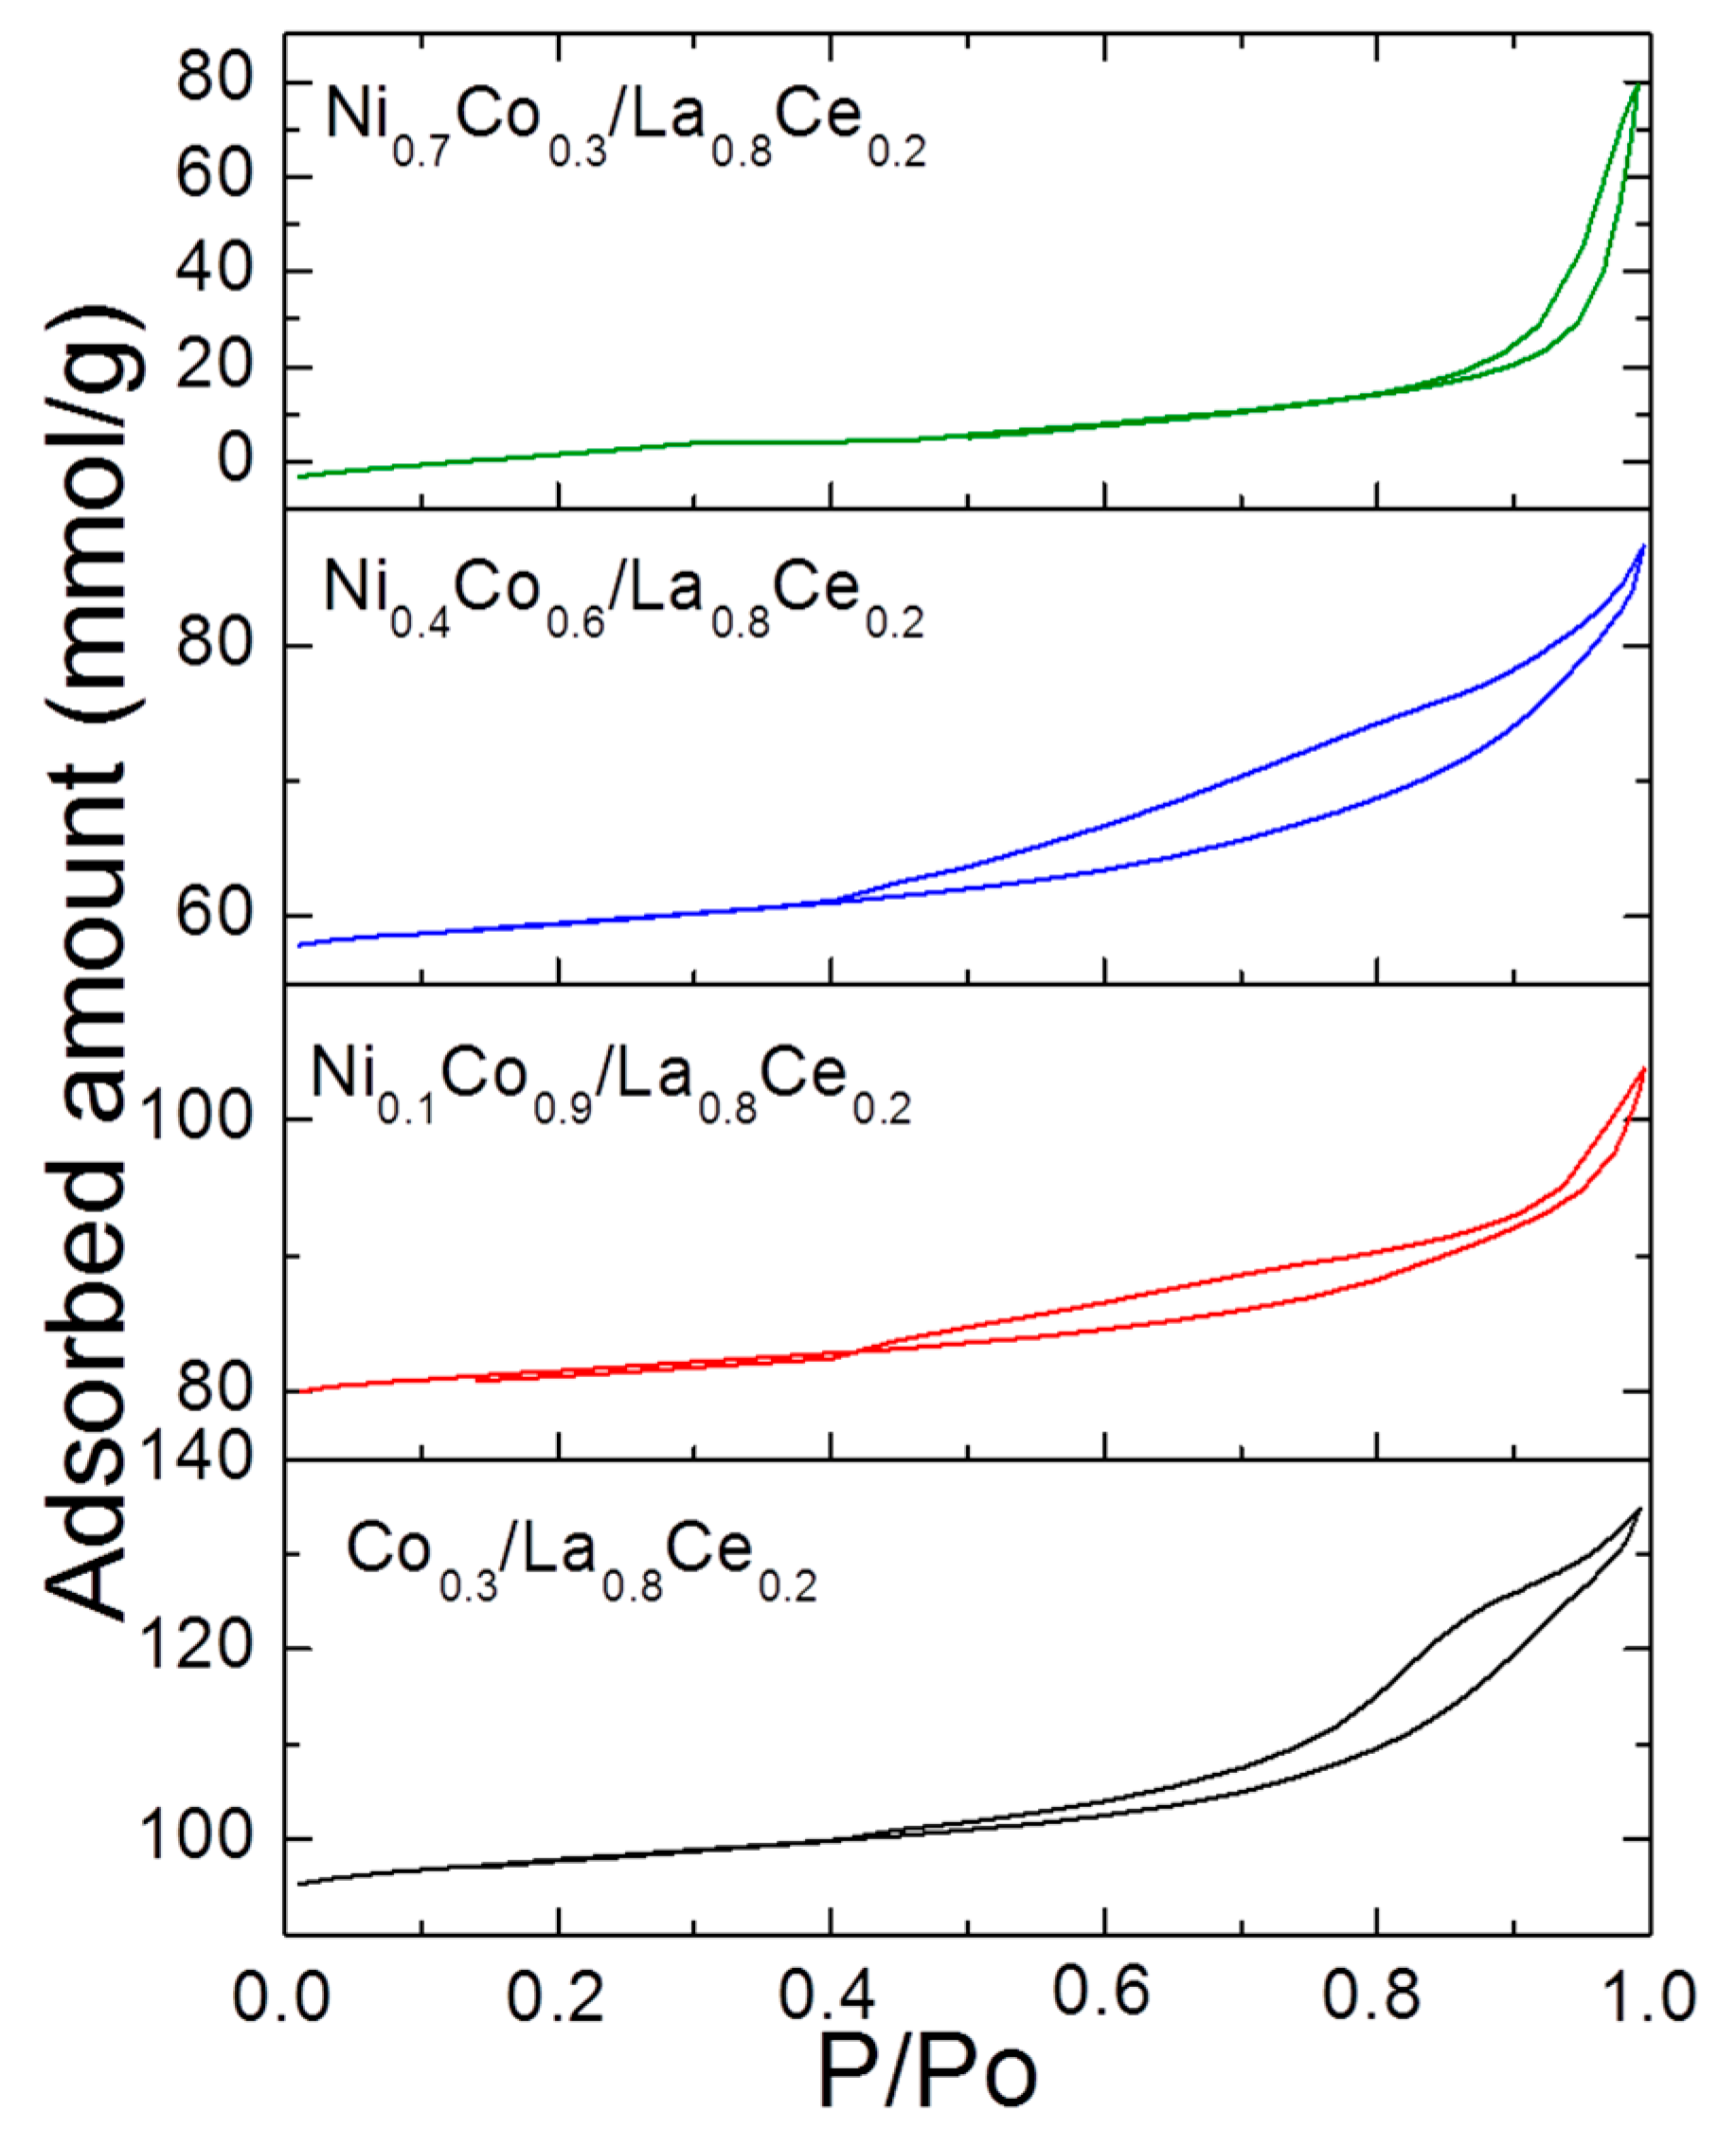
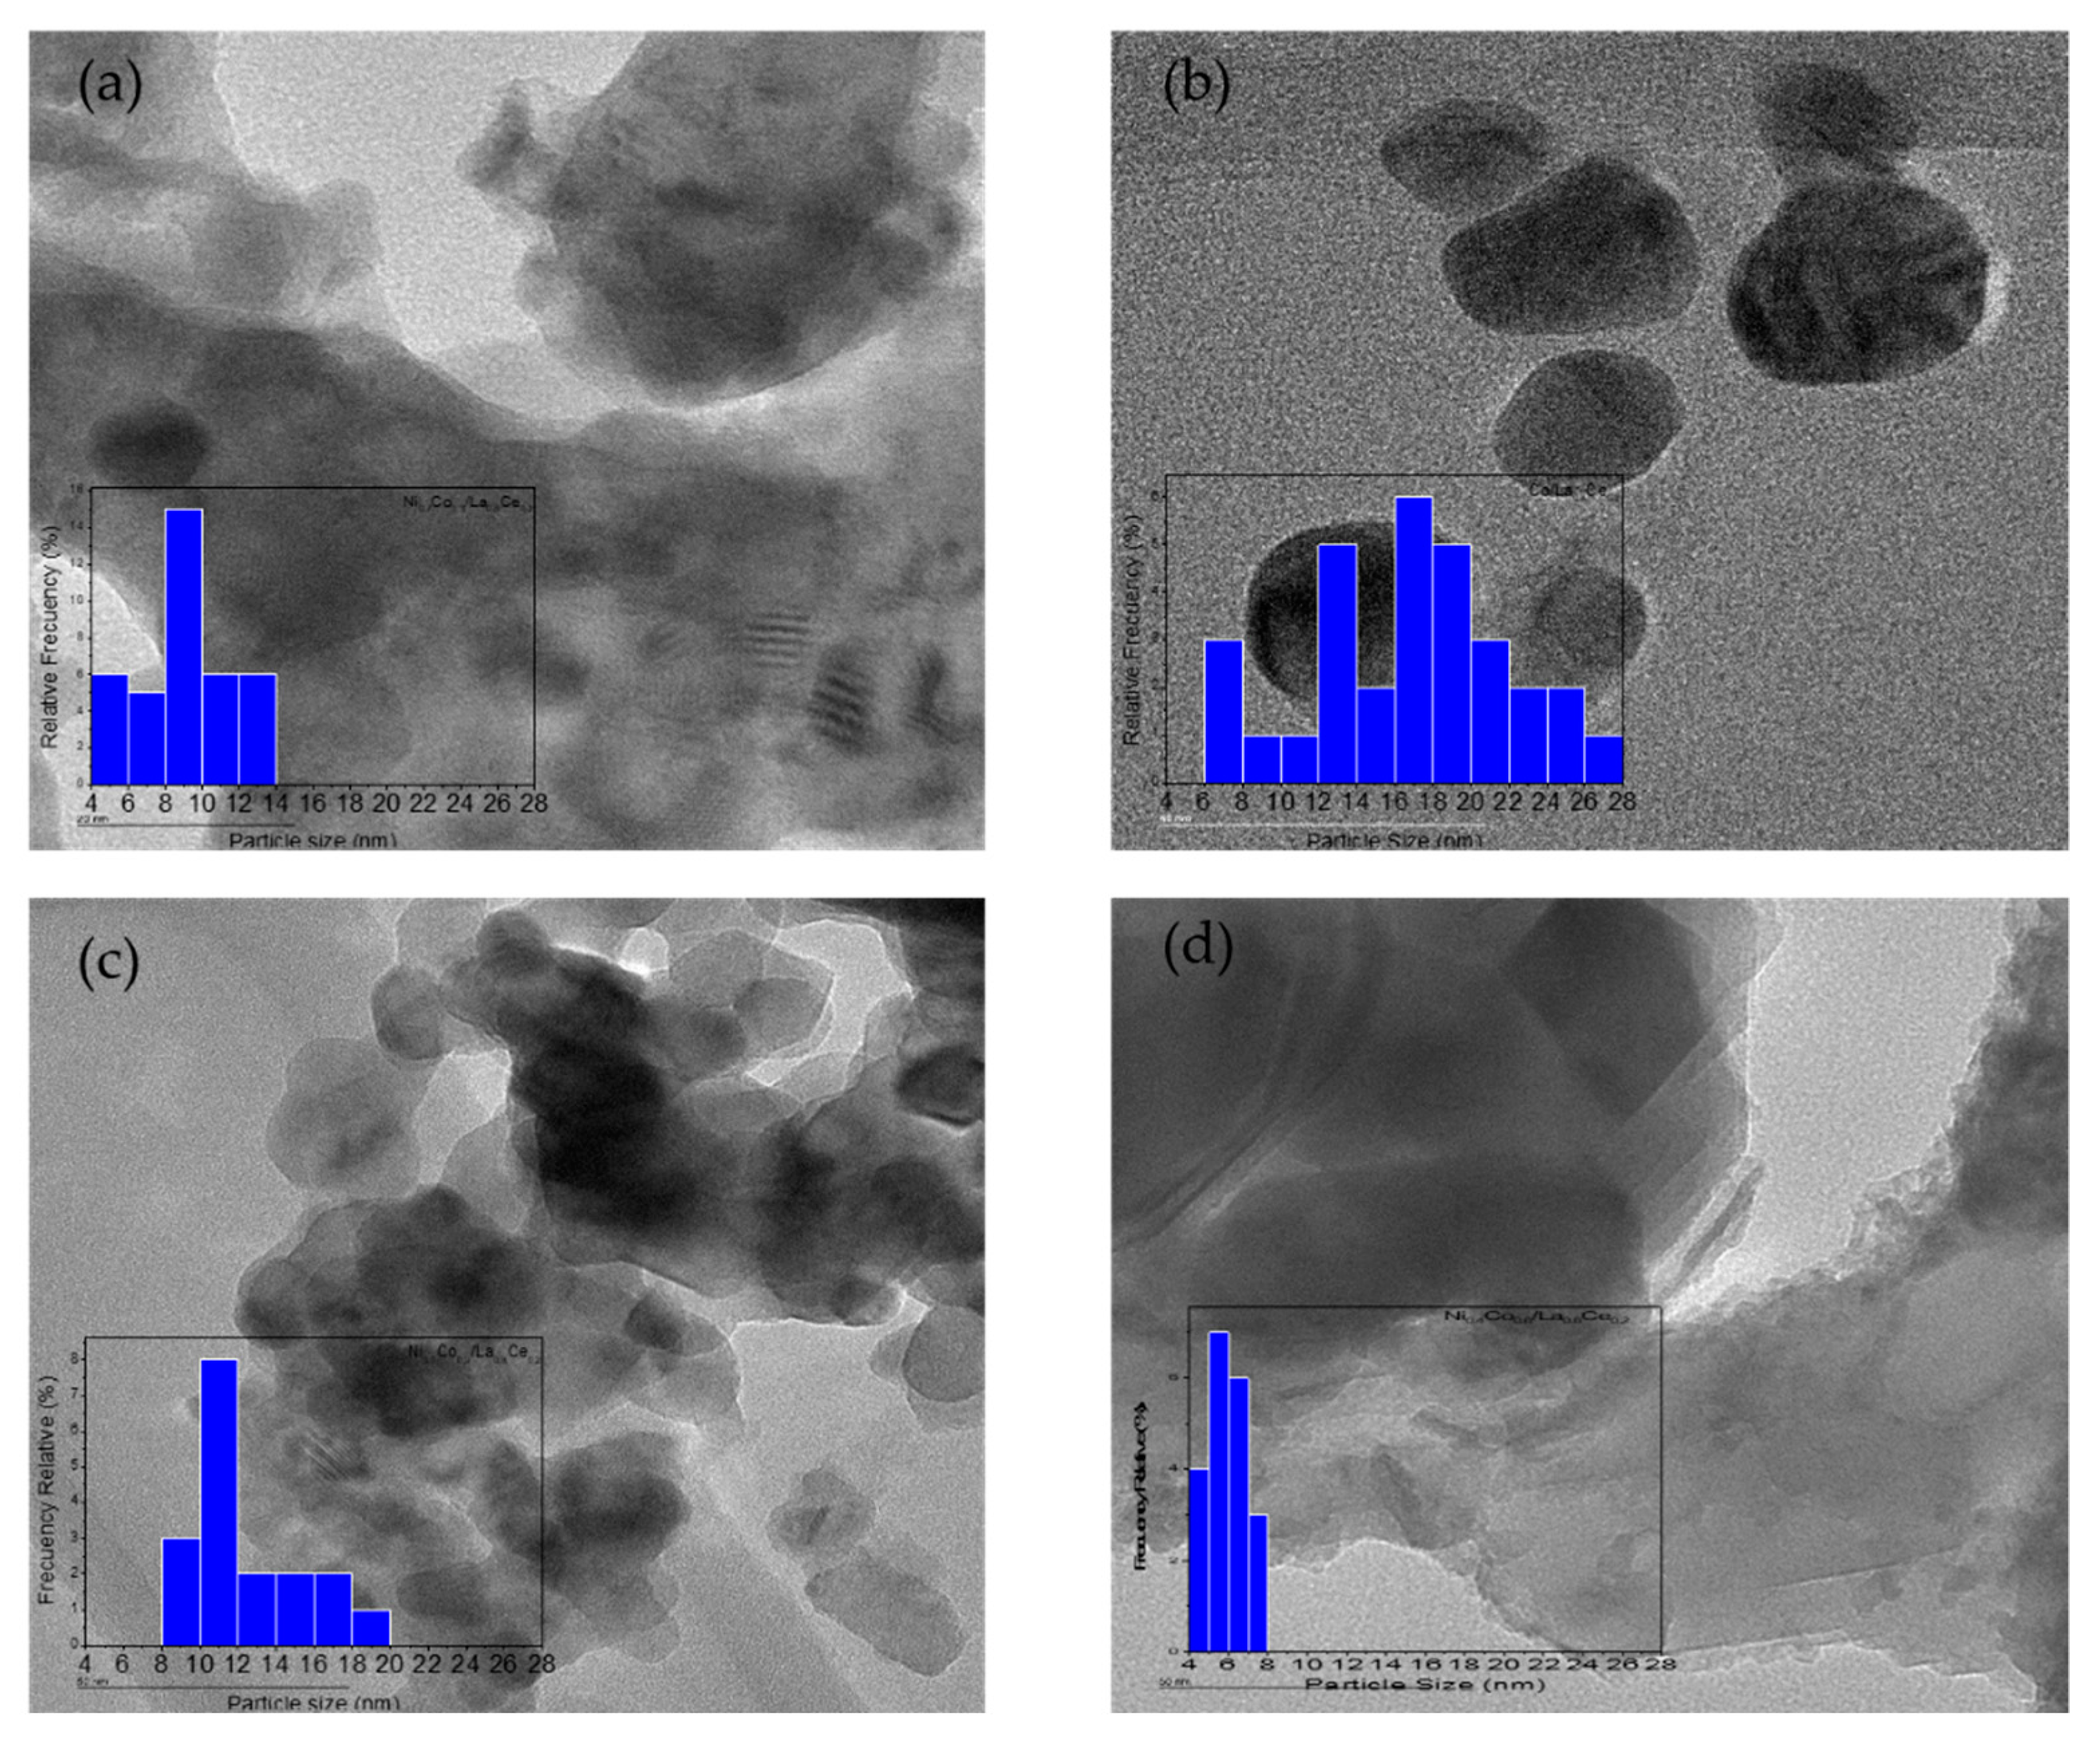
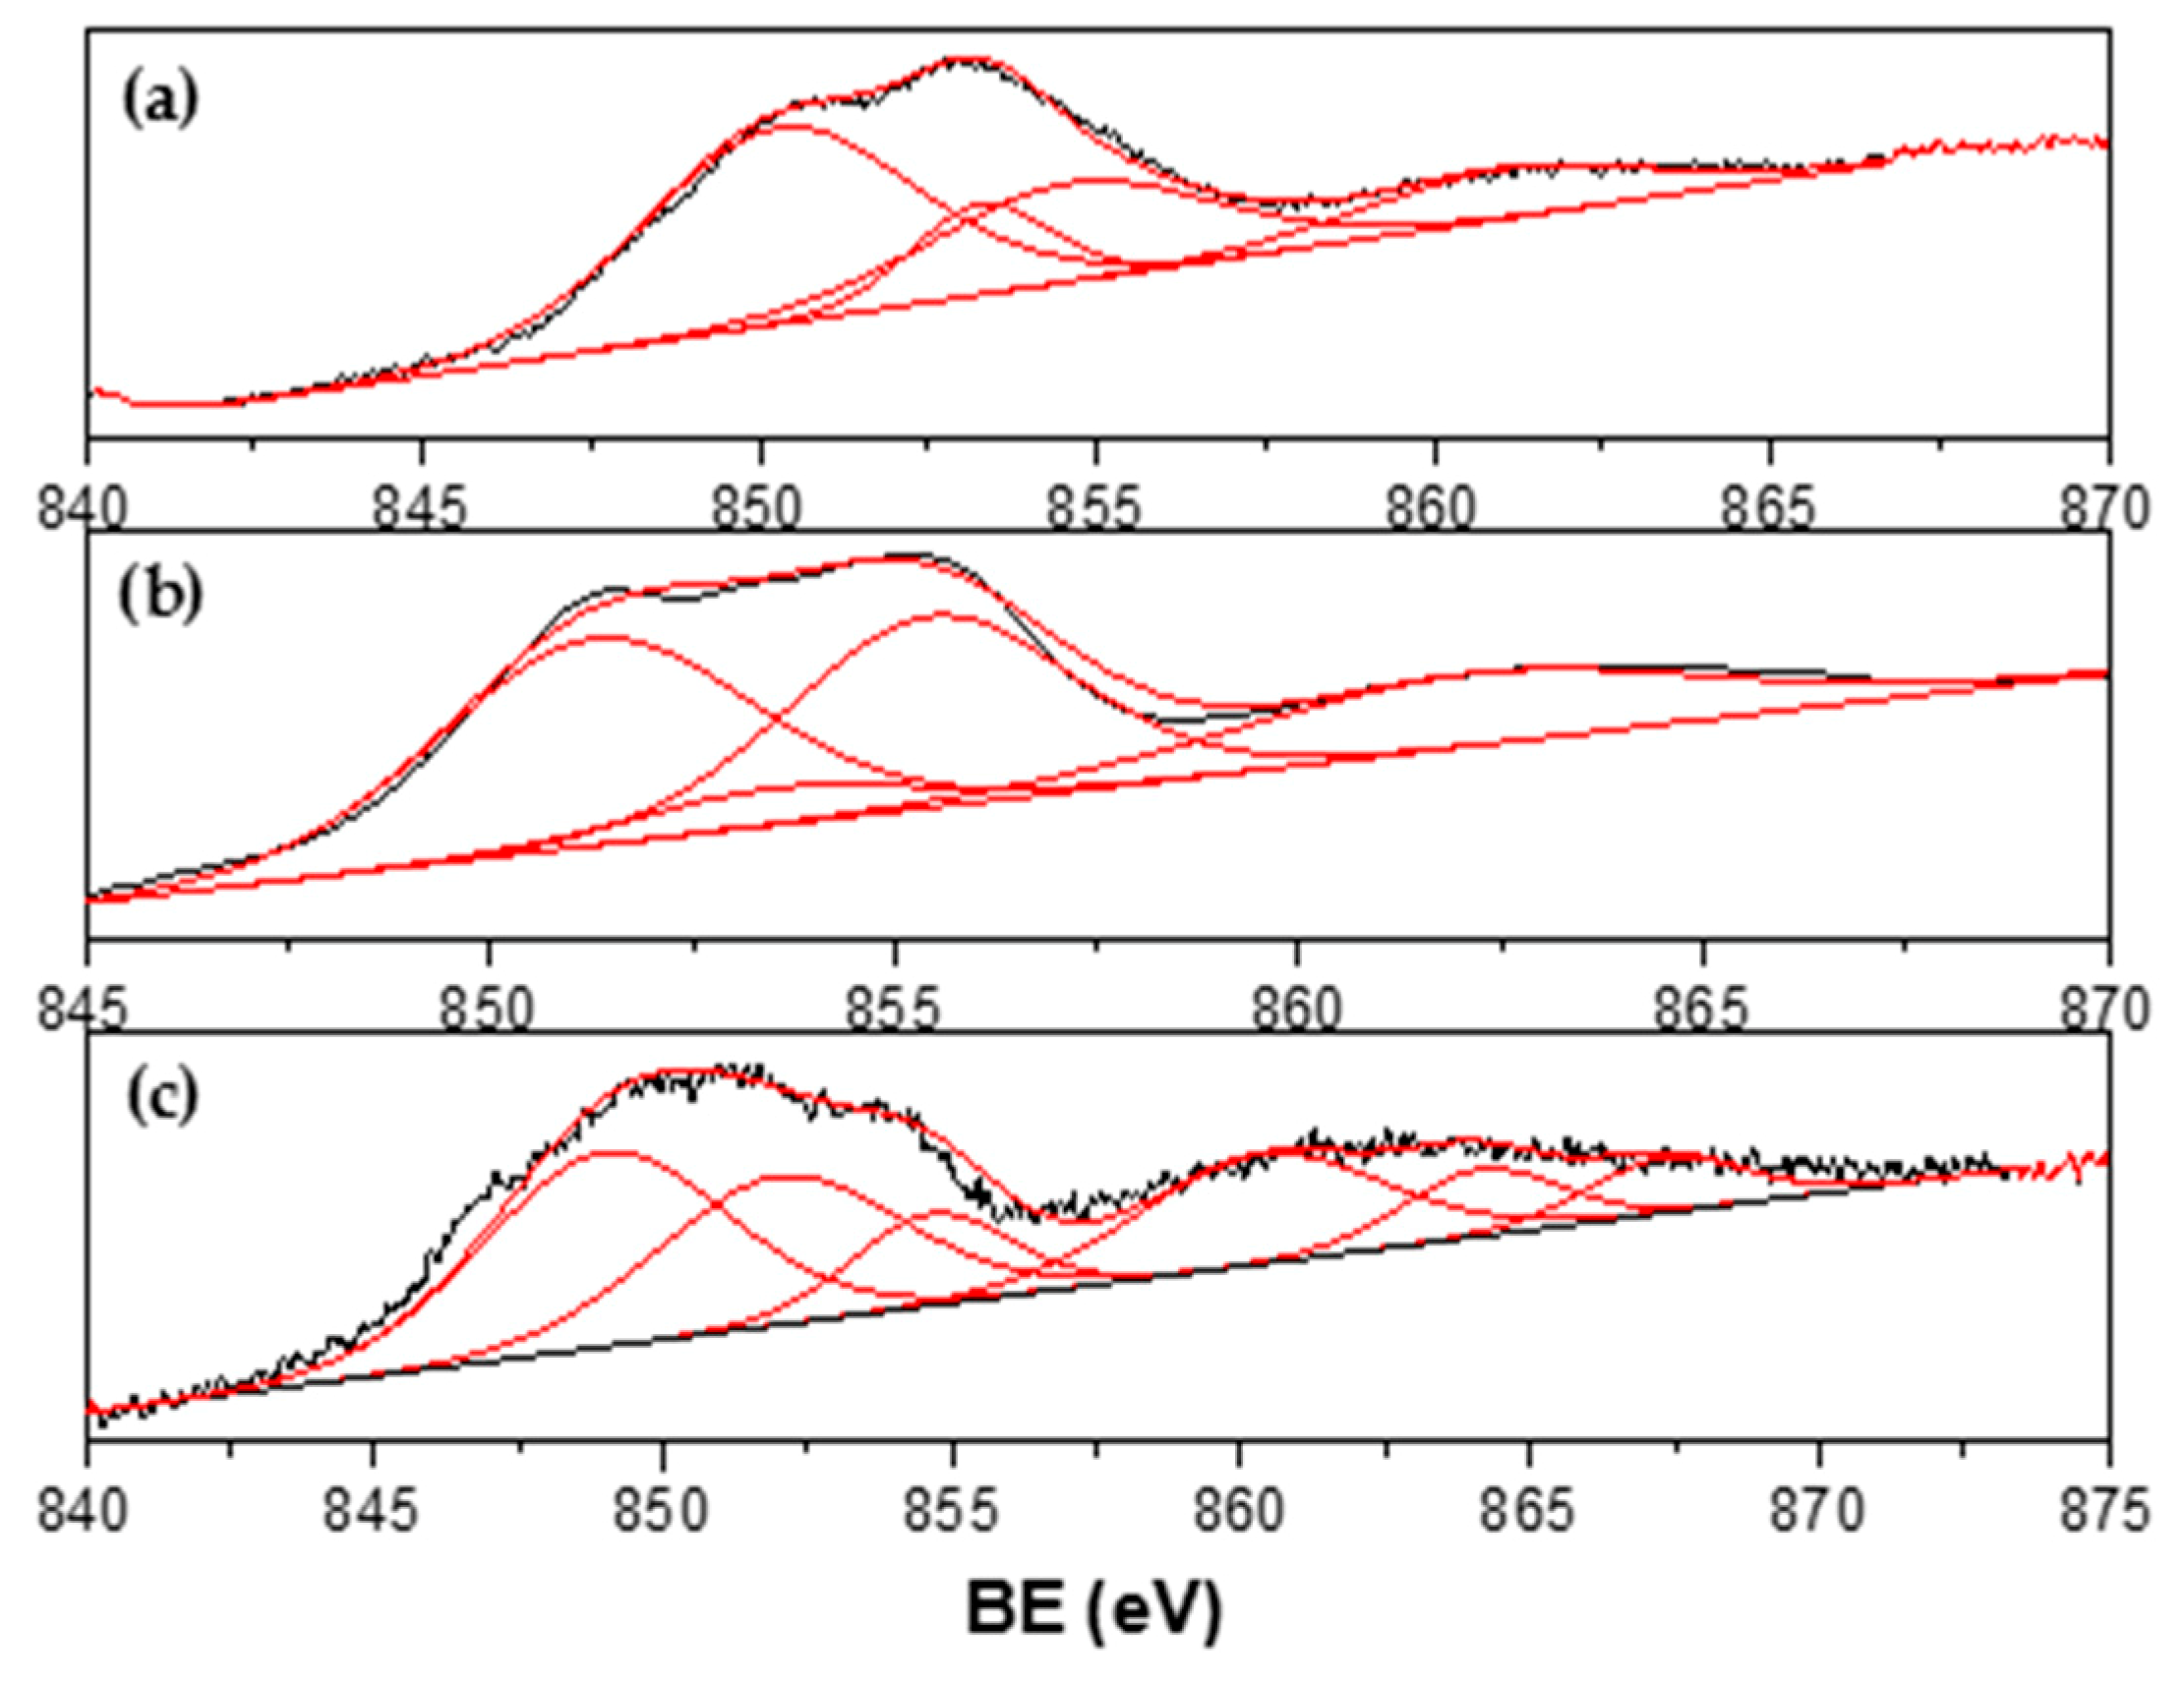
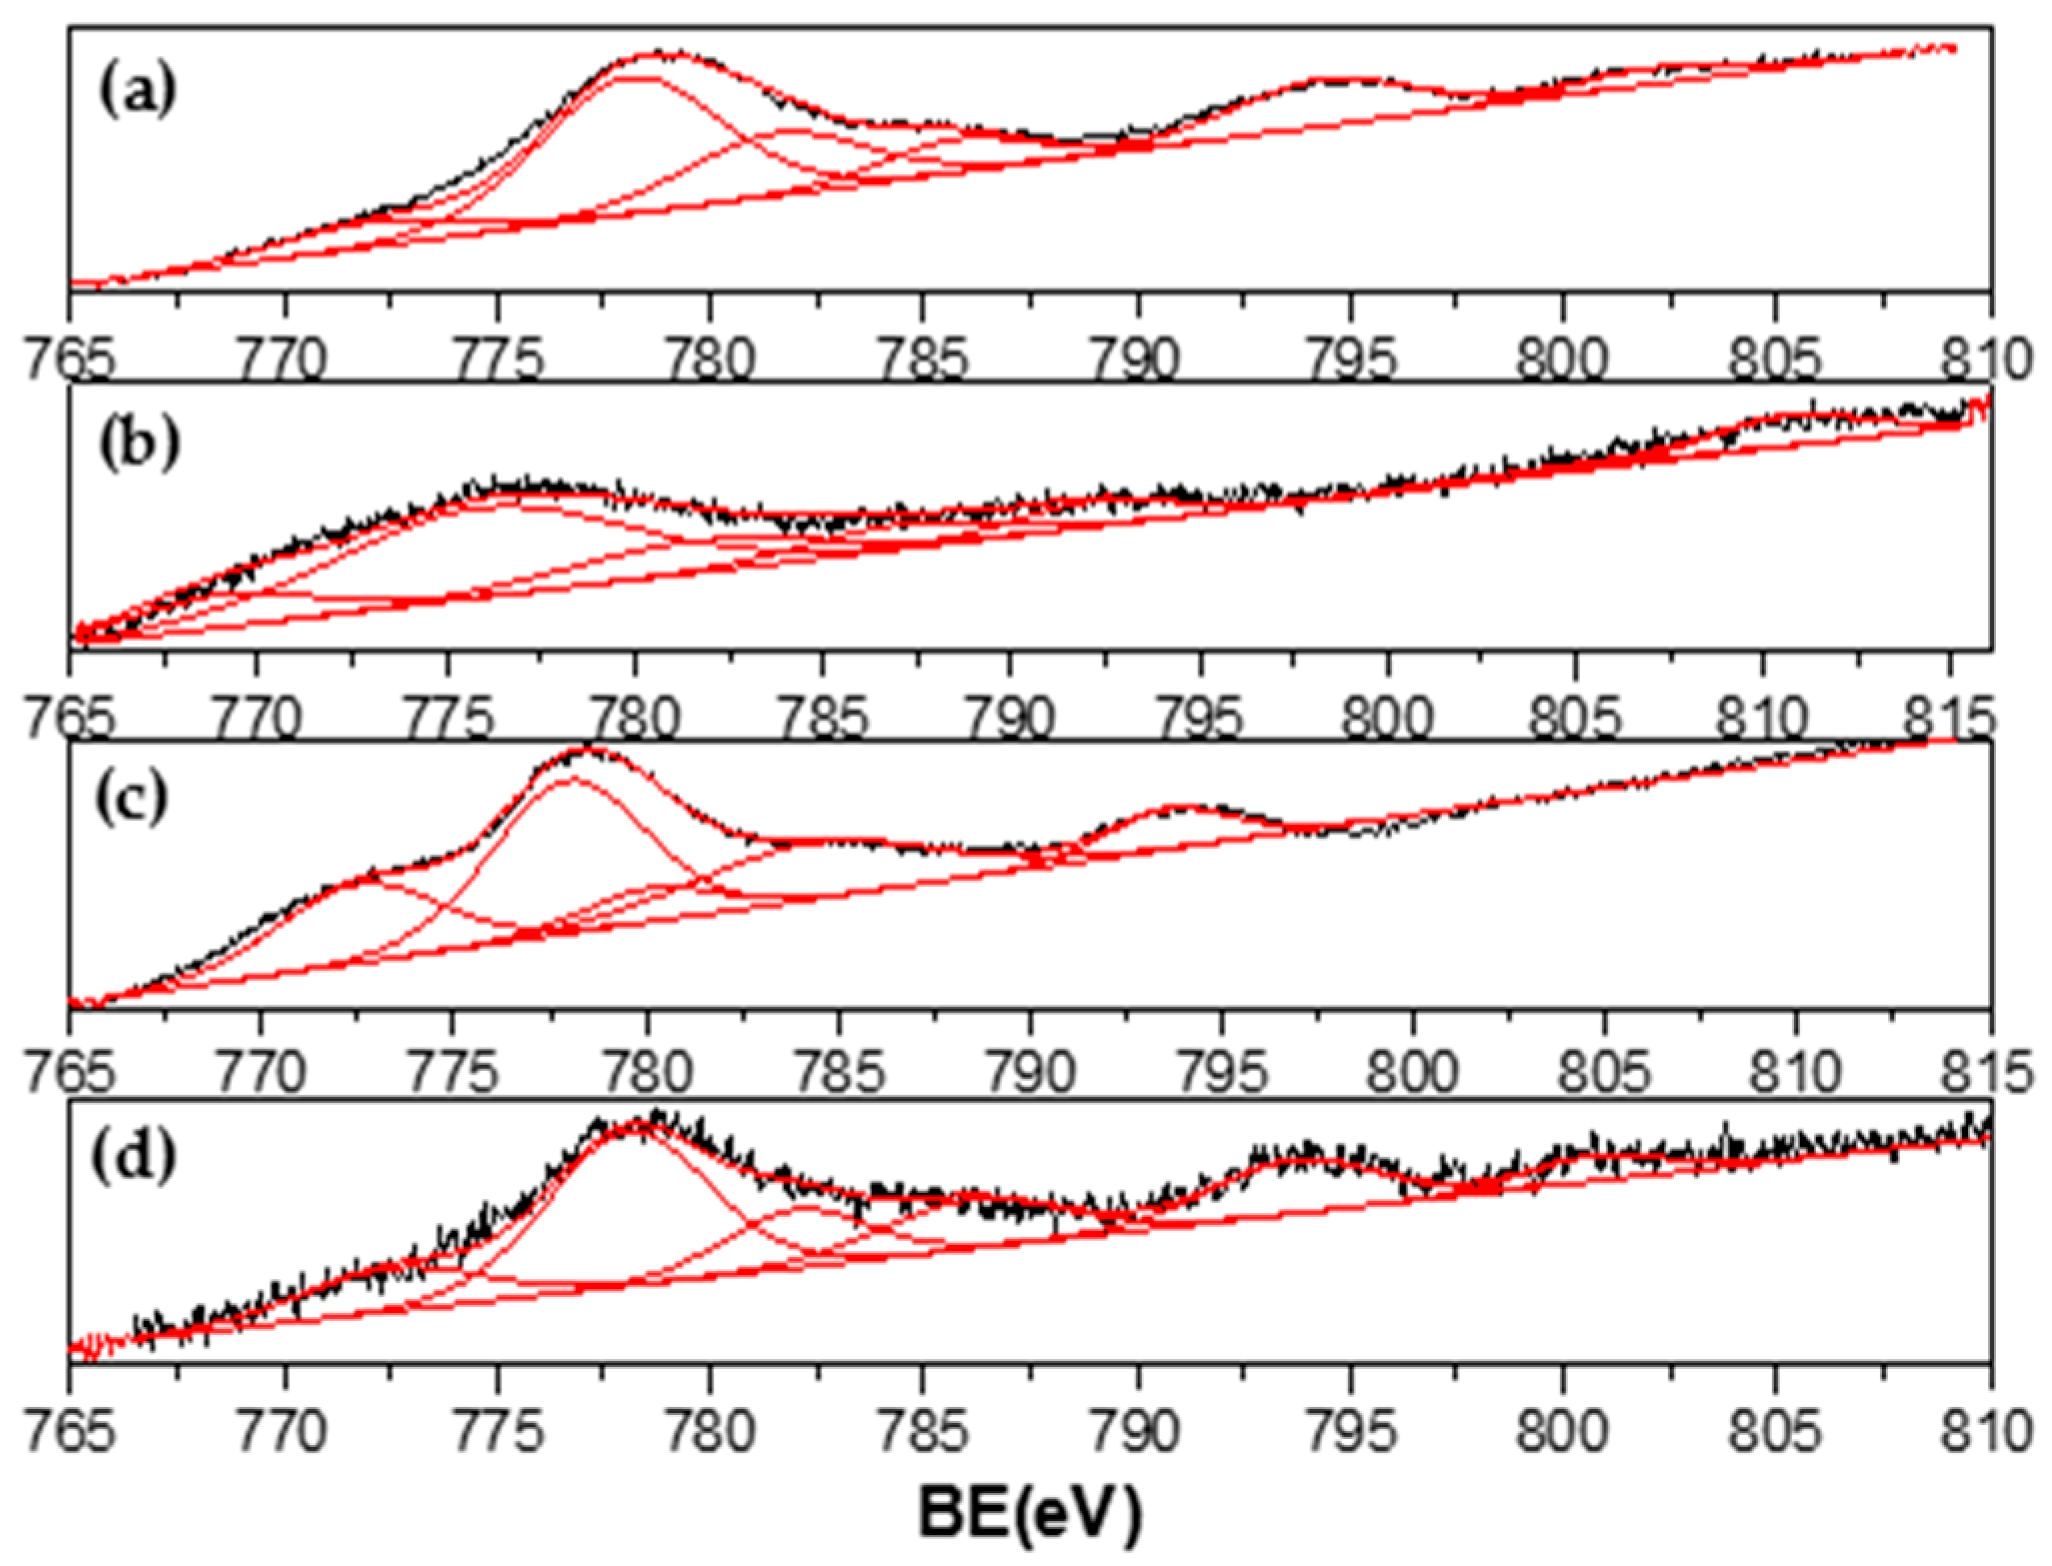
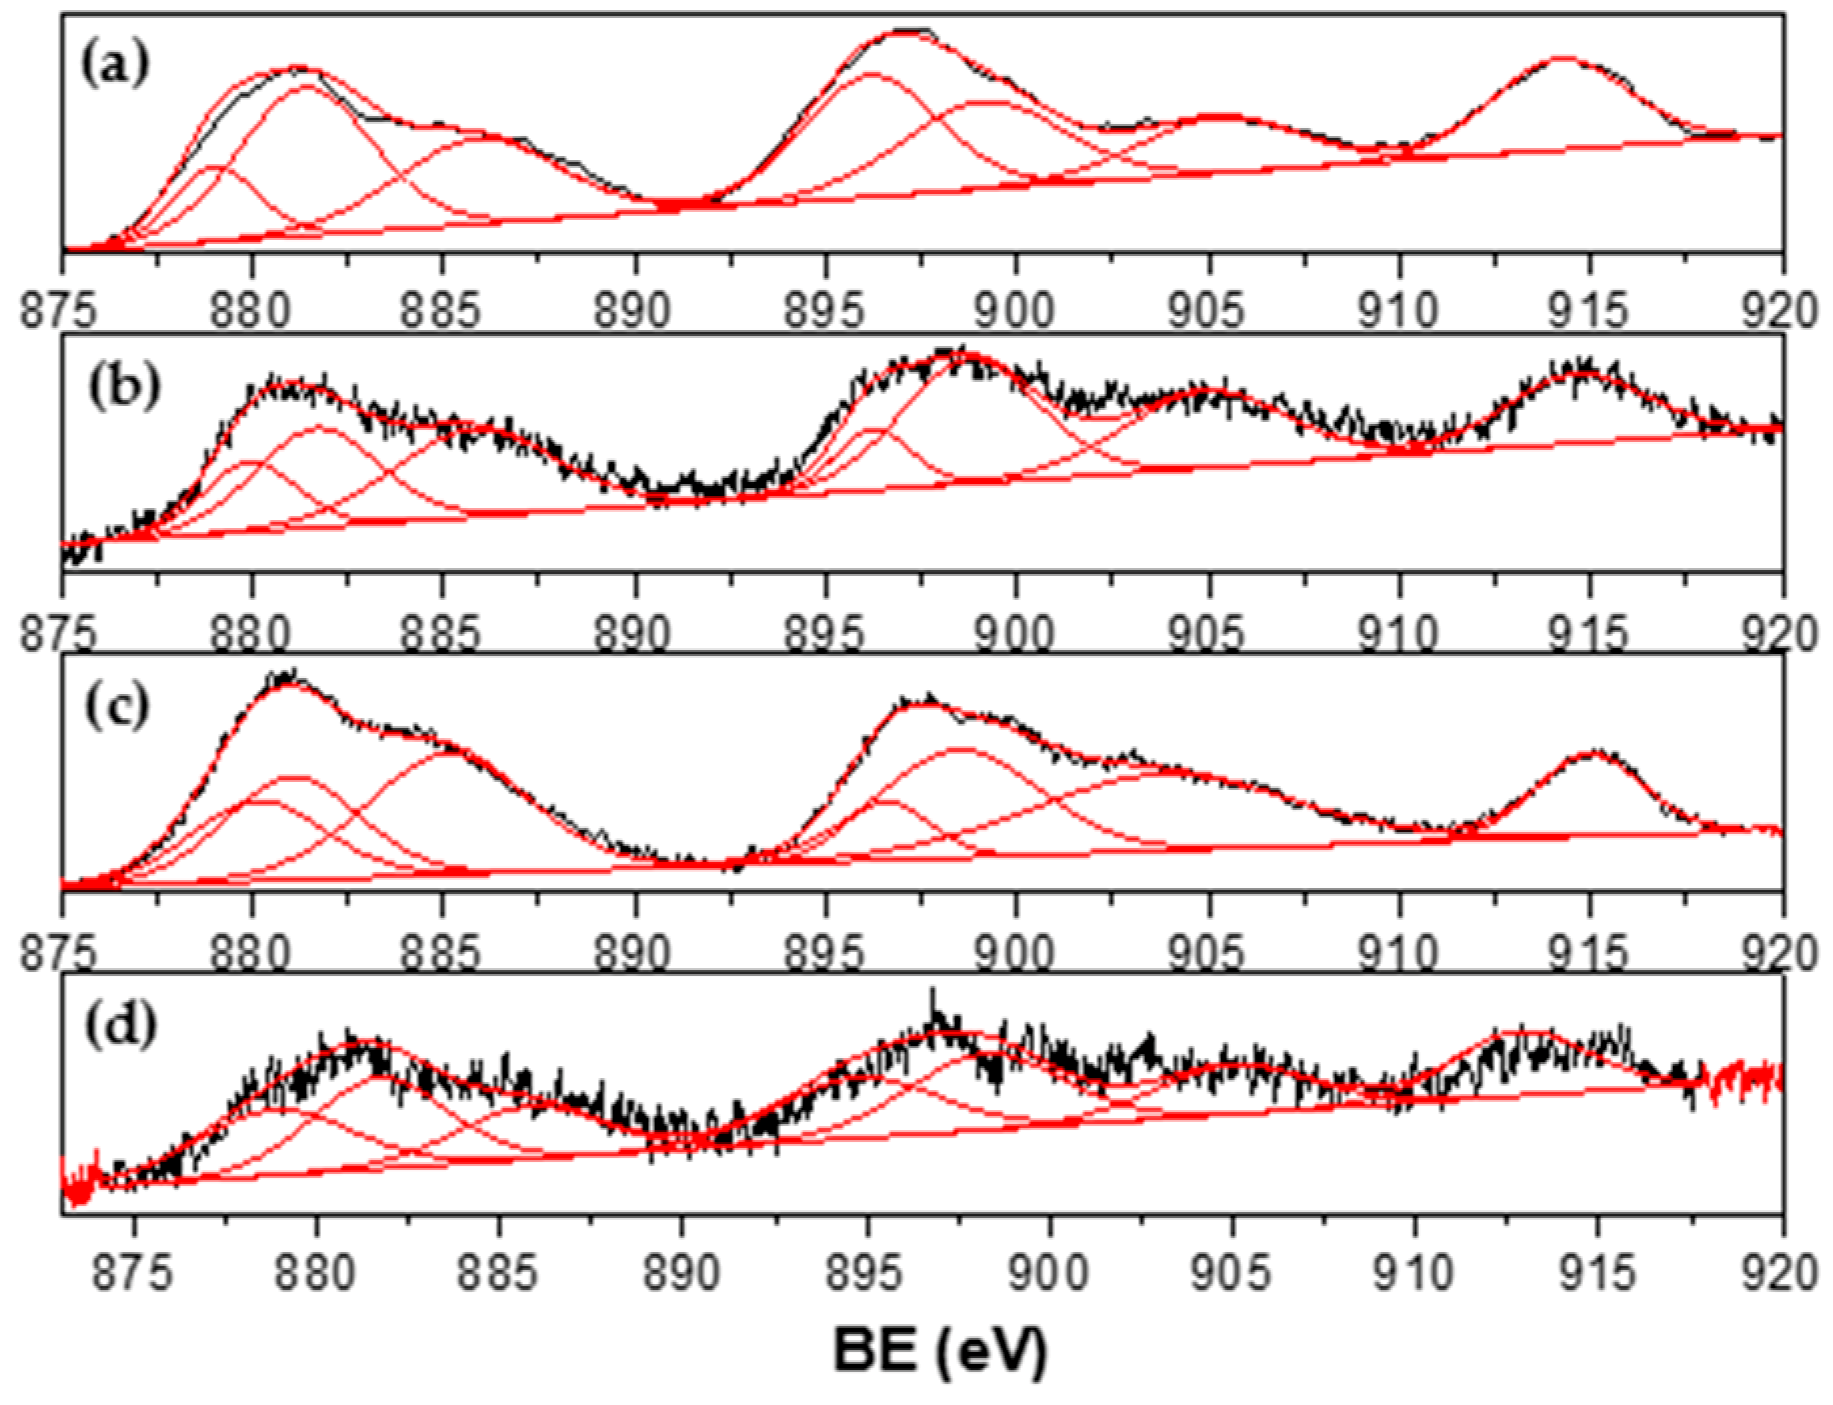
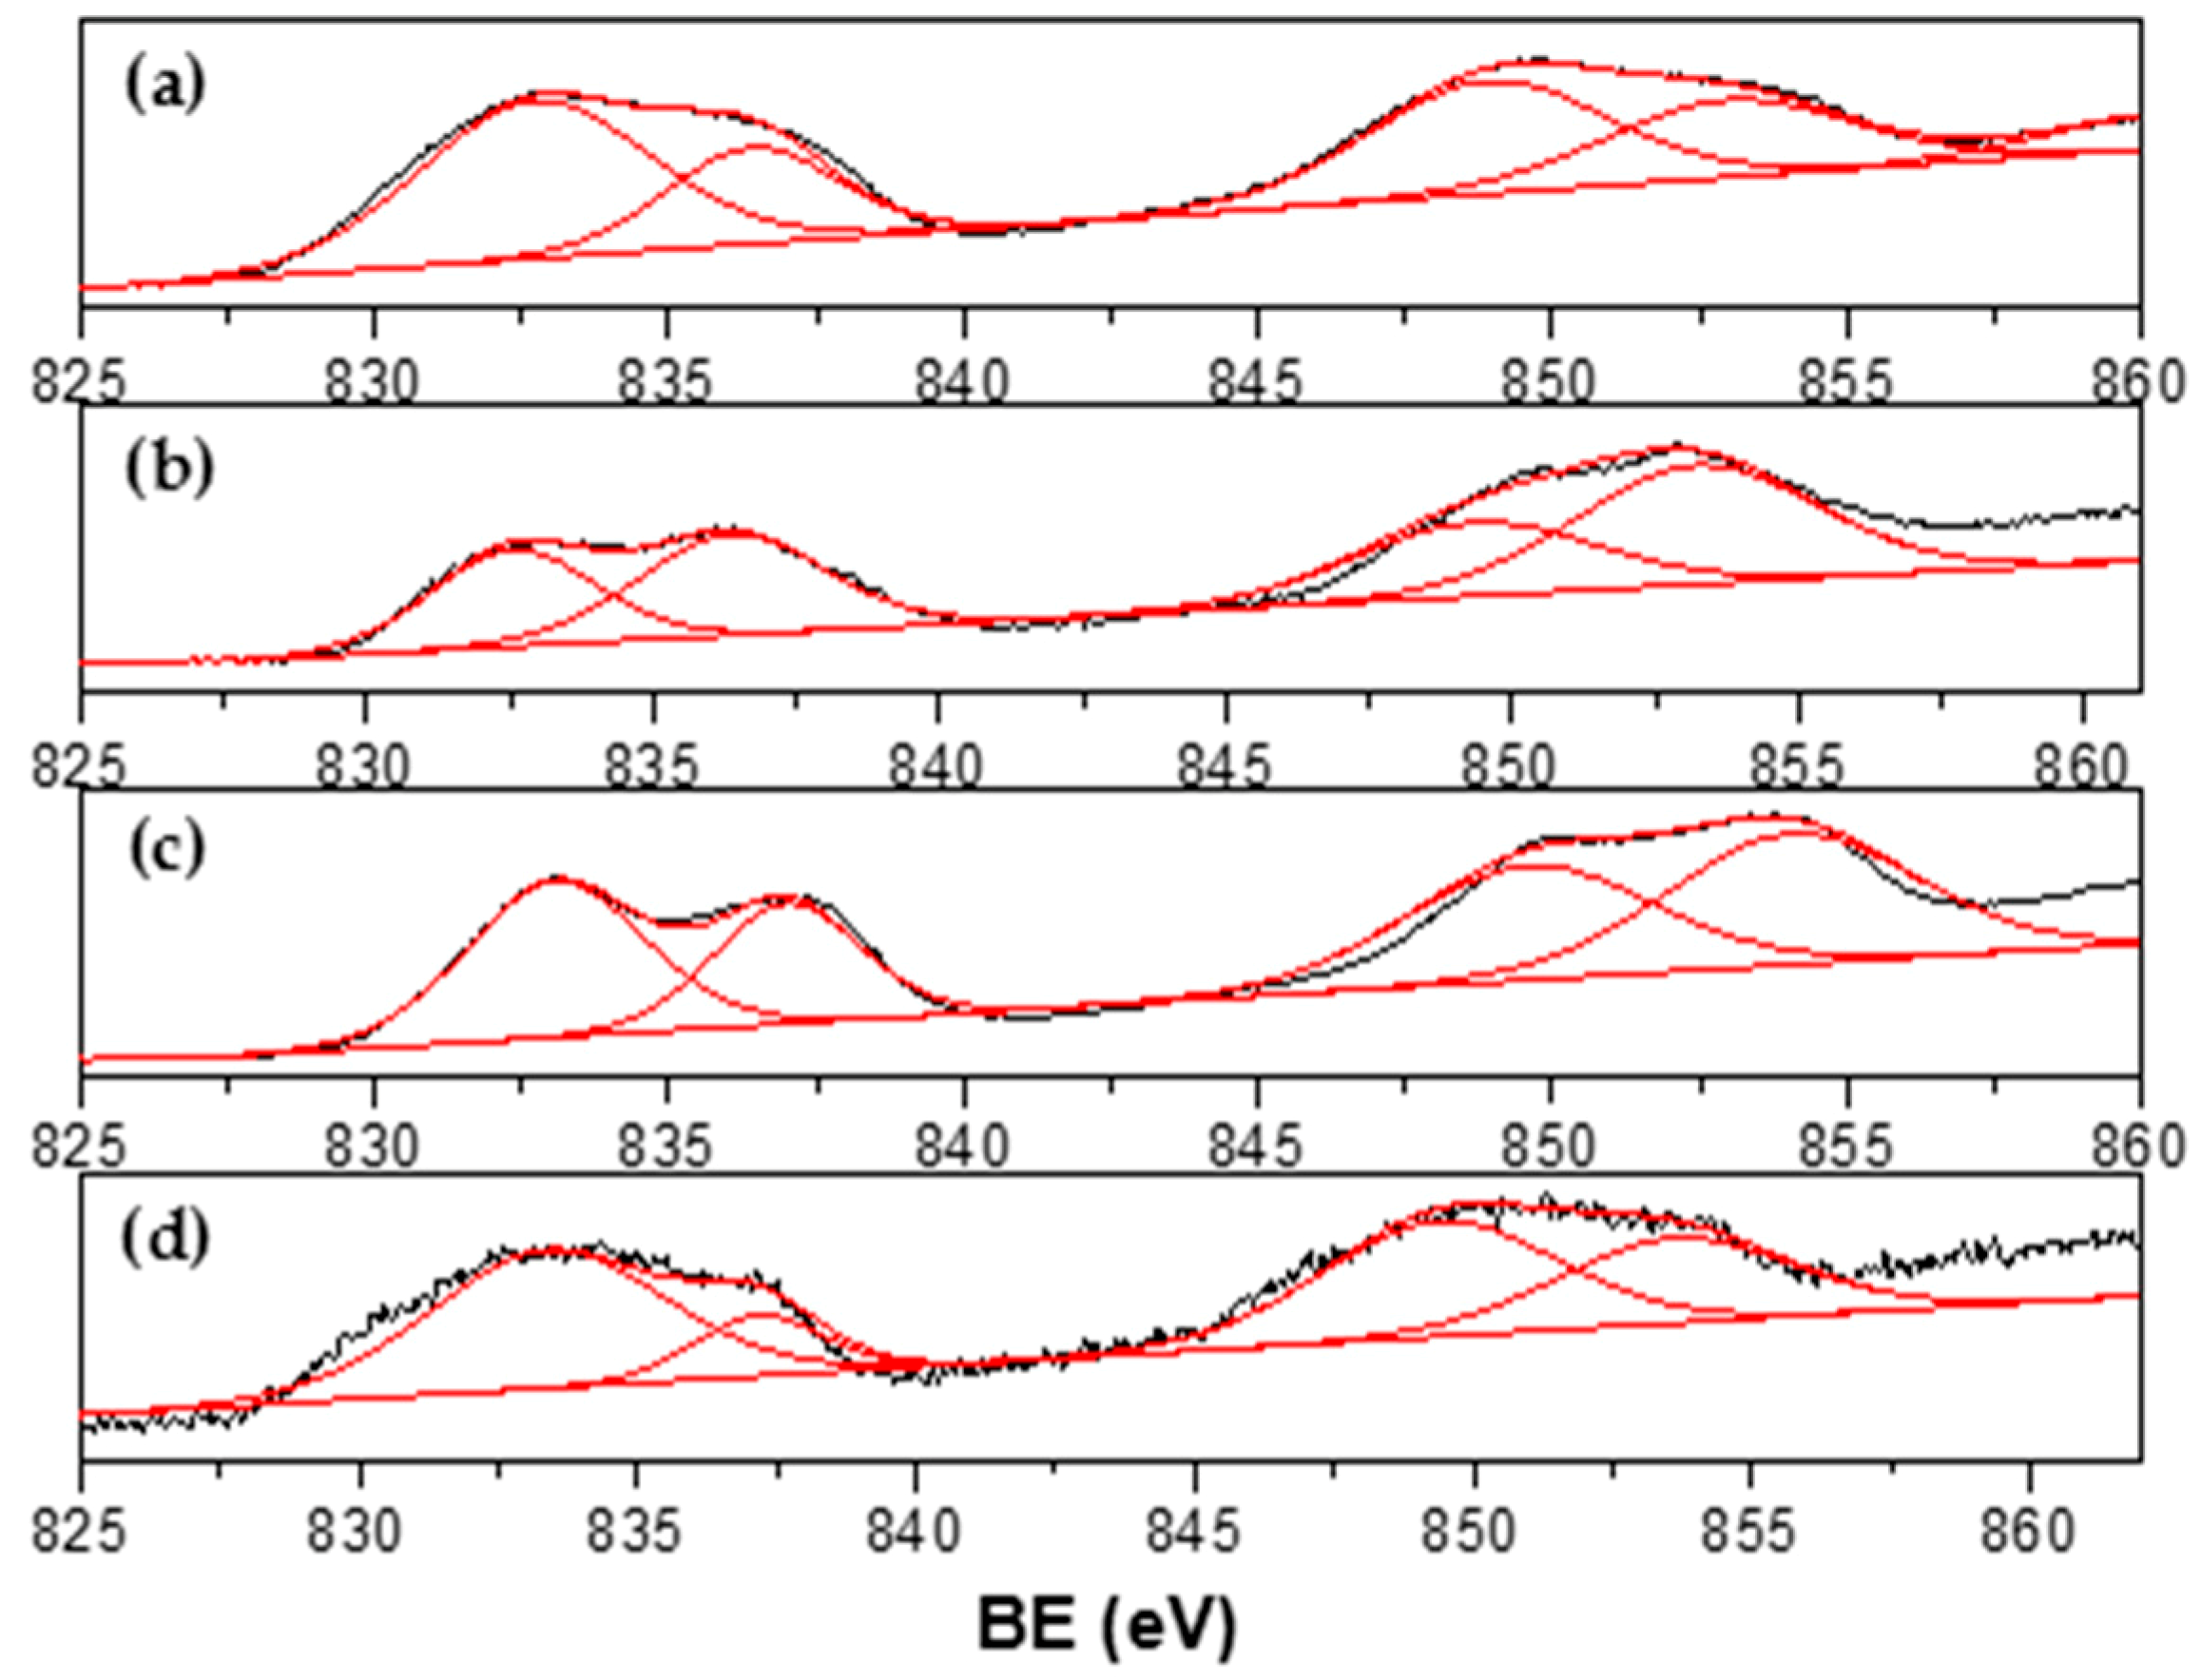
3.1. Catalyst Characterization

Diffractograms of passivated catalysts synthesized by the Pechini method are shown in Figure 1. The fresh catalyst with x = 0 showed six diffraction angles (2θ) at 23.2, 32.9, 33.3, 40.7, 47.5, and 59.0° related to the (012), (110), (104), (202), (024), and (214) respective crystal planes of rhombohedral LaCoO3 (JCPDS 48-0123). For the Ni-containing catalyst, these peaks are slightly displaced, which could be a consequence of the possible insertion of Ni into the structure. In addition, a diffraction line at 2θ ~ 32.7° attributed to the LaNiO3 structure [24] was mainly detected for the La0.8Ce0.2Ni0.7Co0.3 precursor. This result is not surprising given the greater amount of nickel in this precursor. Strong peaks corresponding to Co2O3, La(OH)3, and NiO were also observed. Peaks detected at 31.8, 36.2, 44.9, 59.5, and 65.5° are due to planes (2 2 0), (3 1 1), (4 0 0), (5 1 1), and (4 4 0), respectively, (JCPDS 65-3103) of the Co2O3 cubic phase, while those observed at 2θ of 15.8, 28.1, and 49.1° (JCPDS 00-036-1841) are characteristic of La(OH)3. The diffraction lines corresponding to NiO (2θ = 37.2, 43.3, and 62.9° JCPDS 01-073-1519) appeared mainly in the precursor with higher nickel content (La0.8Ce0.2Ni0.7Co0.3) although slightly shifted. The presence of these latter phases is an indication that there was possibly an excessive amount of cations that led to the segregation of these species, as has been reported by other authors [25,26,27]. The passivated Ni0.7Co0.3/La0.8Ce0.2, Ni0.4Co0.6/La0.8Ce0.2, and Co/La0.8Ce0.2 catalysts (Figure 2) exhibited clear signals indexed at 2θ = 28.6° (1 1 1), 33.1° (2 0 0), 47.6° (2 2 0), and 56.5° (3 1 1) (JCPDS 081-0792) attributed to a fluorite-type structure of CeO2. Similarly, these diffractograms revealed the presence of peaks corresponding to La2O3 at 26.1, 29.1, 29.9, 39.64, 46, and 52° (JCPDS 01-074-2430). The La(OH)3 phase was also detected after the reduction stage. Diffraction lines attributable to Co2O3 were still observed in the Co/La0.8Ce0.2 catalyst after reduction, showing that this species was hardly reducible and probably the presence of Ni (Ni0.7Co0.3/La0.8Ce0.2, Ni0.4Co0.6/La0.8Ce0.2, and Ni0.1Co0.9/La0.8Ce0.2) favored its reduction. However, XRD signals were only observed for Ni0.1Co0.9/La0.8Ce0.2 systems due to metallic Co (2θ = 44.3, 51.8, and 76.3°) and Ni (2θ = 44.5, 51.8, and 76.5°). It is possible that these peaks were not detectable for the other catalysts due to a high dispersion of these species, as confirmed by H2 chemisorption and TEM (Table 1).
Figure 3 shows the H2-TPR profiles of the supported Ni-Co catalysts. The reduction profile of all oxidized catalysts exhibited two peaks in the range between 470–700 K and 700–923 K with different maximum temperatures between them.
The first peak can be related to the reduction of Co3+ to Co2+, at the same time as the Ni3+ to Ni2+, coming from the perovskite structure, as has already been reported [26,27,28]. Subsequently, the second peak corresponds to the reduction of Co2+ to Co0 and/or Ni2+ to Ni0 of the same structure. When the amount of Ni increases, the reduction temperature is shifted to lower temperatures (Ni0.7Co0.3/La0.8Ce0.2 and Ni0.4Co0.6/La0.8Ce0.2), which can be ascribed to the reduction of Ni2+ to Ni0 into the nickel oxide phase [26,27,29] found by XRD. In the Co/La0.8Ce0.2 catalyst, the lowest observed reduction temperature (~573 K) can also be associated with the reduction of Co3O4→CoO→Co [29]. Based on XRD and TPR results, after reduction at 873 K, the perovskite structure was destroyed, and metal Co-Ni particles were supported over lanthanum-cerium oxides. Total acidity of the samples was determined by NH3-TPD (Figure 4), and the results are shown in Table 1.
Generally, the strength of acid sites is classified depending on the temperature in which the desorption peaks appear as follows: weak (<473 K), medium (between 473 and 673 K) and strong (>673 K). The Co/La0.8Ce0.2, Ni0.1Co0.9/La0.8Ce0.2, and Ni0.4Co0.6/La0.8Ce0.2 catalysts exhibited some signals corresponding to weak and intermediate acid sites, whereas the Ni0.7Co0.3/La0.8Ce0.2 system showed only intermediate acid sites.
Table 1 also shows the textural properties of catalysts studied. An increase in the cobalt loading in the bimetallic catalysts seems to decrease the surface area, thus Ni0.7Co0.3/La0.8Ce0.2 exhibited the highest surface (33 m2 g−1), whereas Ni0.1Co0.9/La0.8Ce0.2 had the lowest surface area (14 m2 g−1). The low surface area of the latter was probably due to the blocking of the support pores by cobalt particles. Figure 5 shows the N2 adsorption–desorption isotherms for all catalysts. The isotherms for the Ni-Co catalysts were type IV with H3 hysteresis, suggesting slit-shaped pores [30].
TEM micrographs with their corresponding histograms are presented in Figure 6. Particle sizes as determined by TEM are shown in Table 1. The presence of both metals had an effect on particle size—as the nickel content increased, the particle size decreased—as has been reported previously [31]. This could be an indication of interaction between metals. As the histograms show, for catalysts with low or no Ni content, a wide size distribution was observed, contrary to that observed for Ni > 0.1. The presence of both metals resulted in small particle sizes in a narrow distribution. These results were confirmed by H2 chemisorption measurements.
The XPS spectra for Ni1-x-Cox catalysts are shown in Figure 7, Figure 8, Figure 9 and Figure 10. Signal deconvolution of the Ni 2p3/2 core-level region (Figure 7) led to four main peaks, centered at 850.8, 853.1, 855.1, and 861.4 eV. The peaks at ~853.1 eV (main peak) and 861.4 eV (satellite peak) correspond to NiO, while the peak at 855.1 was assigned to Ni(OH)2 [32,33]. According to the literature, the Ni metal 2p3/2 peak position is found at around 852.3 ± 0.4 eV [31,34]; however, in this study, this peak underwent a shift around 0.8–1.8 eV. This result could be related to a possible Ni–Co interaction. For Co, deconvolution curves of Co2p binding energy range from 770 eV to 810 eV and are shown in Figure 8.
Signals obtained are consistent with Co metallic and Co in Co2+ and Co3+ oxidation states, as has been reported [34,35,36,37]. A peak detected around 777.6 eV could be assigned to metallic Co but shifted approximately 0.6 eV from the reported value [34,35,36,37], which confirms the results found for Ni XPS. Co2* and/or Co3+ species were identified by the presence of peaks around 780 eV and the characteristic strong satellite peak at around 786 eV ascribed to CoO. XPS results confirmed the presence of metallic particles of Ni and Co and may suggest an interaction between them.
Ce 3d3/2,5/2 spectra (Figure 9) are composed of multiplets corresponding to the spin-orbit split 3d5/2 and 3d3/2 core holes for Ce4+ ions. The binding energy located around 917 and 898.3 eV were attributed to a Ce 3d94f0 O 2p6 final state, being the first peak attributed to Ce4+ ions. The other peaks found at 901.3, 882.7, 907.3, and 888.5 eV are due to Ce 3d94f2 O 2p4 and 3d94f1 final states [38,39]. These results indicate that the surface of the catalysts are composed of CeO2 oxides; however, a broadening or shoulder observed in spectra at about 885.3 and 903.8 eV reveals that Ce3+ ions were also present on the support surface [40]. These peaks are the result of a Ce 3d94f1 O 2p6 final state [39]. The La 3d spectra for Ni1-xCox/La0.8Ce0.2 catalysts (Figure 10) consist of two doublets corresponding to La 3d5/2 and 3d3/2 core levels observed at 833.1 and 849.5 eV, respectively, and the satellite split to 4.2 eV reported for La2O3 [41,42]. XPS results confirmed that the support surface is composed of La2O3 and CeO2 oxides.

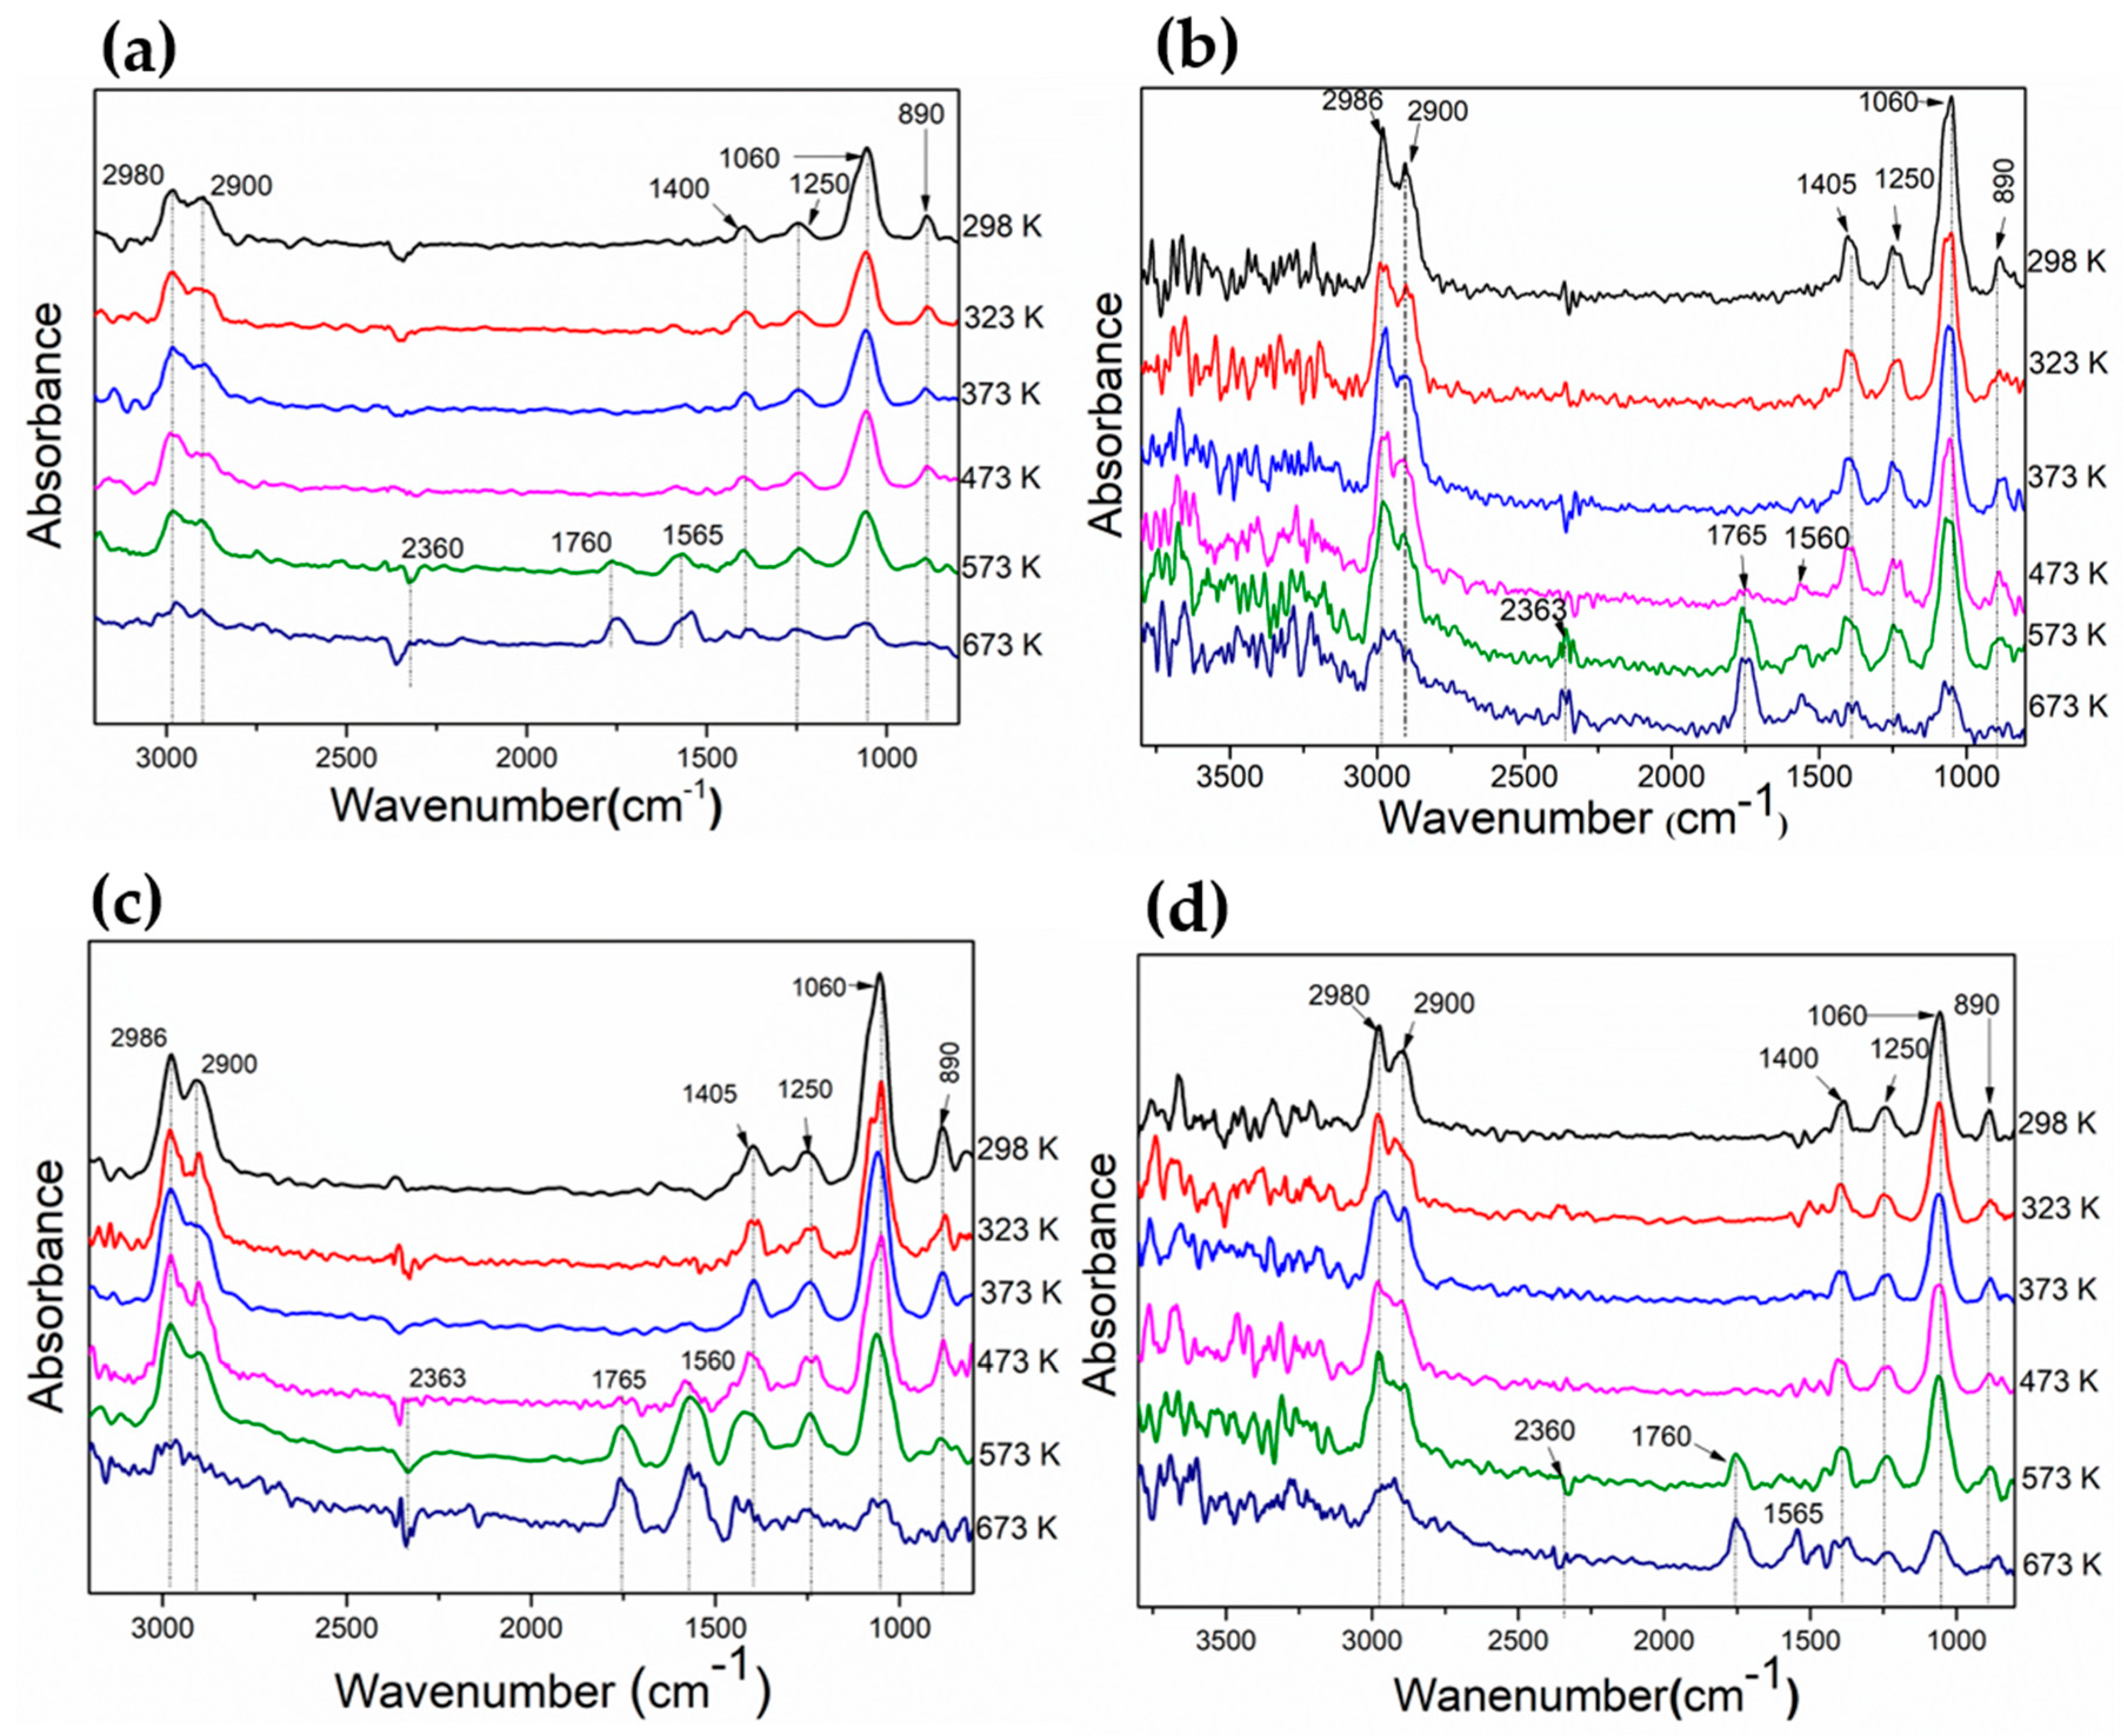
3.2. Evaluation of Adsorbed Species on the Catalyst Surface During Ethanol Decomposition by DRIFT

Adsorbed species on the catalyst surface during ethanol decomposition from 303 to 673 K were evaluated by DRIFT spectroscopy (Figure 11). Ethanol adsorbed through ethoxy species on the surface catalysts. The ethoxy species is represented by bands at 2980 cm−1 (anti-symmetric νas CH3), 2900 cm−1 (symmetric νs CH3), 1060 cm−1 (symmetric νs C–O), and 1400 cm−1sCH3), and its formation on the catalyst surface is due to the scission of the O-H bond. When the temperature rose, band intensities were reduced probably due to the transformation of ethoxy species. At 473 K, bands at 1765 cm−1 and 1560 cm−1 corresponding to νs(CO) and νas(COO) appeared, which can be due to dehydrogenation from ethoxy species leading to adsorbed acetaldehyde and/or acetate. Acetaldehyde may be dehydrogenated to acetyl species, and this intermediate may undergo support-induced oxidation to acetate species by both Osupport or OHsupport, as has been reported [43,44,45]. This can be favored on supports of redox oxides as CeO2.
C H 3 C H 2 O a d s     C H 3 C H O a d s + H 2
C H 3 C H 2 O a d s     C H 3 C O a d s     C H 3 C O O a d s
As temperature rises, band intensities associated with ethoxy species drop, suggesting their conversion with the concomitant rising of bands associated with acetaldehyde and/or acetates. As can be observed for Ni0.1Co0.9 and Ni0.4Co0.6, these species rose at lower temperatures. On the other hand, acetate formation was more favored on Co and Ni0.4Co0.6, which was confirmed by the low intensities of signals for C–H stretching (2800–3050 cm−1). Conversely, the band attributed to acetaldehyde was more pronounced for Ni0.1Co0.9 and Ni0.7Co0.3. Both acetaldehyde and acetates can be decomposed leading to the formation of CO2/CO and CH4 (Equations (6) and (7)), and the bands at 2363 cm−1 and 3017 cm−1, respectively, confirm their presence. Since the goal is that ethanol decomposition should address the selective generation of H2, the formation and decomposition of acetaldehyde and acetates are undesirable reactions. In addition, acetates can remain adsorbed on catalyst-blocking catalytic sites [22]. All catalysts showed signals attributable to these species even at high temperature, although the acetate signal on Ni0.7Co0.3 was less significant, which could point at a higher stability of this catalyst.
C H 3 C H O     C H 4 + C O a d s
C H 3 C O O a d s     C H 3 ( a d s ) + C O 2 a d s

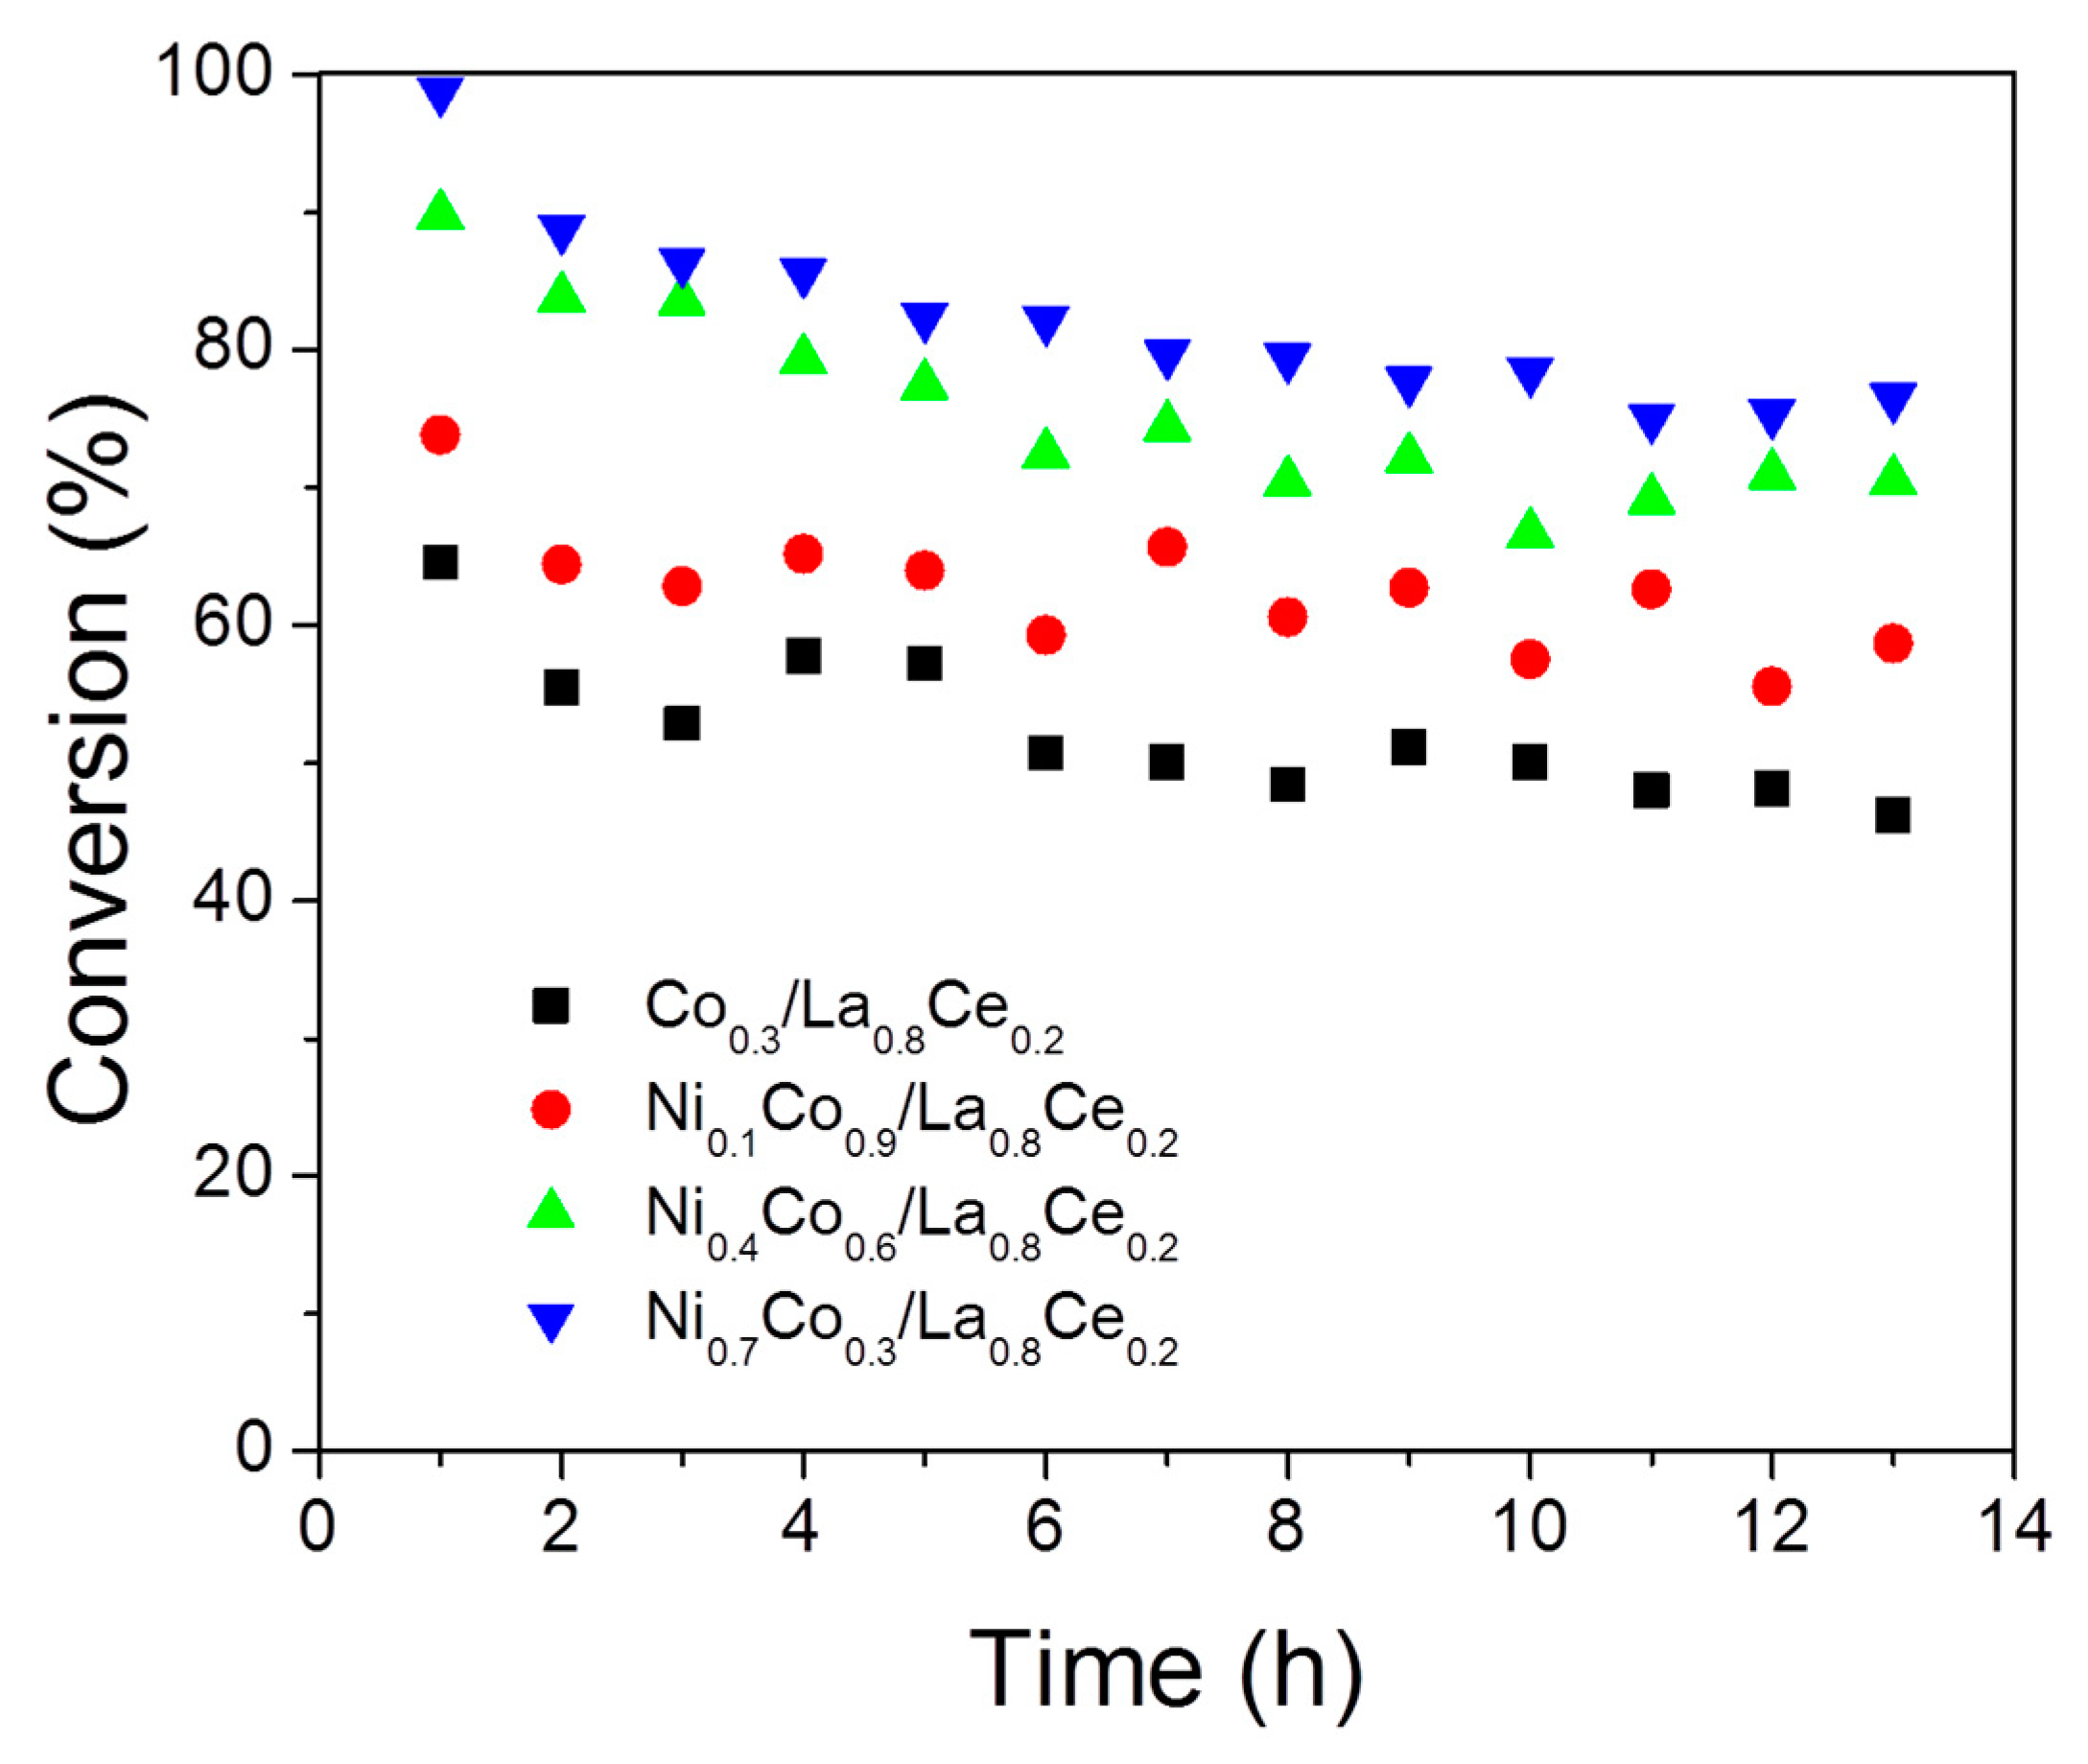
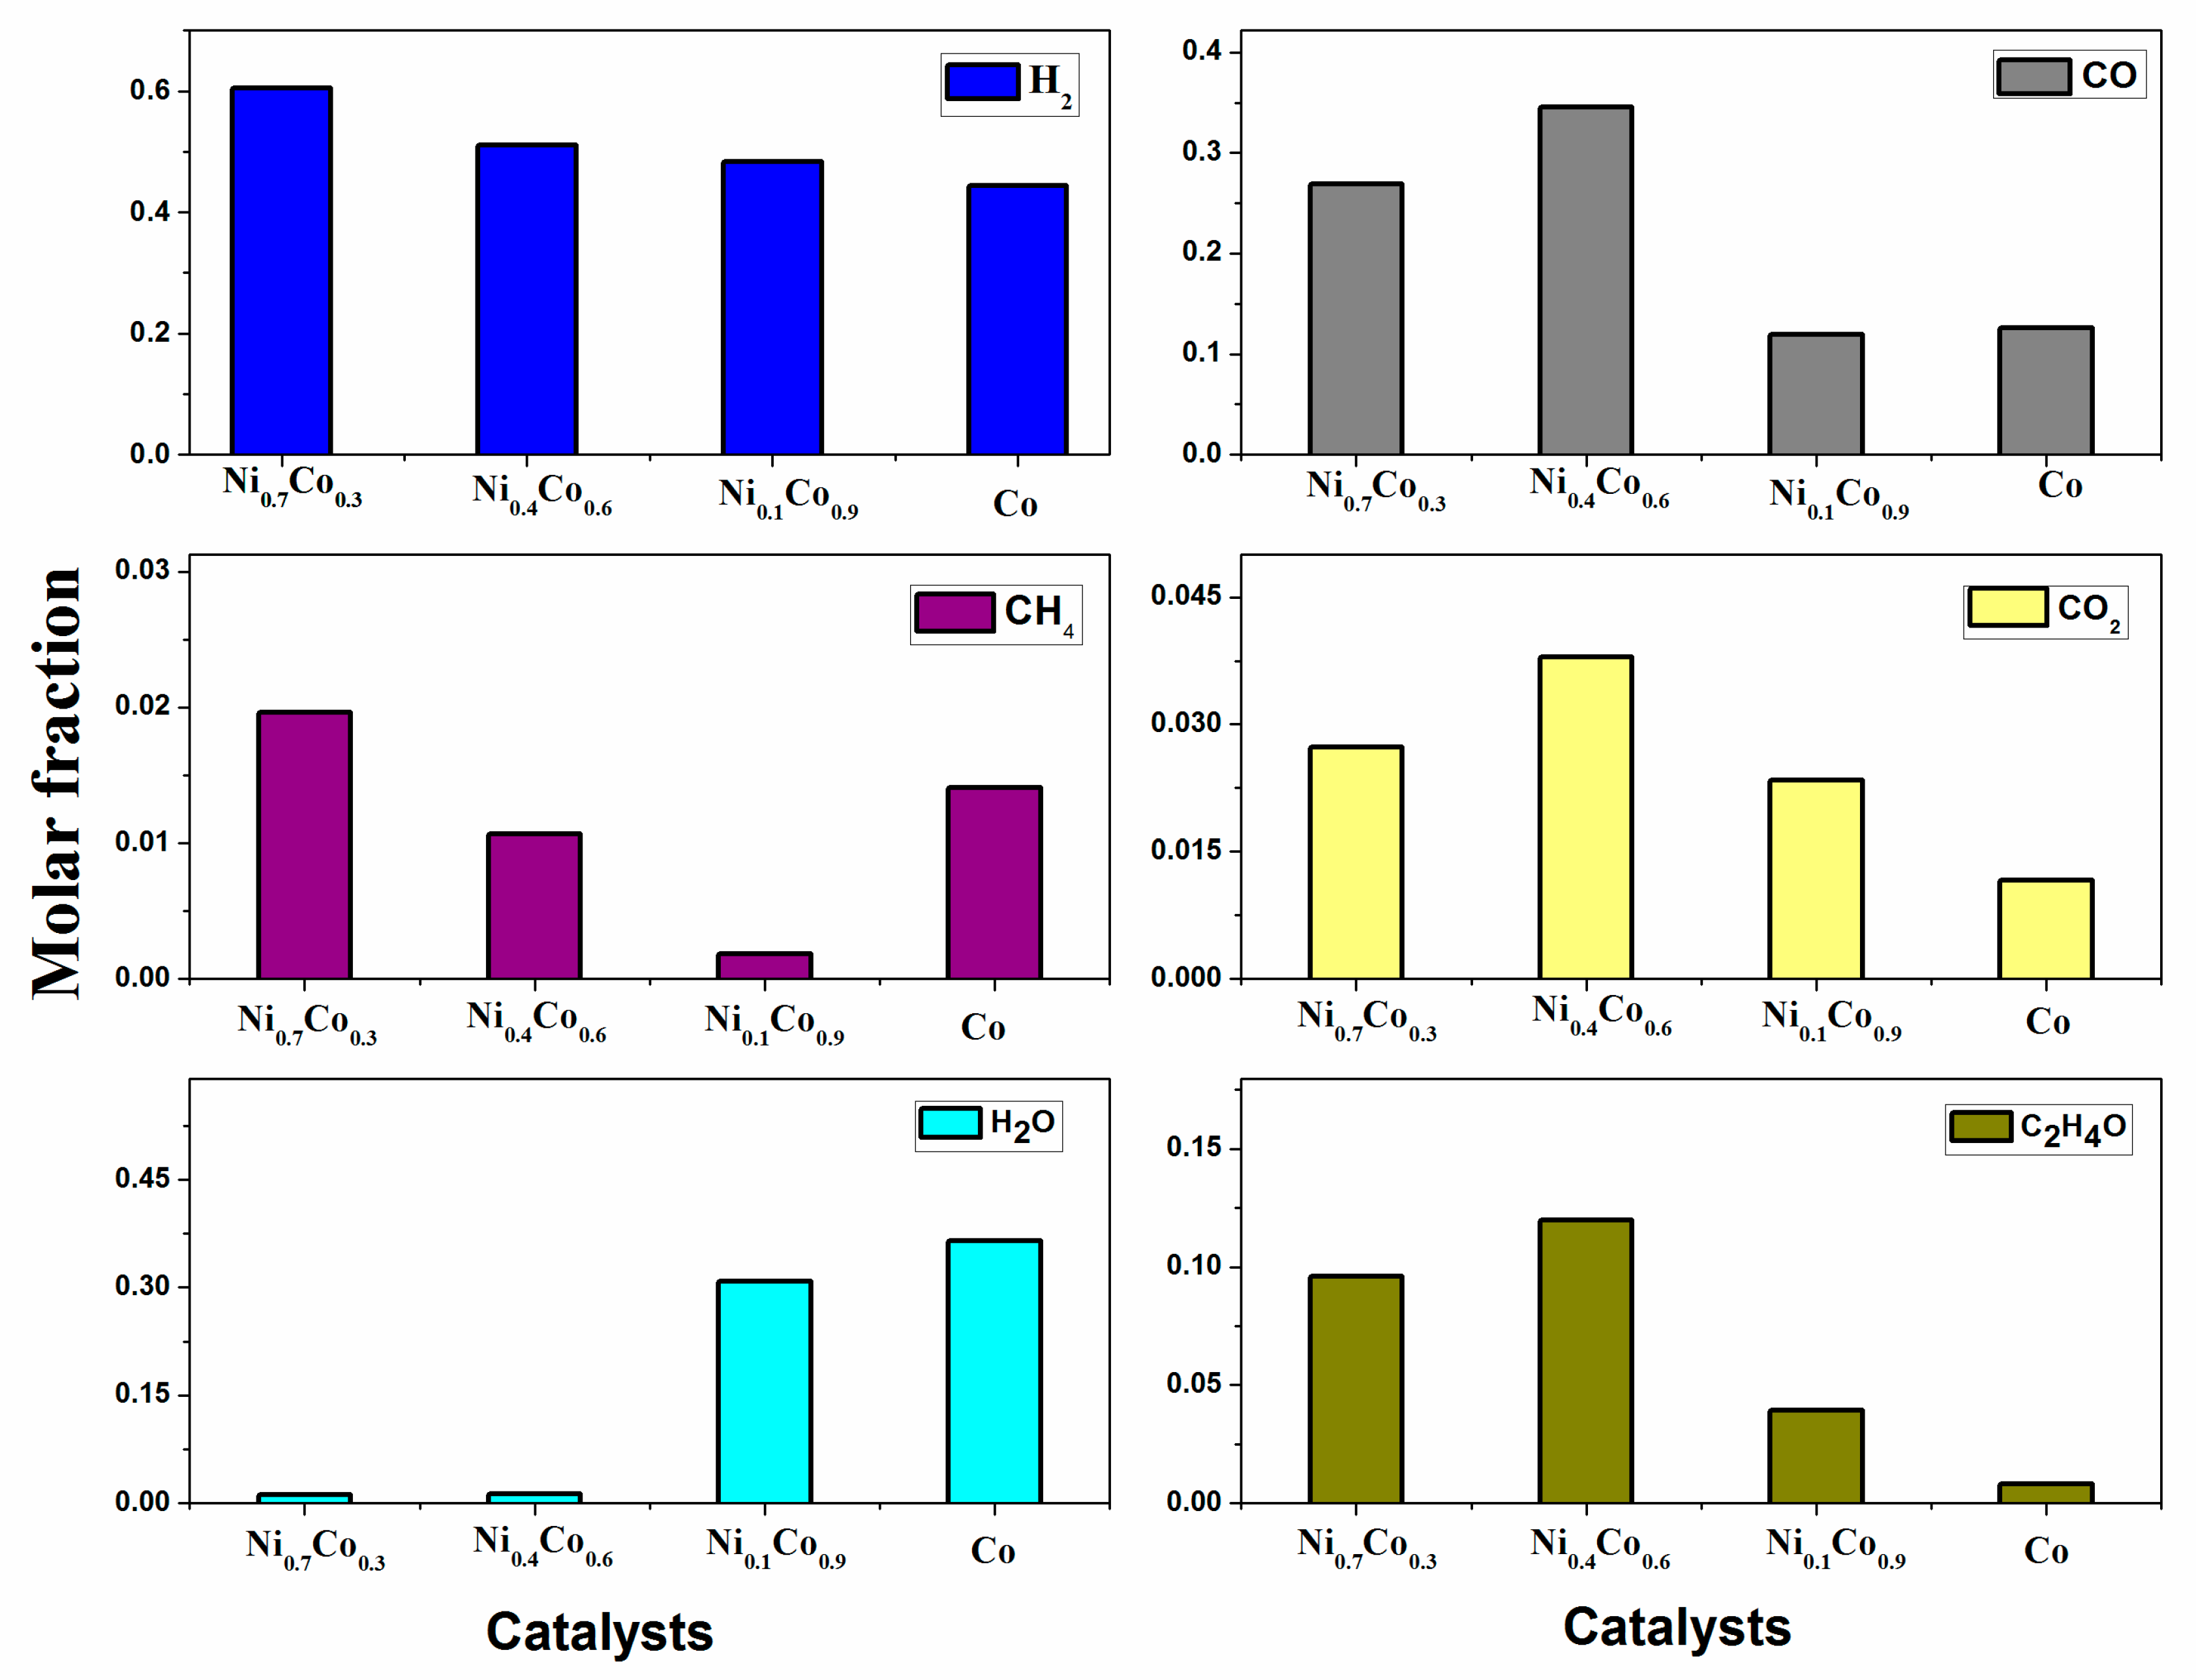
3.3. Ethanol Decomposition Catalytic Tests

The initial rate of reaction (−ra)0 for the ethanol decomposition was determined considering an irreversible, pseudo-first-order chemical reaction under isothermal conditions (973 K). The results are shown in Table 2. These rate values decreased in the following sequence: Ni0.7Co0.3/La0.8Ce0.2 > Ni0.4Co0.6/La0.8Ce0.2 > Ni0.1Co0.9/La0.8Ce0.2 > Co/La0.8Ce0.2. This behavior indicated that catalysts with high Ni content had a greater capacity to decompose ethanol than the systems having a low Ni content or no Ni. A different behavior was observed when the turnover frequency (TOF) was calculated; Co/La0.8Ce0.2 and Ni0.1Co0.9/La0.8Ce0.2 catalysts were the most active systems for ethanol decomposition at initial or clean conditions. The Weisz–Prater criterion (CWP), ethanol conversion, and hydrogen selectivity for the Ni1-xCox/La0.8Ce0.2 catalysts were calculated, and the results are shown in Table 2. All catalysts exhibited CWP values lower than 0.3; therefore, the results indicate the absence of mass transfer effects in ethanol decomposition reactions.
The Ni0.7Co0.3/La0.8Ce0.2 and Ni0.4Co0.6/La00.8Ce0.2 systems exhibited a high level of conversion (≥90%) in the first hour of reaction, whereas Ni0.1Co0.9/La0.8Ce0.2 and Co/La0.8Ce0.2 showed conversions of ethanol of 74.6% and 65.4%, respectively (Table 2). These same catalysts (Ni0.7 and Ni0.4) showed higher hydrogen selectivity than Ni0.1 and Co catalysts. The H2 selectivity for Ni0.7Co0.3/La0.8Ce0.2 was 75%, whereas for Co/La0.8Ce0.2 it was only 52.6%. The fact that Ni0.7Co0.3/La0.8Ce0.2 presented higher activity and hydrogen selectivity in ethanol decomposition may be related to the dispersion, which may increase the active metal surface to participate in the transformation of ethanol.
Figure 12 shows the catalytic stability in the ethanol decomposition at 973 K during 13 h time on stream. The conversion level decreased slightly after 4–5 h of reaction and, afterward, the conversion of ethanol stabilized to levels of activity ≥50%. The observed decrease could be caused by the accumulation of carbon on the catalyst surface. Other products such as carbon monoxide, methane, carbon dioxide, water, and acetaldehyde were detected in the reaction of ethanol decomposition
Hydrogen, carbon monoxide, and methane were the principal products detected over the Ni1-xCox/La0.8Ce0.2 systems. This behavior indicates that ethanol decomposition to hydrogen formation (Equation (1)) is favored at this temperature (973 K). Meanwhile, at 673 K, the systems exhibited a high production of carbon dioxide as detected by DRIFTS of ethanol decomposition. At 973 K, other compounds containing hydrogen such as methane, water, and acetaldehyde were also detected for all catalysts. The production of these compounds caused a decrease in hydrogen selectivity and their formation was related to both decomposition (Equation (1)), oxidation (Equation (4)), as well as the Boudouard (Equation (2)) and methanation (Equations (8) and (9)) reactions.
C O + 3 H 2     C H 4 + H 2 O
C O 2 + 4 H 2     C H 4 + 2 H 2 O
Product distribution shown in Figure 13 confirms that other reactions besides the ethanol decomposition reaction (Equation (1)) occurred on all catalysts. Ni0.7 and Ni0.4 catalysts favored the dehydrogenation route leading to acetaldehyde (Equation (4)). The highest formation of acetaldehyde on Ni0.4 along with the presence of acetates detected even at high temperature by DRIFTS experiments indicates that this pathway reaction can be favored on this catalyst. This fact could be responsible for the high carbon deposition observed on this catalyst (Table 3). As has been reported [22], acetaldehyde can undergo an aldol condensation reaction yielding acetone (Equation (10)), which subsequently produces diacetone alcohol. Dehydration of this species gives rise to mesityl oxide (MO) (Equation (11)), whose oligomerization can lead to the formation of coke [22]. This indicates that, on the Ni0.4 catalyst, the promotion of C–C bond cleavage is inefficient and the decarbonylation of acetaldehyde (Equation (6)) competes with aldol condensation and further formation of acetone. The same took place on the catalyst containing only Co, where acetate species were detected by DRIFTS until high temperatures were reached.
2 C H 3 C H O ( a d s ) + O ( s )     C H 3 C O C H 3 ( a d s ) + H 2 + C O 2
2 C H 3 C O C H 3     ( C H 3 ) 2 C O ( O H ) C H 2 C O C H 3     ( C H 3 ) 2 C = C H C ( O ) C H 3 + H 2 O
The low amounts of CH4 detected in experiments carried out with the Ni0.1Co0.9 catalyst indicate that methane decomposition could be occurring, thereby promoting catalyst deactivation (Equation (3)). Furthermore, the lower amount of CO observed on Ni0.1Co0.9 and Co may be due to the participation of the Boudouard reaction (Equation (2)), which also leads to catalyst deactivation by carbon deposition. This observation agrees with obtained results by TGA and Raman experiments (see Section 3.2).
On the Ni0.1Co0.9 and Co catalysts, a high presence of H2O was found. H2O can originate from the ethanol dehydration reaction (Equation (12)), one of the most reported reactions involved in the catalyst deactivation in this type of process [2], which is favored over acid catalysts. Ethylene thus formed can polymerize to coke. According to the acidity measurements (Table 1), the catalysts with the most acidic sites were Ni0.4Co0.6/La00.8Ce0.2 > Co/La00.8Ce0.2 > Ni0.1Co0.9/La00.8Ce0.2 and these were also the ones with the highest carbon content (Table 3) after 13 h of reaction in the order Ni0.1Co0.9/La00.8Ce0.2 > Ni0.4Co0.6/La00.8Ce0.2 > Co/La00.8Ce0.2 Ni. Although H2O can also form from the methanation reaction (Equations (8) and (9)), no high CH4 content in evolved gases was found to justify this route.
C H 3 C H 2 O H     C 2 H 4 + H 2 O
The Ni0.7Co0.3/La00.8Ce0.2 catalyst displayed the higher ethanol conversion, selectivity to H2, and initial rate. Additionally, it was the catalyst with lower carbon deposition. These results can be related to its greater metal dispersion also associated with the highest specific surface area and much lower acidity compared to other catalysts. The amounts of metal used gave rise to an important metallic interaction, thus affecting both structural and electronic properties of the catalyst. In addition, the preparation method used led to metal nanoparticles being partially embedded in the oxide support, which displayed a lower tendency toward agglomeration and to coke deposition as mentioned in other studies [46,47,48]. Although a high carbon accumulation was observed on the catalysts, the stability only decreased slightly. This result may be due both to the formation of filamentous carbon on the catalysts, which does not always lead to catalyst deactivation [4], and to carbon gasification induced by metal–support interaction.

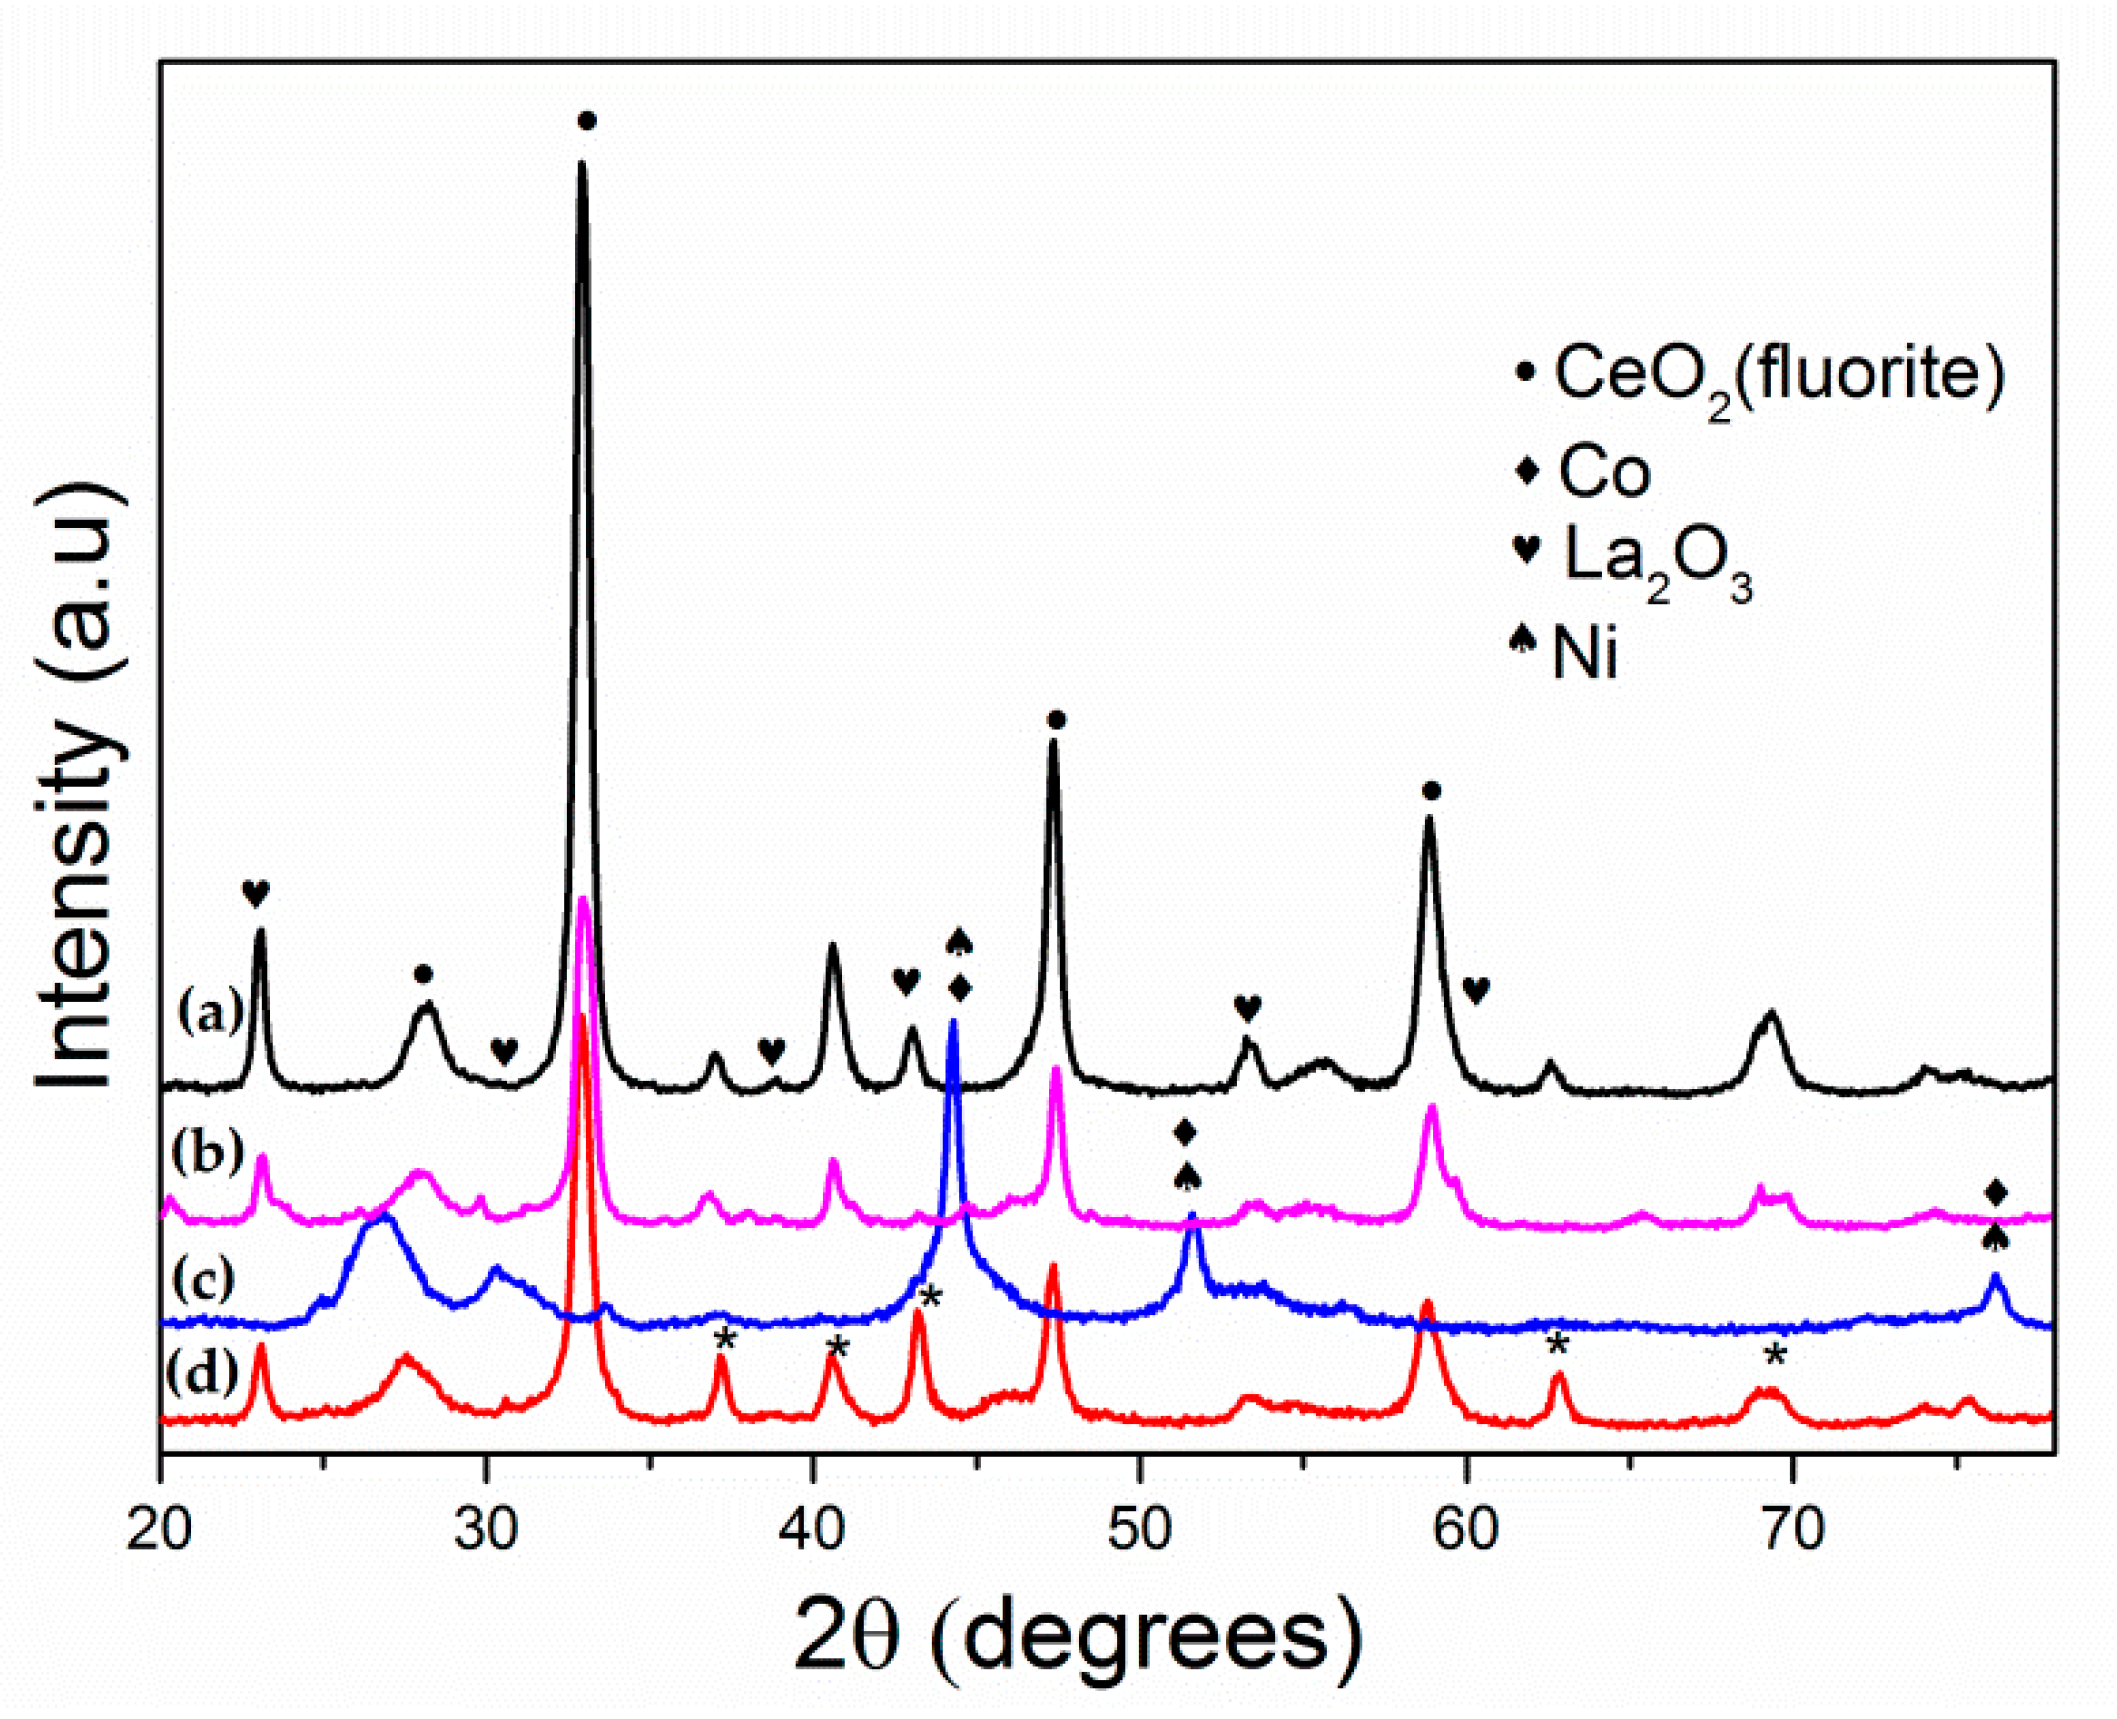
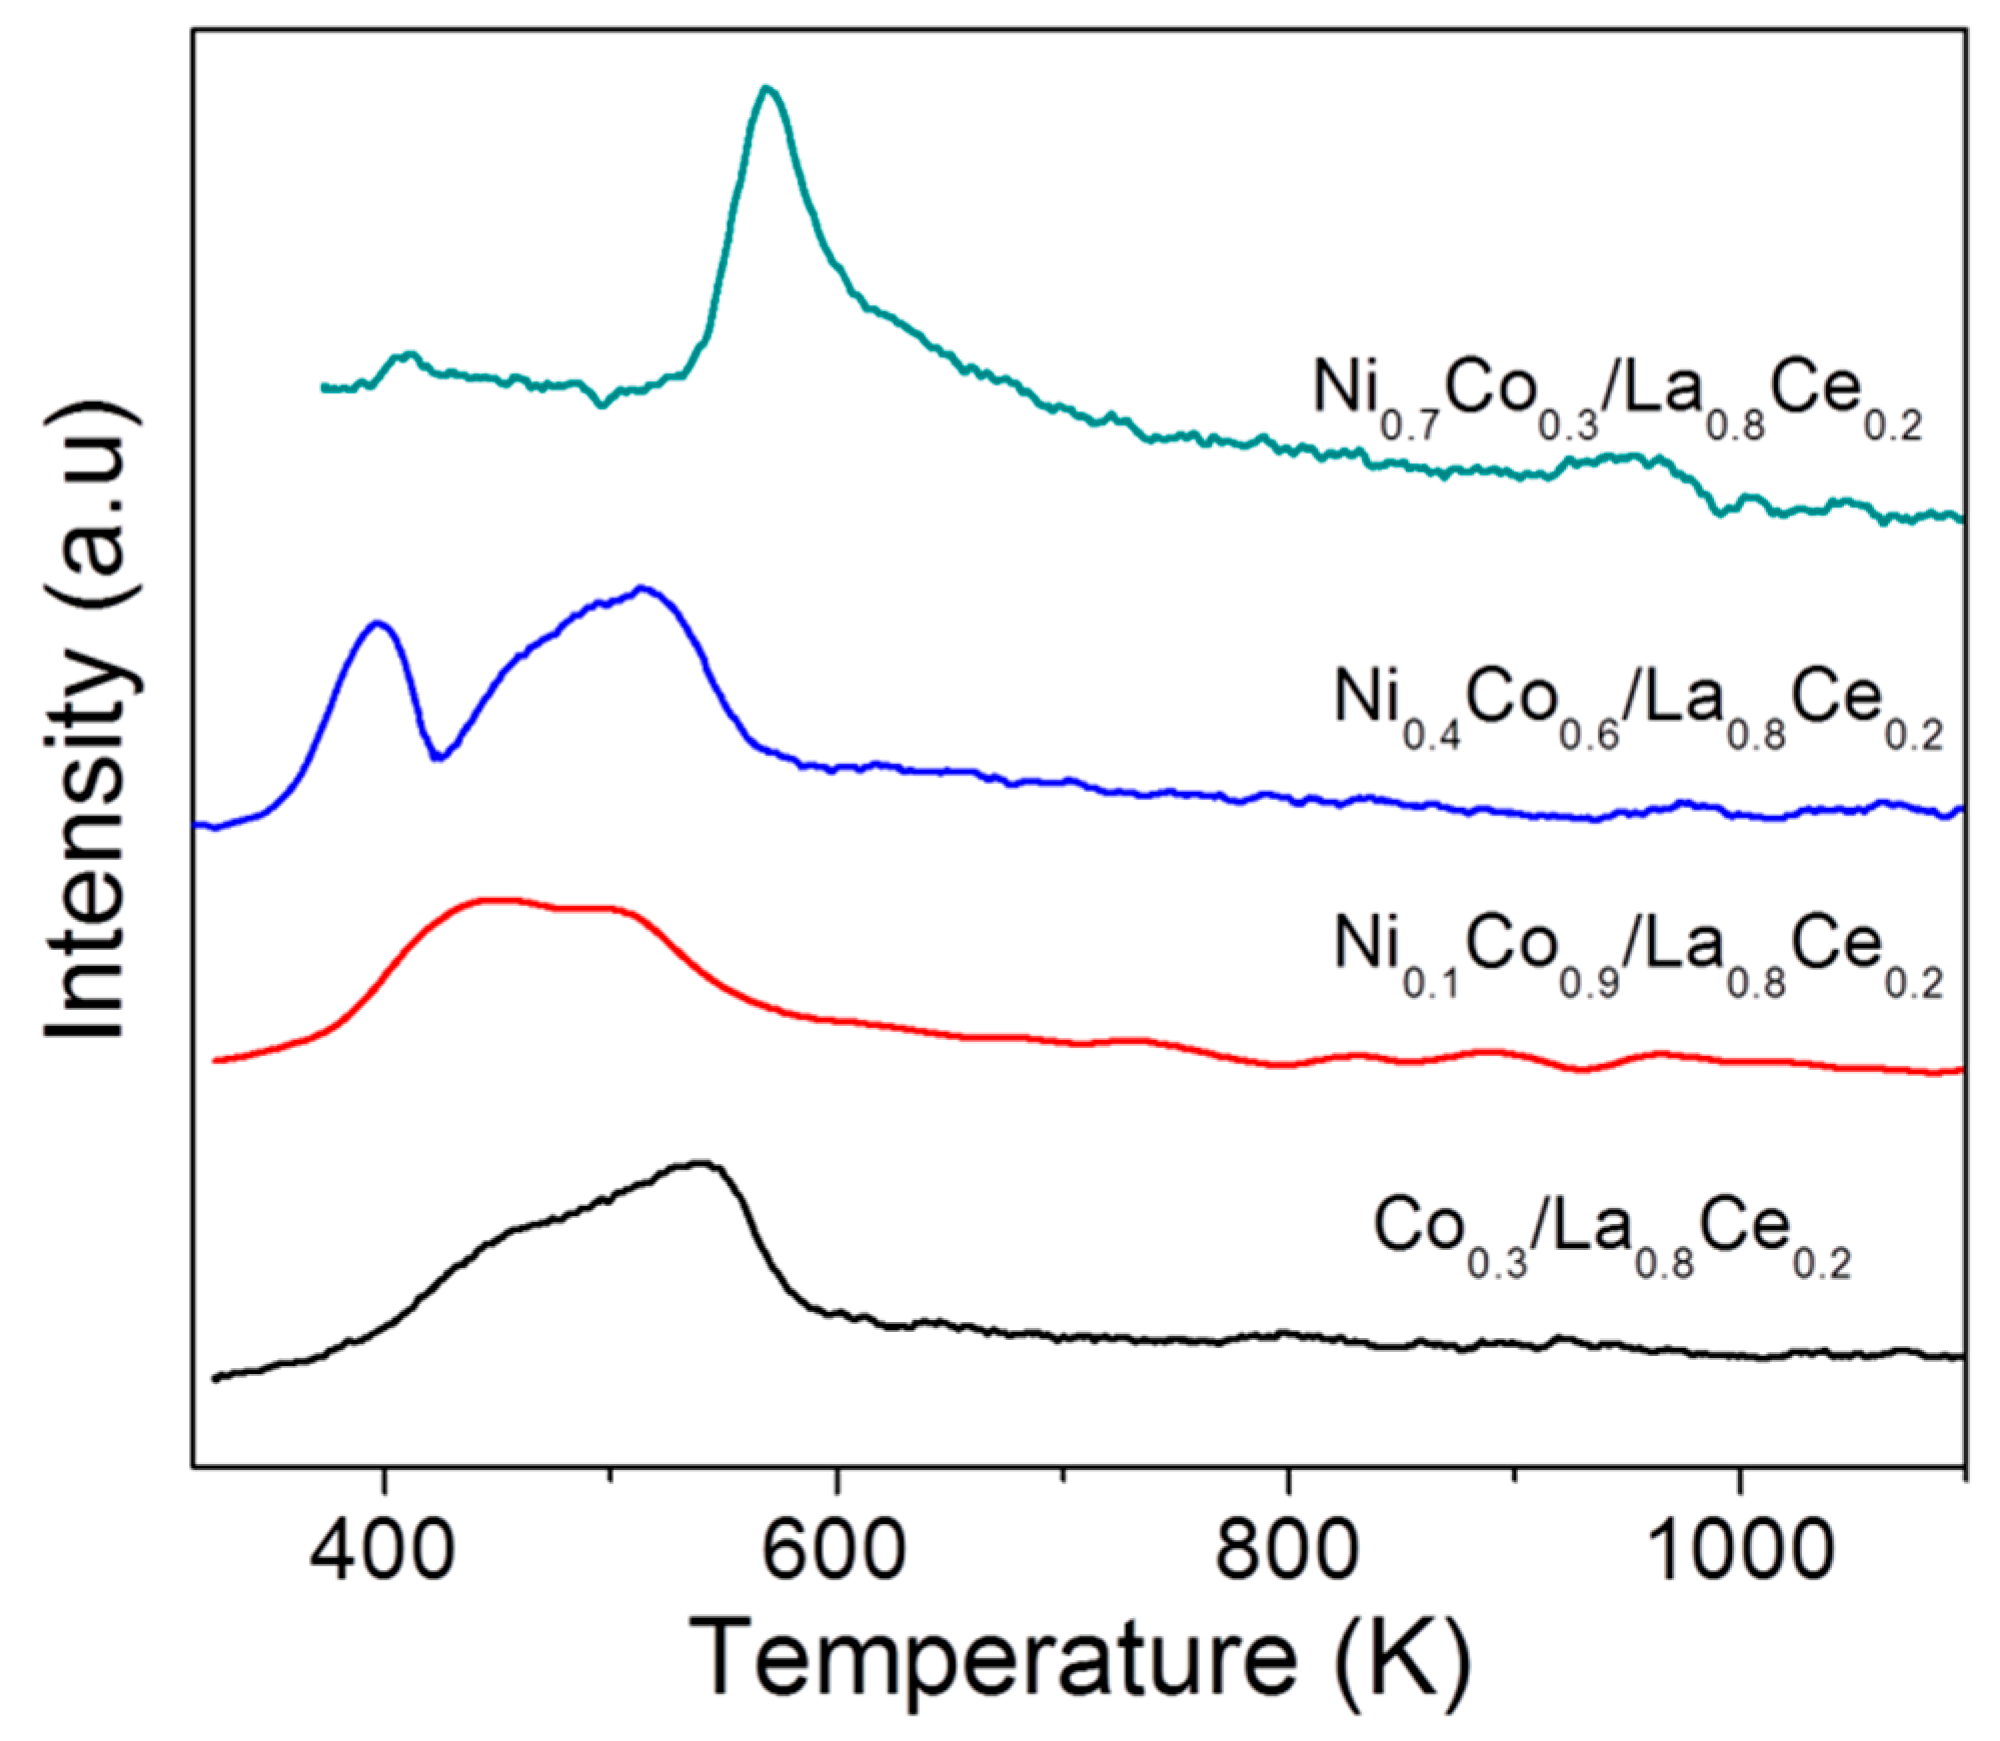
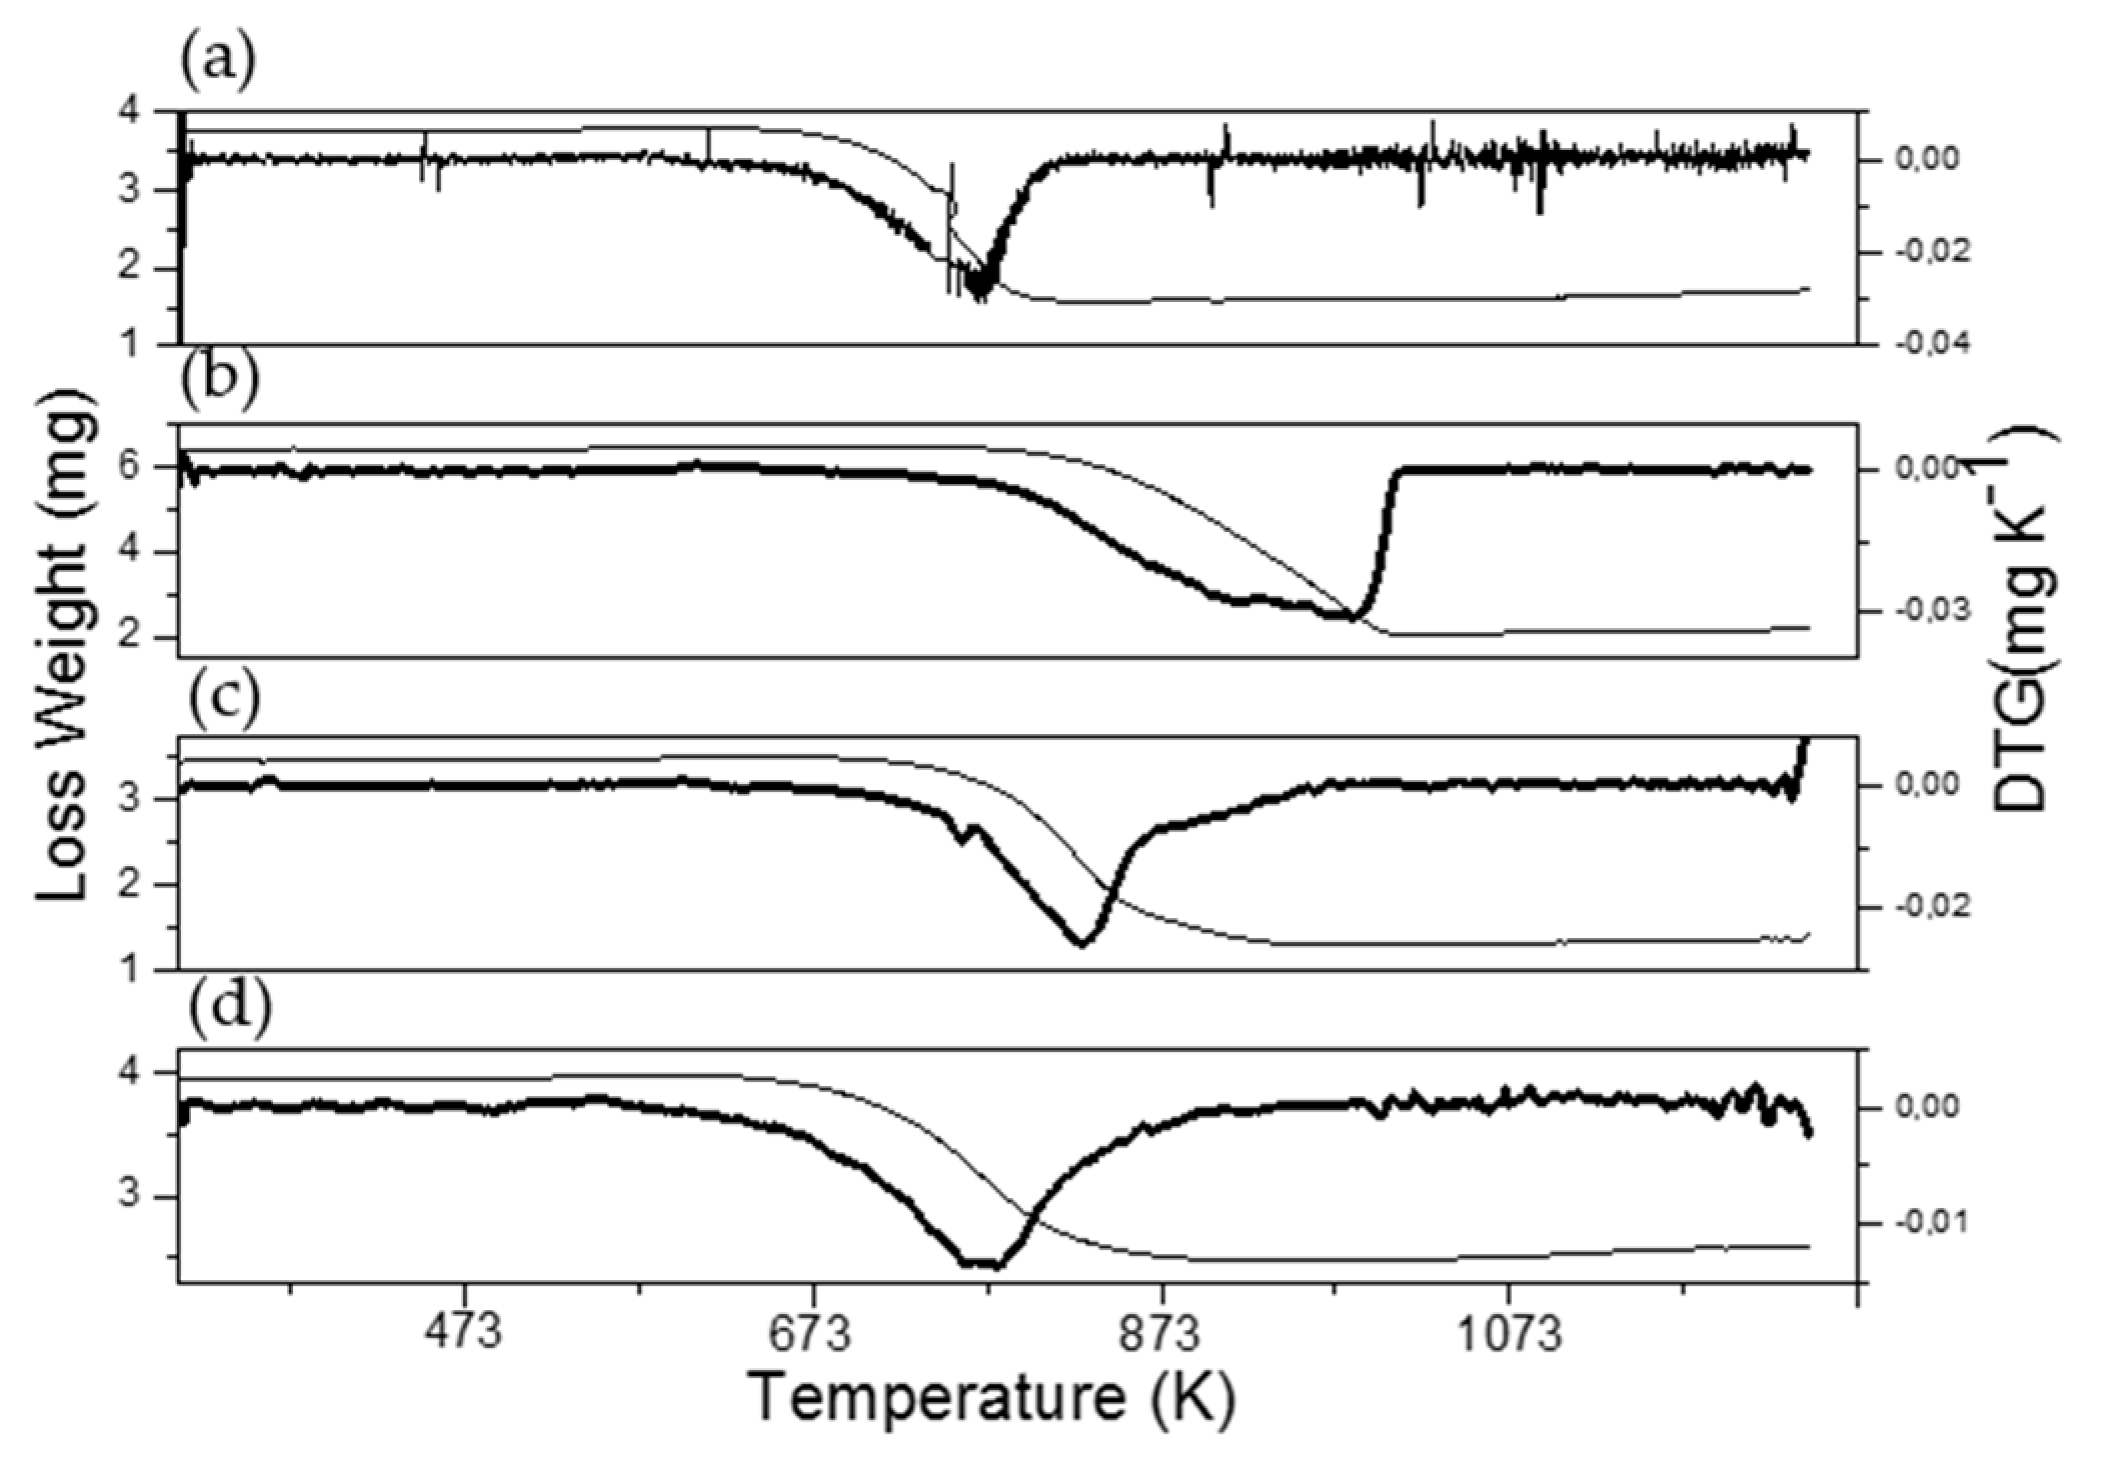
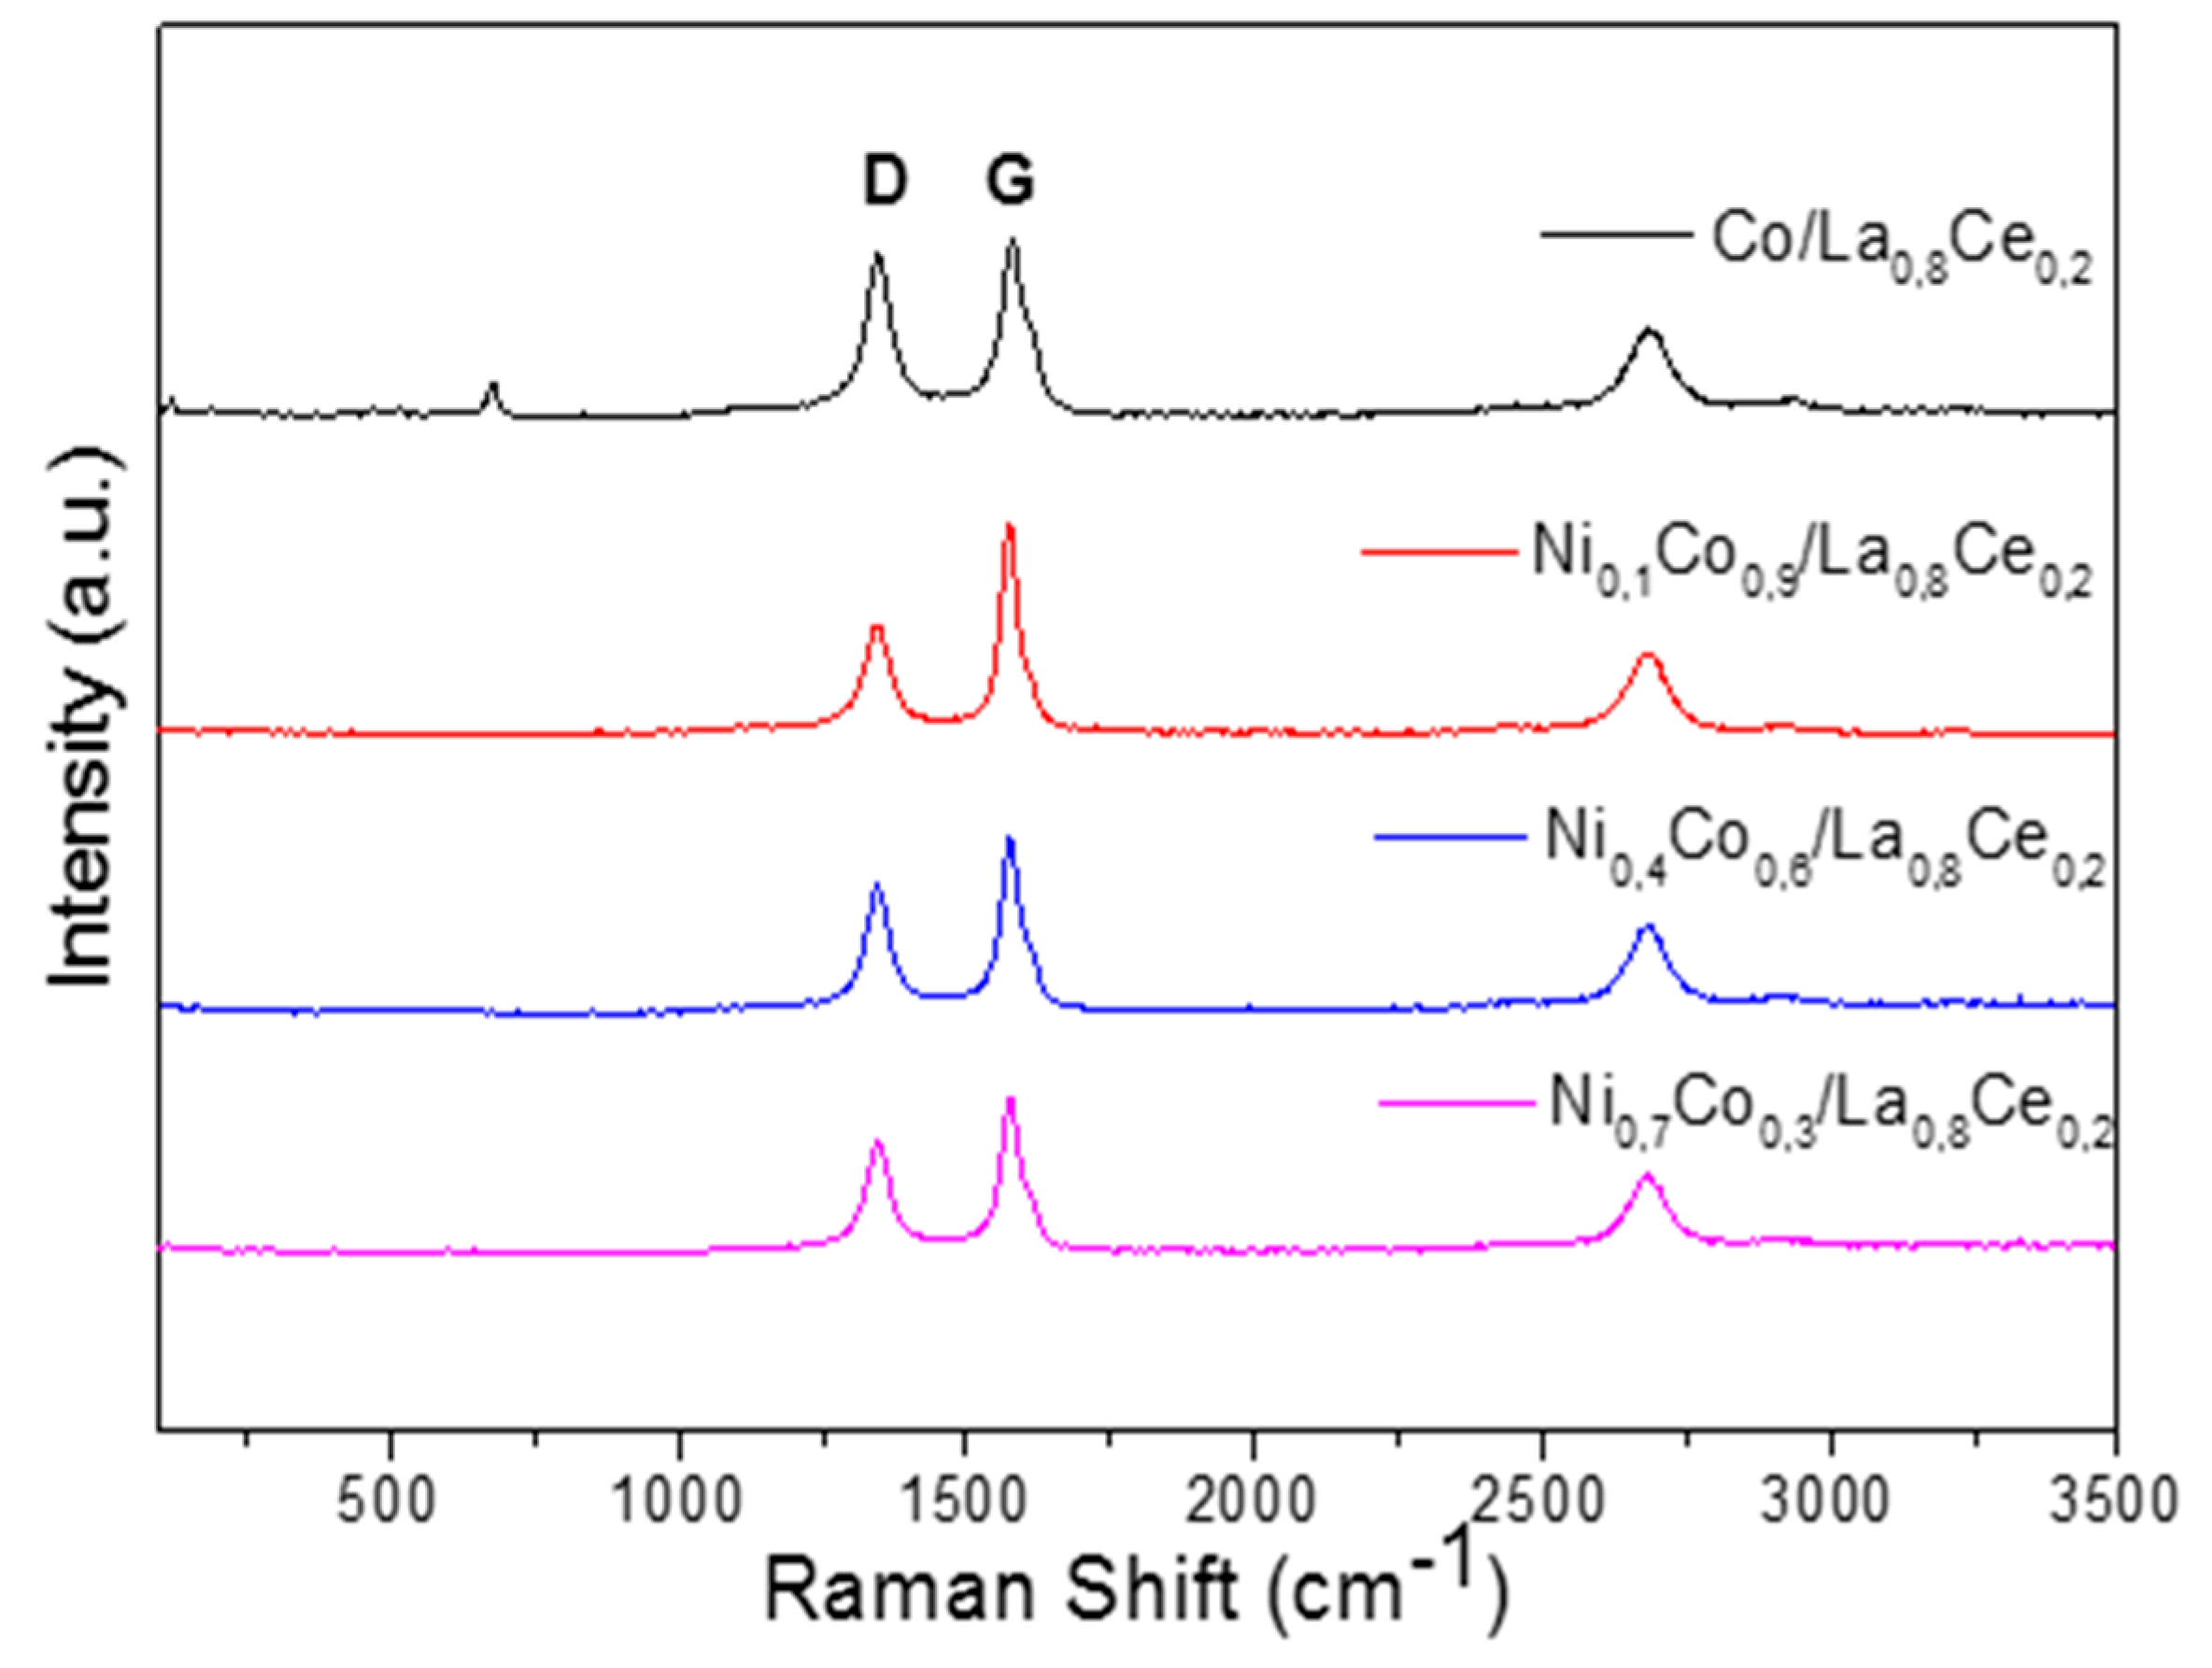
3.4. Characterization of Spent Catalysts

Thermogravimetric analyses of spent catalysts were carried out to calculate the amount of carbonaceous residues formed after ethanol decomposition by measuring the weight loss. TGA-DTG of the catalyst used containing only Co, presented in Figure 14, shows that the catalyst exhibited a peak at 770 K, corresponding to the combustion of amorphous coke [22]. Meanwhile, Ni-containing catalysts showed loss mass at higher temperatures around 800 K, which can be due to the combustion of filamentous coke with different graphitization degrees associated with nickel particles [22]. It is noteworthy that the Ni0.1Co0.9/La0.8Ce0.2 catalyst displayed a wide peak shifted at a higher temperature centered at 980 K, which can be attributed to the presence of highly ordered coke. Increasing Ni content decreased the removal temperature of carbon deposits due to its lower ordering degree obtained by particle size decreasing (Table 1). The carbon depositions for spent samples quantified by TGA are shown in Table 3. The Ni0.7Co0.3 catalyst with the smallest particle size (Table 1) was the most stable catalyst, since it showed the lowest amount of carbon deposits after 13 h of reaction, which is in agreement with previous studies [2,5,49].
On the other hand, the presence and nature of carbon deposits on the catalyst surface were evaluated by Raman spectroscopy. The results are shown in Figure 15. The bands at 1340 and 1580 cm−1 are labelled as D and G bands and their presence is evident in all solids. The G mode is attributed to the graphite structure, but it has also been associated in a general way with stretching vibration of C=C bond in chains or in aromatic rings, whereas the D mode is the breathing mode of C=C bonds only in rings [50,51]. This band is associated with the Raman mode of disordered defective carbon structures. Therefore, the heterogeneity of the carbon species can be related to the presence of both signals, G and D. The intensity ratio of the D and G Raman bands (ID/IG) gives information on the type of coke [50] prevailing during reaction. For Ni0,1Co0,9/La0,8Ce0,2, a lower value was obtained, which agrees with the TGA results where a higher temperature was necessary to remove carbon deposits, as is shown in Figure 12 and Table 3.

4. Conclusions

Co-Ni bimetallic catalysts supported on La-Ce oxides were prepared by reducing La0.8Ce0.2Ni1-xCoxO3 perovskite precursors. The preparation method resulted in very small particle sizes that diminished with nickel content increase in the order Ni0.7Co0.3/La00.8Ce0.2 ≤ Ni0.4Co0.6/La00.8Ce0.2 < Ni0.1Co0.9/La00.8Ce0.2 < Co/La00.8Ce0.2 according to H2 chemisorption and TEM measurements. The Ni0.7Co0.3/La00.8Ce0.2 catalyst exhibited the higher ethanol conversion (98.4%) and selectivity to H2 (75%) as well as the lower carbon deposit formation during the ethanol decomposition reaction as determined by TGA measurements. These observations were attributed to its smaller size particle, higher specific surface area, and much lower acidity compared to other catalysts. Despite the presence of coke, all catalysts were stable for 13 h of time on stream, which can be related to the strong metal–support interaction obtained due to the use of perovskites as precursors for the catalysts. This interaction can increase carbon gasification and decrease metal sintering as reported previously. Several side reactions are involved in H2 production by ethanol decomposition that can favor catalyst deactivation. According to product distribution, the side reactions responsible for the formation of carbon deposits were mainly methane decomposition, Boudouard reaction, and ethanol dehydration. In addition, acetate species could have blocked the active sites as observed in DRIFTS experiments, contributing also to the deactivation of the catalysts. Finally, the preparation method used in this study led to bimetallic Ni-Co catalysts supported on La2O3-CeO2 with small particle sizes, as well as being active and stable for ethanol decomposition for H2 production.

Author Contributions

H.R.V. contributed to validation, formal analysis, software, data curation, and investigation; M.H.B. contributed to formal analysis, conceptualization, methodology, software, investigation, supervision, data curation, and writing—review and editing; J.J.M. contributed to resources, conceptualization, supervision, project administration, and funding acquisition; H.A.R. contributed to resources, supervision, project administration, and funding acquisition; J.P. contributed to supervision and funding acquisition; F.B.P. contributed to methodology, software, and validation; L.P.d.C. contributed to methodology and software; D.G.-V. contributed to formal analysis and methodology; P.O.-V. contributed to conceptualization, supervision, data curation, writing—original draft preparation, and writing—review and editing. All authors have read and agreed to the published version of the manuscript.

Funding

This research was funded by FAPERJ, CNPq, CAPES, and VIE-UPTC, SGI 2446.

Acknowledgments

L.P.C. acknowledges CNPQ process 311461/2017-4 and LME/LNNano/CNPEM for technical support during electron microscopy work.

Conflicts of Interest

The authors declare no conflict of interest

References

  1. Ishizaki, H.; Hasumi, K. Ethanol Production from Biomass; Elsevier: Ámsterdam, The Netherlands, 2013; ISBN 9780124046092. [Google Scholar]
  2. Mattos, L.V.; Jacobs, G.; Davis, B.H.; Noronha, F.B. Production of hydrogen from ethanol: Review of reaction mechanism and catalyst deactivation. Chem. Rev. 2012, 112, 4094–4123. [Google Scholar] [CrossRef]
  3. De Lima, S.M.; da Silva, A.M.; da Costa, L.O.O.; Graham, U.M.; Jacobs, G.; Davis, B.H.; Mattos, L.V.; Noronha, F.B. Study of catalyst deactivation and reaction mechanism of steam reforming, partial oxidation, and oxidative steam reforming of ethanol over Co/CeO2 catalyst. J. Catal. 2009, 268, 268–281. [Google Scholar] [CrossRef]
  4. Campos, C.H.; Pecchi, G.; Fierro, J.L.G.; Osorio-Vargas, P. Enhanced bimetallic Rh-Ni supported catalysts on alumina doped with mixed lanthanum-cerium oxides for ethanol steam reforming. Mol. Catal. 2019, 469, 87–97. [Google Scholar] [CrossRef]
  5. Rostrup-Nielsen, J.R. Sulfur-passivated nickel catalysts for carbon-free steam reforming of methane. J. Catal. 1984, 85, 31–43. [Google Scholar] [CrossRef]
  6. He, S.; An, Z.; Wei, M.; Evans, D.G.; Duan, X. Layered double hydroxide-based catalysts: Nanostructure design and catalytic performance. Chem. Commun. 2013, 49, 5912–5920. [Google Scholar] [CrossRef] [PubMed]
  7. Manukyan, K.V.; Cross, A.J.; Yeghishyan, A.V.; Rouvimov, S.; Miller, J.J.; Mukasyan, A.S.; Wolf, E.E. Highly stable Ni-Al2O3 catalyst prepared from a Ni-Al layered double hydroxide for ethanol decomposition toward hydrogen. Appl. Catal. A Gen. 2015, 508, 37–44. [Google Scholar] [CrossRef] [Green Version]
  8. Ashok, A.; Kumar, A.; Ponraj, J.; Mansour, S.A.; Tarlochan, F. Effect of Ni incorporation in cobalt oxide lattice on carbon formation during ethanol decomposition reaction. Appl. Catal. B Environ. 2019, 254, 300–311. [Google Scholar] [CrossRef]
  9. Gallego, J.; Sierra, G.; Mondragon, F.; Barrault, J.; Batiot-Dupeyrat, C. Synthesis of MWCNTs and hydrogen from ethanol catalytic decomposition over a Ni/La2O3 catalyst produced by the reduction of LaNiO3. Appl. Catal. A Gen. 2011, 397, 73–81. [Google Scholar] [CrossRef]
  10. Morales, R.; Campos, C.H.; Fierro, J.L.G.; Fraga, M.A.; Pecchi, G. Stable reduced Ni catalysts for xylose hydrogenation in aqueous medium. Catal. Today 2018, 310, 59–67. [Google Scholar] [CrossRef]
  11. Kumar, A.; Miller, J.T.; Mukasyan, A.S.; Wolf, E.E. In situ XAS and FTIR studies of a multi-component Ni/Fe/Cu catalyst for hydrogen production from ethanol. Appl. Catal. A Gen. 2013, 467, 593–603. [Google Scholar] [CrossRef]
  12. De Lima, S.M.; Silva, A.M.; Graham, U.M.; Jacobs, G.; Davis, B.H.; Mattos, L.V.; Noronha, F.B. Ethanol decomposition and steam reforming of ethanol over CeZrO2 and Pt/CeZrO2 catalyst: Reaction mechanism and deactivation. Appl. Catal. A Gen. 2009, 352, 95–113. [Google Scholar] [CrossRef]
  13. Dancini-Pontes, I.; Fernandes-Machado, N.R.C.; De Souza, M.; Pontes, R.M. Insights into ethanol decomposition over Pt: A DFT energy decomposition analysis for the reaction mechanism leading to C2H6 and CH4. Appl. Catal. A Gen. 2015, 491, 86–93. [Google Scholar] [CrossRef]
  14. De Souza, G.; Balzaretti, N.M.; Marcílio, N.R.; Perez-Lopez, O.W. Decomposition of ethanol over Ni-Al catalysts: Effect of copper addition. Procedia Eng. 2012, 42, 335–345. [Google Scholar] [CrossRef] [Green Version]
  15. Diao, J.; Wang, H.; Li, W.; Wang, G.; Ren, Z.; Bai, J. Effect of C-supported Co catalyst on the ethanol decomposition to produce hydrogen and multi-walled carbon nanotubes. Phys. E Low-Dimensional Syst. Nanostruct. 2010, 42, 2280–2284. [Google Scholar] [CrossRef]
  16. Chen, R.; Xie, Y.; Zhou, Y.; Wang, J.; Wang, H. Production of hydrogen-rich gas and multi-walled carbon nanotubes from ethanol decomposition over molybdenum modified Ni/MgO catalysts. J. Energy Chem. 2014, 23, 244–250. [Google Scholar] [CrossRef]
  17. Wang, G.; Wang, H.; Tang, Z.; Li, W.; Bai, J. Simultaneous production of hydrogen and multi-walled carbon nanotubes by ethanol decomposition over Ni/Al2O3 catalysts. Appl. Catal. B Environ. 2009, 88, 142–151. [Google Scholar] [CrossRef]
  18. Li, W.; Wang, H.; Ren, Z.; Wang, G.; Bai, J. Co-production of hydrogen and multi-wall carbon nanotubes from ethanol decomposition over Fe/Al2O3 catalysts. Appl. Catal. B Environ. 2008, 84, 433–439. [Google Scholar] [CrossRef]
  19. Mezalira, D.Z.; Probst, L.D.; Pronier, S.; Batonneau, Y.; Batiot-Dupeyrat, C. Decomposition of ethanol over Ni/Al2O3 catalysts to produce hydrogen and carbon nanostructured materials. J. Mol. Catal. A Chem. 2011, 340, 15–23. [Google Scholar] [CrossRef]
  20. Laosiripojana, N.; Sutthisripok, W.; Assabumrungrat, S. Reactivity of high surface area CeO2 synthesized by surfactant-assisted method to ethanol decomposition with and without steam. Chem. Eng. J. 2007, 127, 31–38. [Google Scholar] [CrossRef]
  21. Manukyan, K.V.; Yeghishyan, A.V.; Danghyan, V.; Rouvimov, S.; Mukasyan, A.S.; Wolf, E.E. Structural transformations of highly porous nickel catalysts during ethanol conversion towards hydrogen. Int. J. Hydrogen Energy 2018, 43, 13225–13236. [Google Scholar] [CrossRef]
  22. Osorio-Vargas, P.; Flores-González, N.A.; Navarro, R.M.; Fierro, J.L.G.; Campos, C.H.; Reyes, P. Improved stability of Ni/Al2O3 catalysts by effect of promoters (La2O3, CeO2) for ethanol steam-reforming reaction. Catal. Today 2015, 259, 27–38. [Google Scholar] [CrossRef]
  23. Pechini, M.P. Method of Pre Parng Lead and Alkalne Earth Titanates and Nobates and Coat. U.S. Patent 3,330,697, 11 July 1967. [Google Scholar]
  24. Marinho, A.L.A.; Rabelo-Neto, R.C.; Noronha, F.B.; Mattos, L.V. Steam reforming of ethanol over Ni-based catalysts obtained from LaNiO3 and LaNiO3/CeSiO2 perovskite-type oxides for the production of hydrogen. Appl. Catal. A Gen. 2016, 520, 53–64. [Google Scholar] [CrossRef]
  25. Franchini, C.A.; Aranzaez, W.; Duarte de Farias, A.M.; Pecchi, G.; Fraga, M.A. Ce-substituted LaNiO3 mixed oxides as catalyst precursors for glycerol steam reforming. Appl. Catal. B Environ. 2014, 147, 193–202. [Google Scholar] [CrossRef]
  26. Yang, E.H.; Kim, N.Y.; Noh, Y.S.; Lim, S.S.; Jung, J.S.; Lee, J.S.; Hong, G.H.; Moon, D.J. Steam CO2 reforming of methane over La1-xCexNiO3 perovskite catalysts. Int. J. Hydrogen Energy 2015, 40, 11831–11839. [Google Scholar] [CrossRef]
  27. De Lima, S.M.; da Silva, A.M.; da Costa, L.O.O.; Assaf, J.M.; Mattos, L.V.; Sarkari, R.; Venugopal, A.; Noronha, F.B. Hydrogen production through oxidative steam reforming of ethanol over Ni-based catalysts derived from La1−xCexNiO3 perovskite-type oxides. Appl. Catal. B Environ. 2012, 121–122, 1–9. [Google Scholar] [CrossRef]
  28. Ma, F.; Chu, W.; Huang, L.; Yu, X.; Wu, Y. Steam reforming of ethanol over Zn-Doped LaCoO3 perovskite nanocatalysts. Chin. J. Catal. 2011, 32, 970–977. [Google Scholar] [CrossRef]
  29. Wang, Z.; Wang, C.; Chen, S.; Liu, Y. Co-Ni bimetal catalyst supported on perovskite-type oxide for steam reforming of ethanol to produce hydrogen. Int. J. Hydrogen Energy 2014, 39, 5644–5652. [Google Scholar] [CrossRef]
  30. Sing, K.S.W.; Everett, D.H.; Haul, R.A.W.; Moscou, L.; Pierotti, R.A.; Rouquerol, J.; Siemieniewska, T. Reporting physisorption data for gas/solid systems with Special Reference to the Determination of Surface Area and Porosity (Recommendations 1984). Pure Appl. Chem. 1985, 57, 603–619. [Google Scholar] [CrossRef]
  31. Tang, Z.; Cao, H.; Tao, Y.; Heeres, H.J.; Pescarmona, P.P. Transfer hydrogenation from glycerol over a Ni-Co/CeO2 catalyst: A highly efficient and sustainable route to produce lactic acid. Appl. Catal. B Environ. 2020, 263, 118273. [Google Scholar] [CrossRef]
  32. Biesinger, M.C.; Payne, B.P.; Lau, L.W.M.; Gerson, A.; Smart, R.S.C. X-ray photoelectron spectroscopic chemical state Quantification of mixed nickel metal, oxide and hydroxide systems. Surf. Interface Anal. 2009, 41, 324–332. [Google Scholar] [CrossRef]
  33. Grosvenor, A.P.; Biesinger, M.C.; Smart, R.S.C.; McIntyre, N.S. New interpretations of XPS spectra of nickel metal and oxides. Surf. Sci. 2006, 600, 1771–1779. [Google Scholar] [CrossRef]
  34. Biesinger, M.C.; Payne, B.P.; Grosvenor, A.P.; Lau, L.W.M.; Gerson, A.R.; Smart, R.S.C. Resolving surface chemical states in XPS analysis of first row transition metals, oxides and hydroxides: Cr, Mn, Fe, Co and Ni. Appl. Surf. Sci. 2011, 257, 2717–2730. [Google Scholar] [CrossRef]
  35. Chuang, T.J.; Brundle, C.R.; Rice, D.W. Interpretation of the x-ray photoemission spectra of cobalt oxides and cobalt oxide surfaces. Surf. Sci. 1976, 59, 413–429. [Google Scholar] [CrossRef]
  36. Huck-Iriart, C.; Soler, L.; Casanovas, A.; Marini, C.; Prat, J.; Llorca, J.; Escudero, C. Unraveling the Chemical State of Cobalt in Co-Based Catalysts during Ethanol Steam Reforming: An in Situ Study by Near Ambient Pressure XPS and XANES. ACS Catal. 2018, 8, 9625–9636. [Google Scholar] [CrossRef] [Green Version]
  37. Zhai, Y.; Chu, M.; Shang, N.; Wang, C.; Wang, H.; Gao, Y. Bimetal Co8Ni2 catalyst supported on chitin-derived N-containing carbon for upgrade of biofuels. Appl. Surf. Sci. 2019, 144681. [Google Scholar] [CrossRef]
  38. Maslakov, K.I.; Teterin, Y.A.; Popel, A.J.; Teterin, A.Y.; Ivanov, K.E.; Kalmykov, S.N.; Petrov, V.G.; Petrov, P.K.; Farnan, I. XPS study of ion irradiated and unirradiated CeO2 bulk and thin film samples. Appl. Surf. Sci. 2018, 448, 154–162. [Google Scholar] [CrossRef]
  39. Bêche, E.; Charvin, P.; Perarnau, D.; Abanades, S.; Flamant, G. Ce 3d XPS investigation of cerium oxides and mixed cerium oxide (CexTiyOz). Surf. Interface Anal. 2008, 40, 264–267. [Google Scholar] [CrossRef]
  40. Paparazzo, E. XPS studies of damage induced by X-ray irradiation on CeO2 surfaces. Surf. Sci. 1990, 234, 1–6. [Google Scholar] [CrossRef]
  41. Fleisch, T.H.; Hicks, R.F.; Bell, A.T. An XPS study of metal-support interactions on Pd SiO2 and Pd La2O3. J. Catal. 1984, 87, 398–413. [Google Scholar] [CrossRef]
  42. Araujo, J.C.S.; Zanchet, D.; Rinaldi, R.; Schuchardt, U.; Hori, C.E.; Fierro, J.L.G.; Bueno, J.M.C. The effects of La2O3 on the structural properties of La2O3-Al2O3 prepared by the sol-gel method and on the catalytic performance of Pt/La2O3-Al2O3 towards steam reforming and partial oxidation of methane. Appl. Catal. B Environ. 2008, 84, 552–562. [Google Scholar] [CrossRef]
  43. De Lima, S.M.; da Cruz, I.O.; Jacobs, G.; Davis, B.H.; Mattos, L.V.; Noronha, F.B. Steam reforming, partial oxidation, and oxidative steam reforming of ethanol over Pt/CeZrO2 catalyst. J. Catal. 2008, 257, 356–368. [Google Scholar] [CrossRef]
  44. Mattos, L.V.; Noronha, F.B. Hydrogen production for fuel cell applications by ethanol partial oxidation on Pt/CeO2 catalysts: The effect of the reaction conditions and reaction mechanism. J. Catal. 2005, 233, 453–463. [Google Scholar] [CrossRef]
  45. Erdőhelyi, A.; Raskó, J.; Kecskés, T.; Tóth, M.; Dömök, M.; Baán, K. Hydrogen formation in ethanol reforming on supported noble metal catalysts. Catal. Today 2006, 116, 367–376. [Google Scholar] [CrossRef]
  46. Wang, H.; Dong, X.; Zhao, T.; Yu, H.; Li, M. Dry reforming of methane over bimetallic Ni-Co catalyst prepared from La(CoxNi1-x)0.5Fe0.5O3 perovskite precursor: Catalytic activity and coking resistance. Appl. Catal. B Environ. 2019, 245, 302–313. [Google Scholar] [CrossRef]
  47. Neagu, D.; Oh, T.S.; Miller, D.N.; Ménard, H.; Bukhari, S.M.; Gamble, S.R.; Gorte, R.J.; Vohs, J.M.; Irvine, J.T.S. Nano-socketed nickel particles with enhanced coking resistance grown in situ by redox exsolution. Nat. Commun. 2015, 6, 8120. [Google Scholar] [CrossRef] [PubMed] [Green Version]
  48. Wei, T.; Jia, L.; Zheng, H.; Chi, B.; Pu, J.; Li, J. LaMnO3-based perovskite with in-situ exsolved Ni nanoparticles: A highly active, performance stable and coking resistant catalyst for CO2 dry reforming of CH4. Appl. Catal. A Gen. 2018, 564, 199–207. [Google Scholar] [CrossRef]
  49. Campos, C.H.; Osorio-Vargas, P.; Flores-González, N.; Fierro, J.L.G.; Reyes, P. Effect of Ni Loading on Lanthanide (La and Ce) Promoted γ-Al2O3 Catalysts Applied to Ethanol Steam Reforming. Catal. Lett. 2016, 146, 433–441. [Google Scholar] [CrossRef]
  50. Iglesias-Juez, A.; Beale, A.M.; Maaijen, K.; Weng, T.C.; Glatzel, P.; Weckhuysen, B.M. A combined in situ time-resolved UV-Vis, Raman and high-energy resolution X-ray absorption spectroscopy study on the deactivation behavior of Pt and PtSn propane dehydrogenation catalysts under industrial reaction conditions. J. Catal. 2010, 276, 268–279. [Google Scholar] [CrossRef]
  51. Mutz, B.; Sprenger, P.; Wang, W.; Wang, D.; Kleist, W.; Grunwaldt, J.D. Operando Raman spectroscopy on CO2 methanation over alumina-supported Ni, Ni3Fe and NiRh0.1 catalysts: Role of carbon formation as possible deactivation pathway. Appl. Catal. A Gen. 2018, 556, 160–171. [Google Scholar] [CrossRef]
Figure 1. X-ray diffraction patterns of calcined catalysts: (a) Co/La0.8Ce0.2; (b) Ni0.1Co0.9/La0.8Ce0.2; (c) Ni0.4Co0.6/La0.8Ce0.2; and (d) Ni0.7Co0.3/La0.8Ce0.2.
Materials 13 00759 g001
Figure 2. X-ray diffraction patterns of passivated catalysts: (a) Ni0.7Co0.3/La0.8Ce0.2, (b) Ni0.4Co0.6/La0.8Ce0.2, (c) Ni0.1Co0.9/La0.8Ce0.2, and (d) Co/La0.8Ce0.2.
Materials 13 00759 g002
Figure 3. Temperature-programmed reduction (TPR) profiles of the prepared catalysts.
Materials 13 00759 g003
Figure 4. NH3-TPD profiles of the prepared catalysts CoxNi1-x/La0.8Ce0.2 for acidity determination.
Materials 13 00759 g004
Figure 5. N2 adsorption–desorption isotherms for Ni1-xCox/La0.8Ce0.2 catalysts.
Materials 13 00759 g005
Figure 6. TEM micrographs of Ni1-xCox/La0.8Ce0.2 catalysts: (a) Ni0.7Co0.3/La0.8Ce0.2; (b) Co/La0.8Ce0.2; (c) Ni0.1Co0.9/La0.8Ce0.2; and (d) Ni0.4Co0.6/La0.8Ce0.2.
Materials 13 00759 g006
Figure 7. Ni 2p XPS spectra of (a) Ni0.1Co0.9/La0.8Ce0.2; (b) Ni0.4Co0.6/La0.8Ce0.2; and (c) Ni0.7Co0.3/La0.8Ce0.2.
Materials 13 00759 g007
Figure 8. Co 2p XPS spectra of (a) Co/La0.8Ce0.2; (b) Ni0.1Co0.9/La0.8Ce0.2; (c) Ni0.4Co0.6/La0.8Ce0.2; and (d) Ni0.7Co0.3/La0.8Ce0.2.
Materials 13 00759 g008
Figure 9. Ce 3d3/2,5/2 XPS spectra of supported Ni1-xCox/La0.8Ce0.2 catalysts. (a) Co; (b) Ni0.1Co0.9; (c) Ni0.4Co0.6; and (d) Ni0.7Co0.3.
Materials 13 00759 g009
Figure 10. La 3d spectra of Ni1-xCox/La0.8Ce0.2 catalysts. (a) Co; (b) Ni0.1Co0.9; (c) Ni0.4Co0.6; and (d) Ni0.7Co0.3.
Materials 13 00759 g010
Figure 11. Diffuse reflectance infrared spectroscopy (DRIFT) spectra of ethanol decomposition collected for supported Ni1-xCox/La0.8Ce0.2 catalysts. (a) Co; (b) Ni0.1Co0.9; (c) Ni0.4Co0.6; and (d) Ni0.7Co0.3.
Materials 13 00759 g011
Figure 12. Stability tests in the reaction of ethanol decomposition over Ni1-xCox/La0.8Ce0.2 catalysts.
Materials 13 00759 g012
Figure 13. Product distribution in ethanol decomposition on NixCo1-x/La0.8Ce0.2 catalysts at 1 h of reaction at 973 K.
Materials 13 00759 g013
Figure 14. TGA-DTG of supported Ni1-xCox/La0.8Ce0.2 catalysts after the ethanol decomposition reaction: (a) Co, (b) Ni0.1Co0.9, (c) Ni0.4Co0.6, and (d) Ni0.7Co0.3.
Materials 13 00759 g014
Figure 15. Raman spectra supported NixCo1-x/La0.8Ce0.2 catalysts.
Materials 13 00759 g015
Table 1. Structural parameters of supports and Ni1-xCox/La0.8Ce0.2 catalysts.
CatalystsSurface Area BET
(m2 g−1)
Pore Volume
(cm3 g−1)
Pore Size
(nm)
Dispersion
(%)
Particle Size a
(nm)
Particle Size b
(nm)
Acidity
(mol NH3 gcat−1)
Ni0.7Co0.3/La0.8Ce0.2330.13 25214.89.10.04
Ni0.4Co0.6/La00.8Ce0.2160.052810105.90.47
Ni0.1Co0.9/La0.8Ce0.2140.043161712.40.23
Co/La0.8Ce0.2230.064533316.80.35
a Determined by H2 chemisorption; b Determined by TEM.
Table 2. Initial rate of reaction, turnover frequency (TOF), Weisz–Prater criterion, conversion, and hydrogen selectivity for ethanol decomposition. Reaction conditions: total flow, 100 mL min−1 (5% ethanol; 95% He); temperature of reaction, 973 K; catalyst weight, 100 mg at 1 h of reaction.
Catalysts(−ra)0 (mol g−1 s−1)TOF (s−1)CWPEthanol Conversion (%)Hydrogen Selectivity (%)
Ni0.7Co0.3/La0.8Ce0.26.2 × 10−40.066.3 × 10−398.475.0
Ni0.4Co0.6/La00.8Ce0.25.6 × 10−40.112.8 × 10−390.064.5
Ni0.1Co0.9/La0.8Ce0.24.7 × 10−40.152.8 × 10−374.656.3
Co/La0.8Ce0.24.1 × 10−40.271.5 × 10−365.452.6
Table 3. Carbon deposition on NixCo1-x/La0.8Ce0.2 catalysts evaluated by TGA.
Catalystmgcoke/gcatTpeak DTGID/IG
Co/La0.8Ce0.2530.57731.00
Ni0.1Co0.9/La0.8Ce0.2659.59800.98
Ni0.4Co0.6/La0.8Ce0.2592.18300.99
Ni0.7Co0.3/La0.8Ce0.2342.67800.99

