Effect of CO2 Partial Pressure on the Corrosion Inhibition of N80 Carbon Steel by Gum Arabic in a CO2-Water Saline Environment for Shale Oil and Gas Industry


Abstract
:1. Introduction
2. Experimental Procedure
2.1. Materials
2.2. Gravimetric Measurements
2.3. Electrochemical Experiments
2.4. Surface Analysis
3. Results and Discussion
3.1. Effect of Pressure and Temperature
3.1.1. Gravimetric Experiments
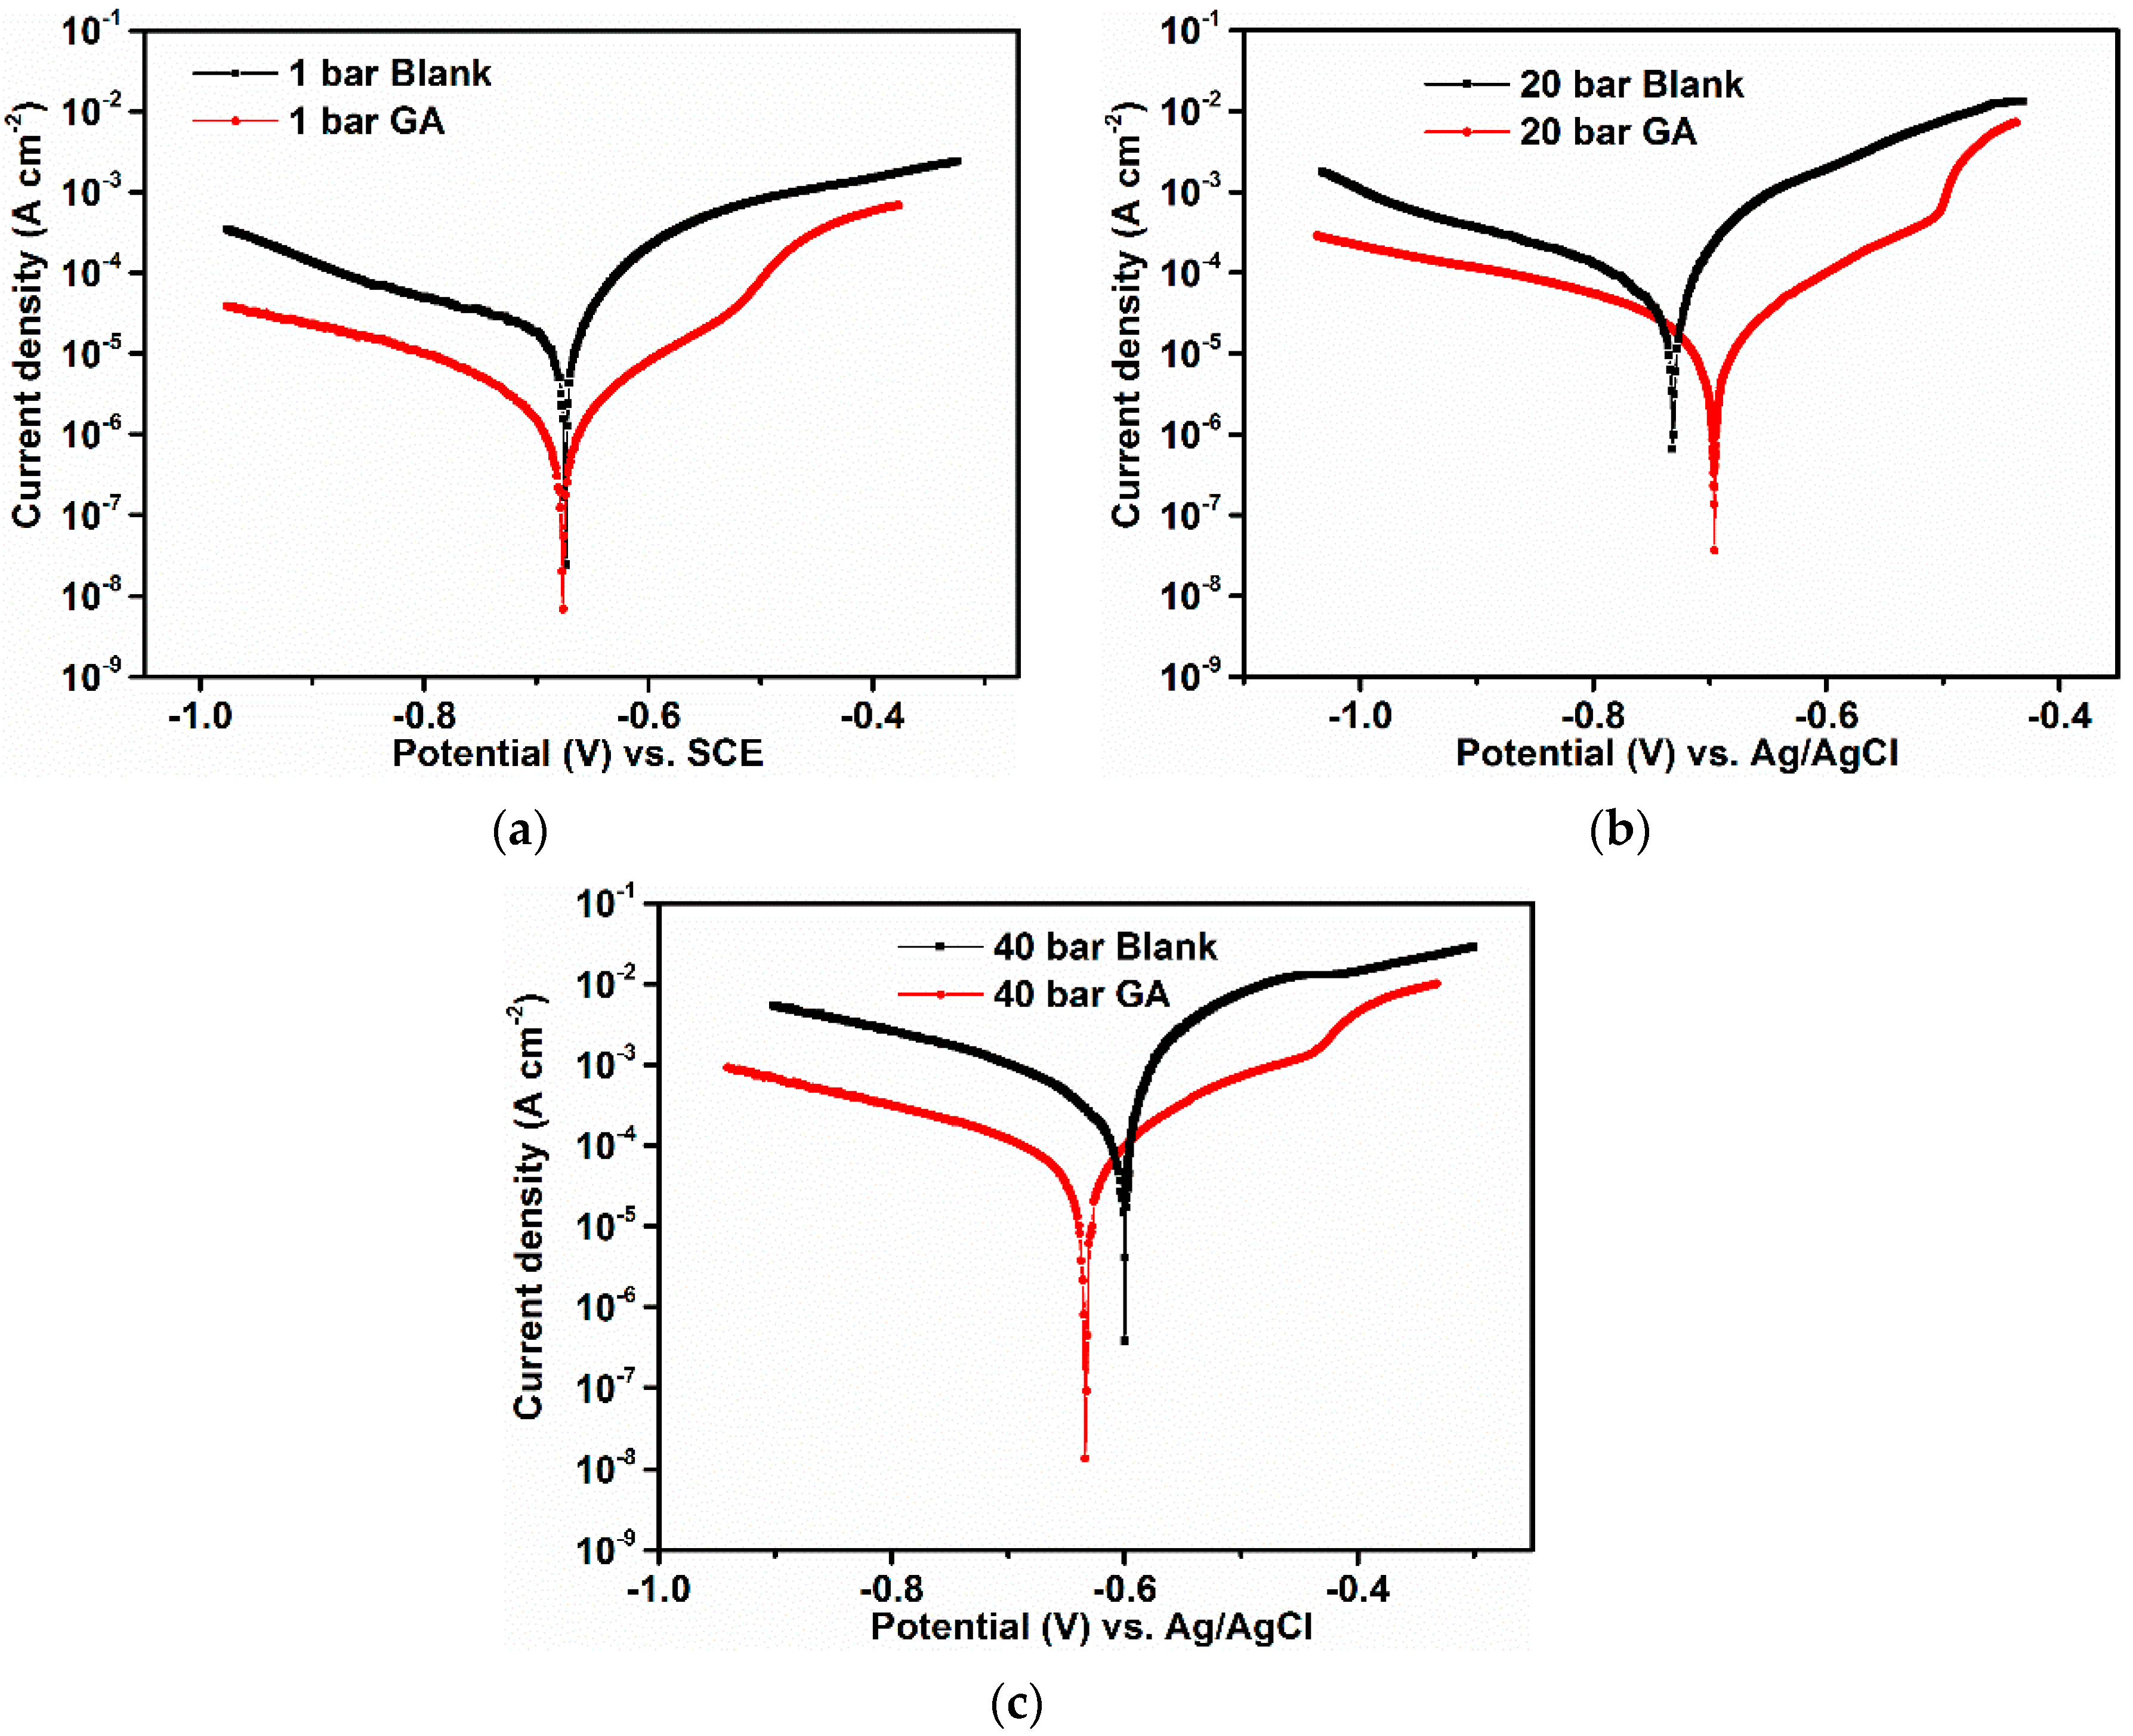
3.1.2. Electrochemical Experiments
3.2. Effect of Time
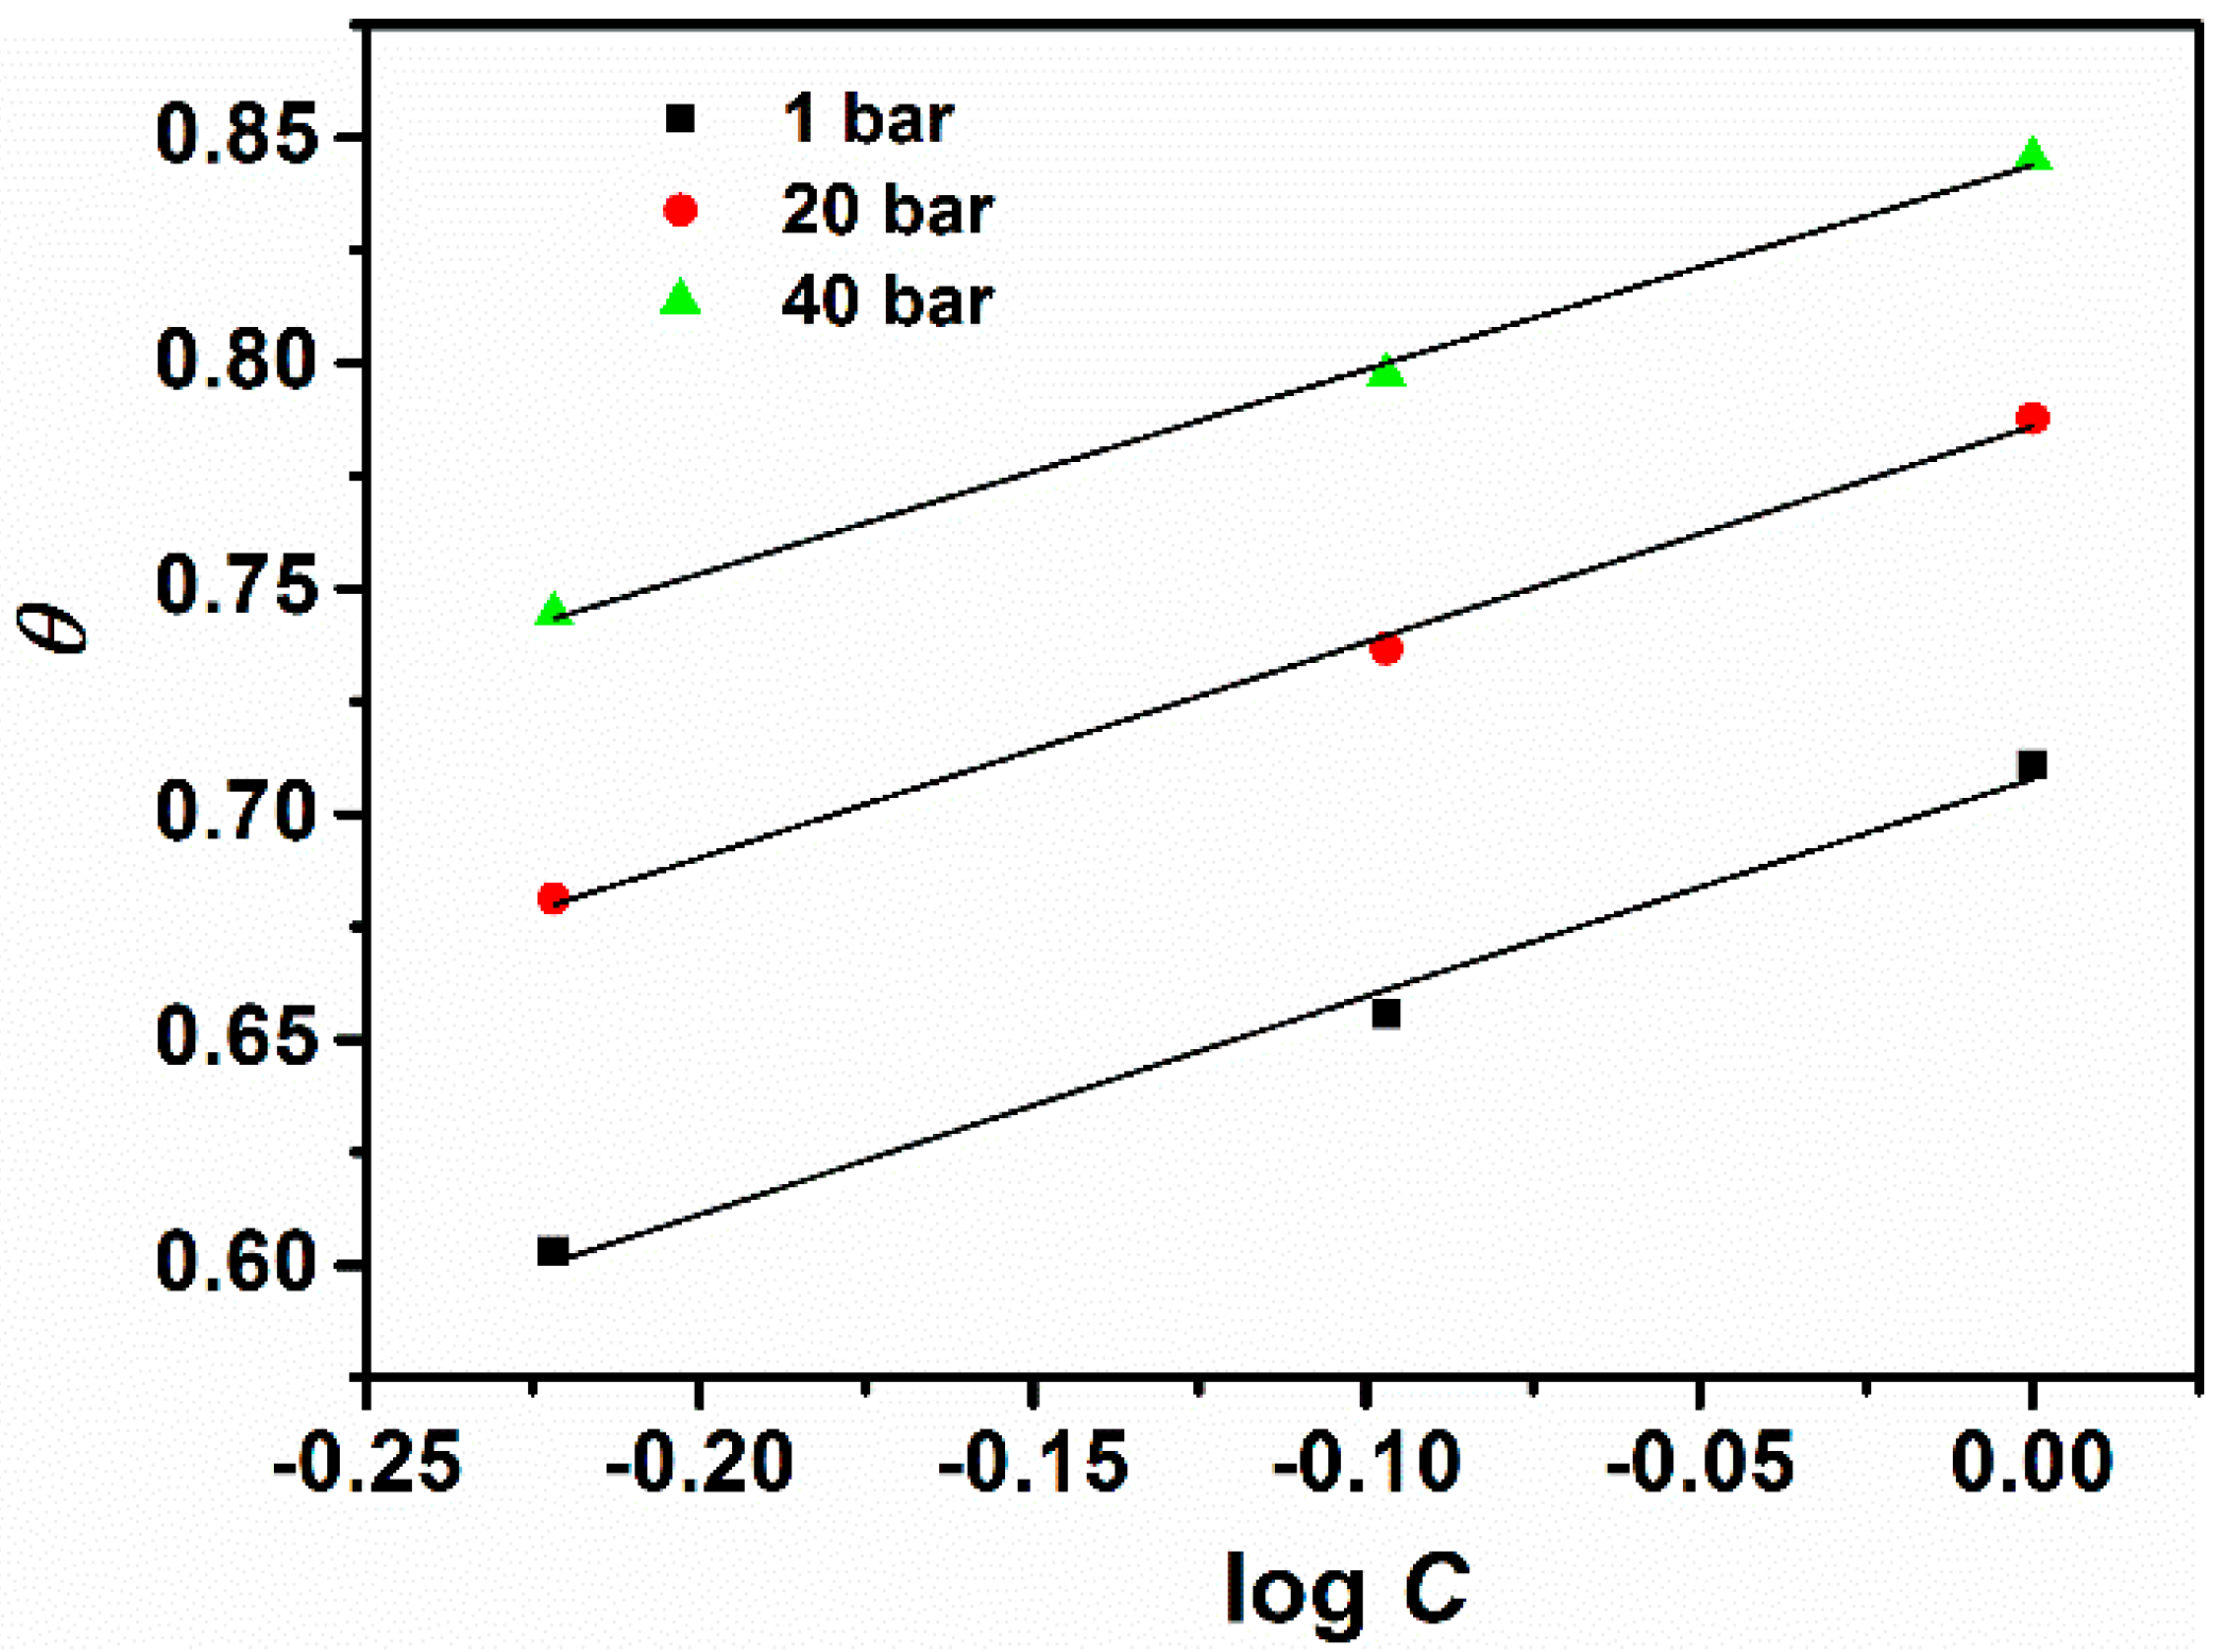
3.3. Adsorption Study and Standard Adsorption Free Energy
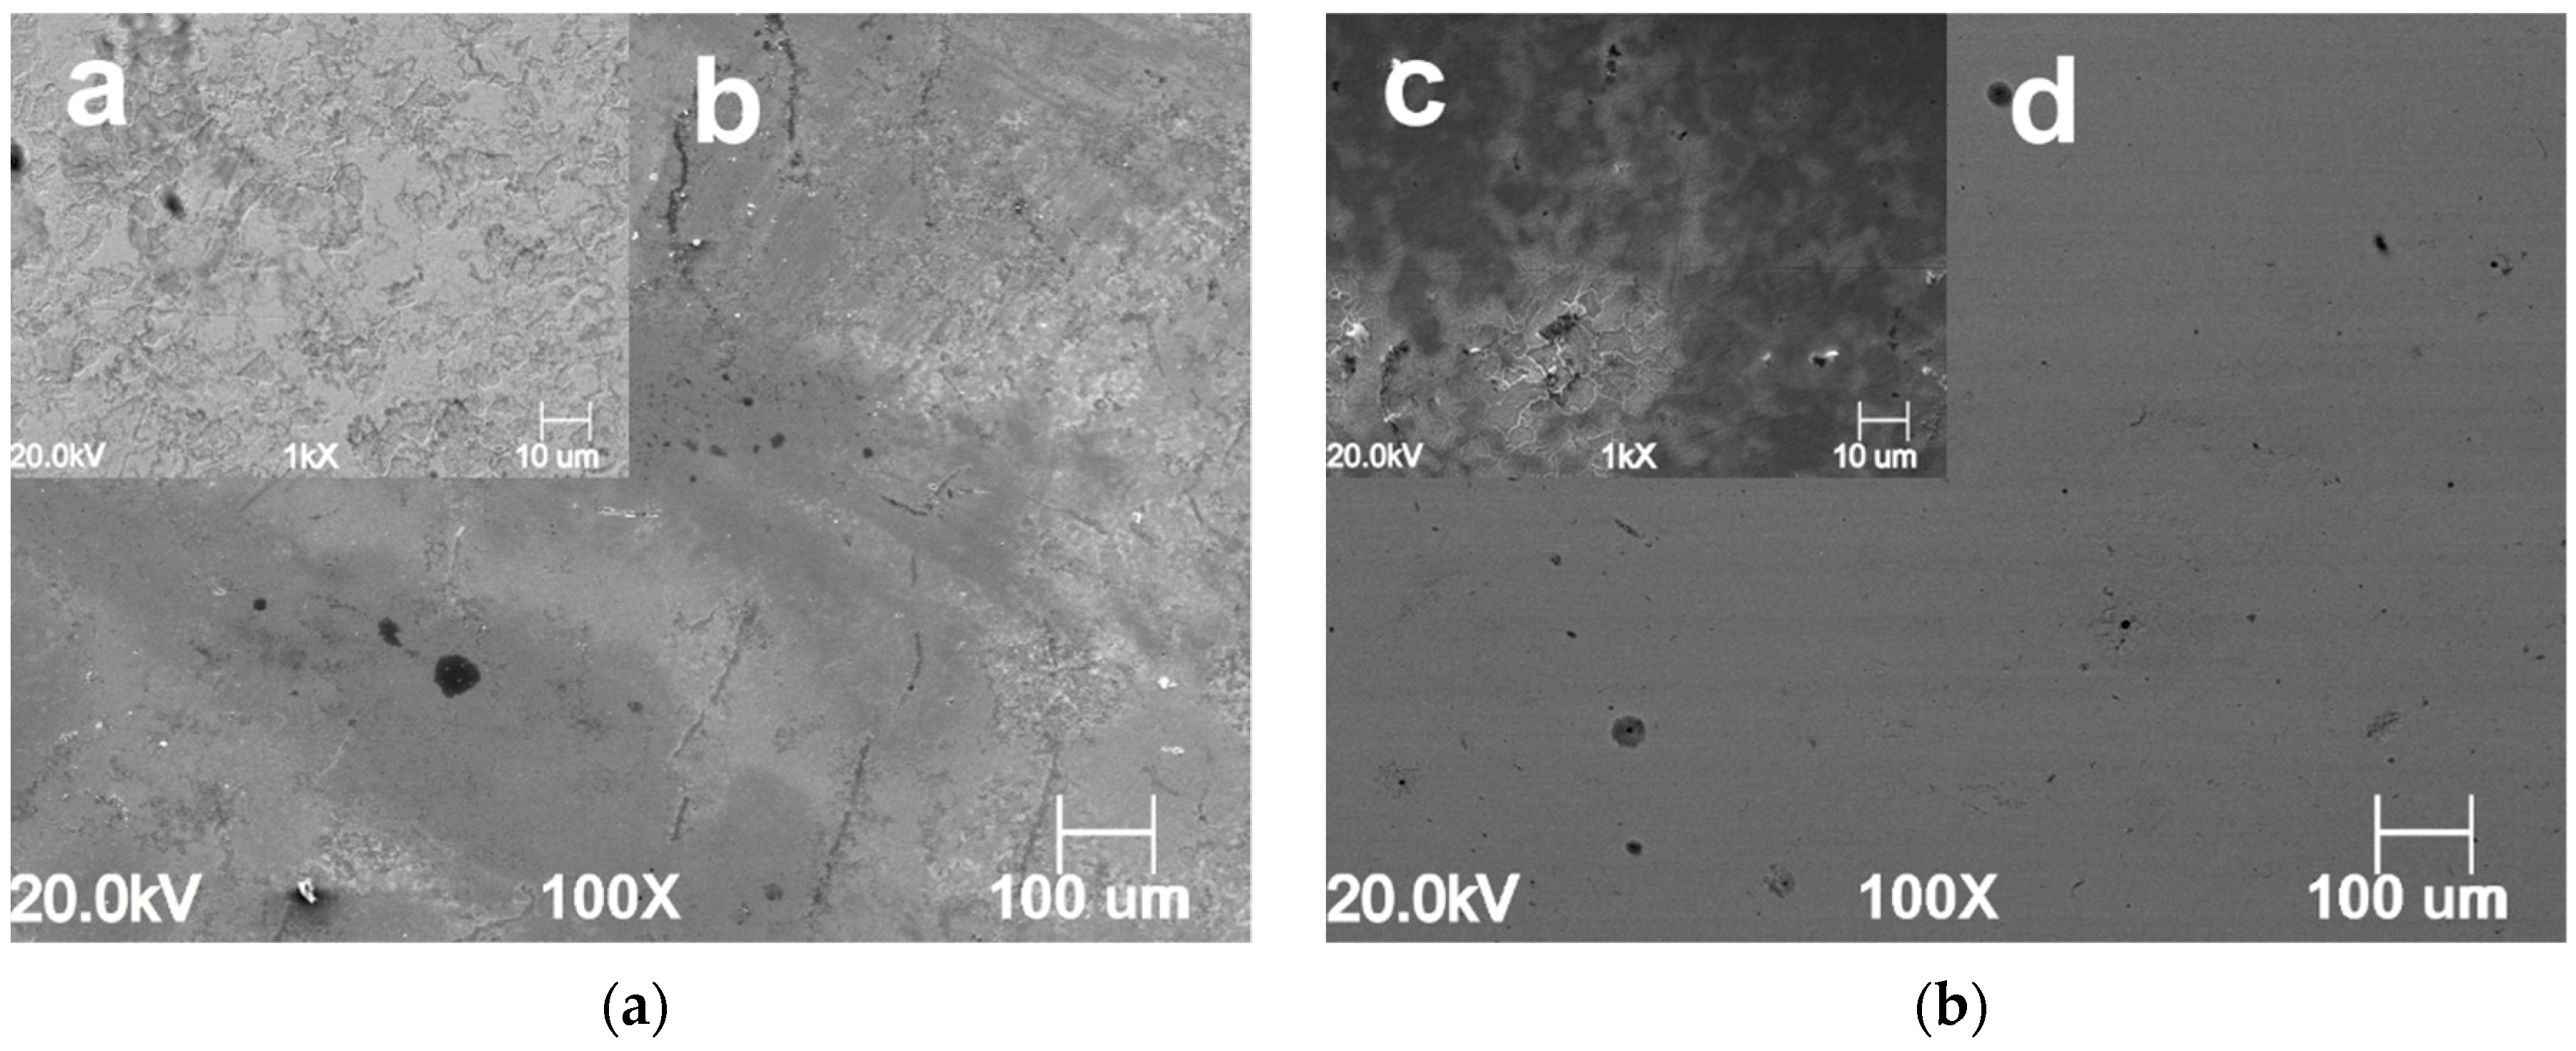
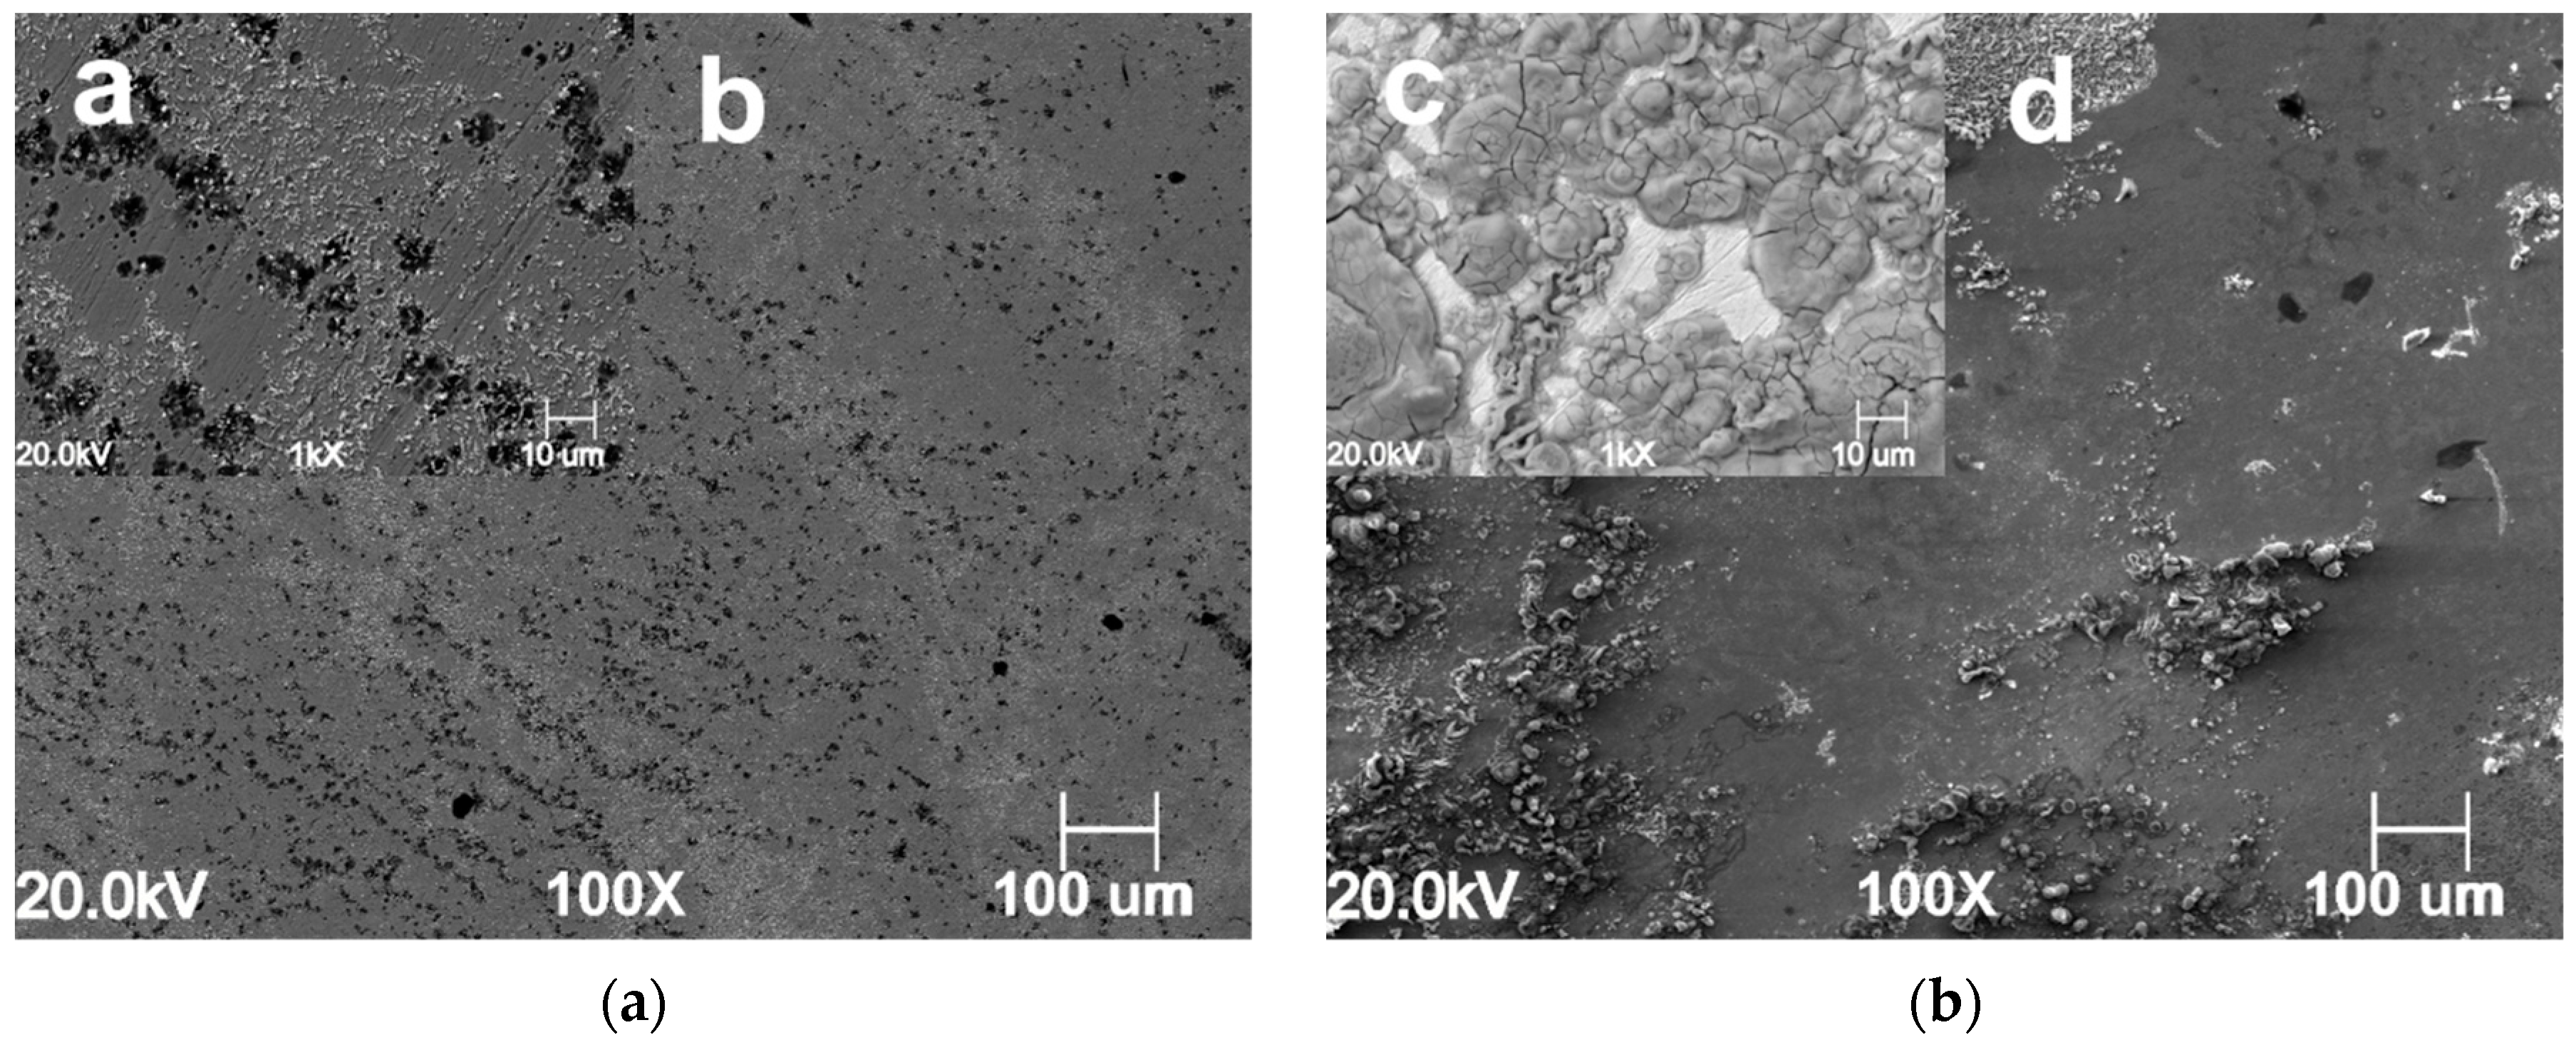
3.4. Surface Analysis
3.5. Mechanism of Inhibition
3.5.1. Adsorption via Electrostatic Interaction
3.5.2. Adsorption via Hydrogen Bond Formation Interaction
3.5.3. Chemical Adsorption
4. Conclusions
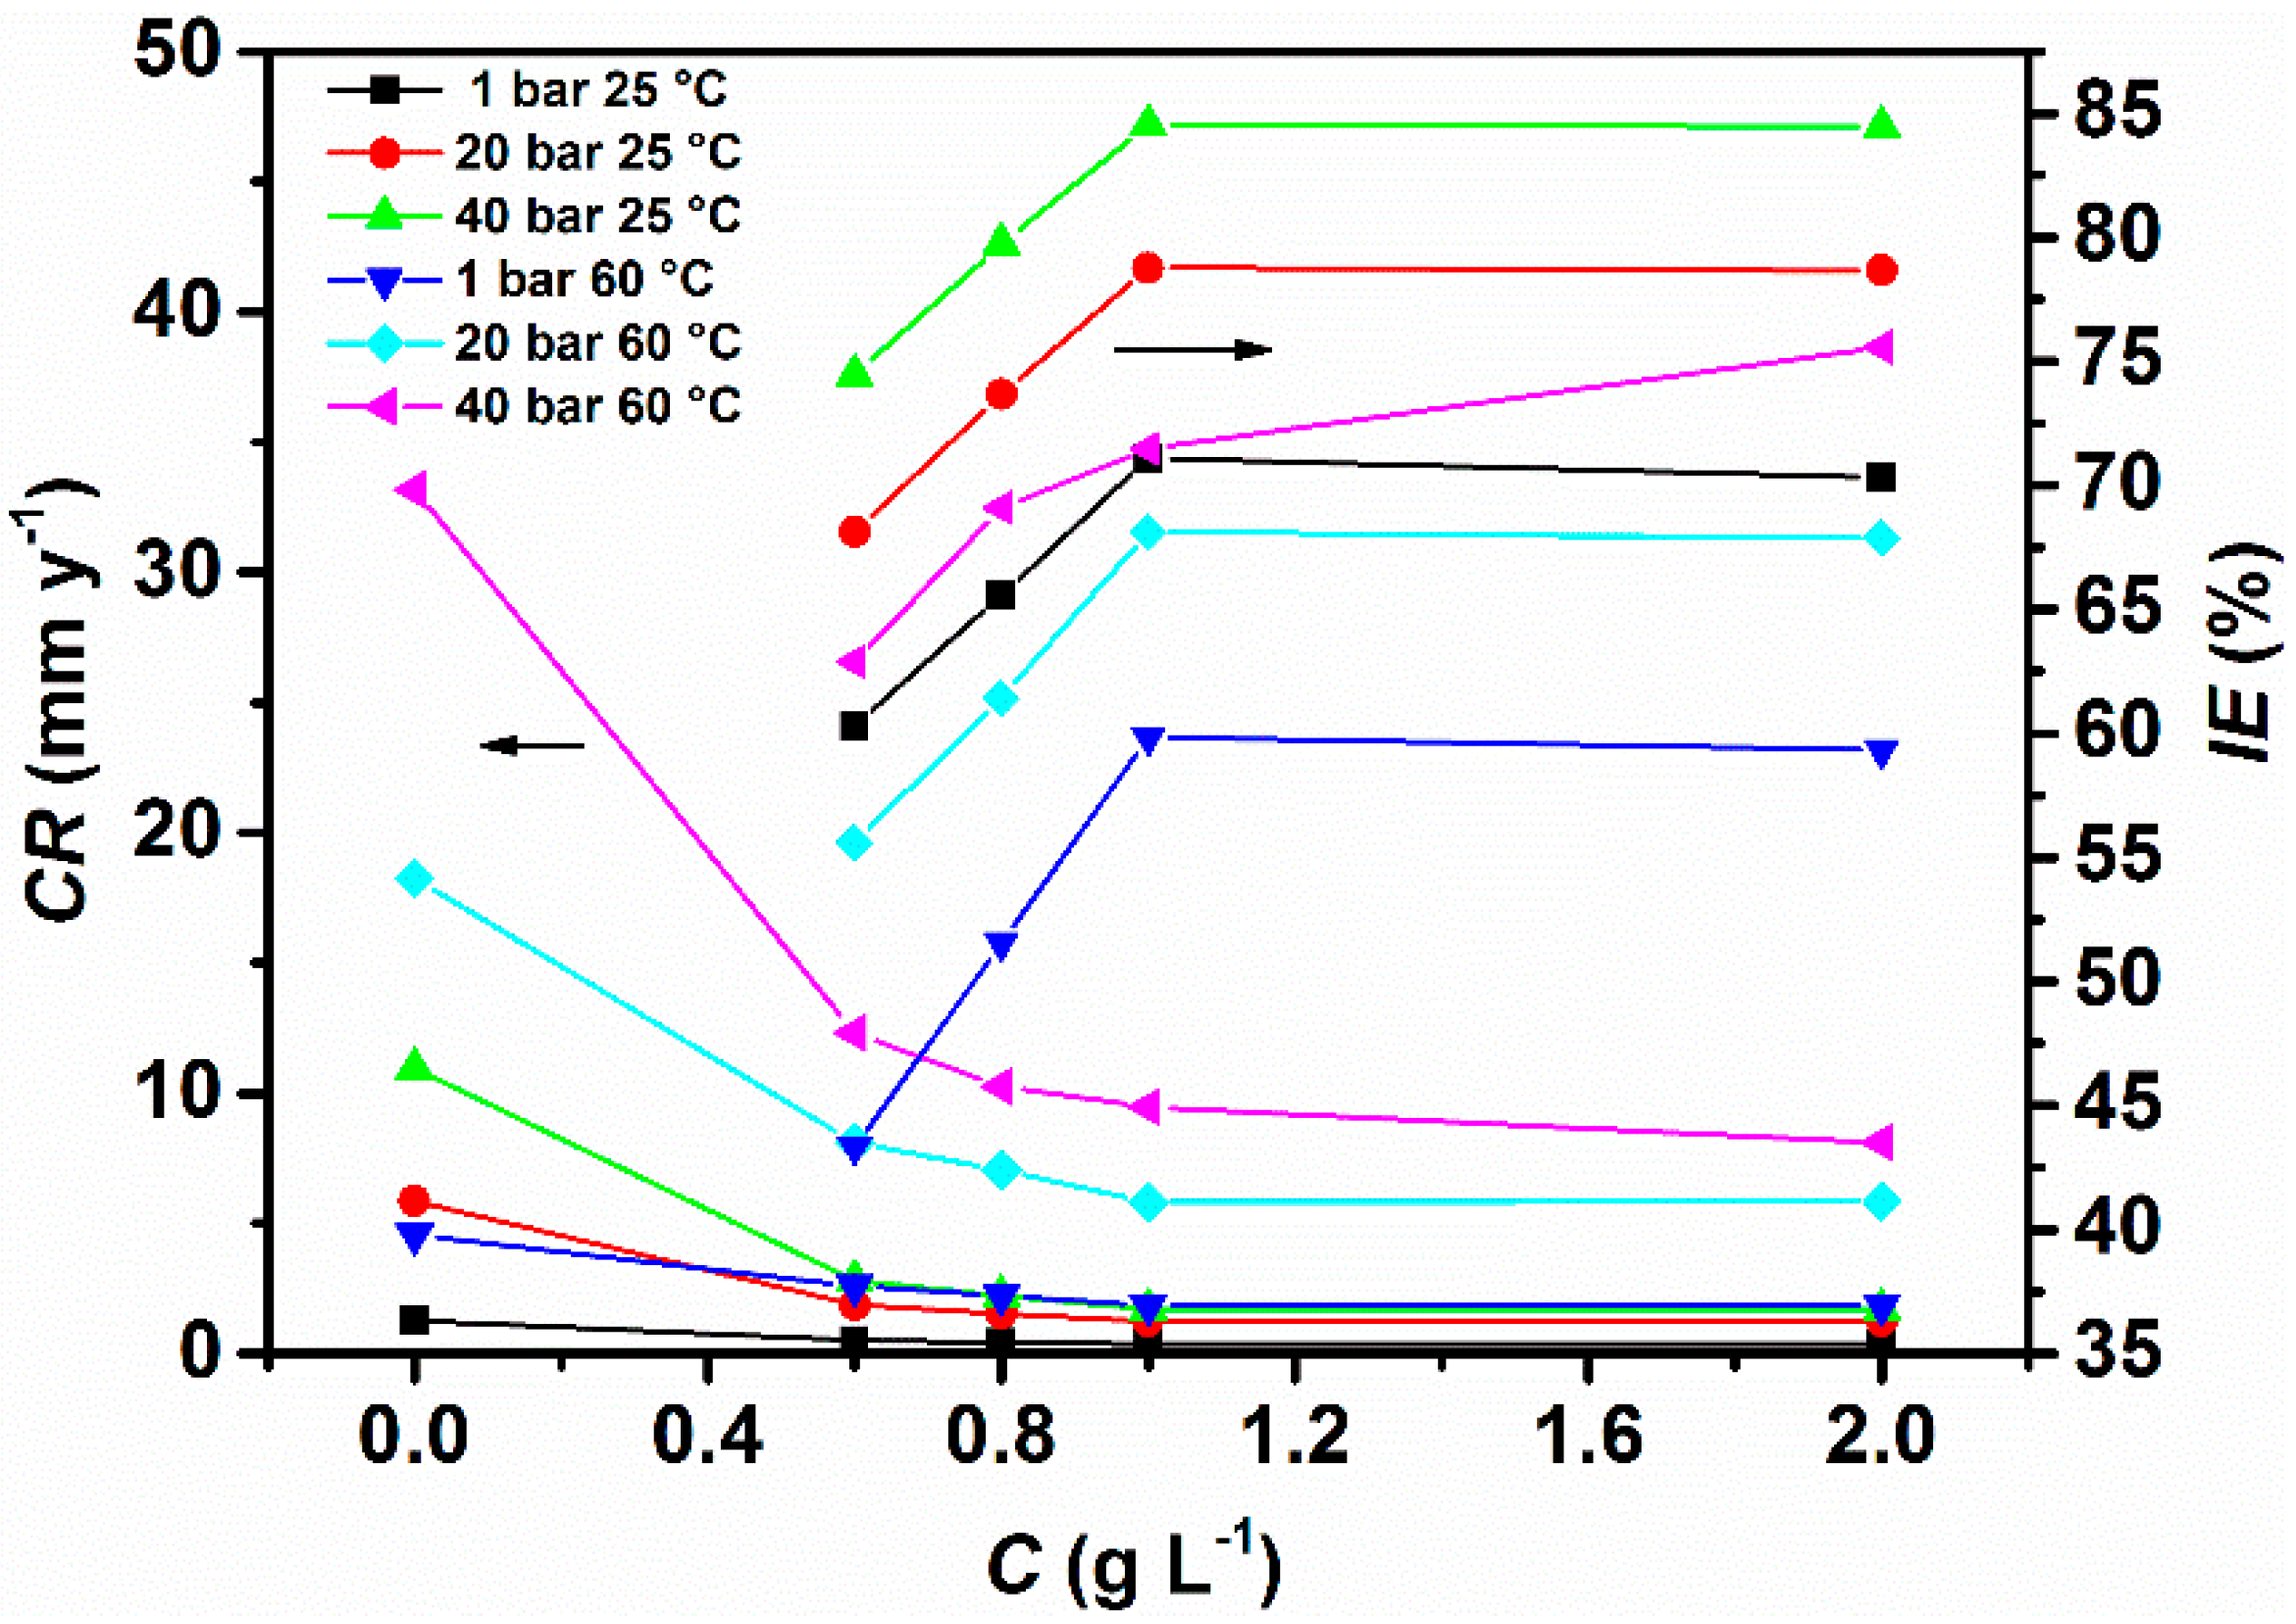
- The weight loss results showed that the thickening agent gum arabic was found to be an efficient corrosion inhibitor for carbon steel in a high-pressure CO2-saline environment. The Inhibition efficiency increased with an increase in inhibitor concentration and CO2 partial pressure with the maximum value of IE found to be 84.53% at = 40 bar after 24 h of immersion. Moreover, the weight loss results also showed that GA was effectively able to protect the steel surface from sweet corrosion at high CO2 partial pressures (i.e., 40 bar) even after a prolonged immersion time (i.e., 168 h) with a corrosion inhibition efficiency found to be 74.41%.
- The adsorption of GA on the carbon steel surface follows the Temkin’s adsorption isotherm model. The negative free energy of adsorption ΔG°ads indicates a strong and spontaneous adsorption of GA on the carbon steel surface. Furthermore, the value of ΔG°ads indicates that the GA adsorbs mainly via physical adsorption on the metal surface.
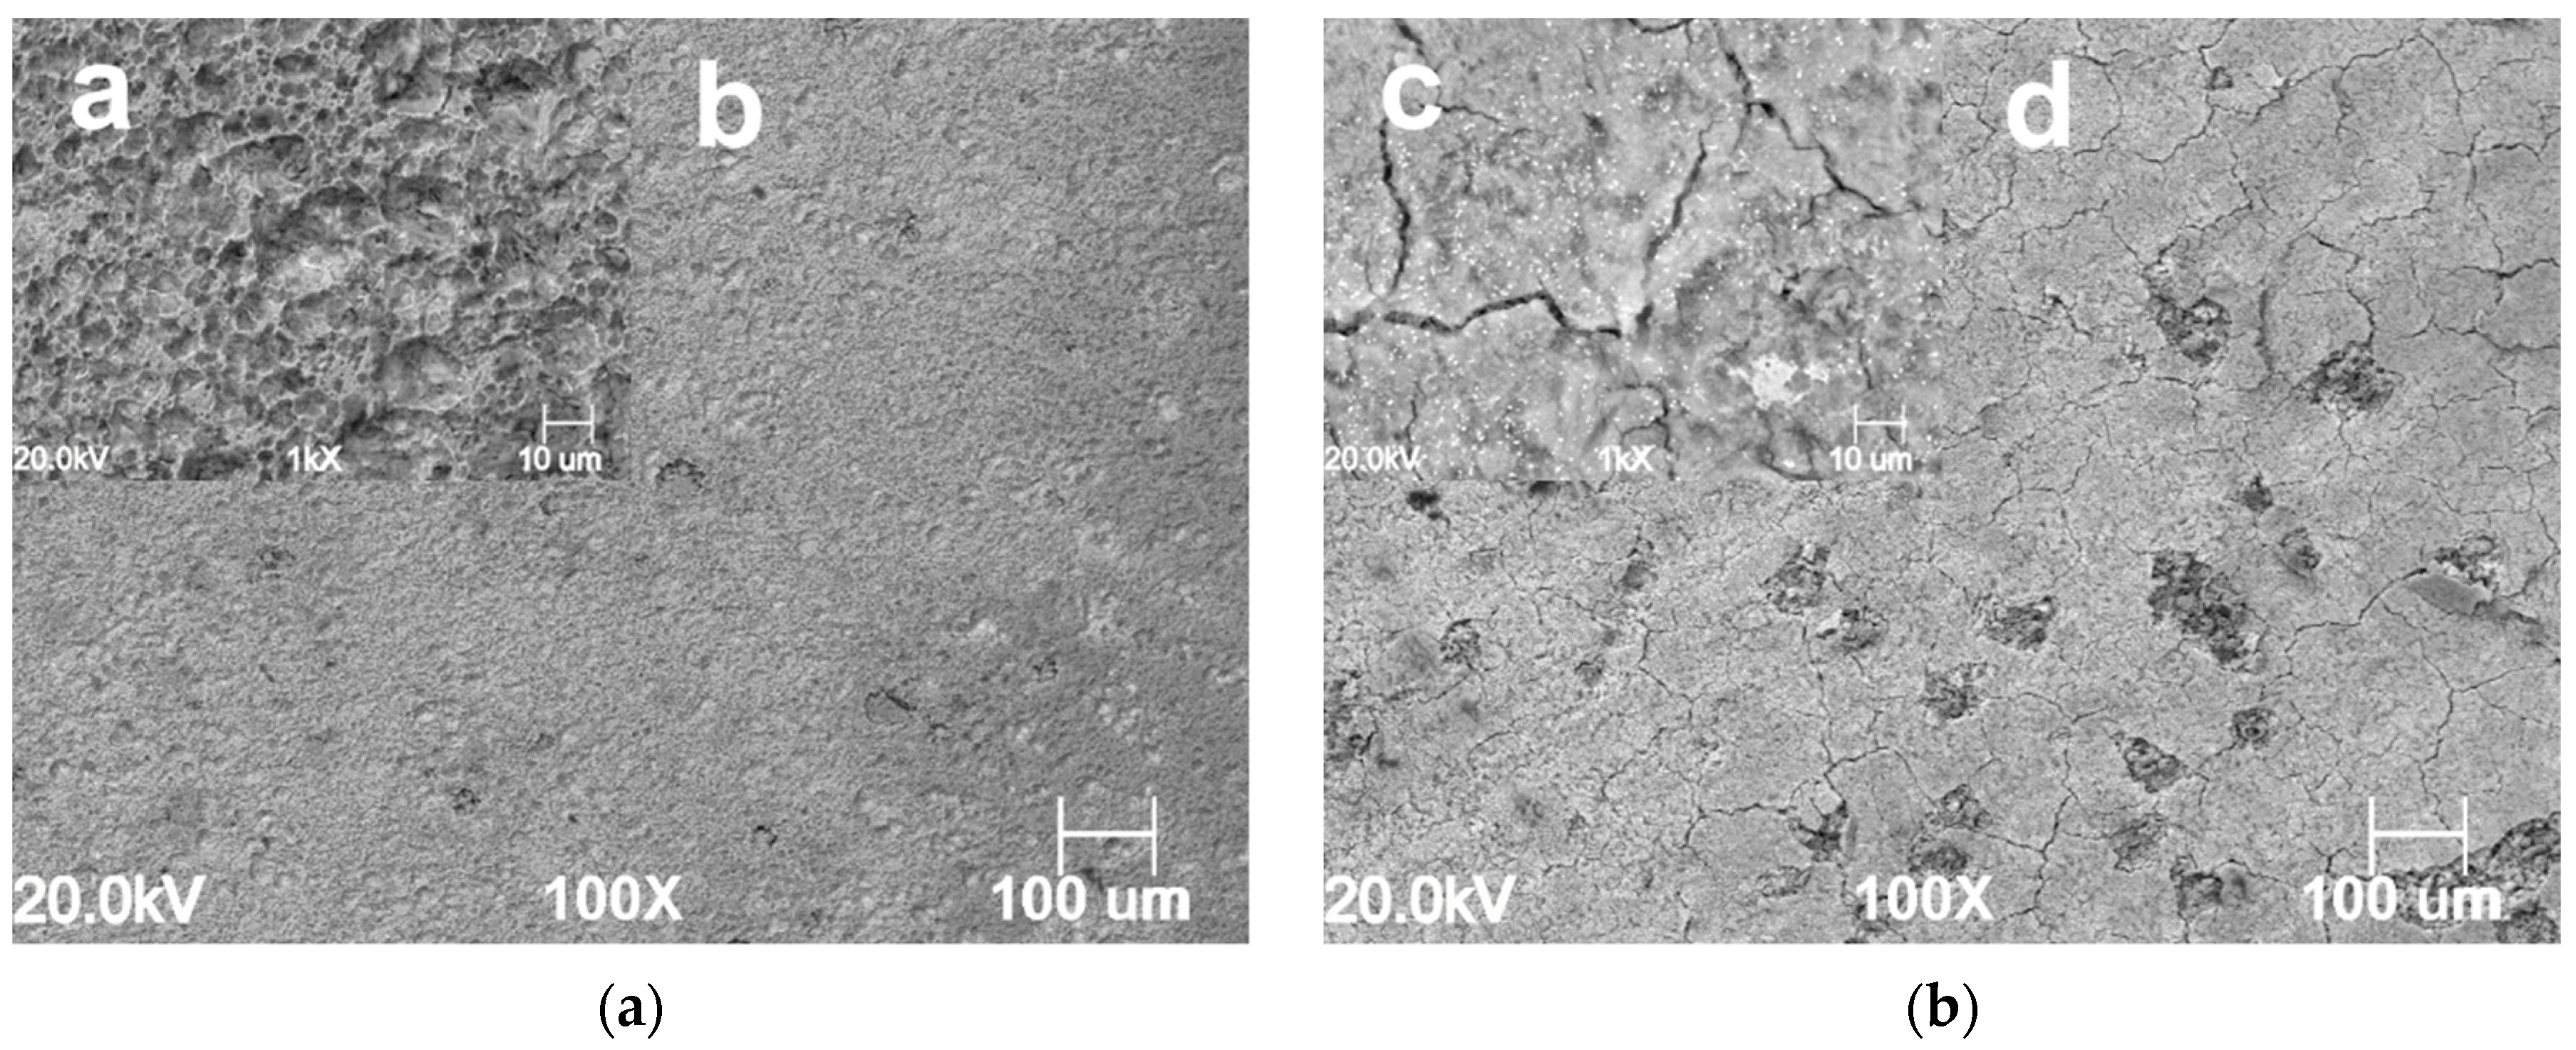
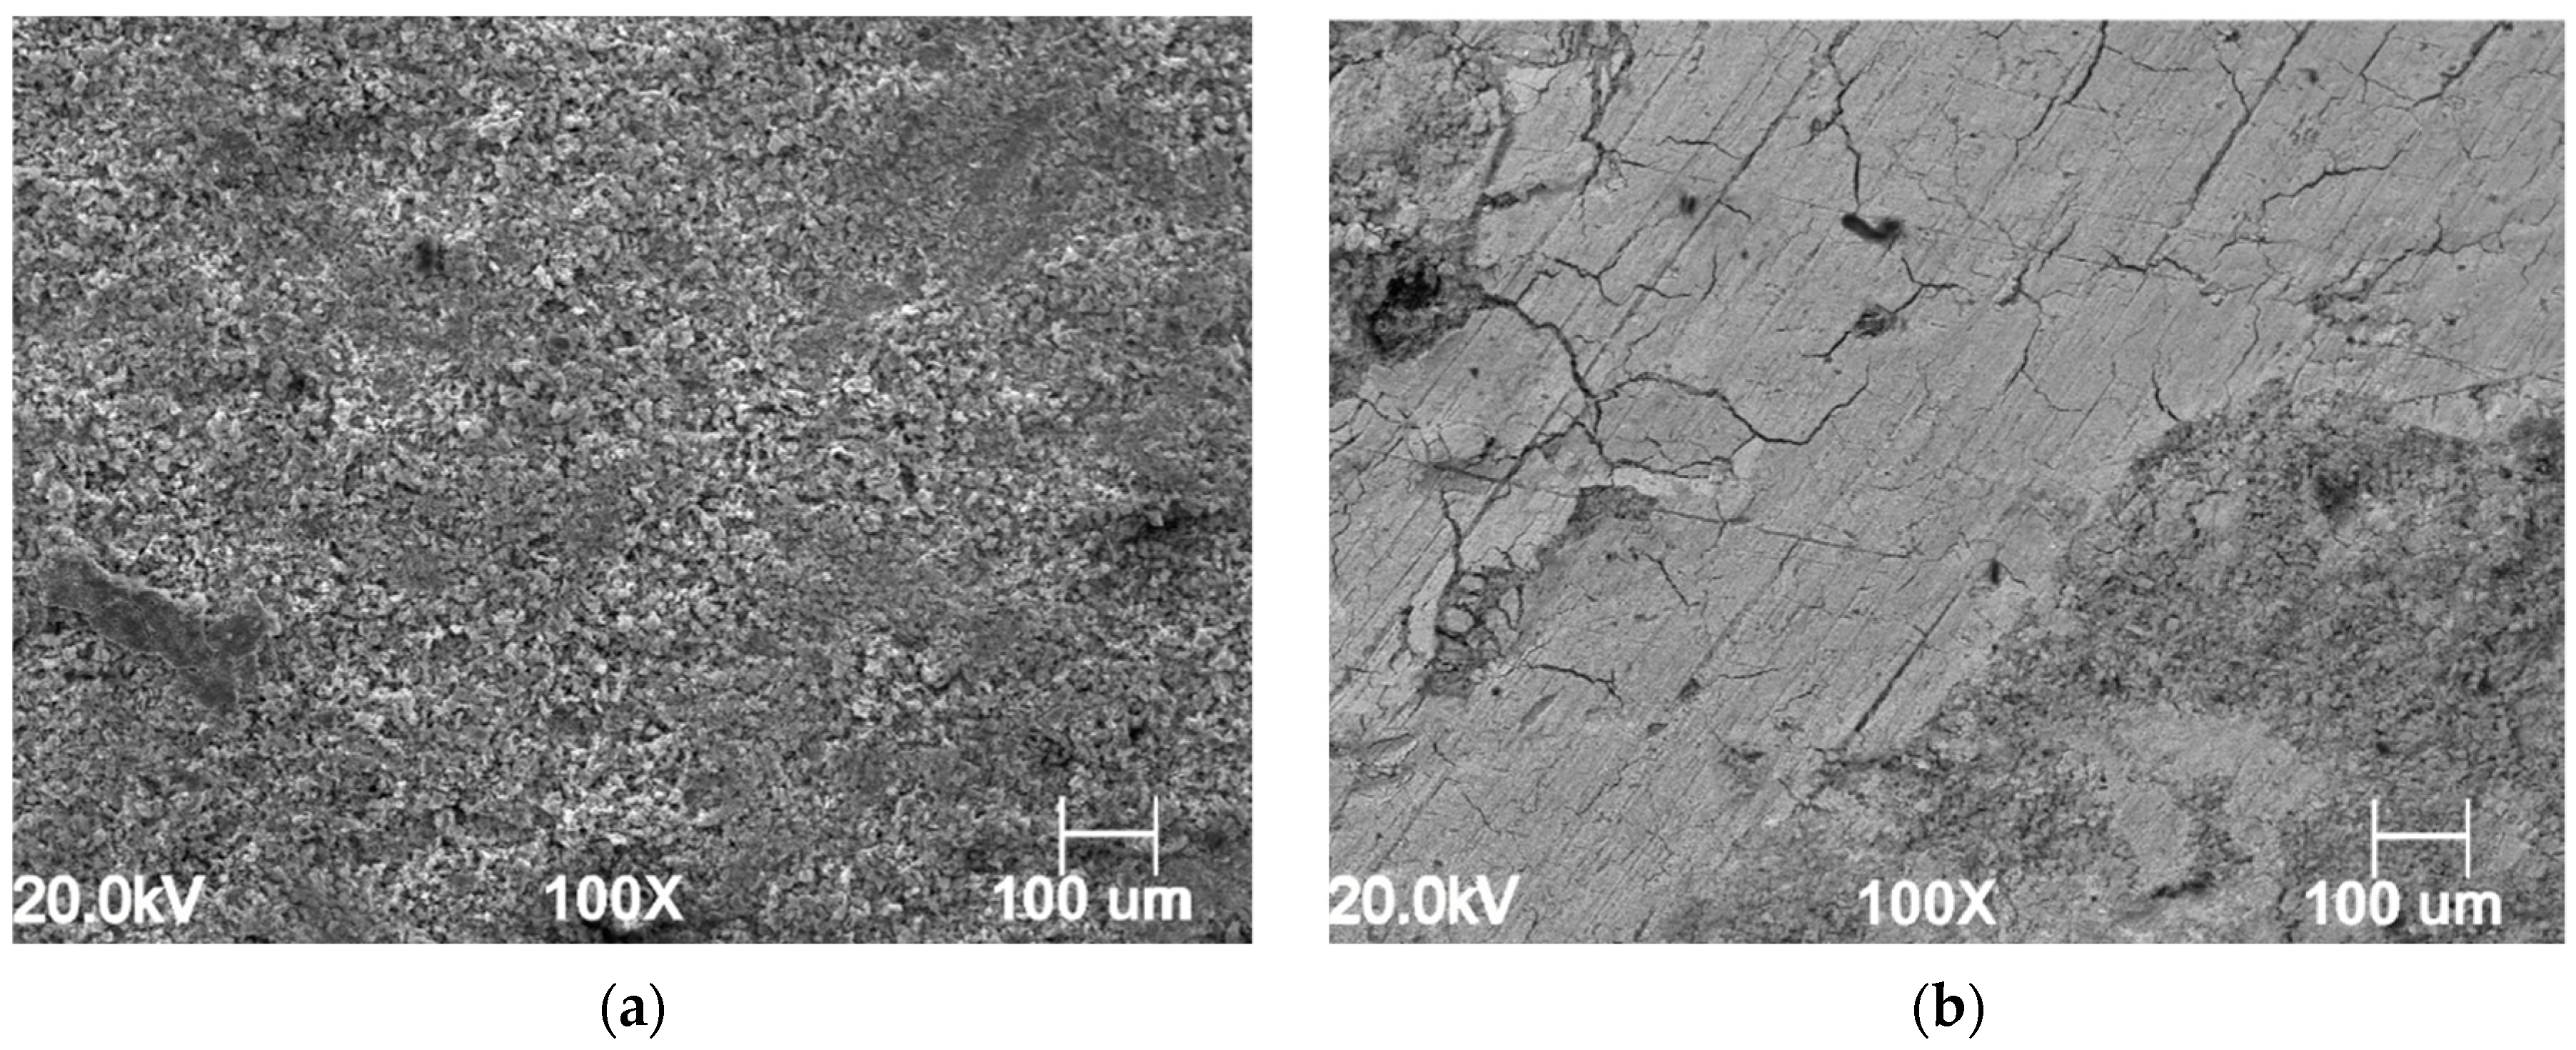
- The SEM analysis revealed that in the presence of GA the protective layer on the metal surface becomes more compact and dense with an increase in CO2 partial pressure. Also, the SEM analysis revealed that after 168 h of immersion, in the presence of GA, the metal surface appeared to be less damaged and smother.
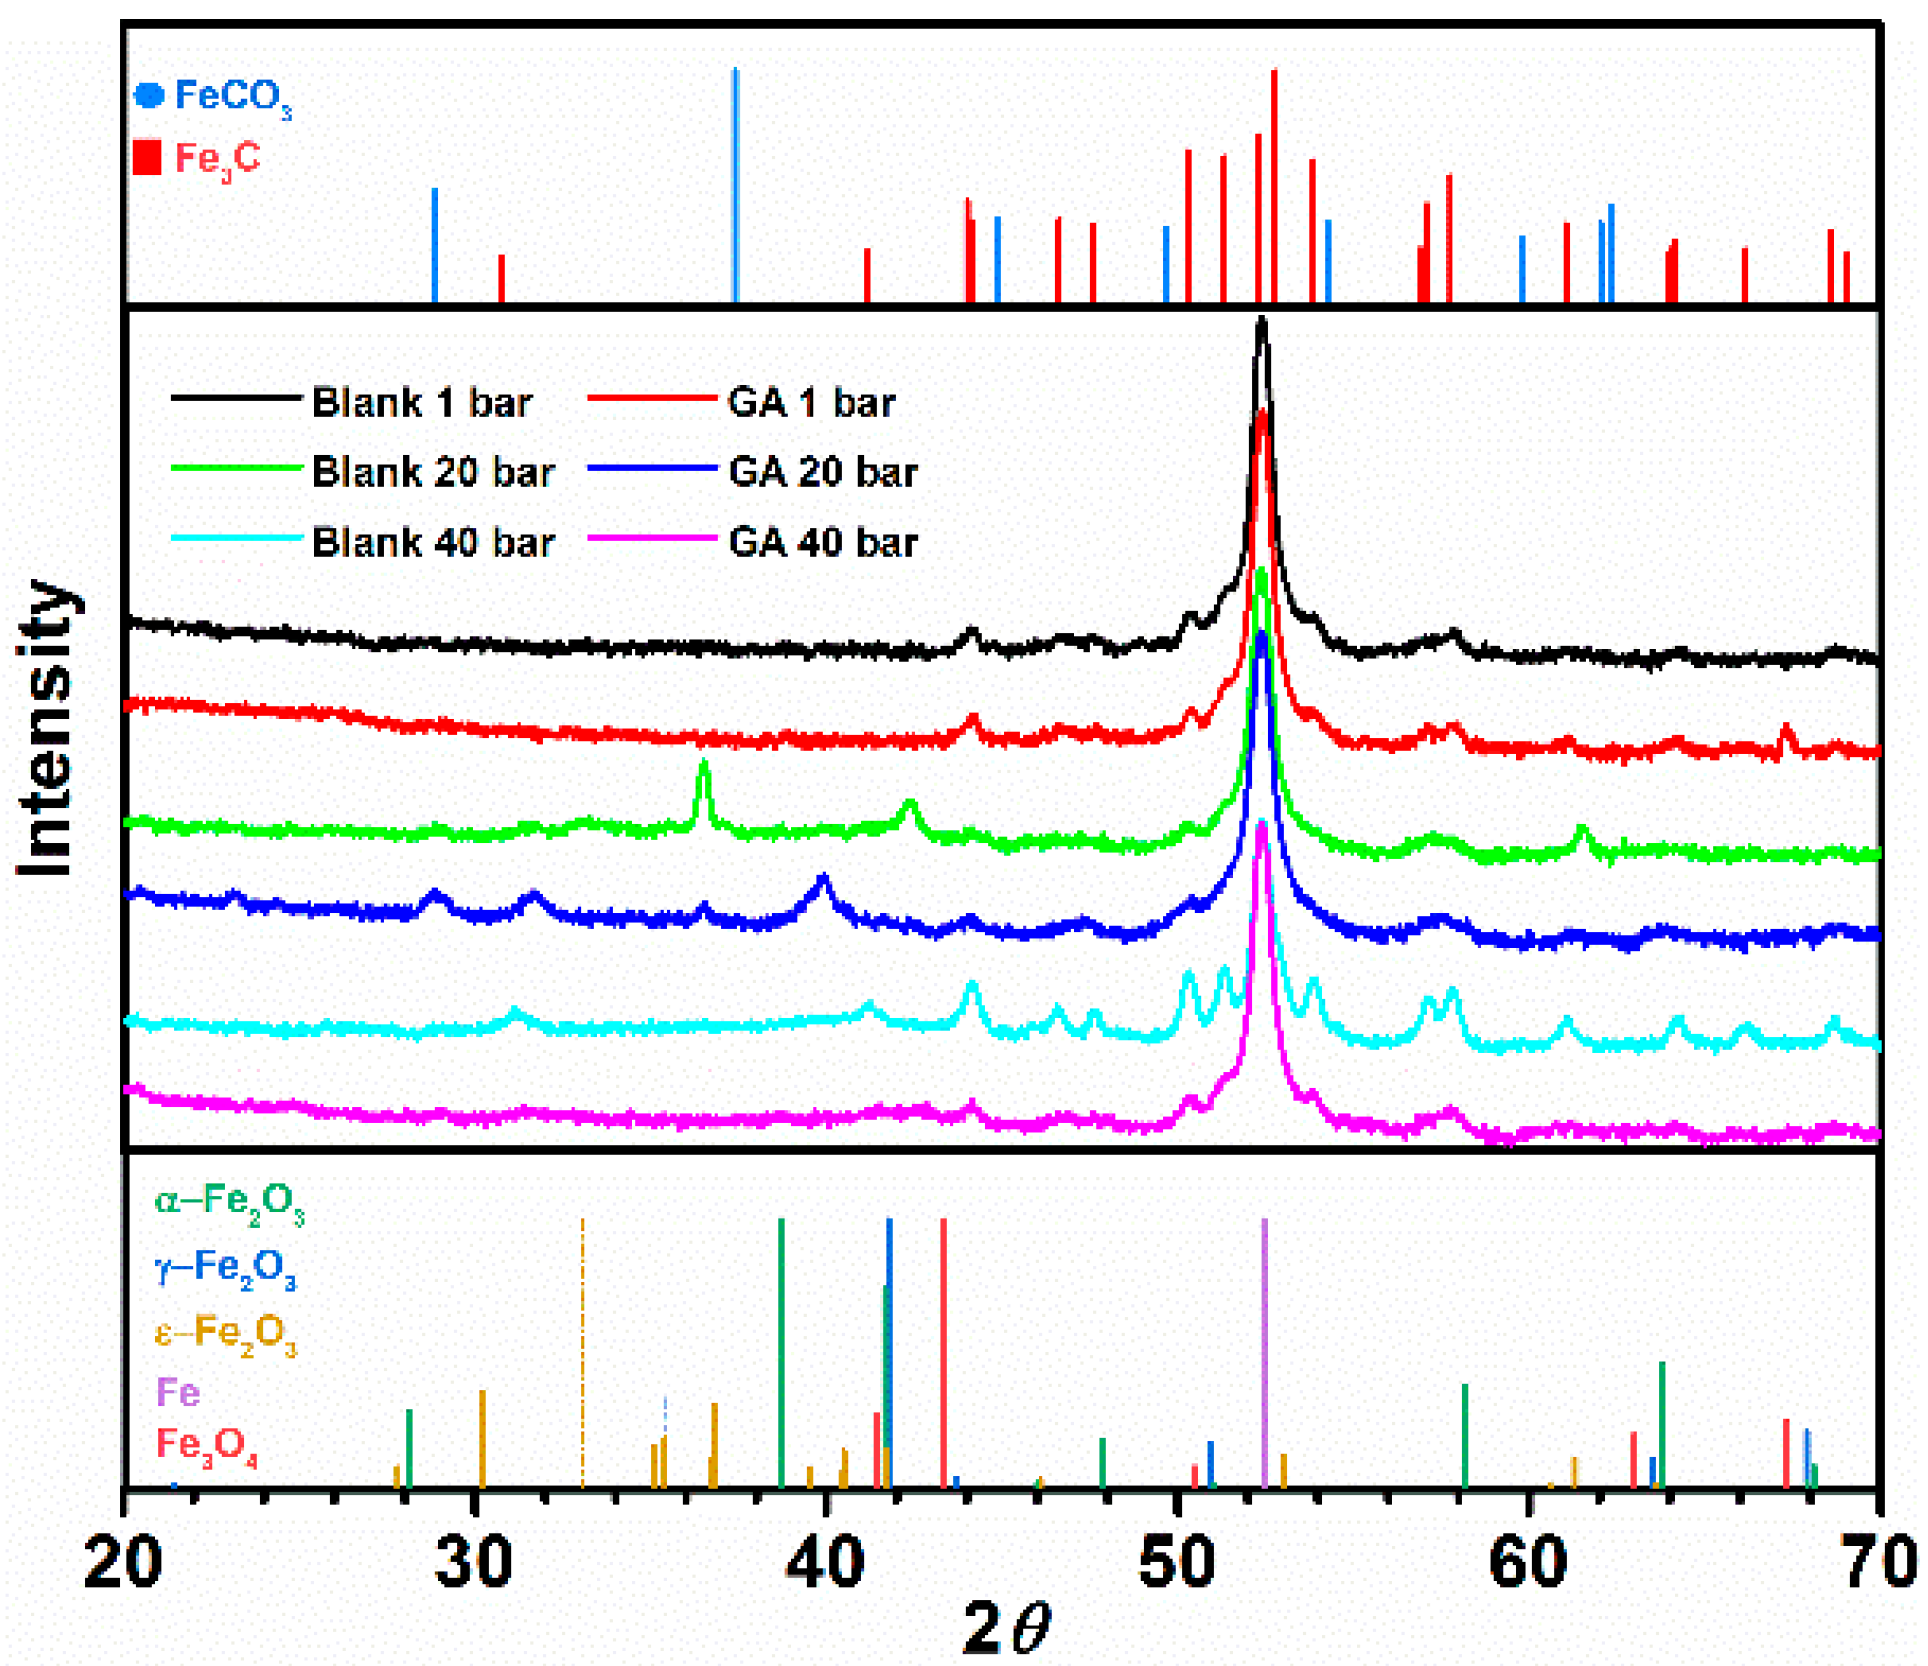
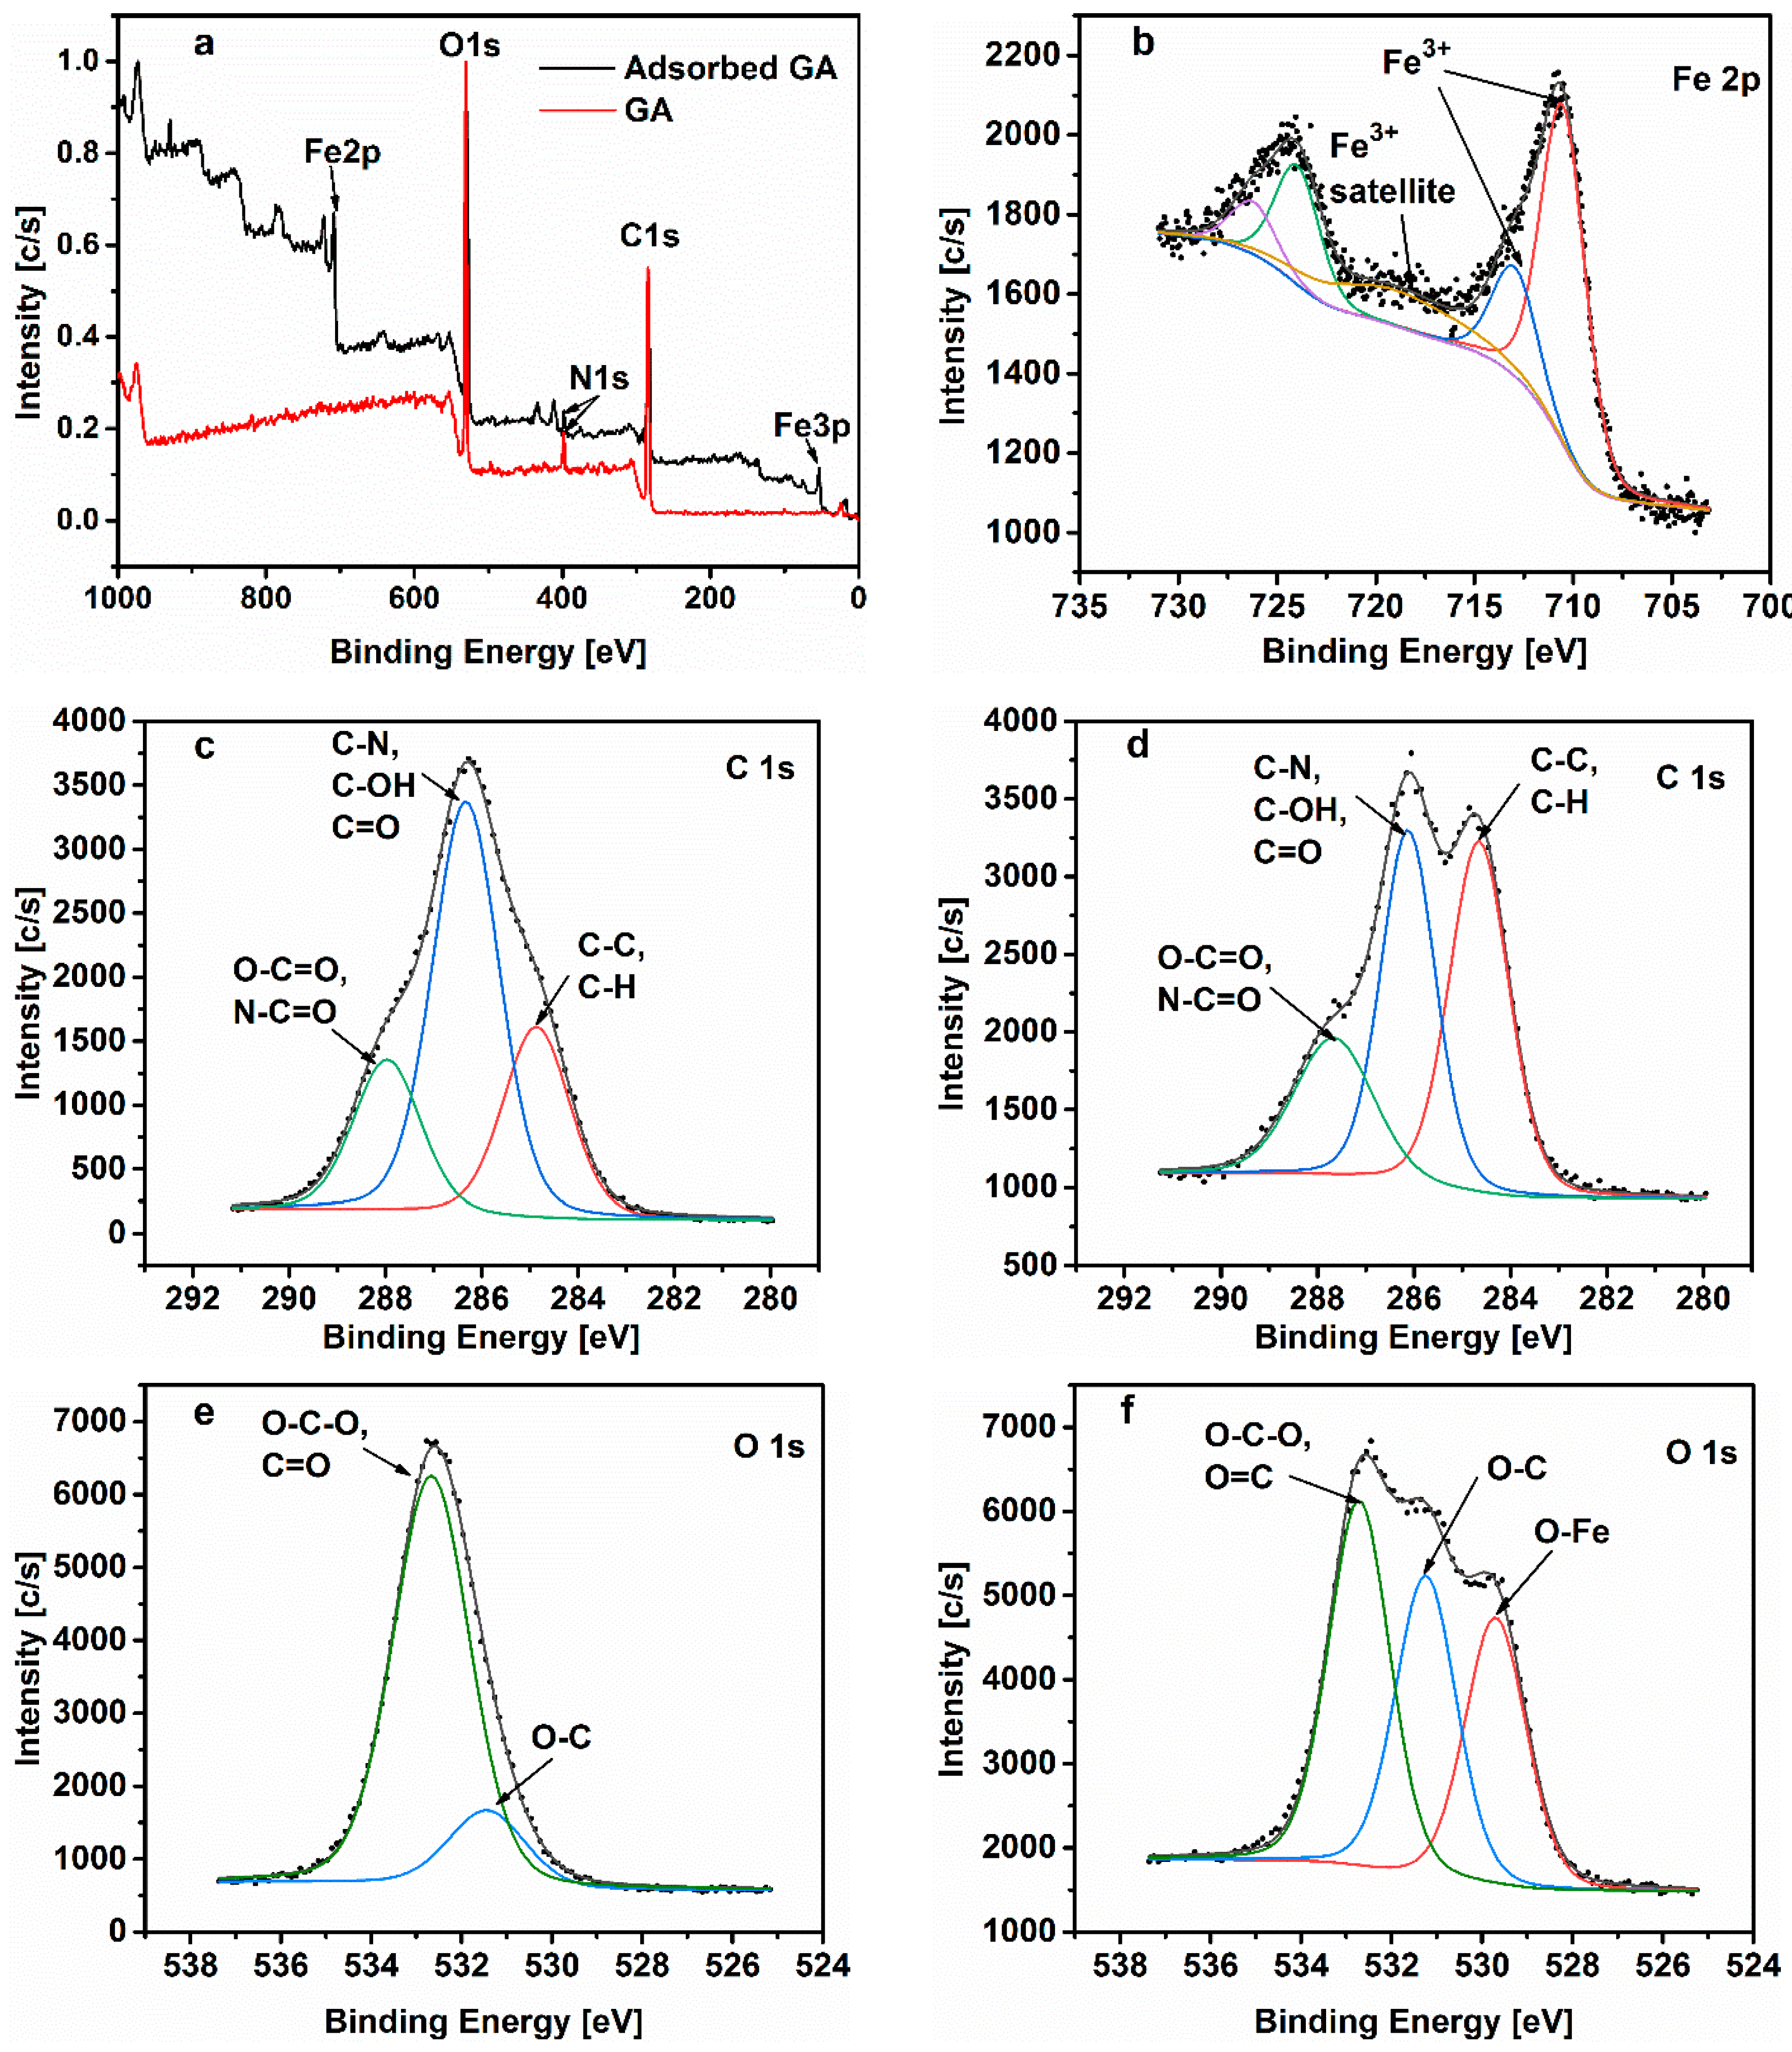
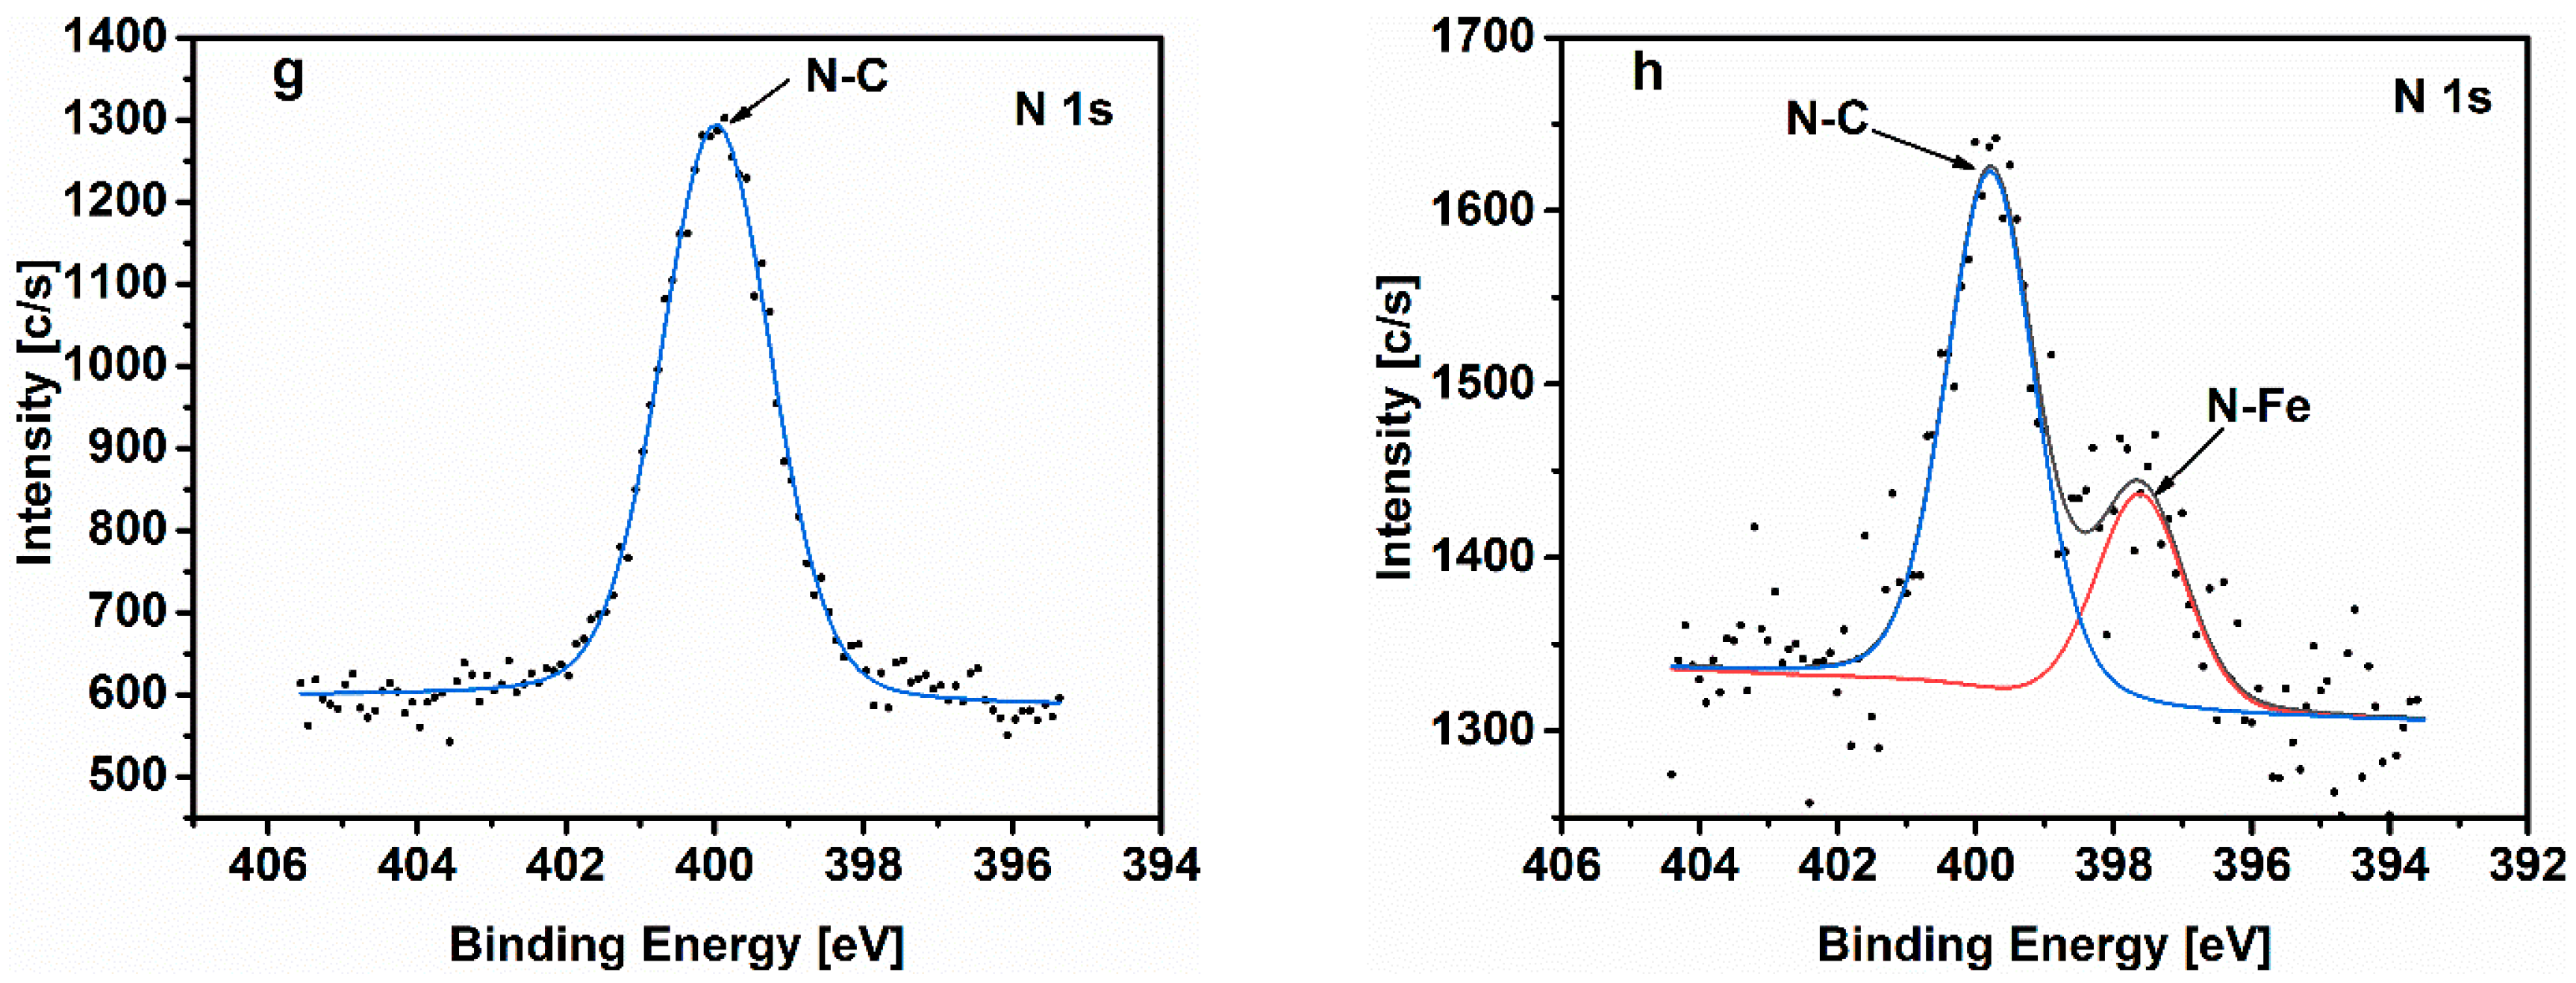
- The XPS results confirmed the formation of a protective layer containing GA molecules and iron oxides on the metal surface.
Supplementary Materials
Author Contributions
Funding
Acknowledgments
Conflicts of Interest
References
- Sheng, J.J. Enhanced oil recovery in shale reservoirs by gas injection. J. Nat. Gas Sci. Eng. 2015, 22, 252–259. [Google Scholar] [CrossRef] [Green Version]
- Bai, H.; Wang, Y.; Ma, Y.; Zhang, Q.; Zhang, N. Effect of CO2 Partial Pressure on the Corrosion Behavior of J55 Carbon Steel in 30% Crude Oil/Brine Mixture. Materials 2018, 11, 1765. [Google Scholar] [CrossRef] [PubMed] [Green Version]
- Bai, H.; Wang, Y.; Ma, Y.; Ren, P.; Zhang, N. Pitting Corrosion and Microstructure of J55 Carbon Steel Exposed to CO2/Crude Oil/Brine Solution under 2–15 MPa at 30–80 °C. Materials 2018, 11, 2374. [Google Scholar] [CrossRef] [PubMed] [Green Version]
- Mustafa, A.H.; Ari-Wahjoedi, B.; Ismail, M.C. Inhibition of CO2 Corrosion of X52 Steel by Imidazoline-Based Inhibitor in High Pressure CO2-Water Environment. J. Mater. Eng. Perform. 2012, 22, 1748–1755. [Google Scholar] [CrossRef]
- Islam, A.; Farhat, Z.N. Characterization of the Corrosion Layer on Pipeline Steel in Sweet Environment. J. Mater. Eng. Perform. 2015, 24, 3142–3158. [Google Scholar] [CrossRef]
- Aristia, G.; Hoa, L.Q.; Bäßler, R. Corrosion of Carbon Steel in Artificial Geothermal Brine: Influence of Carbon Dioxide at 70 °C and 150 °C. Materials 2019, 12, 3801. [Google Scholar] [CrossRef] [Green Version]
- Palumbo, G.; Górny, M.; Banaś, J. Corrosion Inhibition of Pipeline Carbon Steel (N80) in CO2-Saturated Chloride (0.5 M of KCl) Solution Using Gum Arabic as a Possible Environmentally Friendly Corrosion Inhibitor for Shale Gas Industry. J. Mater. Eng. Perform. 2019, 28, 6458–6470. [Google Scholar] [CrossRef] [Green Version]
- Palumbo, G.; Banas, J.; Bałkowiec, A.; Mizera, J.; Lelek-Borkowska, U. Electrochemical study of the corrosion behaviour of carbon steel in fracturing fluid. J. Solid State Electrochem. 2014, 18, 2933–2945. [Google Scholar] [CrossRef]
- Linter, B.; Burstein, G. Reactions of pipeline steels in carbon dioxide solutions. Corros. Sci. 1999, 41, 117–139. [Google Scholar] [CrossRef]
- Palumbo, G.; Banaś, J. Inhibition effect of guar gum on the corrosion behaviour of carbon steel (K-55) in fracturing fluid. Solid State Phenom. 2015, 227, 59–62. [Google Scholar] [CrossRef]
- Tang, J.; Hu, Y.; Han, Z.; Wang, H.; Zhu, Y.; Wang, Y.; Nie, Z.; Wang, Y. Experimental and Theoretical Study on the Synergistic Inhibition Effect of Pyridine Derivatives and Sulfur-Containing Compounds on the Corrosion of Carbon Steel in CO2-Saturated 3.5 wt.% NaCl Solution. Molecules 2018, 23, 3270. [Google Scholar] [CrossRef] [Green Version]
- Ortega-Toledo, D.; Gonzalez-Rodriguez, J.G.; Casales, M.; Martinez, L.; Martinez-Villafañe, A. Co2 corrosion inhibition of X-120 pipeline steel by a modified imidazoline under flow conditions. Corros. Sci. 2011, 53, 3780–3787. [Google Scholar] [CrossRef]
- Singh, A.; Ansari, K.R.; Quraishi, M.A.; Lgaz, H. Effect of Electron Donating Functional Groups on Corrosion Inhibition of J55 Steel in a Sweet Corrosive Environment: Experimental, Density Functional Theory, and Molecular Dynamic Simulation. Materials 2018, 12, 17. [Google Scholar] [CrossRef] [PubMed] [Green Version]
- Ghareba, S.; Omanovic, S. The effect of electrolyte flow on the performance of 12-aminododecanoic acid as a carbon steel corrosion inhibitor in CO2-saturated hydrochloric acid. Corros. Sci. 2011, 53, 3805–3812. [Google Scholar] [CrossRef]
- Umoren, S.; Alahmary, A.A.; Gasem, Z.M.; Solomon, M. Evaluation of chitosan and carboxymethyl cellulose as ecofriendly corrosion inhibitors for steel. Int. J. Boil. Macromol. 2018, 117, 1017–1028. [Google Scholar] [CrossRef] [PubMed]
- Ansari, K.; Chauhan, D.S.; Quraishi, M.; Mazumder, M.A.; Singh, A. Chitosan Schiff base: An environmentally benign biological macromolecule as a new corrosion inhibitor for oil & gas industries. Int. J. Boil. Macromol. 2020, 144, 305–315. [Google Scholar] [CrossRef]
- Lin, Y.; Singh, A.; Ebenso, E.E.; Quraishi, M.A.; Zhou, Y.; Huang, Y. Use of HPHT Autoclave to Determine Corrosion Inhibition by Berberine extract on Carbon Steels in 3.5% NaCl Solution Saturated with CO2. Int. J. Electrochem. Sci. 2015, 10, 194–208. [Google Scholar]
- Singh, A.; Lin, Y.; Liu, W.; Ebenso, E.E.; Pan, J. Extract of Momordica charantia (Karela) Seeds as Corrosion Inhibitor for P110SS Steel in CO2 Saturated 3.5% NaCl Solution. Int. J. Electrochem. Sci. 2013, 8, 12884–12893. [Google Scholar]
- Singh, A.; Lin, Y.; Ebenso, E.E.; Liu, W.; Pan, J.; Huang, B. Gingko biloba fruit extract as an eco-friendly corrosion inhibitor for J55 steel in CO2 saturated 3.5% NaCl solution. J. Ind. Eng. Chem. 2015, 24, 219–228. [Google Scholar] [CrossRef]
- Palumbo, G.; Berent, K.; Proniewicz, E.; Banaś, J. Guar Gum as an Eco-Friendly Corrosion Inhibitor for Pure Aluminium in 1-M HCl Solution. Materials 2019, 12, 2620. [Google Scholar] [CrossRef] [Green Version]
- Bentrah, H.; Rahali, Y.; Chala, A. Gum Arabic as an eco-friendly inhibitor for API 5L X42 pipeline steel in HCl medium. Corros. Sci. 2014, 82, 426–431. [Google Scholar] [CrossRef]
- Umoren, S. Inhibition of aluminium and mild steel corrosion in acidic medium using Gum Arabic. Cellulose 2008, 15, 751–761. [Google Scholar] [CrossRef]
- Singh, A.; Ansari, K.; Quraishi, M. Inhibition effect of natural polysaccharide composite on hydrogen evolution and P110 steel corrosion in 3.5 wt% NaCl solution saturated with CO2: Combination of experimental and surface analysis. Int. J. Hydrogen Energy 2020, 45, 25398–25408. [Google Scholar] [CrossRef]
- Umoren, S.; Ogbobe, O.; Igwe, I.; Ebenso, E. Inhibition of mild steel corrosion in acidic medium using synthetic and naturally occurring polymers and synergistic halide additives. Corros. Sci. 2008, 50, 1998–2006. [Google Scholar] [CrossRef]
- Mobin, M.; Alam Khan, M. Investigation on the Adsorption and Corrosion Inhibition Behavior of Gum Acacia and Synergistic Surfactants Additives on Mild Steel in 0.1 MH2SO4. J. Dispers. Sci. Technol. 2013, 34, 1496–1506. [Google Scholar] [CrossRef]
- Abu-Dalo, M.A.; Othman, A.A.; Al-Rawashdeh, N.A.F. Exudate gum from acacia trees as green corrosion inhibitor for mild steel in acidic media. Int. J. Electrochem. Sci. 2012, 7, 9303–9324. [Google Scholar]
- Shen, C.; Alvarez, V.; Koenig, J.D.B.; Luo, J.-L. Gum Arabic as corrosion inhibitor in the oil industry: Experimental and theoretical studies. Corros. Eng. Sci. Technol. 2019, 54, 444–454. [Google Scholar] [CrossRef]
- Azzaoui, K.; Mejdoubi, E.; Jodeh, S.; Lamhamdi, A.; Rodríguez-Castellón, E.; Algarra, M.; Zarrouk, A.; Errich, A.; Salghi, R.; Lgaz, H. Eco friendly green inhibitor Gum Arabic (GA) for the corrosion control of mild steel in hydrochloric acid medium. Corros. Sci. 2017, 129, 70–81. [Google Scholar] [CrossRef]
- Spellman, F.R. Environmental Impacts of Hydraulic Fracturing; Informa UK Limited: London, UK, 2012. [Google Scholar]
- ASTM-G1-90, Standard Practice for Preparing, Cleaning, and Evaluation Corrosion Test Specimens; ASTM International: West Conshohocken, PA, USA, 1999.
- Choi, Y.-S.; Nešić, S. Determining the corrosive potential of CO2 transport pipeline in high pCO2–water environments. Int. J. Greenh. Gas. Control 2011, 5, 788–797. [Google Scholar] [CrossRef]
- Li, X.; Peng, C.; Crawshaw, J.; Maitland, G.; Trusler, J.M. The pH of CO2-saturated aqueous NaCl and NaHCO3 solutions at temperatures between 308 K and 373 K at pressures up to 15 MPa. Fluid Phase Equilibria 2018, 458, 253–263. [Google Scholar] [CrossRef]
- Dong, B.; Liu, W.; Zhang, Y.; Banthukul, W.; Zhao, Y.; Zhang, T.; Fan, Y.; Li, X.; Wei, L.; Yonggang, Z.; et al. Comparison of the characteristics of corrosion scales covering 3Cr steel and X60 steel in CO2-H2S coexistence environment. J. Nat. Gas Sci. Eng. 2020, 80, 103371. [Google Scholar] [CrossRef]
- Bousselmi, L.; Fiaud, C.; Tribollet, B.; Triki, E. Impedance spectroscopic study of a steel electrode in condition of scaling and corrosion. Electrochim. Acta 1999, 44, 4357–4363. [Google Scholar] [CrossRef]
- Bousselmi, L.; Fiaud, C.; Tribollet, B.; Triki, E. The characterisation of the coated layer at the interface carbon steel-natural salt water by impedance spectroscopy. Corros. Sci. 1997, 39, 1711–1724. [Google Scholar] [CrossRef]
- Roy, P.; Karfa, P.; Adhikari, U.; Sukul, D. Corrosion inhibition of mild steel in acidic medium by polyacrylamide grafted Guar gum with various grafting percentage: Effect of intramolecular synergism. Corros. Sci. 2014, 88, 246–253. [Google Scholar] [CrossRef]
- Saha, S.K.; Dutta, A.; Sukul, D.; Ghosh, P.; Banerjee, P. Adsorption and corrosion inhibition effect of Schiff base molecules on the mild steel surface in 1 M HCl medium: A combined experimental and theoretical approach. Phys. Chem. Chem. Phys. 2015, 17, 5679–5690. [Google Scholar] [CrossRef]
- Outirite, M.; Lagrenée, M.; Lebrini, M.; Traisnel, M.; Jama, C.; Vezin, H.; Bentiss, F. Ac impedance, X-ray photoelectron spectroscopy and density functional theory studies of 3,5-bis(n-pyridyl)-1,2,4-oxadiazoles as efficient corrosion inhibitors for carbon steel surface in hydrochloric acid solution. Electrochim. Acta 2010, 55, 1670–1681. [Google Scholar] [CrossRef]
- Paolinelli, L.; Perez, T.; Simison, S. The effect of pre-corrosion and steel microstructure on inhibitor performance in CO2 corrosion. Corros. Sci. 2008, 50, 2456–2464. [Google Scholar] [CrossRef]
- Mora-Mendoza, J.; Turgoose, S. Fe3C influence on the corrosion rate of mild steel in aqueous CO2 systems under turbulent flow conditions. Corros. Sci. 2002, 44, 1223–1246. [Google Scholar] [CrossRef]
- Ding, Y.; Brown, B.; Young, D.; Singer, M. Effectiveness of an Imidazoline-Type Inhibitor Against CO2 Corrosion of Mild Steel at Elevated Temperatures (120 °C–150 °C). In Proceedings of the CORROSION 2018, Phoenix, AZ, USA, 15–19 April 2018; p. 22. [Google Scholar]
- Heuer, J.; Stubbins, J. An XPS characterization of FeCO3 films from CO2 corrosion. Corros. Sci. 1999, 41, 1231–1243. [Google Scholar] [CrossRef]
- Boumhara, K.; Tabyaoui, M.; Jama, C.; Bentiss, F. Artemisia Mesatlantica essential oil as green inhibitor for carbon steel corrosion in 1M HCl solution: Electrochemical and XPS investigations. J. Ind. Eng. Chem. 2015, 29, 146–155. [Google Scholar] [CrossRef]
- Bouanis, M.; Tourabi, M.; Nyassi, A.; Zarrouk, A.; Jama, C.; Bentiss, F. Corrosion inhibition performance of 2,5-bis(4-dimethylaminophenyl)-1,3,4-oxadiazole for carbon steel in HCl solution: Gravimetric, electrochemical and XPS studies. Appl. Surf. Sci. 2016, 389, 952–966. [Google Scholar] [CrossRef]
- Hashim, N.Z.N.; Anouar, E.H.; Kassim, K.; Zaki, H.M.; Alharthi, A.I.; Embong, Z. XPS and DFT investigations of corrosion inhibition of substituted benzylidene Schiff bases on mild steel in hydrochloric acid. Appl. Surf. Sci. 2019, 476, 861–877. [Google Scholar] [CrossRef]
- Barker, R.; Burkle, D.; Charpentier, T.; Thompson, H.; Neville, A. A review of iron carbonate (FeCO3) formation in the oil and gas industry. Corros. Sci. 2018, 142, 312–341. [Google Scholar] [CrossRef]
- Messali, M.; Lgaz, H.; Dassanayake, R.; Salghi, R.; Jodeh, S.; Abidi, N.; Hamed, O. Guar gum as efficient non-toxic inhibitor of carbon steel corrosion in phosphoric acid medium: Electrochemical, surface, DFT and MD simulations studies. J. Mol. Struct. 2017, 1145, 43–54. [Google Scholar] [CrossRef]
- Williams, D.N.; Gold, K.A.; Holoman, T.R.P.; Ehrman, S.H.; Wilson, O.C. Surface Modification of Magnetic Nanoparticles Using Gum Arabic. J. Nanopart. Res. 2006, 8, 749–753. [Google Scholar] [CrossRef]
- Leong, Y.; Seah, U.; Chu, S.; Ong, B. Effects of Gum Arabic macromolecules on surface forces in oxide dispersions. Colloids Surf. A Physicochem. Eng. Asp. 2001, 182, 263–268. [Google Scholar] [CrossRef]


| C (g L−1) | Rs (Ω cm2) | CPEf | Rf (Ω cm2) | CPEdl | Rct (Ω cm2) | Rp = Rf + Rct (Ω cm2) | χ2 (× 10−3) | IE (%) | ||
|---|---|---|---|---|---|---|---|---|---|---|
| Yf (mΩ−1 sn cm−2) | nf | Ydl (mΩ−1 sn cm−2) | ndl | |||||||
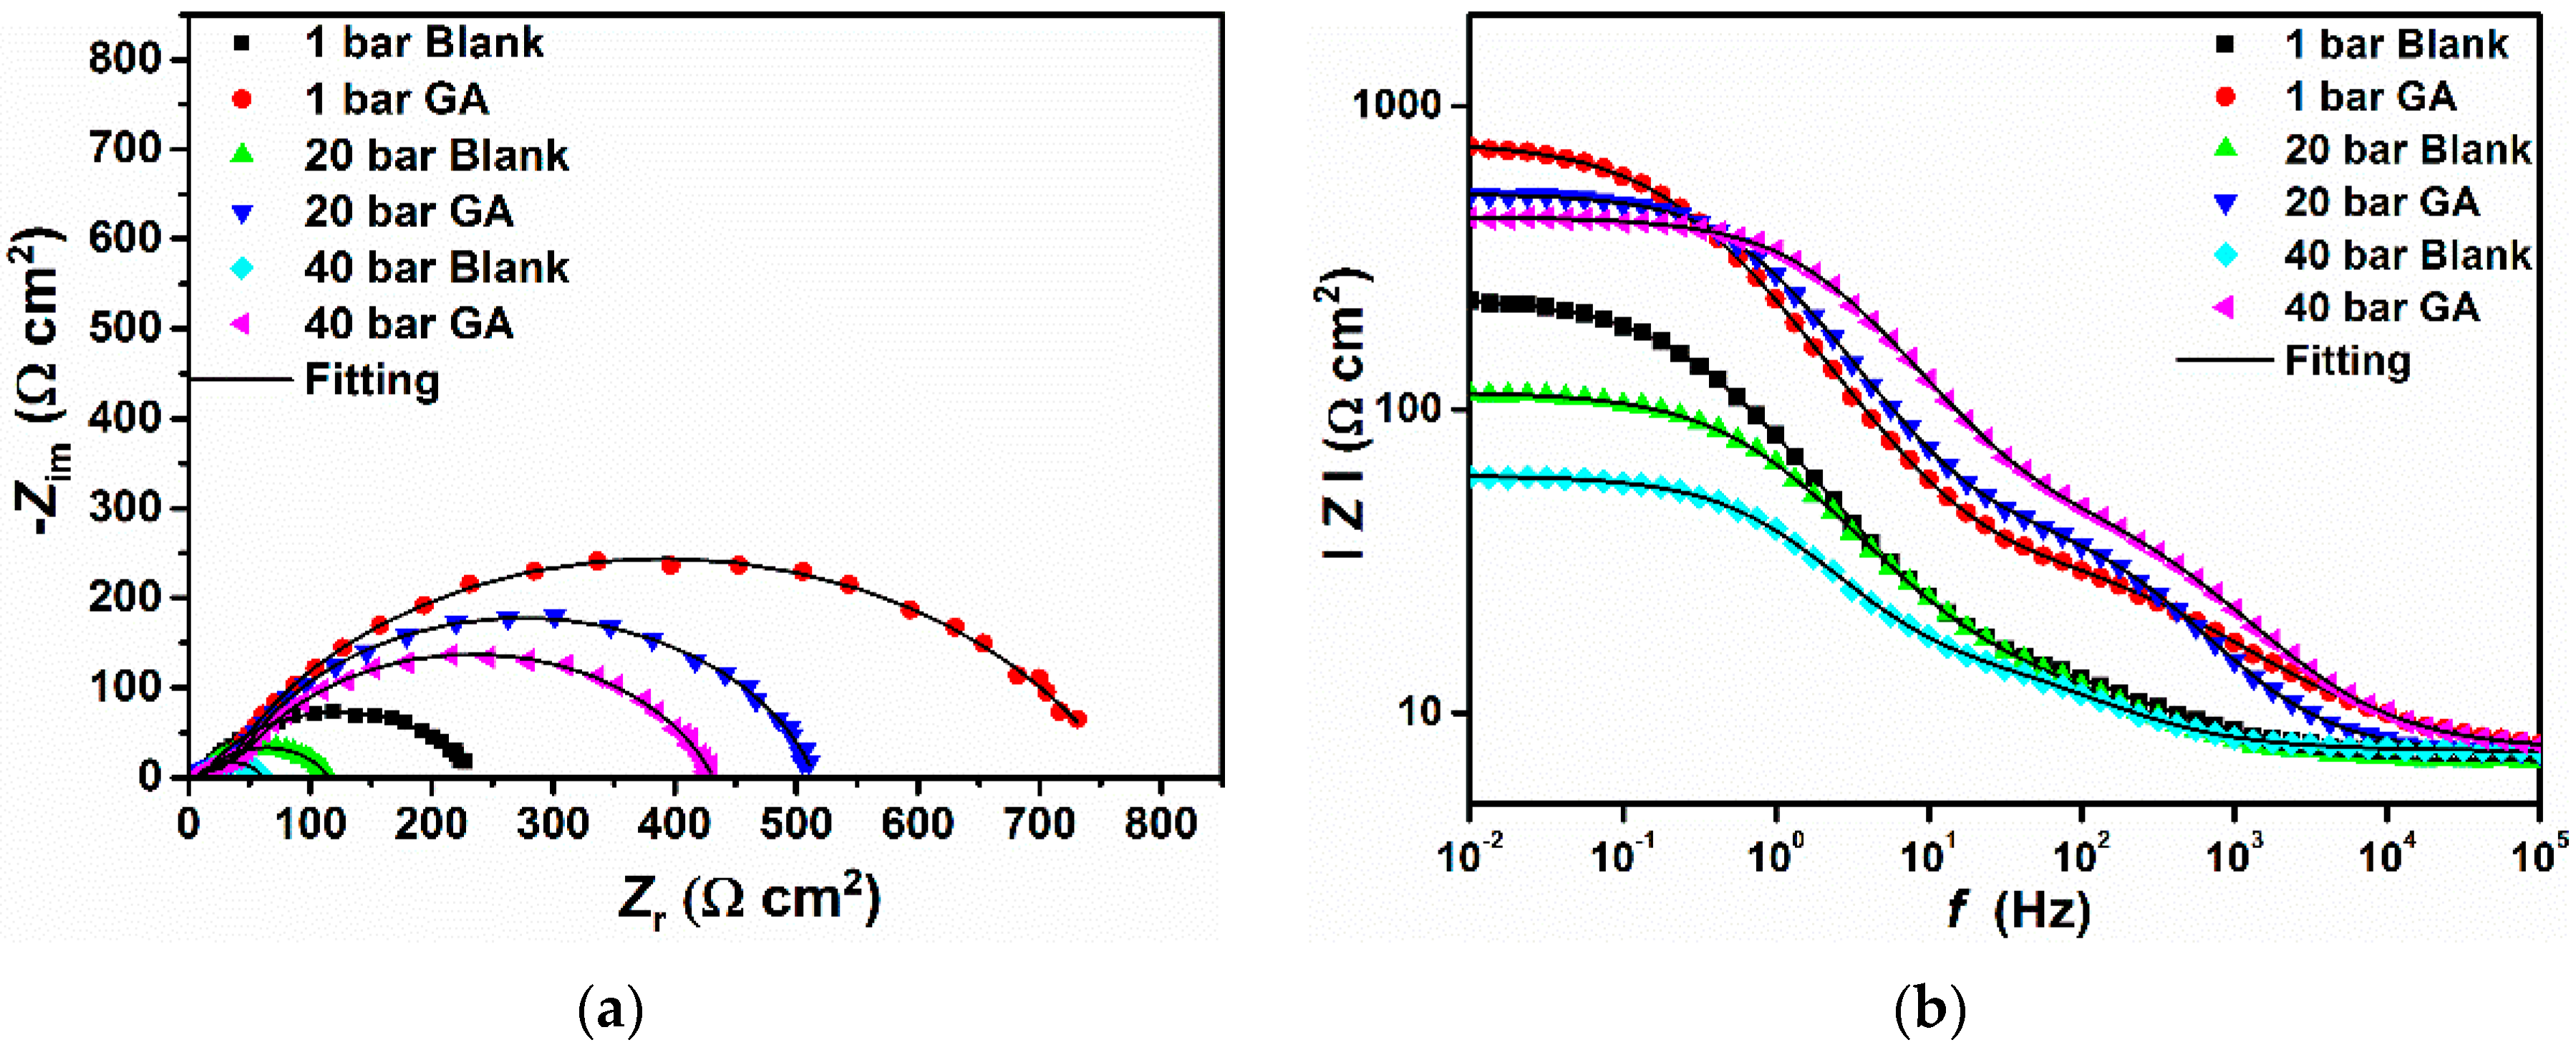
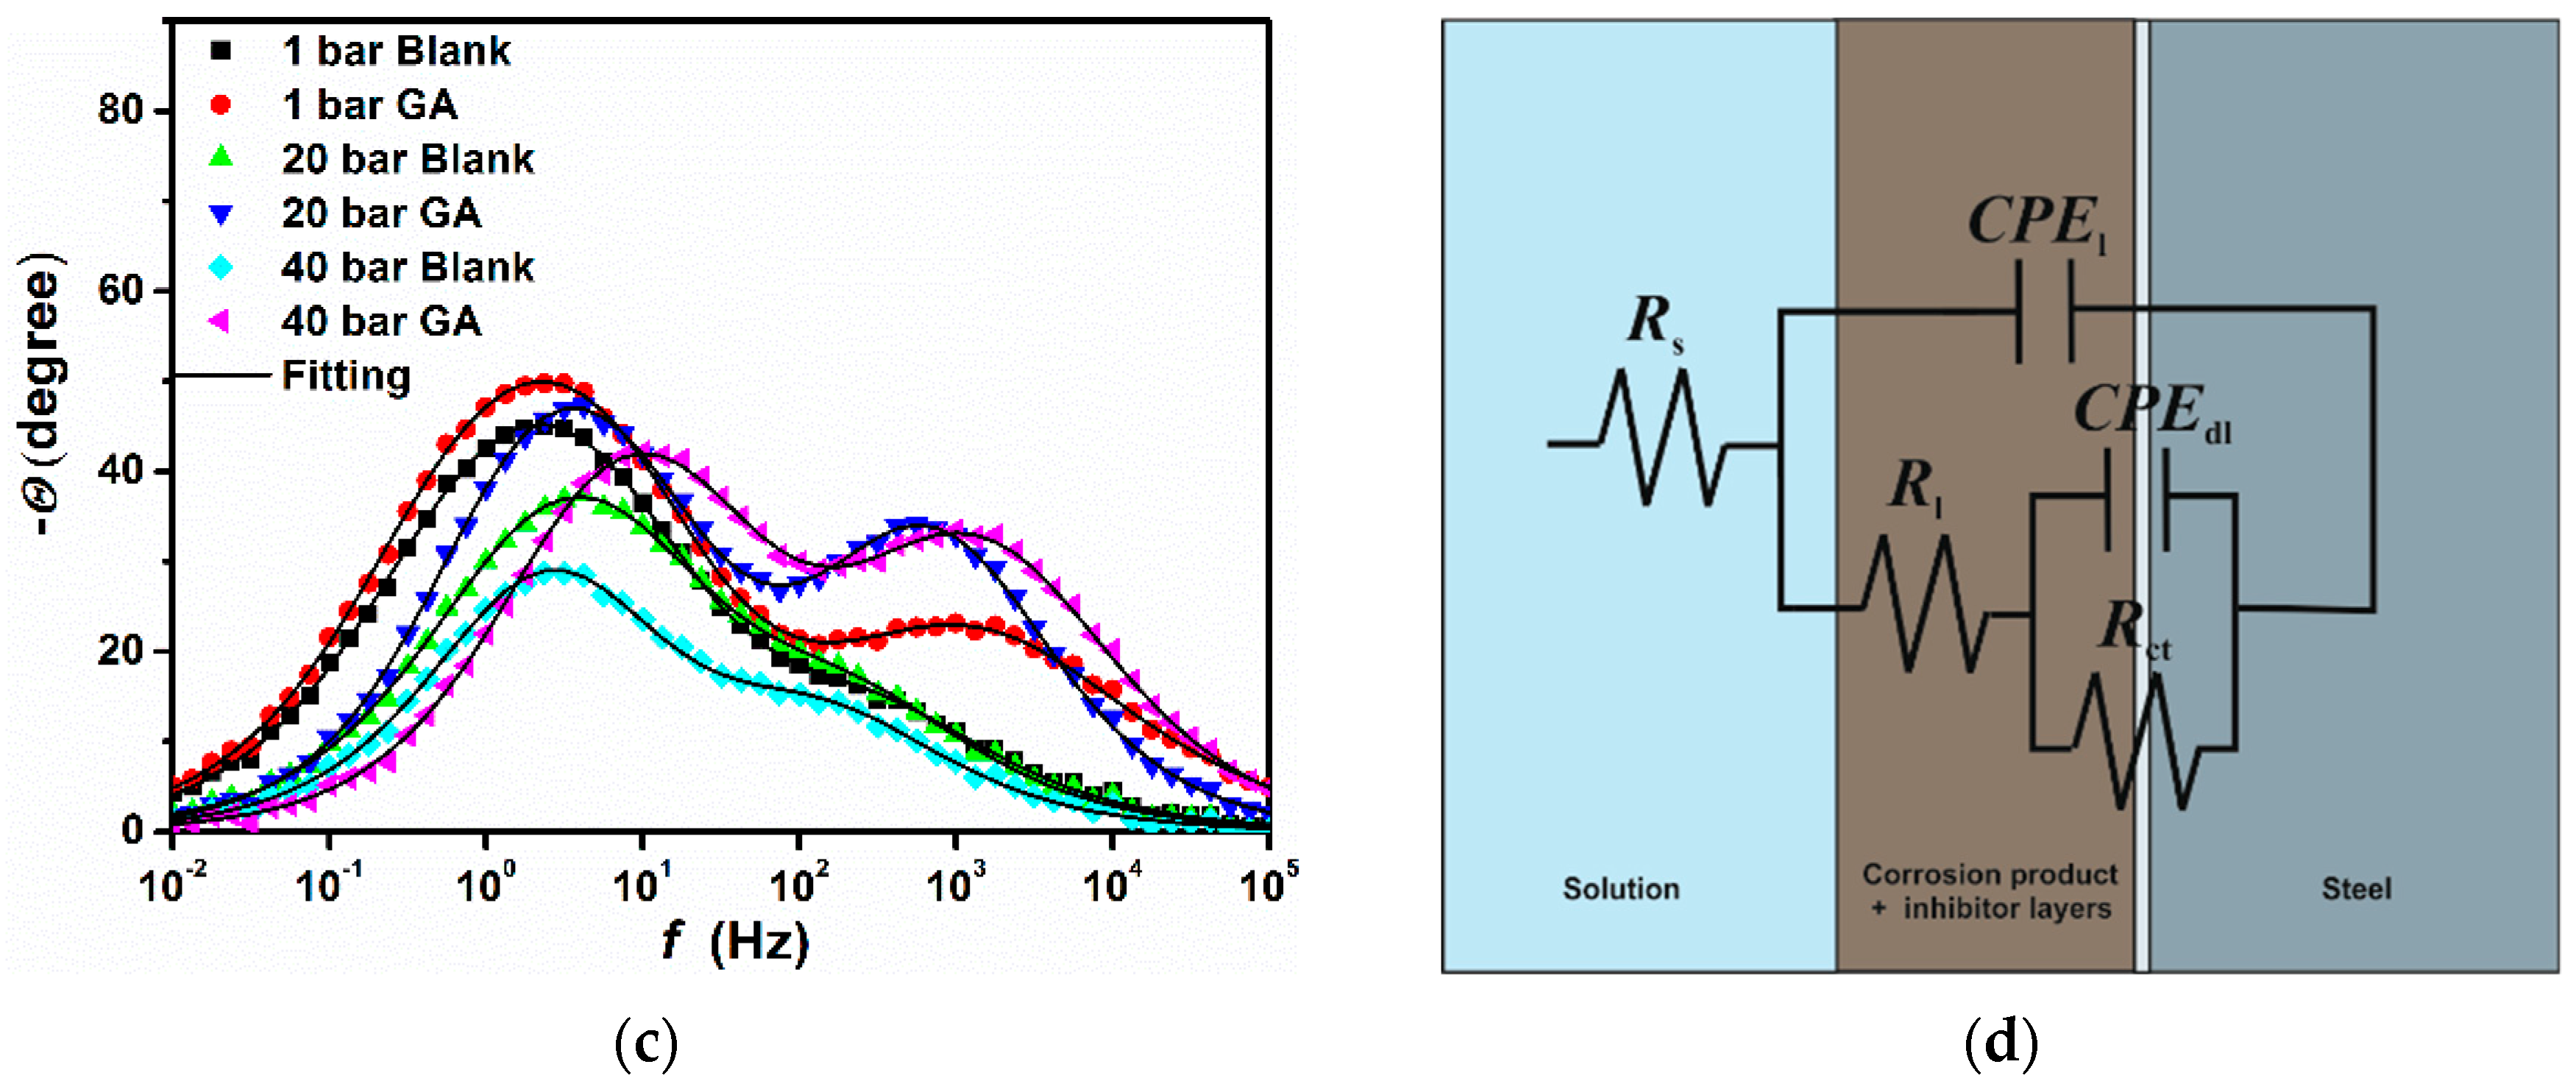
| 1 bar Blank | 7.13 | 1.24 | 0.66 | 11.59 | 1.68 | 0.79 | 217.90 | 229.49 | 1.12 | - |
| 1 bar Ga | 7.39 | 0.34 | 0.61 | 30.29 | 0.68 | 0.81 | 730.60 | 760.89 | 1.50 | 69.83 |
| 20 bar Blank | 6.92 | 1.28 | 0.68 | 12.18 | 1.85 | 0.76 | 95.07 | 107.25 | 1.34 | - |
| 20 bar GA | 7.32 | 0.10 | 0.78 | 38.89 | 0.55 | 0.82 | 469.90 | 507.79 | 1.28 | 78.68 |
| 40 bar Blank | 7.49 | 0.15 | 0.70 | 9.44 | 3.99 | 0.78 | 43.87 | 53.31 | 1.11 | - |
| 40 bar GA | 7.56 | 0.01 | 0.71 | 50.11 | 0.28 | 0.81 | 374.50 | 424.61 | 1.99 | 87.44 |
| C (g L−1) | Ecorr (V) | icorr (μA cm−2) | βc (V dec−1) | IE (%) |
|---|---|---|---|---|
| 1 bar Blank | −0.673 | 17.98 | 0.286 | - |
| 1 bar GA | −0.676 | 5.54 | 0.334 | 69.23 |
| 20 bar Blank | −0.696 | 99.90 | 0.311 | - |
| 20 bar GA | −0.736 | 24.09 | 0.391 | 75.88 |
| 40 bar Blank | −0.600 | 647.05 | 0.316 | - |
| 40 bar GA | −0.634 | 84.90 | 0.312 | 86.76 |
| Pressure (bar) | R2 | Slope | Intercept | a | Kads | ΔGads (kJ mol−1) |
|---|---|---|---|---|---|---|
| 1 | 0.985 | 0.483 | 0.708 | −2.38 | 29.10 | −8.37 |
| 20 | 0.995 | 0.478 | 0.786 | −2.41 | 44.09 | −9.39 |
| 40 | 0.996 | 0.453 | 0.844 | −2.50 | 72.97 | −10.64 |
| Element | Weight% | |||
|---|---|---|---|---|
| C | O | Fe | Total | |
| Polished | 0.70 | - | 99.30 | 100 |
| Blank (1 bar) | 1.18 | - | 98.82 | 100 |
| 1.0 g L−1 (1 bar) | 4.06 | 3.51 | 92.43 | 100 |
| Blank (20 bar) | 7.28 | 0.83 | 91.89 | 100 |
| 1.0 g L−1 (20 bar) | 8.00 | 21.98 | 70.02 | 100 |
| Blank (40 bar) | 4.99 | 2.05 | 92.96 | 100 |
| 1.0 g L−1 (40 bar) | 9.90 | 16.21 | 73.89 | 100 |
© 2020 by the authors. Licensee MDPI, Basel, Switzerland. This article is an open access article distributed under the terms and conditions of the Creative Commons Attribution (CC BY) license (http://creativecommons.org/licenses/by/4.0/).
Share and Cite
Palumbo, G.; Kollbek, K.; Wirecka, R.; Bernasik, A.; Górny, M. Effect of CO2 Partial Pressure on the Corrosion Inhibition of N80 Carbon Steel by Gum Arabic in a CO2-Water Saline Environment for Shale Oil and Gas Industry. Materials 2020, 13, 4245. https://doi.org/10.3390/ma13194245
Palumbo G, Kollbek K, Wirecka R, Bernasik A, Górny M. Effect of CO2 Partial Pressure on the Corrosion Inhibition of N80 Carbon Steel by Gum Arabic in a CO2-Water Saline Environment for Shale Oil and Gas Industry. Materials. 2020; 13(19):4245. https://doi.org/10.3390/ma13194245
Chicago/Turabian StylePalumbo, Gaetano, Kamila Kollbek, Roma Wirecka, Andrzej Bernasik, and Marcin Górny. 2020. "Effect of CO2 Partial Pressure on the Corrosion Inhibition of N80 Carbon Steel by Gum Arabic in a CO2-Water Saline Environment for Shale Oil and Gas Industry" Materials 13, no. 19: 4245. https://doi.org/10.3390/ma13194245