Corrosion Susceptibility and Allergy Potential of Austenitic Stainless Steels


1
Scientific Independent Consultant Biomaterials and Medical Devices, 103 Paul-Vouga, 2074 Marin-Neuchâtel, Switzerland
2
Department of Technology of Materials and Devices in Dental Medicine, “Victor Babes” University of Medicine and Pharmacy Timisoara, 2 Eftimie Murgu sq, 300041 Timisoara, Romania
*
Author to whom correspondence should be addressed.
Materials 2020, 13(18), 4187; https://doi.org/10.3390/ma13184187
Submission received: 27 July 2020
/
Revised: 5 September 2020
/
Accepted: 14 September 2020
/
Published: 21 September 2020
(This article belongs to the Collection Microstructure and Corrosion Behavior of Advanced Alloys)
Abstract
:Although called stainless steels, austenitic steels are sensitive to localized corrosion, namely pitting, crevice, and intergranular form. Seventeen grades of steel were tested for localized corrosion. Steels were also tested in general corrosion and in galvanic couplings (steels–precious alloys) used in watchmaking applications. The evaluations have been carried out in accordance with the ASTM standards which specifically concern the forms of corrosion namely, general (B117-97, salt fog test), pitting (G48-11, FeCl3), crevice (F746-87) and intergranular (A262-15, Strauss chemical test and G108-94, Electrochemical potentiodynamic reactivation test). All tests revealed sensitivity to corrosion. We have noticed that the transverse face is clearly more sensitive than the longitudinal face, in the direction of rolling process. The same conclusion has been drawn from the tests of nickel release. It should be pointed out that, despite the fact that the grade of steel is in conformity with the classification standards, the behavior is very different from one manufacturer to another, due to parameters dependent on the production process, such as casting volume, alloying additions, and deoxidizing agents. The quantities of nickel released are related to the operations involved in the manufacturing process. Heat treatments reduce the quantities of nickel released. The surface state has little influence on the release. The hardening procedures increase the quantities of nickel released. The quantities of released nickel are influenced by the inclusionary state and the existence of the secondary phases in the steel structure. Another aspect is related to the strong dispersion of results concerning nickel release and corrosion behavior of raw materials.
1. Introduction
Corrosion represents an important factor in the design and selection of metals and alloys for different purposes, as various corrosion mechanisms can lead to failure [1,2]. Corrosion resistance is an important criterion for selecting materials used, because the cost of their degradation due to corrosion and the associated environmental impact are quite substantial [3]. Like all metals, stainless steels can undergo chemical corrosion over time [4,5,6].
Corrosion manifests in different forms and depends on a multitude of physico-chemical factors (chemical composition and microstructure of the alloy, temperature, pH, chemical composition of the environment) and mechanical factors (stresses, friction) [7]. The relationship between corrosion rate and grain size has been revealed in numerous studies [8,9,10,11]. Its importance lies in the fact that this parameter can be tailored by the producers [8,9,10,11].
The austenitic steels belong to the stainless steels family and are being characterized by high Nieq and Creq [12,13]. Over time, the chemical composition, mechanical properties, resistance to corrosion, machinability and polish ability of the austenitic steels have evolved considerably, and new production processes have been developed by the steel manufacturers [14]. Each chemical element in their composition plays an important role in their properties [15], including corrosion resistance, and can be substantially modified by adding certain elements as Cu, Ti, Nb, Al, Si and Ca. Generally, the composition of austenitic stainless steels is adjusted to meet service requirements in various corrosive environments [8]. The corrosion sensitivity of austenitic steels mainly takes the form of pitting, crevice and intergranular type [16].
An important aspect which concerns the austenitic steels is the release of nickel in contact with the skin. The role of nickel in the biological response to alloys is significant with regard to toxicology and biological performance. The current trend is to eliminate nickel from alloys for medical applications. However, this needs a careful evaluation since no compromise is acceptable concerning the mechanical properties, corrosion resistance or any other possible undesirable consequences due to the substitution of nickel [7,17].
Nickel allergy is the most widespread of all contact allergies. In the European population, the prevalence of nickel allergy is of 10%–15% of adult females and 1%–3% of adult males [18,19,20,21,22]. Of nickel-sensitive people in the general population, 30% develop hand eczema. Teenagers and young adults tend to have a higher prevalence due to frequent body piercing.
In Europe, for objects containing nickel, intended for permanent contact with skin, Directive 94/27/EC imposed a ban if the rate of nickel release exceeds 0.5 µg/cm2·week. The subsequent Directive 2004/96/EC: “Piercing in the Human Body” specifies that the limit rate of nickel release, for these cases, is 0.2 µg/cm2·week [23,24,25].
The aim of this study is to evaluate the sensitivity, under the same conditions, of 17 austenitic steels of the 304, 316 and 904 series, for uniform, pitting, crevice and galvanic corrosion. Our interest was also to assess the behavior differences of the transverse surface of the samples compared to the longitudinal one.
2. Materials and Methods
Table 1 shows the composition of the austenitic stainless steels (exception #16 and #17) which were used to prepare the samples for the corrosion evaluation tests.
According to the classification of Fontana [26], the evaluation of their behavior in uniform, pitting, crevice, intergranular corrosion was presented, as well as in galvanic couplings.
2.1. Salt Fog Test
To illustrate uniform corrosion, four austenitic steels—#2-1.4427, #3-1.4435/316L, #4-316L/1.4435Ugim and #5-1.4435/316LVal—were tested by using the salt fog test, according to ASTM B117-97 [27].
The samples were of cylindrical shape—10 mm diameter, 5 cm long. To create a reference state, as-received samples were first annealed and recrystallized at 1050 °C. The thermal treatment was carried out in a continuous industrial oven under hydrogen protection with gas cooling.
Half of the annealed cylinders were cold-worked to diameter 7.7 mm. The purpose of this cold-working operation was to increase the samples’ sensitivity to corrosion [28,29]. The entire surface of the samples was “mirror” polished. The test was carried out over a period of 12 days, 6 days in 5% NaCl medium and 6 days in artificial sweat medium diluted 40 times (Table 2). Artificial sweat medium ISO 3160-2 has the following composition: NaCl 0.5 g/L; NH4Cl 0.4375 g/L; Acetic Acid 0.063 g/L; Urea 0.125 g/L; Lactic Acid 0.375 g/L; NaOH solid, necessary quantity to induce a pH of 4.7.
The test in question was an adaptation of the ASTM B117-97 standard [27] which is in current use for metallic objects in contact with the skin (ISO 3160-2). Three samples were used for each state, making a total of 48 samples.
2.2. Pitting Corrosion
Steels #1–#17 (Table 1) were tested for pitting corrosion. The test samples, in the form of wires, 10 mm diameter, 5 cm long, were fixed in a resin and “mirror” polished.
The tests were carried out in the most commonly used electrolytes: FeCl3 and NaCl, and artificial sweat, according to ISO 3160-2:2015 [30]. The different electrolytes were used to verify the observations. The chemical compositions of the media used and the experimental conditions are presented in Table 3.
2.3. Crevice Corrosion
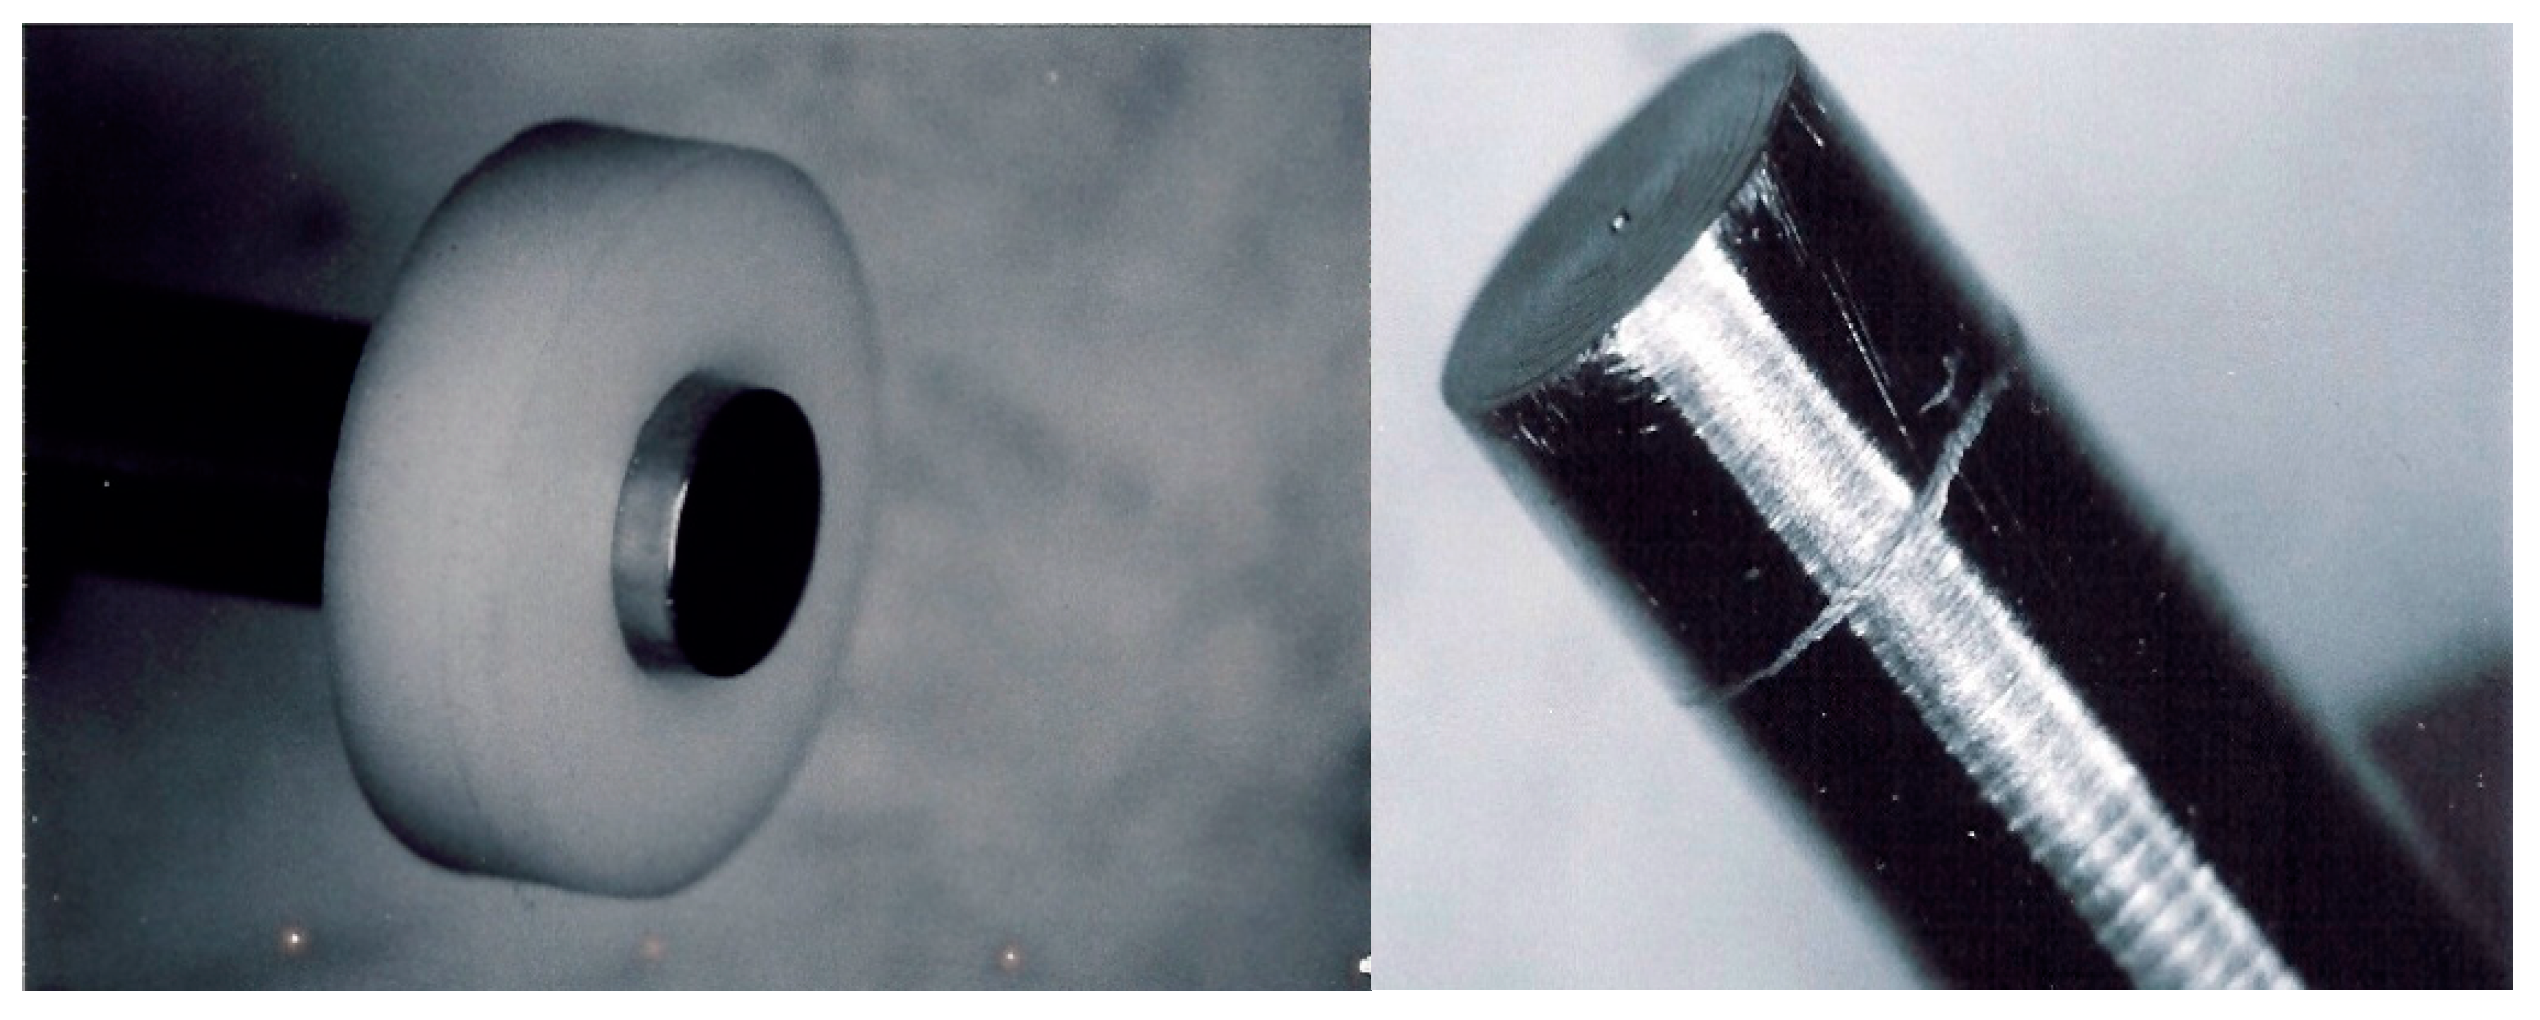
The crevice corrosion test was carried out according to ASTM F746-87 [35]. The samples, of cylindrical shape—6.35 mm diameter, 5 cm long—obtained by machining of 10-mm-diameter steel profiles, “mirror” polished, were embedded in a polytetrafluoroethylene (PTFE) collar at one of the extremities (Figure 1). Both transverse and longitudinal surfaces were subjected to the corrosion test.
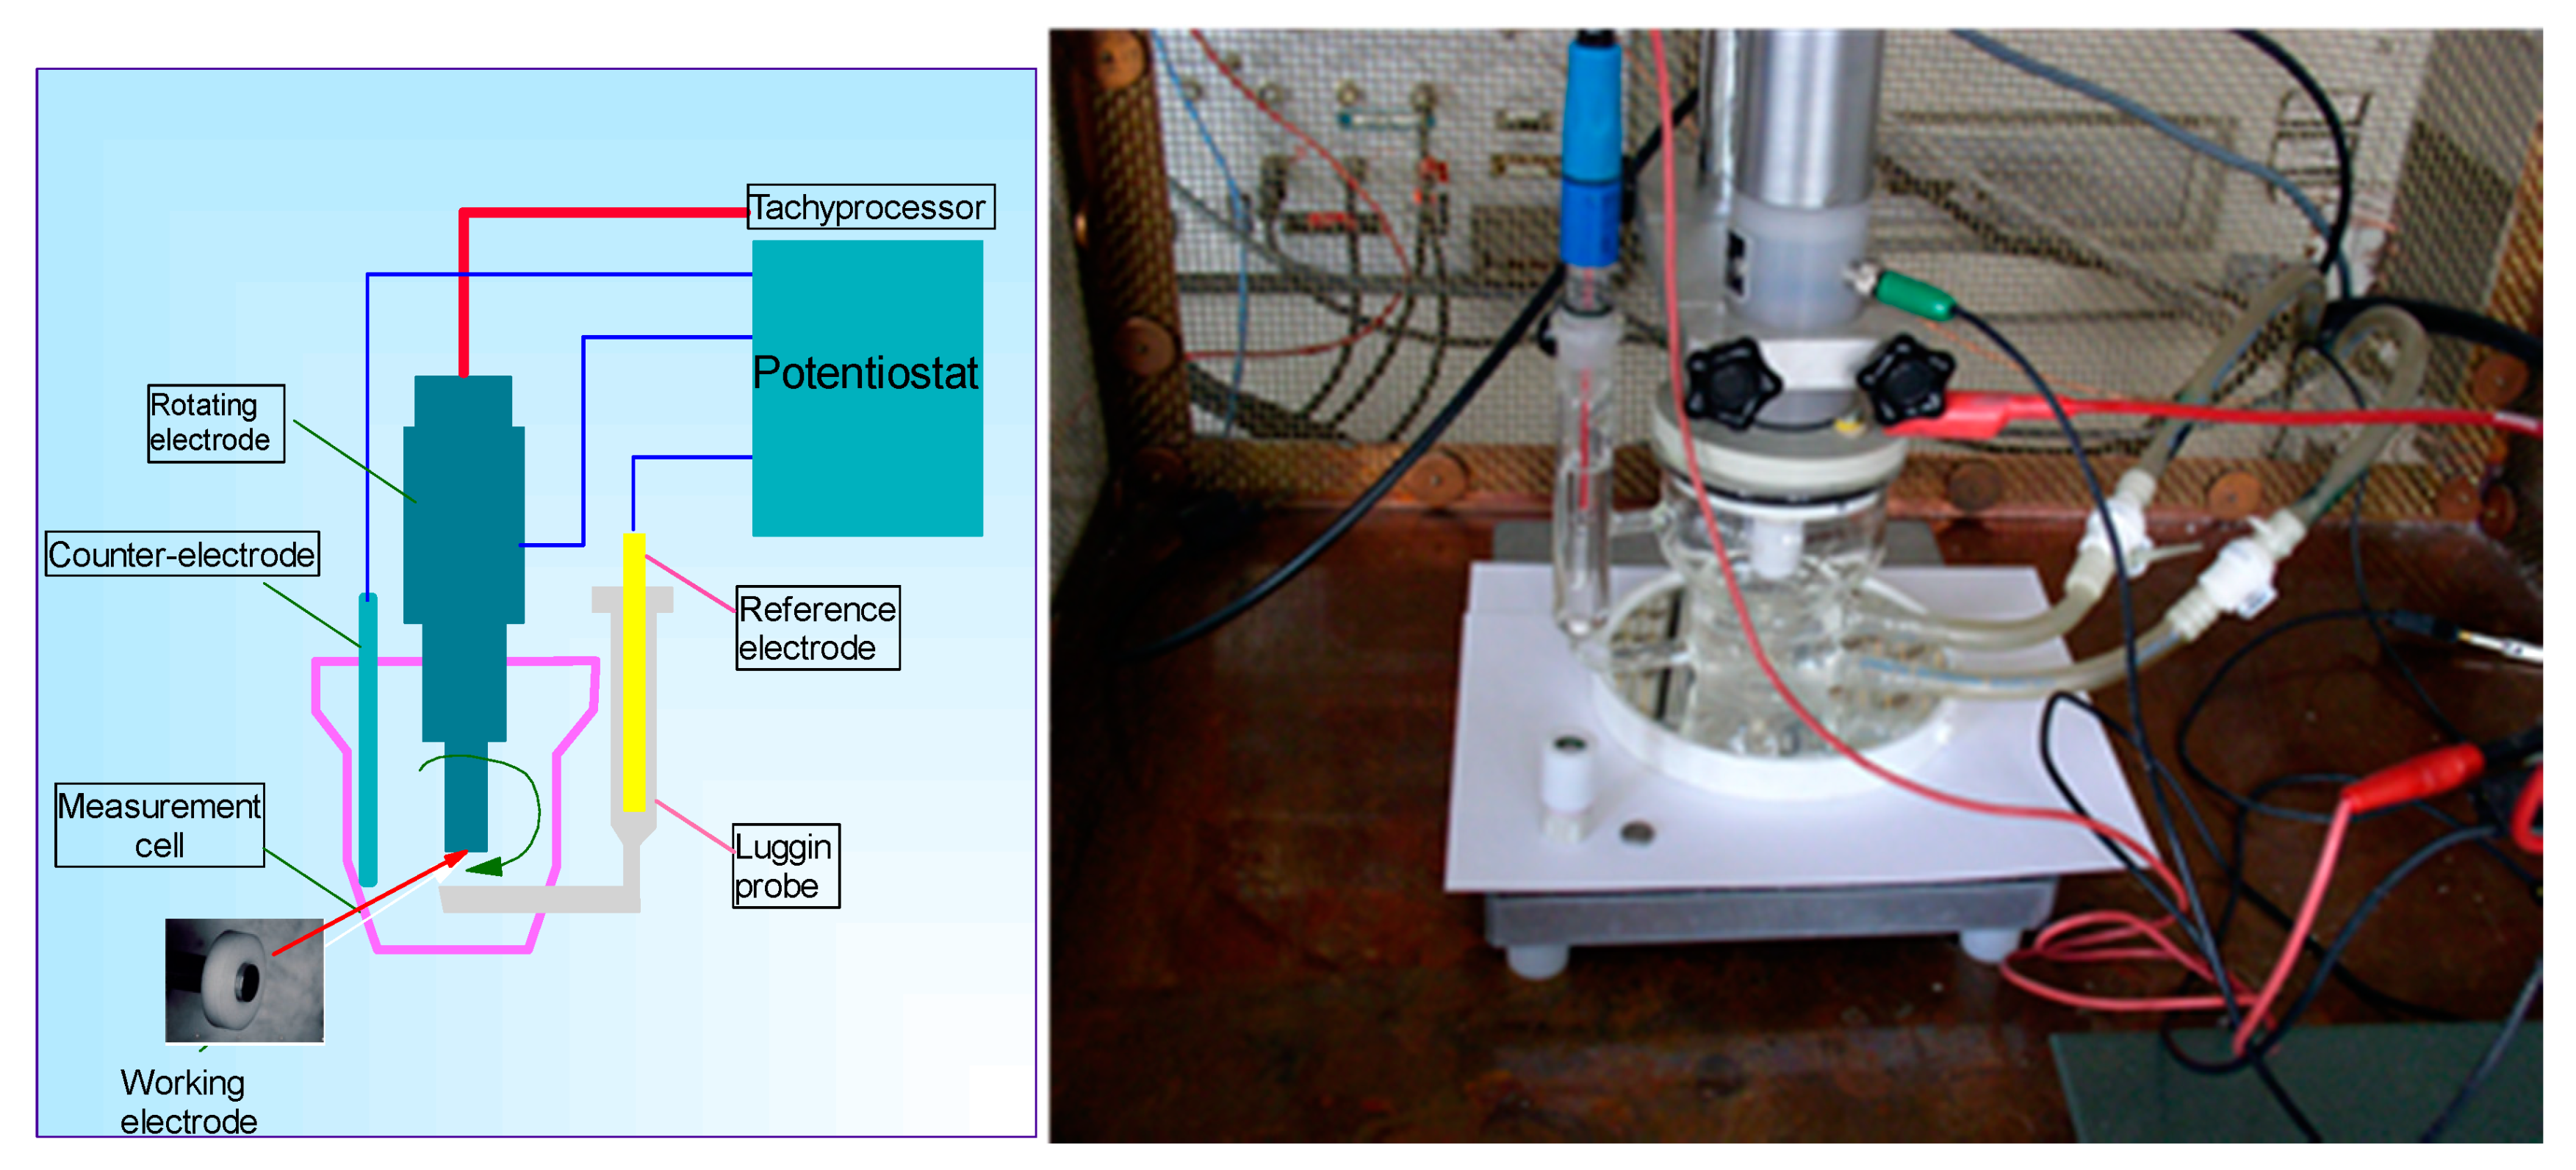
The sample was mounted in the rotating electrode of the measuring cell (Figure 2).
The test consisted of two stages:
- In the first stage, anodic excitation of the sample to be evaluated was carried out at 800 mV vs. SCE (saturated calomel electrode) for 10 s;
- In the second stage, the potentiost at imposed the abandon potential value for 15 min. As a result, the current variation was plotted as a function of time for an imposed potential.
If the current recorded stayed within the cathodic domain (negative values), a fresh measurement cycle was started: excitation for 10 s at 800 mV and current measurement for a potential set at Eabandon +25 mV (ASTM recommends +50 mV). The cycles were repeated, each time at a higher potential, until the current measured moved into the anodic domain (positive values). As a result, the crevice potential was determined, which corresponded to the last-but-one measurement for which the current was positive. Once the Teflon ring was removed, a groove of crevice corrosion was noted on the surface of the metal sample.
2.4. Intergranular Corrosion
This type of corrosion occurs preferentially at grain boundaries and may be due to the presence of precipitates.
For assessing the intergranular corrosion morphology, chemical and electrochemical tests may be used. Two examples of evaluating intergranular corrosion susceptibility of austenitic steel tubes are being presented:
- –
- Chemical evaluation of tubes #3, 1.4435/316L used in medical devices and endoscopic applications;
- –
- Electrochemical evaluation of tubes #1, 1.44306/304L used in medical devices and endoscopes applications.
2.4.1. Chemical Tests
The standardized tests [36,37,38] to assess the sensitivity of stainless steel to intergranular corrosion, according to ASTM A262-15 [36], have been summarized in Table 4.
Evaluation of intergranular corrosion according to standard ASTM A262-15-the Strauss test [36].
The test medium was a solution of copper sulphate-50% sulfuric acid in the presence of metallic copper, brought to the boiling point (125 °C) for 120 h. This test investigated the intergranular corrosion behavior of steel in the potential range between 110–350 mV. The test setup was in accordance with ASTM A262-15 [36]. The samples to be tested, tubes of #3, 1.4435/316L steel, were placed in specific glass cradle.
2.4.2. Electrochemical Tests
Electrochemical Potentiodynamic Reactivation (EPR) measurements, single or double loop, are methods of examining and assessing the corrosion sensitivity of austenitic steels [37,38,39,40,41,42,43,44,45,46,47].
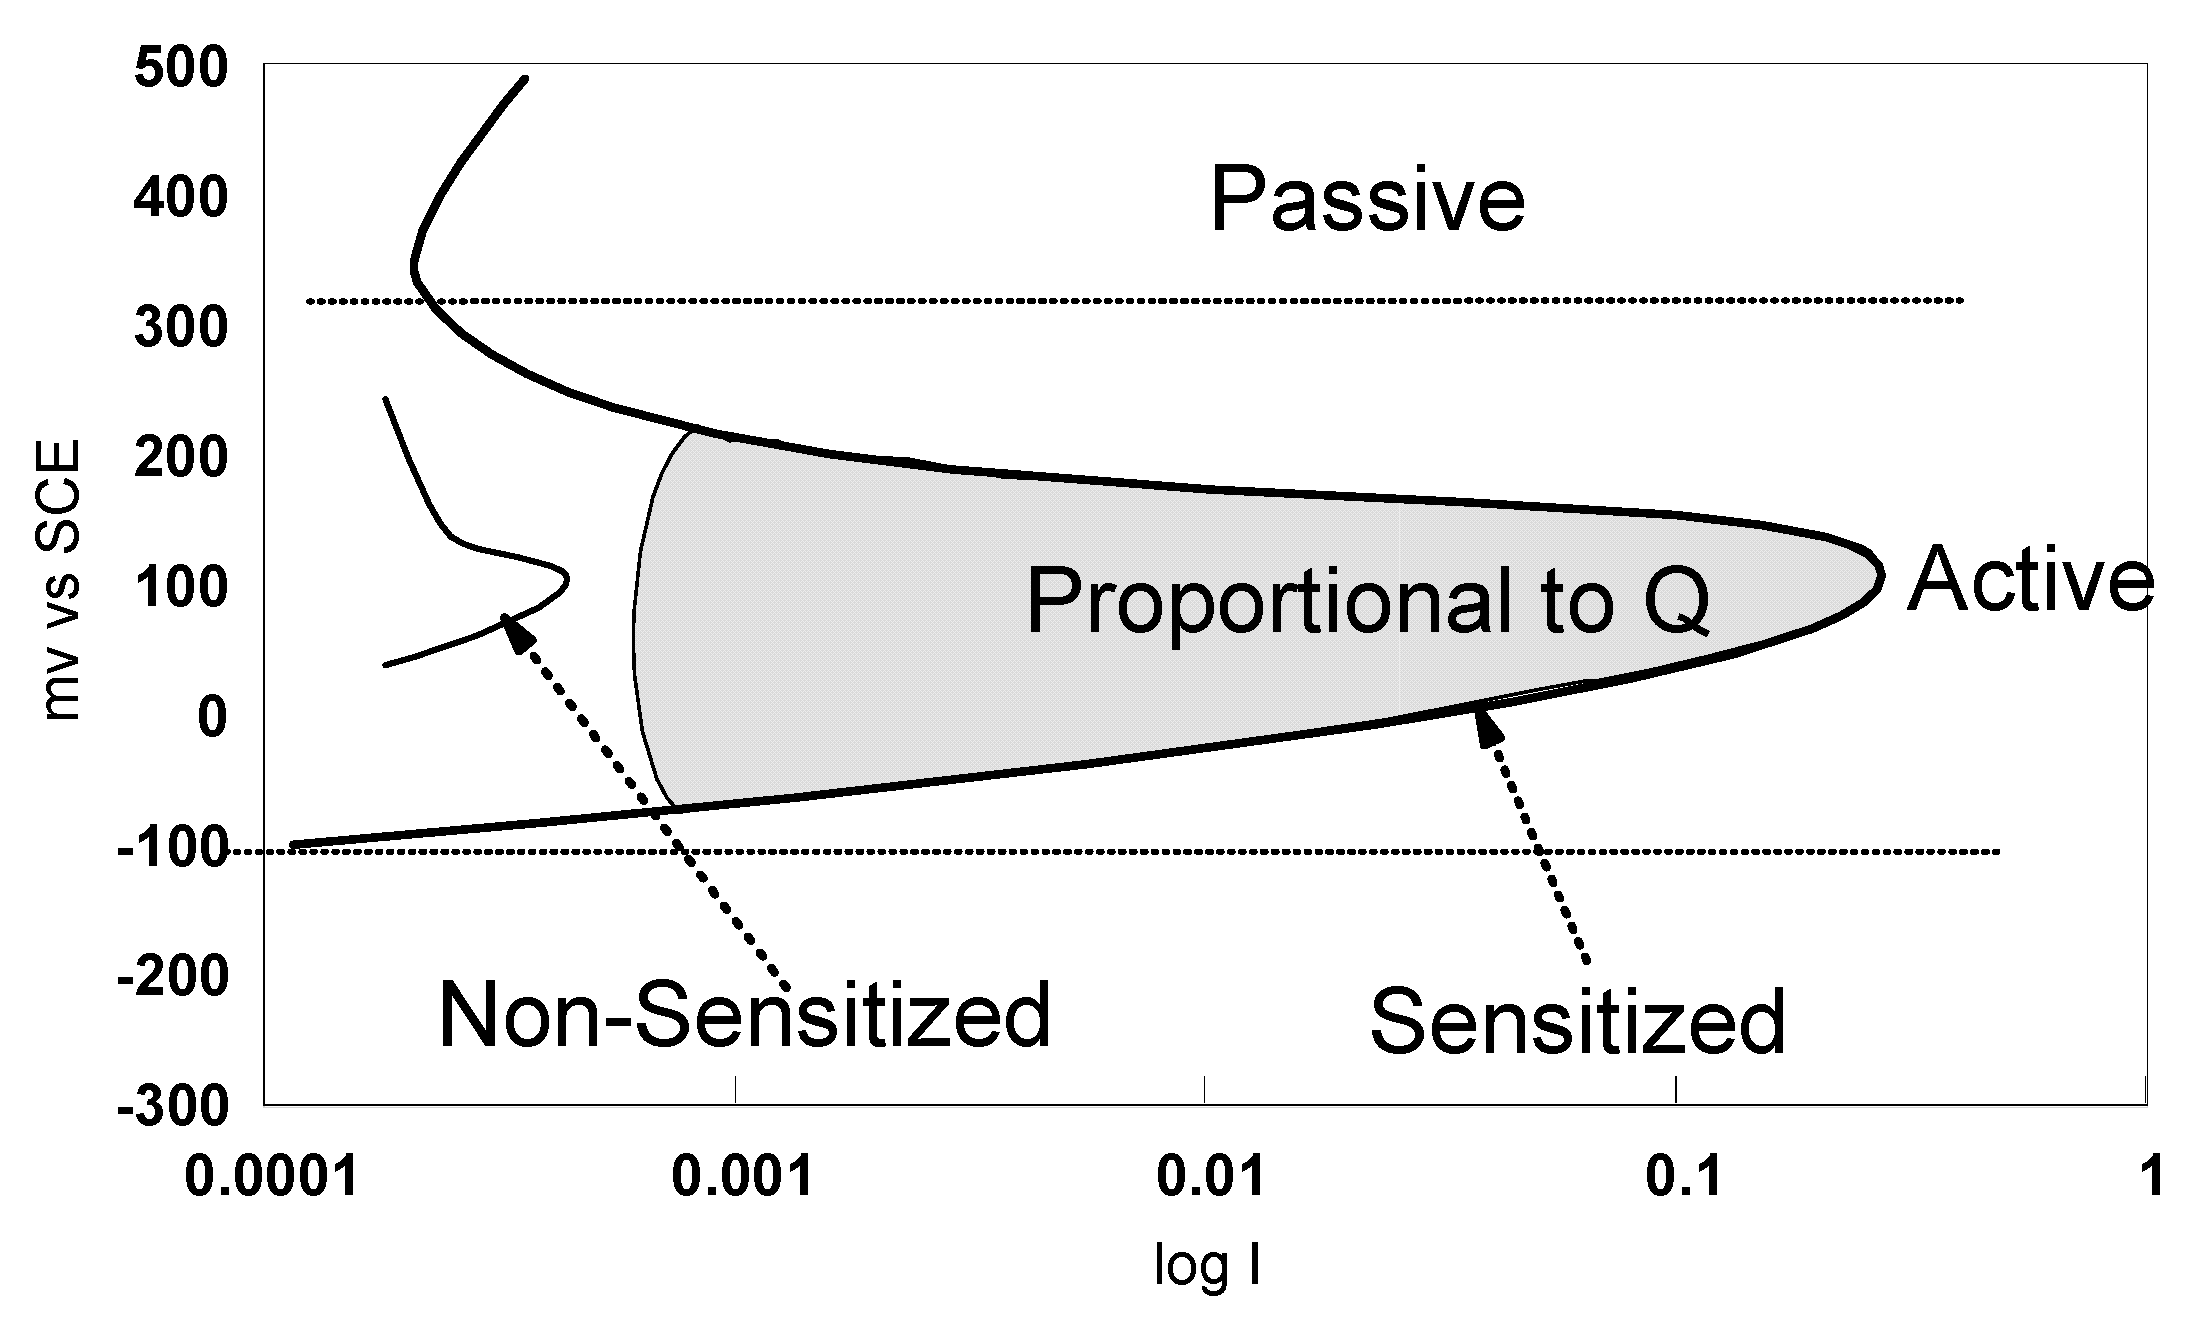
The ASTM G108-94 (2015) [48] was practiced with the single loop method. Using the single loop test, a sample polished to a 1 µm finish, was polarized for two minutes at 200 mV vs. SCE in a solution of 0.5 M H2SO4 + 0.01 M KSCN. Subsequently, the potential was decreased, at a rate of 6 V/h, to the corrosion potential, Ecorr. This decrease resulted in reactivation of the specimen, involving breakdown of the passive film covering chromium depleted areas of material. The area under the large loop generated in the curve of potential vs. current (Figure 3) was proportional to the electric charge Q, that depends on surface area and grain size. In non-sensitized material, the passive film was intact and the loop size was small.
The samples tested were tubes of 304L AISI, used for manufacturing medical endoscopes (Table 5). The tubes #Test 1 and #Test 2 were suspected to be sensitized in intergranular corrosion. For the evaluation test, reference samples #Brut 1 and #Brut 2 and three samples from the supplier stock, subjected to heat treatments at 500, 620 and 750 °C, respectively, were used (Table 5).
The sample (Table 5), transversely cut, was incorporated into a resin and “mirror” polished. The resin was machined to be adapted to the working electrode. The mounting of the electrodes, the electrochemical cell and the EPR measurement conditions were those of ASTM G108-94 (2015) [48]. The ASTM G108-94 method allows a quantitative evaluation of the intergranular corrosion sensitization of steels AISI 304 and AISI 304L. The purpose of the test was to evaluate the intergranular corrosion of the transverse surface by an electrochemical scanning method from +200 mV to −400 mV vs. SCE. In the mathematical calculation for evaluating the sensitivity to intergranular corrosion, another parameter, the corresponding value of the grain index, has to be considered, according to ASTM E112-13 [49].
2.5. Galvanic Corrosion
In the first stage, to establish a galvanic series in artificial sweat the open circuit potentials of eighteen alloys were measured:
Precious metal alloys used in jewelry: Pt 950CoNi (950‰Pt, 18‰Co, 32‰Ni), AuPdCu150 (750‰Au, 100‰Pd, 150‰Cu), AuAgNi109 (750‰Au, 141‰Ag, 109‰Ni), AuCuNi130 (750‰Au, 120‰Cu, 130‰Ni), AuNiCu142 (750‰Au, 108‰ Ni, 142‰Cu), AuNiCu112 (750‰Au, 138‰Ni, 112‰Cu) and AuCuZn374 (585‰Au 41‰Cu, 374‰Zn).
Steels: 1.4441, 1.4435, 316 L F, 316 L F Cu, 1.4301, 1.4305, Sandvik 1802, 1.4104. 1.4105, 1.4539 and 12/12.
The samples, in form of 10-mm-diameter discs, were “mirror” polished, washed with a mixture of acetone and ethanol, and rinsed with deionized water 18 MΩ·cm. After drying with hot air, the samples were introduced into the PTFE sample holder, specially designed for the rotating electrode test. The electrochemical measurements were made with a potentiostatic assembly of three electrodes: a working electrode (rotating electrode), a platinum counter-electrode and a reference SCE electrode. Given that diffusion phenomena play a major role with regard to the changes produced at the metal/solution interface and consequently to the state and composition of the metal surfaces layers, readings were made in a laminar system (criterion of Re = 3200) with a limit current iL = 56 mA, and a rotational velocity of 300 rpm, to control the mass transfer phenomena. The open circuit potentials (Eoc) were measured after 24 h of immersion.
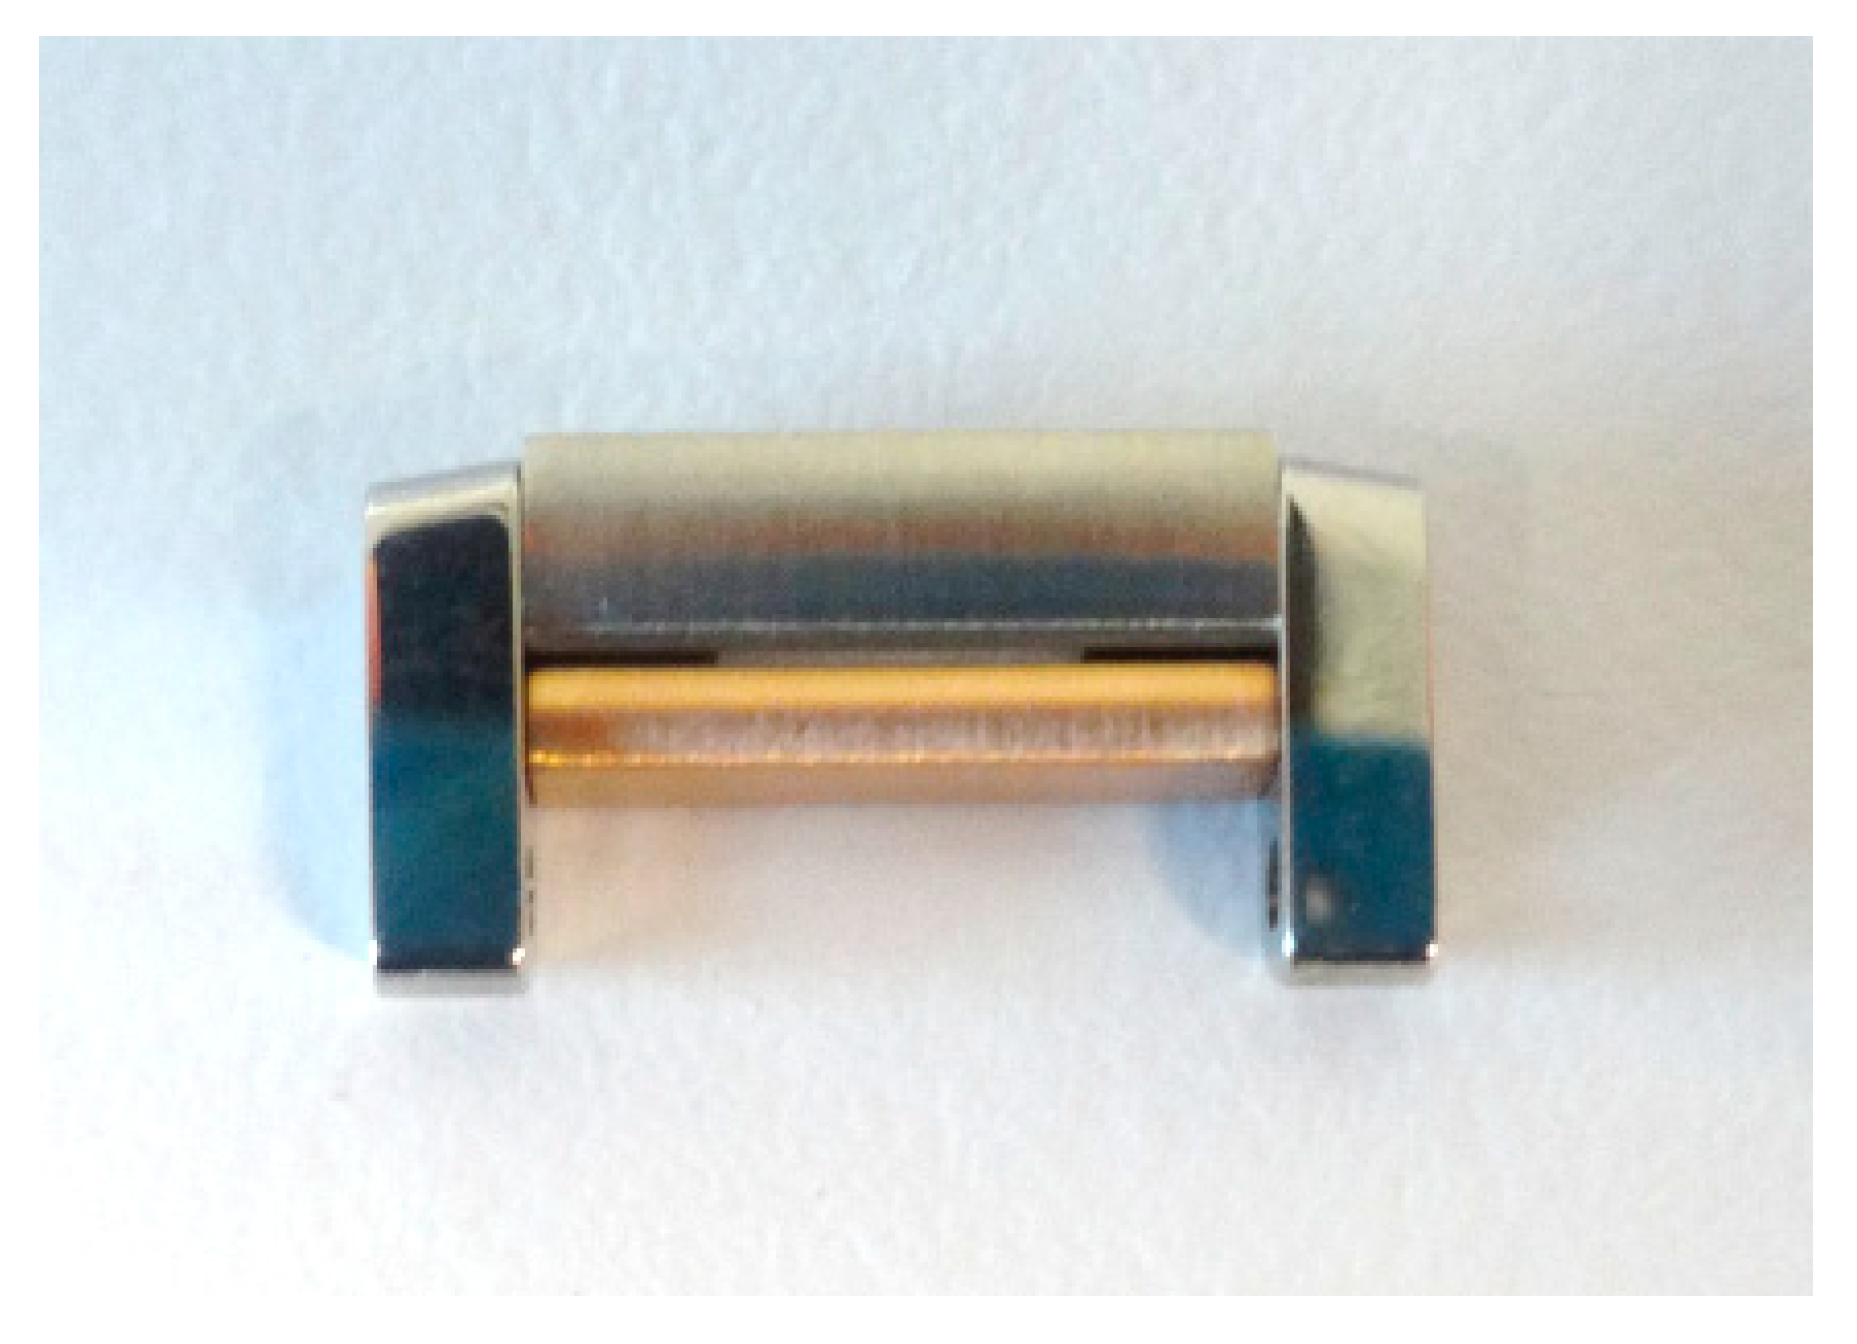
In the second stage, our interest was focused on galvanic couplings in the assembly of steel watch strap links with precious metal alloys (18K gold). The evaluation was indirectly made, by measuring the quantities of nickel released after 7 days of immersion in artificial sweat, according to standard EN 1811-2011+A1:2015 [50]. The tests were carried out on 27 gold-steel links (Figure 4), 5N18 (18K gold alloy)-1.4441 (316L) and 5N18 (18K alloy)-1.4539 (904L).
The microscopy investigations (scanning electron microscopy/energy-dispersive X-ray spectroscopy SEM/EDX) were carried out using a JEOL JSM-6300 SEM (JEOL, Peabody, MA, USA) equipped with an Oxford INCA EDS system (Oxford Instruments, Abingdon, UK) for local phase analysis.
3. Results and Discussion
3.1. Uniform Corrosion
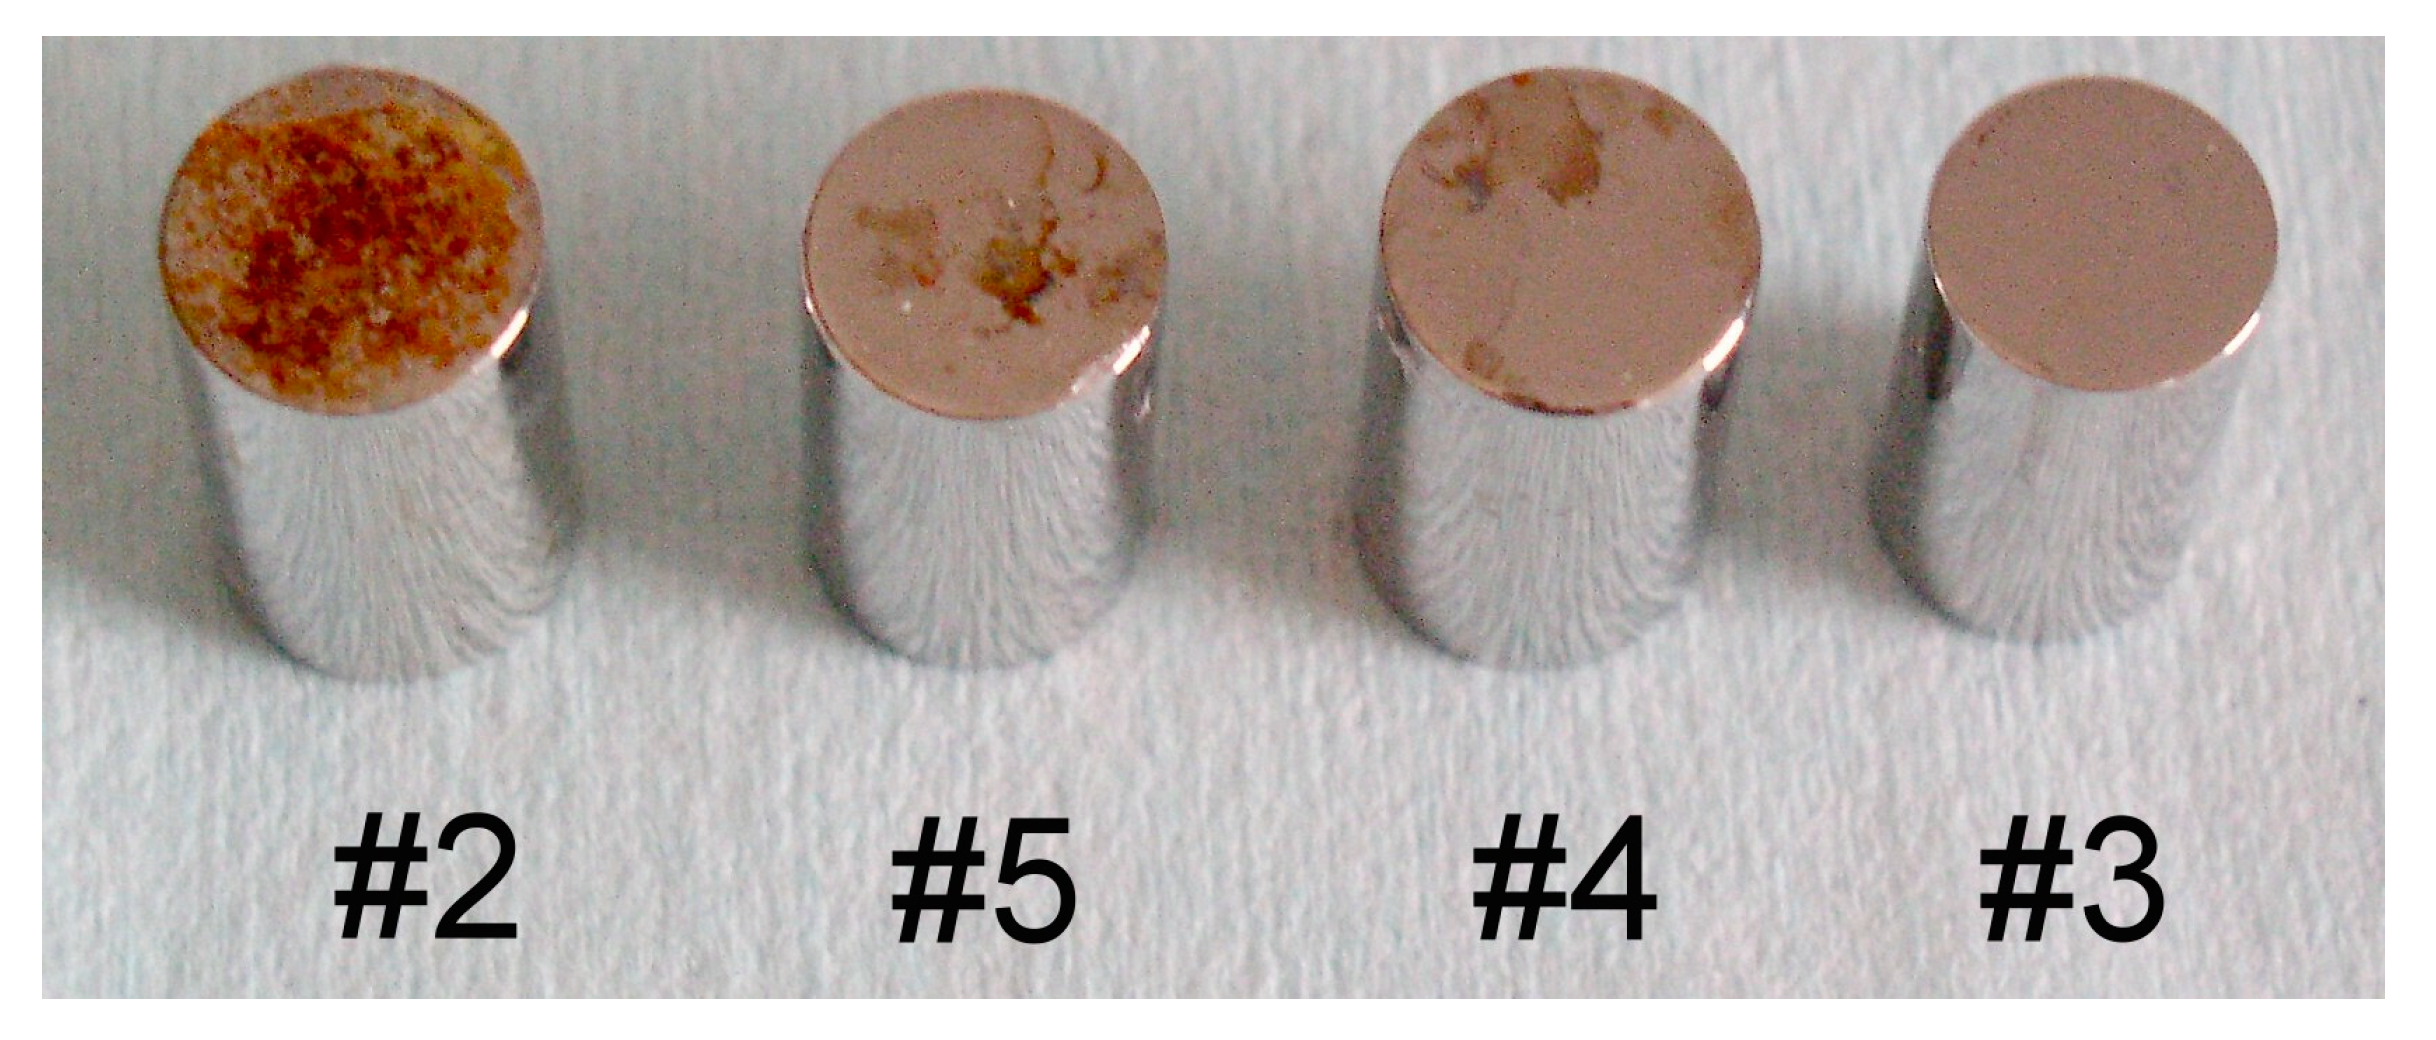
After 12 days, the salt fog test revealed that here was a difference in the corrosion susceptibility of transverse and longitudinal surfaces (Figure 5). In general, the transversal surfaces were corroded, with the exception of steel #3, the intensity depending on the steel grade and the manufacturing process. Samples #3, #4 and #5 were made of grade 316L, from three different steelmakers (Germany, France, Italy). The longitudinal surfaces showed no signs of corrosion.
According to Zanotto et al., the test has limitations, it becomes non-discriminating in case of steels with excellent corrosion resistance [51].
In case of steels #8, #10, #6 and #17, the test, carried out under the same experimental conditions, showed no signs of corrosion of the transversal or longitudinal surfaces, similar to sample #3 (Figure 6).
The results obtained are presented in Table 6. In general, the transverse surfaces were corroded with the exception of steel #3. Examination of steel #3 did not reveal any traces of corrosion either in the cold-worked state.
3.2. Pitting Corrosion
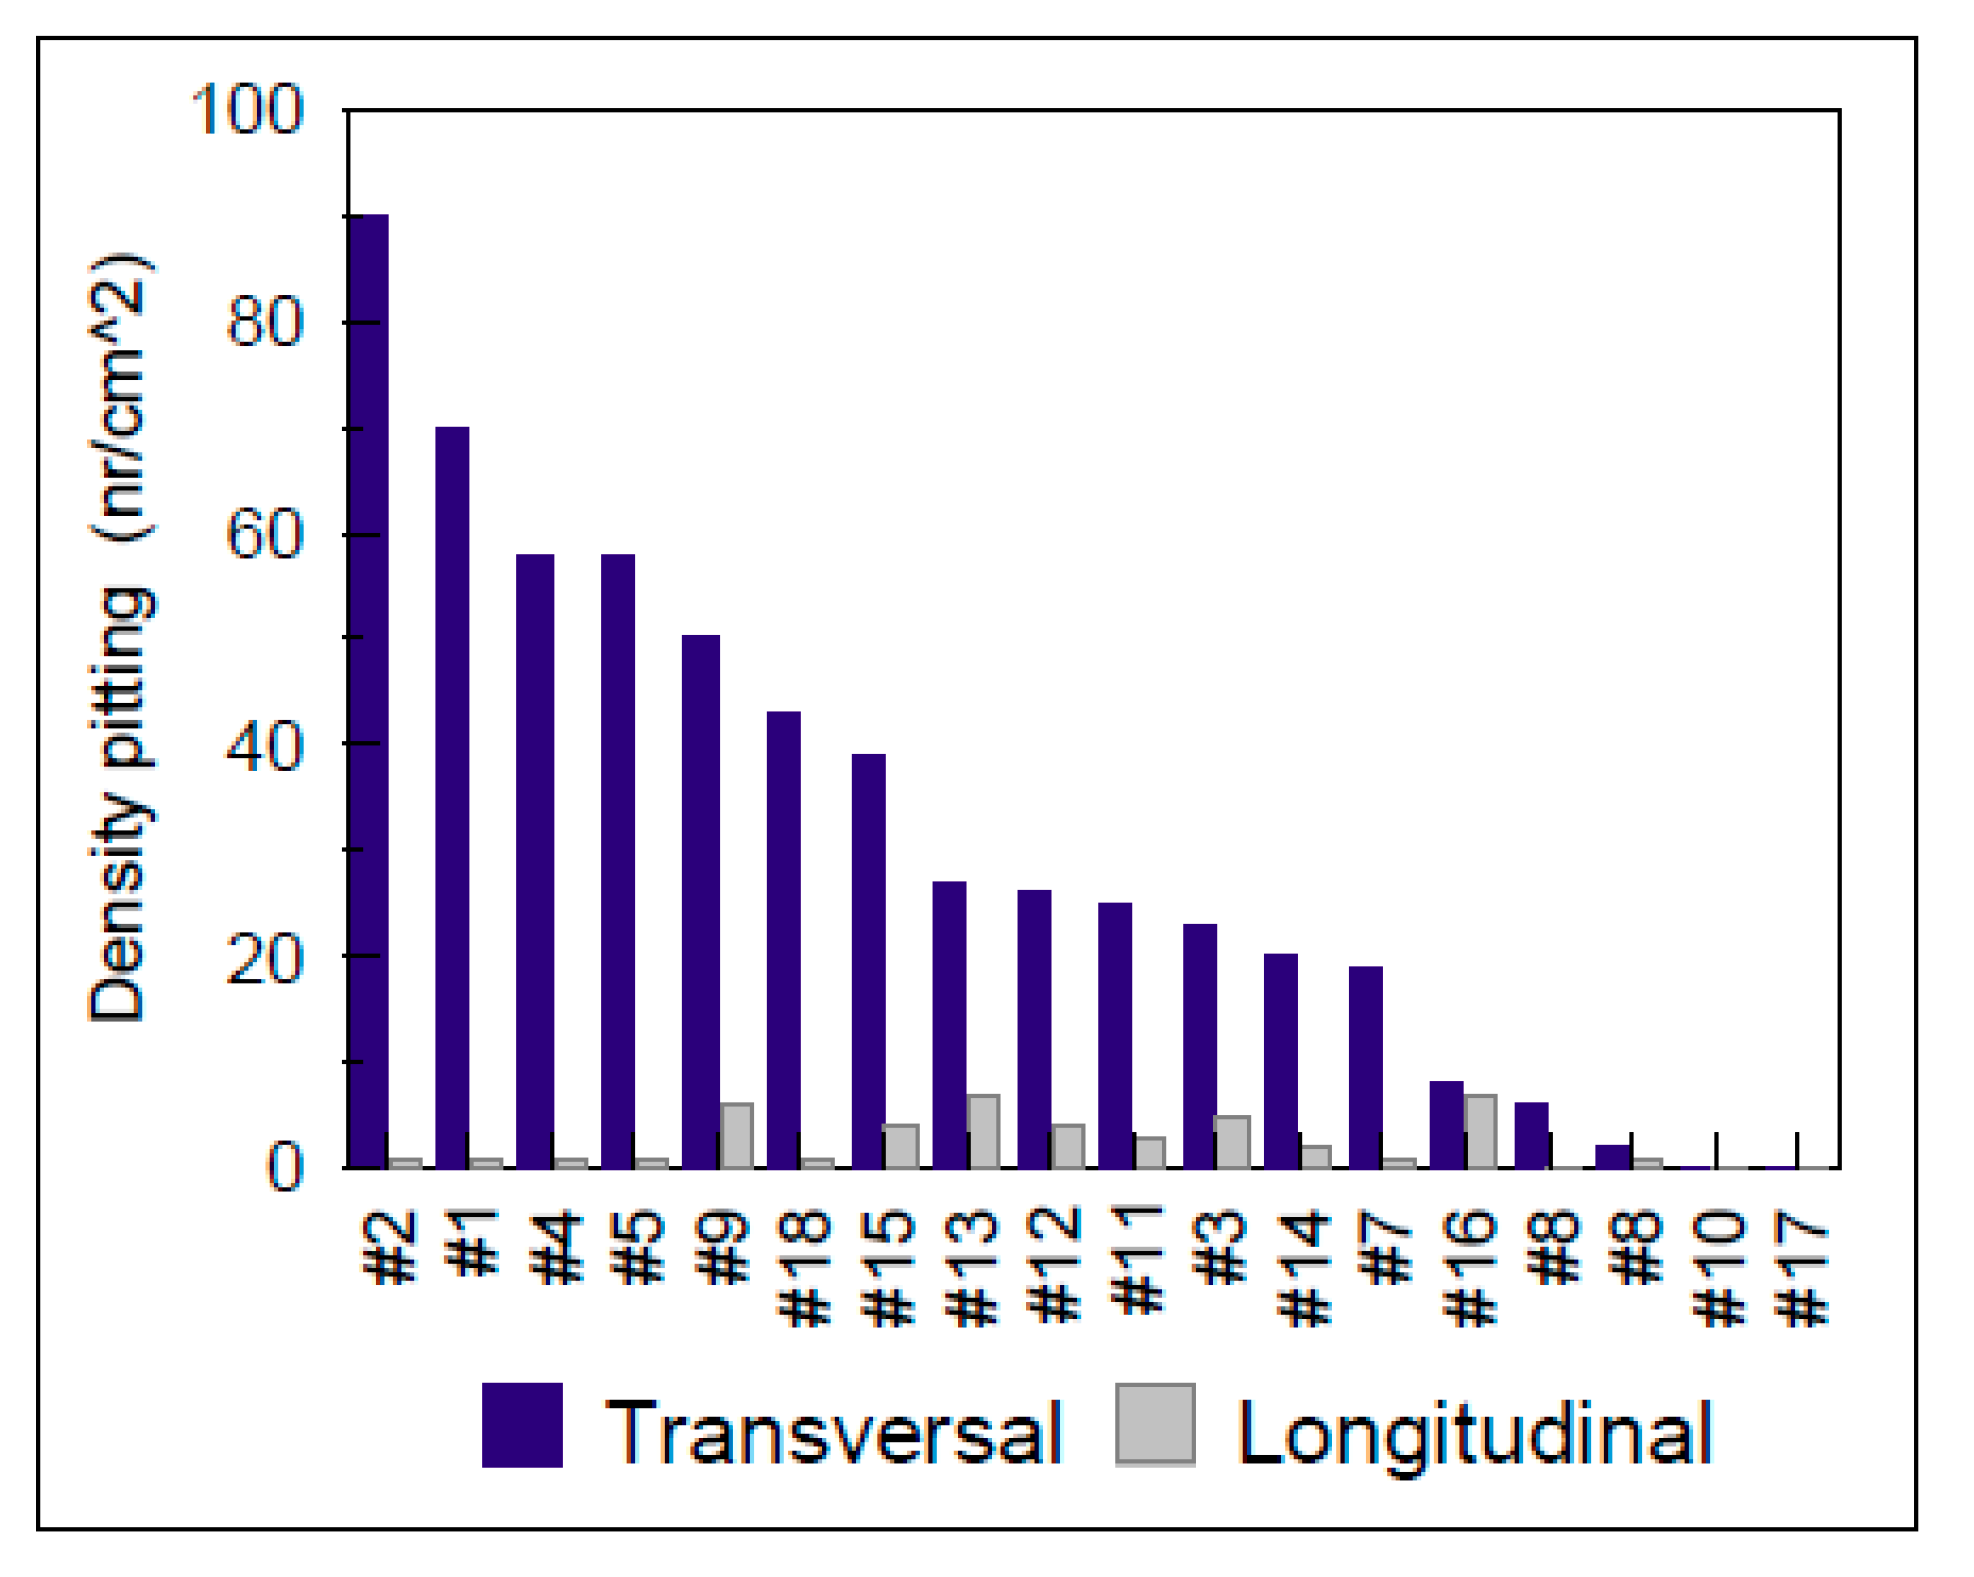
For the evaluation of steels sensitivity in pitting corrosion, available standards allow characterization of the formation, the shapes and the density of pits per unit area [52]. For the establishment of Figure 6, Figure 7, Figure 8 and Figure 9, it was necessary to determine the density of pitting corrosion (counting the number of pits per unit area).
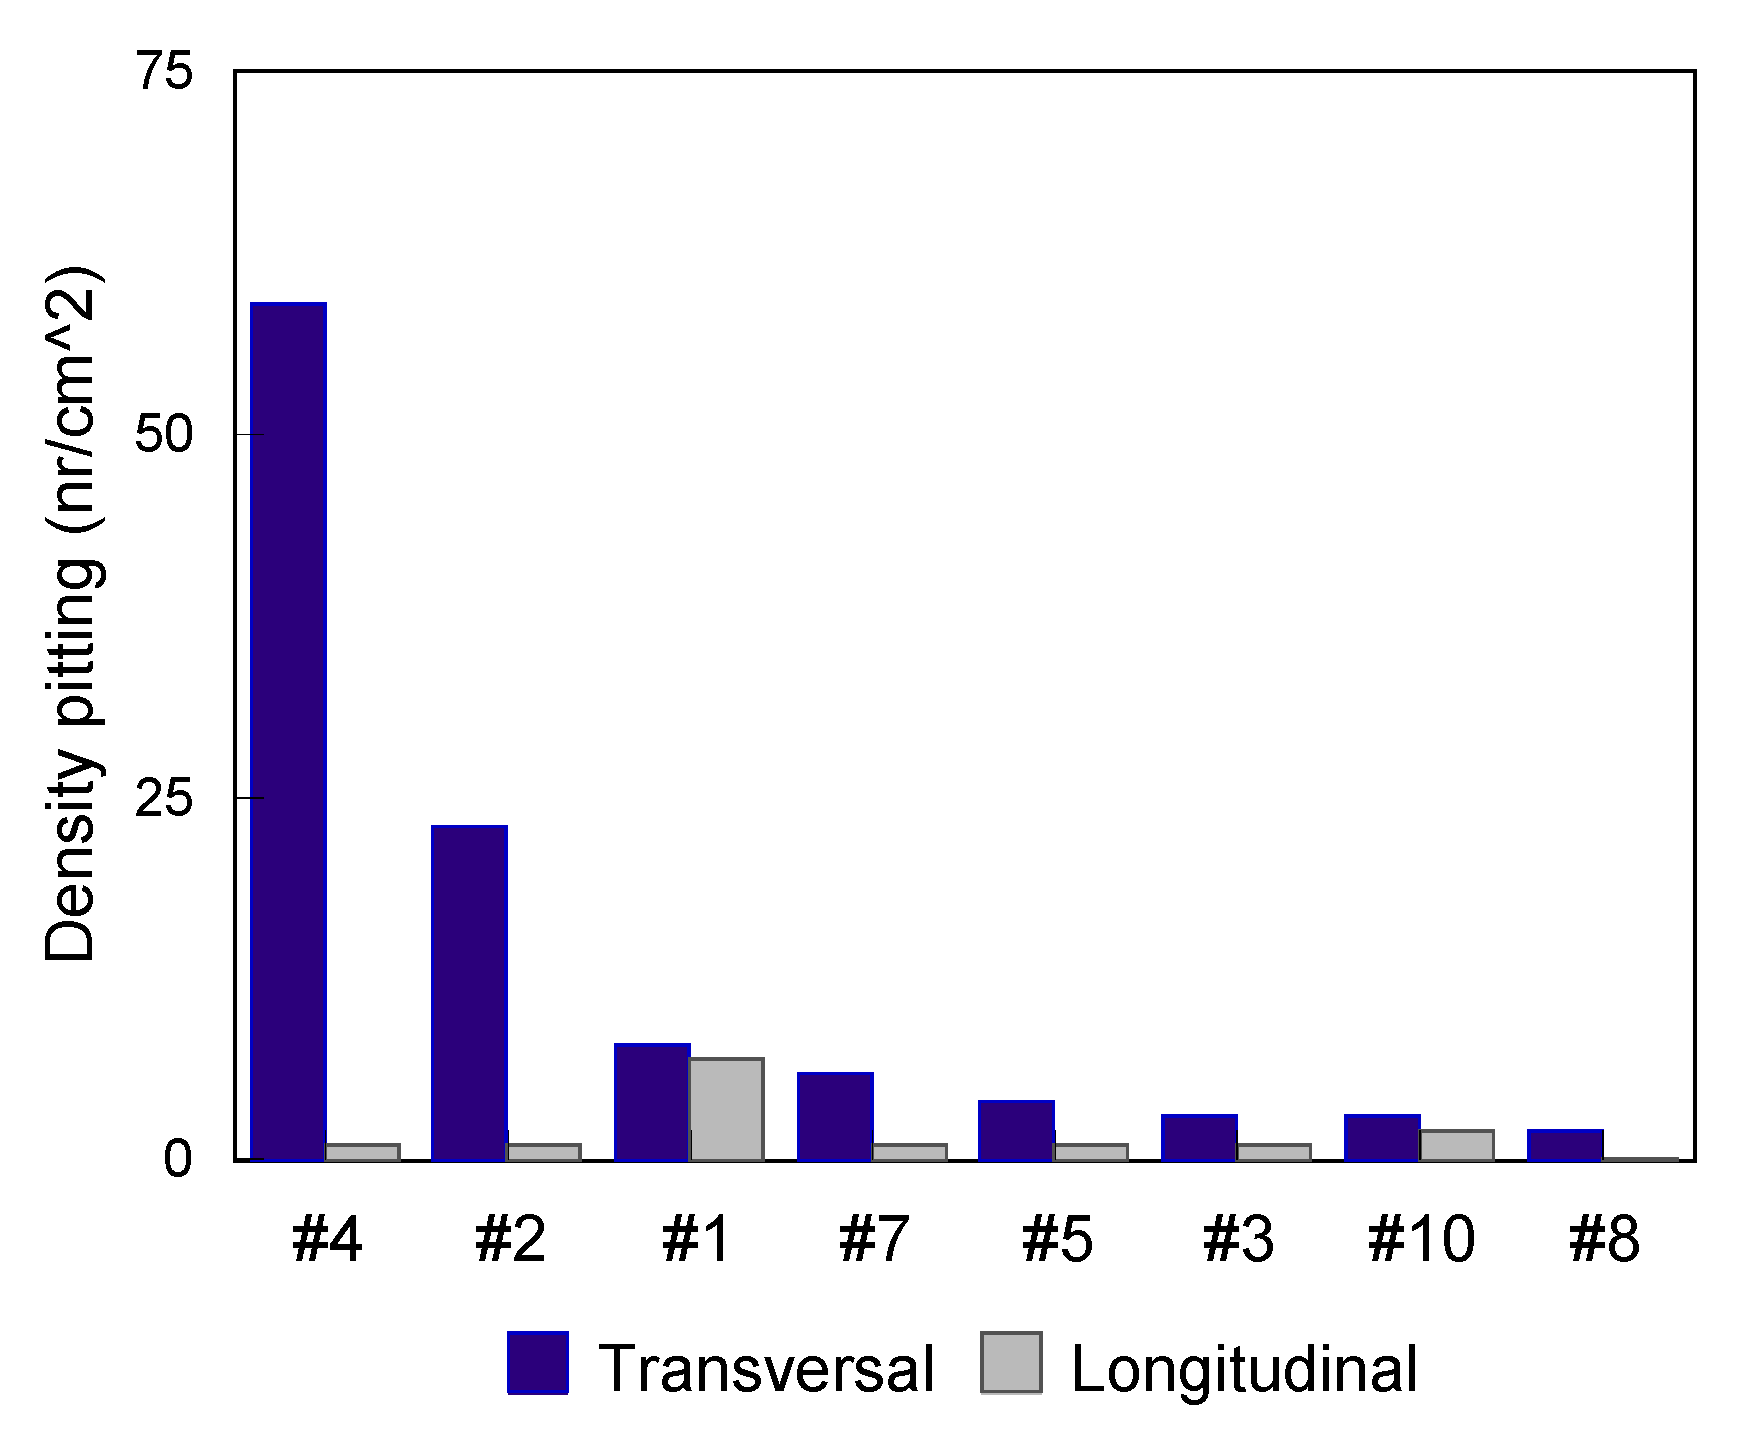
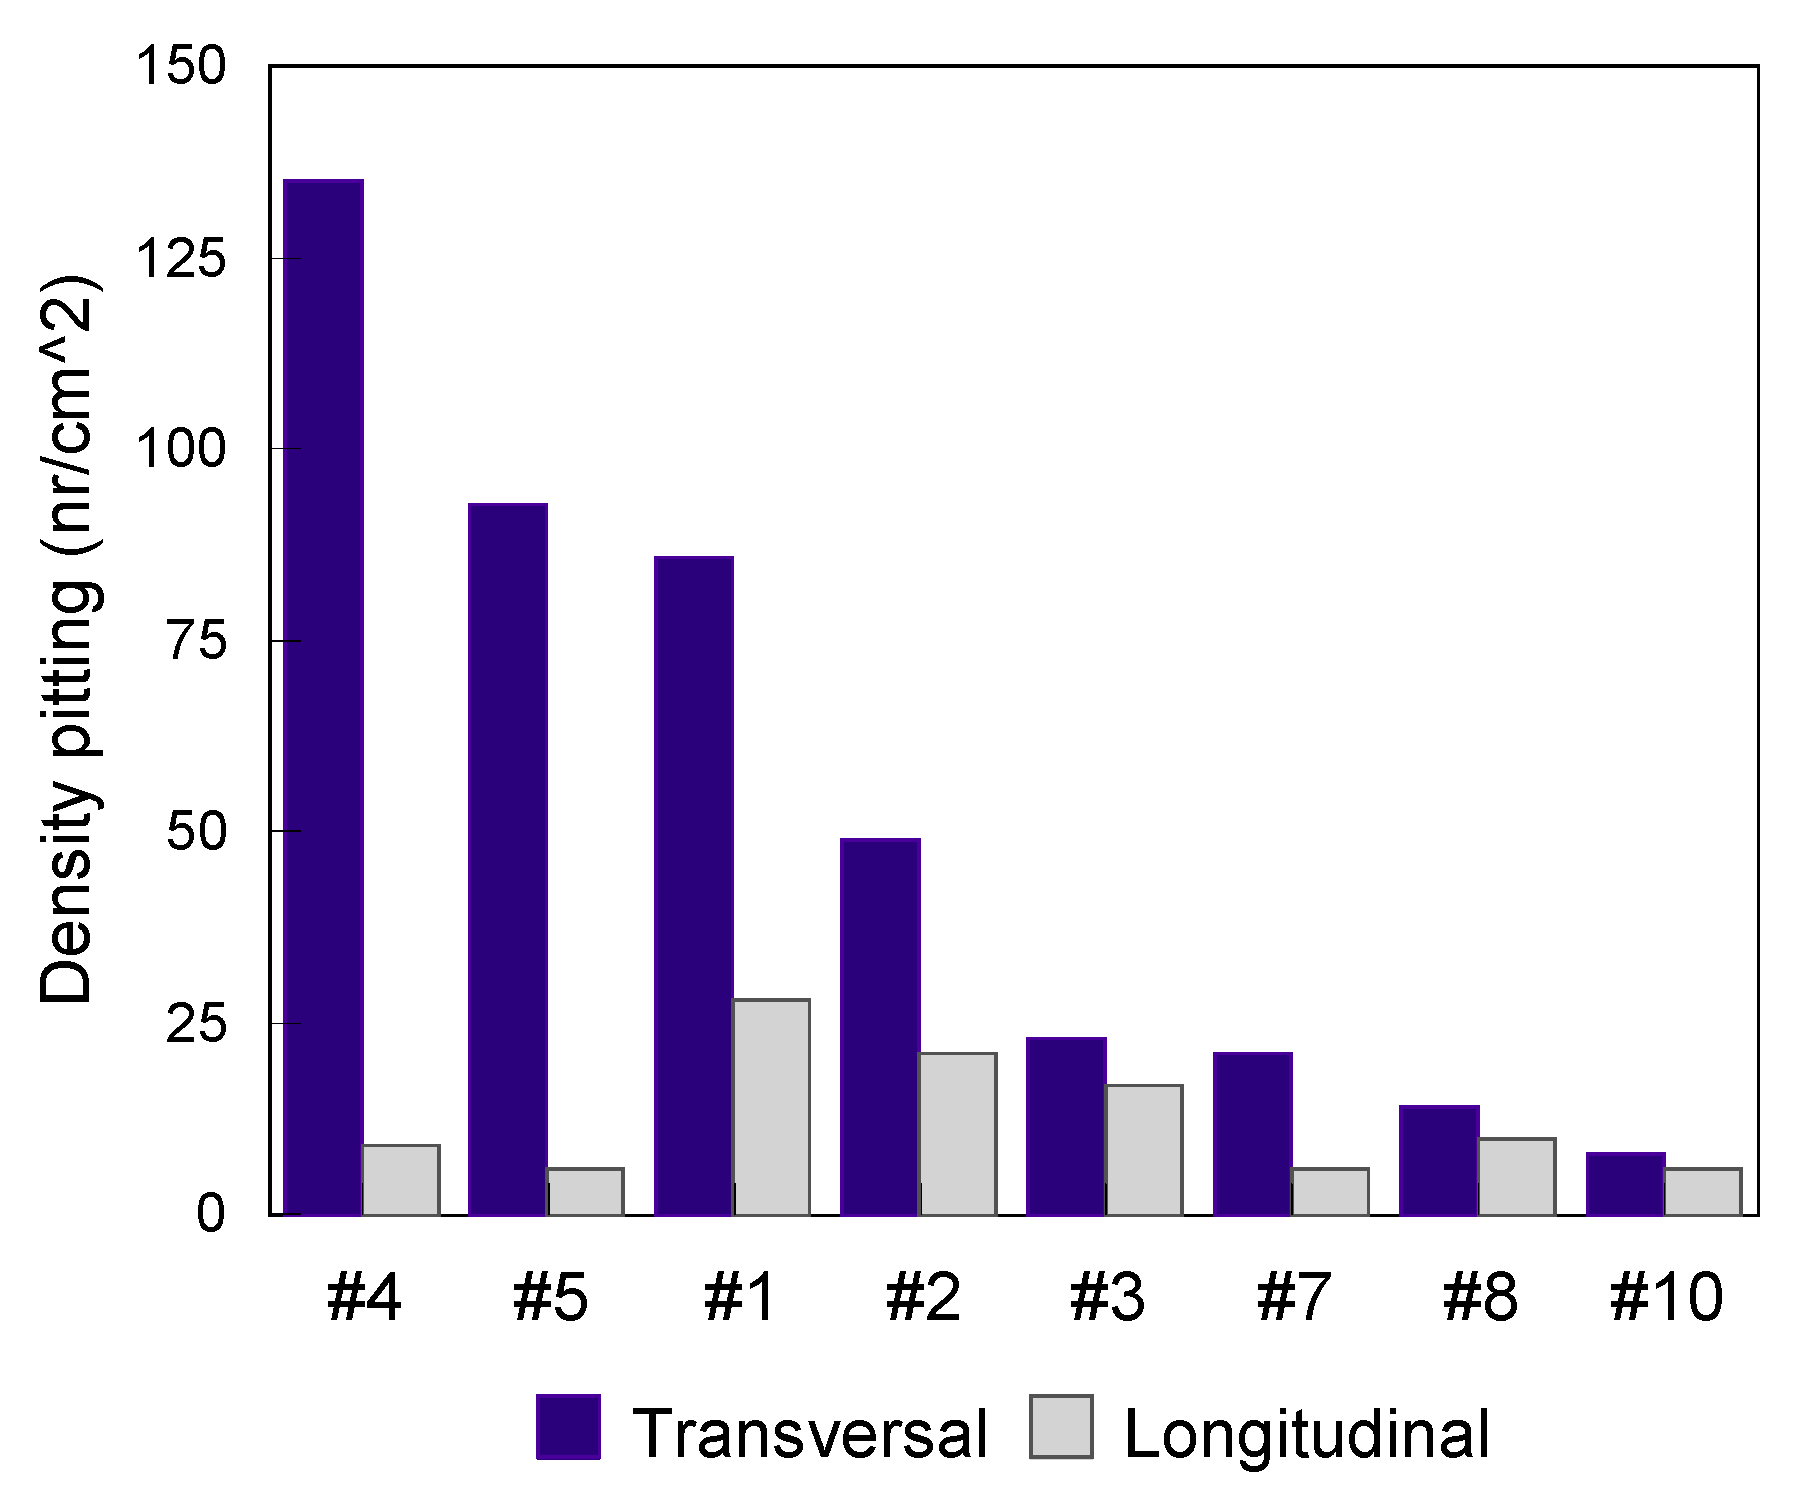
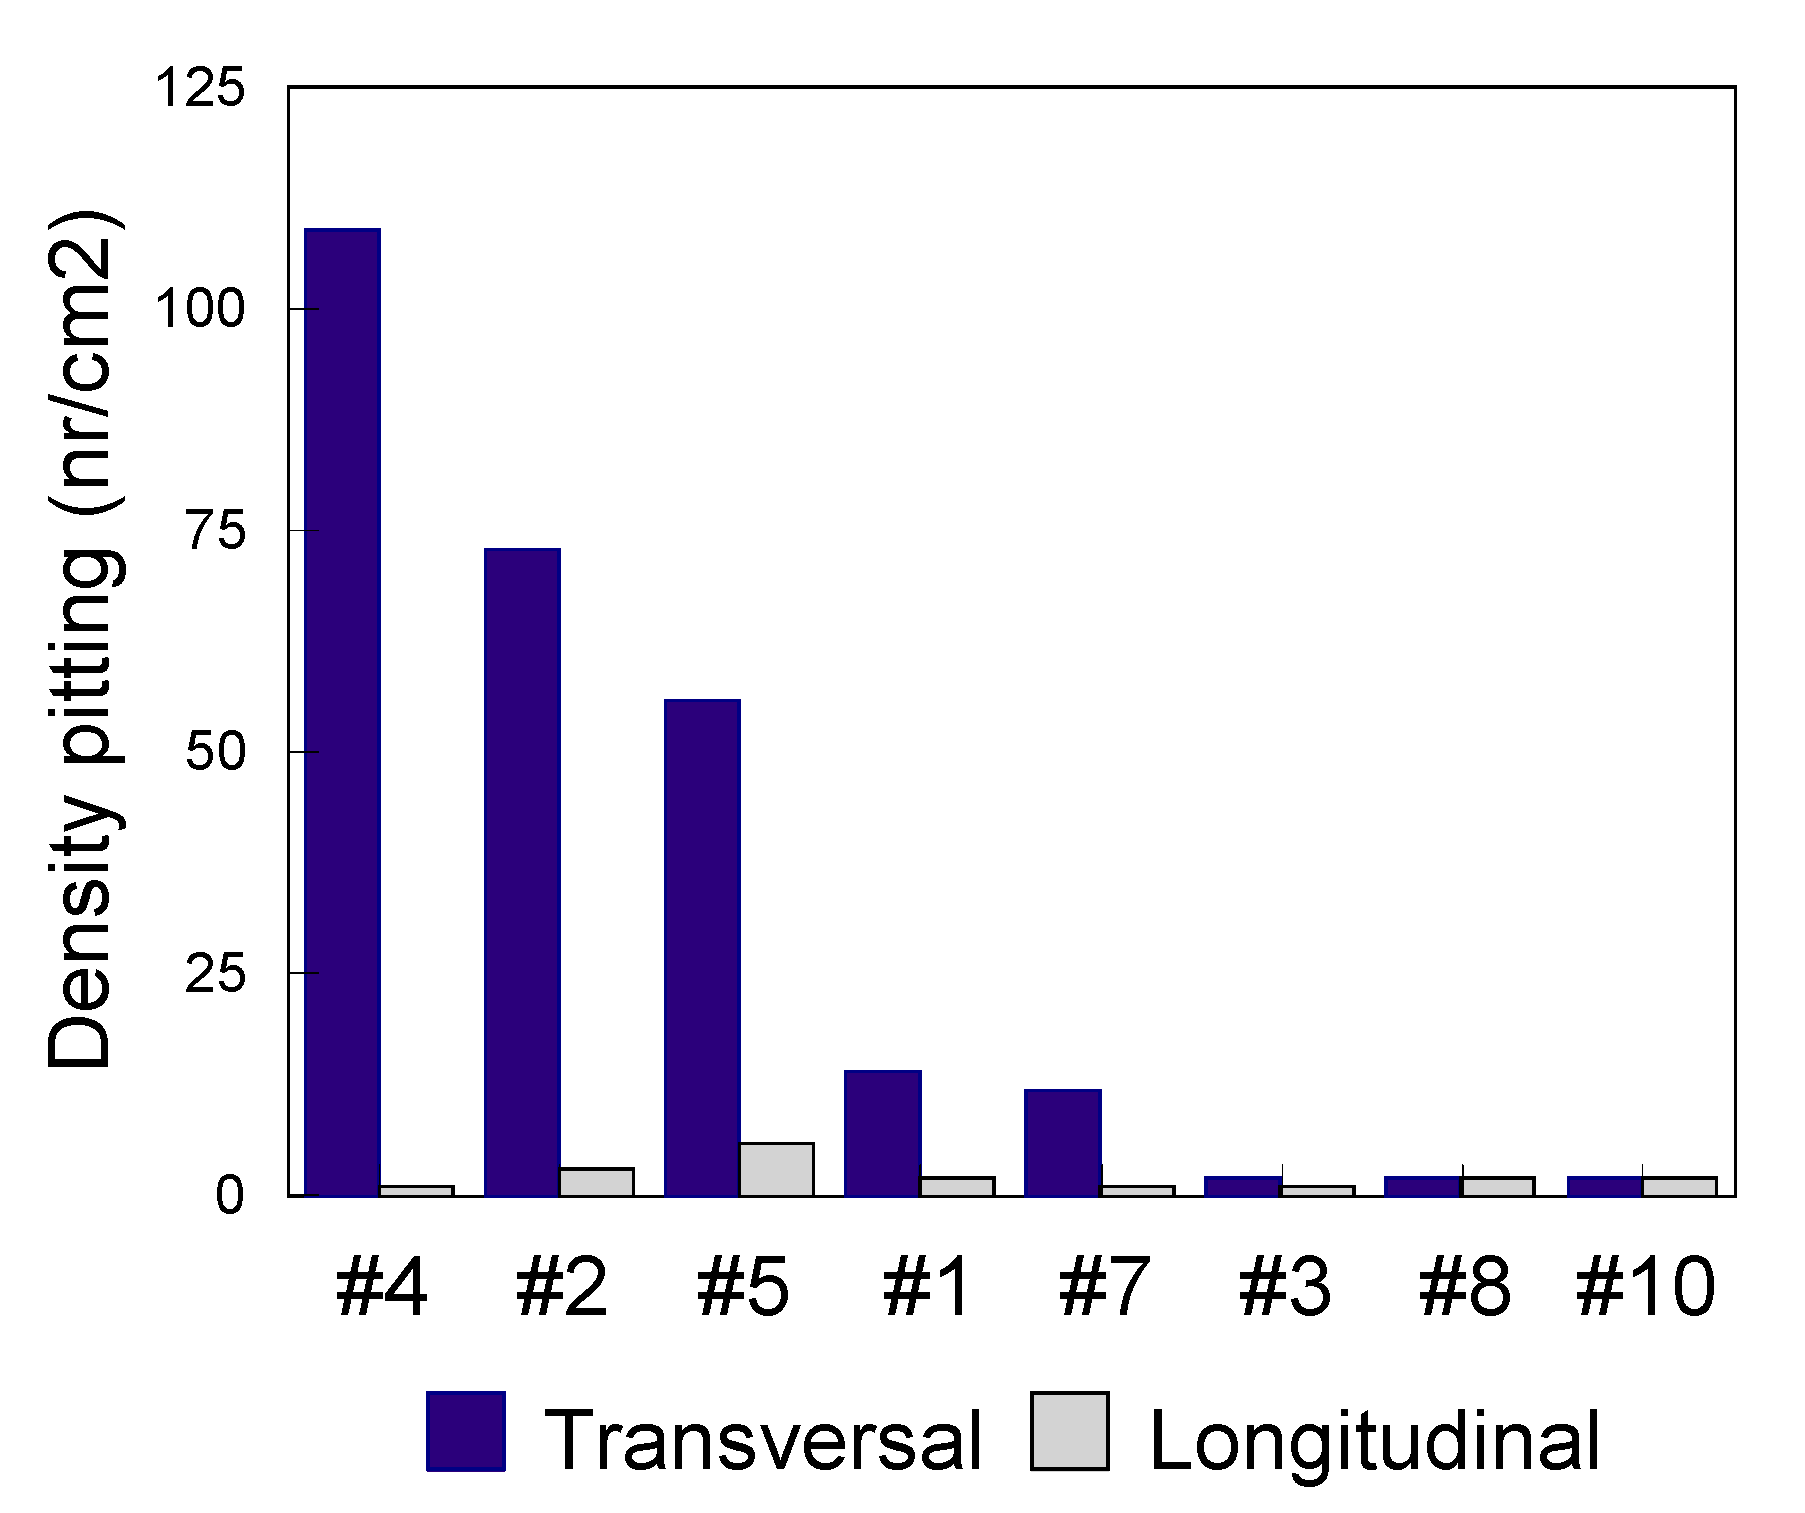
In all test environments, the transverse surfaces showed a higher pitting density compared to the longitudinal ones.
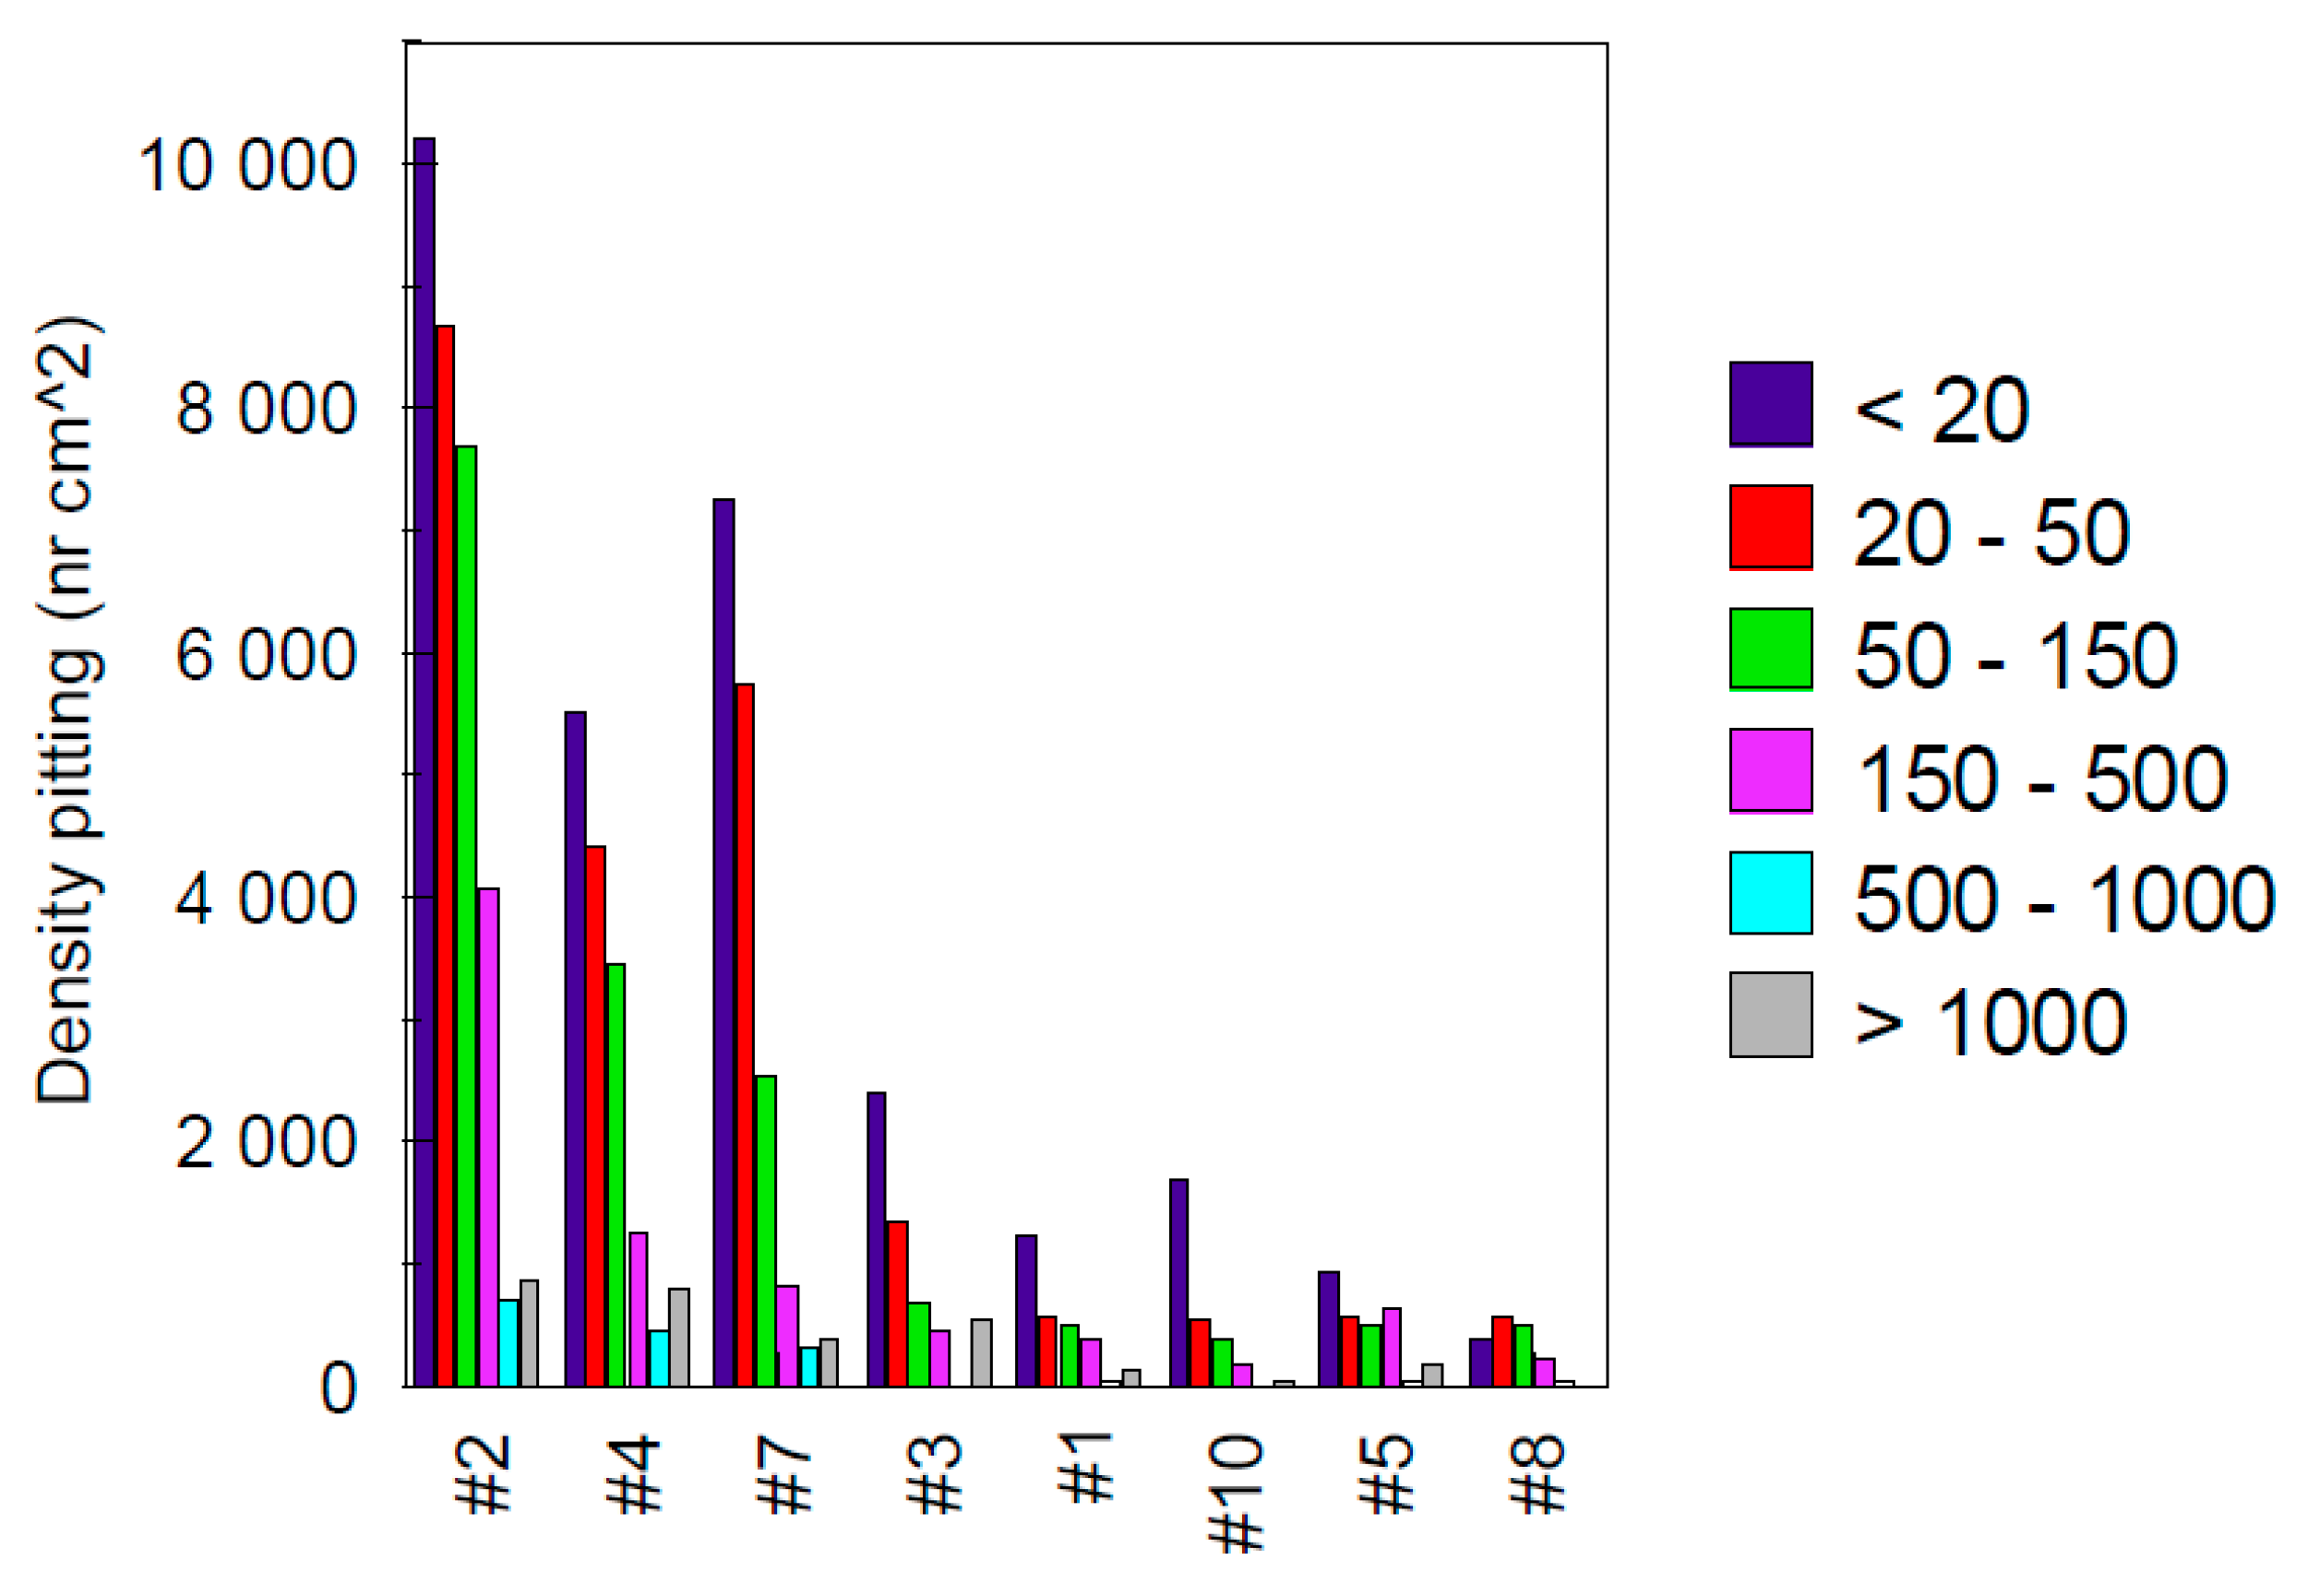
Using a Kontron KS 300 Version 1.2 image analysis program, the cross-sectional area of alloys #1, #2, #3, #4, #5, #7, #8 and #10, tested in 0.5 M FeCl3 at 50 °C for 2 h was analyzed statistically in relation to the area size of the pits. The following classes were established accordingly: <20, 20–50, 50–150, 150–500, 500–1000 and >1000 μm2. The densities (number of pits/cm2) according to the above mentioned classes are presented in Figure 10.
The image analysis revealed a density of pits which can be significant (more than 10,000 for sample #2, Figure 10). Under these conditions, it was necessary to define criteria which enable easier identification of pitting corrosion. Examination of the surfaces revealed numerous cavities which were not necessarily pitting.
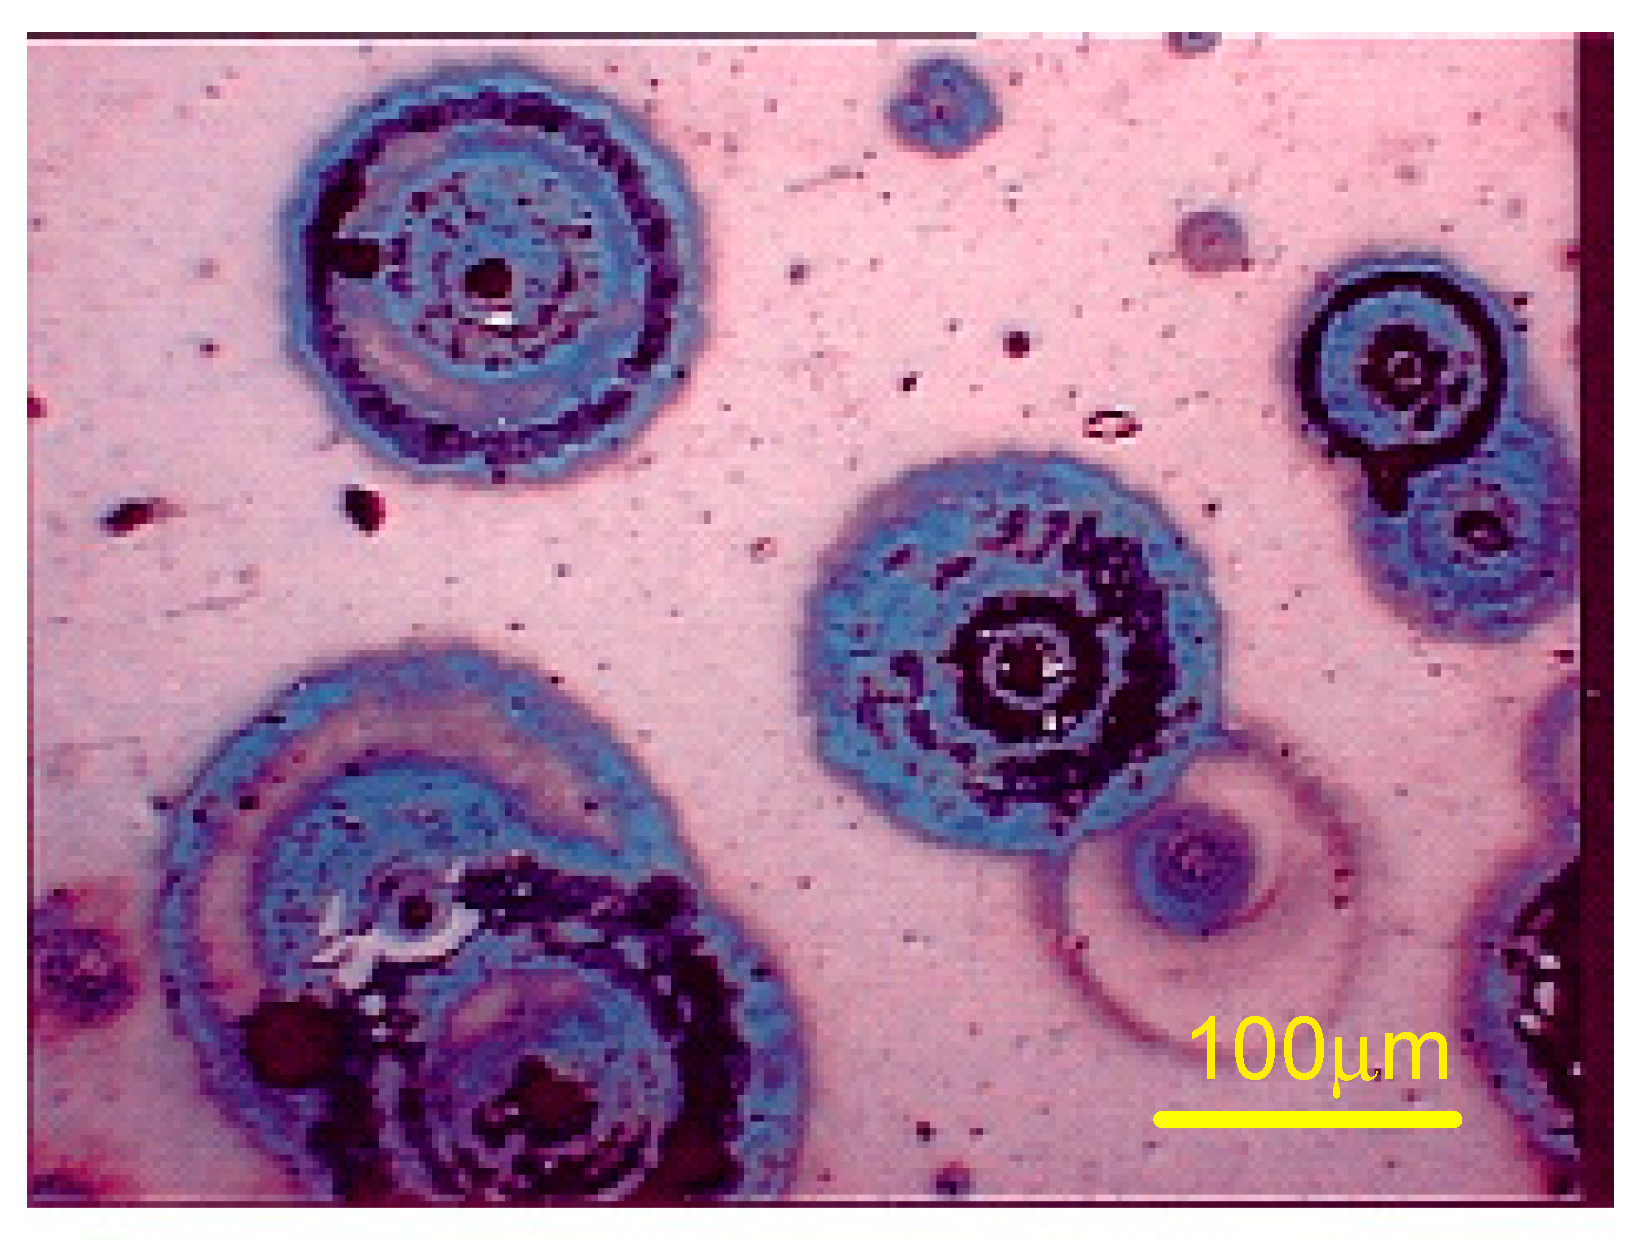
At this point, it is essential to clarify the definition of pitting corrosion. According to the ASTM, a pitting corrosion is electrochemically active if an anodic dissolution of the alloy occurs within the cavity. Thus, by definition, a pitting corrosion releases cations in the electrolyte. It is therefore sufficient to carry out the corrosion test in an electrolyte containing traces of an analytical reagent which forms, with one of the cations released by the active corrosion pits, an insoluble colored compound which will deposit near the pit. The common element for all the alloys in question is iron, the iron dissolution mechanism being based on ferrous ions (Fe2+). Tests carried out on several reagents showed that potassium ferricyanide (K3[Fe (CN6]) is suitable to form an insoluble colored complex. Corrosion pits, revealed as blue discs encircling the pits (Figure 11), were used to determine the number per unit area.
In conclusion, the FeCl3 solution, according to the ASTM G48-11 [31] standard, was aggressive with respect to the pitting corrosion behavior of the alloys studied; within two hours, most steel grades show readily identifiable macroscopic corrosion pits. On the other hand, in case of NaCl 0.5 M or artificial sweat ISO 3160-2 [30], the evaluation of the pits density was problematic given the difficulty of identifying the effectively electrochemically active pits. The use of potassium ferricyanide, which precipitates in the form of Turnbull blue in the presence of Fe2+ ions, greatly facilitated the evaluation of the density of pits after immersion in this type of electrolyte.
According to Blackwood [2], pitting corrosion was a common problem with the early 304 stainless steels. In the case of 316L stainless steels, the addition of 2–3 wt% Mo has greatly reduced the number of failures due to pitting corrosion [2].
After initiation, pits either keep growing or repassivation may occur. According to Virtanen, an alloy with a high pitting corrosion resistance should ideally combine low susceptibility to pit initiation, low pit propagation rate, and fast repassivation [53]. According to Melchers, in case of metals with electron-conducting passive films such as stainless steels, the number of pits usually correlates inversely with their average depth, since the cathodic current consumed by the large passive surface area fosters anodic dissolution inside the pits [54]. The pits may grow at different rates, depending on the number of active pits [54]. According to Abbasi Aghuy et al., changes in electrochemical behavior of metal due to grain refinement as a consequence of changing grain boundary densities may occur [55].
3.3. Crevice Corrosion
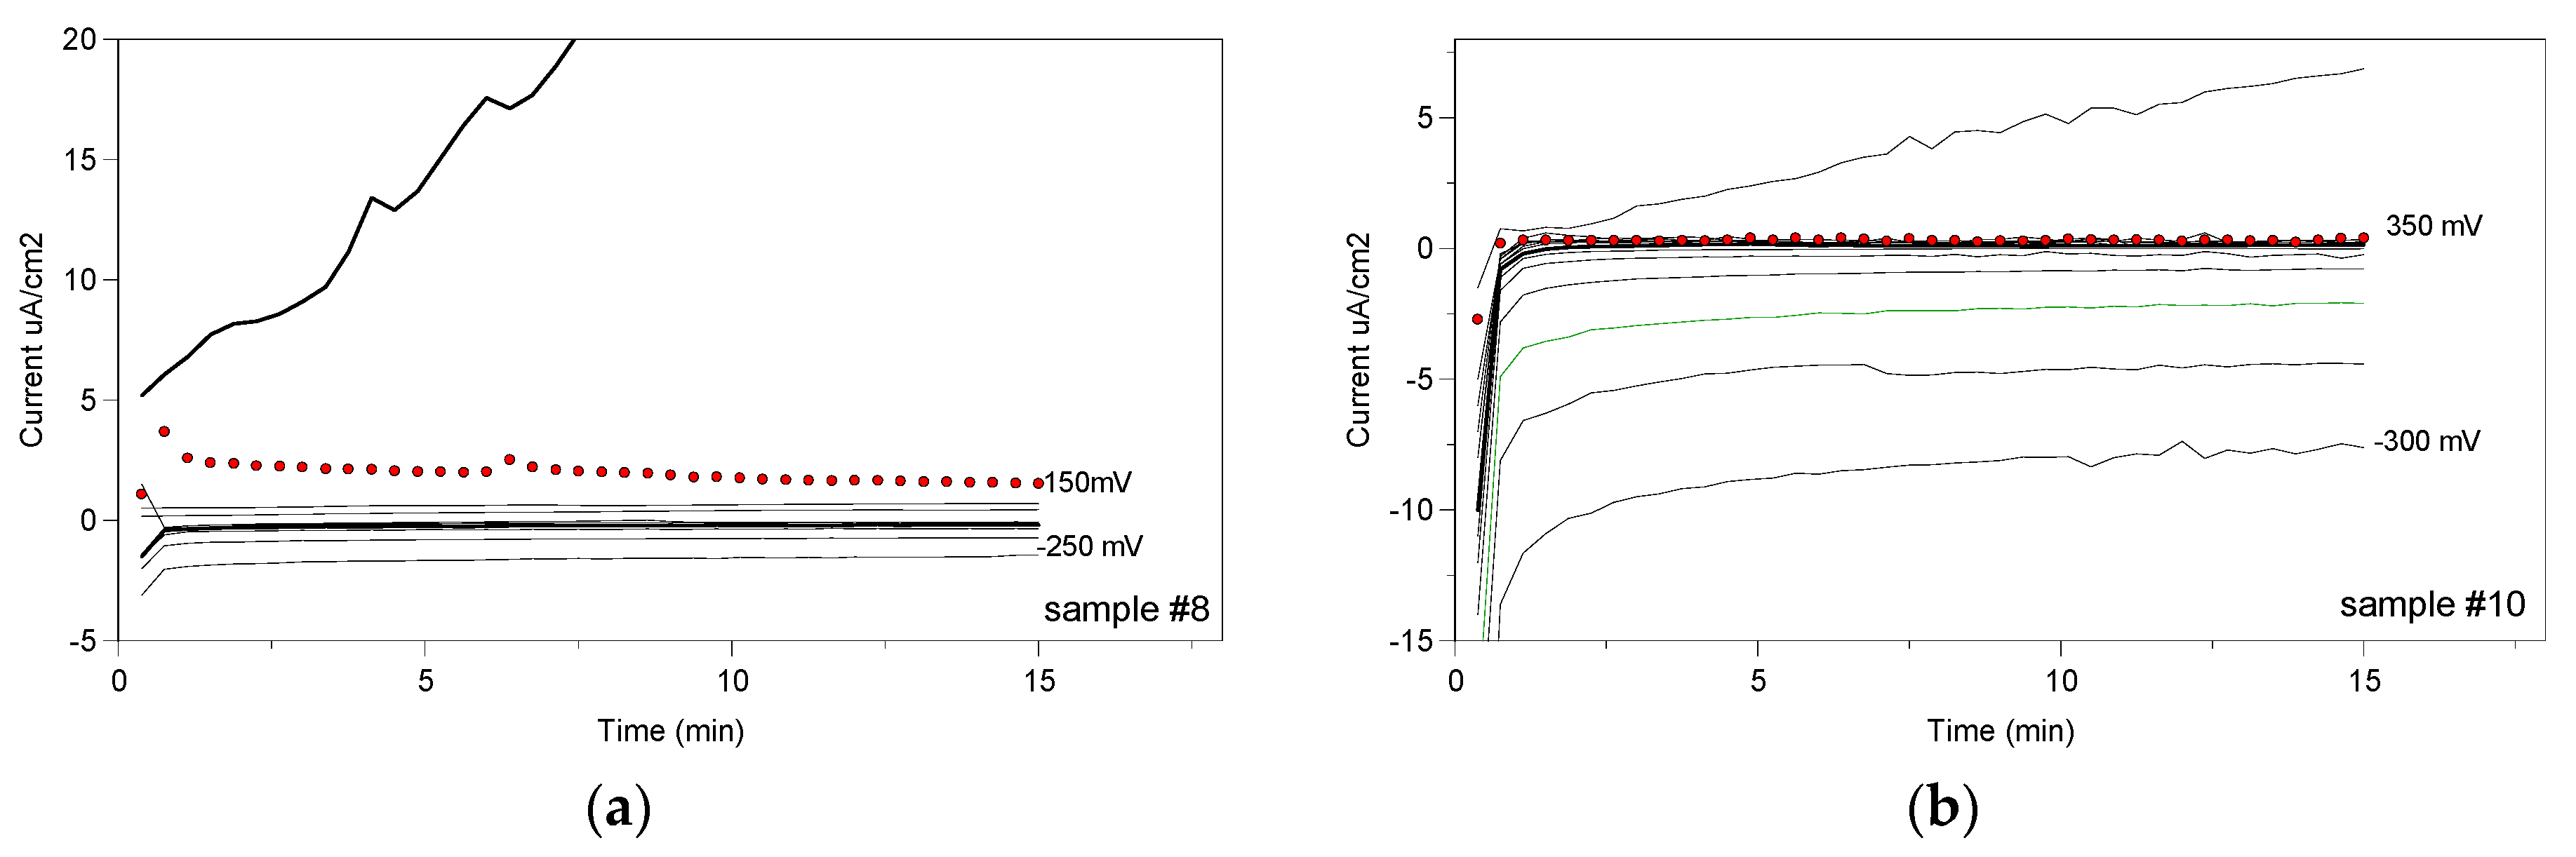
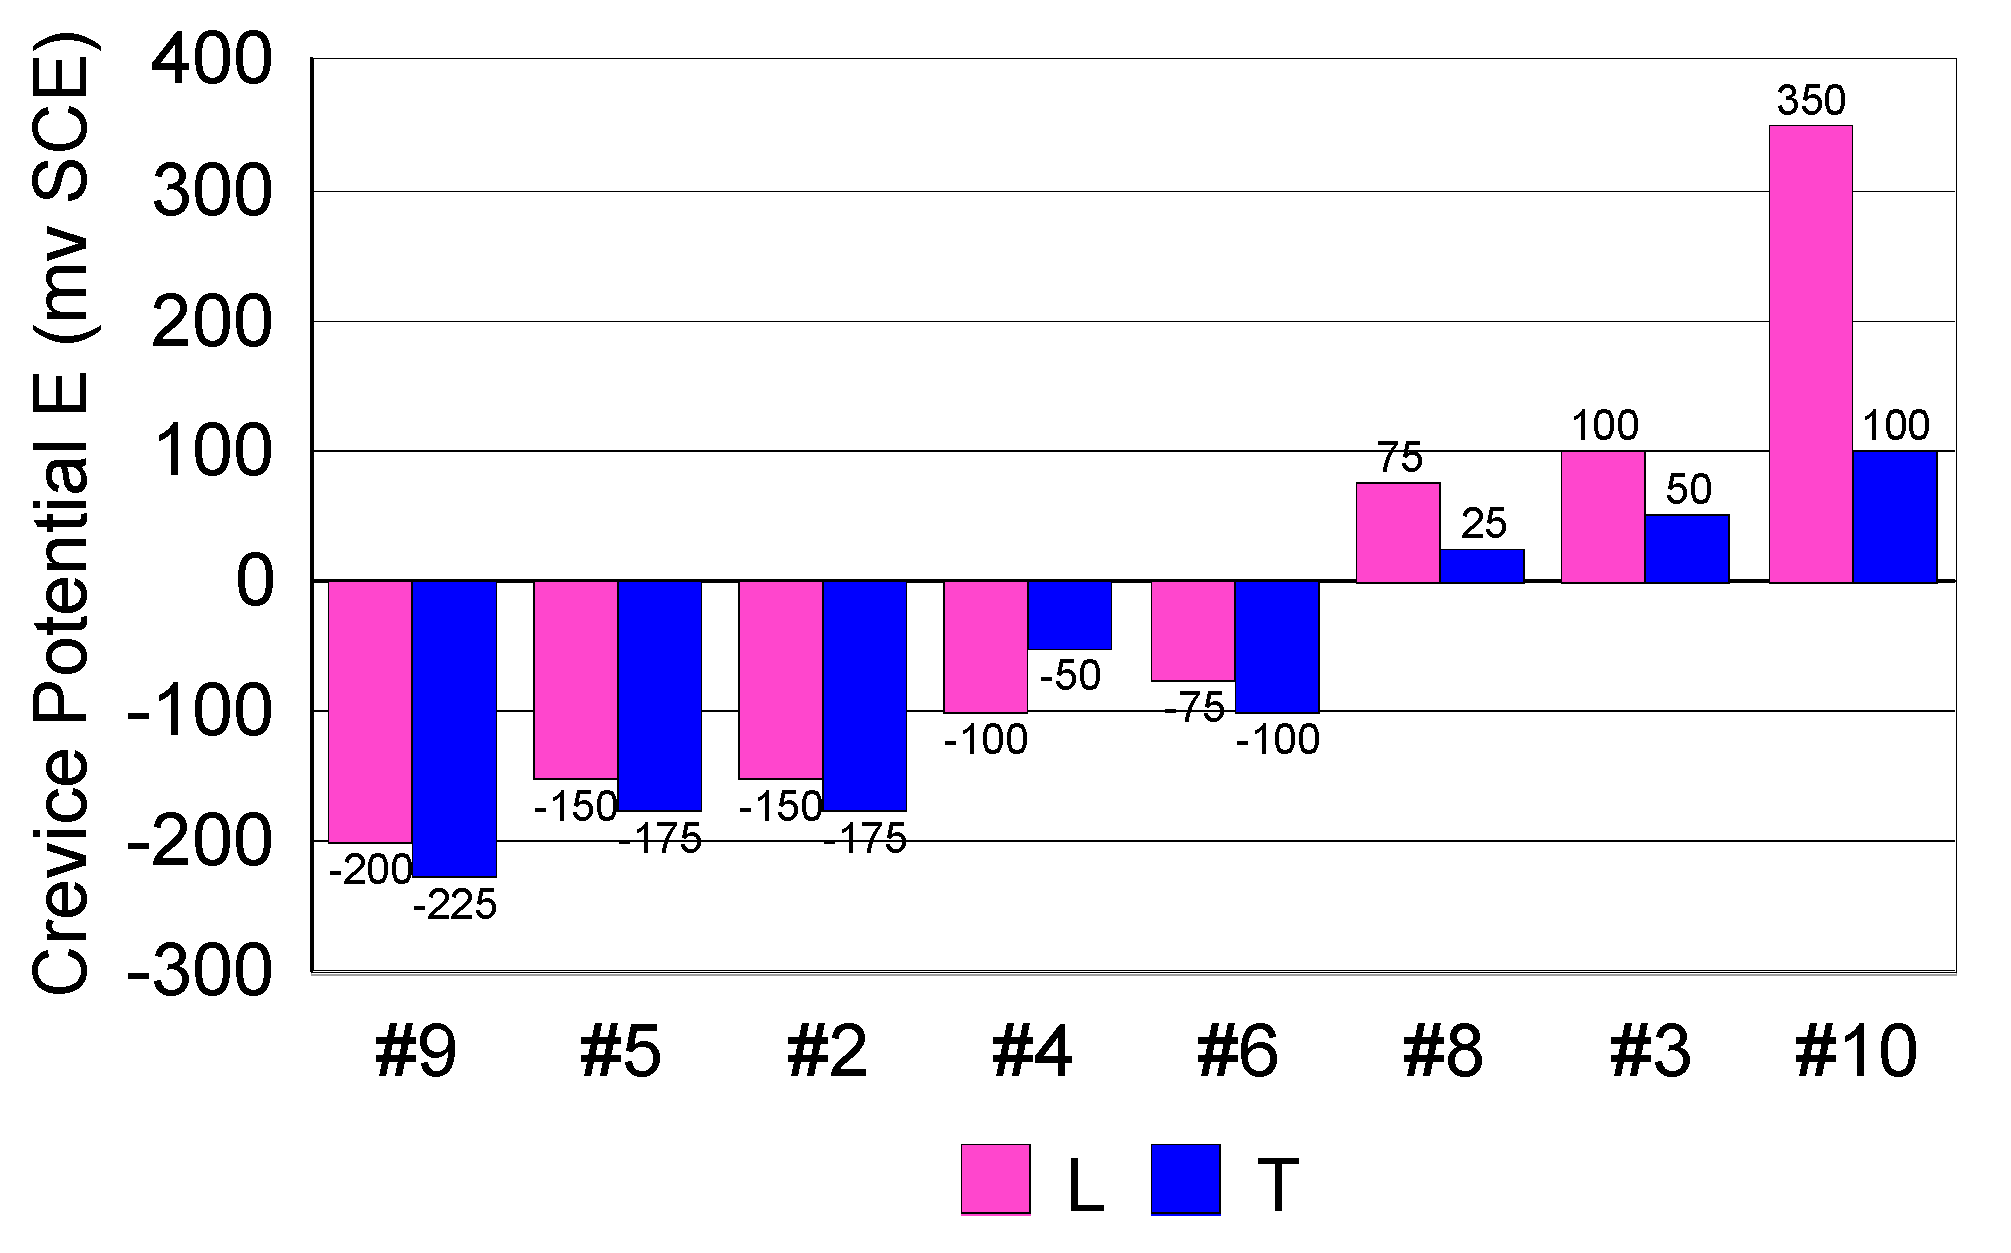
Figure 12 shows the “variations of the current” curves as a function of time, for values of imposed potential, for the longitudinal surface of samples #8 and #10, respectively. The crevice potentials were +150 mV (red points) for sample #8 and +350 mV (red points) for sample #10.
Figure 13 shows the values of the crevice potentials determined for both longitudinal and transverse surfaces, according to ASTM F746-87 standard [35].
The values of the crevice potentials measured did not reveal any difference in susceptibility to crevice corrosion between the two surfaces. The only difference was that the transverse surface showed lower values than the longitudinal surface, but these differences remained in the field of experimental errors. In other words, there was no significant difference in the crevice corrosion behavior between the two surfaces.
In case of 316L steels (#2, #3, #4, #6, #8, and #9), the values of the crevice potentials were different, due to the structure type of inclusions and composition in minor chemical elements.
The study of Poyetet et al., involving 18-10 type stainless steels [56], has concluded that the reactivity of the inclusions, in terms of their contribution to the onset of pitting, is a function of their association (Table 7).
Mixed oxide-sulfide or silicate-sulfide inclusions are the most susceptible to pitting. The corrosion susceptibility of inclusions might be ranked, in increasing order: sulfides < alumina-sulfides < silicate-sulfides < Mg-oxide-sulfides. By themselves, sulfides do not have a particularly detrimental action on the pitting corrosion resistance of steel, but they become particularly harmful when associated in the form of mixed inclusions. As far as shape is concerned, globular inclusions (present only in the as-cast, undeformed material) seem to be less harmful than inclusions deformed during hot working of the metal [56].
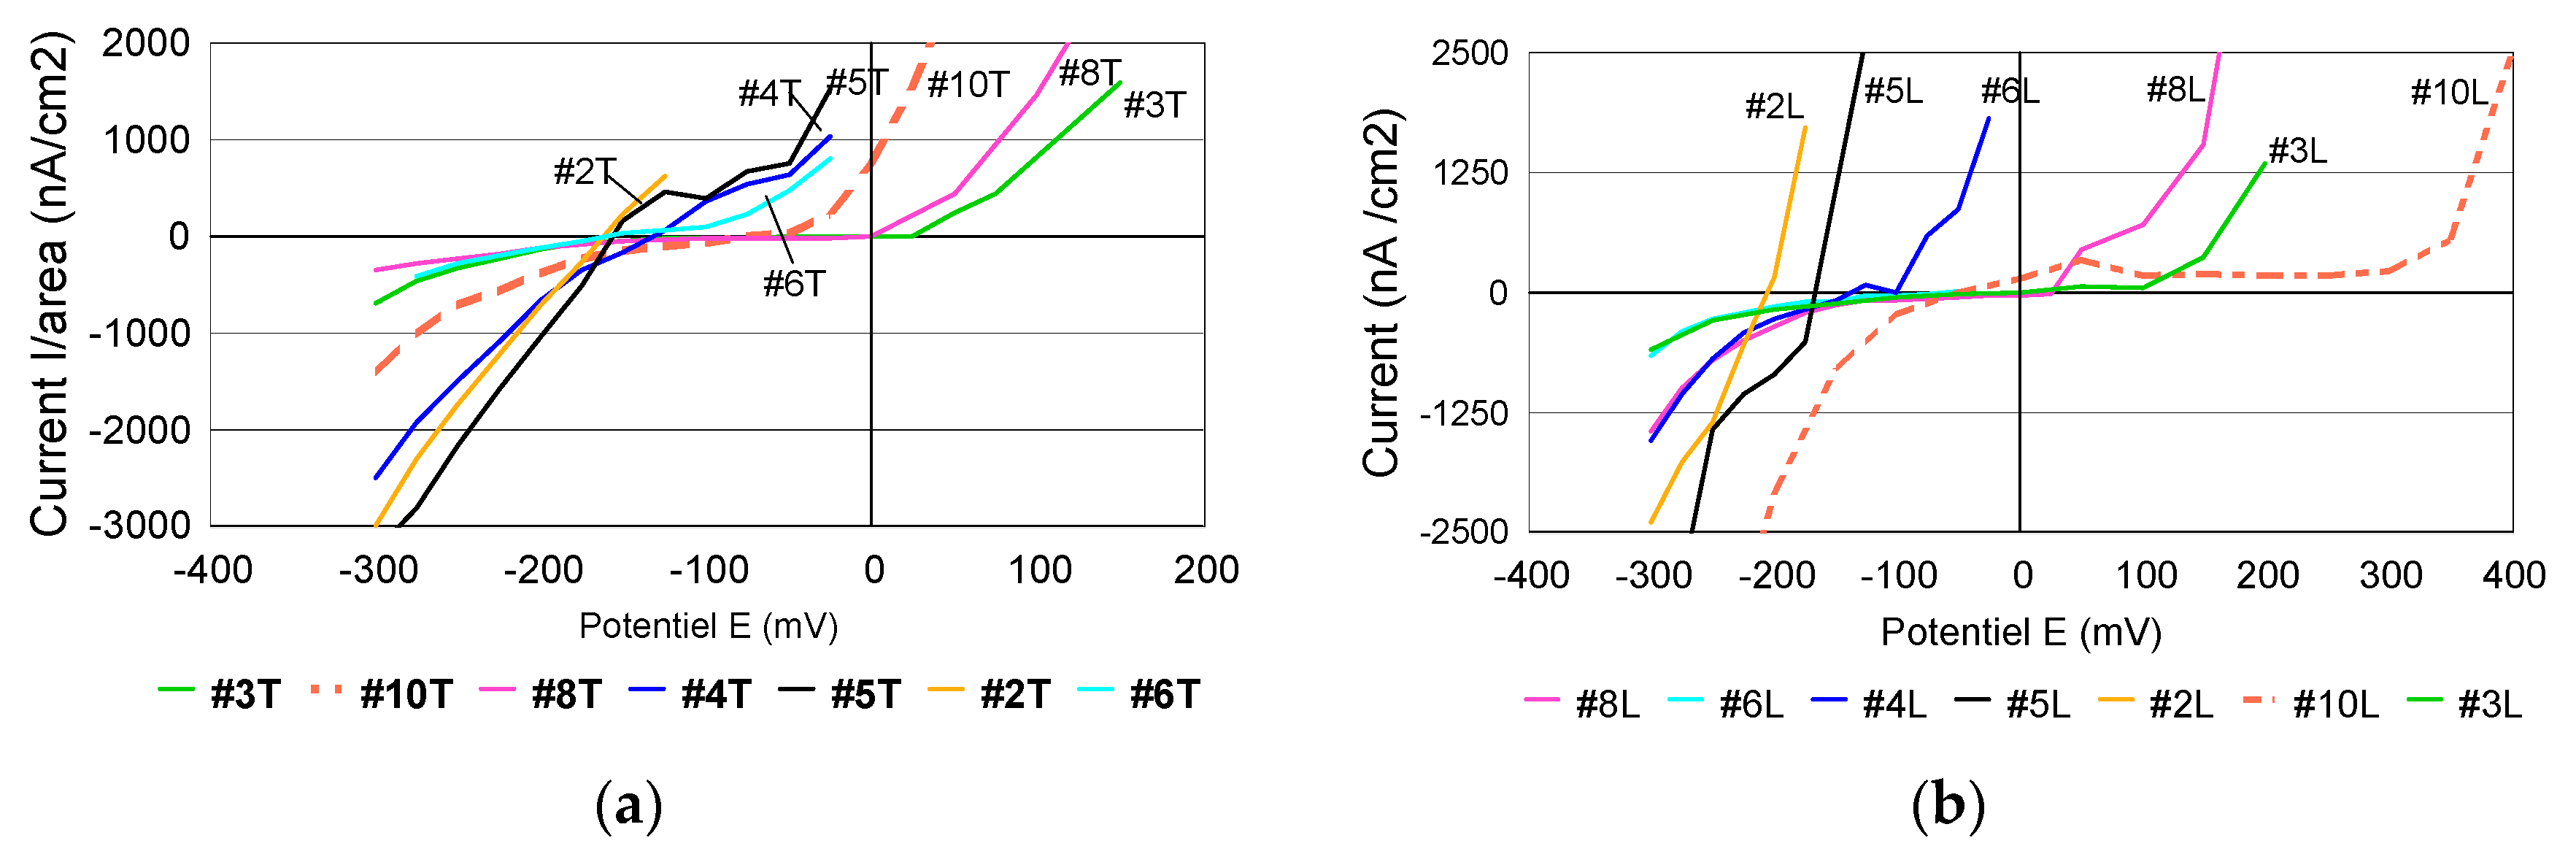
When considering the final values of currents recorded after 15 min for each level and representing the current as a function of potential, a series of “polarization curves”, specific to the crevice corrosion process were obtained (Figure 14).
When comparing the crevice corrosion behavior of the two surfaces, no real difference in susceptibility to corrosion was noticed. On the other hand, in accordance to Bryant et al. [57], each steel has a different behavior to crevice corrosion. Some steels do not reveal a “passivation capacity” before reaching the value of crevice initiation potential. In case of 316L, respectively #2, #3, #4, #6 and #8 this difference was noticed. According to Liu et al., in case of 316L stainless steel, widely used as a metallic biomaterial, crevice corrosion has been a serious concern [58]. In case of #10, a difference was expected, due to the better corrosion resistance compared to the 316L family.
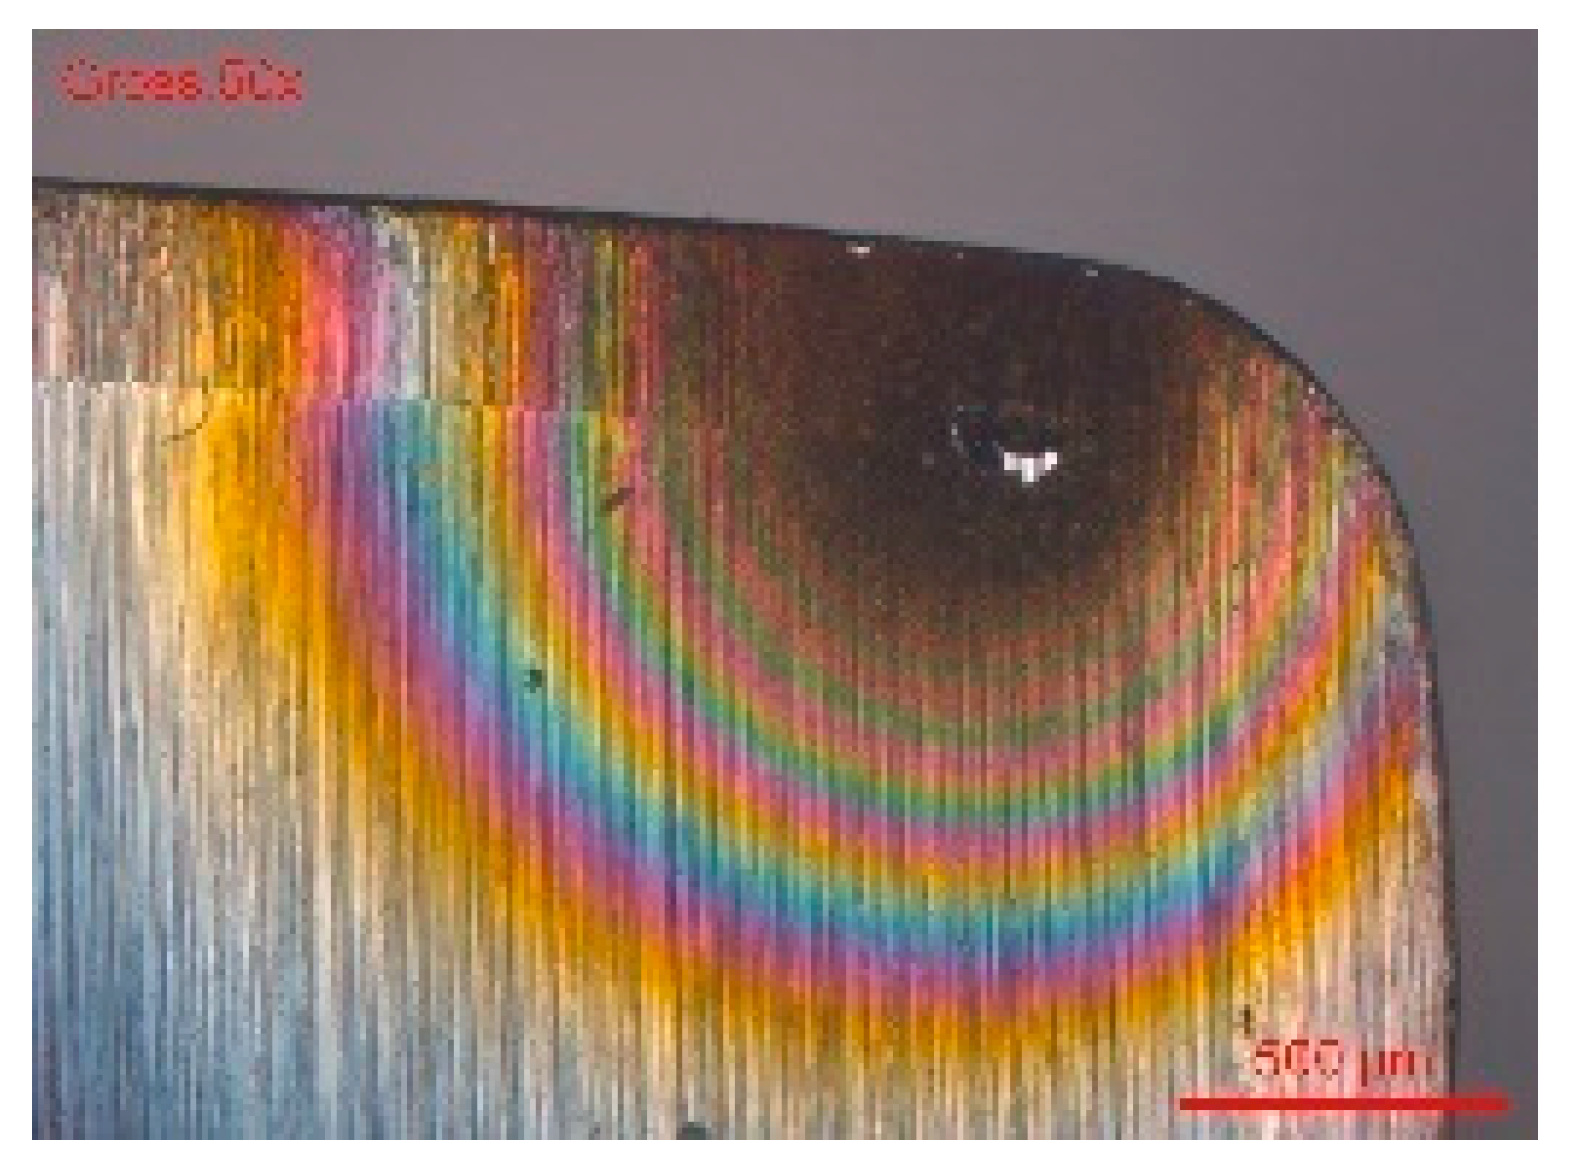
In conclusion, the evaluation of the crevice corrosion resistance did not reveal marked differences between the behavior of the transverse surface compared to the longitudinal one. This shows that the pitting and crevice corrosion mechanisms, although having some similarities, are different. In case of certain grades of steel, particularly sensitive to crevice corrosion, sometimes crevice corrosion can interfere with pitting corrosion measurements. Figure 15 shows a situation where crevice corrosion strongly interfered during the measurement of pitting corrosion by the rotating electrode technique. The crevice corrosion developed under a defective collar, making the measurements unusable for the characterization of pitting corrosion. Sometimes, the observation of the corrosion morphology provides information on the metallographic structure of the alloy. The morphology of crevice corrosion on the transverse surface (Figure 15) showed a particular structure, the orientation of the corroded structures suggesting a preferential longitudinal dissolution. This reveals a manifestation of a higher corrosion sensitivity of the transverse direction compared to longitudinal direction.
3.4. Intergranular Corrosion
3.4.1. Chemical Tests
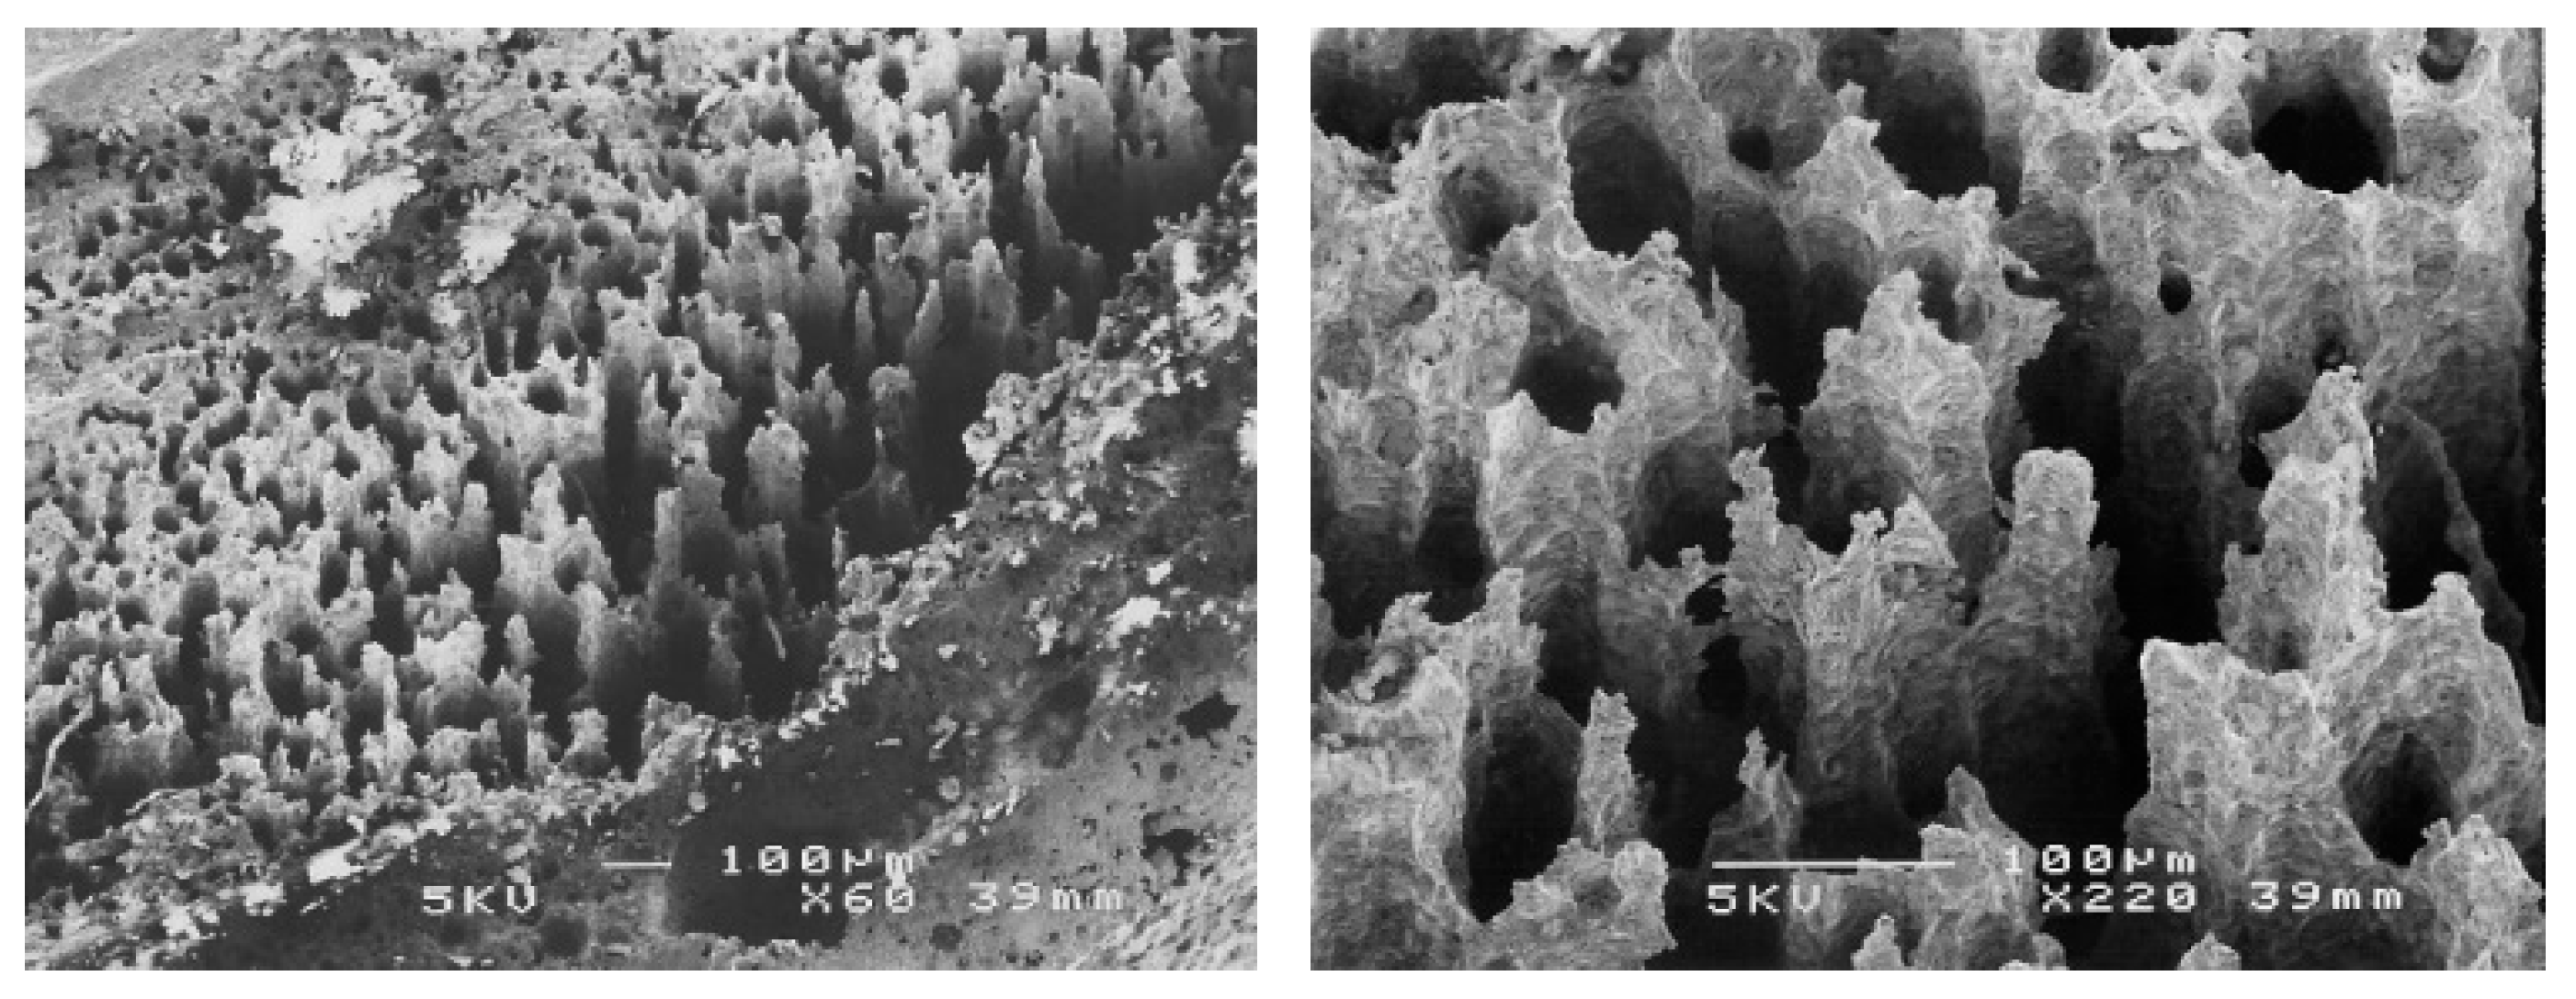
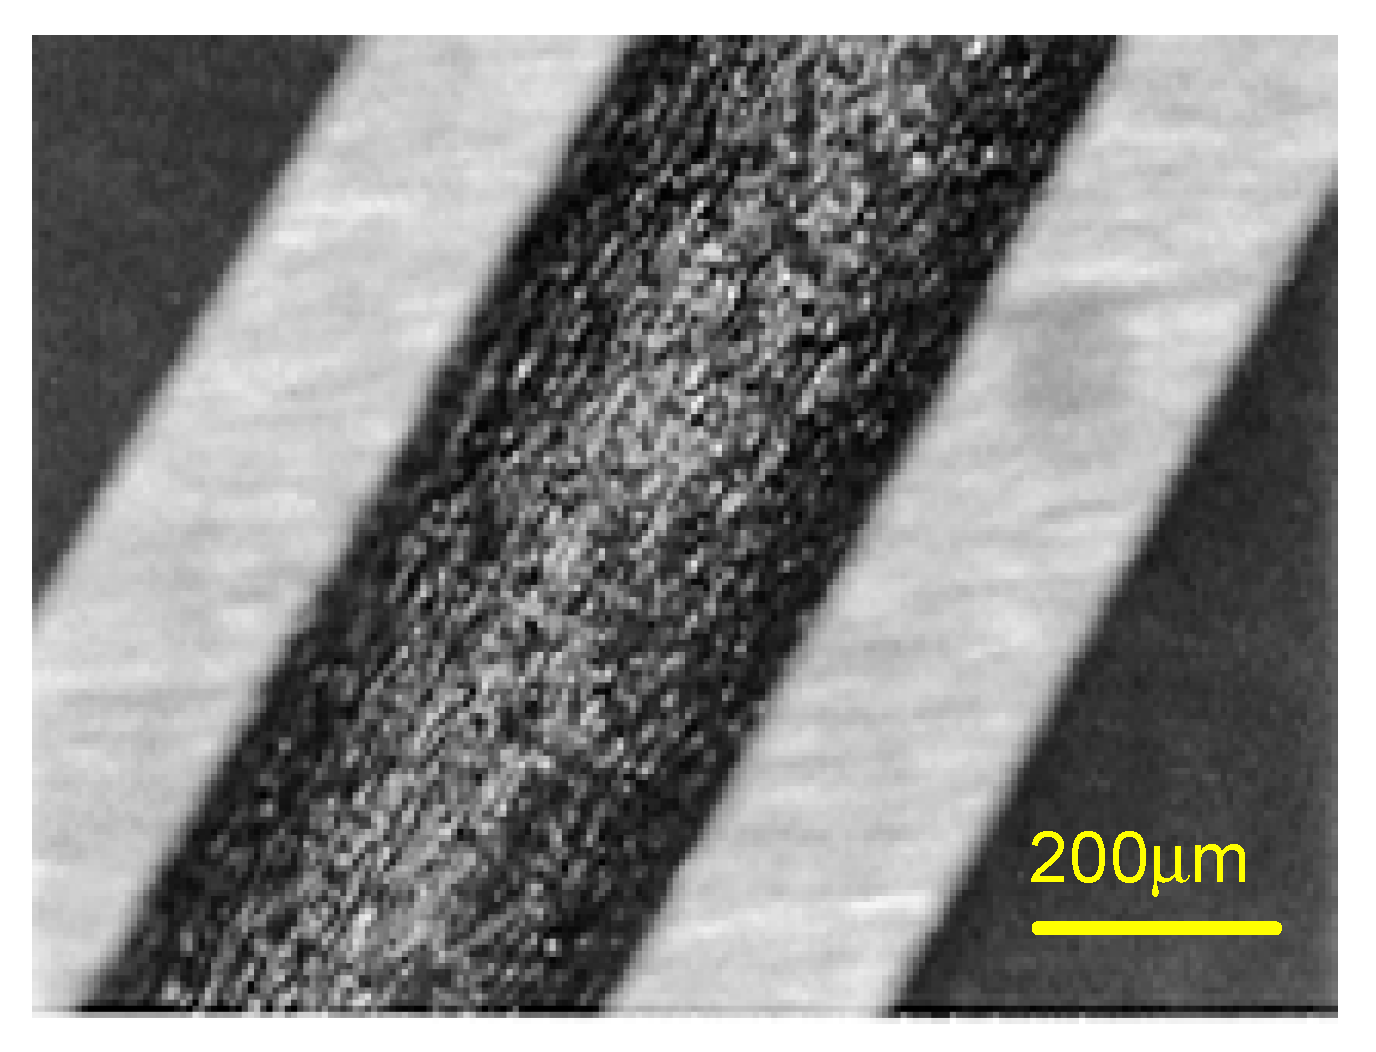
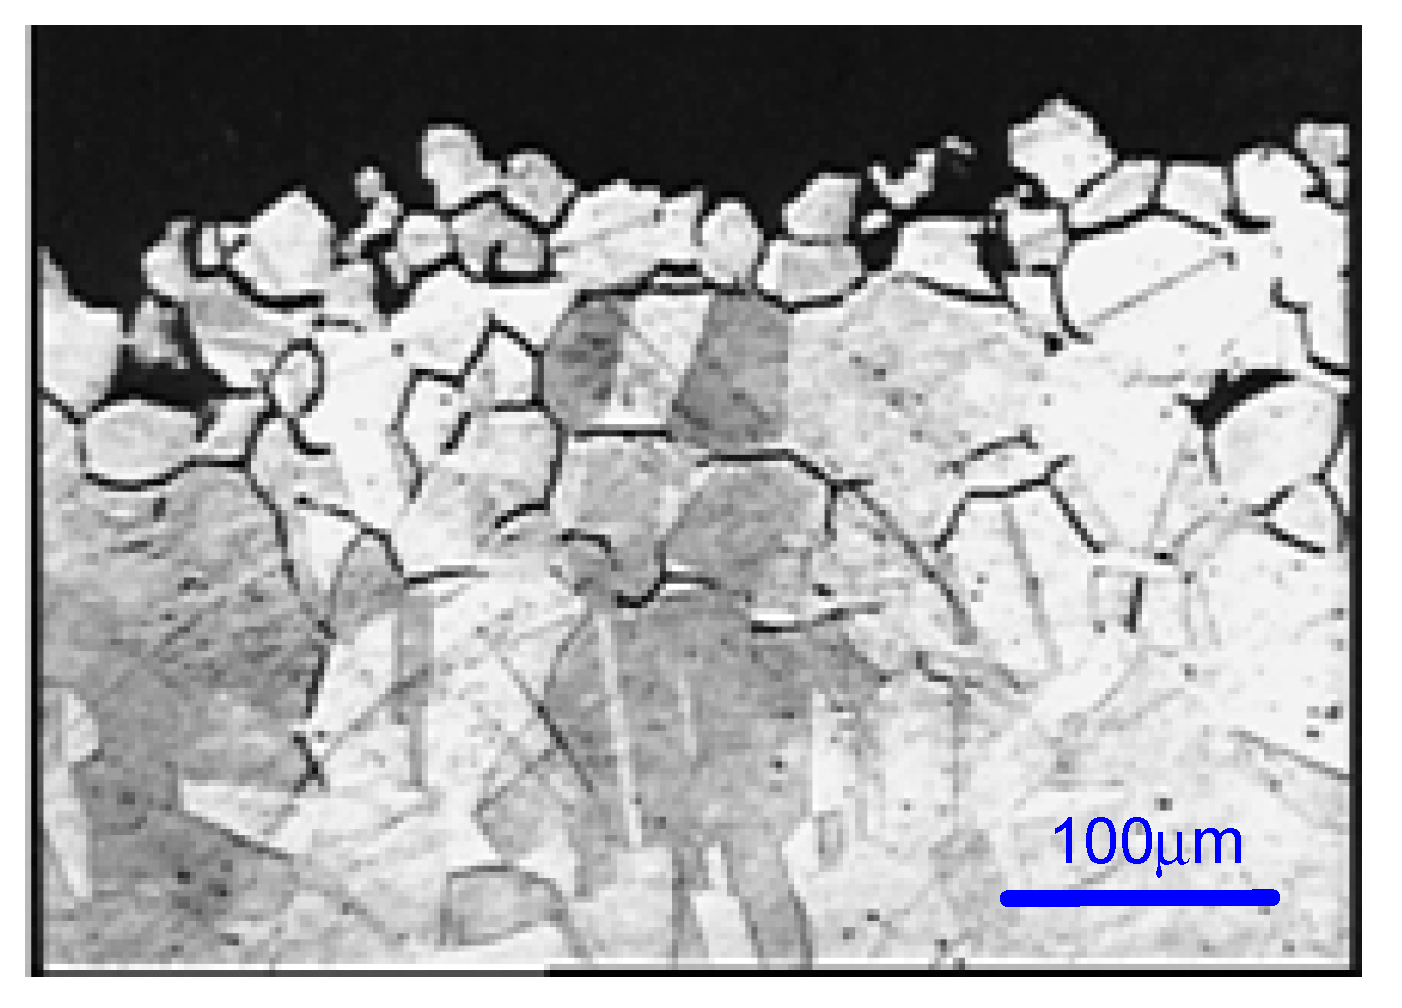
After completing the test, the examination of the interior of the tube showed corrosion signs. In case of each sample, a mass loss of about 40 mg/cm2 was determined (Table 8). An optical or scanning electron microscopy (SEM) examination was also carried out, for each sample (Figure 16). The metallographic section from the external part of the corroded tube had a structurally disturbed surface area to a depth of about 70 μm (Figure 17).
The Strauss test clearly and unequivocally showed that the 316L steel tubes were sensitized to intergranular corrosion. The corrosion rate was higher on the interior compared to the exterior.
The energy-dispersive X-ray spectroscopy (EDX) analysis of the corroded areas showed the presence of elements which did not belong to the alloy: sulfur, chlorine, calcium, sodium, aluminum and potassium. These elements most likely resulted from lubricants formulated as additives or base oil. The sensitization to intergranular corrosion was probably due to the pyrolysis of residual oil present on the tube surface—in other words, poor cleaning during the manufacturing process.
3.4.2. Electrochemical Tests: EPR Method ASTM G108–94 (2015)
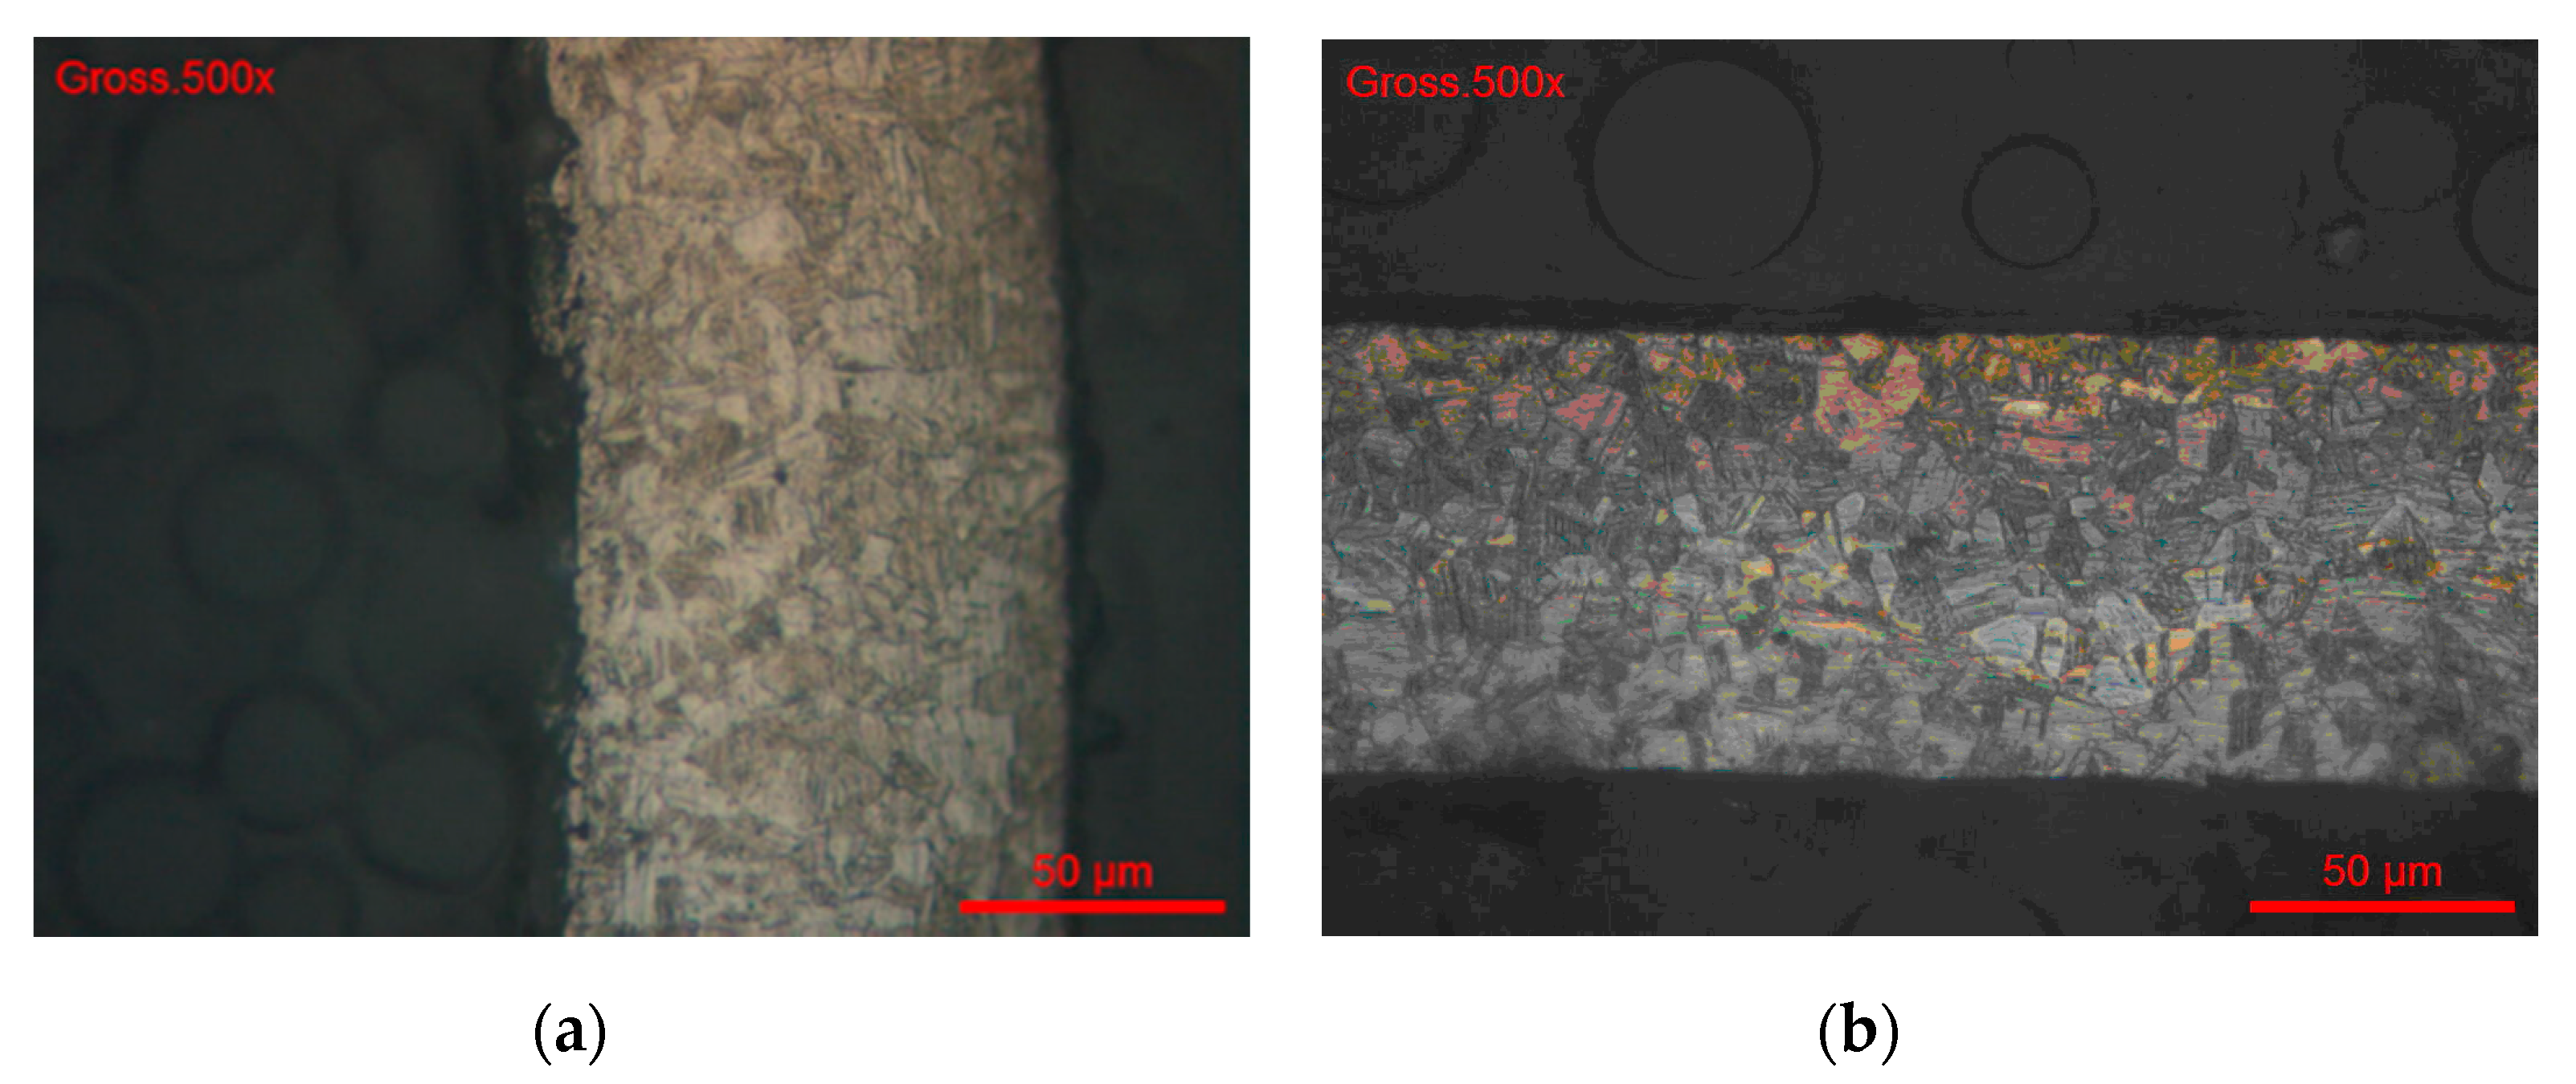
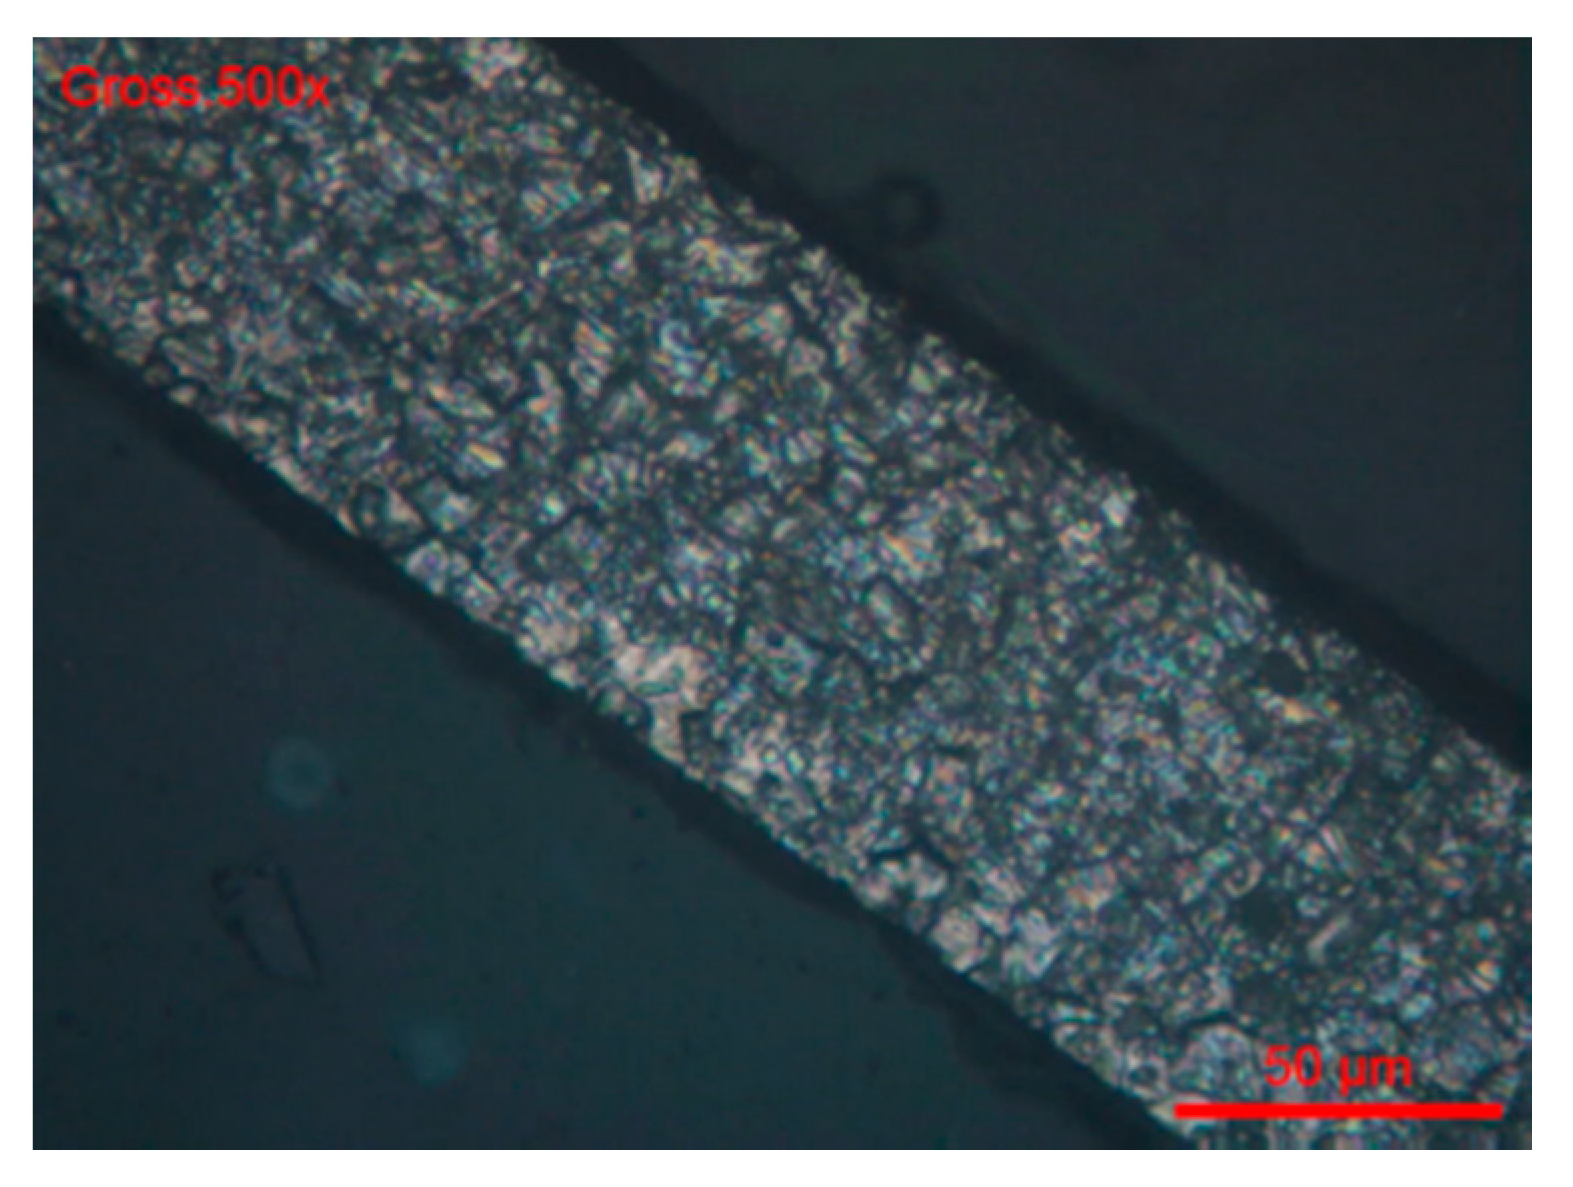
Electrochemical Tests were carried out according to the EPR Method ASTM G108–94 (2015) [48]. The grain index was determined according to the ASTM E112-13 method [49] (Figure 18 and Figure 19).
Grain index values are given in Table 9.
According to the EPR method ASTM G108-94 (2015) [48], after the cyclic polarization scans, the evaluation parameter is the normalized charge (Pa), measured in coulombs/cm2, calculated with the formula:
where Q = measured on current integration measuring instrument (coulombs), normalized for both specimen size and grain size X = As[5.1 × 10⁻³e0.35G], where As = specimen area (cm2), G = grain index at 100× according to ASTM E112-13 [49].
Pa = Q/X
In the derivation of the equation, it was assumed that the Q value was the result of the attack on the specimen surface that was distributed uniformly over the entire grain boundary region of a constant width of 2 × (5 × 10−5) cm. This may not represent the actual physical processes.
The potentiokinetic electrochemical reactivation results are presented in Table 10.
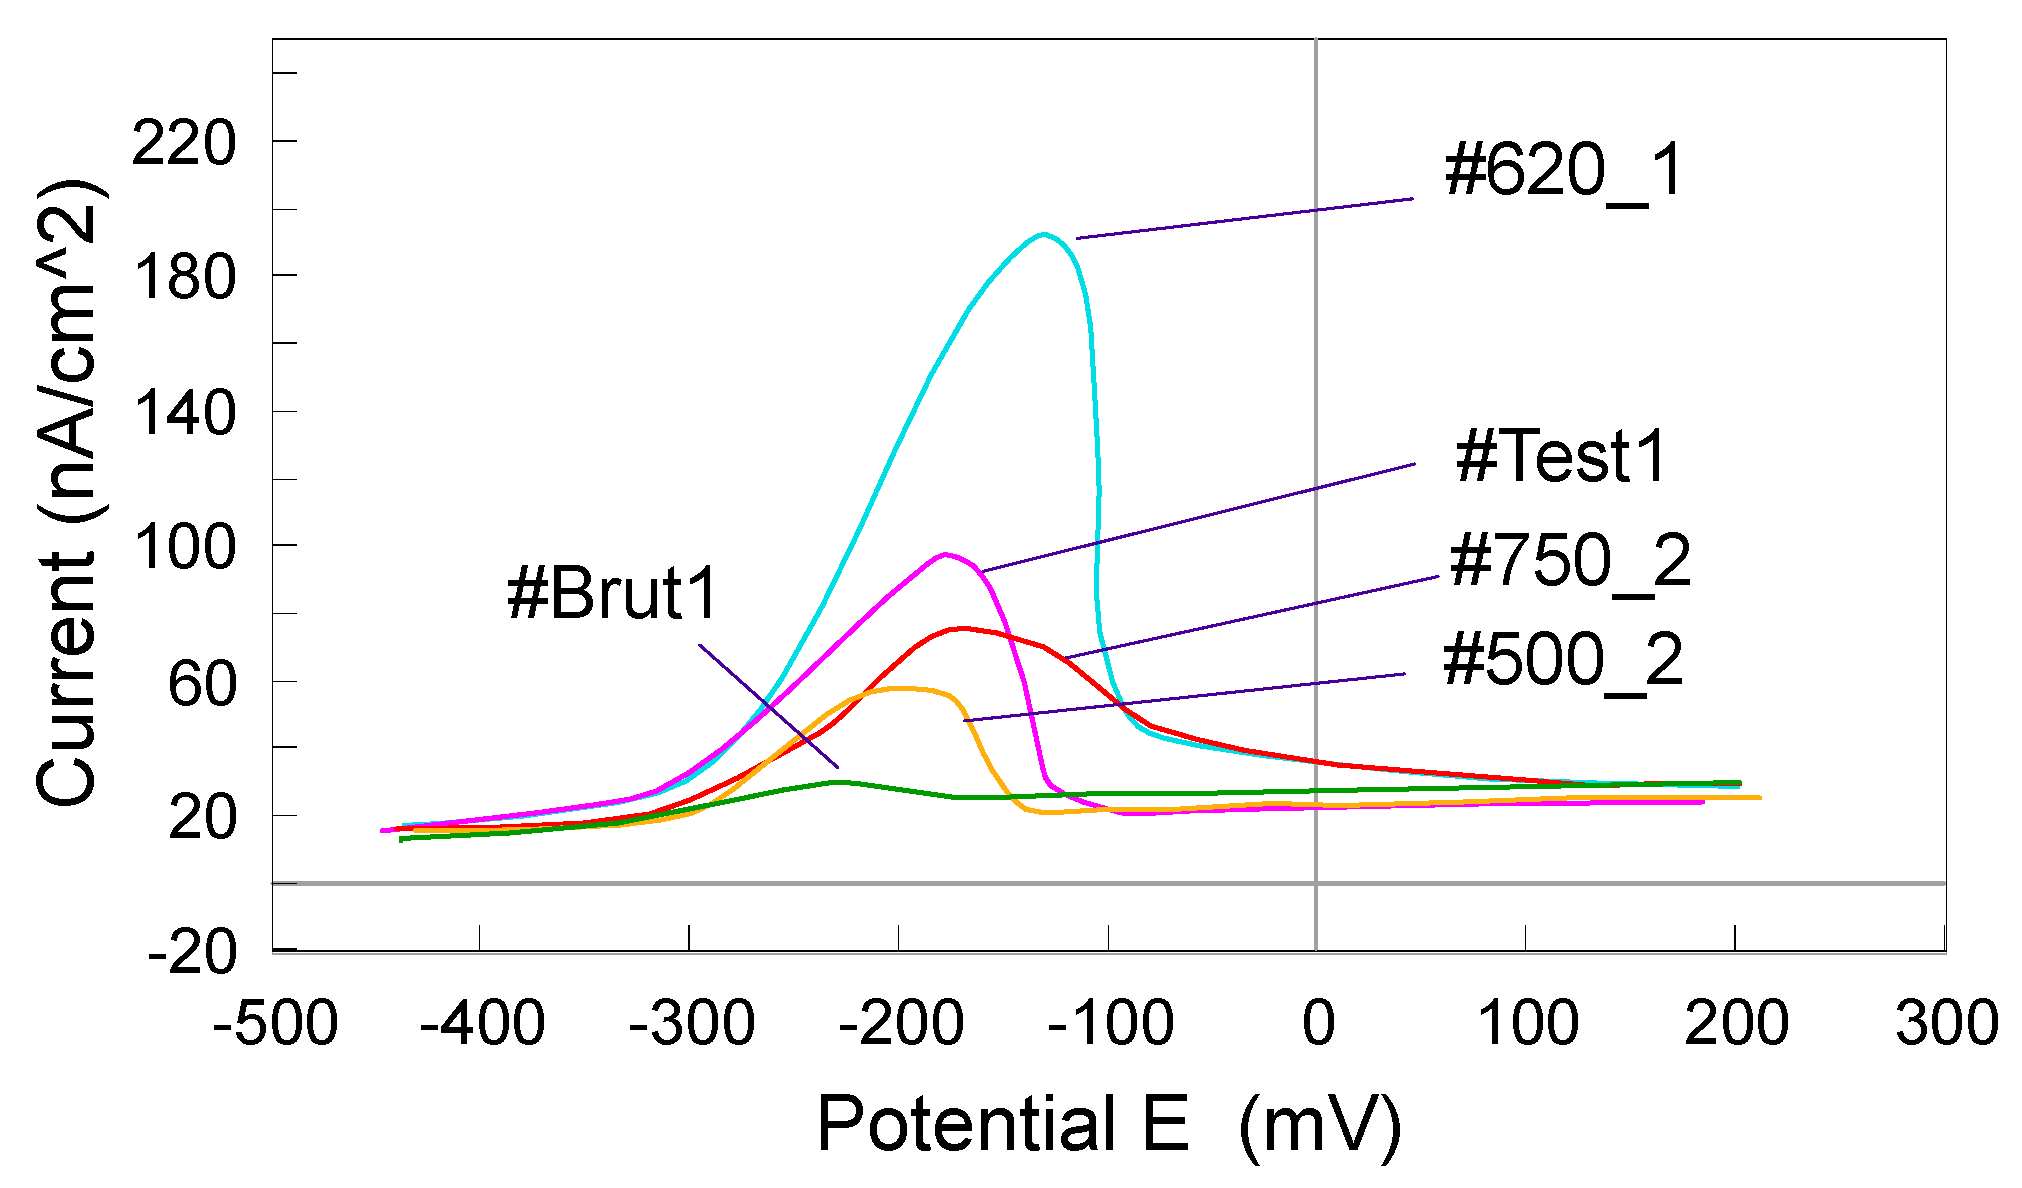
Figure 20 shows the potentio kinetic reactivation curves in linear axes.
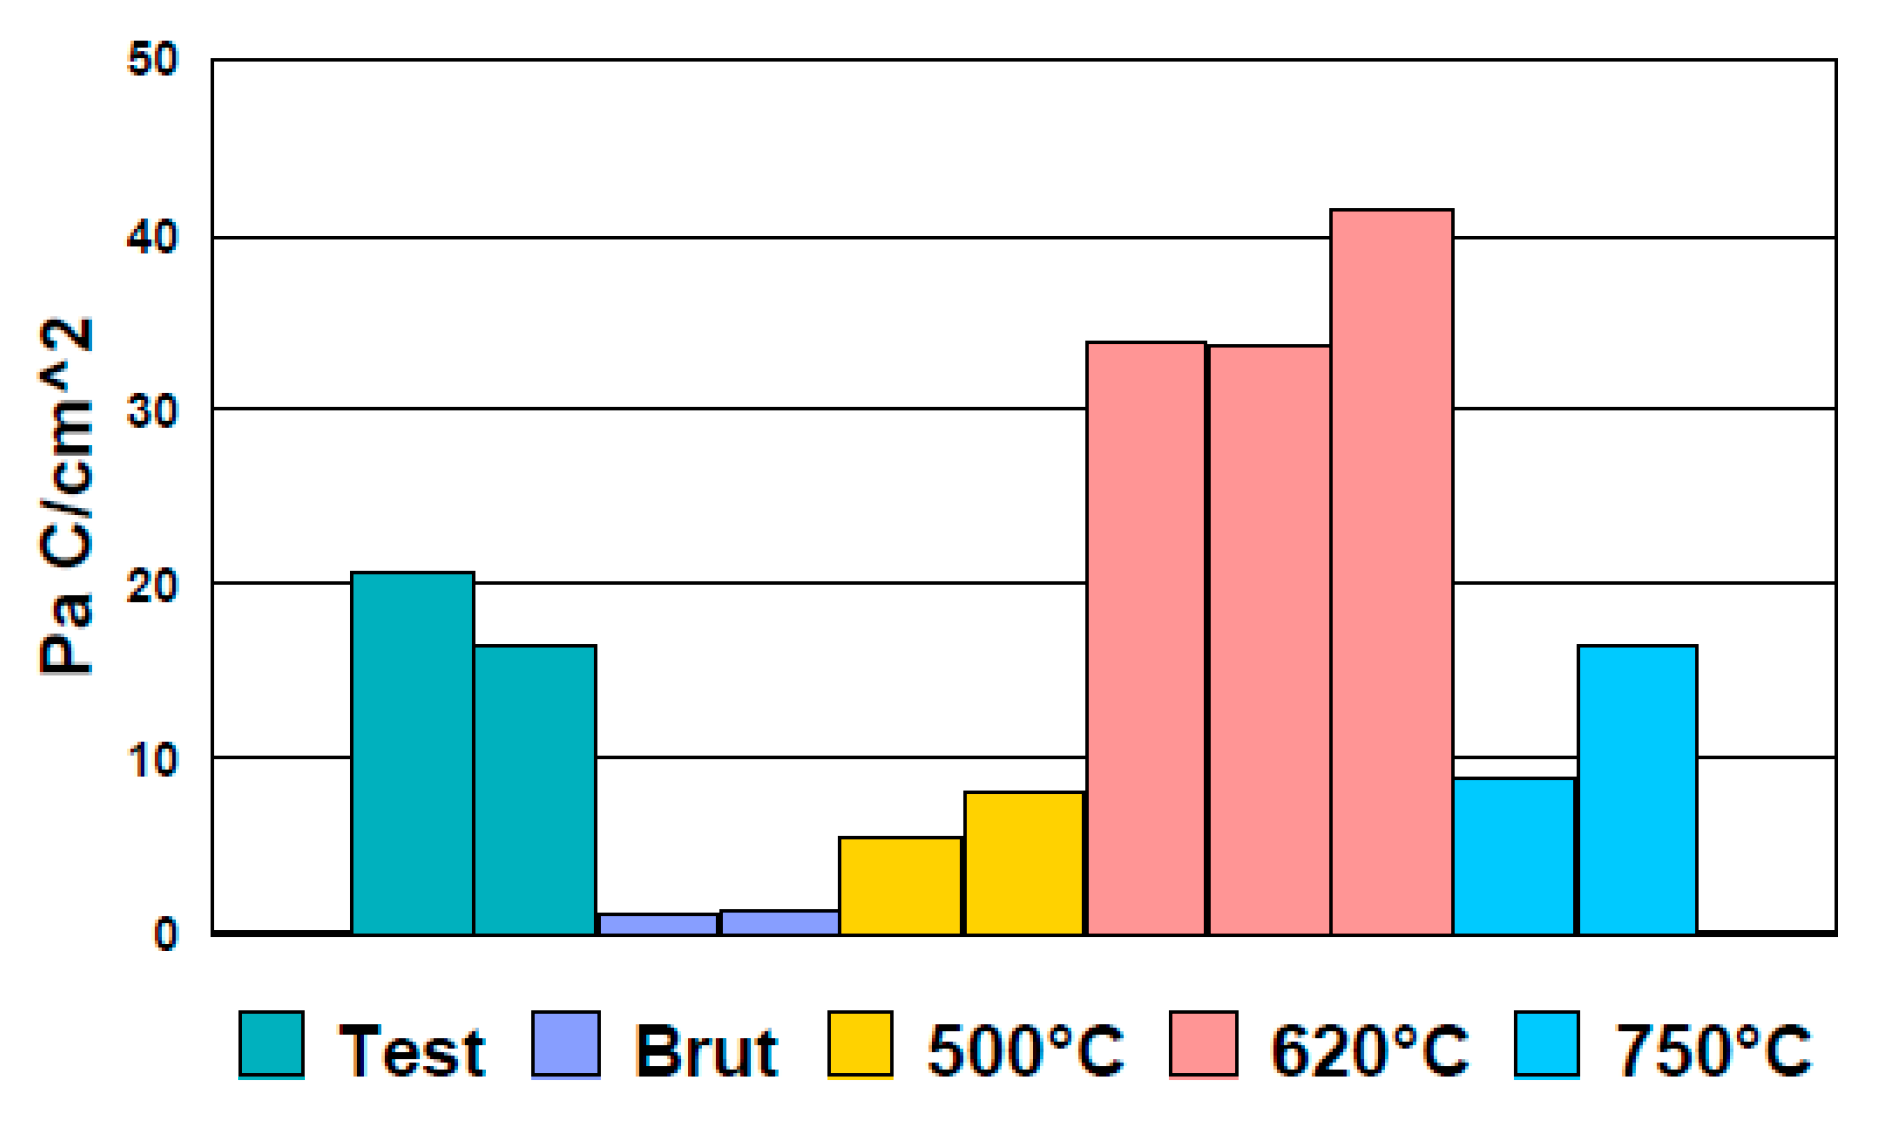
The peak valuesfor Ir, given in Table 10, were specific to the intergranular corrosion degradation of the tubes. The higher the intensity, the greater the degradation. Thus, according to Figure 20, it was noted that the highest sensitization of the tubes was generated by the heat treatment at 620 °C. The minimum sensitization corresponded to the 500 °C heat treatment. The overall results (Table 10) for the normalized charge (Pa) calculated (Figure 21) for all the samples indicated that the heat treatment over 500 °C for 304 steels is not indicated, the risks of inducing an intergranular corrosion process being obvious. Consequently, the 500 °C heat treatment should be used in the manufacturing process.
Type 304 steel was more sensitive to intergranular corrosion compared to other steels. Consequently, in the manufacturing process, great importance must be given to this type of corrosion morphology. The temperature of 620 °C was critical for generating the process and therefore used in the ASTM tests (A262-15 and G108-94) for evaluating intergranular corrosion. The goal is to near the behavior of the tube in raw state (#Brut 1).
The susceptibility to intergranular corrosion of stainless steels is not always due to heat treatment with precipitation of chromium carbides. Under certain conditions, the precipitation of intermetallic compounds of (Fe, Cr)Mo2 or (Cr, Ni, Fe)3P2 type can occur. According to Stonawská et al., the structural sensitization of 316 L steel is due to the precipitation of secondary phases along the grain boundaries [59]. The studies of Liu et al. regarding 316 L steels [60] and Fujii et al. [61] regarding 304 steel, also supports this statement. According to Liu et al. [62], the chromium-depleted zones near grain boundaries represent the corrosion nucleation sites for austenitic steels. According to Eliaz, since the carbon content in 316 stainless steel was lowered in the 316L and 316LVM grades, sensitization of this steel is less problematic as it used to be [7].
3.5. Galvanic Corrosion
Table 11 presents the corrosion potentials measured in artificial sweat (EN 1811-2011+A1:2015) [50] for the precious alloys and austenitic steels. The measured potential values enable to establish a relative comparison of the alloys nobility in the considered medium and to construct a galvanic series. Higher potential values mean higher corrosion resistance. The alloys series with higher negative potentials (anodic) generally tend to undergo greater corrosion in the event of a galvanic coupling, while other metals (cathodic) will generally undergo a reduced attack. According to Mansfeld and Kenkel, the corrosion potential of each alloy is a criterion in the analysis of galvanic corrosion behavior, but it is still insufficient. The electrical potential values can only indicate a trend and state absolutely nothing about the rate of corrosion and the type of control of the galvanic cell (mixed, cathodic or anodic) [63,64].
The most frequent cases we encountered are precious metal-austenitic steel assemblies in watch straps. Thus millions of gold-steel links are produced to assemble straps, this is the ideal case for the formation of a galvanic cell, a significant difference in electrical potential being involved. In the case of gold-steel, a difference in electrical potential of around 300 mV can be calculated.
According to Gilbert and Mali, while corrosion per se may not be of great concern, when combined with mechanical effects, restricted crevice-like geometries or any combination thereof, considerably amplified corrosion rates might arise [65].
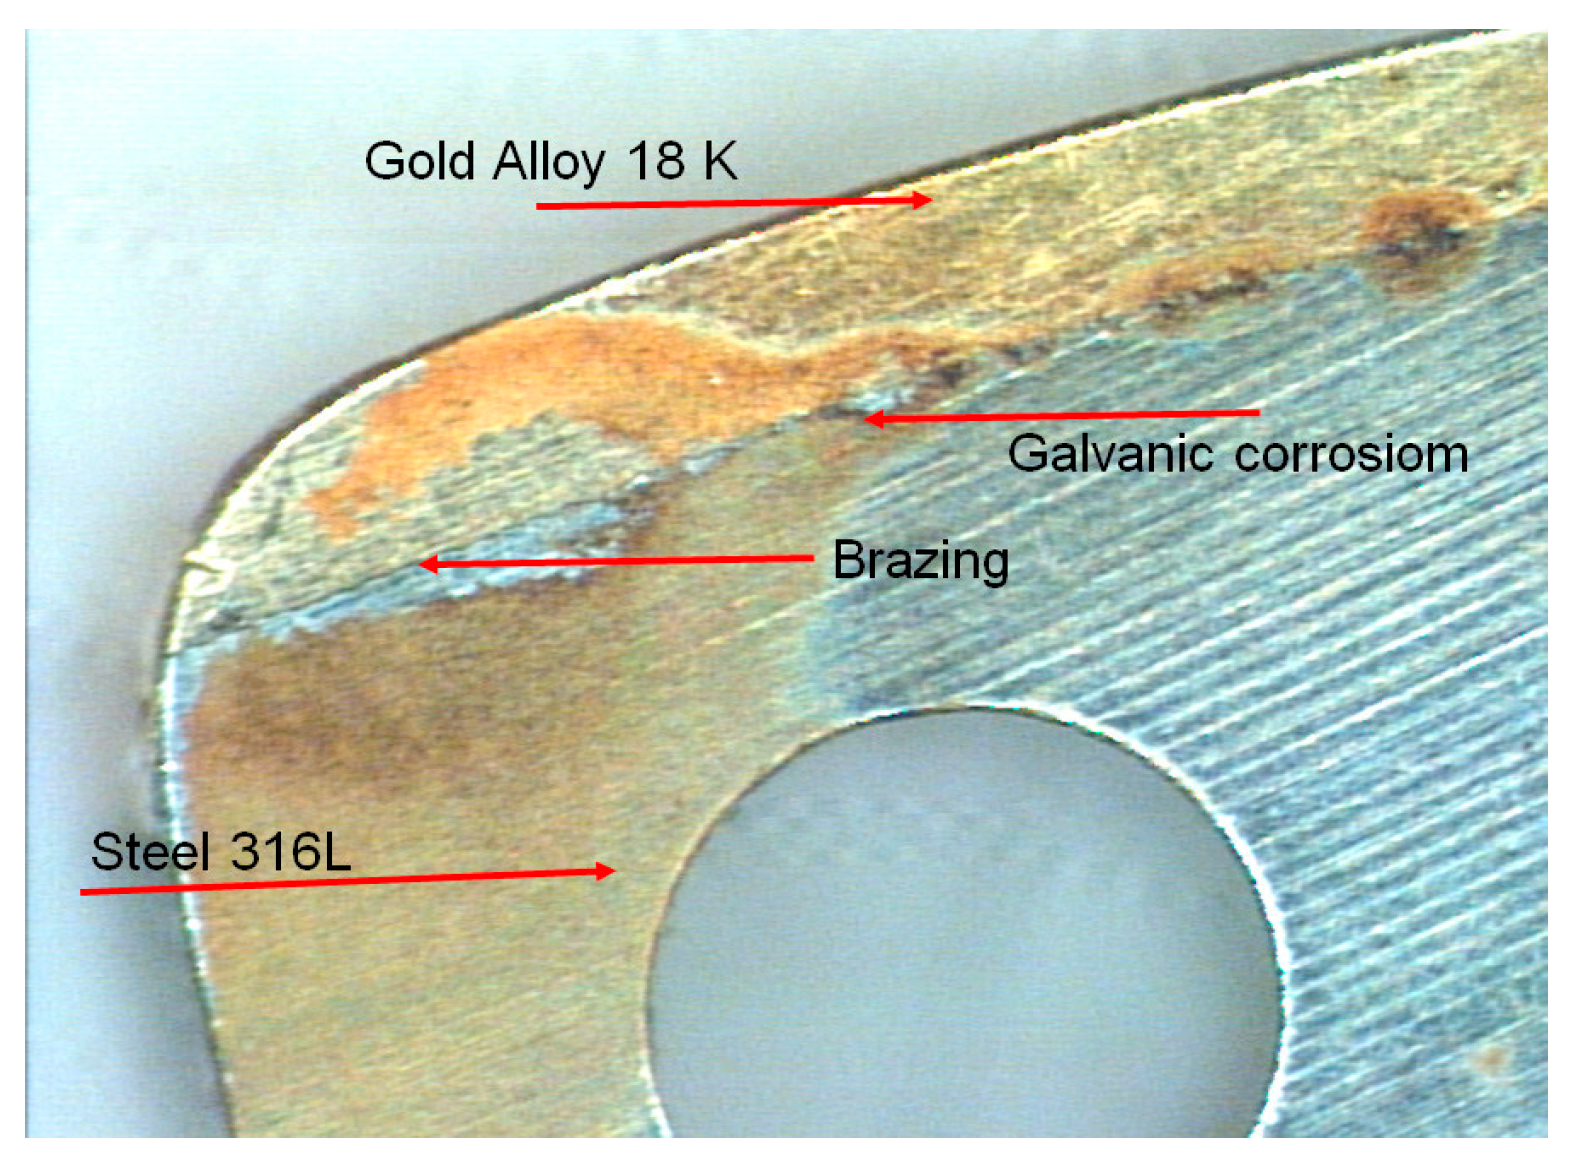
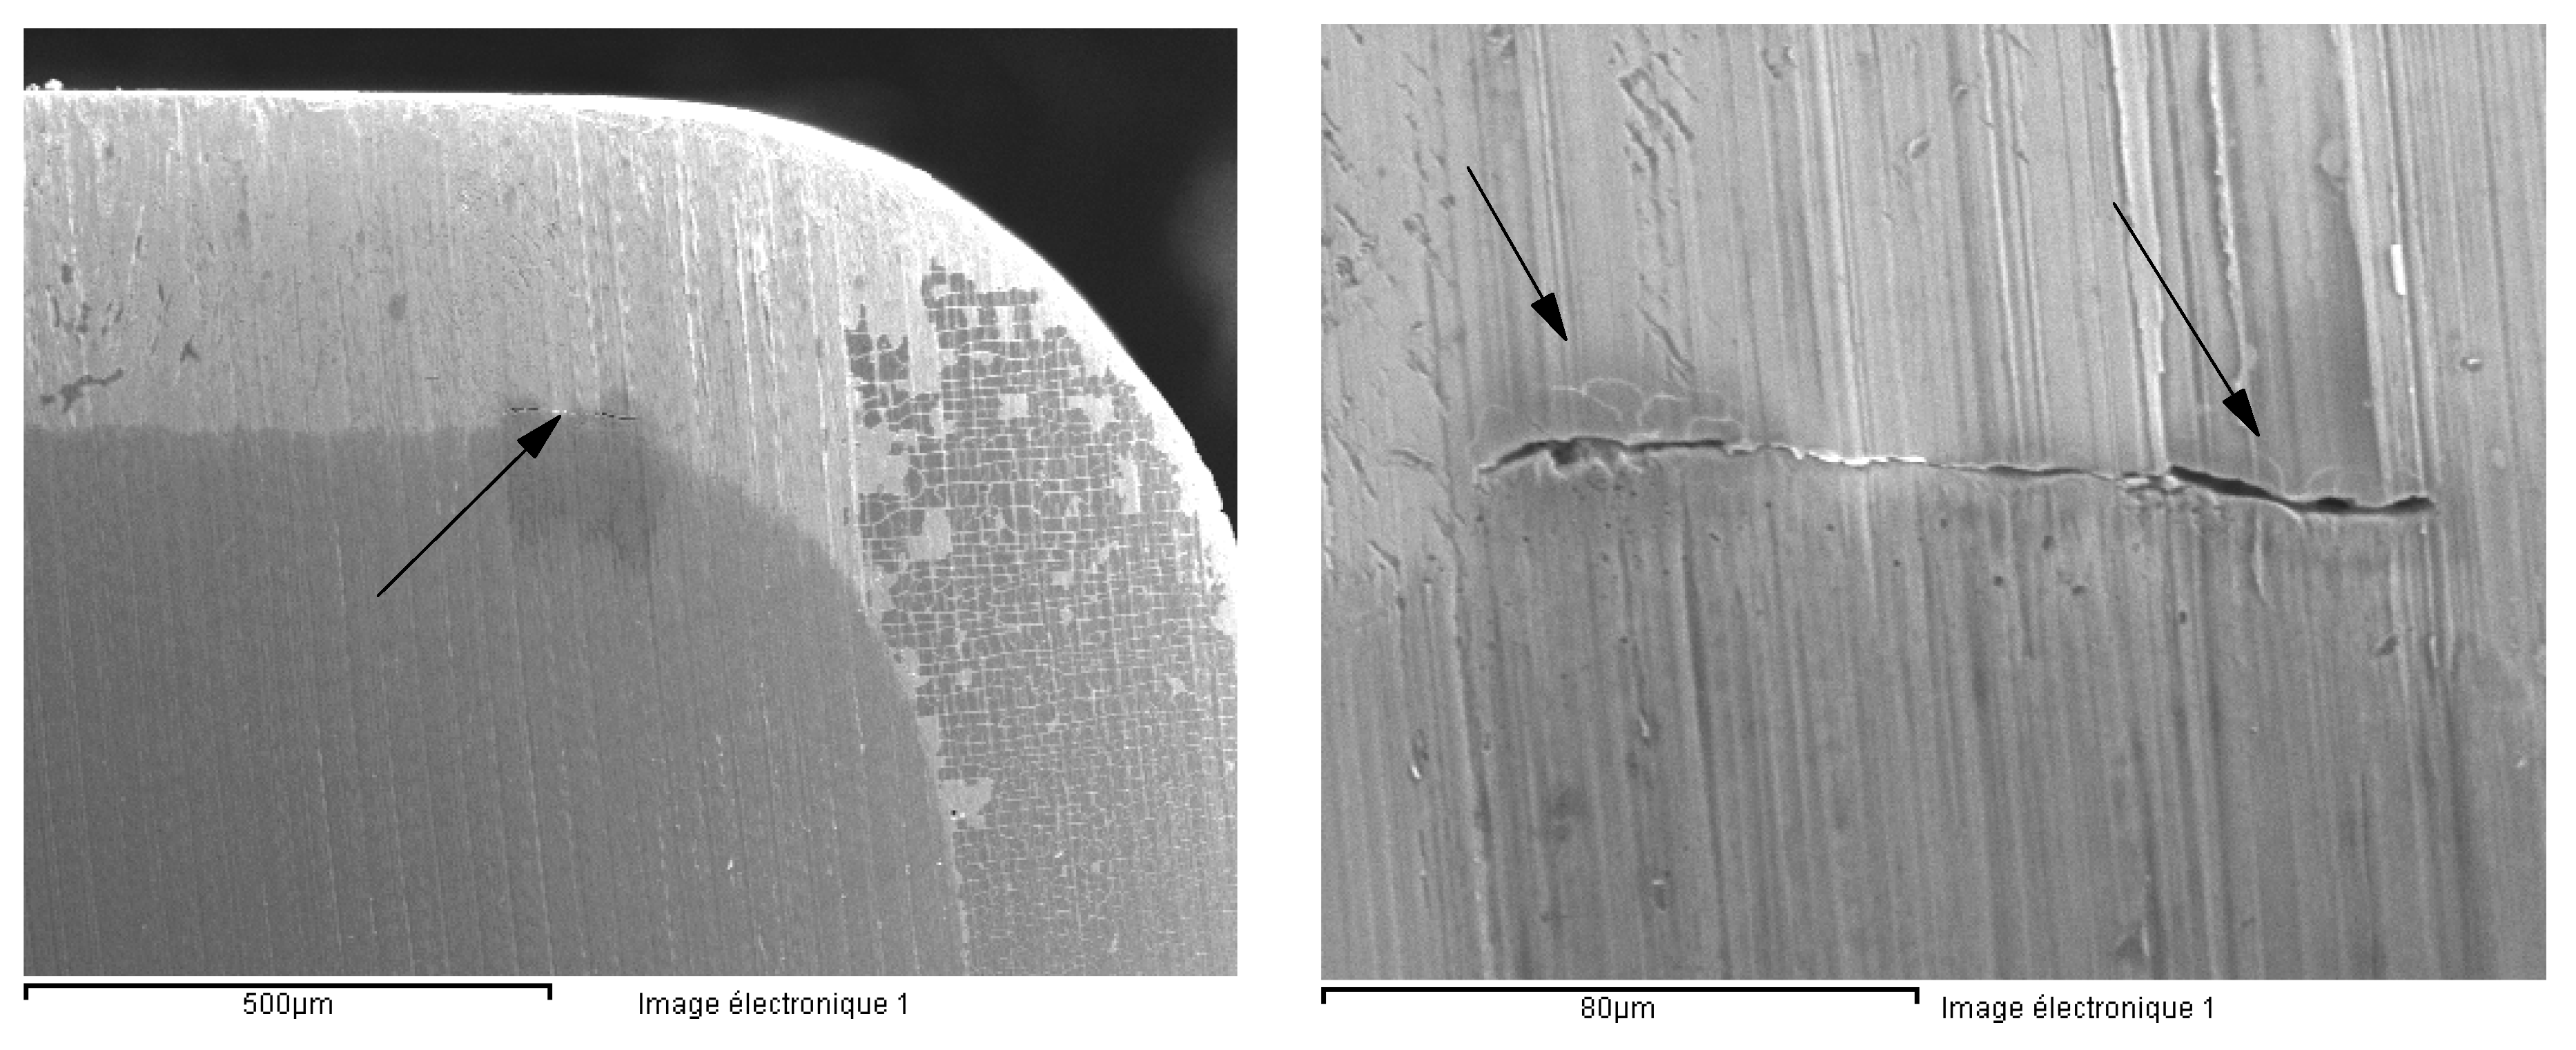
One of the several available techniques to realize the gold-steel assembly is brazed gold caps. The brazed gold caps reveal a particularity due to brazing. The solder acts as the anode (a small area) and the steel and gold parts are the cathode (large area). Thus, the corrosion process results in the dissolution of the solder (Figure 22 and Figure 23). In such a type of assembly it is particularly important to make the right choice of solder.
Two aspects of great importance have to be considered:
- (a)
- The cathode–anode relationship. The precious metal surfaces will act as the cathode, and the less noble parts will be the anode. Constructions with large cathode surfaces and small anode surfaces are very dangerous. The galvanic cell will output a strong anodic current which will lead to the rapid degradation of the anodic part by mechanisms of crevice or pitting corrosion;
- (b)
- The nickel release in contact with the skin has to be considered as the current legislation tolerates an amount of 0.5 µg/cm2·week.
Table 12 presents a series of tests carried out on the same types of gold-stainless steel links. The 14441/316 LM steel originated from five different steelmakers from the EU, USA, Japan and China.
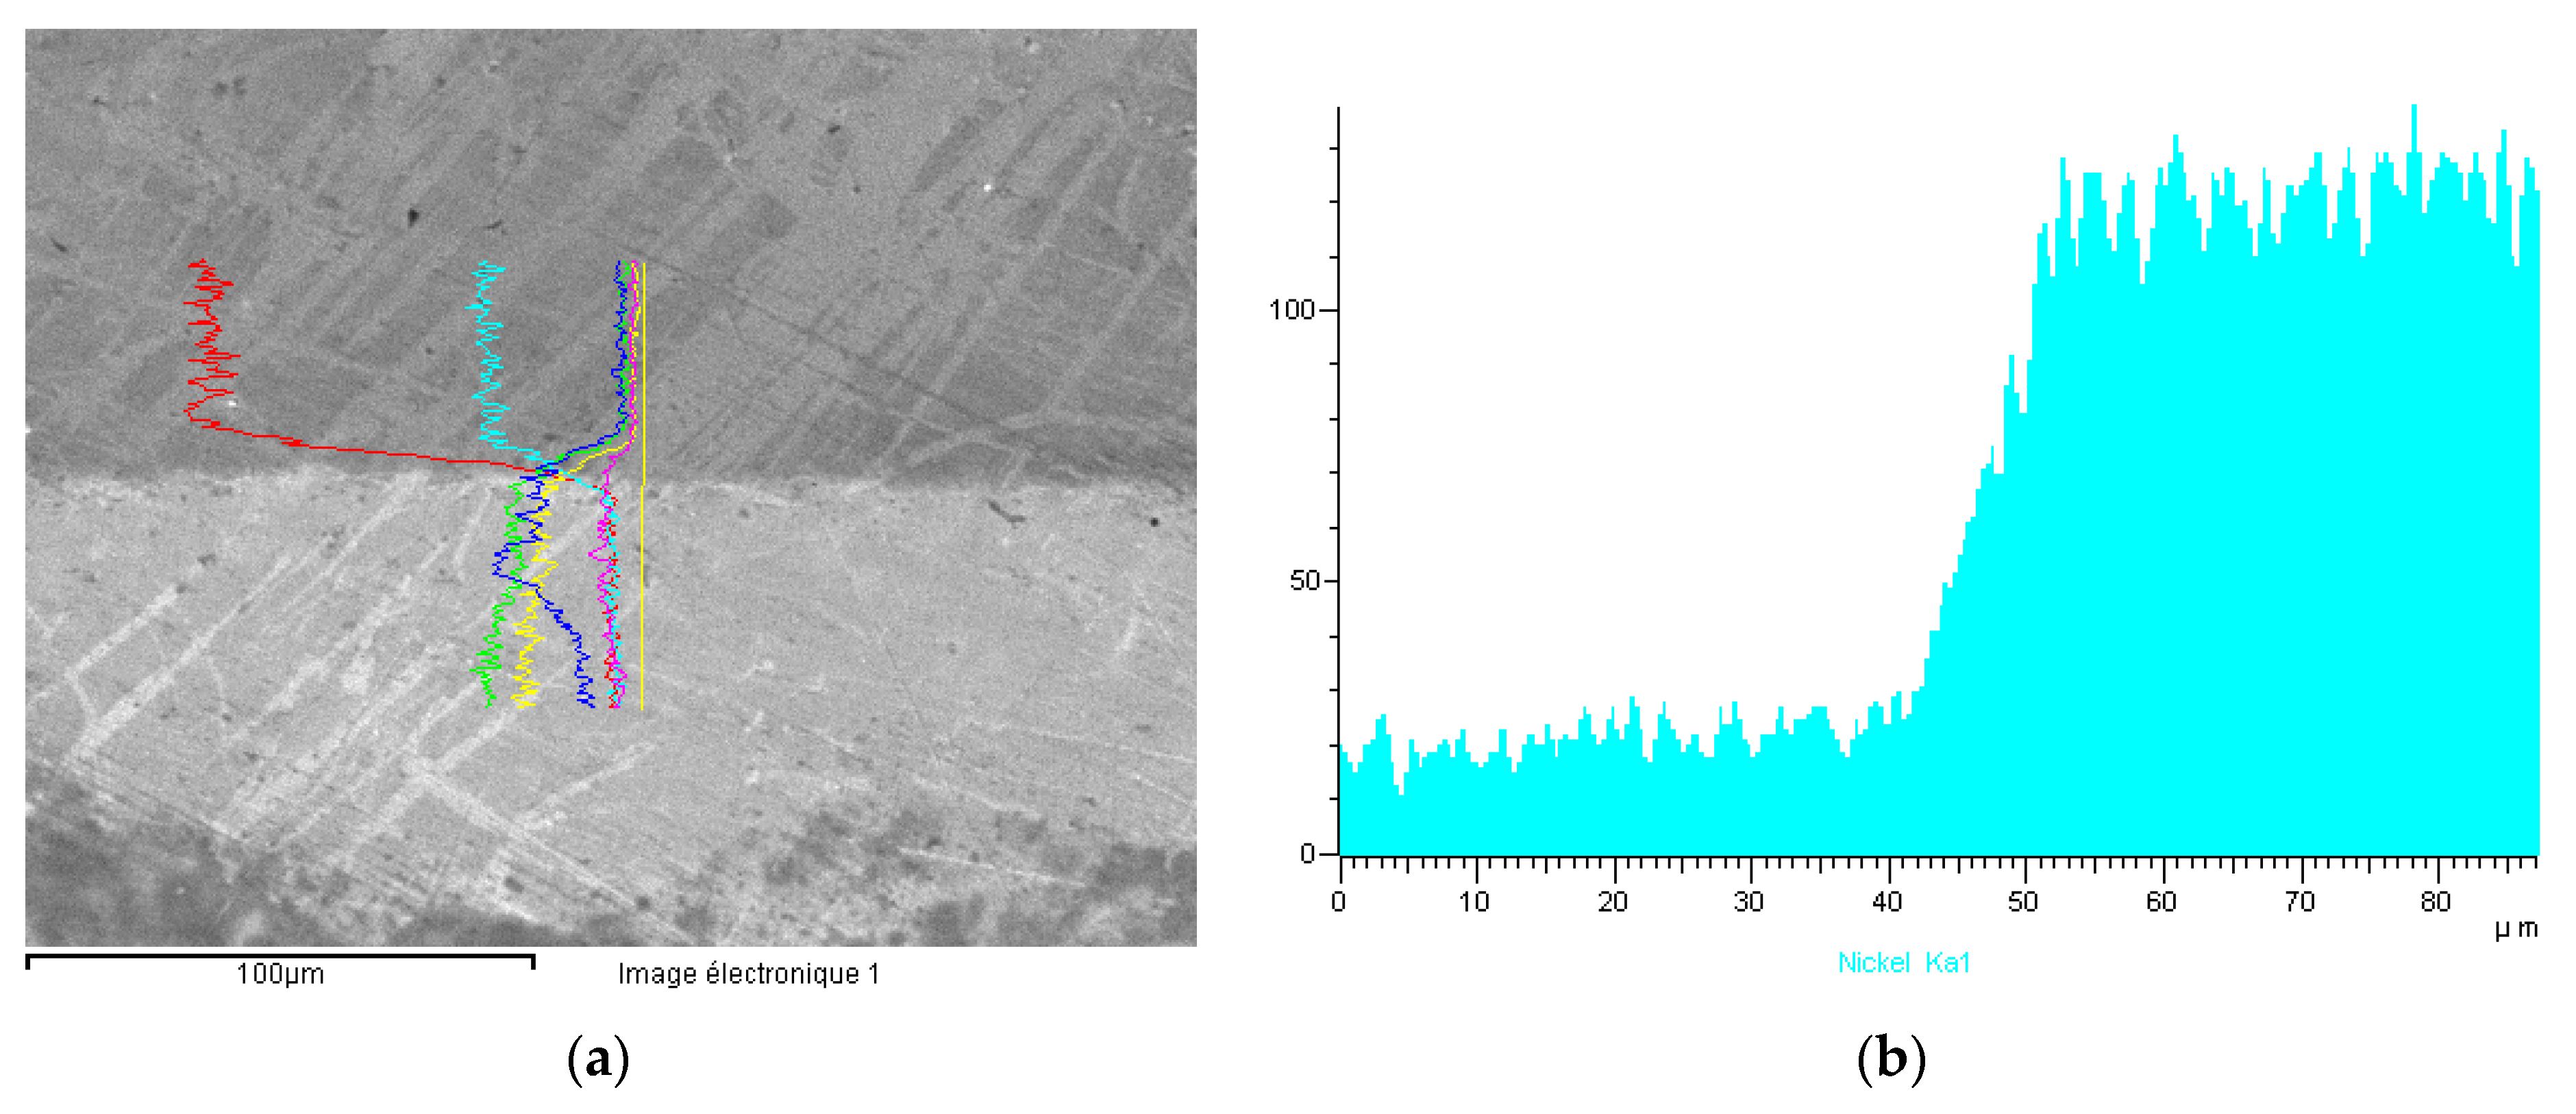
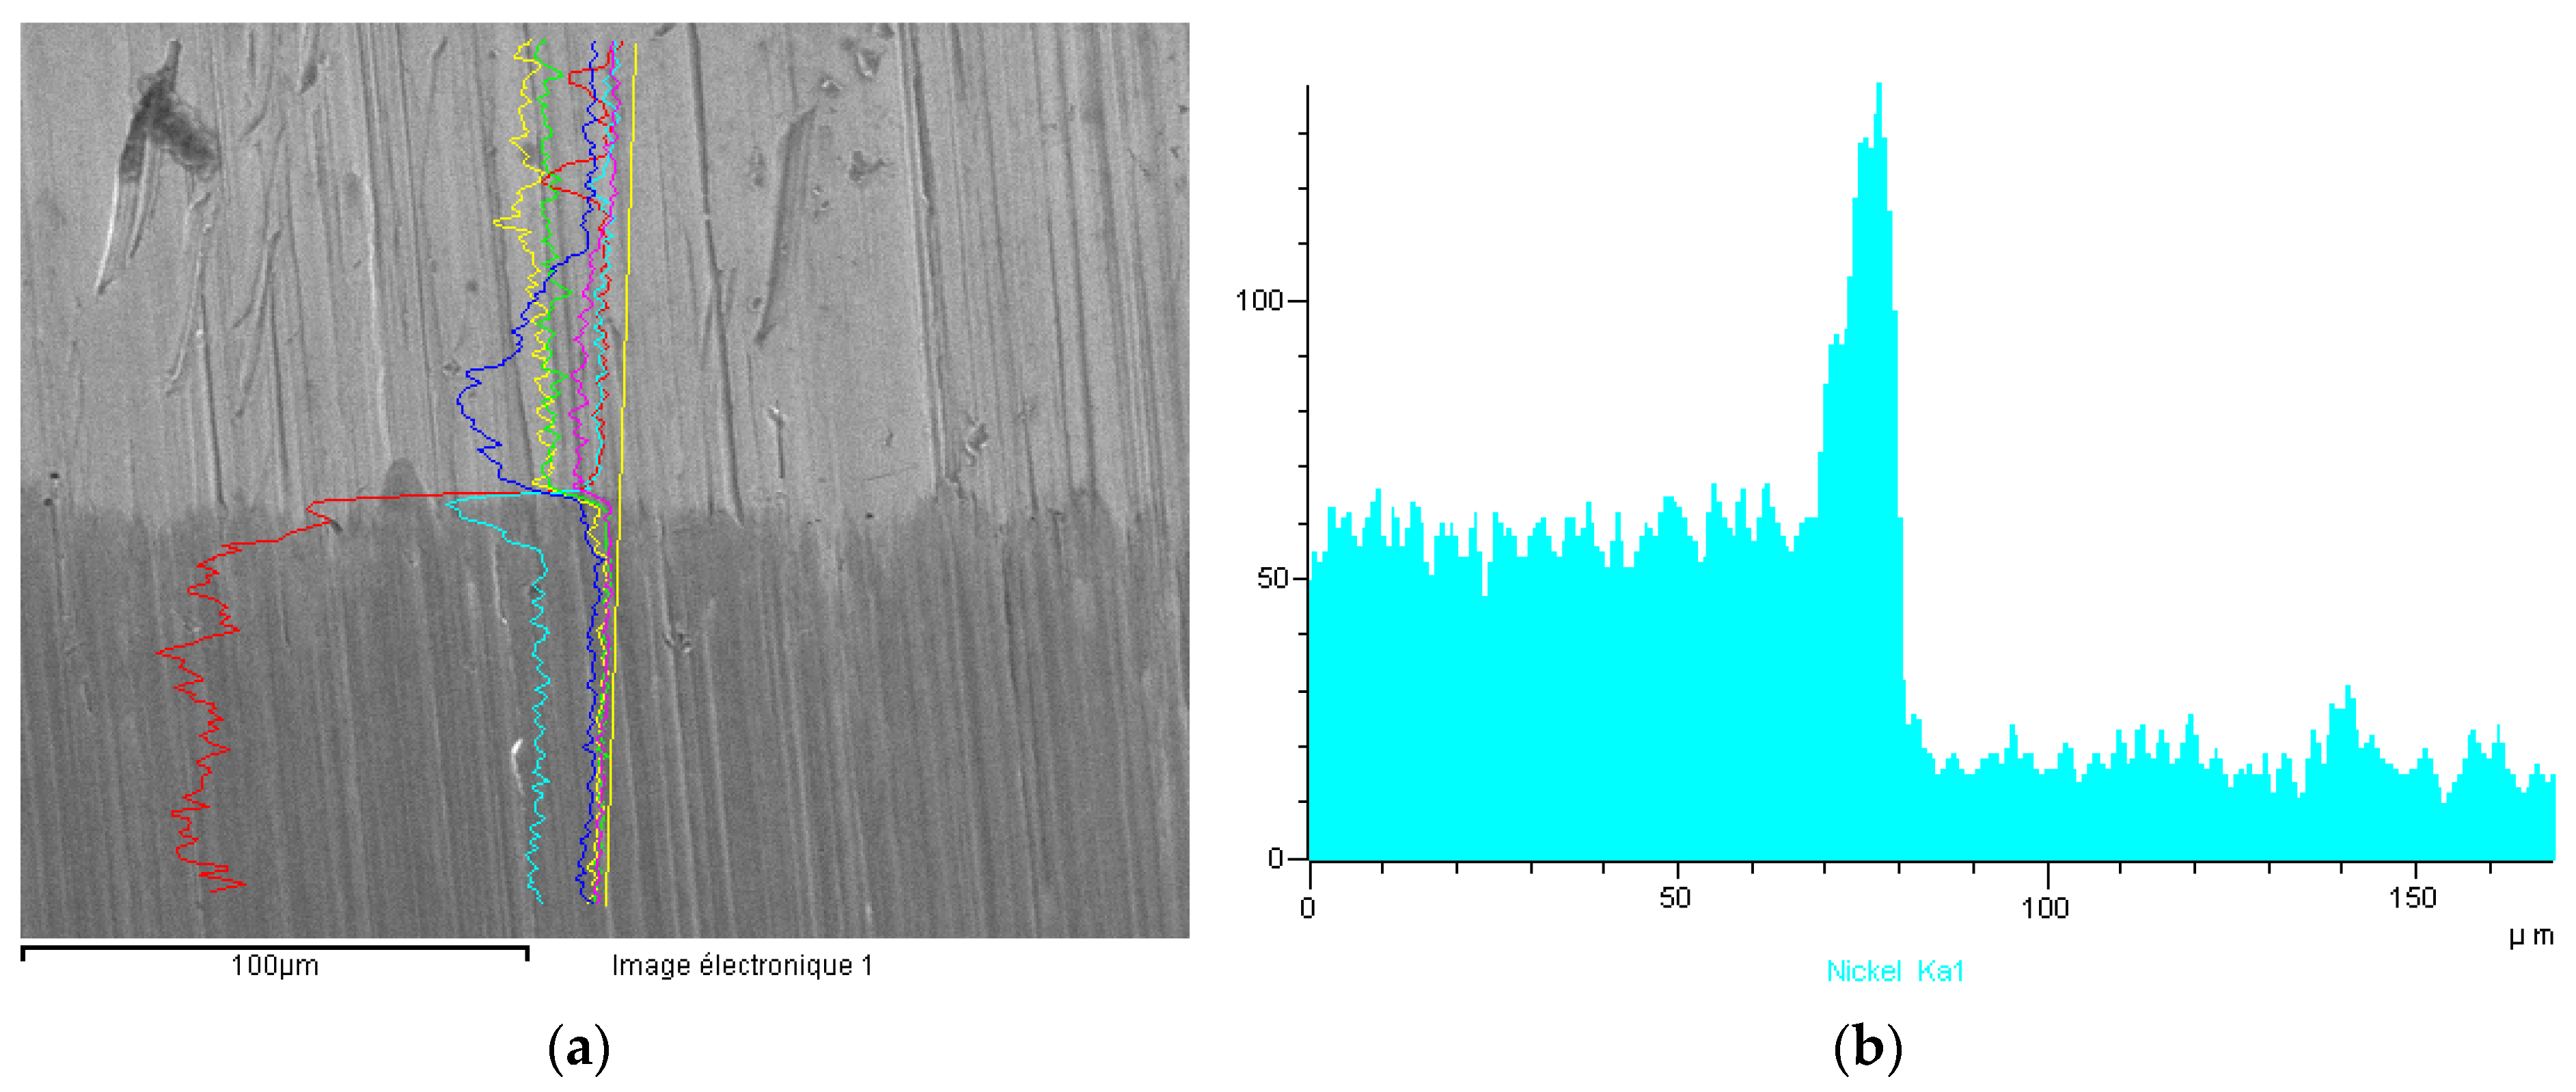
In case of #6 (gold-steel 904L), the nickel release was greater than 2 μg·cm−2·week−1, despite the absence of visible corrosion. This was due to a different behavior compared to a medical 316L steel. The comparison of the EDX profile between a gold-904L steel (Figure 24) and a gold-316LM steel (Figure 25) revealed a very different nickel profile with the disappearance of the nickel peak in the gold-904L steel solder (Figure 24). In the gold-904L system, the solder was in the anodic position (gold and 904L steel being cathodic), with a very unfavorable surface report. It revealed a selective corrosion morphology powered by a galvanic battery; this would explain the significant nickel release from the gold-904L steel coupling, despite the absence of visible corrosion.
SEM examination of sample #4 (5N18) showed that the corrosion was localized and did not develop at the level of the steel, but of the brazing, causing its dissolution (Figure 26). This demonstrates that the solder represents the weak point of the gold-steel assembly.
The steels which are being used for watch straps are of grades 316 and 904L. The other steel grades, such as 304, 304L, 316LS, and 316Ti, are not usable; their rate of Ni release does not respect the limits imposed by the EU directives, or other countries legislations (USA, Japan, China, Korea, Canada). The difficulty consists in eliminating the corrosion process and achieving a rate of nickel release which respects the legislation: max 0.5 μg·cm−2·week−1.
The use of a Ni-Cr-P solder involves the risk of increasing the nickel amounts by chemical dissolution or corrosion of the solder. In the case of a gold base solder (melting range 750–850 °C) the risk is to initiate corrosion in the steel; with a Ni-Cr-P based solder (melting range 800–950 °C) the risk is to start corrosion in the solder. To find the best compromise, testing the link assemblies is necessary. Because the quality of 316 LM steel is highly dependent on the supplier, most straps manufacturers use steels they have exclusivity for.
3.6. Nickel Release in Relation with the Manufacturing Process
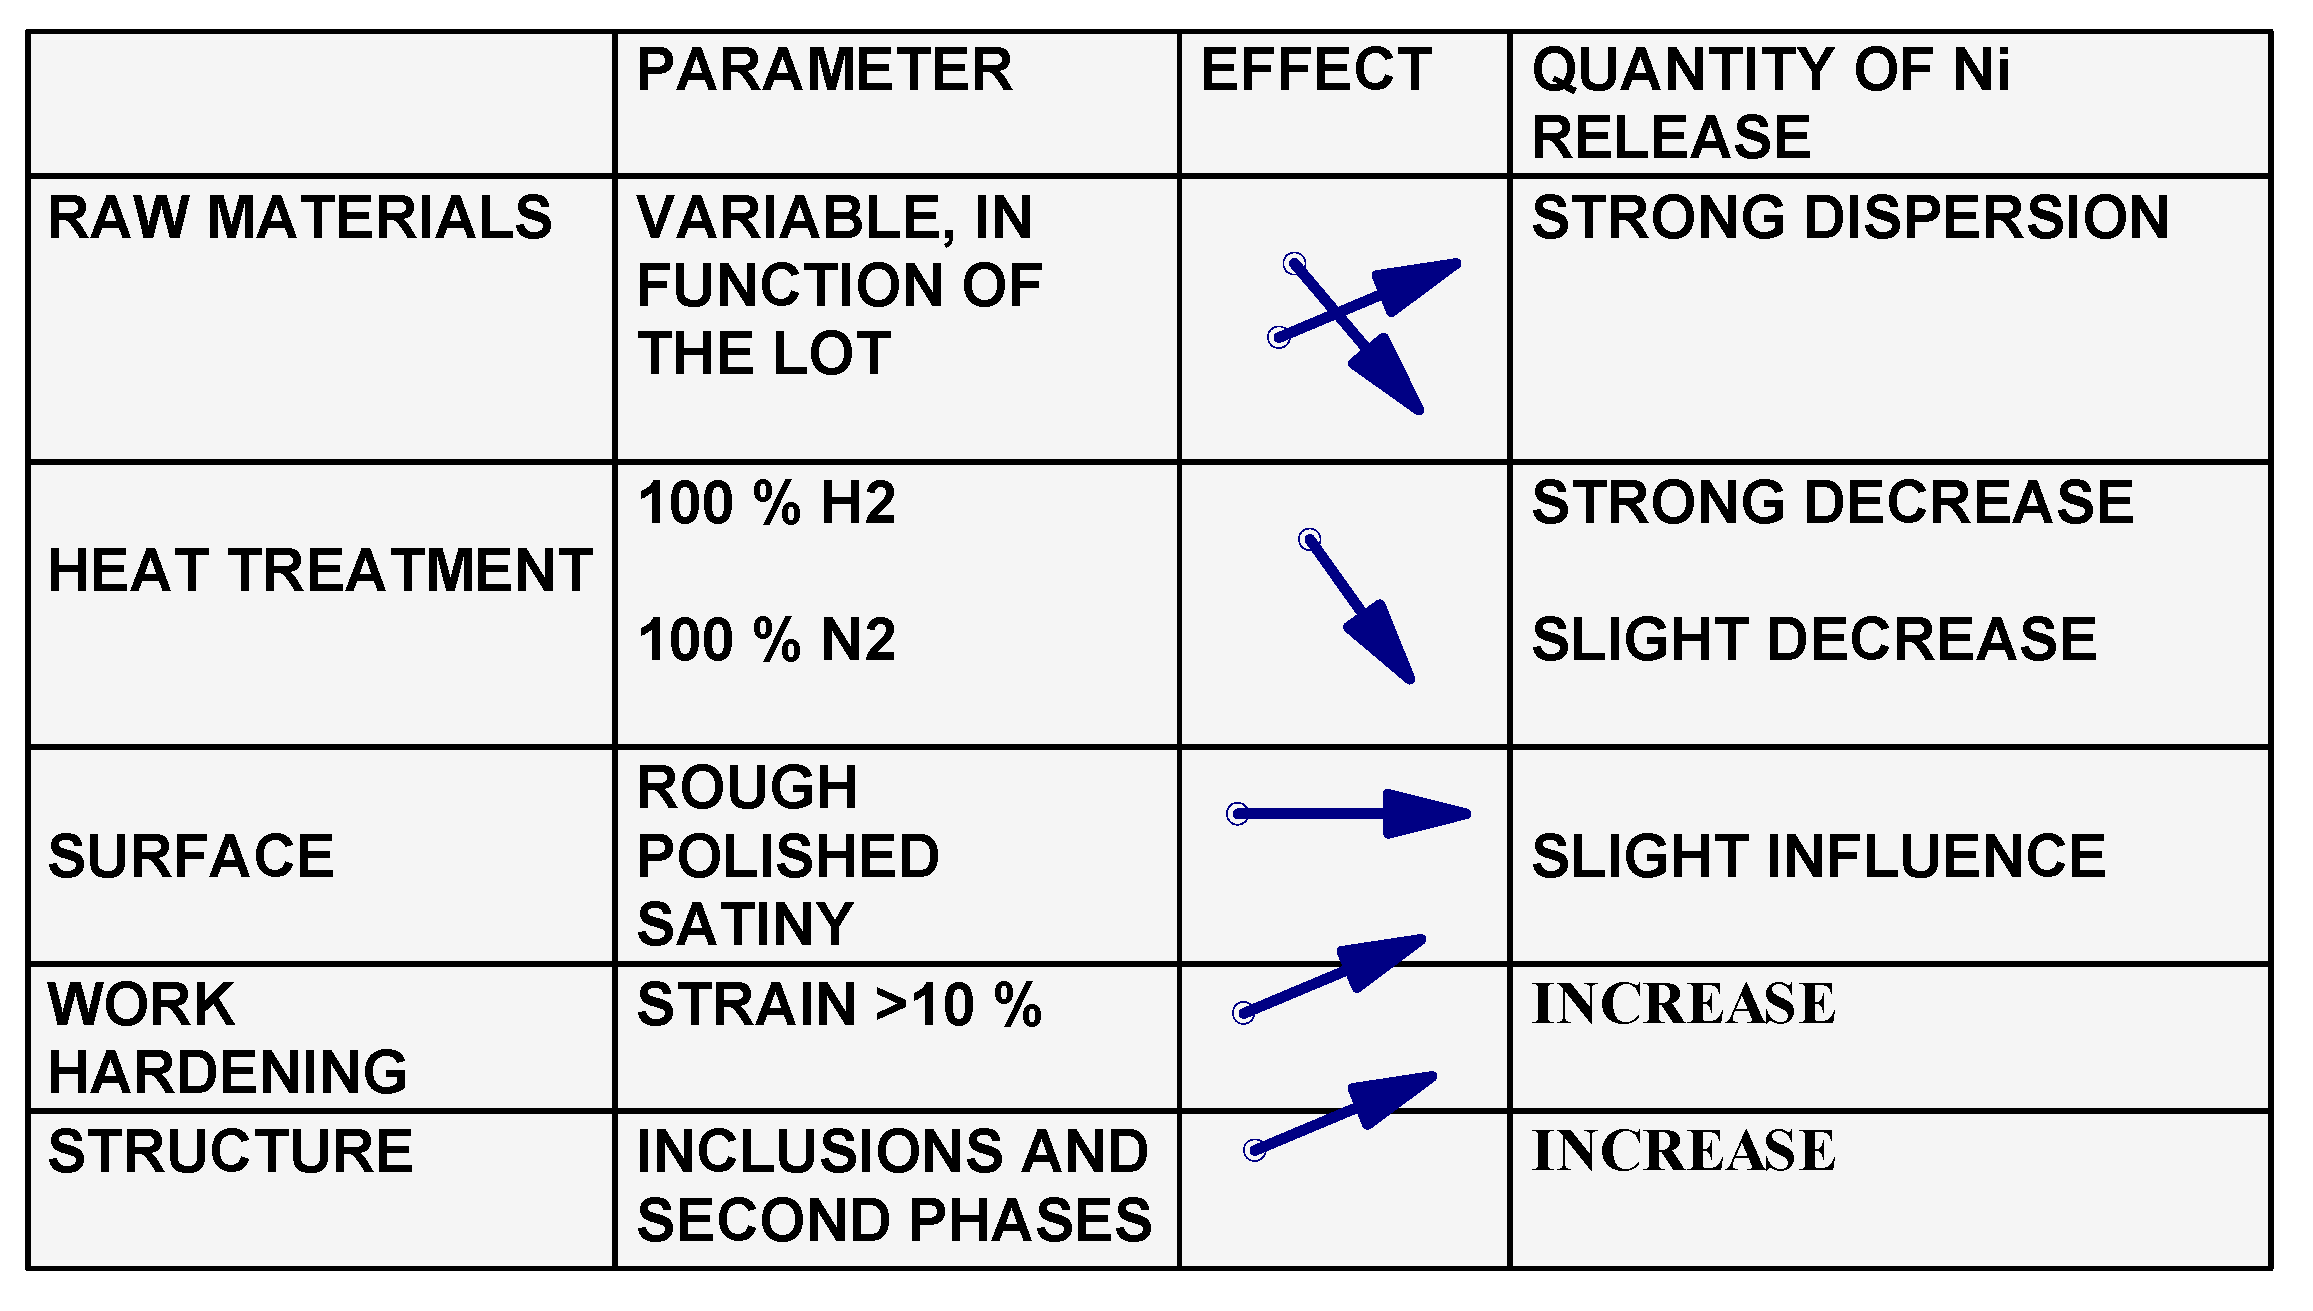
In our laboratories, a large number of nickel extraction tests in compliance with EN 1811-2011+A1:2015 standard [50] were carried out on the 316 L grades manufactured by five different steelmakers from EU, Japan and USA. There was a significant difference in the quantities of Ni released, compared to the chemical composition of steels, which depends on the steelmaker. The conclusions are presented in Figure 27. It should be pointed out that despite the fact that the grade of steel is in conformity with the classification standards, their behavior was markedly different from one manufacturer to another, due to production parameters, such as the casting volume, alloying additions, and deoxidizing agents.
The heat treatments resulted in a reduction of the nickel release rates. The surface state had little influence. On the other hand, the hardening processes strongly influenced the quantities of nickel released. The increase in hardness greatly decreased the corrosion resistance and increased the amount of nickel released. Another factor which strongly influenced the quantities of nickel released was the inclusion state and the existence of secondary phases in the structure of steels. Being aware of these causes, subcontractors demand from the steelmakers a very strict specification respecting in the manufacturing of steels.
4. Conclusions
Seventeen grades of stainless steels were assessed for specific types of corrosion: general, pitting, crevice, intergranular and galvanic. It was noted that there are significant differences between the grades of the austenitic steels studied.
The conclusions are as follows:
- –
- The intensity of the corrosion was dependent on the production parameters, such as the casting volume, alloying additions, and deoxidizing agents;
- –
- The amount of nickel release was dependent on the heat treatment, hardening rate, and other parameters of the manufacturing process;
- –
- The quantity of nickel released is strongly influenced by the inclusion state and the existence of secondary phases;
- –
- There is a clear difference of corrosion between the transverse surface and the longitudinal surface. The longitudinal surface (in the rolling direction) reveals a better resistance to corrosion than the transverse surface.
- –
- The quantities of nickel released are highly dependent on the grade of steel. As a result, manufacturers can use only steels that meet the current legislative requirements;
- –
- Top range watches manufacturers use steels with exclusivity labels, so the chemical compositions, structures, inclusive states, mechanical properties, machinability, polishing are very well defined in their specifications. The rule also applies to medical devices manufacturers;
- –
- Finally, a compromise in choosing a steel over another has to be made, depending on the application and the legal requirements for the final products on a specific market.
Author Contributions
Conceptualization, L.R.; methodology, L.R.; validation, L.R.; formal analysis, L.R.; investigation, L.R.; resources, L.R.; data curation, L.R.; writing—original draft preparation, L.R., L.C.A.; writing—review and editing, L.C.A. All authors have read and agreed to the published version of the manuscript.
Funding
This research received no external funding.
Conflicts of Interest
The authors declare no conflict of interest.
References
- Eliaz, N. Degradation of Implant. Materials; Springer: New York, NY, USA, 2012. [Google Scholar]
- Blackwood, D.J. Biomaterials: Past successes and future problems. Corros. Rev. 2003, 21, 97–124. [Google Scholar] [CrossRef]
- Boonruang, C.; Thong-On, A.; Kidkhunthod, P. Effect of nanograin-boundary networks generation on corrosion of carburized martensitic stainless steel. Sci. Rep. 2018, 8, 2289. [Google Scholar] [CrossRef] [Green Version]
- Mudali, U.K.; Sridhar, T.M.; Eliaz, N.; Raj, B. Failures of stainless steel orthopaedic devices—Causesand remedies. Corros. Rev. 2003, 21, 231–267. [Google Scholar] [CrossRef]
- Pound, B.G. Corrosion behavior of metallic materials in biomedical applications. I. Ti and its alloys. Corros. Rev. 2014, 32, 1–20. [Google Scholar] [CrossRef]
- Revie, R.; Uhlig, H.H. Corrosion and Corrosion Control: An Introduction to Corrosion Science and Engineering, 4th ed.; John Wiley & Sons: Hoboken, NJ, USA, 2008; p. 84. [Google Scholar]
- Eliaz, N. Corrosion of metallic biomaterials: A review. Materials 2019, 12, 407. [Google Scholar] [CrossRef] [PubMed] [Green Version]
- Tiamiyu, A.A.; Eduok, U.; Szpunar, J.A.; Odeshi, A.G. Corrosion behavior of metastable AISI 321 austenitic stainless steel: Investigating the effect of grain size and prior plastic deformation on its degradation pattern in saline media. Sci. Rep. 2019, 9, 12116. [Google Scholar] [CrossRef]
- Gupta, R.K.; Birbilis, N. The influence of nanocrystalline structure and processing route on corrosion of stainless steel: A review. Corros. Sci. 2015, 92, 1–15. [Google Scholar] [CrossRef]
- Ralston, K.D.; Birbilis, N.; Davies, C.H.J. Revealing the relationship between grain size and corrosion rate of metals. Scr. Mater. 2010, 63, 1201–1204. [Google Scholar] [CrossRef]
- Schino, A.D.I.; Materiali, C.S.; Brin, V.B. Effects of grain size on the properties of a low nickel austenitic stainless steel. J. Mater. Sci. 2003, 8, 4725–4733. [Google Scholar] [CrossRef]
- Key to Steel-Stahlschlüssel, 25th ed.; Verlag Stahlschlüssel Wegst GmbH: Marbach, Germany, 2019; Available online: http://www.online.stahlschluessel.de/BrowseProducts.aspx (accessed on 30 April 2020).
- Amaro Vicente, T.; Oliveira, L.A.; Correa, E.O.; Barbosa, R.P.; Macanhan, V.B.P.; Alcântara, N.G. Stress corrosion cracking behaviour of dissimilar welding of AISI 310S austenitic stainless steel to 2304 duplex stainless steel. Metals 2018, 8, 195. [Google Scholar] [CrossRef] [Green Version]
- Lo, K.H.; Shek, C.H.; Lai, J.K.L. Recent developments in stainless steels. Mater. Sci. Eng. R. 2009, 65, 39–104. [Google Scholar] [CrossRef]
- Ha, H.-Y.; Lee, T.-H.; Bae, J.-H.; Chun, D.W. Molybdenum effects on pitting corrosion resistance of FeCrMnMoNC austenitic stainless steels. Metals 2018, 8, 653. [Google Scholar] [CrossRef] [Green Version]
- Ha, H.-Y.; Jang, J.H.; Lee, T.-H.; Won, C.; Lee, C.-H.; Moon, J.; Lee, C.-G. Investigation of the localized corrosion and passive behavior of type 304 stainless steels with 0.2–1.8 wt% B. Materials 2018, 11, 2097. [Google Scholar] [CrossRef] [PubMed] [Green Version]
- Desestret, A.; Charle, J. Les aciersinoxydablesausténico-ferritiques. In Les AciersInoxydables; Lacombe, P., Baroux, B., Beranger, G., Colombier, L., Hochmann, J., Eds.; Les Ulis, Les Editions de Physique: Paris, France, 1990; pp. 631–678. [Google Scholar]
- Reclaru, L.; Ziegenhagen, R.; Eschler, P.Y.; Blatter, A.; Lemaître, J. Comparative corrosion study of “Ni-free” austenitic stainless steels in view of medical applications. Acta. Biomater. 2006, 2, 433–444. [Google Scholar]
- Baker, M. European standards developed in support of the european union nickel directive. In Metal Allergy; Chen, J.K., Thyssen, J.P., Eds.; Springer: Berlin, Germany, 2018; pp. 23–29. [Google Scholar] [CrossRef]
- Liden, C. Nickel in jewelry and associated products. Contact Dermat. 1992, 26, 73–75. [Google Scholar] [CrossRef]
- Belsito, D.V. The diagnostic evaluation, treatment, and prevention of allergic contact dermatitis in the new millennium. J. Allergy Clin. Immunol. 2000, 105, 409–420. [Google Scholar] [CrossRef]
- Schafer, T.; Bohler, E.; Ruhdorfer, S.; Weigl, L.; Wessner, D.; Filipiak, B.; Wichmann, H.E.; Ring, J. Epidemiology of contact allergy in adults. Allergy 2001, 56, 1192–1196. [Google Scholar] [CrossRef] [PubMed] [Green Version]
- Publication Office of the European Union. Commission communication in the framework of the implementation of regulation (EC) No 1907/2006 of the european parliament and of the council concerning the registration, evaluation, authorisation and restriction of chemicals (REACH). Off. J. Eur. Union 2012, C142, 8. [Google Scholar]
- Publication Office of the European Union. European parliament and council directive 94/27/EC of 30 June 1994: Amending for the 12th time directive 76/769/EEC on the approximation of the laws, regulations and administrative provisions of the member States relating to restrictions on the marketing and use of certain dangerous substances and preparations. Off. J. Eur. Commun. 1994, L188, 1–2. [Google Scholar]
- Heim, K.; Basketter, D. Metal exposure regulations and their effect on allergy prevention. In Metal Allergy; Chen, J.K., Thyssen, J.P., Eds.; Springer: Berlin, Germany, 2018; pp. 39–54. [Google Scholar] [CrossRef]
- Fontana, M. Corrosion Engineering, 5th ed.; McGraw Hill International Edition: New York, NY, USA, 1987; p. 556. [Google Scholar]
- ASTM B117-97. Standard Practice for Operating Salt Spray (Fog) Apparatus; ASTM International: West Conshohocken, PA, USA, 2010; Available online: www.astm.org (accessed on 30 April 2020).
- Bech-Nielsen, G. The anodic dissolution of iron–V. Some observations regarding the influence of cold working and annealing on the two anodic reactions of the metal. Electrochim. Acta 1974, 19, 821–828. [Google Scholar] [CrossRef]
- Cigada, A.; Mazza, B.; Pedeferri, P.; Sinigaglia, D. Influence of cold plastic deformation on critical pitting potential of AISI 316 L and 304 L steels in an artificial physiological solution simulating the aggressiveness of the human body. J. Biomed. Mater. Res. 1977, 11, 503–512. [Google Scholar] [CrossRef] [PubMed]
- ISO 3160-2:2015. Watch-Cases and Accessories—Gold Alloy Coverings—Part 2: Determination of Fineness, Thickness, Corrosion Resistance and Adhesion. Available online: https://www.iso.org/standard/66162.html (accessed on 30 April 2020).
- ASTM G48-11. Standard Test Methods for Pitting and Crevice Corrosion Resistance of Stainless Steels and Related Alloys by Use of Ferric Chloride Solution; ASTM International: West Conshohocken, PA, USA, 2015; Available online: www.astm.org (accessed on 30 April 2020).
- Hoar, T.P.; Mears, D.C. Corrosion-resistant alloys in chloride solutions: Materials for surgical implants. Proc. R. Soc. Lond. 1966, 294, 486–510. [Google Scholar]
- Zabel, D.D.; Brown, S.A.; Merritt, K.; Payer, J.H. AES analysis of stainless steel corroded in saline, in serum and in vivo. J. Biomed. Mater. Res. 1988, 22, 31–44. [Google Scholar] [CrossRef] [PubMed]
- Turnbull, A. The solution composition and electrode potential in pits, crevices and cracks. Corros. Sci. 1983, 23, 833–870. [Google Scholar] [CrossRef]
- ASTM F746-87. Standard Test Method for Pitting or Crevice Corrosion of Metallic Surgical Implant Materials; ASTM International: West Conshohocken, PA, USA, 1999; Available online: www.astm.org (accessed on 30 April 2020).
- ASTM A262-15. Standard Practices for Detecting Susceptibility to Intergranular Attack in Austenitic Stainless Steels; ASTM International: West Conshohocken, PA, USA, 2015; Available online: www.astm.org (accessed on 2 May 2020).
- Streicher, M.A. Intergranular. In Corrosion Tests and Standards: Application and Interpretation, 2nd ed.; Baboian, R., Ed.; ASTM International: West Conshohocken, PA, USA, 2004; pp. 244–266. [Google Scholar]
- Henthorne, M. Localized Corrosion. ASTM Tech. Publ. 1972, 518, 108. [Google Scholar]
- Cihal, V.; Stefec, R. On the development of the electrochemical potentiokinetic method. Electrochim. Acta 2001, 46, 3867–3877. [Google Scholar] [CrossRef]
- Iacoviello, F.; Di Cocco, V.; D’Agostino, L. Analysis of the intergranular corrosion susceptibility in stainless steel by means of potentiostatic reactivation tests. Procedia Struct. Integr. 2017, 3, 269–275. [Google Scholar] [CrossRef]
- Clarke, W.L.; Romero, V.M.; Danko, J.C. Detection of sensitization in stainless steel using electrochemical techniques. In Corrosion 77, International Corrosion Forum; National Association of Corrosion Engineers: San Francisco, CA, USA, 1977; p. 180. [Google Scholar]
- Novak, P.; Stefec, R.; Franz, F. Testing the susceptibility of stainless steels to intergranular corrosion by a reactivation method. Corrosion 1975, 31, 344–347. [Google Scholar] [CrossRef]
- Desestret, A.; Froment, M.; Guiraldenq, P. Intergranular corrosion of austenitic stainless steels in the sensitized or solution-annealed condition. In Proceedings of the 23rd Meeting of I.S.E., Stockholm, Sweden, 27 August–2 September 1972; Volume 87. [Google Scholar]
- Aydoğdu, G.H.; Aydinol, K. Determination of susceptibility to intergranular corrosion and electrochemical reactivation behaviour of AISI 316L type stainless steel. Corr. Sci. 2006, 48, 3565–3583. [Google Scholar] [CrossRef]
- Cíhal, V.; Lasek, S.; Blahetová, M.; Kalabisová, E.; Krhutová, Z. Trends in the electrochemical polarization potentiodynamic reactivation method-EPR. Chem. Biochem. Eng. Q. 2007, 21, 47–54. [Google Scholar]
- Parvathavarthini, N.; Dayal, R.K.; Seshadri, S.K.; Gnanamoorthy, J.B. Influence of prior deformation on the sensitisation of AISI type 304 stainless steel and applicability of EPR technique. Br. Corros. J. 1991, 26, 67–76. [Google Scholar] [CrossRef]
- Majidi, A.P.; Streicher, M.A. The double loop reactivation method for detecting sensitization in AISI 304 stainless steels. Corrosion 1984, 40, 584–593. [Google Scholar] [CrossRef]
- ASTM G108-94. Standard Test Method for Electrochemical Reactivation (EPR) for Detecting Sensitization of AISI Type 304 and 304L Stainless Steels; ASTM International: West Conshohocken, PA, USA, 2015; Available online: www.astm.org (accessed on 2 May 2020).
- ASTM E112-13. Standard Test Methods for Determining Average Grain Size; ASTM International: West Conshohocken, PA, USA, 2013; Available online: www.astm.org (accessed on 6 May 2020).
- EN 1811-2011+A1:2015, Reference Test Method for Release of Nickel From All Post Assemblies which are Inserted Into Pierced Parts of the Human Body and Articles Intended to Come Into Direct or Prolonged Contact With the Skin, CEN/TC347. 2011. Available online: https://www.en-standard.eu/din-en-1811 (accessed on 10 October 2018).
- Zanotto, F.; Grassi, V.; Balbo, A.; Monticelli, C.; Zucchi, F. Resistance of thermally aged DSS 2304 against localized corrosion attack. Metals 2018, 8, 1022. [Google Scholar] [CrossRef] [Green Version]
- ASTM G46-94. Standard Guide for Examination and Evaluation of Pitting Corrosion; ASTM International: West Conshohocken, PA, USA, 2018; Available online: www.astm.org (accessed on 6 May 2020).
- Virtanen, S. Degradation of titanium and its alloys. In Degradation of Implant Materials; Eliaz, N., Ed.; Springer: New York, NY, USA, 2012; pp. 29–55. [Google Scholar]
- Melchers, R.E. A review of trends for corrosion loss and pit depth in longer-term exposures. Corros. Mater. Degrad. 2020, 1, 4. [Google Scholar] [CrossRef] [Green Version]
- Abbasi Aghuy, A.; Zakeri, M.; Moayed, M.H.; Mazinani, M. Effect of grain size on pitting corrosion of 304L austenitic stainless steel. Corros. Sci. 2015, 94, 368–376. [Google Scholar] [CrossRef]
- Poyet, P.; Desestret, A.; Coriou, H.; Grall, L. Contribution à L’étude de la Corrosion par Piqûres des Aciers Inoxydables 18/10. Influence de Divers Facteurs sur le Processus D’amorçage des Piqûres; Société française de métallurgie. Journées d’automne: Paris, France, 1973. [Google Scholar]
- Bryant, M.; Hu, X.; Farrar, R.; Brummitt, K.; Freeman, R.; Neville, A. Crevicecorrosion of biomedical alloys: A novel method of assessing the effects of bone cement and its chemistry. J. Biomed. Mater. Res. B Appl. Biomater. 2013, 101, 792–803. [Google Scholar] [CrossRef]
- Liu, Y.; Zhu, D.; Pierre, D.; Gilbert, J.L. Fretting initiated crevicecorrosion of 316LVM stainless steel in physiological phosphate buffered saline: Potential and cycles to initiation. Acta Biomater. 2019, 97, 565–577. [Google Scholar] [CrossRef]
- Stonawská, Z.; Svoboda, M.; Sozańska, M.; Krístková, M.; Sojka, J.; Dagbert, C.; Hyspecká, L. Structural analysis and intergranularcorrosion tests of AISI 316L steel. J. Microsc. 2006, 224, 62–64. [Google Scholar] [CrossRef]
- Liu, T.; Xia, S.; Bai, Q.; Zhou, B.; Lu, Y.; Shoji, T. Evaluation of grain boundary network and improvement of intergranular cracking resistance in 316L stainless steel after grain boundary engineering. Materials 2019, 12, 242. [Google Scholar] [CrossRef] [Green Version]
- Fujii, T.; Furumoto, T.; Tohgo, K.; Shimamura, Y. Crystallographic evaluation of susceptibility to intergranular corrosion in austenitic stainless steel with various degrees of sensitization. Materials 2020, 13, 613. [Google Scholar] [CrossRef] [Green Version]
- Liu, G.; Liu, Y.; Cheng, Y.; Li, J.; Jiang, Y. The intergranular corrosion susceptibility of metastable austenitic Cr-Mn-Ni-N-Cu high-strength stainless steel under various heat treatments. Materials 2019, 12, 1385. [Google Scholar] [CrossRef] [PubMed] [Green Version]
- ASTM G82-98. Standard Guide for Development and Use of a Galvanic Series for Predicting Galvanic Corrosion Performance; ASTM International: West Conshohocken, PA, USA, 2014; Available online: www.astm.org (accessed on 6 May 2020).
- Mansfeld, F.; Kenkel, J.V. Laboratory studies of galvanic corrosion of aluminium alloys. In Galvanic and Pitting Corrosion--Field and Laboratory Studies; Baboian, R., France, W.D., Eds.; ASTM: West Conshohocken, PA, USA, 1976; pp. 20–47. [Google Scholar]
- Gilbert, J.L.; Mali, S. Medical implant corrosion: Electrochemistry at metallic biomaterial surfaces. In Degradation of Implant Materials; Eliaz, N., Ed.; Springer: New York, NY, USA, 2012; Chapter 1; pp. 1–28. [Google Scholar]
Figure 1.
Specific assembly for the crevice corrosion test. Crevice corrosion aspect of the test sample.
Figure 1.
Specific assembly for the crevice corrosion test. Crevice corrosion aspect of the test sample.

Figure 2.
The electrochemical assembly and the electrochemical measuring cell.

Figure 3.
Procedures of single loop EPR test method according to ASTM G108–94 (2015) [48].
Figure 3.
Procedures of single loop EPR test method according to ASTM G108–94 (2015) [48].

Figure 4.
Link, steel-gold assembly with pins.

Figure 5.
Uniform corrosion salt fog test, according to ASTM B 117-97. Samples #2-1.4427 So, #3-1.4435/316L, #4-316LUgim and #5-316L Val.
Figure 5.
Uniform corrosion salt fog test, according to ASTM B 117-97. Samples #2-1.4427 So, #3-1.4435/316L, #4-316LUgim and #5-316L Val.

Figure 6.
Pitting test results of the transverse and longitudinal surfaces for various grades of steel alloys (0.5 M FeCl3 test medium at 50° for 2 h).
Figure 6.
Pitting test results of the transverse and longitudinal surfaces for various grades of steel alloys (0.5 M FeCl3 test medium at 50° for 2 h).

Figure 7.
Pitting test results of the transverse and longitudinal surfaces for various grades of steels (0.1 M FeCl3 test medium at 37 °C for 15 days).
Figure 7.
Pitting test results of the transverse and longitudinal surfaces for various grades of steels (0.1 M FeCl3 test medium at 37 °C for 15 days).

Figure 8.
Pitting test results of the transverse and longitudinal surfaces for various grades of steels (0.5 M NaCl test medium at 37 °C for 26 days).
Figure 8.
Pitting test results of the transverse and longitudinal surfaces for various grades of steels (0.5 M NaCl test medium at 37 °C for 26 days).

Figure 9.
Pitting test results of the transverse and longitudinal surfaces for various grades of steels (artificial sweat test medium at 37 °C for 30 days).
Figure 9.
Pitting test results of the transverse and longitudinal surfaces for various grades of steels (artificial sweat test medium at 37 °C for 30 days).

Figure 10.
Number of pits counted by class, according to the size of the pit surface area.

Figure 11.
Corrosion pits revealed as blue discs (cross section sample #2).

Figure 12.
The crevice test potentiostatic curves for the longitudinal surface of sample #8 (a) and #10 (b).
Figure 12.
The crevice test potentiostatic curves for the longitudinal surface of sample #8 (a) and #10 (b).

Figure 13.
Crevice potential values measured for the transverse and longitudinal surfaces of the steels considered (L: longitudinal, T: transverse).
Figure 13.
Crevice potential values measured for the transverse and longitudinal surfaces of the steels considered (L: longitudinal, T: transverse).

Figure 14.
Polarization curves (current value recorded after 15 min vs. preselected potential; (a) transverse and (b) longitudinal surface.
Figure 14.
Polarization curves (current value recorded after 15 min vs. preselected potential; (a) transverse and (b) longitudinal surface.

Figure 15.
Scanning electron microscopy (SEM) of the transverse surface, corroded under a defective PTFE collar. The columnar morphology suggests preferential longitudinal dissolution due to the texture of the material.
Figure 15.
Scanning electron microscopy (SEM) of the transverse surface, corroded under a defective PTFE collar. The columnar morphology suggests preferential longitudinal dissolution due to the texture of the material.

Figure 16.
The interior of a corroded tube (#3, 1.4435/316L steel).

Figure 17.
Metallographic section of the tube (#3, 1.4435/316L steel) after Strauss’s test.

Figure 18.
(a)#Test 1 and (b) #Test 2. Grain index (ASTM E112-13) G = 11.

Figure 19.
#Brut 1. Grain index (ASTM E112-13) G = 11.

Figure 20.
Potentio kinetic reactivation curves recorded for #Brut 1, #Test 1, #500_1, #620_2, and #750_2.
Figure 20.
Potentio kinetic reactivation curves recorded for #Brut 1, #Test 1, #500_1, #620_2, and #750_2.

Figure 21.
Normalized charge (Pa) measured by EPR.

Figure 22.
Galvanic corrosion in a gold-steel assembly.

Figure 23.
Corrosion of the transverse surface, at the level of the gold-steel interface.

Figure 24.
Sample #6. (a) EDX profiles of the gold-904 L steel solder for iron, nickel, silver, gold, copper and zinc; (b) EDX Ni profile.
Figure 24.
Sample #6. (a) EDX profiles of the gold-904 L steel solder for iron, nickel, silver, gold, copper and zinc; (b) EDX Ni profile.

Figure 25.
Sample #4. (a) EDX profiles of the gold-316 LM steel solder for iron, nickel, silver, gold, copper and zinc; (b) EDX Ni profile.
Figure 25.
Sample #4. (a) EDX profiles of the gold-316 LM steel solder for iron, nickel, silver, gold, copper and zinc; (b) EDX Ni profile.

Figure 26.
SEM examination of sample #4.

Figure 27.
Factors influencing the amounts of nickel released during the manufacturing process.


Table 1.
Chemical composition (wt.%) of the grades of austenitic steels used in corrosion tests.
| Code | DIN | AISI | C | Si | Mn | P | S | Cr | Mo | Ni | Other |
|---|---|---|---|---|---|---|---|---|---|---|---|
| #1 | 1.4306 | 304L | <0.03 | <1.5 | <1.5 | <0.035 | <0.02 | 17.0–20.0 | - | 8.0–12.0 | N 0.1–0.2 |
| #2 | 1.4427So | - | <0.03 | <1.0 | <2.0 | <0.045 | 0.10–0.13 | 16.5–18.5 | 2.0–2.7 | - | - |
| #3 | 1.4435 | 316L | <0.03 | <1.0 | <2.0 | <0.045 | <0.025 | 17.0–18.5 | 2.5–3.0 | 12.5–15.0 | - |
| #4 | 1.4435 | 316LUgim | <0.03 | <1.0 | <2.0 | <0.045 | ~0.018 | 17.0–18.5 | 2.5–3.0 | 12.5–15.0 | N < 0.11 |
| #5 | 1.4435 | 316LVal | <0.03 | <1.0 | <2.0 | <0.045 | ~0.018 | 17.0–18.5 | 2.5–3.0 | 12.5–15.0 | N < 0.11 |
| #6 | 1.4435 | 316LPM | <0.03 | <1.0 | <2.0 | <0.045 | ~0.018 | 17.0–18.5 | 2.5–3.0 | 12.5–15.0 | N < 0.11 |
| #7 | 1.4435 | 316LSW | <0.03 | <1.0 | <2.0 | <0.045 | ~0.018 | 17.0–18.5 | 2.5–3.0 | 12.5–15.0 | N < 0.11 |
| #8 | 1.4441 | 316LMed | <0.03 | <1.0 | <2.0 | <0.025 | <0.01 | 17.0–0.19 | 2.5–3.2 | 13.0–15.5 | N < 0.10 Cu < 0.12 |
| #9 | 1.4571 | 316Ti | <0.08 | <1.0 | <2.0 | <0.045 | <0.03 | 16.5–18.5 | 2.0–2.5 | - | - |
| #10 | 1.4539 | 904L | <0.02 | <0.7 | <2.0 | <0.03 | <0.015 | 19.0–21.0 | 4.0–5.0 | 24.0–26.0 | Cu 1.0–2.0; N 0.04–0.15 |
| #11 | 1.4057 | 431 | 0.14–0.23 | <1.0 | <1.0 | <0.045 | <0.03 | 15.5–17.5 | - | 1.5–2.5 | - |
| #12 | 1.4460 | 329 | <0.05 | <1.0 | <2.0 | <0.045 | <0.03 | 25.0–28.0 | 1.3–2.0 | 4.5–6.5 | N 0.05–0.2 |
| #13 | 1.4462 | 2205 | <0.03 | <1.0 | <2.0 | - | <0.02 | 21.0–23.0 | 2.5–3.5 | 4.5–6.5 | N 0.08–0.2 |
| #14 | 1.4542 | 630 | <0.07 | <1.0 | <1.0 | <0.045 | <0.03 | 15.0–17.0 | - | 3.0–5.0 | Nb 0.15–0.45 |
| #15 | 1.4841 | 310/314 | <0.20 | 1.5–2.5 | <2.0 | <0.045 | <0.03 | 24.0–26.0 | - | 19.0–22.0 | - |
| #16 | 1.4876 | B 163 | <0.12 | <1.0 | <2.0 | <0.03 | <0.02 | 19.0–23.0 | - | 30.0–34.0 | - |
| #17 | 2.4816 | Inconel600 | <0.15 | <0.5 | <1.0 | <0.02 | <0.015 | 14.0–17.0 | - | >72.0 | Ti < 0.3; Al < 0.3; B <0.006; Cu <0.5; Fe 6.00–10.0 |
Table 2.
The salt fog test conditions.
| Test | Conditions |
|---|---|
| Electrolyte |
|
| Temperature | 35 °C |
| Total duration | 12 days |
| NaCl 5% | 6 days |
| Artificial sweat Dilution x40 | 6 days |
| Operating cycle salt spraying exposing |
|
Table 3.
Types of electrolytes used and the experimental conditions for testing pitting corrosion [31,32,33].
| Test Medium | Concentration | Temperature | Test Duration |
|---|---|---|---|
| FeCl3 | 0.5 M | 50 °C | 2 h |
| FeCl3 | 0.1 M | 37 °C | 15 days |
| NaCl | 0.5 M | 37 °C | 26 days |
| Artificial sweat ISO 3160-2 Diluted 20x | NaCl 0.5 g/L; NH4Cl 0.4375 g/L; Acetic Acid 0.063 g/L; Urea 0.125 g/L; Lactic Acid 0.375 g/L; NaOH solid, necessary quantity to induce a pH of 4.7 | 37 °C | 30 days |
Table 4.
ASTM A262-15 [36] Standard practice for detecting susceptibility to intergranular attack in austenitic stainless steels.
Table 4.
ASTM A262-15 [36] Standard practice for detecting susceptibility to intergranular attack in austenitic stainless steels.
| Designation | Test | Temperature | Testing Time | Applicability | Evaluation Method |
|---|---|---|---|---|---|
| Practice A | Oxalic Acid Etch Screening Test | Ambient | 1.5 min | Chromium Carbide sensitization only | Microscopic Examination |
| B | Ferric Sulfate and 50% Sulfuric Acid | Boiling | 120 h | Chromium Carbide | Weight loss/ Corrosion Rate |
| C | 65% Nitric Acid | Boiling | 4 h | Chromium Carbide | Weight loss/ Corrosion Rate |
| D | 10% Nitric-3% Hydro Fluoric Acid (This test has been removed from A 262-15) | 70 °C | 4 h | Chromium carbide in 316, 316L, 317, 317L | Corrosion Rates of “unknown” over that of solution annealed specimen |
| E | 6% Copper Sulfate 16% Sulfuric Acid with metallic copper | Boiling | 24 h | Chromium Carbide | Examination for fissures after bending |
| F | Copper Sulfate 50% Sulfuric Acid with metallic copper | Boiling | 120 h | Chromium Carbide in 316 and 316L | Weight loss/ Corrosion rate |
Table 5.
Test samples #1, 14306/304L tubes.
| Code | Description |
|---|---|
| #Test 1 | Tube returned from user |
| #Test 2 | Tube returned from user |
| #Brut 1 | Tube from supplier stock (reference) |
| #Brut 2 | Tube from supplier stock (second reference) |
| #500 | Tube from supplier stock+ 500 °C heat treatment, 1 h |
| #620 | Tube from supplier stock+ 621 °C heat treatment, 1 h |
| #750 | Tube from supplier stock+ 750 °C heat treatment, 1 h |
Table 6.
Observations after the salt fog test (samples tested in annealed, cold-worked state).
| Code | State | T *-Face | L **-Face |
|---|---|---|---|
| #2 | Annealed | Corrosion | No corrosion |
| Cold worked | Corrosion | No corrosion | |
| #3 | Annealed | No corrosion | No corrosion |
| Cold worked | No corrosion | No corrosion | |
| #4 | Annealed | Corrosion | No corrosion |
| Cold worked | Corrosion | No corrosion | |
| #5 | Annealed | Corrosion | No corrosion |
| Cold worked | Corrosion | No corrosion |
* T: transverse surface, ** L: longitudinal surface, with respect to the rolling direction.
Table 7.
Types and reactivity of inclusions according to [56].
Table 7.
Types and reactivity of inclusions according to [56].
| Inclusion Types and Associations | Number Rating: #Pitted/#Total of Inclusions | Shape Rating: #Pitted/#Total of Inclusions |
|---|---|---|
| Sulfide Sulfide-silicate Silicate | 2/32 = 6% 22/81 = 27% 0/5 = 0% | Globular 3/20 = 15% Elongated 19/61 = 31% |
| Sulfide Sulfide-alumina Alumina | 1/33 = 3% 9/87 = 10% - | Globular 1/33 = 3% Elongated 8/54 = 15% |
| Mg-oxide Mg-oxide-sulfide | 100% | (rare inclusions) |
Table 8.
Tube mass loss after Strauss test.
| Material | Mass Loss (g) | Surface (cm2) | Mass Loss (mg/cm2) |
|---|---|---|---|
| Tubes 1.4435/316 L | 0.31651 | 7.38 | 43 |
| 0.32816 | 7.80 | 42 | |
| 0.28091 | 7.02 | 40 | |
| 0.22120 | 5.84 | 38 | |
| 0.05145 | 6.04 | 9 |
Table 9.
Grain index according to ASTM E112-13 [49].
Table 9.
Grain index according to ASTM E112-13 [49].
| Code | Grain Index |
|---|---|
| #Test 1 | 11 |
| #Test 2 | 11 |
| #Brut 1 | 11 |
Table 10.
Potentiokinetic electrochemical reactivation results.
| Code | Eoc (mV) | Ir (mA/cm2) | Q (C/cm2) | Pa(C/cm2) |
|---|---|---|---|---|
| #Test 1 | −400 | 8.21 | 4.96 | 20.67 |
| #Test 2 | −423 | 12.92 | 4.01 | 16.70 |
| #Brut 1 | −387 | 11.84 | 0.28 | 1.15 |
| #Brut 2 | −410 | 8.21 | 0.33 | 1.37 |
| #500_1 | −410 | 30.70 | 1.33 | 5.54 |
| #500_2 | −388 | 59.22 | 1.94 | 8.10 |
| #620_1 | −404 | 173.30 | 8.17 | 34.04 |
| #620_2 | −410 | 132.60 | 8.07 | 33.63 |
| #620_3 | −395 | 162.20 | 9.94 | 41.42 |
| #750_1 | −407 | 34.22 | 2.14 | 8.90 |
| #750_2 | −407 | 59.22 | 4.01 | 16.70 |
Eoc = Initial open circuit potential, Ir = maximum anodic current density.
Table 11.
Galvanic series established in an EN1811-2011+A1:2015 artificial sweat type environment.
| A | Precious Alloys | Corrosion Potential Ecorr (mV) | B | Steels | Corrosion Potential Ecorr (mV) |
|---|---|---|---|---|---|
| 952 | Pt 950CoNi | 175 | 316L series | 1.4441 | −21 |
| 150 | AuPdCu150 | 70 | - | 1.4435 | −160 |
| 109 | AuAgNi109 | 53 | - | 316L F | −164 |
| 141 | AuCuNi130 | 43 | - | 316L F Cu | −282 |
| 142 | AuNiCu142 | 42 | 304 series | 1.4301 | −169 |
| 112 | AuNiCu112 | 22 | 303 series | 1.4305 | −266 |
| 374 | AuCuZn374 | 6.4 | - | Sandvik 1802 | −168 |
| - | - | - | - | 1.4104 | −234 |
| - | - | - | - | 1.4105 | −389 |
| - | - | - | 904L series | 1.4539 | −72 |
| - | - | - | 12/12 | −163 |
Table 12.
Tests results for gold-stainless steel links.
| # | Gold | Steel | Nickel Release (μg·cm−2·Week−1) | Corroded Parts Rate | Corrosion Rate (%) |
|---|---|---|---|---|---|
| #1 | 5N18 | 1.4441 | 0.14 | 0/6 | 0% |
| 316LM | 0.25 | ||||
| 0.13 | |||||
| 0.04 | |||||
| 0.22 | |||||
| 0.03 | |||||
| #2 | 5N18 | 1.4441 | 0.44 | 2/6 | 33% |
| 316LM | 0.05 | ||||
| 0.01 | |||||
| 0.10 | |||||
| #4 | 5N18 | 1.4441 | 0.03 | 6/9 | 67% |
| 316LM | 0.06 | ||||
| 0.09 | |||||
| #5 | 5N18 | 1.4441 | 0.09 | 0/3 | 0% |
| 316LM | 0.08 | - | - | ||
| 0.06 | |||||
| #6 | 5N18 | 1.4539 | 2.3 | 0/3 | 0% |
| 904L | 2.6 | ||||
| 2.2 |
© 2020 by the authors. Licensee MDPI, Basel, Switzerland. This article is an open access article distributed under the terms and conditions of the Creative Commons Attribution (CC BY) license (http://creativecommons.org/licenses/by/4.0/).
Share and Cite
MDPI and ACS Style
Reclaru, L.; Ardelean, L.C. Corrosion Susceptibility and Allergy Potential of Austenitic Stainless Steels. Materials 2020, 13, 4187. https://doi.org/10.3390/ma13184187
AMA Style
Reclaru L, Ardelean LC. Corrosion Susceptibility and Allergy Potential of Austenitic Stainless Steels. Materials. 2020; 13(18):4187. https://doi.org/10.3390/ma13184187
Chicago/Turabian StyleReclaru, Lucien, and Lavinia Cosmina Ardelean. 2020. "Corrosion Susceptibility and Allergy Potential of Austenitic Stainless Steels" Materials 13, no. 18: 4187. https://doi.org/10.3390/ma13184187
Note that from the first issue of 2016, this journal uses article numbers instead of page numbers. See further details here.