Novel Route to Obtain Carbon Self-Doped TiO2 Mesoporous Nanoparticles as Efficient Photocatalysts for Environmental Remediation Processes under Visible Light

Abstract
:
1. Introduction
2. Materials and Methods
2.1. Chemicals
2.2. Synthesis
2.3. Characterization
2.4. Photocatalytic Evaluation
3. Results and Discussion
3.1. Characterization of Catalysts
3.2. Photocatalytic Degradation of Acid Orange 7
4. Conclusions
Author Contributions
Funding
Acknowledgments
Conflicts of Interest
References
- Bizani, E.; Fytianos, K.; Poulios, I.; Tsiridis, V. Photocatalytic decolorization and degradation of dye solutions and wastewaters in the presence of titanium dioxide. J. Hazard. Mater. 2006, 136, 85–94. [Google Scholar] [CrossRef]
- Anpo, M.; Kim, T.; Matsuoka, M. The design of Ti-, V-, Cr-oxide single-site catalysts within zeolite frameworks and their photocatalytic reactivity for the decomposition of undesirable molecules—The role of their excited states and reaction mechanisms. Catal. Today 2009, 142, 114–124. [Google Scholar] [CrossRef]
- Konstantinou, I.; Albanis, T. TiO2-assisted photocatalytic degradation of azo dyes in aqueous solution: Kinetic and mechanistic investigations: A review. Appl. Catal. B 2004, 49, 1–14. [Google Scholar] [CrossRef]
- Da Silva, C.G.; Faria, J.L. Photochemical and photocatalytic degradation of an azo dye in aqueous solution by UV irradiation. J. Photochem. Photobiol. A Chem. 2003, 155, 133–143. [Google Scholar] [CrossRef]
- Brown, M.A.; De Vito, S.C. Predicting azo dye toxicity. Crit. Rev. Environ. Sci. Technol. 1993, 23, 249–324. [Google Scholar] [CrossRef]
- Cermenati, L.; Pichat, P.; Guillard, C.; Albini, A. Probing the TiO2 Photocatalytic Mechanisms in Water Purification by Use of Quinoline, Photo-Fenton Generated OH•Radicals and Superoxide Dismutase†. J. Phys. Chem. B 1997, 101, 2650–2658. [Google Scholar] [CrossRef]
- Fujishima, A.; Rao, T.N.; Tryks, D.A. Titanium dioxide photocatalysis. J. Photochem. Photobiol. 2000, C1, 1–21. [Google Scholar] [CrossRef]
- Pelaez, M.; Nolan, N.; Pillai, S.; Seery, M.; Falaras, P.; Kontos, A.; Dunlop, P.; Hamilton, J.; Byrne, J.; O’Shea, K.; et al. A Review on the Visible Light Active Titanium Dioxide Photocatalysts for Environmental Applications. Appl. Catal. B 2012, 125, 331–349. [Google Scholar] [CrossRef]
- Fan, Y.; Ma, C.; Liu, B.; Chen, H.; Dong, L.; Yin, Y. Nitrogen doped anatase TiO2 sheets with dominant {001} facets for enhancing visible-light photocatalytic activity. Mater. Sci. Semicond. Process. 2014, 27, 47–50. [Google Scholar] [CrossRef]
- Ansari, S.A.; Khan, M.M.; Ansari, M.O.; Cho, M.H. Nitrogen-doped titanium dioxide (N-doped TiO2) for visible light photocatalysis. New J. Chem. 2016, 40, 3000–3009. [Google Scholar] [CrossRef]
- Sakthivel, S.; Kisch, H. Daylight Photocatalysis by Carbon-Modified Titanium Dioxide. Angew. Chem. Int. Ed. 2003, 42, 4908–4911. [Google Scholar] [CrossRef] [PubMed]
- Di Valentin, C.; Pacchioni, G.; Selloni, A. Theory of Carbon Doping of Titanium Dioxide. Chem. Mater. 2005, 17, 6656–6665. [Google Scholar] [CrossRef]
- Lee, S.; Lee, Y.; Kim, D.H.; Moon, J.H. Carbon-Deposited TiO2 3D Inverse Opal Photocatalysts: Visible-Light Photocatalytic Activity and Enhanced Activity in a Viscous Solution. ACS Appl. Mater. Interfaces 2013, 5, 12526–12532. [Google Scholar] [CrossRef] [PubMed]
- He, Z.; Que, W.; He, Y. Enhanced photocatalytic performance of sensitized mesoporous TiO2 nanoparticles by carbon mesostructures. RSC Adv. 2014, 4, 3332–3339. [Google Scholar] [CrossRef]
- Irie, H.; Watanabe, Y.; Hashimoto, K. Carbon-doped anatase TiO2 powders as a visible-light sensitive photo-catalyst. Chem. Lett. 2003, 32, 772–773. [Google Scholar] [CrossRef]
- Kang, I.-C.; Zhang, Q.; Yin, S.; Sato, T.; Saito, F. Preparation of a visible sensitive carbon doped TiO2 photo-catalyst by grinding TiO2 with ethanol and heating treatment. Appl. Catal. B Environ. 2008, 80, 81–87. [Google Scholar] [CrossRef]
- Hahn, R.; Salonen, J.; Thiemann, S.; Song, Y.Y.; Kunze, J.; Lehto, V.P.; Schmuki, P.; Schmidt-Stein, F. Semimetallic TiO2 Nanotubes. Angew. Chem. Int. Ed. 2009, 48, 7236–7239. [Google Scholar] [CrossRef]
- El-Sheikh, S.M.; Khedr, T.M.; Hakki, A.; Ismail, A.A.; Badawy, W.A.; Bahnemann, D.W. Visible light activated carbon and nitrogen co-doped mesoporous TiO2 as efficient photocatalyst for degradation of ibuprofen. Sep. Purif. Technol. 2017, 173, 258–268. [Google Scholar] [CrossRef]
- Huang, Y.; Ho, W.; Lee, S.C.; Zhang, L.; Li, G.; Yu, J.C. Effect of Carbon Doping on the Mesoporous Structure of Nanocrystalline Titanium Dioxide and Its Solar-Light-Driven Photocatalytic Degradation of NOx. Langmuir 2008, 24, 3510–3516. [Google Scholar] [CrossRef]
- Na Quan, L.; Jang, Y.H.; Stoerzinger, K.; May, K.J.; Jang, Y.J.; Kochuveedu, S.T.; Shao-Horn, Y.; Kim, D.H. Soft-template-carbonization route to highly textured mesoporous carbón—TiO2 inverse opals for efficient photocatalytic and photoelectrochemical applications. Phys. Chem. Chem. Phys. 2014, 16, 9023–9030. [Google Scholar] [CrossRef]
- Dong, F.; Wang, H.; Wu, Z. One-Step “Green” Synthetic Approach for Mesoporous C-Doped Titanium Dioxide with Efficient Visible Light Photocatalytic Activity. J. Phys. Chem. C 2009, 113, 16717–16723. [Google Scholar] [CrossRef]
- Reddy, E.P.; Sun, B.; Smirniotis, P.G. Transition Metal Modified TiO2-Loaded MCM-41 Catalysts for Visible- and UV-Light Driven Photodegradation of Aqueous Organic Pollutants. J. Phys. Chem. B 2004, 108, 17198–17205. [Google Scholar] [CrossRef]
- Thind, S.S.; Wu, G.; Chen, A. Synthesis of mesoporous nitrogen–tungsten co-doped TiO2 photocatalysts with high visible light activity. Appl. Catal. B Environ. 2012, 111, 38–45. [Google Scholar] [CrossRef]
- Lin, C.; Liou, Y.H.; Zhang, Y.; Chen, C.L.; Dong, C.; Chen, S.; Stucky, G. Mesoporous Fe-doped TiO2 sub-microspheres with en-hanced photocatalytic activity under visible light illumination. Appl. Catal. B Environ. 2012, 127, 175–181. [Google Scholar] [CrossRef]
- Kim, D.S.; Kwak, S.-Y. The hydrothermal synthesis of mesoporous TiO2 with high crystallinity, thermal stability, large surface area, and enhanced photocatalytic activity. Appl. Catal. A Gen. 2007, 323, 110–118. [Google Scholar] [CrossRef]
- Piumetti, M.; Freyria, F.S.; Armandi, M.; Geobaldo, F.; Garrone, E.; Bonelli, B. Fe-TiO2 and V- TiO2 mesoporous catalysts obtained by direct synthesis: Physico-chemical characterization and catalytic properties in the decomposition of azo-dyes. Catal. Today 2014, 227, 71–79. [Google Scholar] [CrossRef]
- Zhang, L.; Yu, J.C. A sonochemical approach to hierarchical porous titania spheres with enhanced photocatalytic activity. Chem. Commun. 2003, 16, 2078–2079. [Google Scholar] [CrossRef]
- Eiden-Assmann, S.; Widoniak, J.; Maret, G. Synthesis and Characterization of Porous and Nonporous Monodisperse Colloidal TiO2Particles. Chem. Mater. 2004, 16, 6–11. [Google Scholar] [CrossRef]
- Elías, V.; Vaschetto, E.; Sapag, K.; Oliva, M.; Casuscelli, S.; Eimer, G. MCM-41-based materials for the photo-catalytic degradation of Acid Orange 7. Catal. Today 2011, 172, 58–65. [Google Scholar] [CrossRef]
- Moradi, V.; Jun, M.B.; Blackburn, A.; Herring, R.A. Significant improvement in visible light photocatalytic activity of Fe doped TiO2 using an acid treatment process. Appl. Surf. Sci. 2018, 427, 791–799. [Google Scholar] [CrossRef]
- Zhang, Y.; Zhao, Z.; Chen, J.; Cheng, L.; Chang, J.; Sheng, W.; Hu, C.; Cao, S. C-doped hollow TiO2 spheres: In situ synthesis, controlled shell thickness, and superior visible-light photocatalytic activity. Appl. Catal. B Environ. 2015, 165, 715–722. [Google Scholar] [CrossRef]
- Warkhade, S.K.; Gaikwad, G.; Zodape, S.P.; Pratap, U.; Maldhure, A.V.; Wankhade, A.V. Low temperature synthesis of pure anatase carbon doped titanium dioxide: An efficient visible light active photocatalyst. Mater. Sci. Semicond. Process. 2017, 63, 18–24. [Google Scholar] [CrossRef]
- Zhang, J.; Zhou, P.; Liu, J.; Yu, J. New understanding of the difference of photocatalytic activity among anatase, rutile and brookite TiO2. Phys. Chem. Chem. Phys. 2014, 16, 20382–20386. [Google Scholar] [CrossRef] [PubMed]
- Etacheri, V.; Di Valentin, C.; Schneider, J.; Bahnemann, D.; Pillai, S.C. Visible-light activation of TiO2 photocatalysts: Advances in theory and experiments. J. Photochem. Photobiol. C Photochem. Rev. 2015, 25, 1–29. [Google Scholar] [CrossRef]
- Sing, K.S.W. Reporting physisorption data for gas/solid systems with special reference to the determination of surface area and porosity (Recommendations 1984). Pure Appl. Chem. 1985, 57, 603–619. [Google Scholar] [CrossRef]
- Bhesh, B. Drying Technology. In handbook of Industrial Drying, 4th ed.; Mujumdar, A.S., Ed.; CRC Press: Boca Raton, FL, USA, 2015; Volume 33, pp. 128–129. [Google Scholar]
- Mistura, G.; Pozzato, A.; Grenci, G.; Bruschi, L.; Tormen, M. Continuous adsorption in highly ordered porousmatrices made by nanolithography. Nat. Commun. 2013, 4, 2966. [Google Scholar] [CrossRef] [PubMed]
- Thommes, M.; Kaneko, K.; Neimark, A.V.; Olivier, J.P.; Rodríguez-Reinoso, F.; Rouquerol, J.; Sing, K.S. Physisorption of gases, with special reference to the evaluation of surface area and pore size distribution (IUPAC Technical Report). Pure Appl. Chem. 2015, 87, 1051–1069. [Google Scholar] [CrossRef] [Green Version]
- Ren, W.; Ai, Z.; Jia, F.; Zhang, L.; Fan, X.; Zou, Z. Low temperature preparation and visible light photocatalytic activity of mesoporous carbon-doped crystalline TiO2. Appl. Catal. B Environ. 2007, 69, 138–144. [Google Scholar] [CrossRef]
- Yu, J.; Wang, G.; Cheng, B.; Zhou, M. Effects of hydrothermal temperature and time on the photocatalytic activity and microstructures of bimodal mesoporous TiO2 powders. Appl. Catal. B Environ. 2007, 69, 171–180. [Google Scholar] [CrossRef]
- Dong, F.; Guo, S.; Wang, H.; Li, X.; Wu, Z. Enhancement of the Visible Light Photocatalytic Activity of C-Doped TiO2 Nanomaterials Prepared by a Green Synthetic Approach. J. Phys. Chem. C 2011, 115, 13285–13292. [Google Scholar] [CrossRef]
- Gregg, S.J.; Sing, K.S.W. Adsorption, Surface Area and Porosity, 2nd ed.; Academic Press: London, UK, 1982. [Google Scholar]
- Marien, C.B.; Marchal, C.; Koch, A.; Robert, D.; Drogui, P. Sol-gel synthesis of TiO2 nanoparticles: Effect of Pluronic P123 on particle’s morphology and photocatalytic degradation of paraquat. Environ. Sci. Pollut. Res. Int. 2017, 24, 12582–12588. [Google Scholar] [CrossRef] [PubMed]
- Neville, E.M.; Mattle, M.J.; Loughrey, D.; Rajesh, B.; Rahman, M.; Don MacElroy, J.M.; Sullivan, J.A.; Thampi, K.R. Carbon-Doped TiO2 and Carbon, Tungsten-Codoped TiO2 through Sol–Gel Processes in the Presence of Melamine Borate: Reflections through Photocatalysis. J. Phys. Chem. C 2012, 116, 16511–16521. [Google Scholar] [CrossRef]
- Wu, X.; Yin, S.; Dong, Q.; Guo, C.; Li, H.; Kimura, T.; Sato, T. Synthesis of high visible light active carbon doped TiO2 photocatalyst by a facile calcination assisted solvothermal method. Appl. Catal. B Environ. 2013, 142, 450–457. [Google Scholar] [CrossRef]
- Erdem, B.; Hunsicker, R.A.; Simmons, G.W.; Sudol, E.D.; Dimonie, V.L.; El-Aasser, M.S. XPS and FTIR Surface Characterization of TiO2Particles Used in Polymer Encapsulation. Langmuir 2001, 17, 2664–2669. [Google Scholar] [CrossRef]
- Yu, J.C.; Ho, W.; Yu, J.; Hark, S.K.; Iu, K. Effects of Trifluoroacetic Acid Modification on the Surface Microstructures and Photocatalytic Activity of Mesoporous TiO2Thin Films. Langmuir 2003, 19, 3889–3896. [Google Scholar] [CrossRef]
- Gómez-Avilés, A.; Peñas-Garzón, M.; Bedia, J.; Rodriguez, J.; Belver, C. C-modified TiO2 using lignin as carbon precursor for the solar photocatalytic degradation of acetaminophen. Chem. Eng. J. 2019, 358, 1574–1582. [Google Scholar] [CrossRef]
- Gu, D.E.; Lu, Y.; Yang, B.C.; Hu, Y.D. Facile preparation of micro-mesoporous carbon-doped TiO2 photocatalysts with anatase crystalline walls under template-free condition. Chem. Commun. 2008, 21, 2453–2455. [Google Scholar] [CrossRef]
- Sood, S.; Umar, A.; Mehta, S.K.; Kansal, S.K. Highly effective Fe-doped TiO₂ nanoparticles photocatalysts for visible-light driven photocatalytic degradation of toxic organic compounds. J. Colloid Interface Sci. 2015, 450, 213–223. [Google Scholar] [CrossRef]
- Elías, V.; Sabre, E.; Sapag, K.; Casuscelli, S.; Eimer, G. Influence of the Cr loading in Cr/MCM-41 and TiO2/Cr/MCM-41 molecular sieves for the photodegradation of Acid Orange 7. Appl. Catal. A Gen. 2012, 413, 280–291. [Google Scholar] [CrossRef]
- Lin, Y.-T.; Weng, C.-H.; Lin, Y.-H.; Shiesh, C.-C.; Chen, F.-Y. Effect of C content and calcination temperature on the photocatalytic activity of C-doped TiO2 catalyst. Sep. Purif. Technol. 2013, 116, 114–123. [Google Scholar] [CrossRef]
- Park, J.H.; Kim, S.; Bard, A.J. Novel Carbon-Doped TiO2Nanotube Arrays with High Aspect Ratios for Efficient Solar Water Splitting. Nano Lett. 2006, 6, 24–28. [Google Scholar] [CrossRef] [PubMed]
- Lei, X.F.; Xu, X.X.; Yang, H.; Chen, C.; Li, X.; Niu, M.C.; Gao, X.Y.; Yang, Y.T. Effect of calcination temperature on the structure and visible-light photocatalytic activities of (N, S and C) co-doped TiO2 nano-materials. Appl. Surf. Sci. 2015, 332, 172–180. [Google Scholar] [CrossRef]
- Chen, X.; Burda, C. The Electronic Origin of the Visible-Light Absorption Properties of C-, N- and S-Doped TiO2Nanomaterials. J. Am. Chem. Soc. 2008, 130, 5018–5019. [Google Scholar] [CrossRef] [PubMed]
- Wang, D.H.; Jia, L.; Wu, X.L.; Lu, L.Q.; Xu, A.W. One-step hydrothermal synthesis of N-doped TiO2/C nanocomposites with high visible light photocatalytic activity. Nanoscale 2012, 4, 576–584. [Google Scholar] [CrossRef]


| Photocatalyst | SBET (m2 g−1)a | PD (nm)b | PV (cm3g−1)b | Band Gap (eV) |
|---|---|---|---|---|
| MT1 | 87 | 6.0 | 0.18 | 3.3 |
| MT2 | 150 | 6.2 | 0.25 | 3.1 |
| MT2-200 | 139 | 6.6 | 0.27 | 3.1 |
| MT2-400 | 93 | 7.9 | 0.22 | 3.2 |
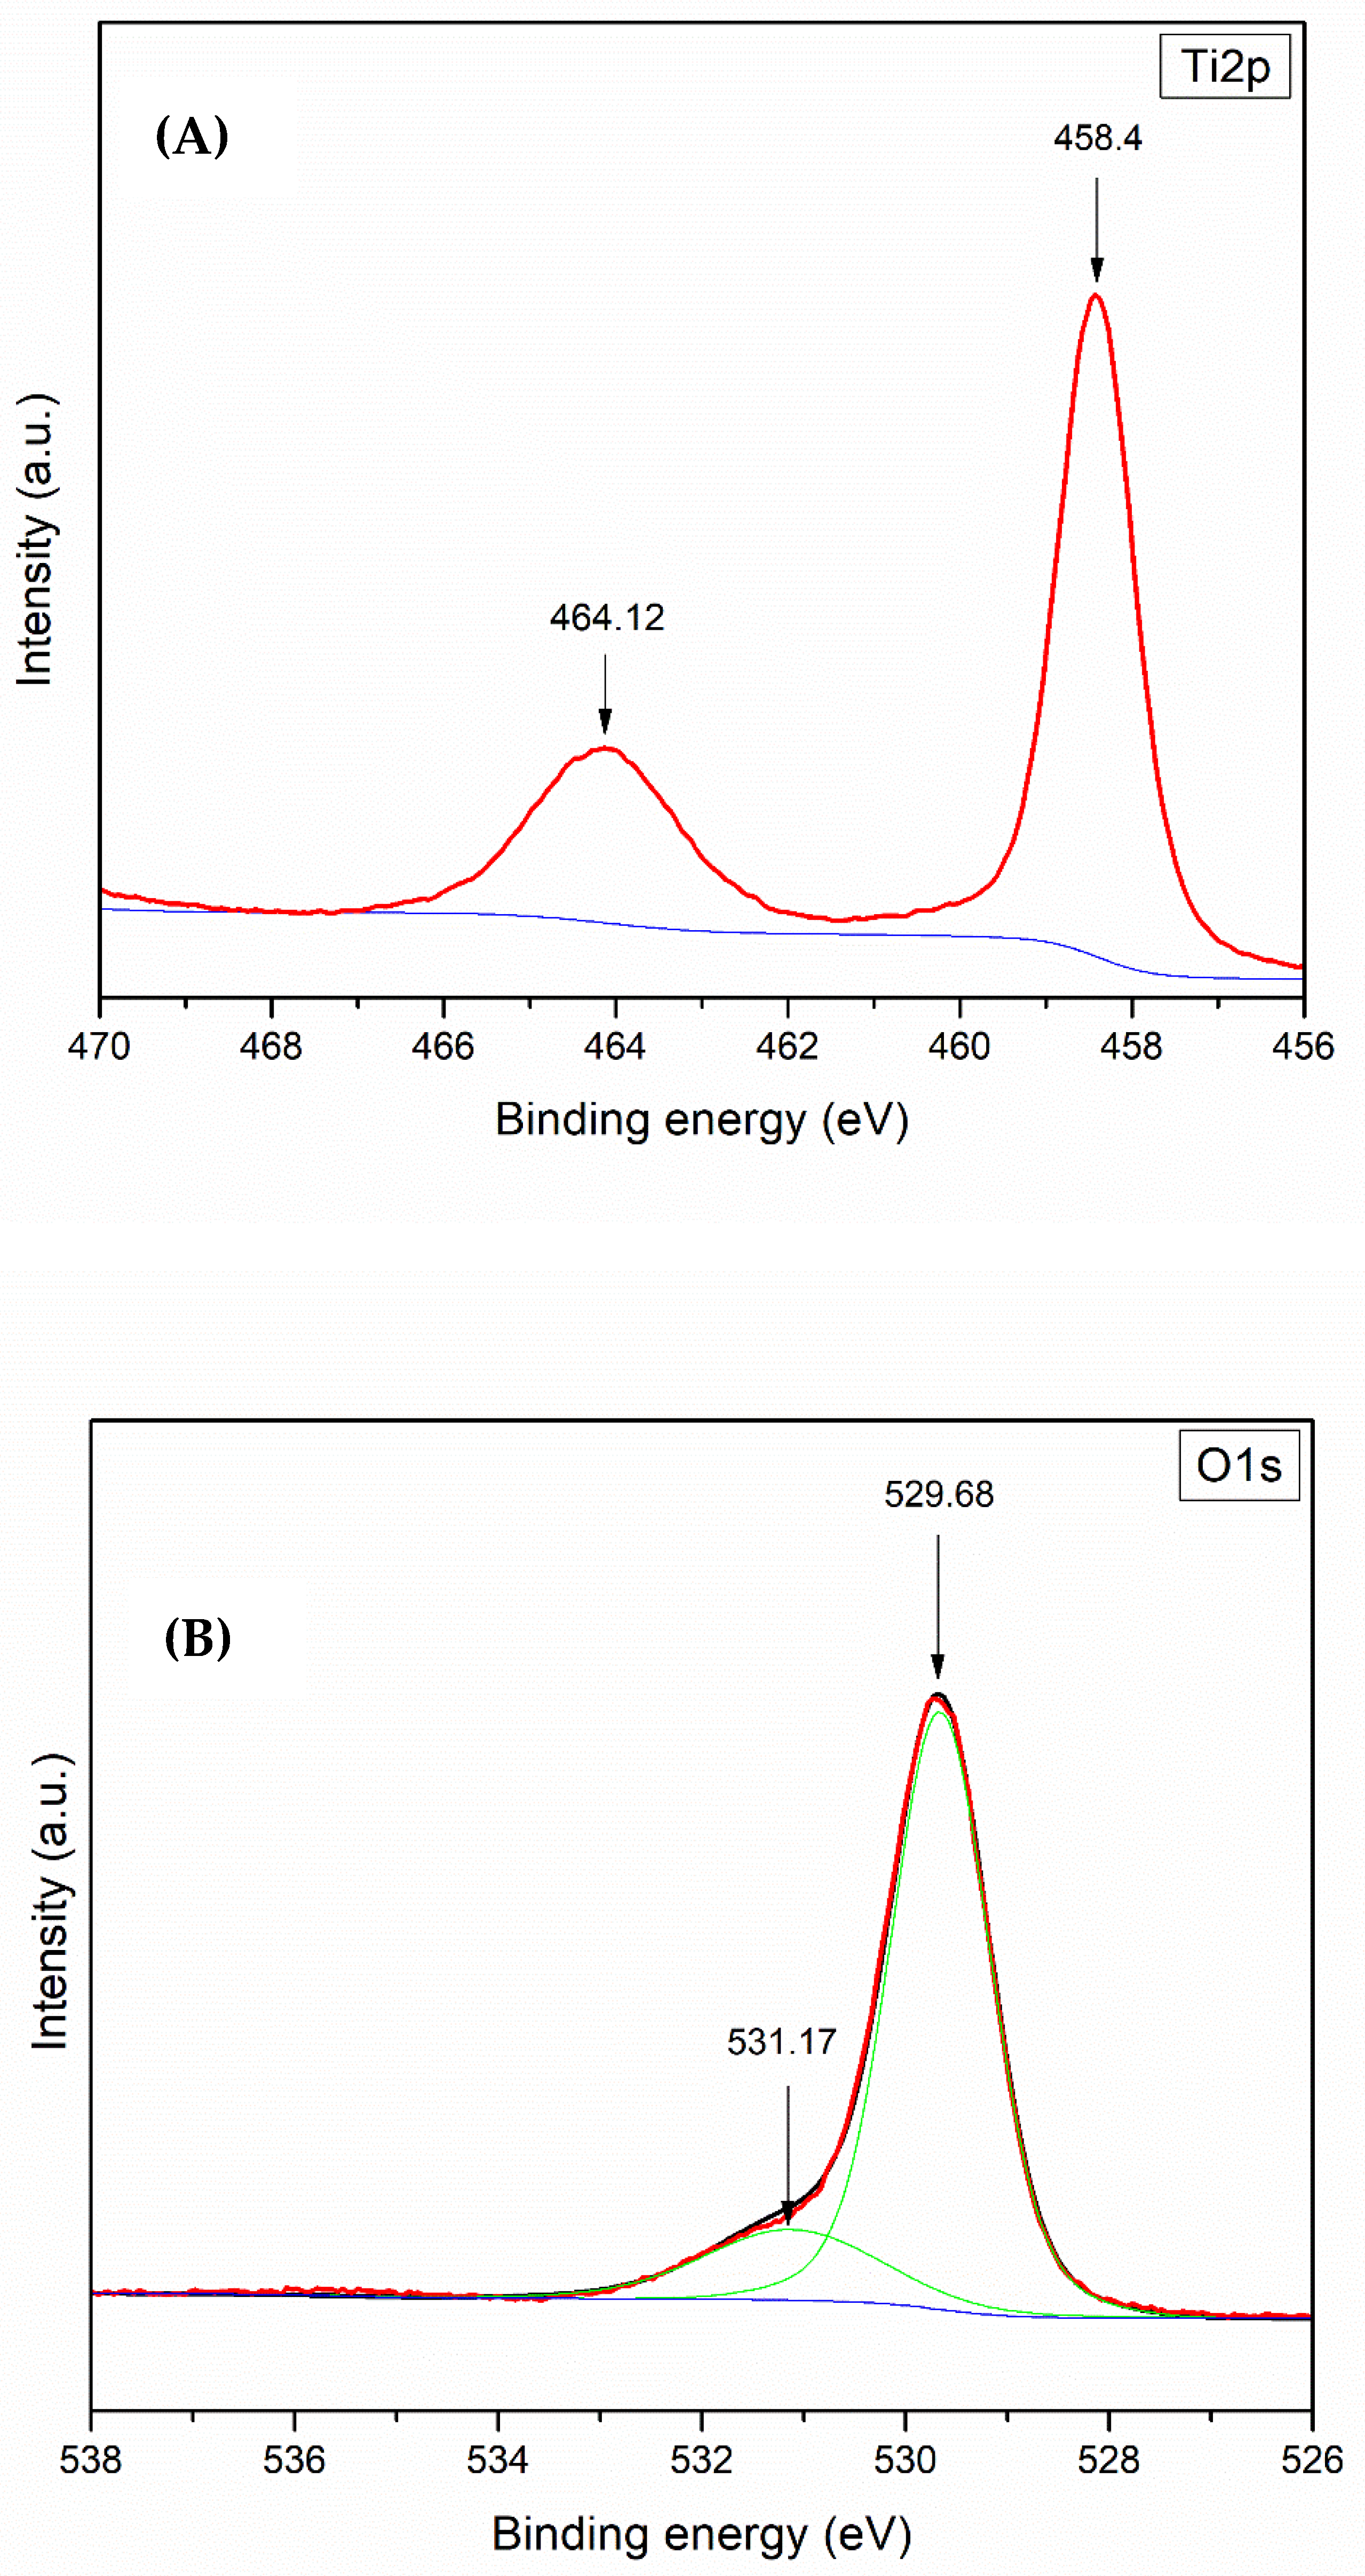
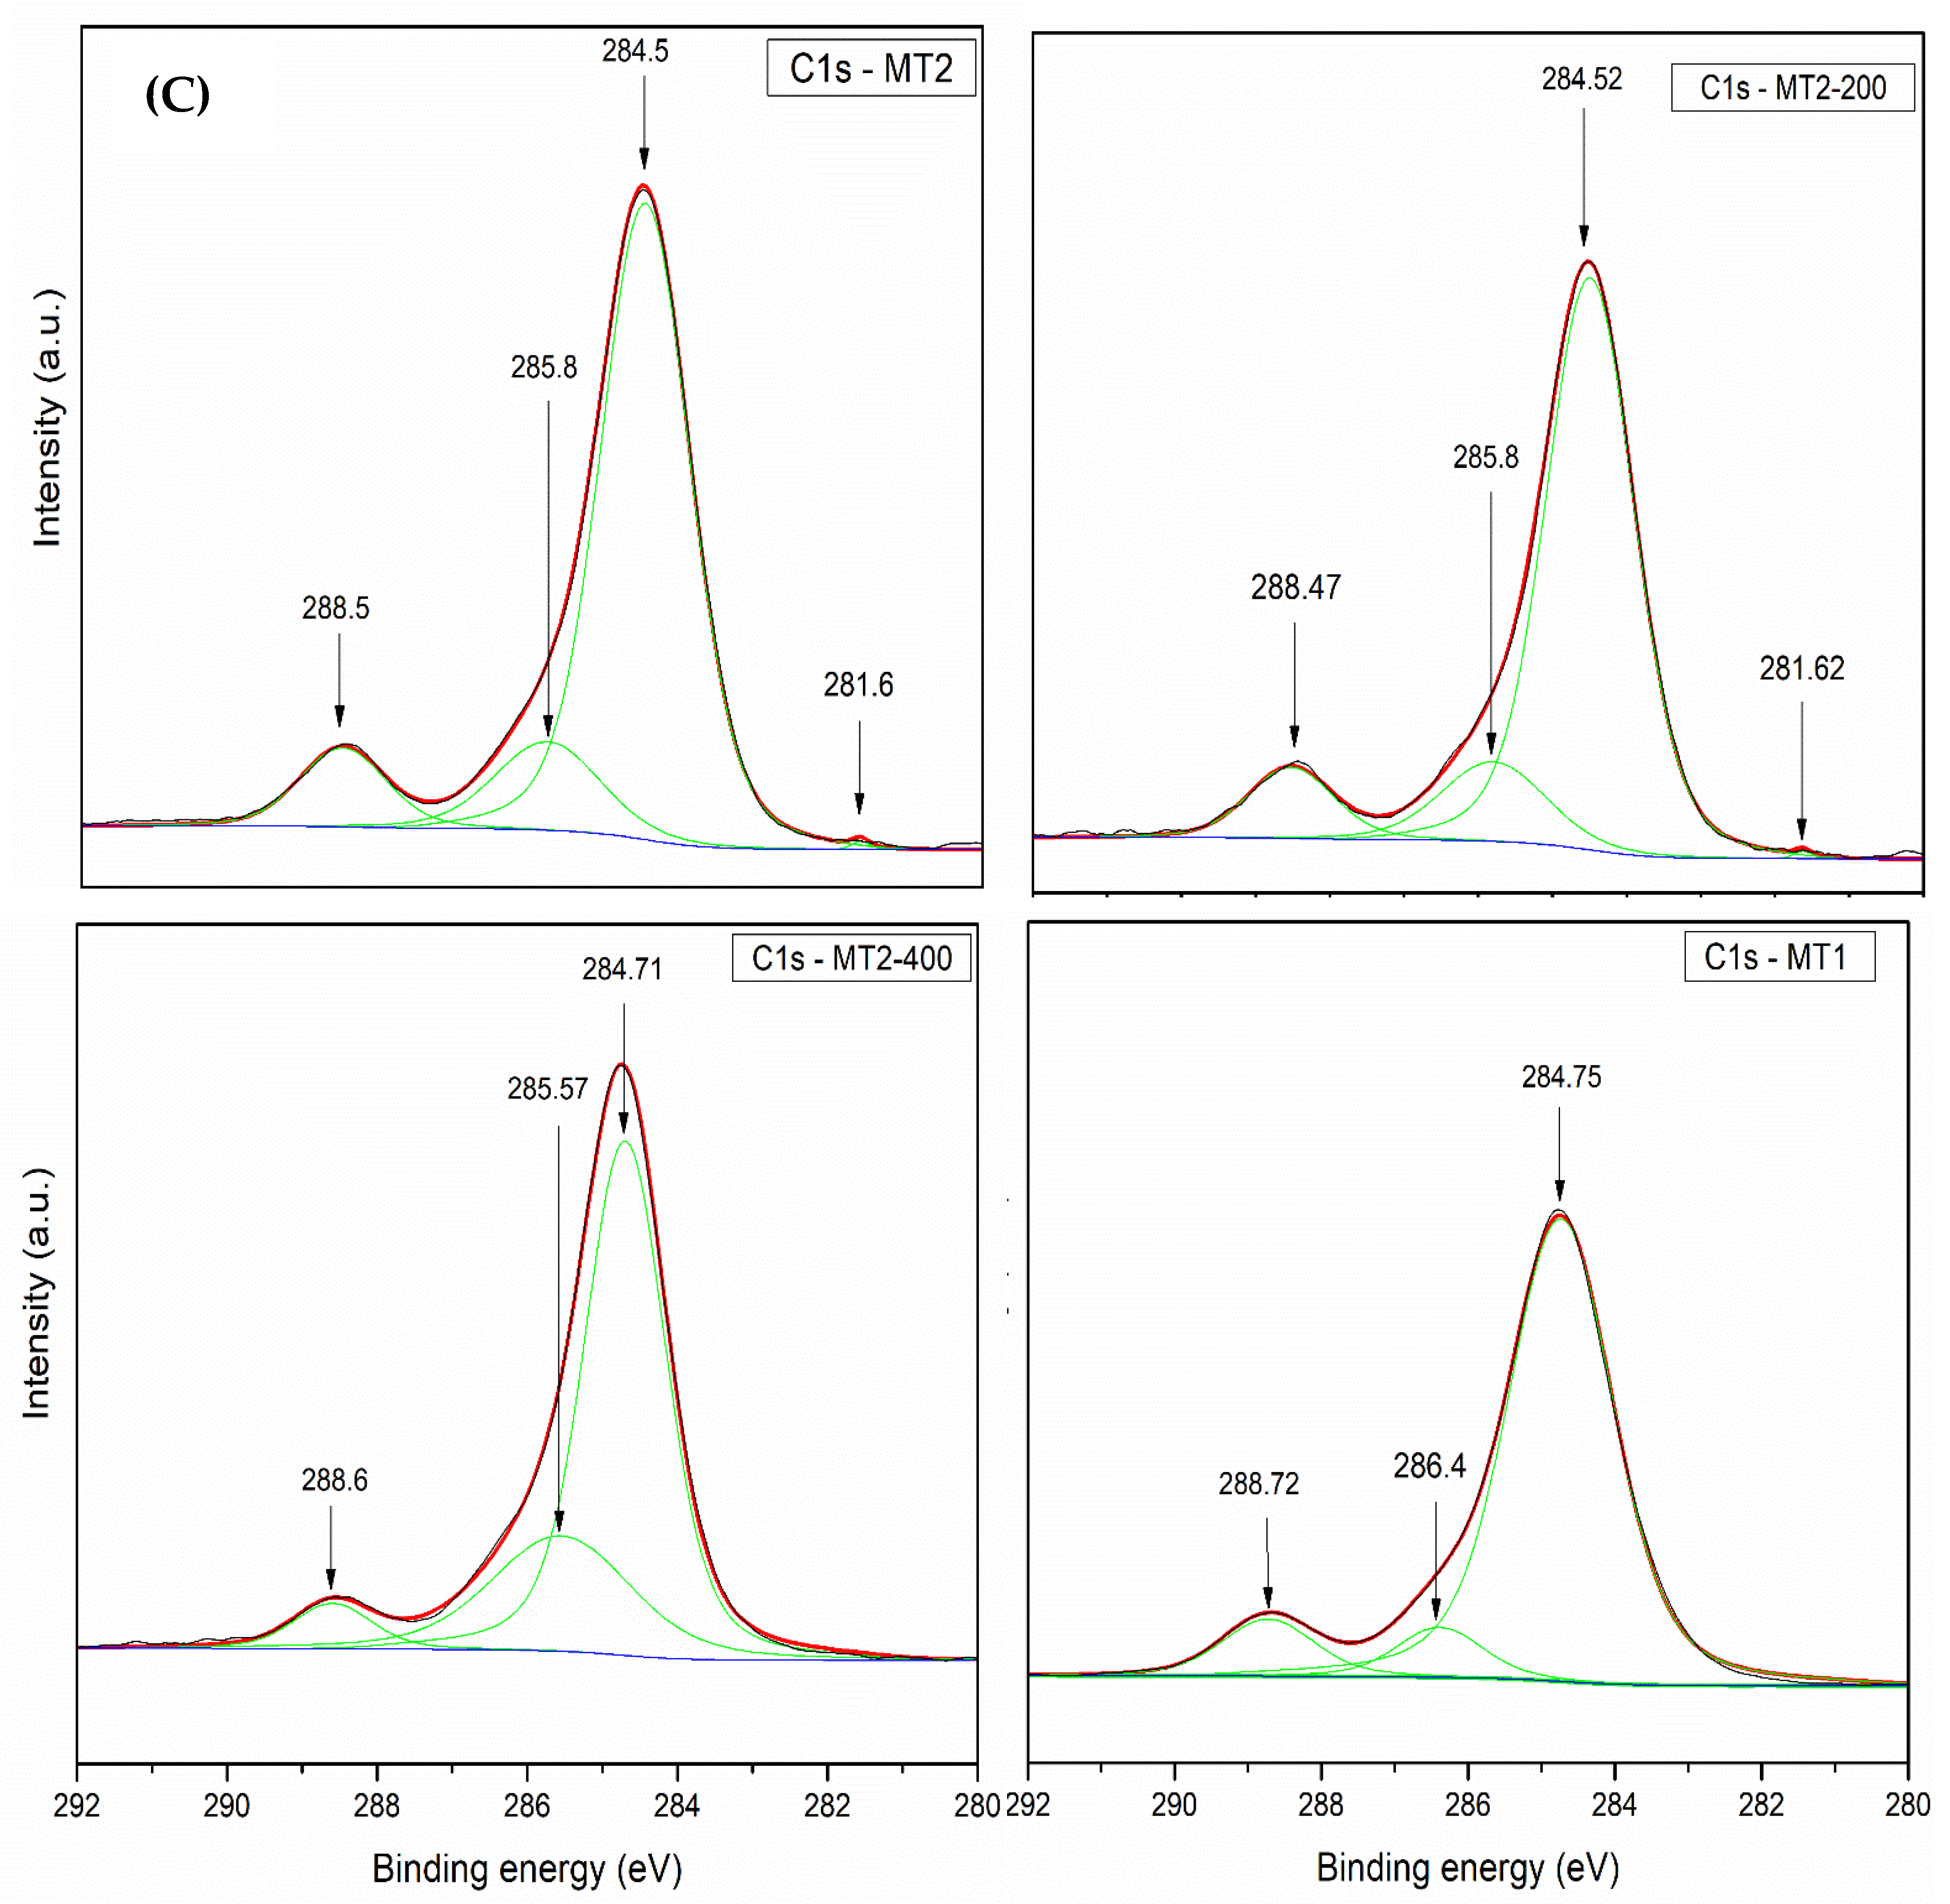
| Sample | Ti–C | C–C | C–O | C–O–Ti | ||||
|---|---|---|---|---|---|---|---|---|
| BE (eV) | % Area | BE (eV) | % Area | BE (eV) | % Area | BE (eV) | % Area | |
| MT2 | 281.6 | 2.1 | 284.5 | 73.5 | 285.8 | 12.0 | 288.5 | 12.4 |
| MT2–200 | 281.6 | 2.6 | 284.5 | 74.3 | 285.8 | 11.6 | 288.5 | 11.5 |
| MT2–400 | 281.0 | 0.9 | 284.7 | 71.2 | 285.6 | 16.8 | 288.6 | 11.1 |
| MT1 | 281.3 | 0.7 | 284.4 | 77.4 | 286.4 | 10.7 | 288.7 | 11.2 |
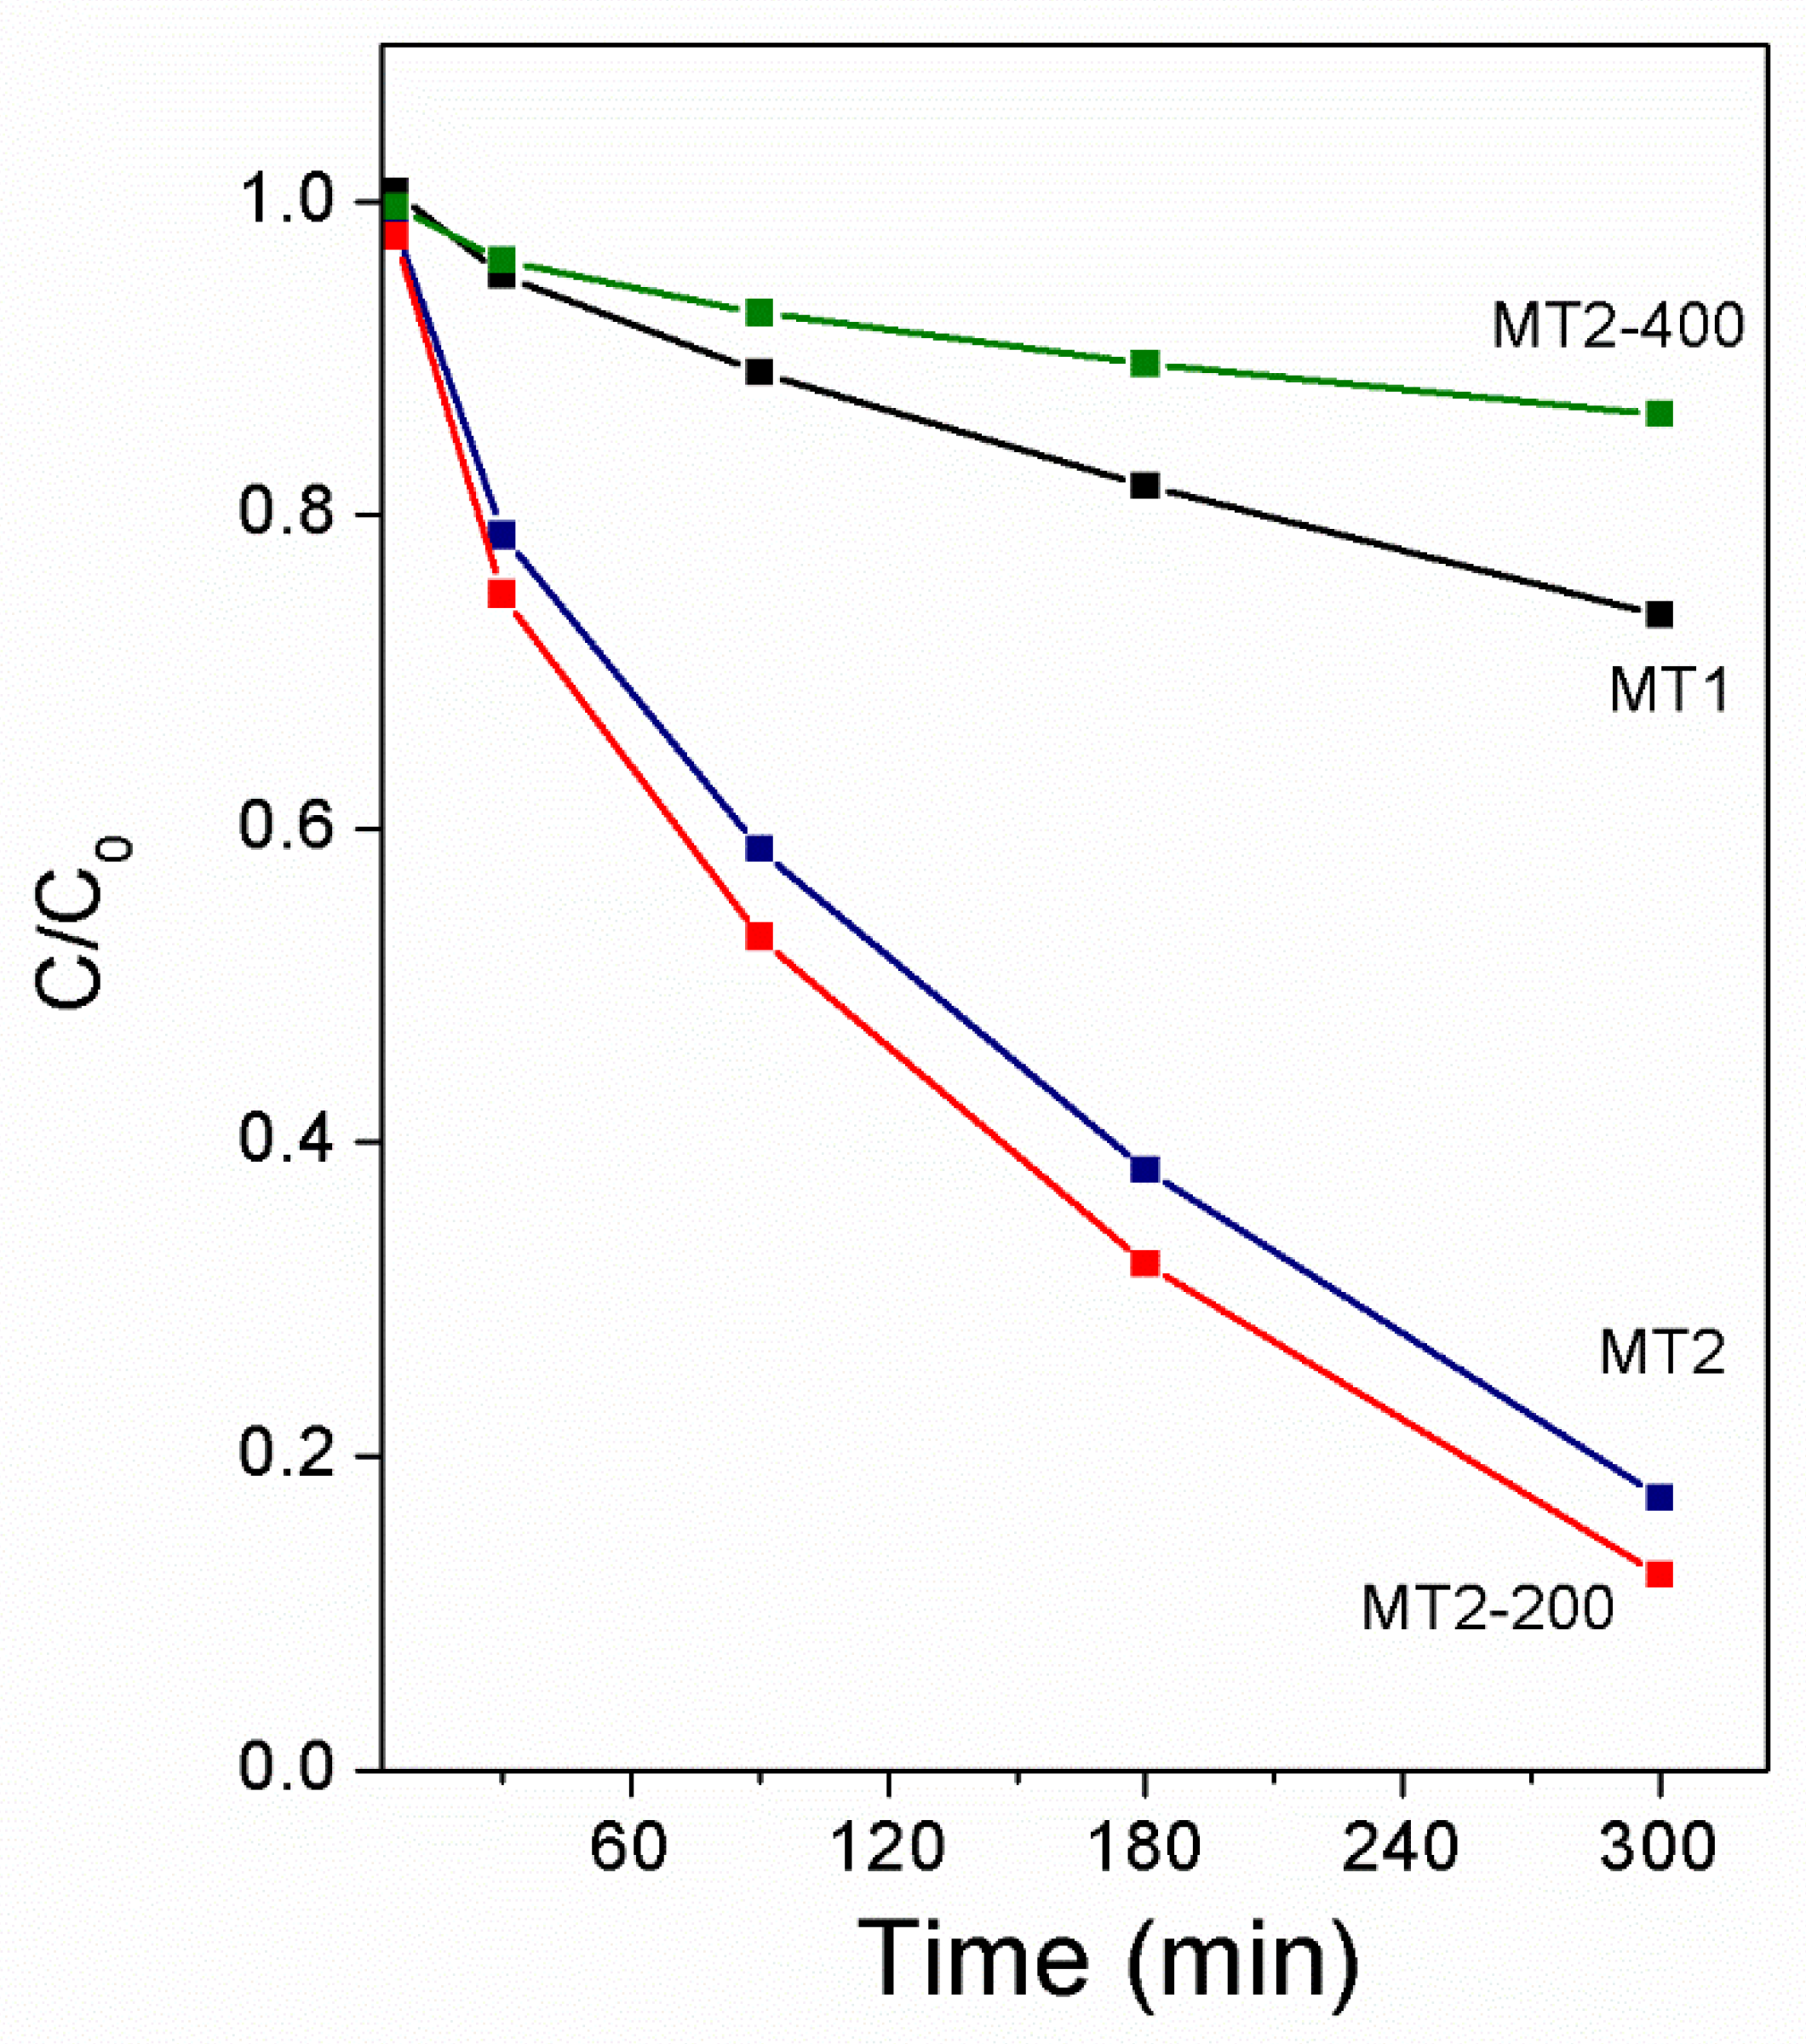
| Photocatalyst | % Degradation | % Mineralization |
|---|---|---|
| MT1 | 26 | 0 |
| MT2 | 84 | 27 |
| MT2–200 | 89 | 51 |
| MT2–400 | 14 | 0 |
© 2019 by the authors. Licensee MDPI, Basel, Switzerland. This article is an open access article distributed under the terms and conditions of the Creative Commons Attribution (CC BY) license (http://creativecommons.org/licenses/by/4.0/).
Share and Cite
Ochoa Rodríguez, P.A.; Benzaquén, T.B.; Pecchi, G.A.; Casuscelli, S.G.; Elías, V.R.; Eimer, G.A. Novel Route to Obtain Carbon Self-Doped TiO2 Mesoporous Nanoparticles as Efficient Photocatalysts for Environmental Remediation Processes under Visible Light. Materials 2019, 12, 3349. https://doi.org/10.3390/ma12203349
Ochoa Rodríguez PA, Benzaquén TB, Pecchi GA, Casuscelli SG, Elías VR, Eimer GA. Novel Route to Obtain Carbon Self-Doped TiO2 Mesoporous Nanoparticles as Efficient Photocatalysts for Environmental Remediation Processes under Visible Light. Materials. 2019; 12(20):3349. https://doi.org/10.3390/ma12203349
Chicago/Turabian StyleOchoa Rodríguez, Pablo A., Tamara B. Benzaquén, Gina A. Pecchi, Sandra G. Casuscelli, Verónica R. Elías, and Griselda A. Eimer. 2019. "Novel Route to Obtain Carbon Self-Doped TiO2 Mesoporous Nanoparticles as Efficient Photocatalysts for Environmental Remediation Processes under Visible Light" Materials 12, no. 20: 3349. https://doi.org/10.3390/ma12203349