Effect of SO2 on the Selective Catalytic Reduction of NOx over V2O5-CeO2/TiO2-ZrO2 Catalysts

Abstract
:1. Introduction
2. Materials and Methods
2.1. Catalyst Preparation
2.2. Activity Measurements
2.3. Catalyst Characterization
3. Results and Discussion
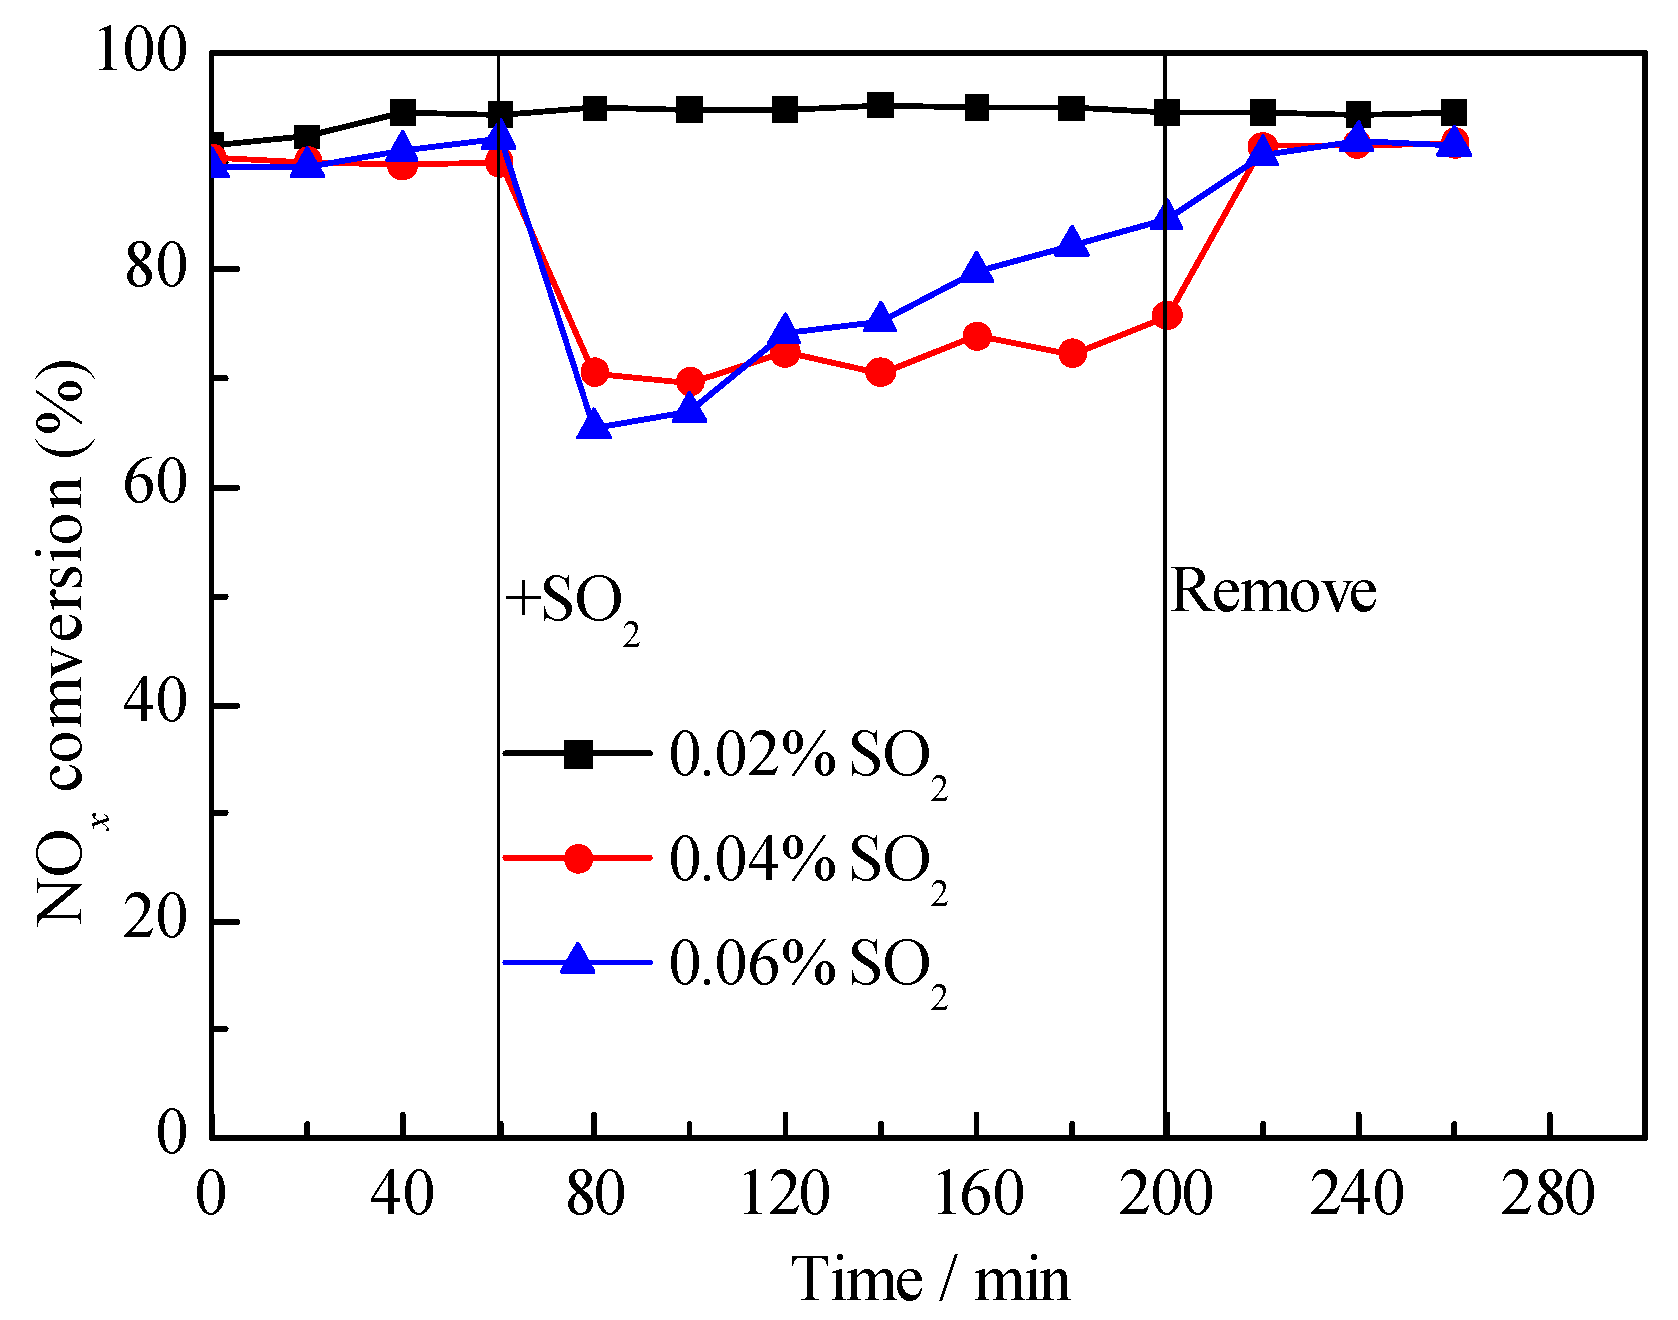
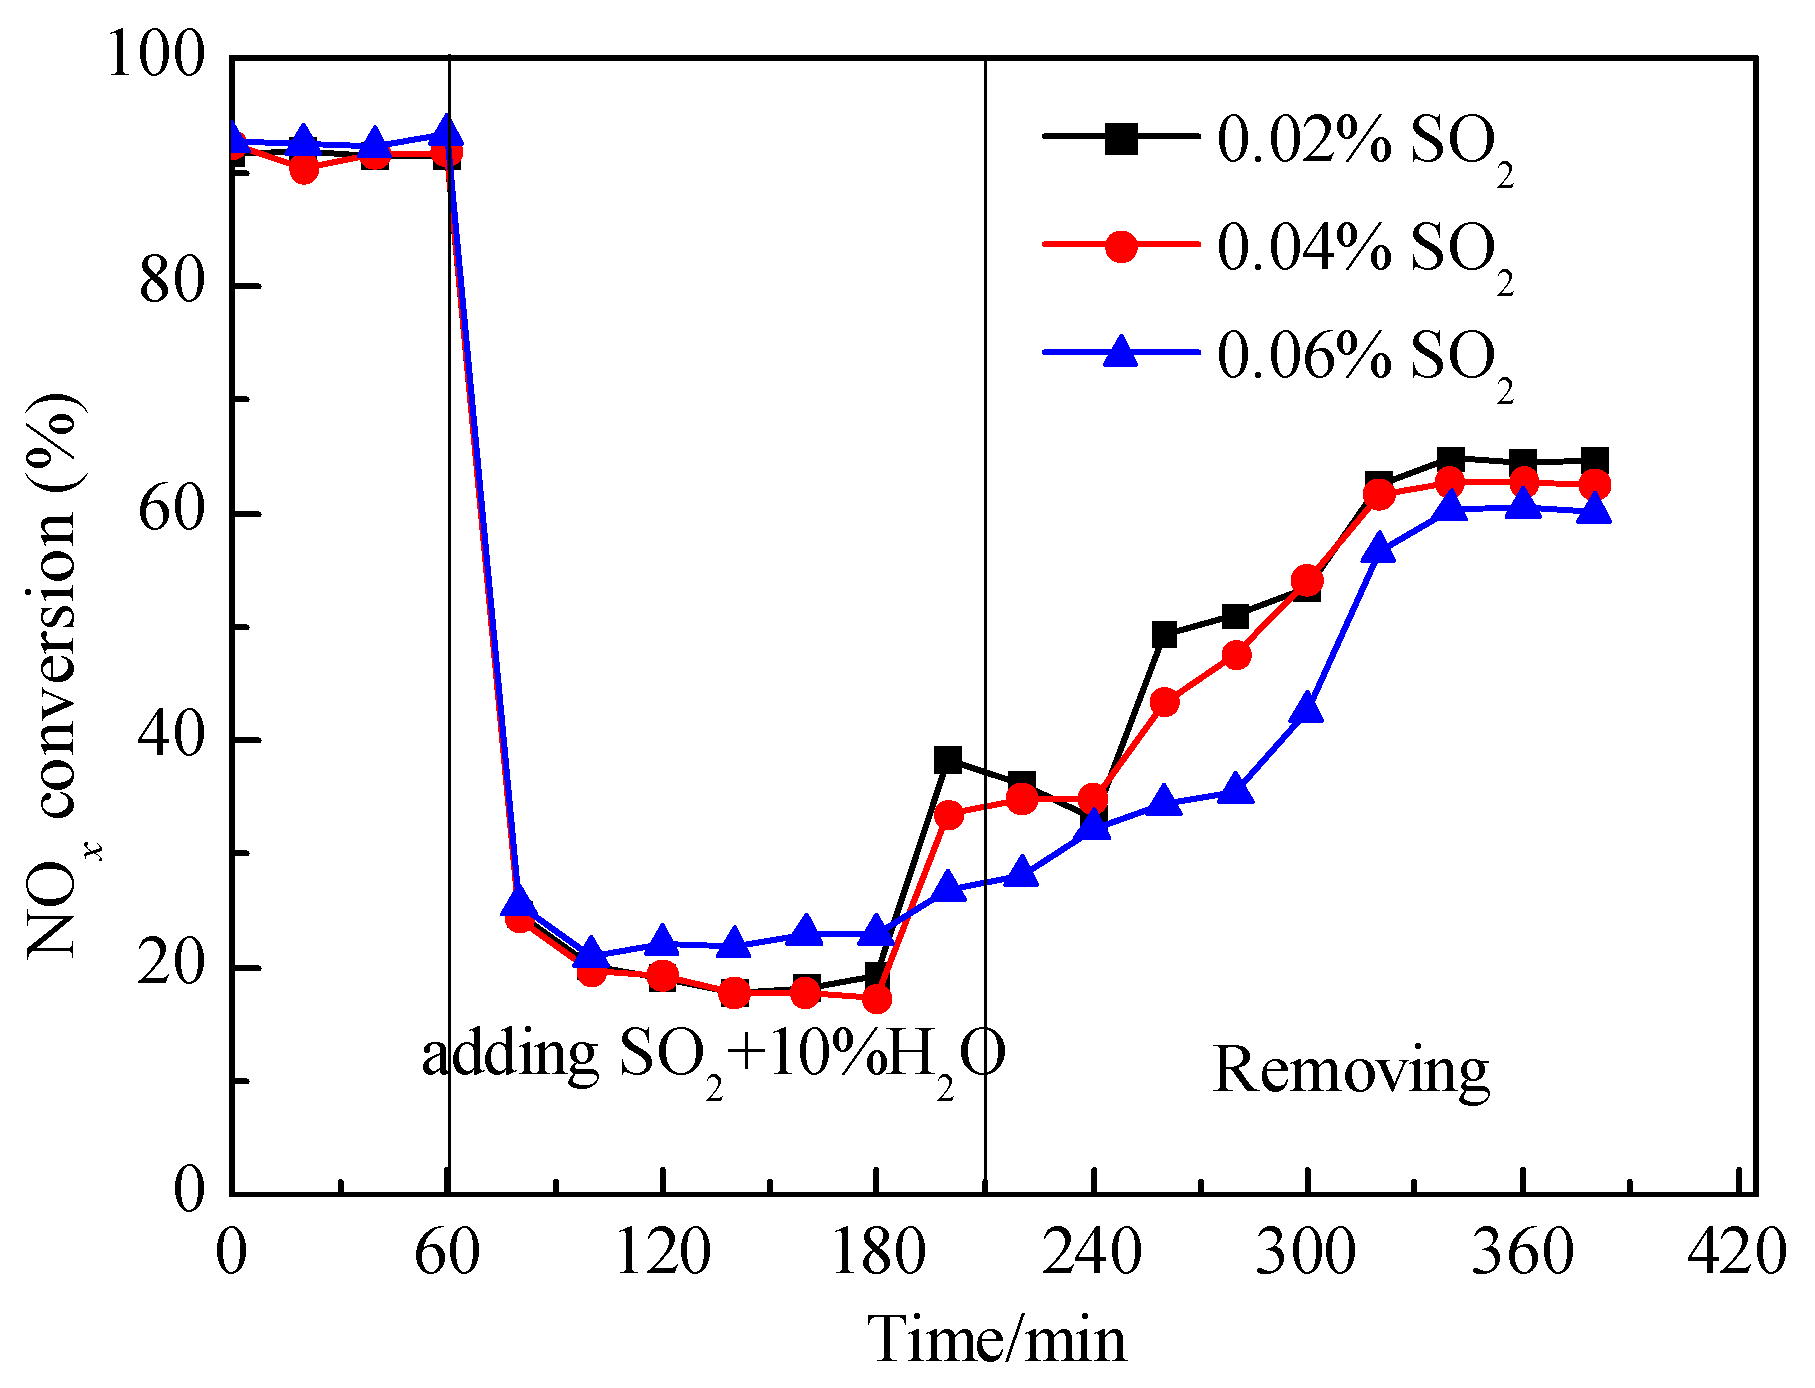
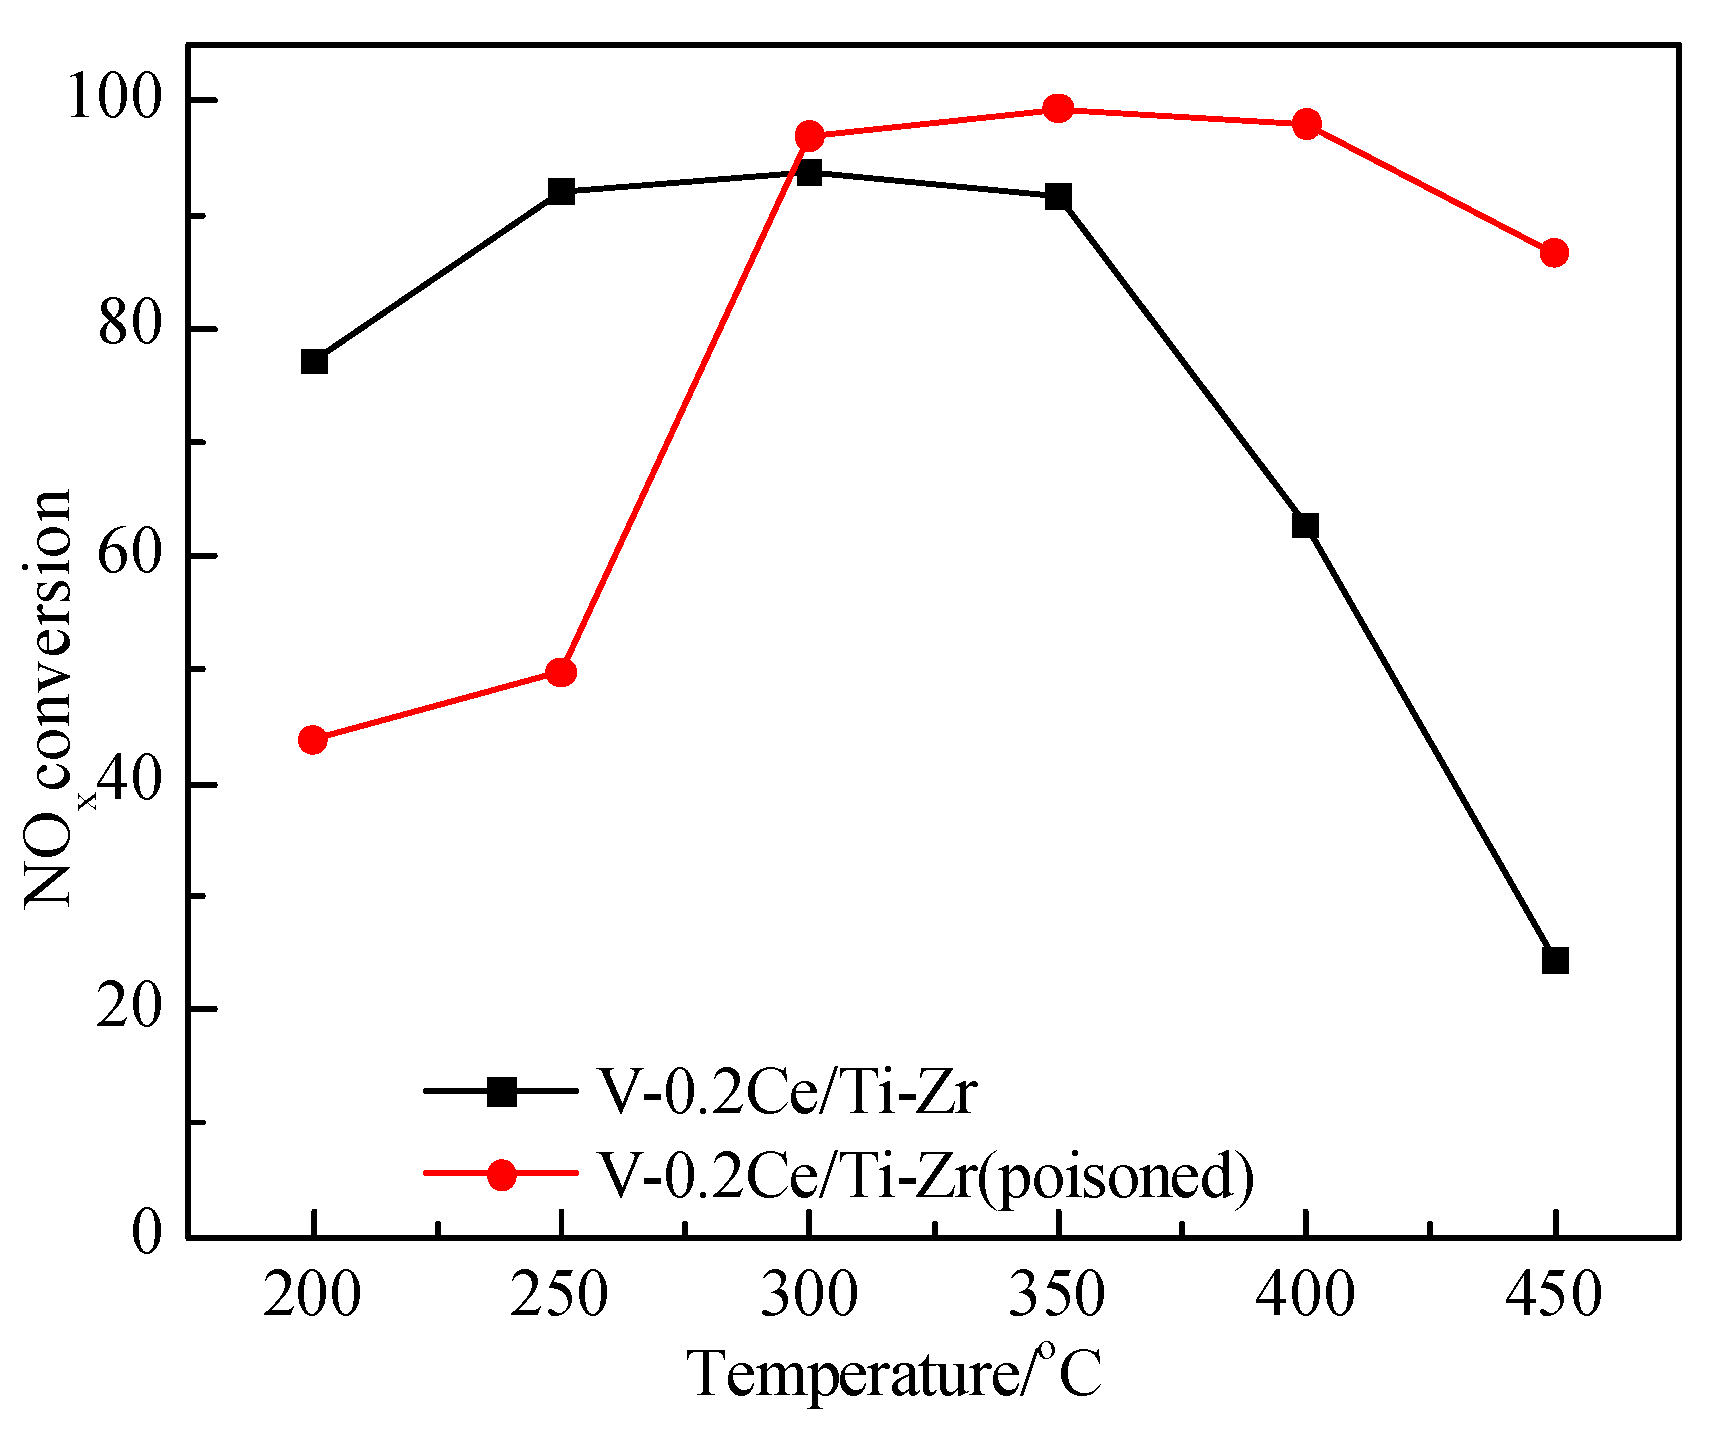
3.1. Effects of SO2 and H2O on Catalyst Activity
3.2. Physico-Chemical Characterization of Catalysts
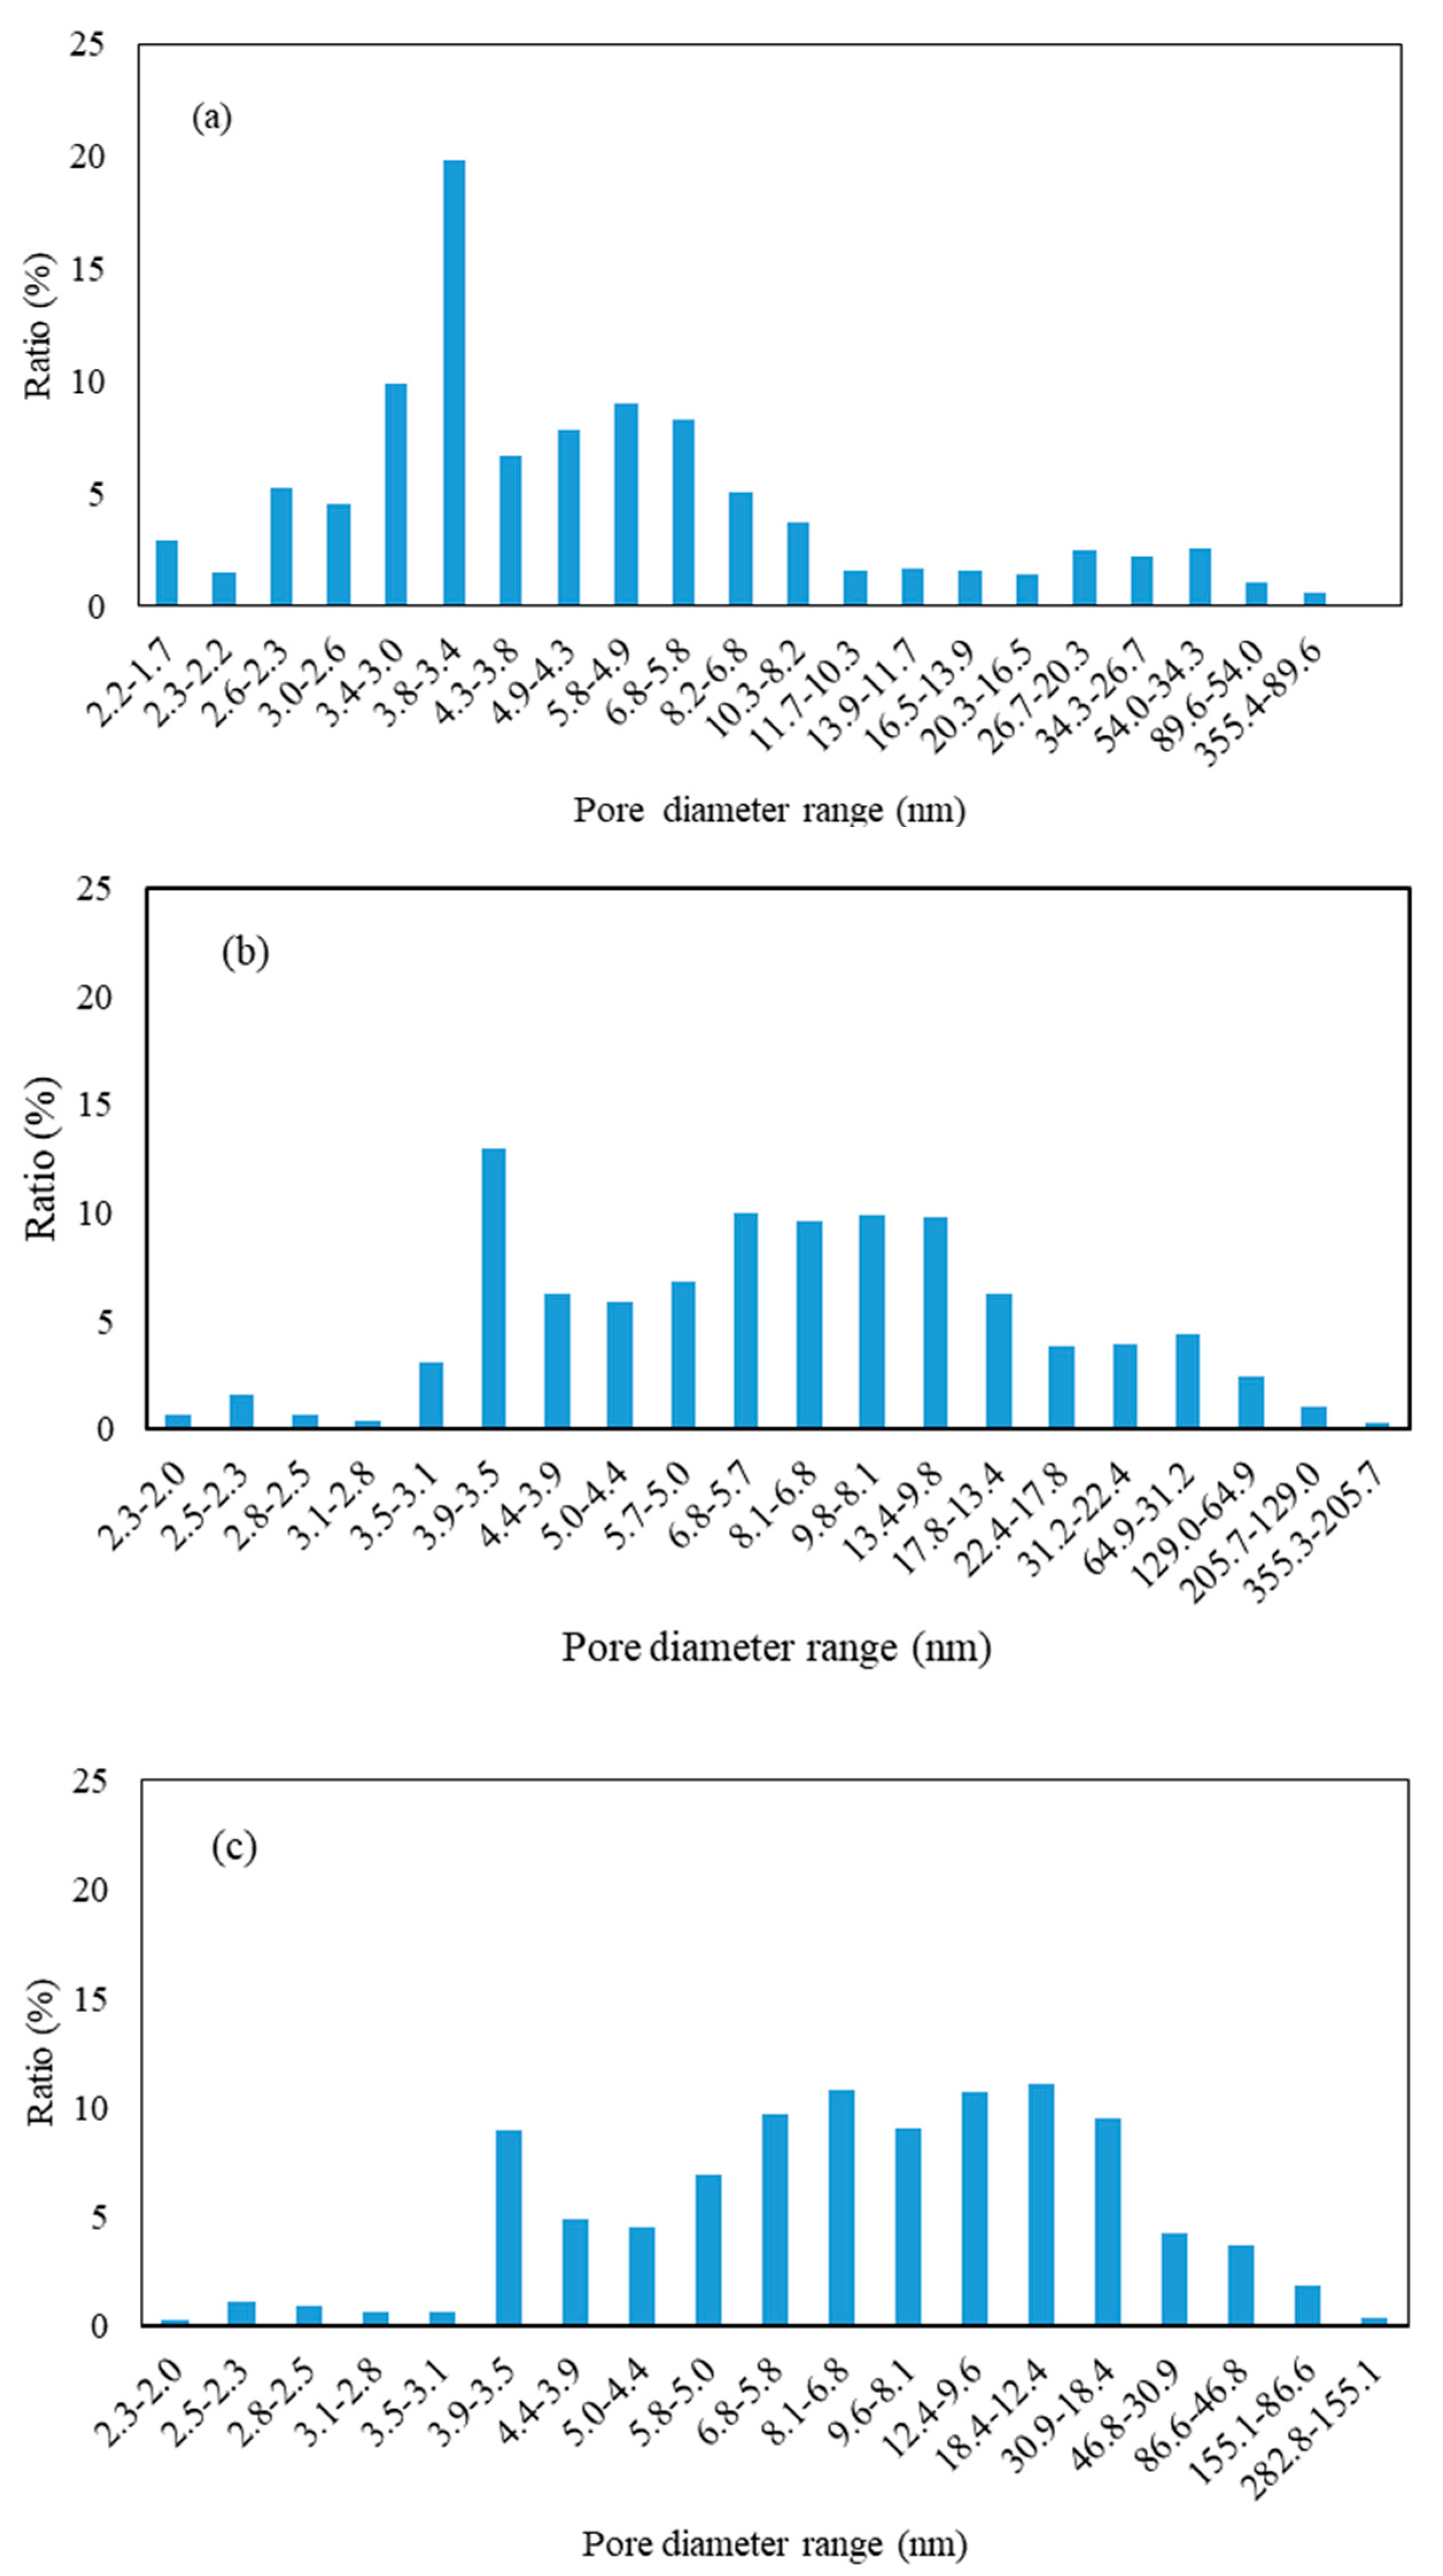
3.2.1. BET Analysis
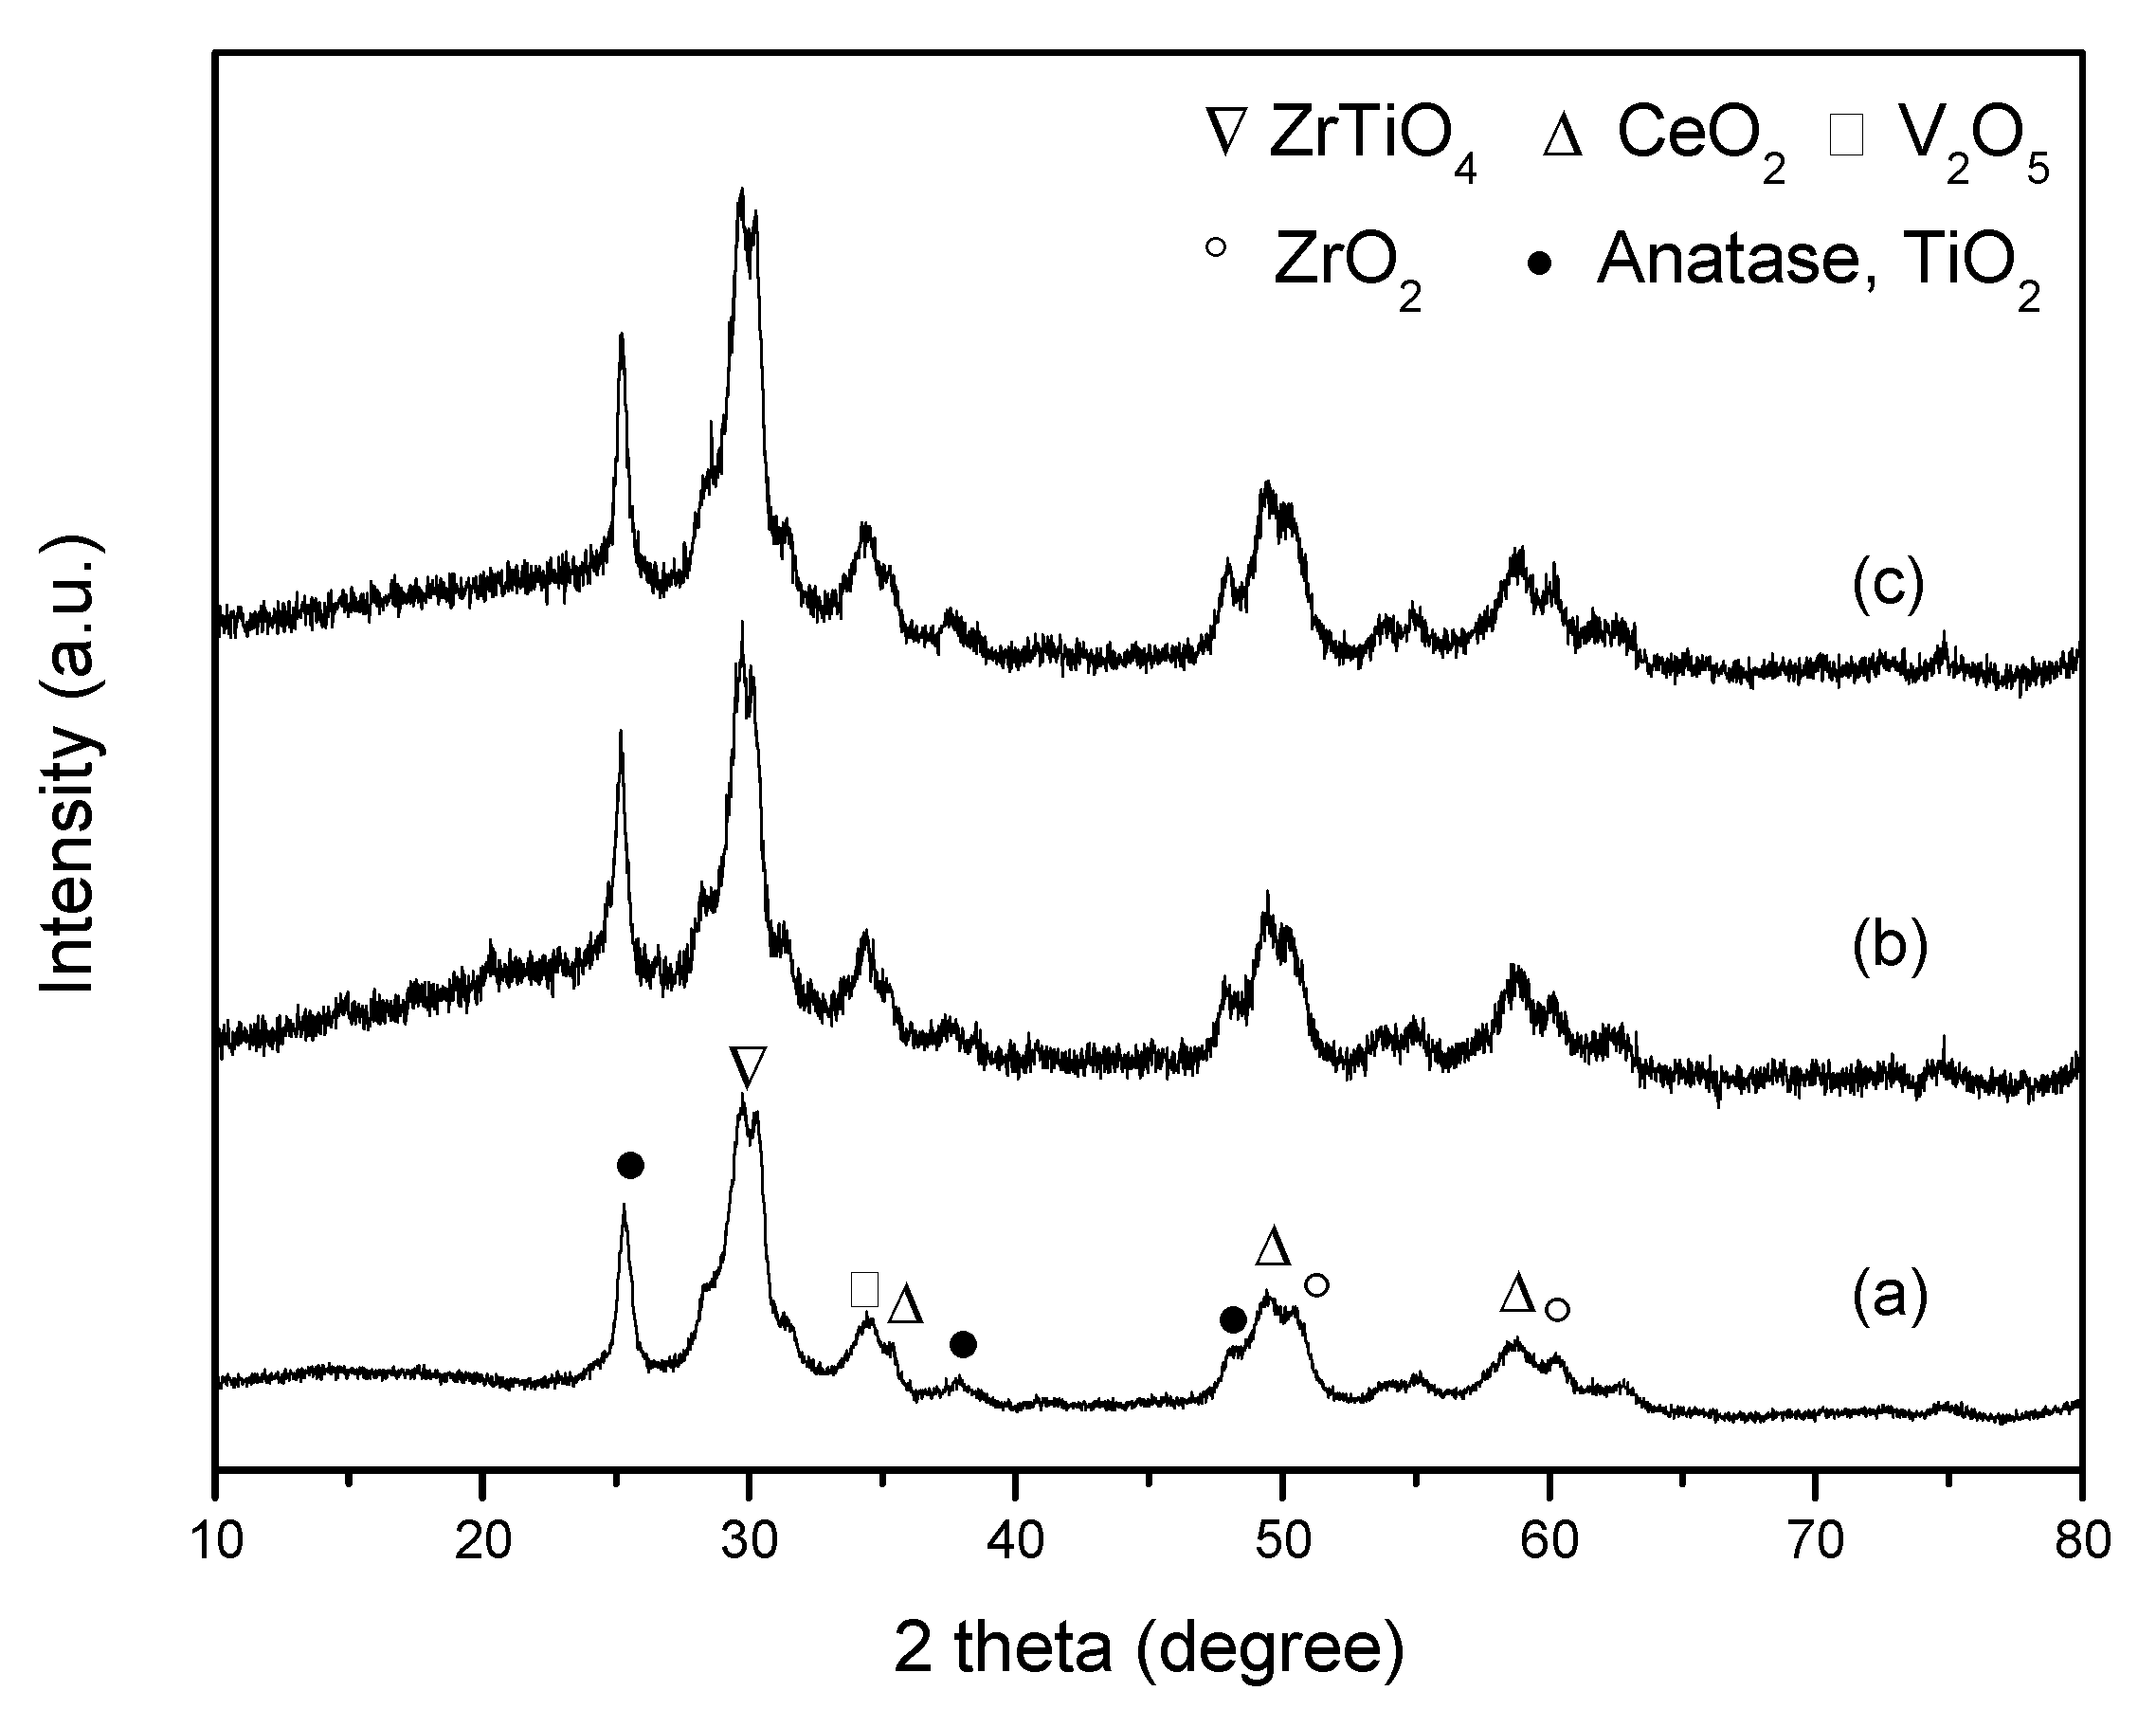
3.2.2. XRD Analysis
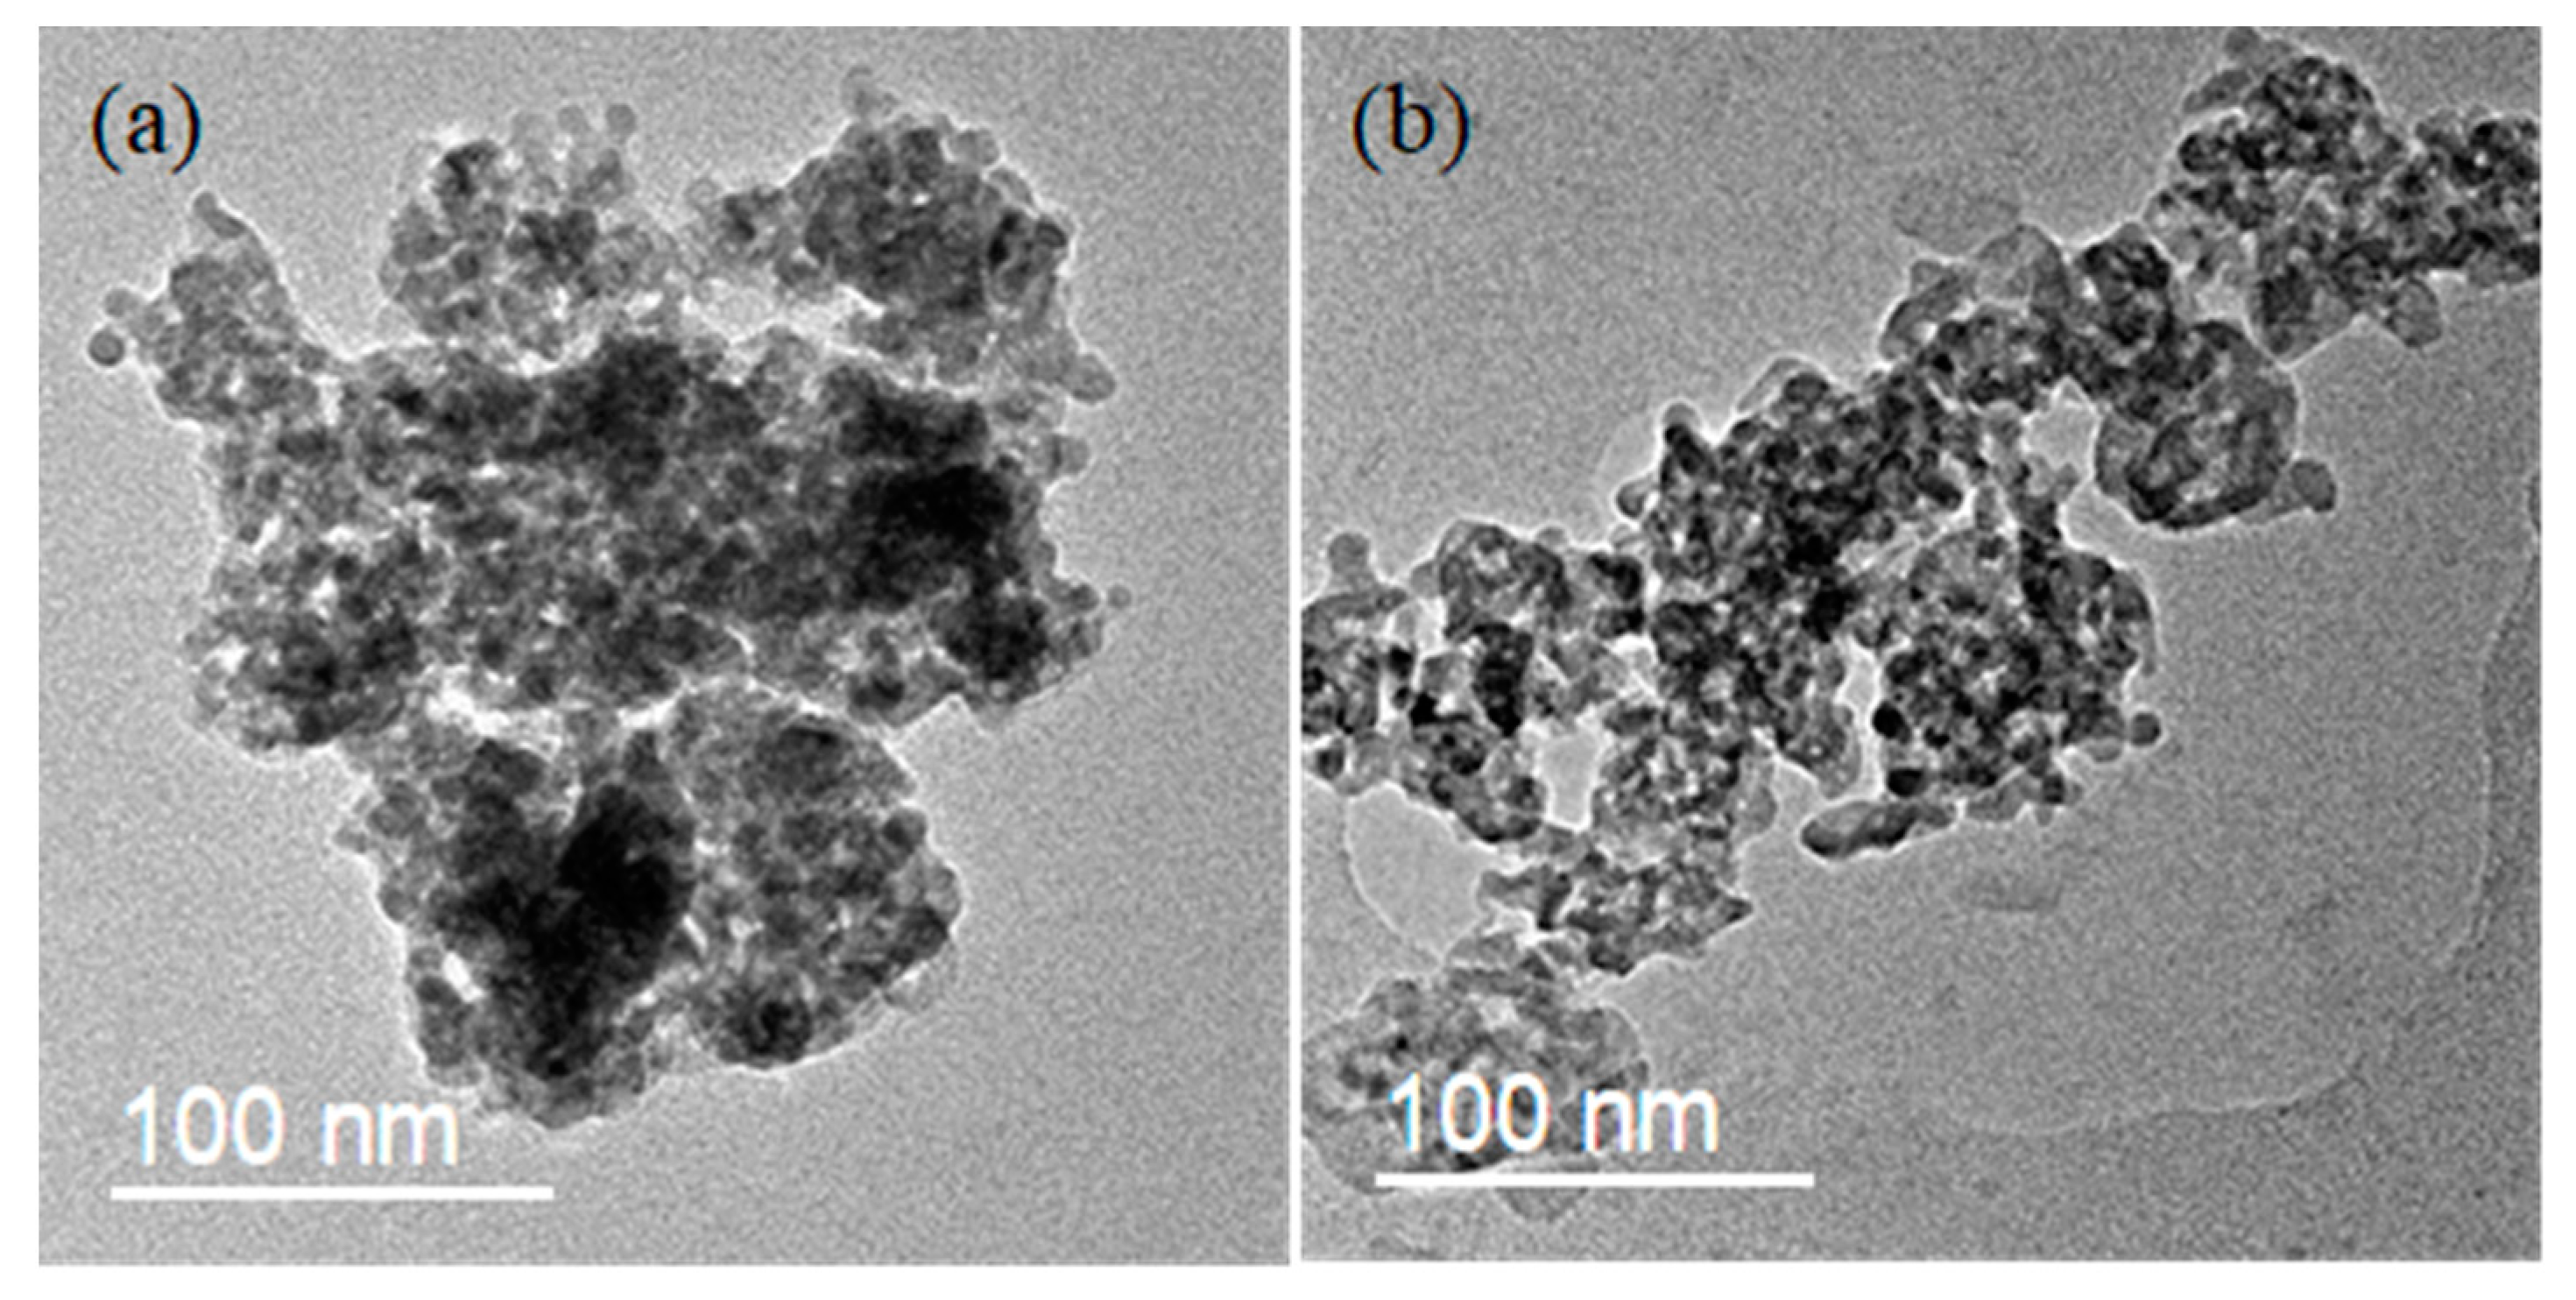
3.2.3. TEM and XRF Analysis
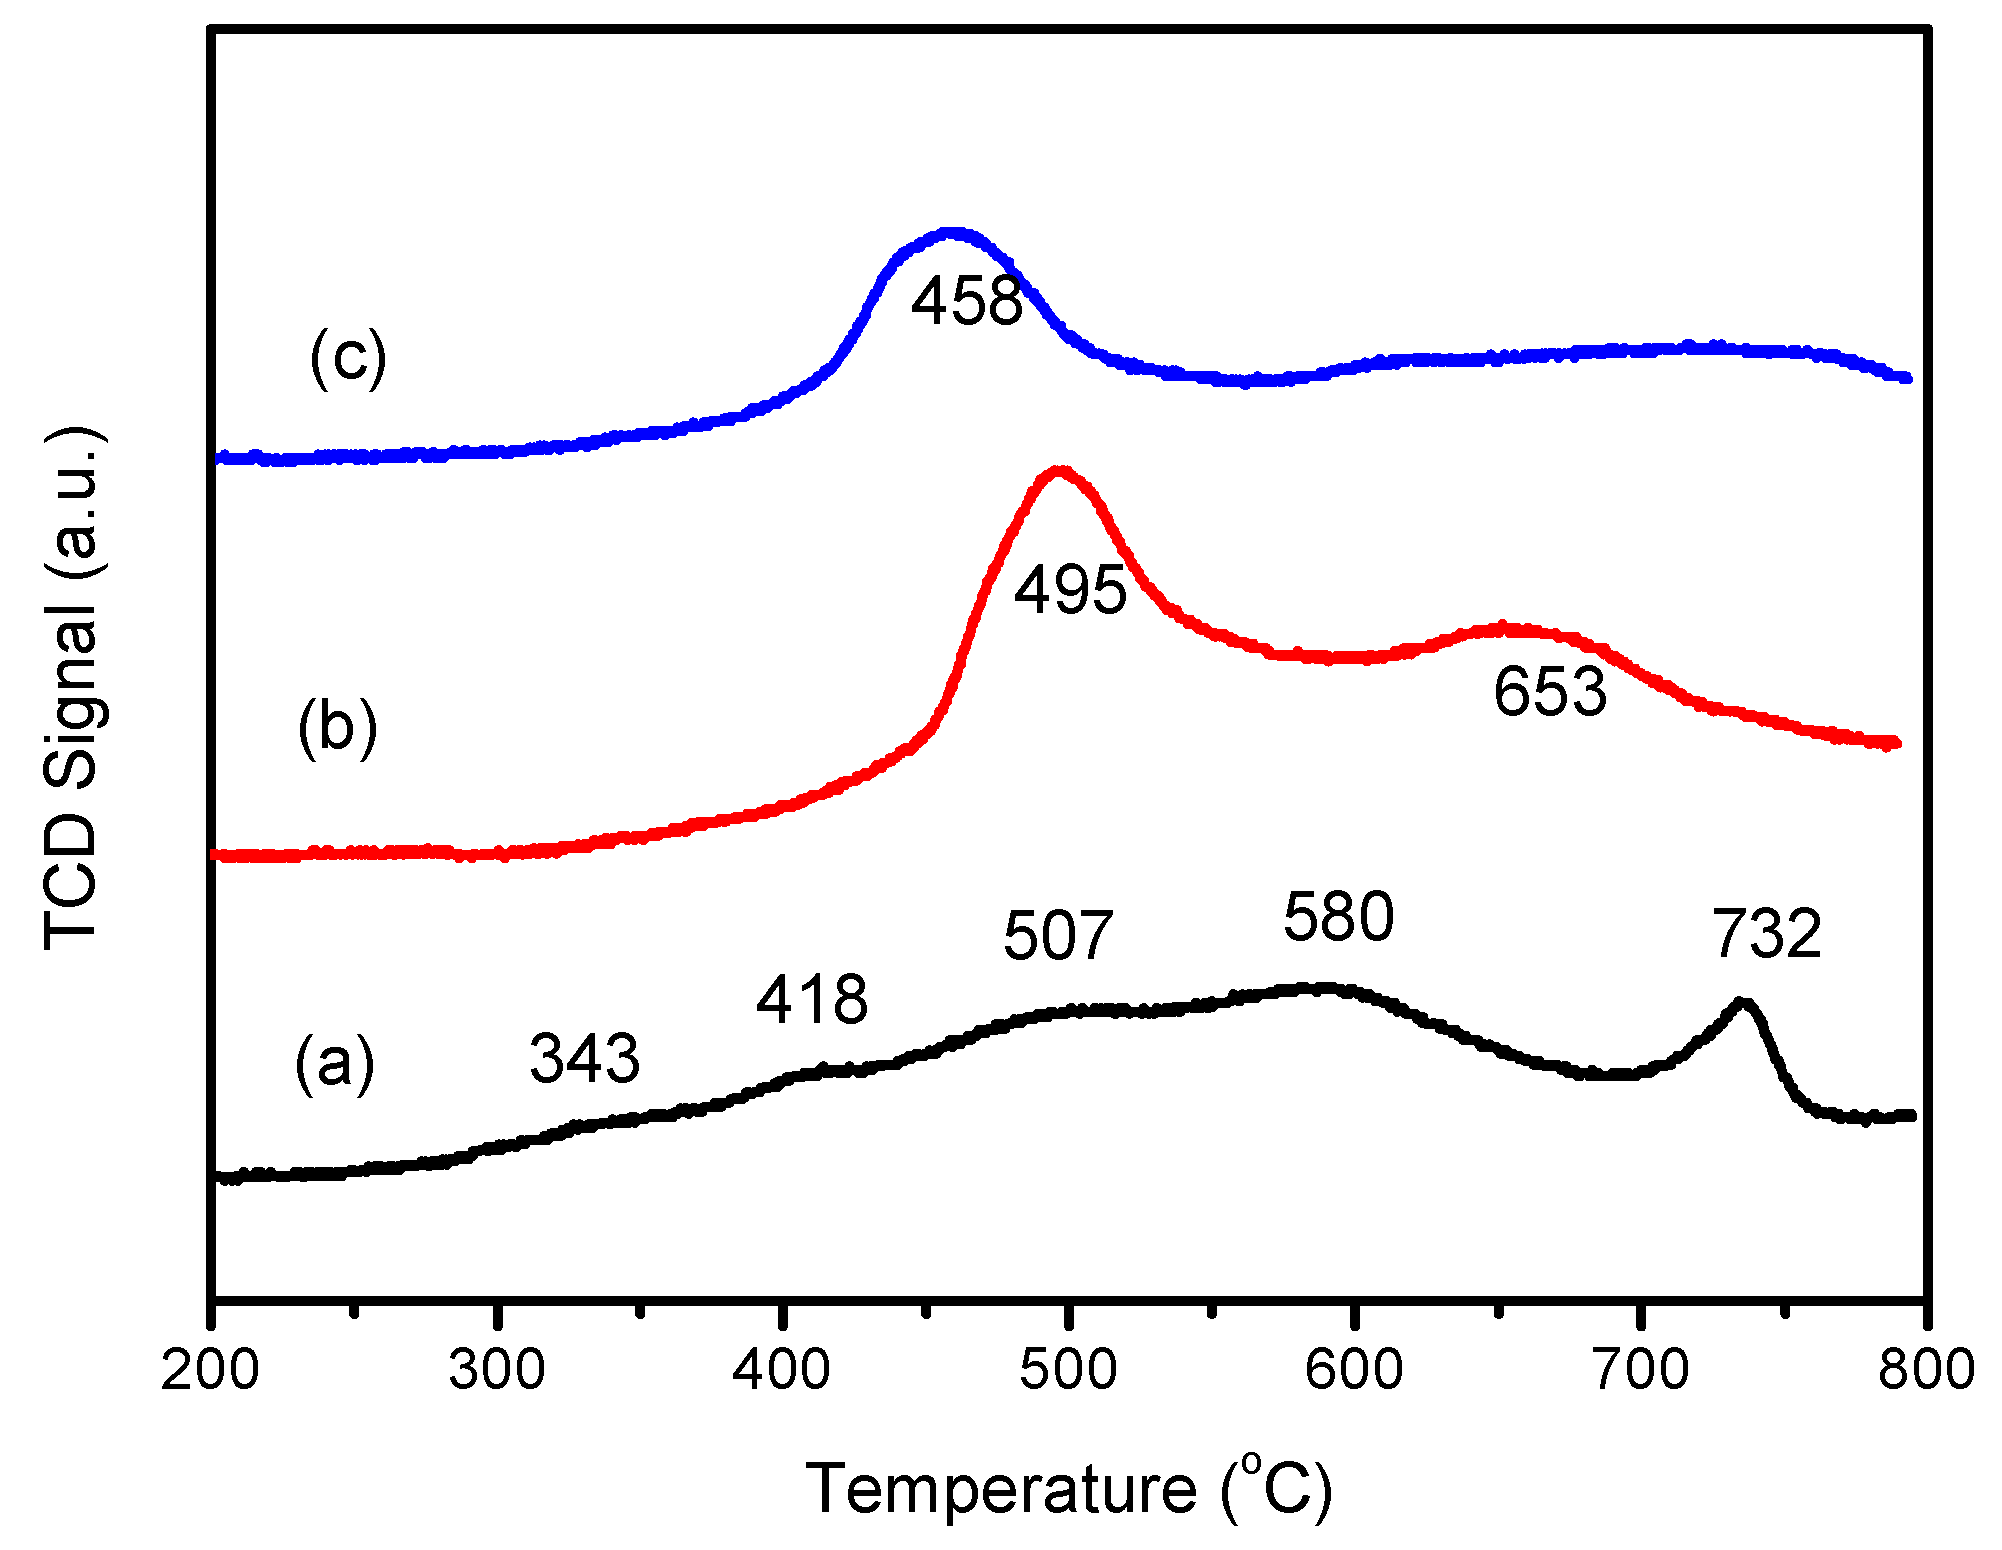
3.2.4. H2-TPR Analysis
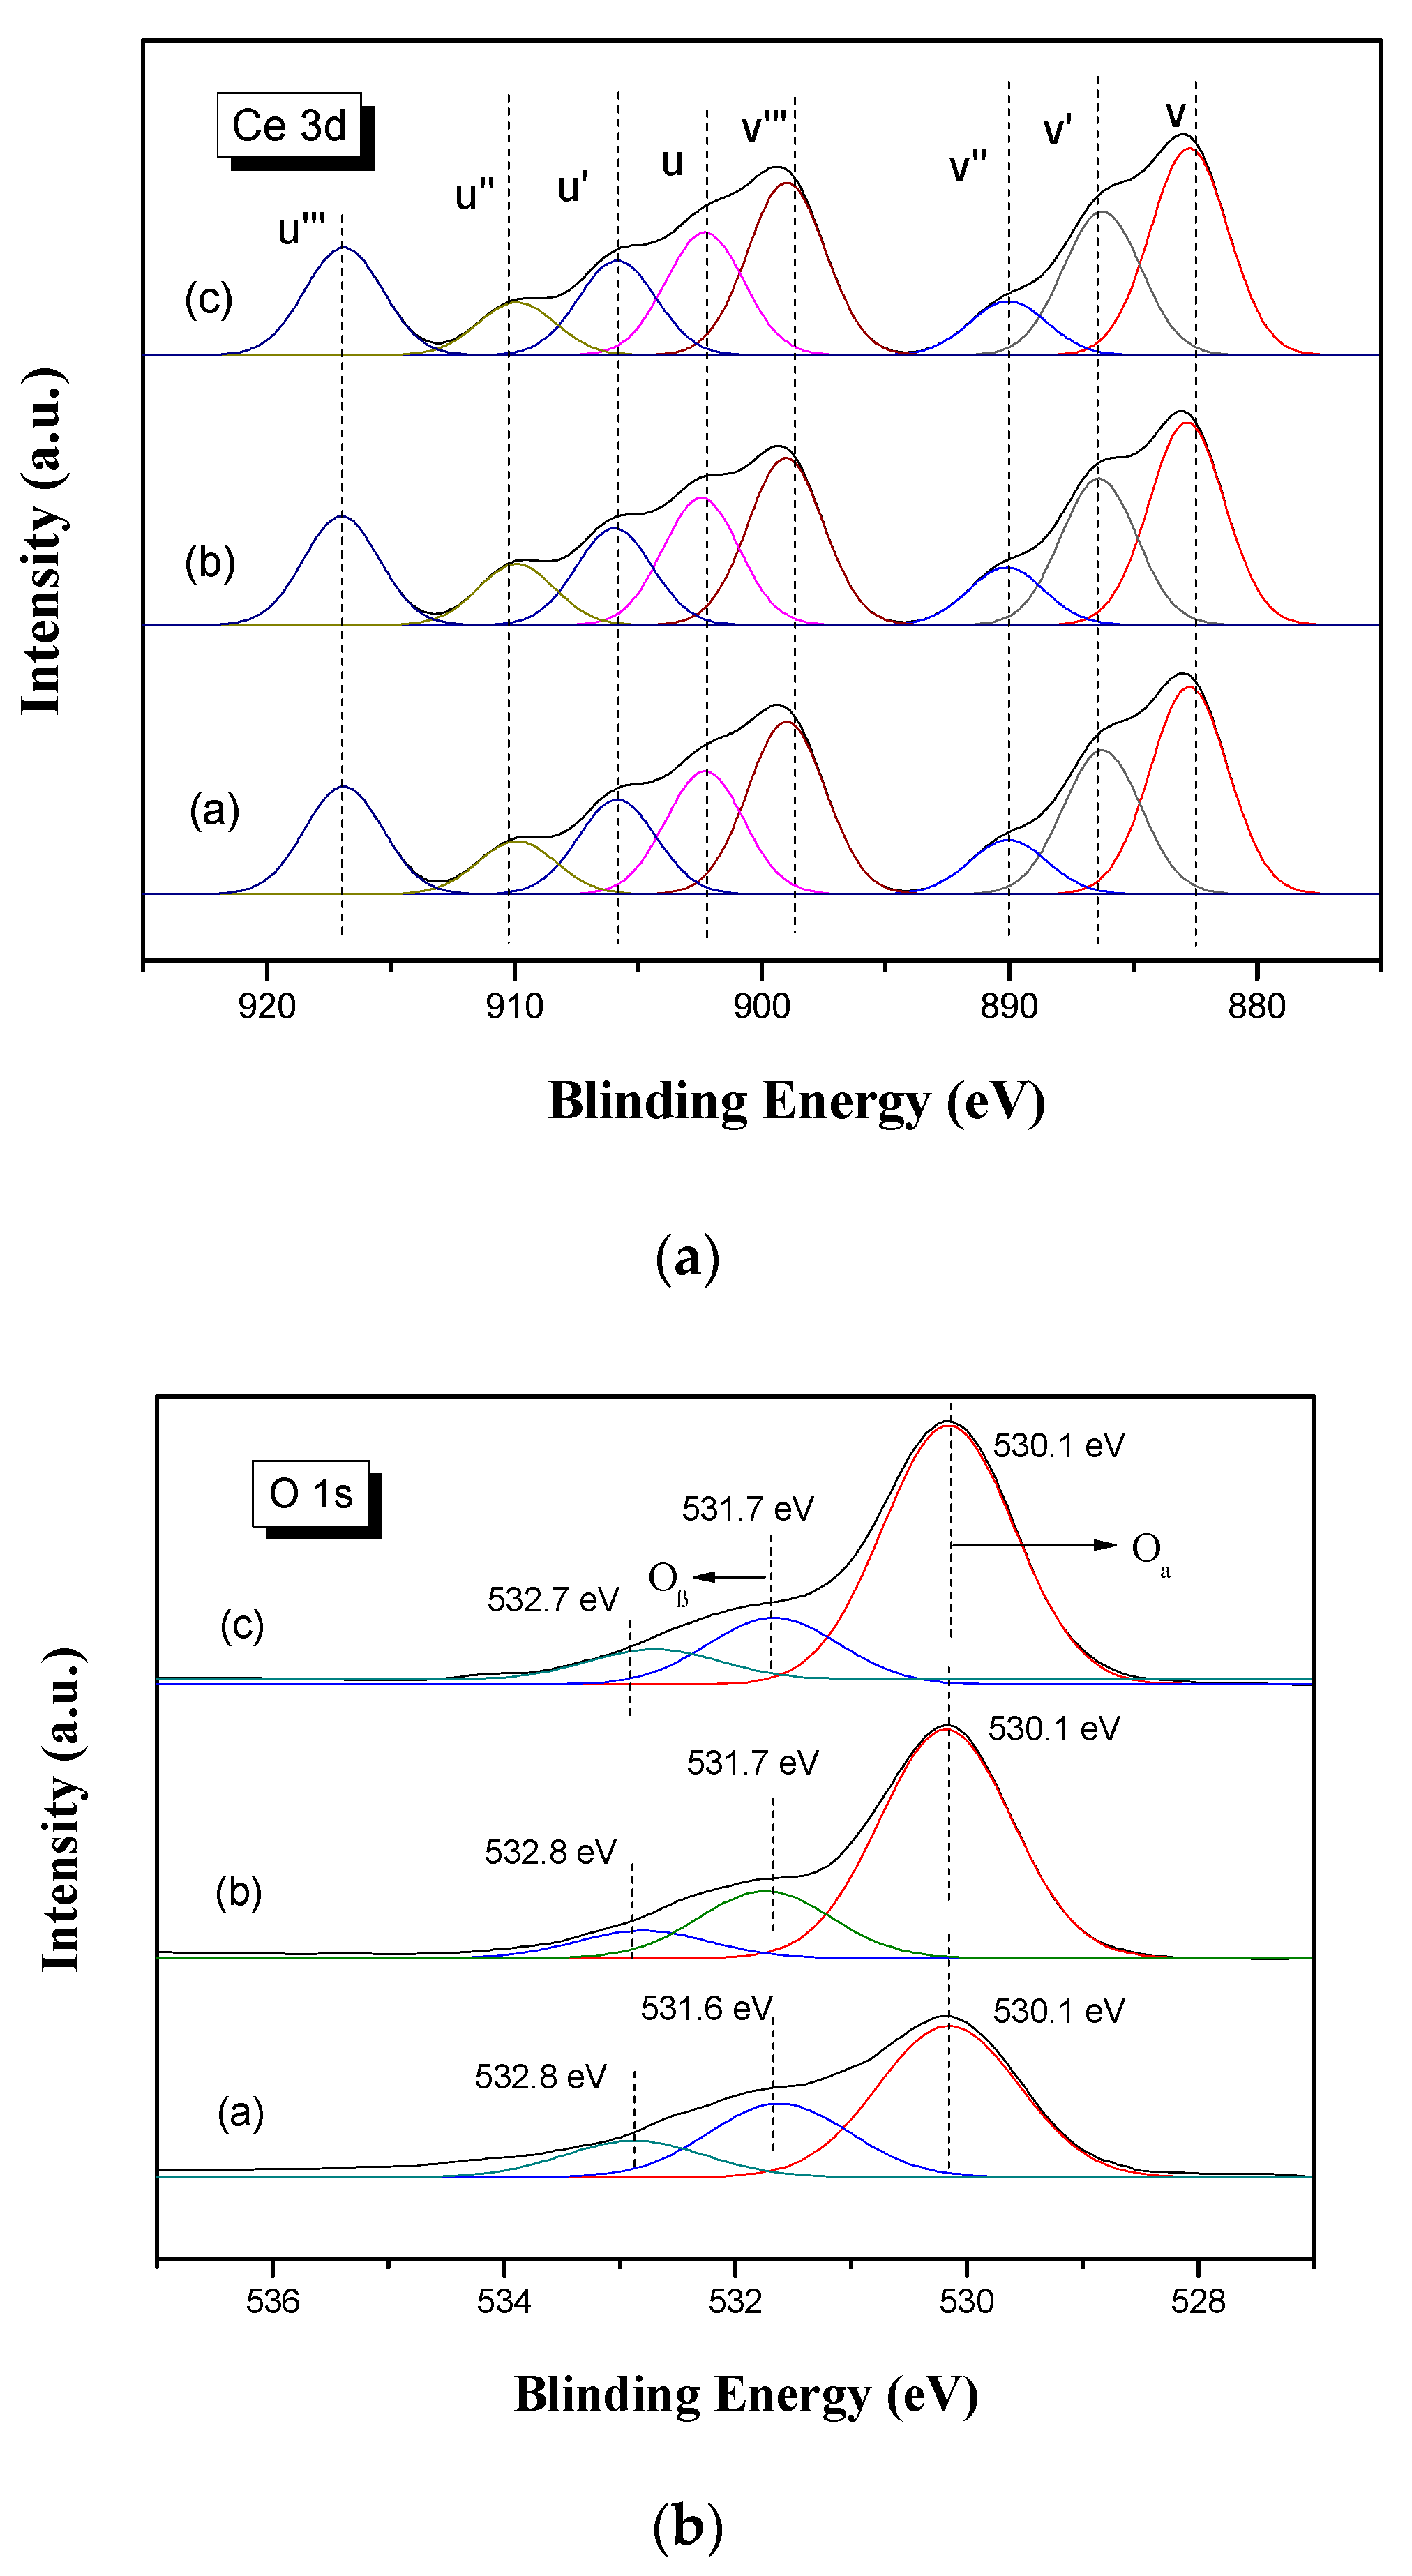
3.2.5. XPS Analysis
3.3. In Situ DRIFTS Study
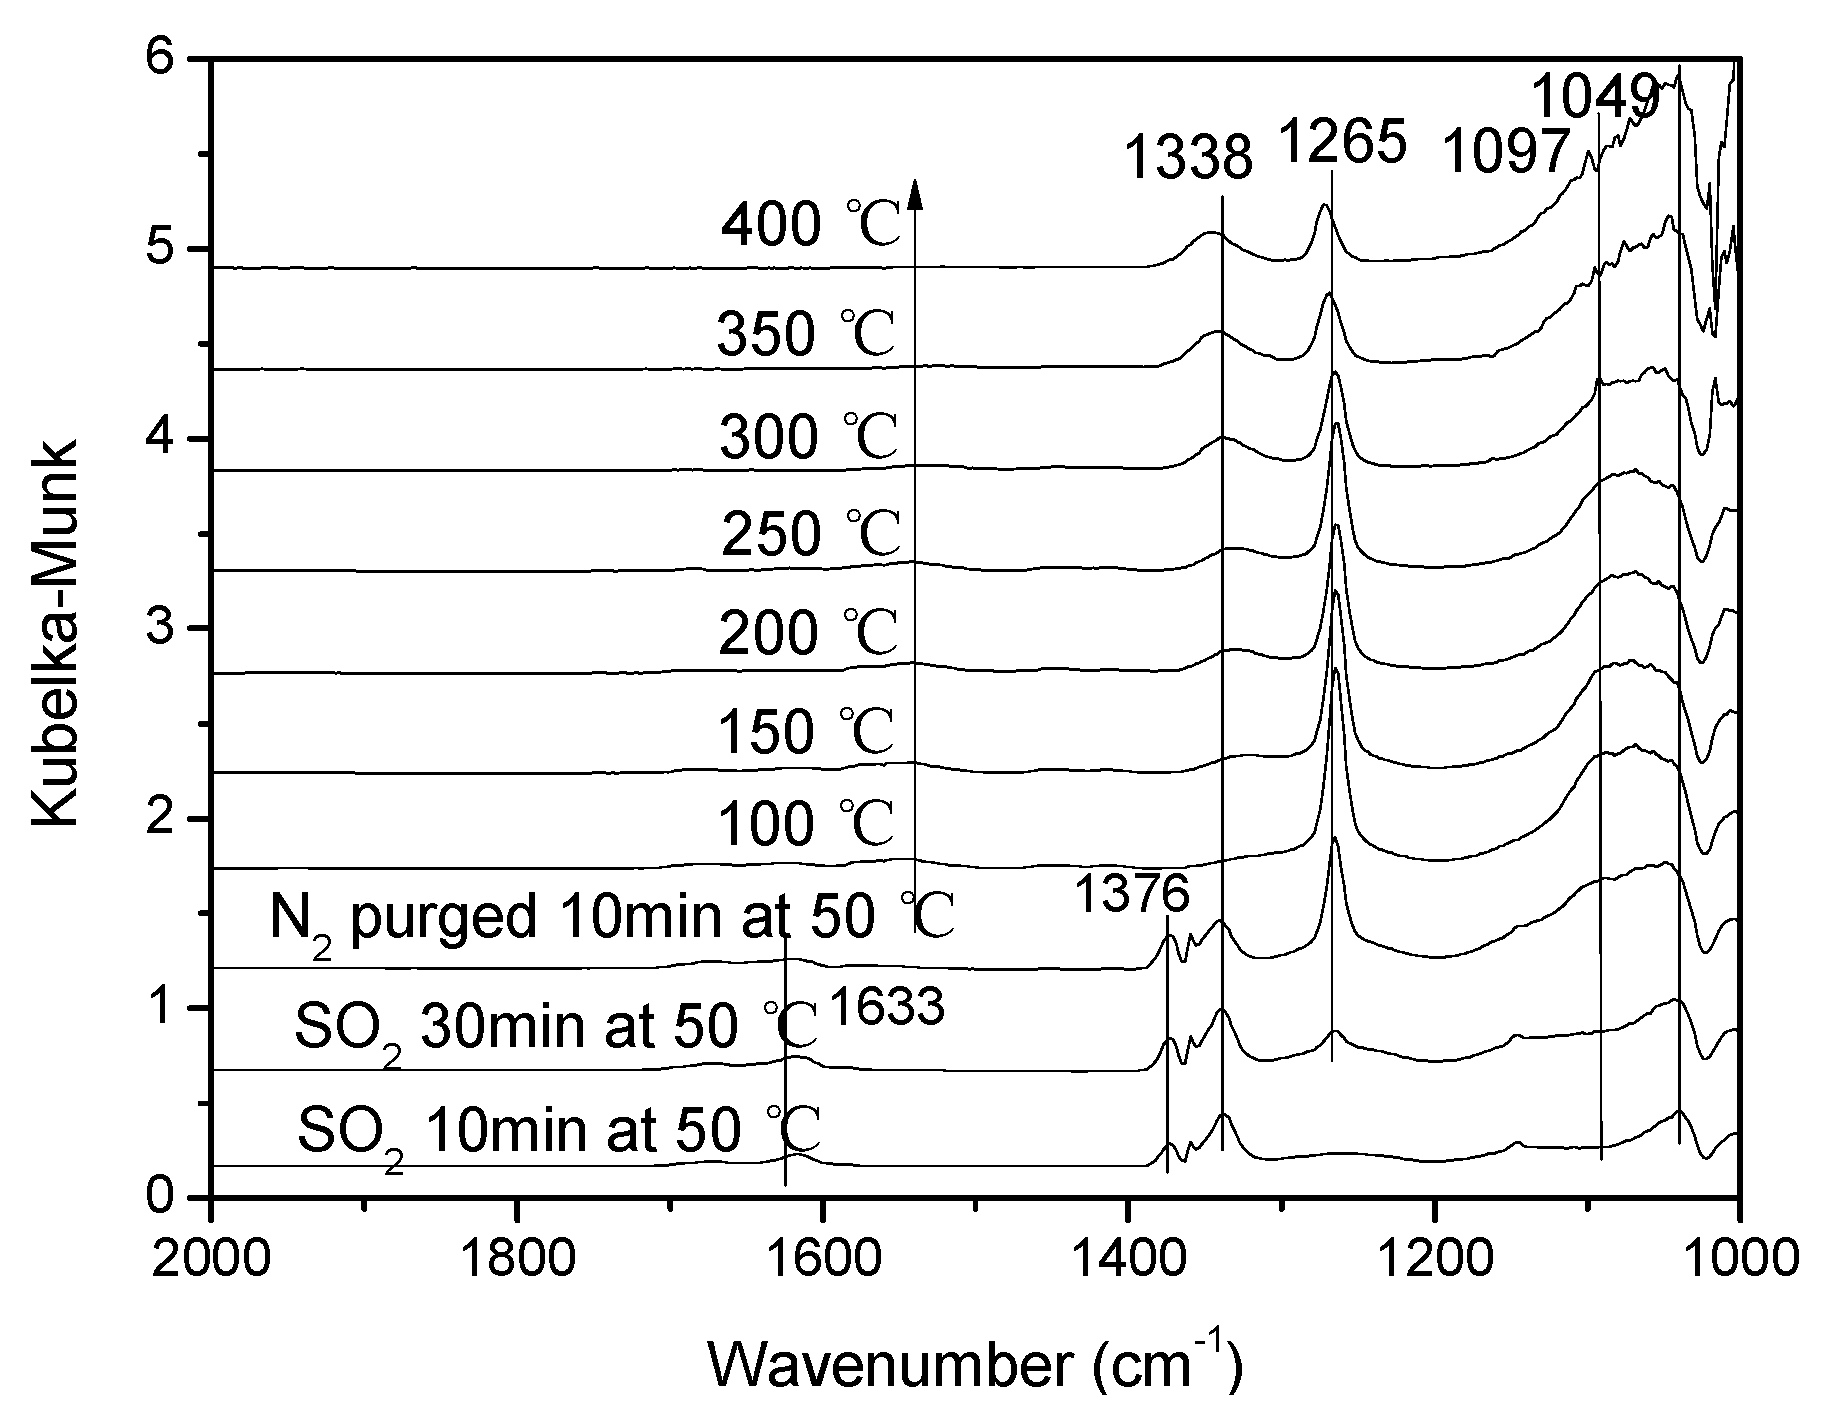
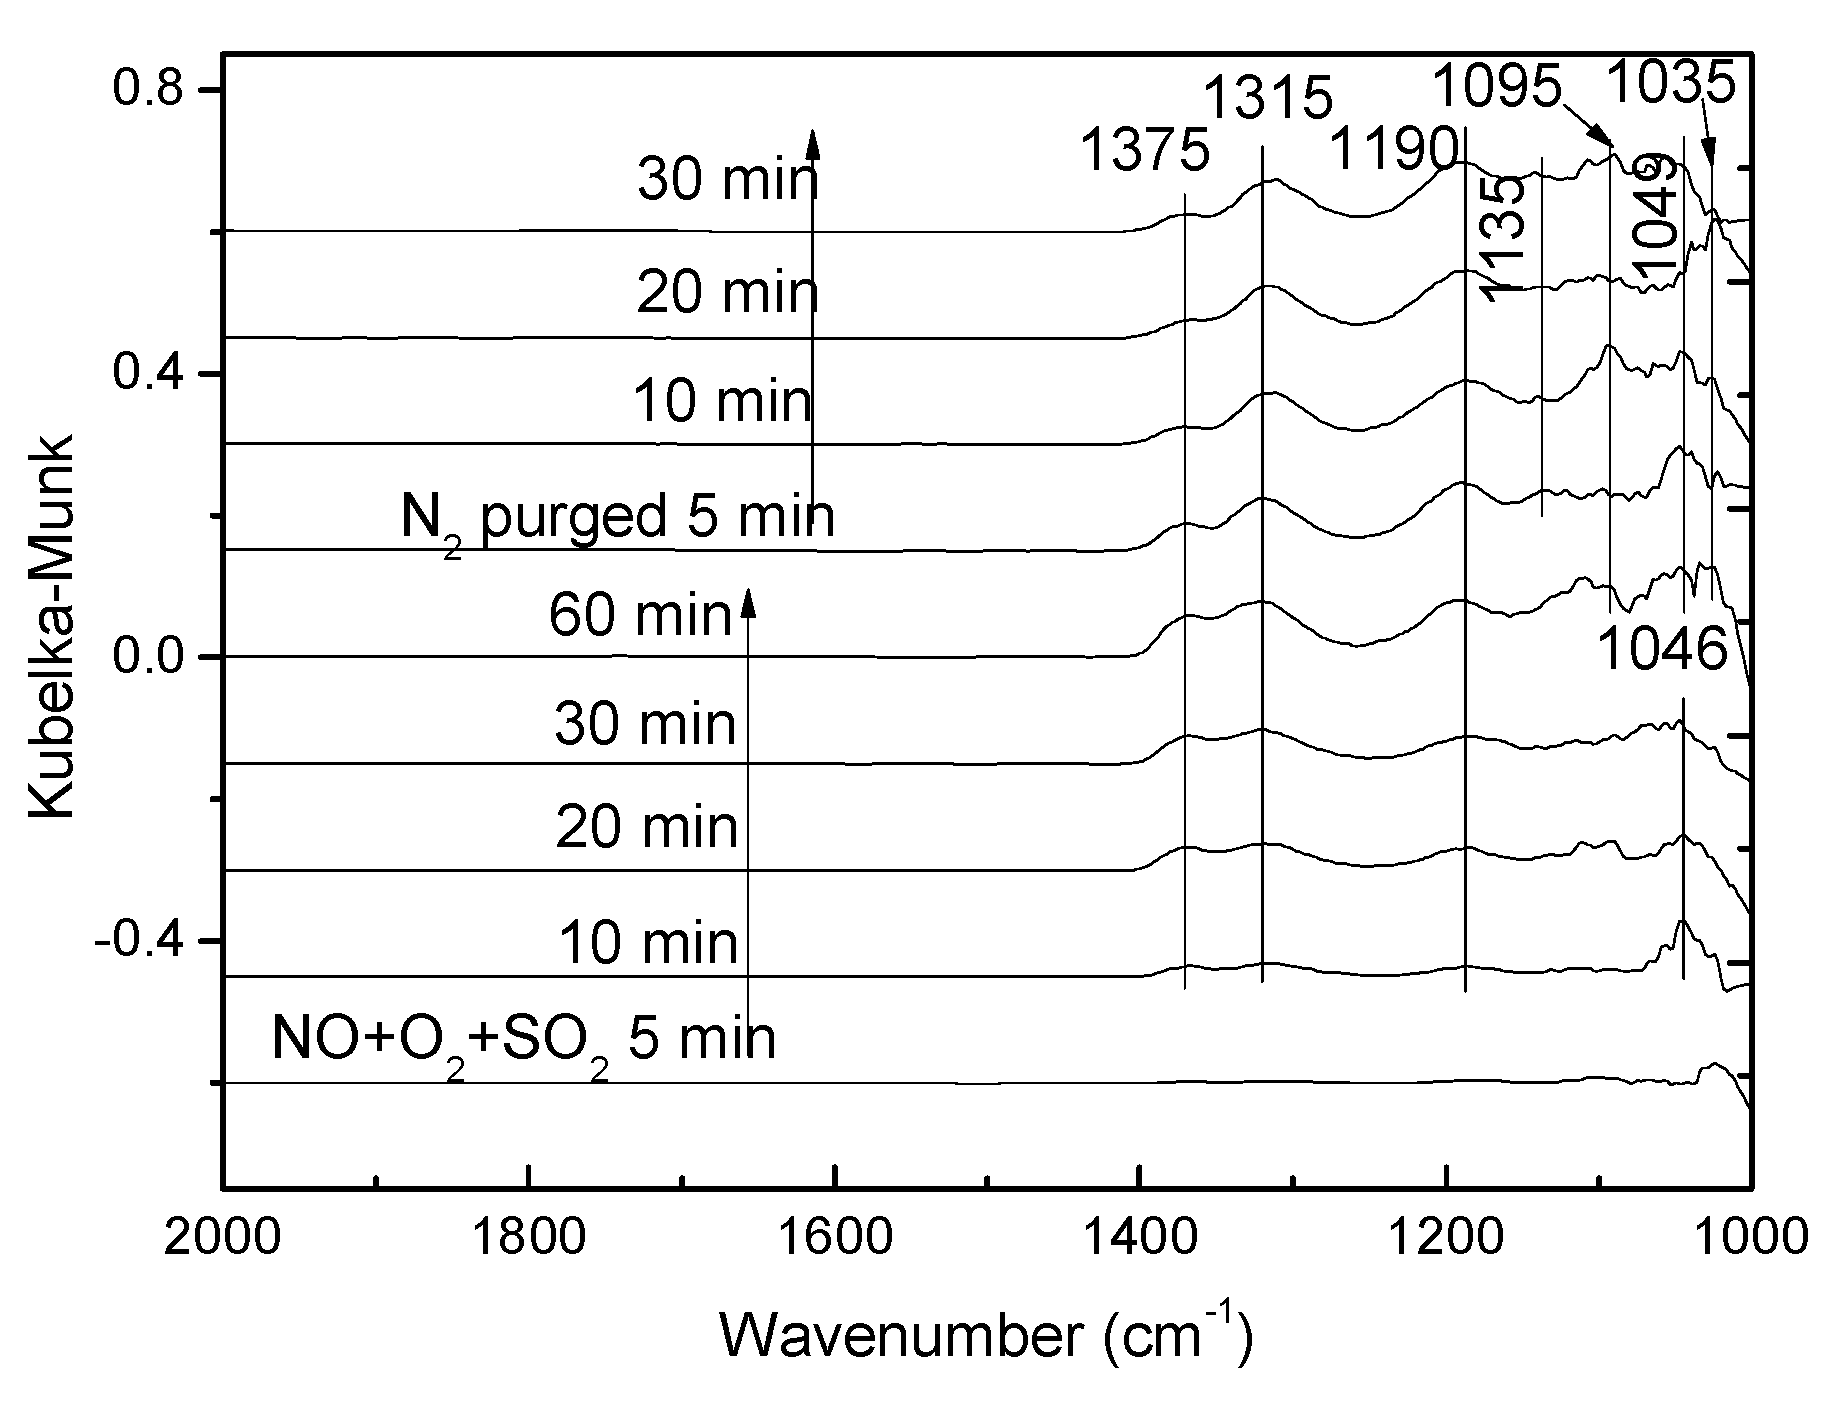
3.3.1. Sulfur Dioxide Adsorption.
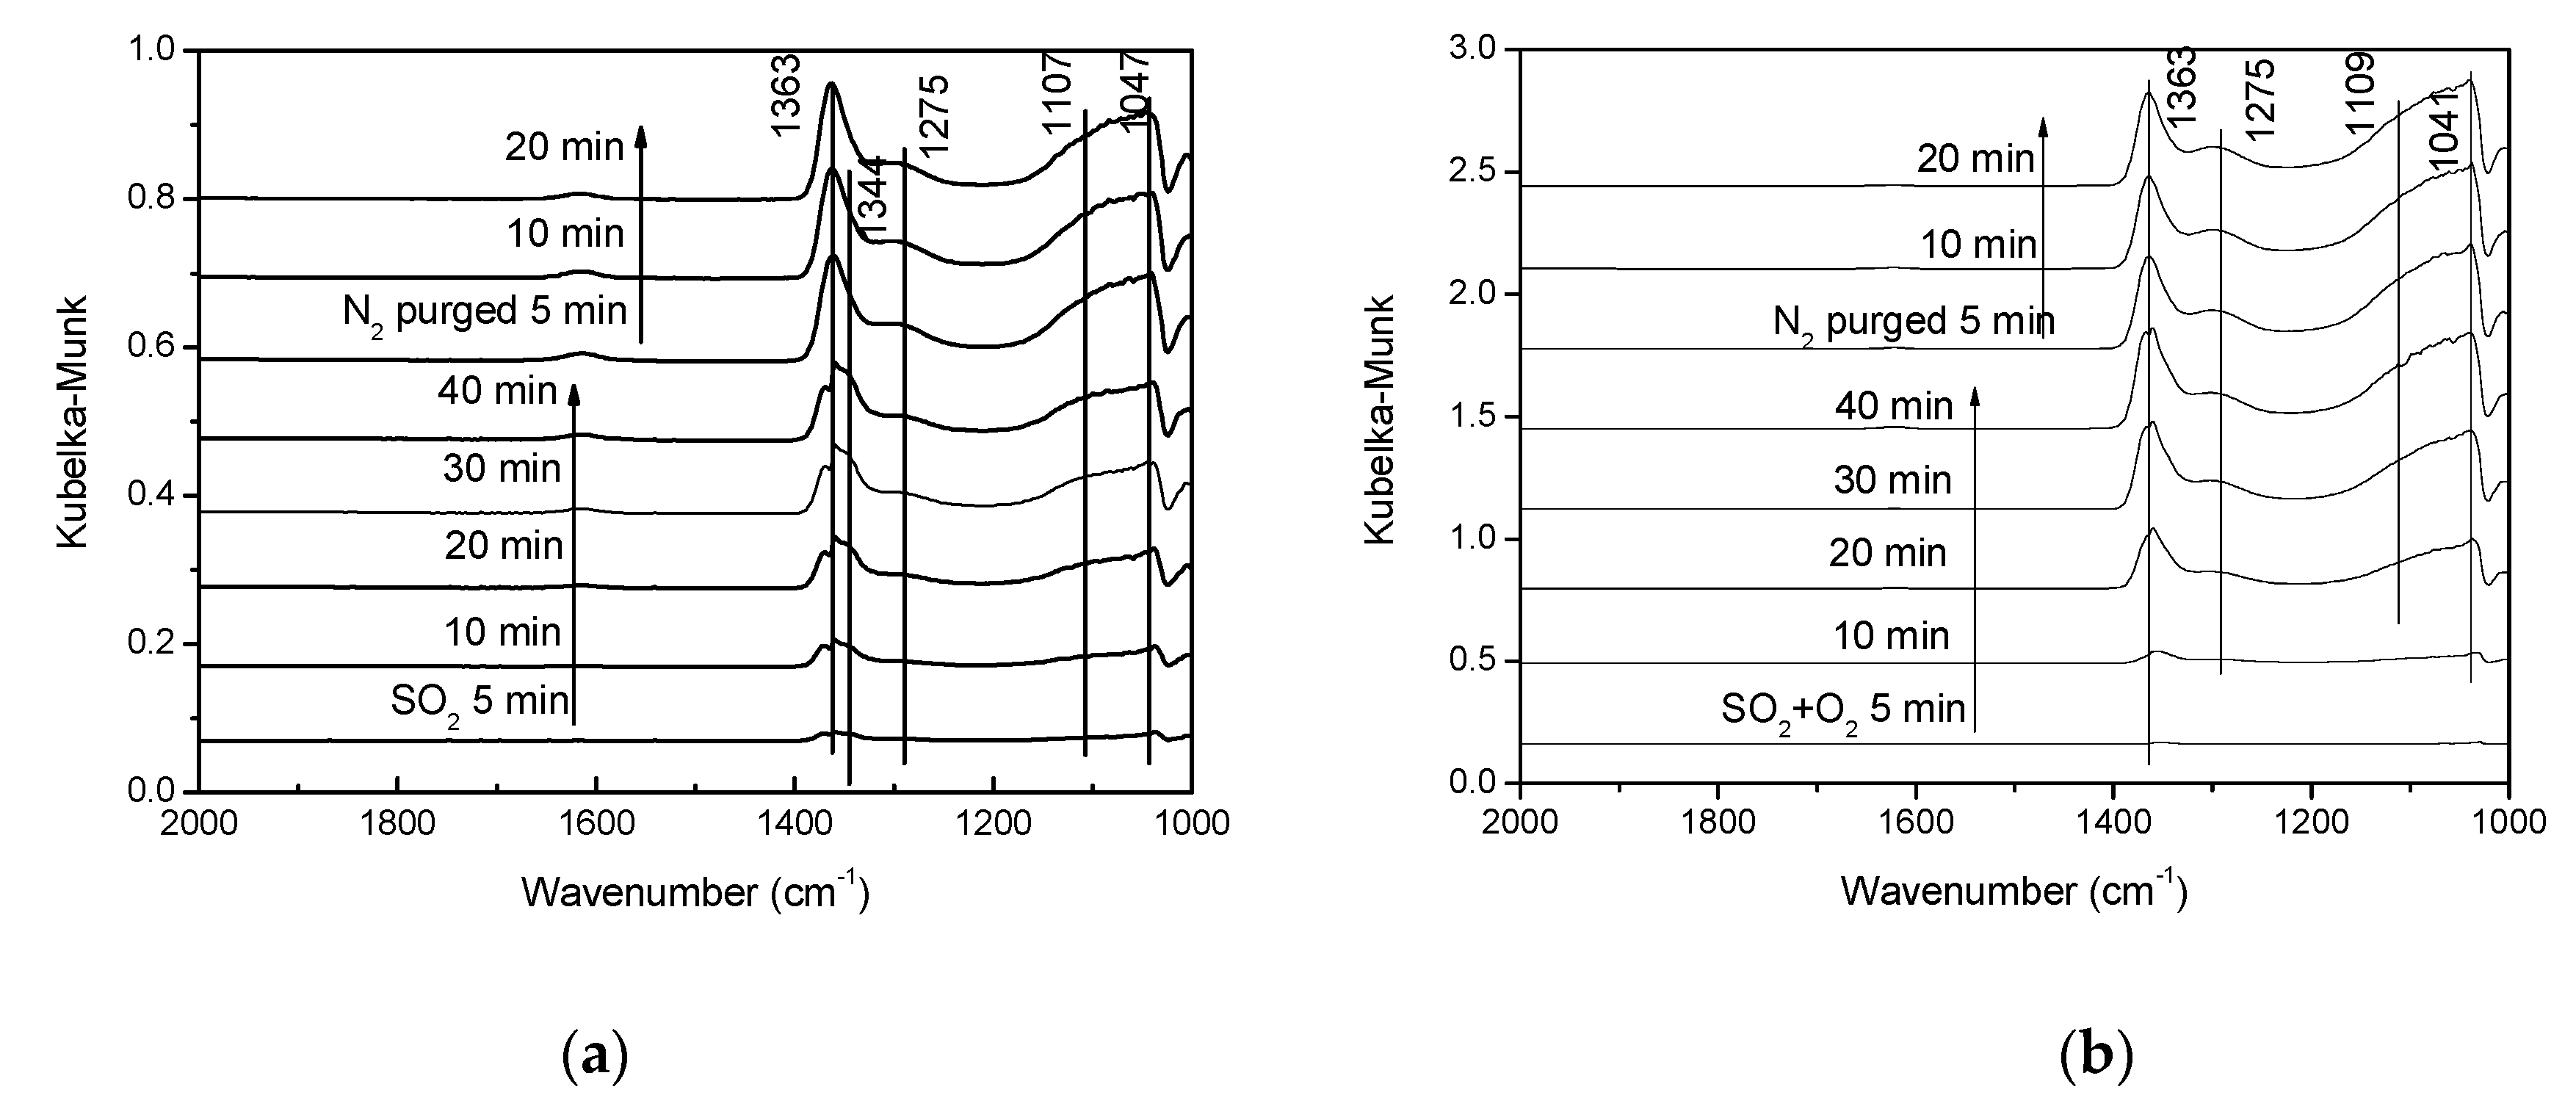
3.3.2. Effect of SO2 on NH3 Adsorption
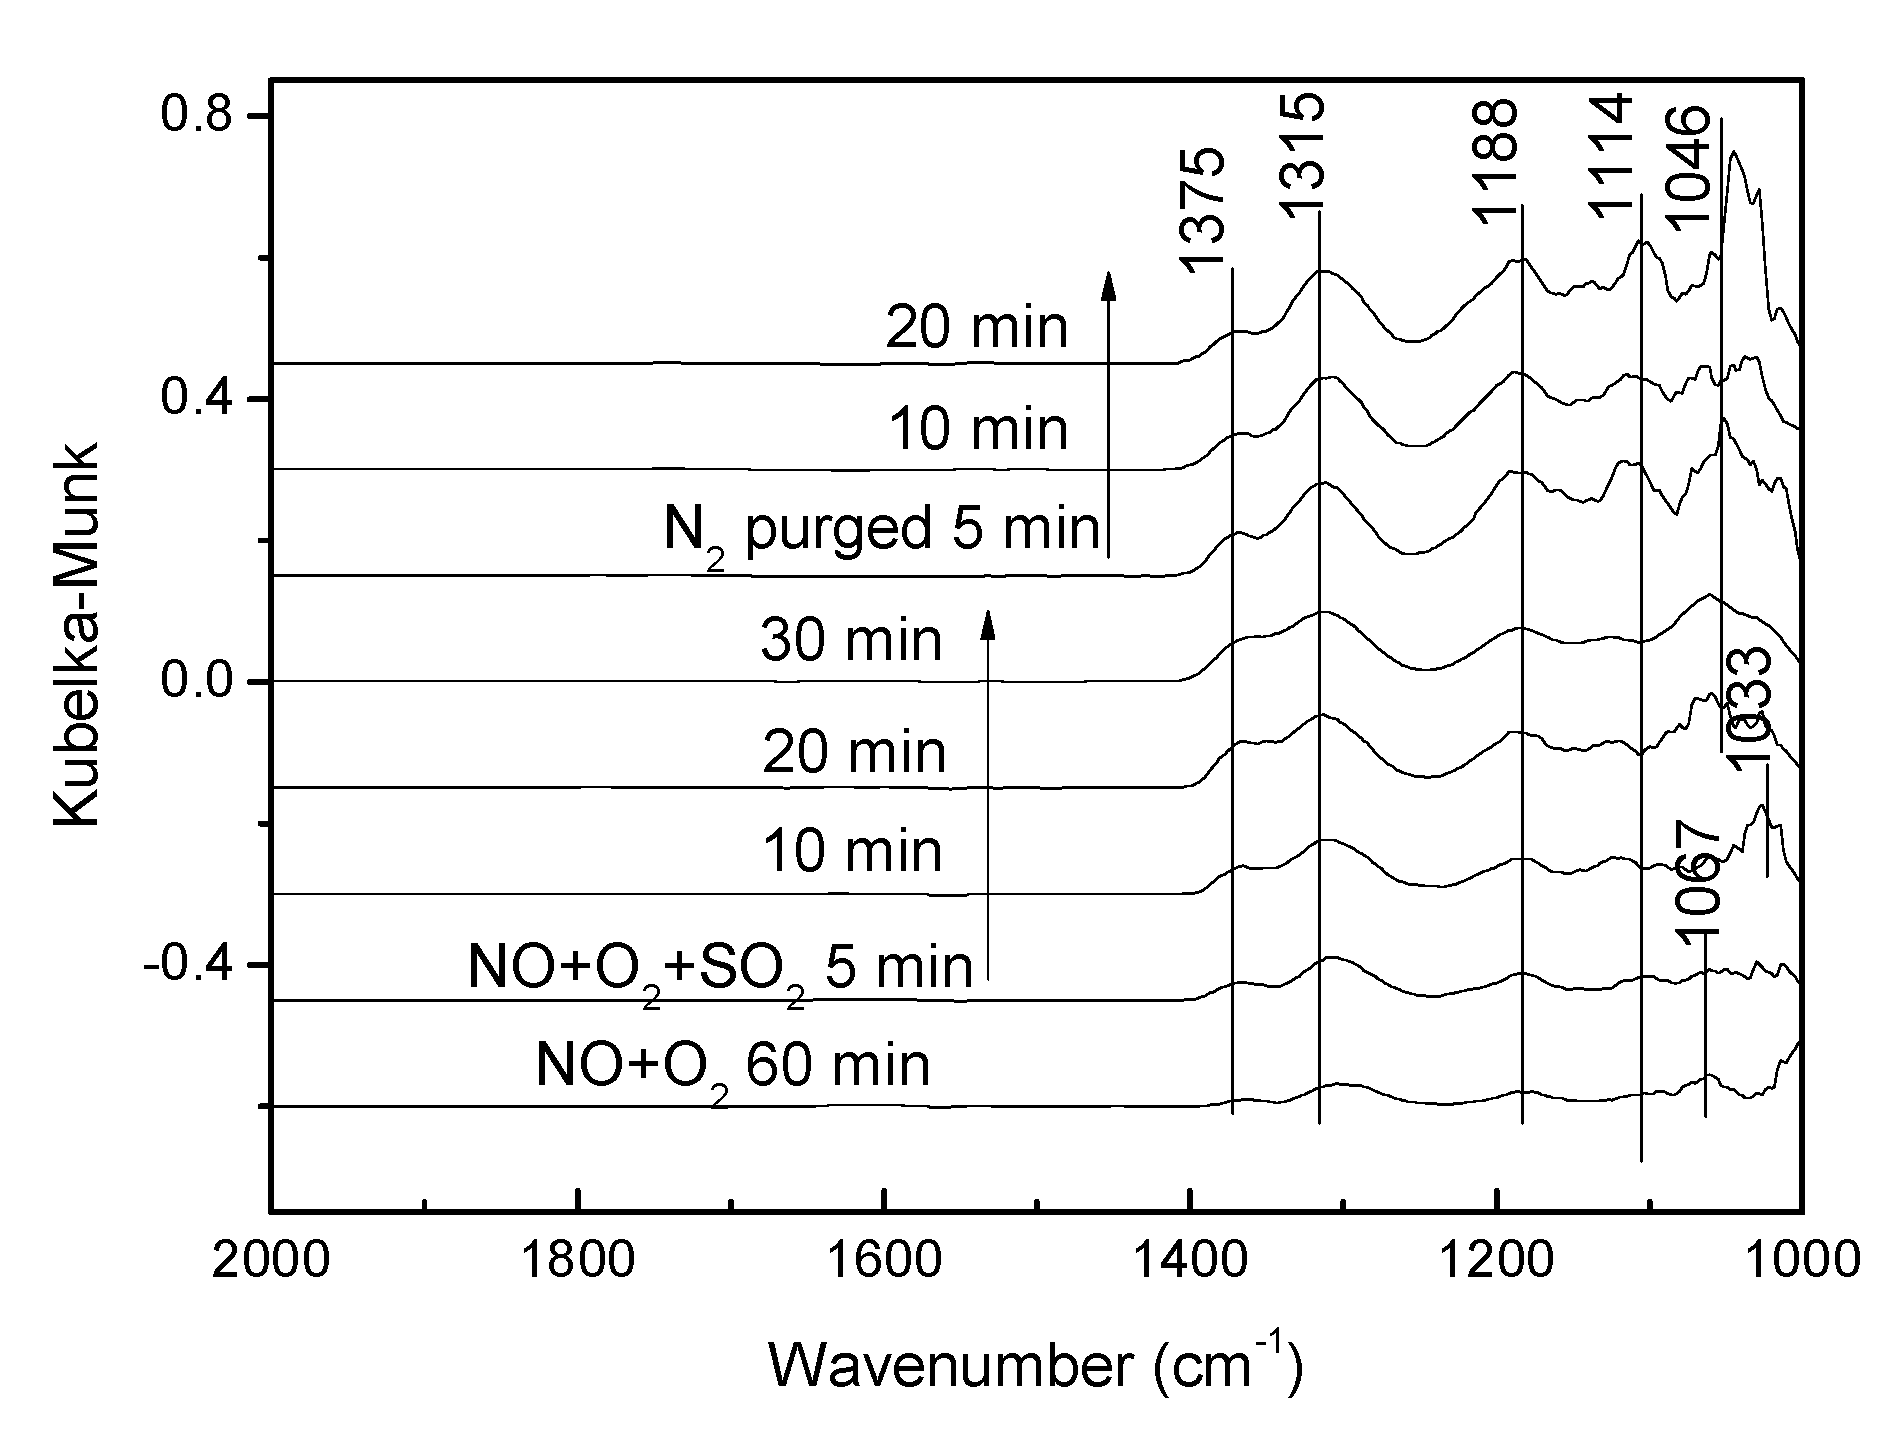
3.3.3. Effect of SO2 on NO Adsorption
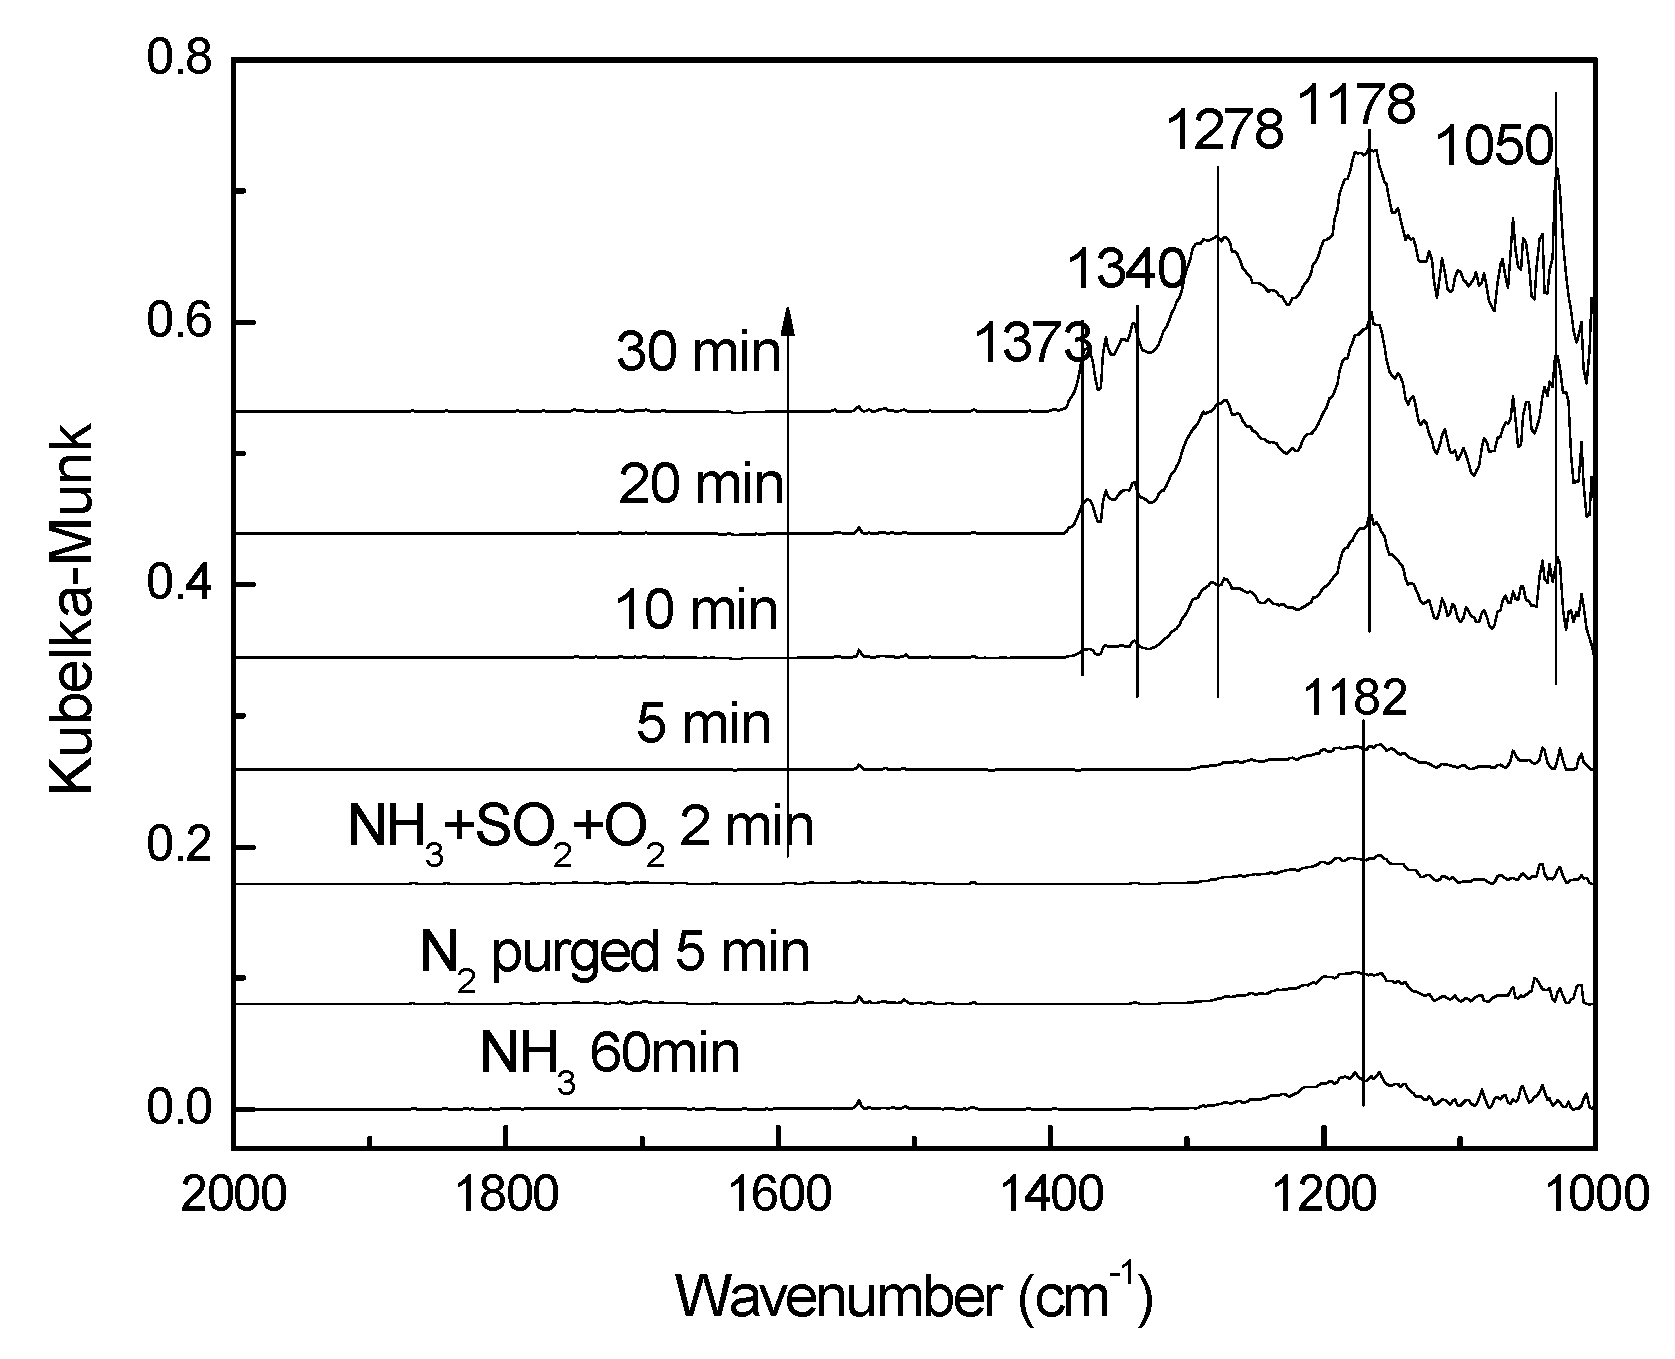
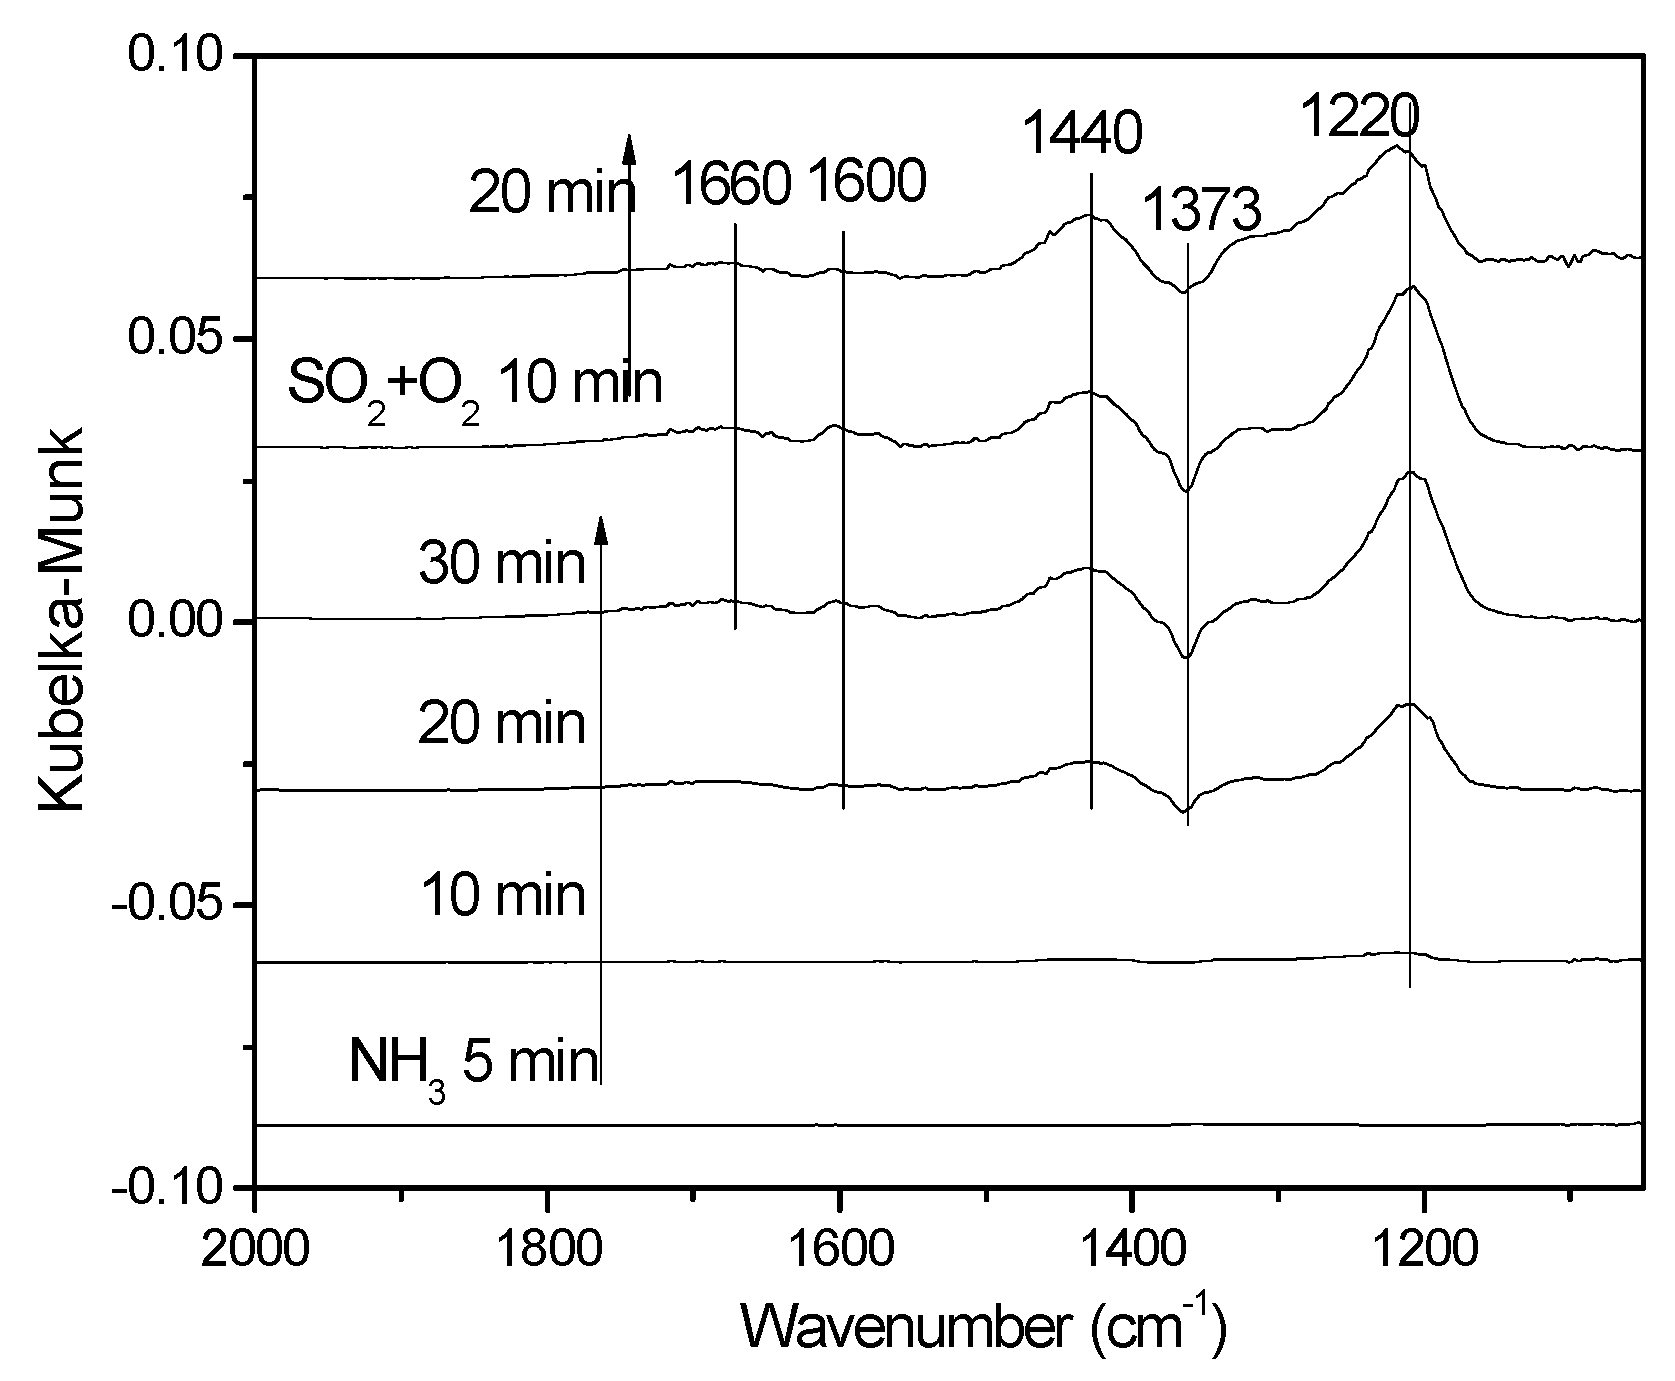
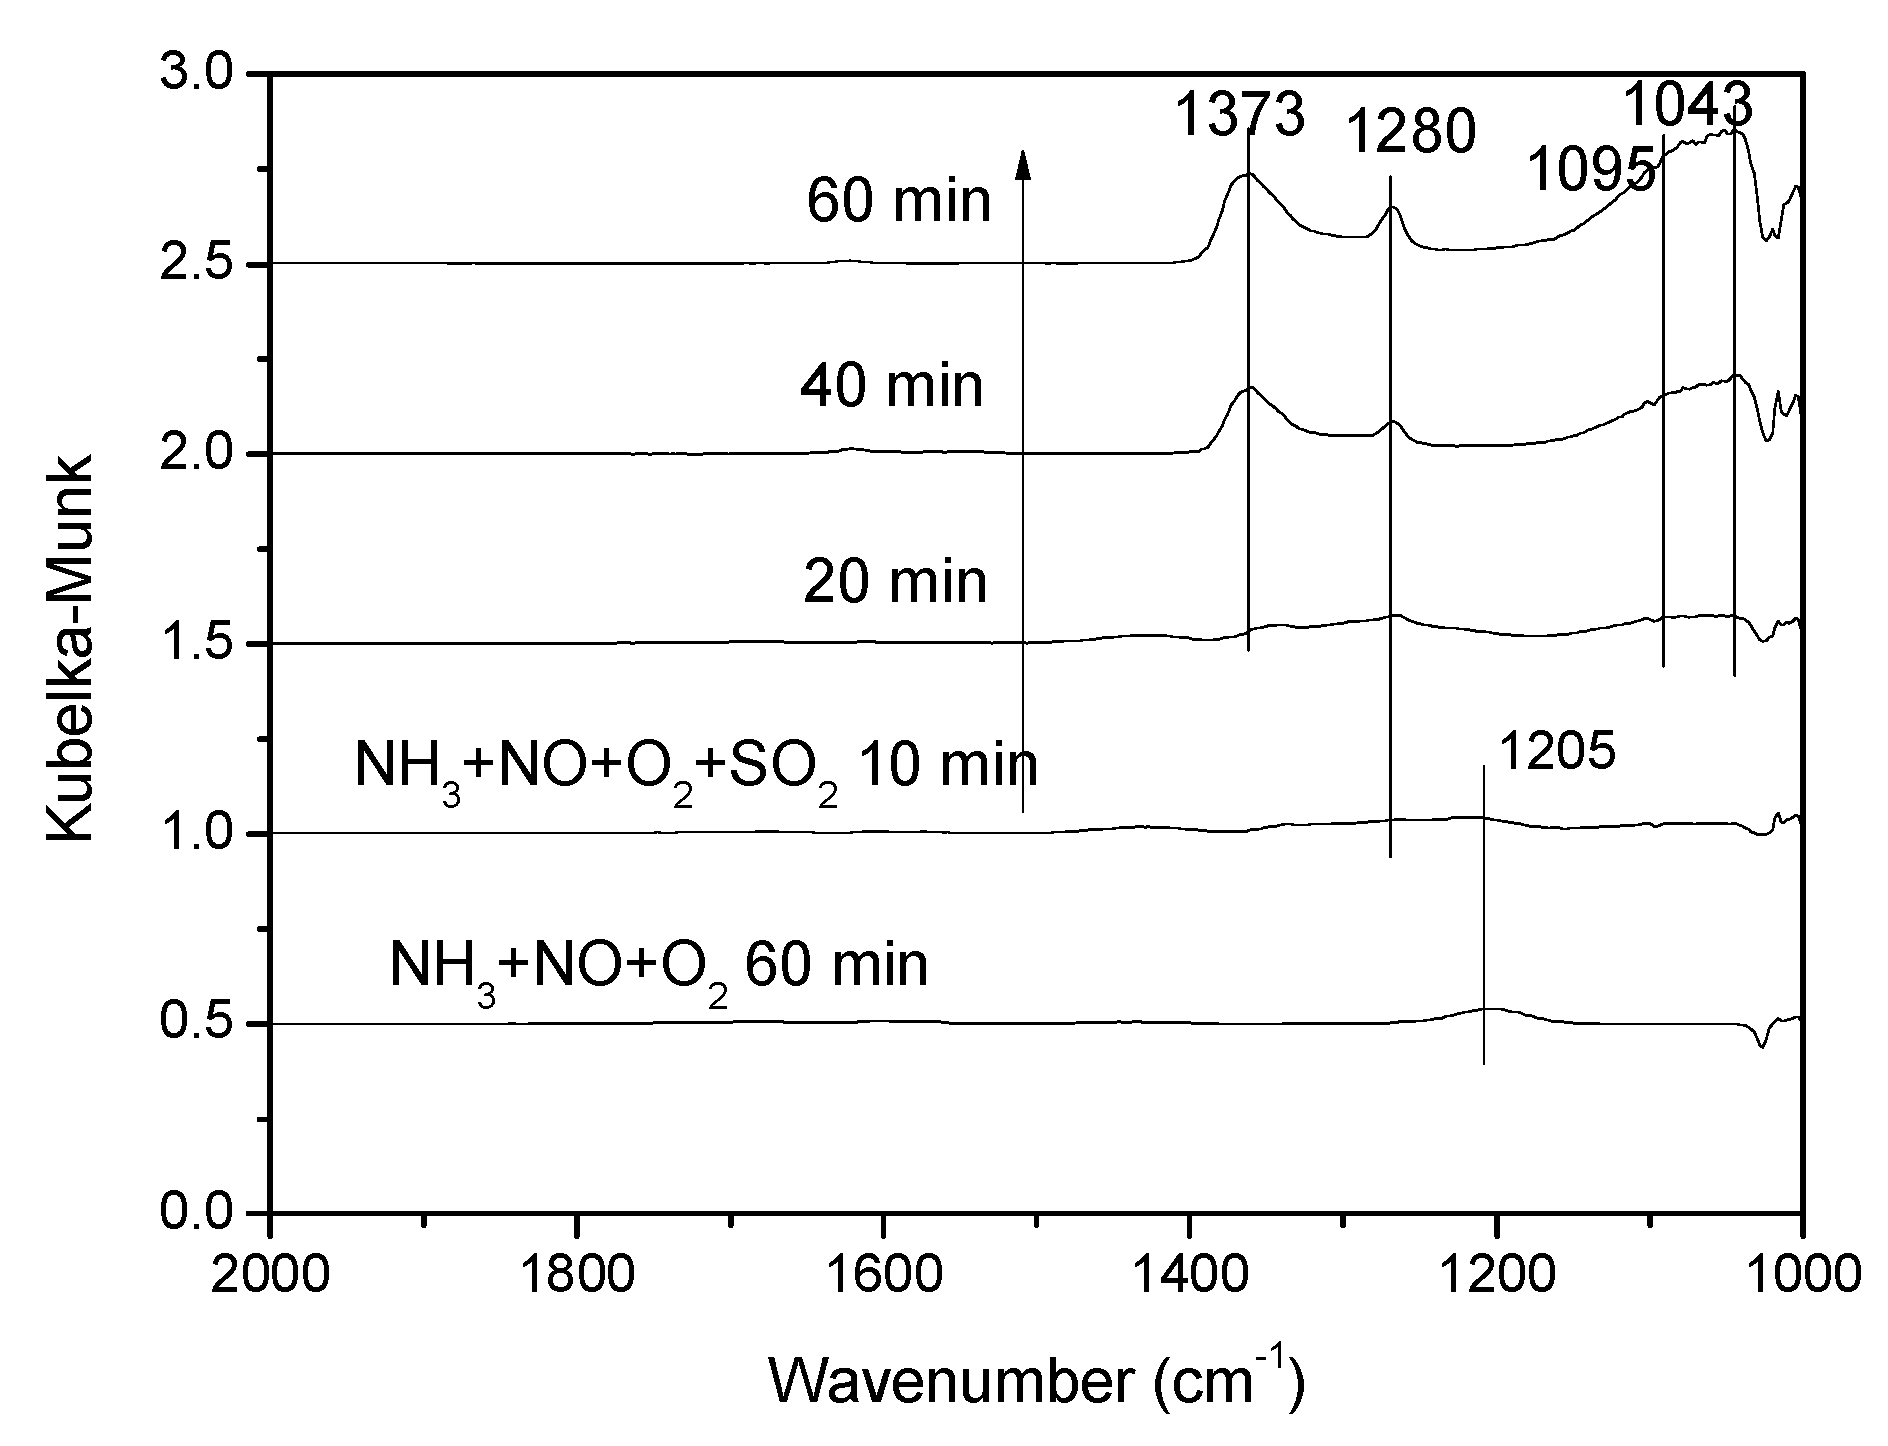
3.3.4. Effect of SO2 on NH3 + NO + O2 Co-Adsorption
3.4. Possible SO2 Reaction Mechanism Over The Catalyst
4. Conclusions
Author Contributions
Acknowledgments
Conflicts of Interest
References
- Fan, Y.Z.; Cao, F.H. Thermal decomposition kinetics of ammonium sulfate. J. Chem. Eng. Chin. Univ. 2011, 25, 341–346. [Google Scholar]
- Zhang, W.; Chen, H.; Xia, Y. Effects of Nd-modification on the activity and SO2 resistance of MnOx/TiO2 catalyst for low-temperature NH3-SCR. New J. Chem. 2018, 42, 12845–12852. [Google Scholar]
- Qi, G.; Yang, R.T. Low-temperature selective catalytic reduction of NO with NH3 over iron and manganese oxides supported on titania. Appli. Catal. B: Environ. 2003, 44, 217–225. [Google Scholar] [CrossRef]
- Wei, L.; Cui, S.; Guo, H. Mechanism of SO2 Influence on Mn/TiO2 for Low Temperature SCR Reaction; Han, Y., Ed.; Chinese Materials Conference; Springer: Berlin, Germany, 2017; pp. 789–796. [Google Scholar]
- Jiang, B.Q.; Wu, Z.B.; Liu, Y. DRIFT study of the SO2 effect on low-temperature SCR reaction over Fe-Mn/TiO2. J Phys Chem. C 2010, 114, 4961–4965. [Google Scholar] [CrossRef]
- Liu, F.; He, H. Selective catalytic reduction of NO with NH3 over manganese substituted iron titanate catalyst: Reaction mechanism and H2O/SO2 inhibition mechanism study. Catal. Today. 2010, 153, 70–76. [Google Scholar] [CrossRef]
- Pan, S.; Luo, H.; Li, L. H2O and SO2 deactivation mechanism of MnOx/MWCNTs for low-temperature SCR of NOx with NH3. J. Mol. Catal. A: Chem. 2013, 377, 154–161. [Google Scholar] [CrossRef]
- Gu, T.; Liu, Y.; Weng, X. The enhanced performance of ceria with surface sulfation for selective catalytic reduction of NO by NH3. Catal. Commun. 2010, 12, 310–313. [Google Scholar] [CrossRef]
- Xu, Q.; Yang, W.; Cui, S. Sulfur resistance of Ce-Mn/TiO2 catalysts for low-temperature NH3–SCR. R. Soc. Open Sci. 2018, 5, 171846. [Google Scholar] [CrossRef]
- Yamaguchi, T. Recent progress in solid superacid. Cheminform 1990, 61, 1–25. [Google Scholar] [CrossRef]
- Kwon, D.W.; Nam, K.B.; Hong, S.C. The role of ceria on the activity and SO2 resistance of catalysts for the selective catalytic reduction of NOx by NH3. Appli. Catal. B Environ. 2015, 166–167, 37–44. [Google Scholar] [CrossRef]
- Zhang, Y.; Guo, W.; Wang, L. Characterization and activity of V2O5-CeO2/TiO2-ZrO2 catalysts for NH3-selective catalytic reduction of NOx. Chin. J. Catal. 2015, 36, 1701–1710. [Google Scholar] [CrossRef]
- Zhang, Y.; Zhu, X.; Shen, K. Influence of ceria modification on the properties of TiO2-ZrO2 supported V2O5 catalysts for selective catalytic reduction of NO by NH3. J. Colloid Interface Sci. 2012, 376, 233–238. [Google Scholar] [CrossRef] [PubMed]
- Zhang, Y.; Yue, X.; Huang, T. In Situ DRIFTS Studies of NH3-SCR Mechanism over V2O5-CeO2/TiO2-ZrO2 Catalysts for Selective Catalytic Reduction of NOx. Materials 2018, 11, 1307. [Google Scholar] [CrossRef] [PubMed]
- Xu, W.; He, H.; Yu, Y. Deactivation of a Ce/TiO2 Catalyst by SO2 in the Selective Catalytic Reduction of NO by NH3. J. Phys. Chem. C 2009, 113, 4426–4432. [Google Scholar] [CrossRef]
- Pena, M.L.; Dejoz, A.; Fornes, V. V-containing MCM-41 and MCM-48 catalysts for the selective oxidation of propane in gas phase. Appli. Catal. A Gen. 2001, 209, 155–164. [Google Scholar] [CrossRef]
- Held, A.; Kowalska-Kuś, J.; Nowińska, K. Epoxidation of propene on vanadium species supported on silica supports of different structure. Catal. Commun. 2012, 17, 108–113. [Google Scholar] [CrossRef]
- Jiang, H.; Wang, C.; Wang, H. Synthesis of highly efficient MnOx catalyst for Low-Temperature NH3-SCR prepared from Mn-MOF-74 template. Mater. Lett. 2016, 168, 17–19. [Google Scholar] [CrossRef]
- Liu, J.; Guo, R.; Li, M. Enhancement of the SO2 resistance of Mn/TiO2 SCR catalyst by Eu modification: A mechanism study. Fuel 2018, 223, 385–393. [Google Scholar] [CrossRef]
- Zhang, L.; Zhang, D.; Zhang, J. Design of meso-TiO2@MnOx-CeOx/CNTs with a core-shell structure as DeNOx catalysts: Promotion of activity, stability and SO2-tolerance. Nanoscale 2013, 5, 9821. [Google Scholar] [CrossRef] [PubMed]
- Peak, D.; Ford, R.G.; Sparks, D.L. An in situ ATR-FTIR investigation of sulfate bonding mechanisms on goethite. J. Colloid Inter. Sci. 1999, 218, 289–299. [Google Scholar] [CrossRef] [PubMed]
- Luo, T.; Gorte, R.J. Characterization of SO2-poisoned ceria-zirconia mixed oxides. Appli. Catal. B Environ. 2004, 53, 77–85. [Google Scholar] [CrossRef]
- Yamaguchi, T.; Jin, T.; Tanabe, K. Structure of acid sites on sulfur-promoted iron oxide. J. Phys. Chem. 1986, 90, 3148–3152. [Google Scholar] [CrossRef]
- Zhang, L.; Li, L.L.; Cao, Y.; Yao, X.J.; Ge, C.Y.; Gao, F.; Yu, D.; Tang, C.J.; Dong, L. Getting insight into the influence of SO2 on TiO2/CeO2 for the selective catalytic reduction of NO by NH3. Appli. Cataly. B Environ. 2015, 165, 589–598. [Google Scholar] [CrossRef]
- Liu, Y.; Shu, H.; Xu, Q. FT-IR study of the catalytic oxidation of SO2 during the process of selective catalytic reduction of NO with NH3 over commercial catalysts. J. Fuel Chem. Technol. 2015, 43, 1018–1024. [Google Scholar] [CrossRef]
- Zhang, Q.; Fan, J.; Ning, P. In situ DRIFTS investigation of NH3-SCR reaction over CeO2 /zirconium phosphate catalyst. Appli. Surf. Sci. 2018, 435, 1037–1045. [Google Scholar] [CrossRef]
- Gelves, J.F.; Dorkis, L.; Márquez, M.A. Activity of an iron Colombian natural zeolite as potential geo-catalyst for NH3-SCR of NOx. Cataly. Today 2019, 320, 112–122. [Google Scholar] [CrossRef]
- Jin, C.M.; Xin, Y.L.; Wen, B.S. Enhancement of low-temperature catalytic activity over highly dispersed Fe-Mn/Ti Catalyst for selective catalytic reduction of NOx with NH3. Ind. Eng. Chem. Res. 2018, 57, 10159–10169. [Google Scholar]


| Sample | BET Surface Area (m2/g) | Pore Volume (mL/g) |
|---|---|---|
| V-0.2Ce/Ti–Zr | 54.45 | 0.14 |
| S-V-0.2Ce/Ti–Zr | 25.07 | 0.16 |
| HS-V-0.2Ce/Ti–Zr | 15.27 | 0.11 |
| Sample | V | Ce | Ti | Zr | S |
|---|---|---|---|---|---|
| V-0.2Ce/Ti–Zr | 0.723 | 12.512 | 1.2 | 34.66 | 0 |
| S-V-0.2Ce/Ti–Zr | 0.63 | 12.365 | 19.75 | 26.66 | 0 |
| HS-V-0.2Ce/Ti–Zr | 0.558 | 12.932 | 20.46 | 26.4 | 1.13 |
| Area Ratio | ||
|---|---|---|
| Sample | ||
| V-0.2Ce/Ti–Zr | 24.94 | 28.14 |
| S-V-0.2Ce/Ti–Zr | 25.15 | 20.71 |
| HS-V-0.2Ce/Ti–Zr | 24.93 | 18.67 |
© 2019 by the authors. Licensee MDPI, Basel, Switzerland. This article is an open access article distributed under the terms and conditions of the Creative Commons Attribution (CC BY) license (http://creativecommons.org/licenses/by/4.0/).
Share and Cite
Zhang, Y.; Wu, P.; Zhuang, K.; Shen, K.; Wang, S.; Guo, W. Effect of SO2 on the Selective Catalytic Reduction of NOx over V2O5-CeO2/TiO2-ZrO2 Catalysts. Materials 2019, 12, 2534. https://doi.org/10.3390/ma12162534
Zhang Y, Wu P, Zhuang K, Shen K, Wang S, Guo W. Effect of SO2 on the Selective Catalytic Reduction of NOx over V2O5-CeO2/TiO2-ZrO2 Catalysts. Materials. 2019; 12(16):2534. https://doi.org/10.3390/ma12162534
Chicago/Turabian StyleZhang, Yaping, Peng Wu, Ke Zhuang, Kai Shen, Sheng Wang, and Wanqiu Guo. 2019. "Effect of SO2 on the Selective Catalytic Reduction of NOx over V2O5-CeO2/TiO2-ZrO2 Catalysts" Materials 12, no. 16: 2534. https://doi.org/10.3390/ma12162534