1. Introduction
Wind energy is an important source of clean and renewable energy, and there has been substantial development in this field in recent years [
1]. With the development of wind turbine technology, wind farm owners have increasingly high requirements for the efficiency of wind turbines [
2,
3]. It is, therefore, necessary for the manufacturer to implement higher reliability standards when designing and manufacturing the turbine and for the operator to avoid manual shutdowns while operating the fan to increase the unit’s efficiency. Therefore, the study of the predictive maintenance of wind turbines has recently increased in scope, resulting in improvements in the efficiency of wind farms and a reduction in manual shutdowns.
The main bearing of the wind turbine generator unit is prone to overheating due to main bearing seal ring damage, deterioration of the lubricating grease, foreign matter pollution in the lubricating grease, etc., which can affect the normal power generation of the unit. In order to accurately assess the cooling and lubrication status of the main bearing, as well as arrange the operation and maintenance tasks in advance, and avoid a shutdown in windy weather, it is necessary to study the bearing anomaly detection method.
As the main technical means of unit monitoring and management, the wind turbine SCADA system collects a large number of variables related to the unit’s operating state. However, it is difficult to determine the operating state of the unit or unit components through the straightforward assessment of single variables; therefore, it is necessary to extract the hidden fault features from many parameters in order to assess the operating state of the unit [
4]. In reference [
5], the focus was on the modeling and analysis of several important components of wind turbines, such as the tower and transmission chain, by analyzing vibration signals. A tower vibration model was established, and principal component analysis (PCA) technology was used for analysis. In order to ensure adaptability to the environmental factors, adaptive principal component analysis was introduced, and the model was updated through sliding windows. In reference [
6], a bearing health deterioration model based on temperature characteristic variables was proposed. The non-stationary degradation tendency was divided into steady components using an enhanced ensemble empirical mode decomposition (EEMD). Each component was predicted using time series neural network models, and the predicted components were superimposed. The results showed that this approach increased the fitting degree and improved prediction accuracy. In reference [
7], a bearing health sample set was selected under various operating conditions using the relative evaluation criterion. The data were fitted with the least squares method in order to establish a bearing-temperature health status assessment model. The degradation degree concept was introduced by combining the upper and lower threshold values of the actual operating status. The time series neural network was used to establish a degradation trend prediction model for wind turbine bearings. Both models exhibited good predictive accuracy.
In recent years, deep learning has received increasing attention in the field of bearing fault diagnosis due to its advantages in nonlinear fitting ability. In the literature by [
8], a bidirectional recurrent neural network was used to establish a wind turbine operation prediction model based on the wind turbine operational data and produced an early fault warning system based on the residual effect between the actual and measured values of the sliding window. In reference [
9], an improved convolution neural network (CNN) model was proposed to resolve multiple conditions in the operation of bearings. The model was adjusted by adding the weight of feature channels. In reference [
10], a multi-channel convolutional neural network (Bagging-MCNN) based on the Bagging concept was proposed in order to address the problem of low accuracy and generalization in the fault diagnosis of imbalanced samples. The method was validated on a publicly available bearing dataset and achieved improved diagnostic accuracy in both balanced and imbalanced scenarios. Furthermore, it improved the convergence speed and diagnostic stability of the model. In reference [
11], a hierarchical CNN model was proposed for the smart diagnosis of bearing faults by stacking multiple layers of convolutional neural networks in order to allow for better feature extraction and fault classification. The results showed that the hierarchical CNN model achieved high accuracy and improved the diagnostic performance of bearing faults. In reference [
12], an improved quantum bee colony algorithm and BP neural network were used to develop a rolling bearing fault diagnosis model. The findings showed that the model achieved high accuracy in identifying various bearing fault types and demonstrated greater generalization and robustness compared to the more conventional approaches. In reference [
13], a bearing fault diagnosis method based on multi-layer denoising technology and an improved convolution neural network (ICNN) was proposed to address the difficulty of effectively diagnosing weak faults in rolling bearings under loud noise conditions. Through simulation experiments, the proposed method achieved a more accurate bearing fault diagnosis in loud, noisy environments. In reference [
14], a diagnosis method combining an improved Hilbert–Huang transform (IHHT) algorithm and convolution neural network (CNN) was proposed in order to address the problems of feature extraction and intelligent diagnosis of complex faults in rolling bearings in agricultural machinery equipment. This method achieved an end-to-end intelligent diagnosis of complex rolling bearing faults under varying working conditions and showed good generalization ability and robustness. In reference [
15], a novel DSCNN-GRU network was proposed for fault diagnosis, which fused the light and fast feature of depth separable convolution and added a gate mechanism in order to analyze and memorize the signal features of fault points and the signal relationships within the cycle. The research showed that the algorithm could achieve an average fault recognition rate of greater than 94%, improving classification generalization ability. Finally, in reference [
16], an improved transfer diagnostic model was proposed to address the problem of significant lowering of the bearing fault diagnosis accuracy due to changes in the machine operating conditions. This model comprehensively used the maximum mean difference and distance variance to measure the differences between the different distributions and used entropy loss to improve the separability of features in the shared subspace. The results demonstrate that this method shows high transfer diagnostic performance under varying loads and can effectively cope with interference caused by varying noise levels. Overall, these studies demonstrate the potential of deep learning techniques for the fault diagnosis of bearings, with the various methods achieving high accuracy and improved diagnostic performance in varying scenarios. The methods proposed in these studies also have a good generalization ability and robustness and, thus, show great potential for practical applications.
However, some models in the above literature use too few variables to fully characterize the state of the unit, which can affect the fault detection performance of the prediction model. In this paper, a method for detecting abnormalities in the state of the bearings of wind turbine generators, based on the cascade deep learning model, is proposed. First, data on the mechanical function of wind turbine generators were collected, and the correlations between the data were used to select the parameters related to bearing temperature. Then, the logical relationship between the observation and target parameters based on the one-dimensional CNN and long short-term memory (LSTM) network was established. The difference between the predicted and actual temperatures was assessed using the root mean square error evaluation model. Finally, using the operational data from a wind farm in northwest China, the model used in this paper is compared with a separate LSTM model to verify its effectiveness.
3. Abnormality Detection Method for Wind Turbine Bearings Based on CNN-LSTM
The main bearing of a wind turbine generator unit supports the weight of the rotating blades and is one of the most important components in the entire transmission chain. Once a main bearing failure occurs, it can cause a decrease in the unit’s power generation and availability, which can have a severely negative effect on the economic benefits of wind power generation. Furthermore, replacing the main bearing is a high-cost maintenance task requiring professional skills and equipment. The replacement work is particularly challenging, as wind turbines are often installed in harsh environments, such as offshore locations. Therefore, the stable operation and maintenance of the main bearing are critical to the sustainable development of the wind power industry.
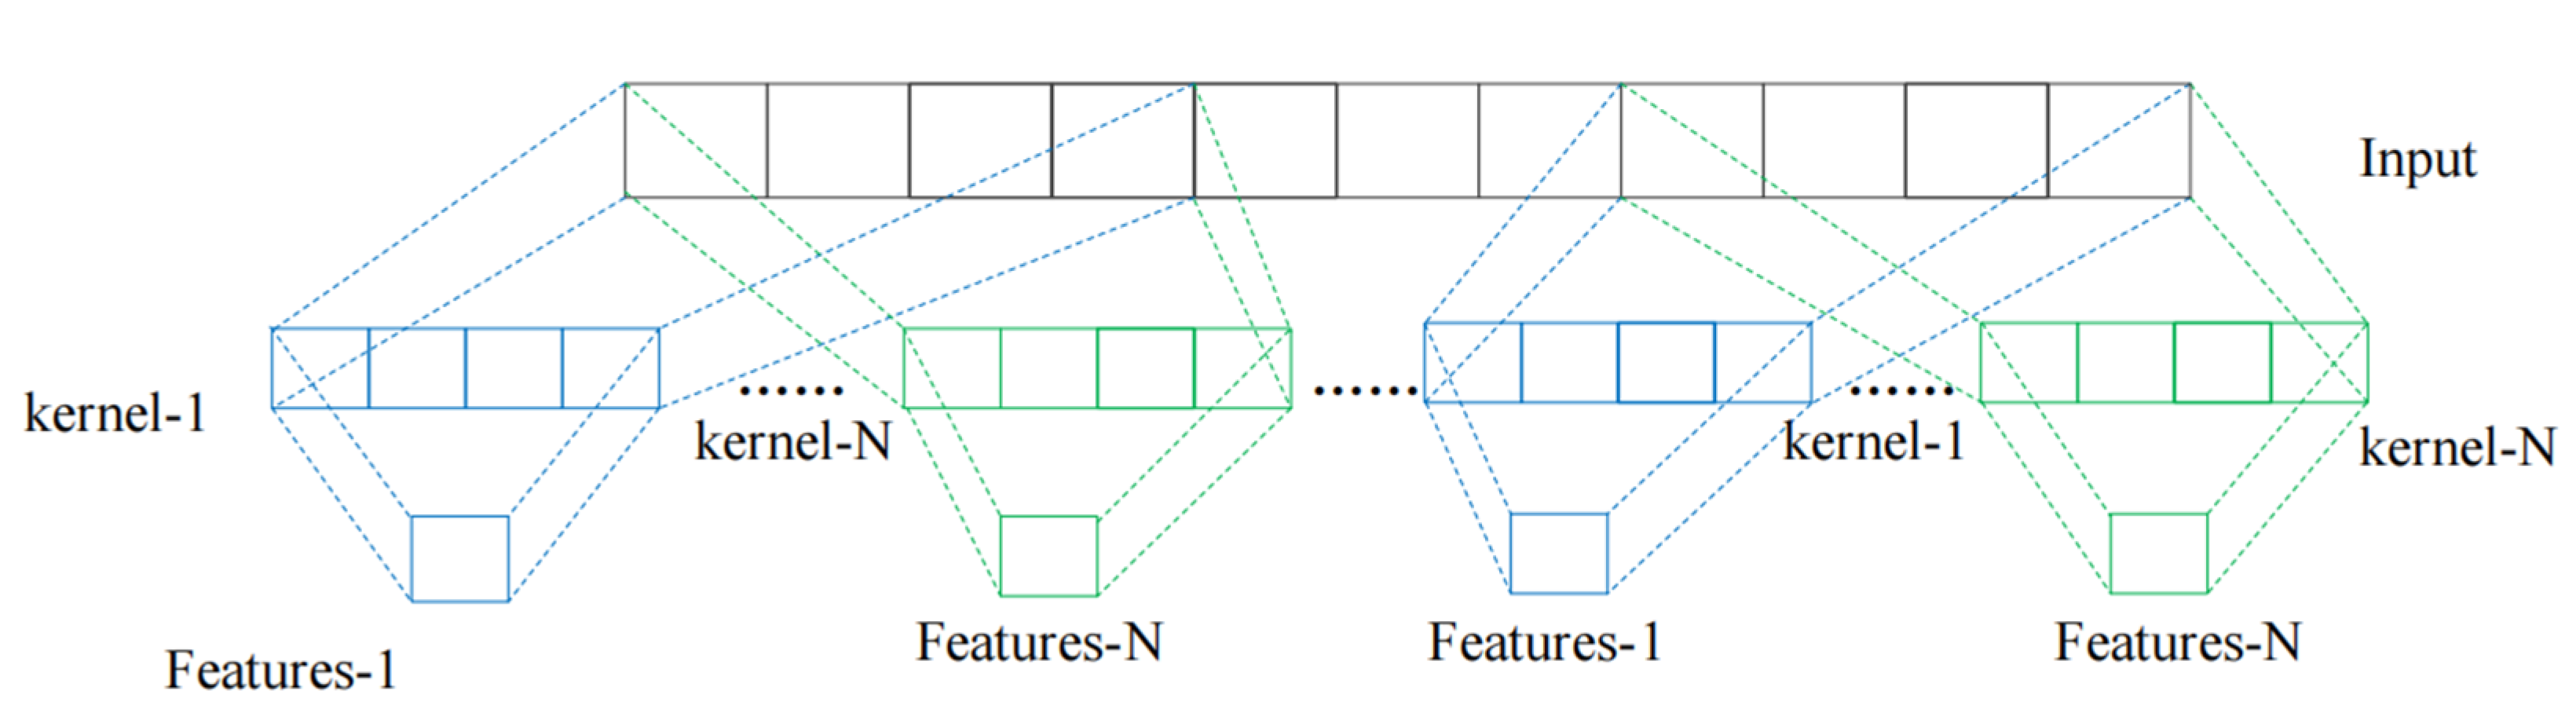
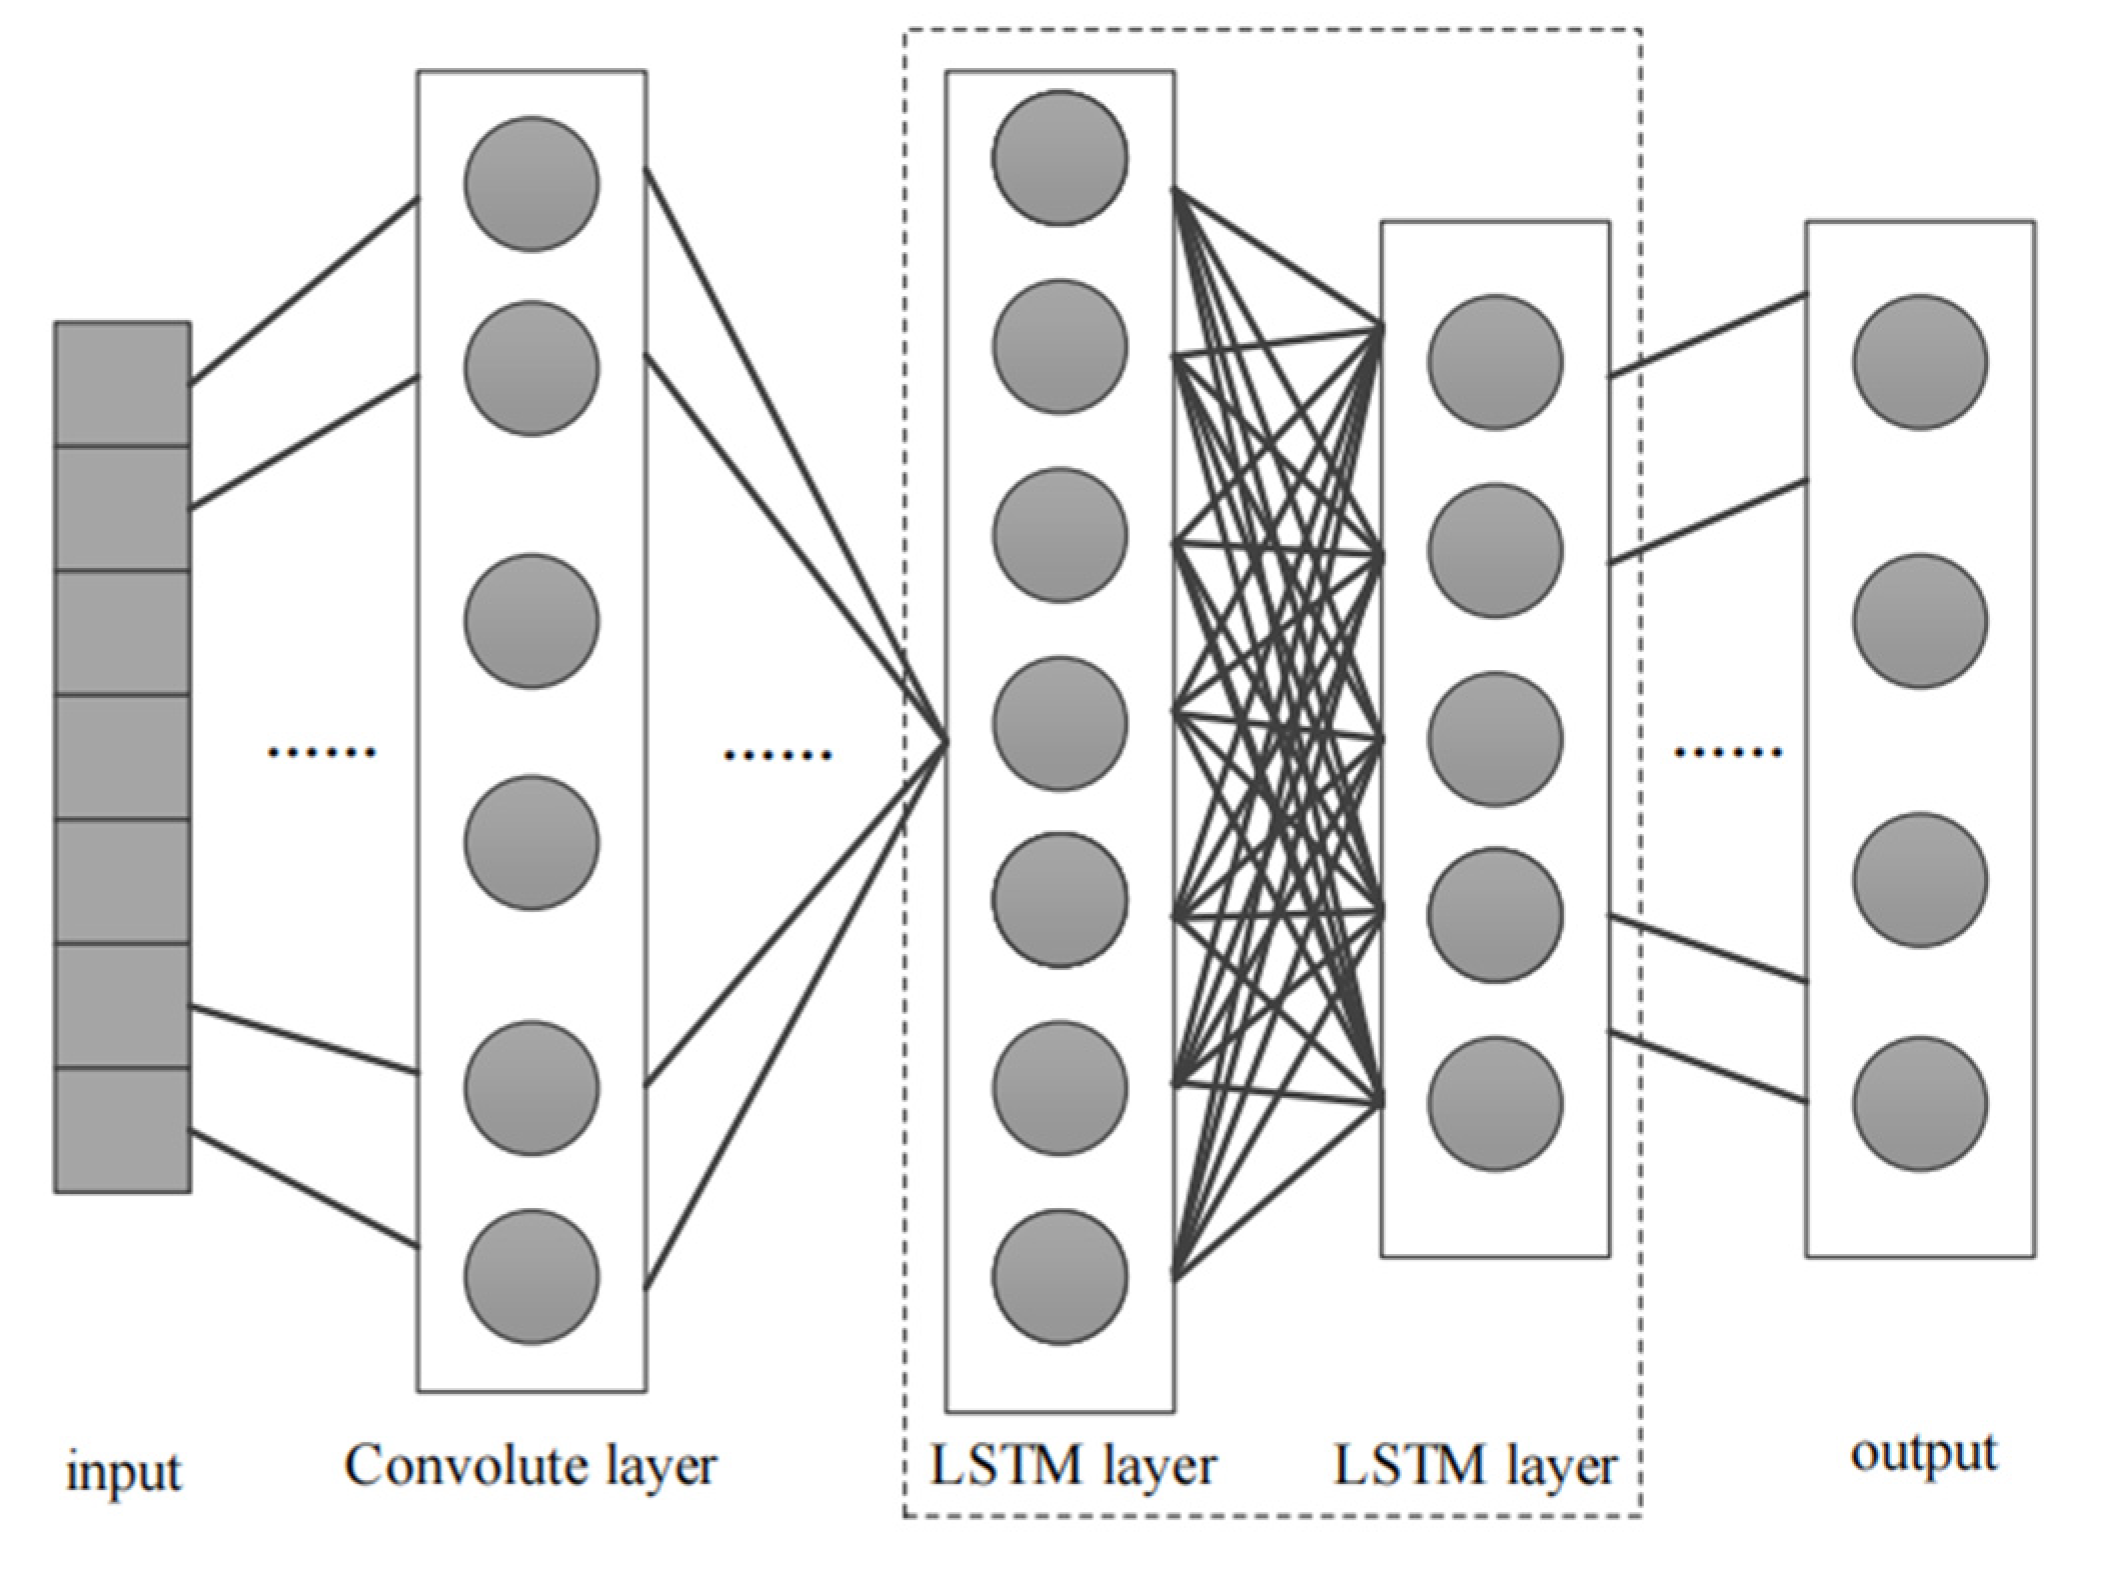
This paper presents a method based on a CNN and LSTM, which uses SCADA data to monitor the condition of the main bearings of the wind turbine. Firstly, we used the CNN one-dimensional convolution network layer to extract the unit operation features from SCADA data in the time direction and obtained multiple feature vectors of input data. The length of the input data is equal to the number of convolution kernels. Then, these multiple eigenvectors are sent into the LSTM network, and the information passing through the multiple LSTM network layers is transferred to the output layer, as shown in
Figure 3.
The variables that have a high correlation with the main bearing temperature are selected as the input to establish the model through correlation analysis, and the prediction model is established with the bearing temperature as the target. The specific steps are as follows:
Step 1: Select a normally operating unit as the source of the training data, eliminate the null value and other abnormal data, and normalize the data;
Step 2: Establish a prediction model. In the model, the convolution layer is a one-dimensional CNN, the number of layers is one, the number of cores is ten, and the LSTM block is four layers. Select the average absolute error as the loss function. The optimizer selects Adam, which can use the adaptive learning rate to accelerate the model training convergence;
Step 3: Train the model, and use the preprocessed data to conduct multiple iterative training;
Step 4: Input the unit data to be tested into the trained model to detect the bearing status of the unit.
4. Example Analysis
4.1. Data Preprocessing and Parameter Selection
The 2018 SCADA data of a wind farm in northwest China were used for the model training. The SCADA data contain many Boolean-type status variables that record whether each system of the unit is enabled, as well as the operational status of the unit, unit fault alarm, etc. The units in normal operation are selected through these Boolean variables, and the data related to the main bearings are selected for the model training.
The correlation coefficient between the selected floating-point field and the temperature of the front bearing of the main shaft was calculated (the results are shown in
Table 1), and variables, such as the temperature of the rear bearing of the main shaft, the temperature of the engine room, and the ambient temperature, were selected as the input of the model. The data were filtered according to the value range of the selected field, and the abnormal data caused by a sensor anomaly, communication anomaly, and other factors were eliminated.
In order to more accurately predict the current bearing temperature value of the unit by the model, the temperature data from the front bearing of the main shaft is used as the input of the model, such as the temperature of the rear bearing of the main shaft, the temperature of the engine room, the ambient temperature, and other measuring points that reflect the temperature at the current time of measurement, and the temperature of the front bearing of the main shaft is the temperature at a certain time in the previous period of time by way of the input of the model. The comprehensive working condition of the unit at the current moment is evaluated by the parameters, such as the temperature of the rear bearing of the main shaft, the temperature of the engine room, and the ambient temperature. The theoretical temperature of the front bearing of the main shaft under the current working conditions is jointly predicted by taking the temperature of the front bearing of the main shaft in the previous period as the initial value of the prediction value.
4.2. Anomaly Detection Method
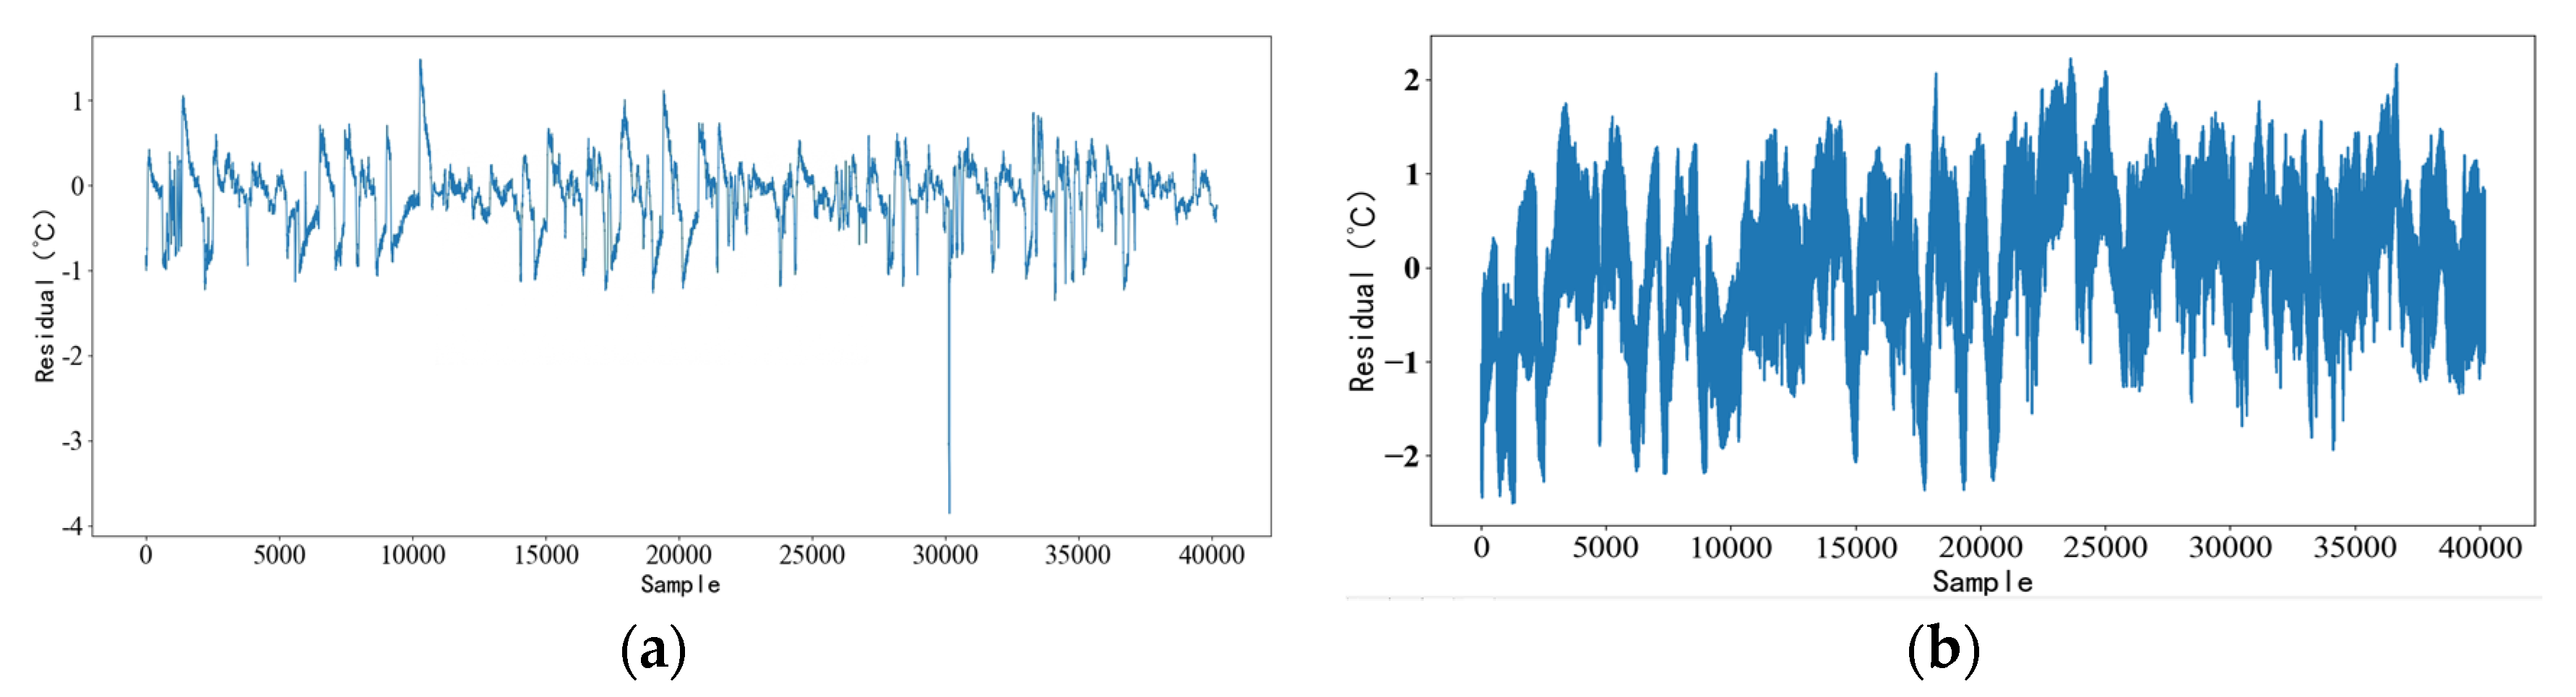
Anomaly detection is carried out by finding abnormal units in the test sample dataset, calculating the theoretical temperature of the unit bearing through the prediction model proposed in this paper, and comparing the difference between the theoretical temperature and the actual temperature in order to detect the abnormality. The root mean square error of the real and predicted values is used to evaluate the difference between the actual and theoretical temperatures. The calculation formula of the root mean square error is as follows:
where
is the real temperature,
is the predicted temperature (theoretical temperature), and N is the number of samples.
4.3. Anomaly Detection Method
SCADA data of multiple normal units were selected as training data for 10 batches of training. The data of normal units in the test set were inputted into the model in order to obtain the predicted temperature and compare it with the actual temperature.
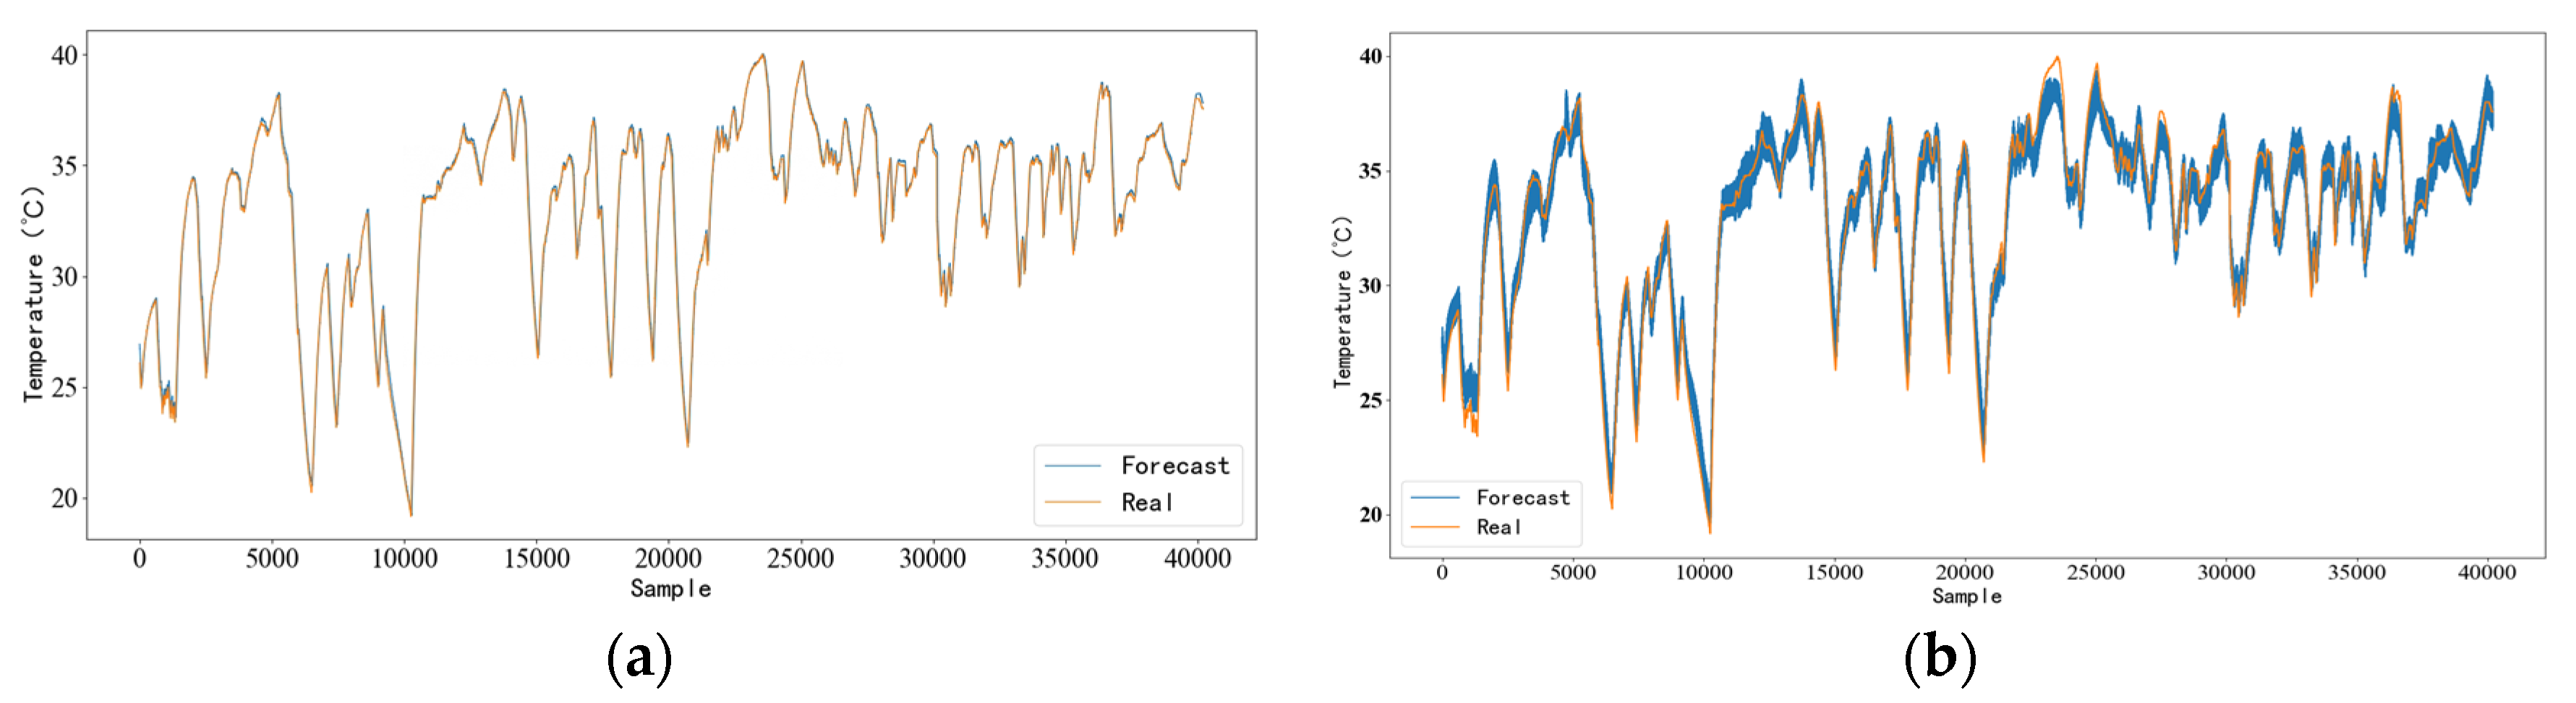
Figure 4 and
Figure 5 show the fitting of the separate LSTM model and the CNN-LSTM model for normal units. For the normal units, the predicted temperatures of the two models can follow the changes in the actual temperature. The RMSE between the predicted values of the CNN-LSTM model and the actual values is 0.8460, and the RMSE between the predicted values of the CNN-LSTM model and the actual values is 0.4235. In the temperature prediction of normal units, the RMSE of the LSTM model is slightly lower than that of the CNN-LSTM model; however, the RMSE of both models is low overall.
4.4. Analysis of Indicators under Abnormal Conditions
The data of each unit in the test set were inputted into the model after preprocessing, the predicted temperature of the unit bearing was obtained and compared with the actual temperature, and a model warning was sent when the actual temperature was significantly higher than the predicted temperature (theoretical temperature).
By examining the onsite operation and maintenance records, it was found that the main bearings of unit A and unit B were abnormal: the main shaft bearing cages of the bearings of unit A were all broken, and the bearings were scraped; the lubricating grease inside the bearings of unit B had hardened and formed plates, particles had entered the bearings, and the bearings were moderately worn. In unit A, the CNN-LSTM model detects unit faults at 6800 sample points in advance. The operation results of units A and B in the LSTM model and the CNN-LSTM model proposed in this paper are shown in the figure below.
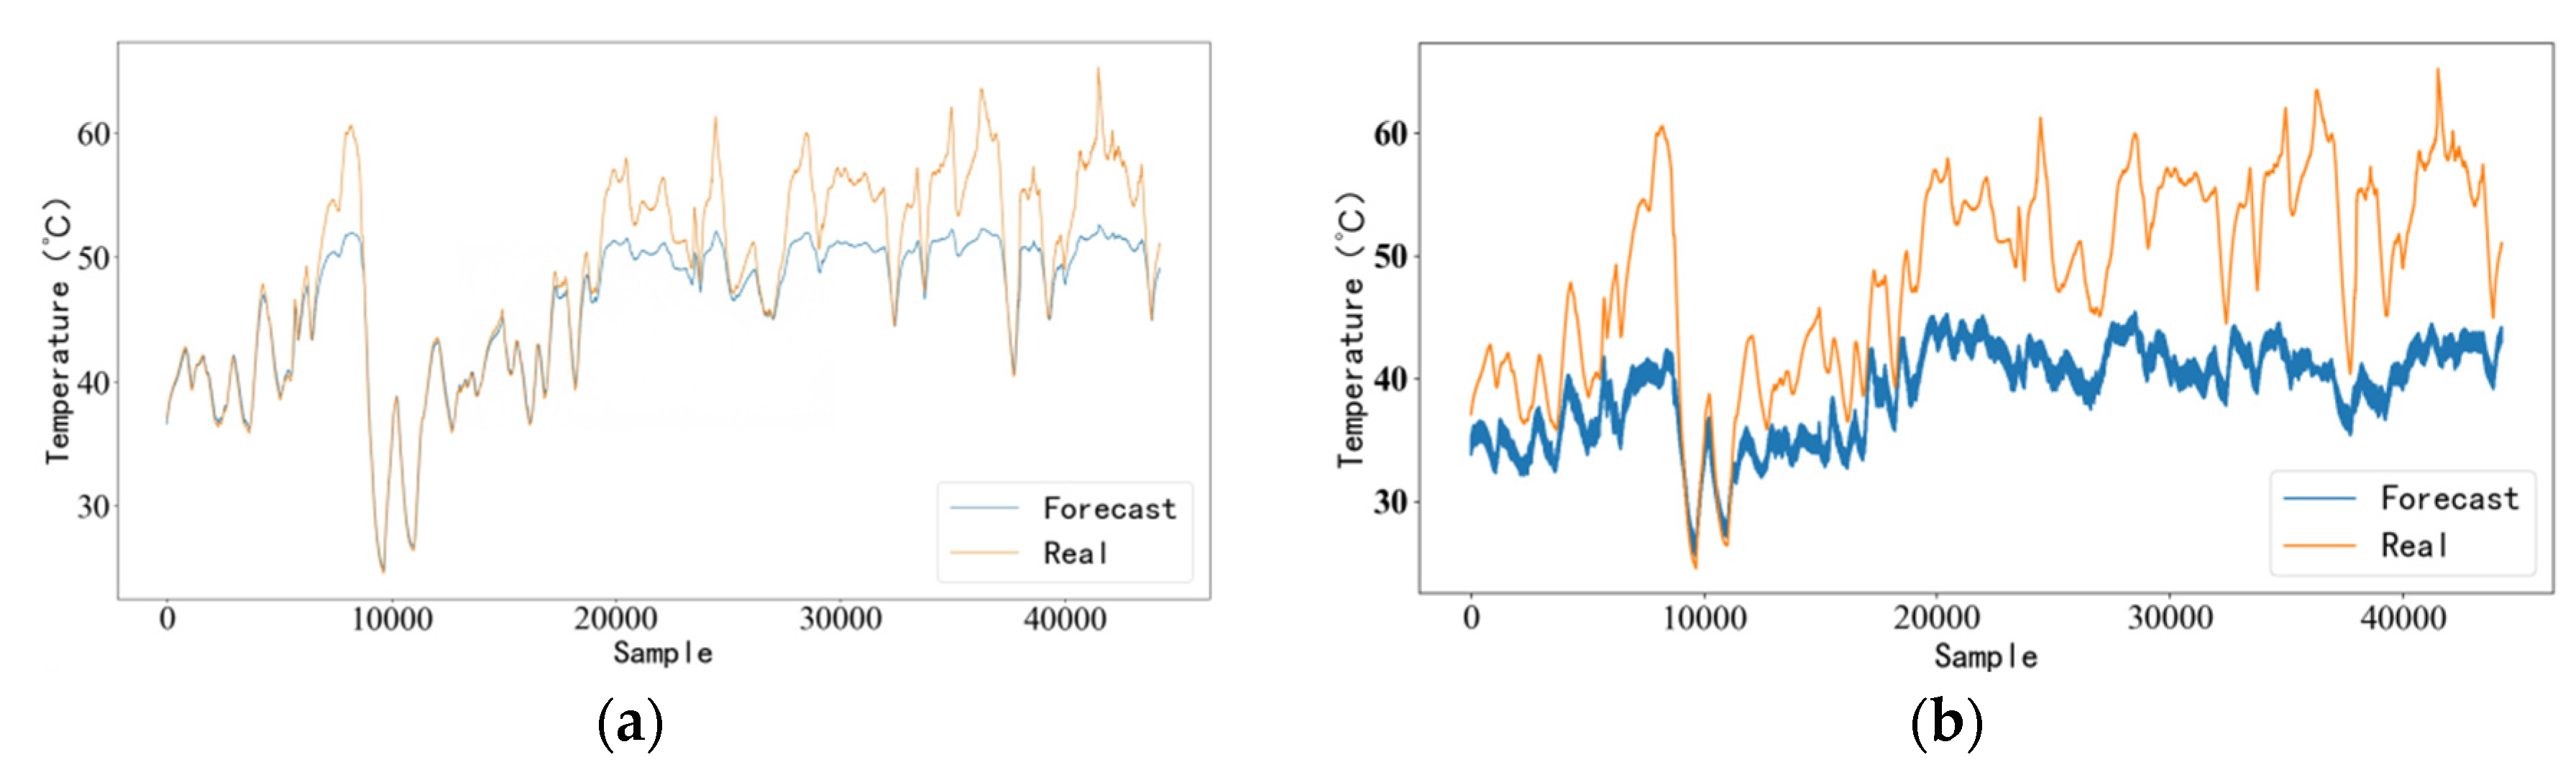
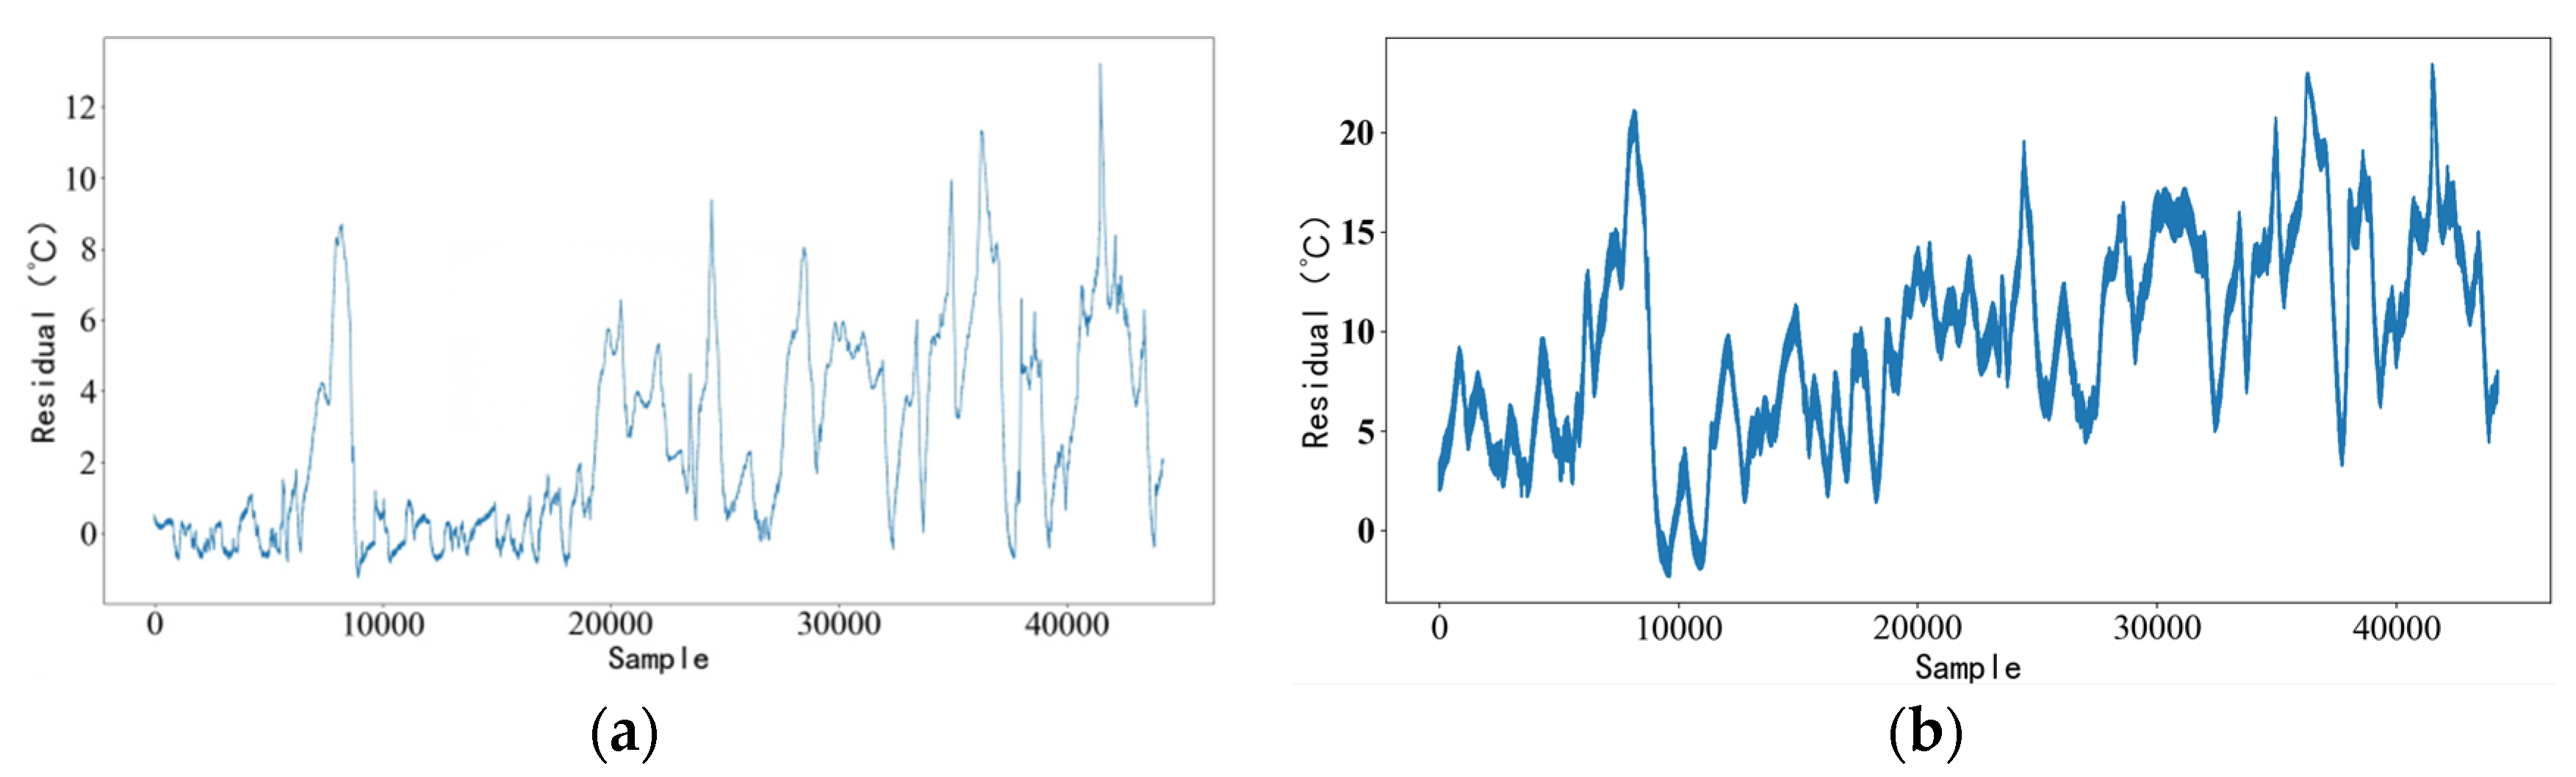
Figure 6 and
Figure 7 show the comparison between the LSTM model of unit A and the CNN-LSTM model proposed in this paper for the same time period. It can be seen that the model proposed in this paper can separate the actual temperature from the predicted temperature earlier, and to a greater extent, it can detect the abnormality of the main bearings earlier. At the same time, the RMSE of the theoretical temperature and actual temperature of the model proposed in this paper was 11.2637, and the RMSE of the theoretical temperature and actual temperature of the LSTM model was 3.760.
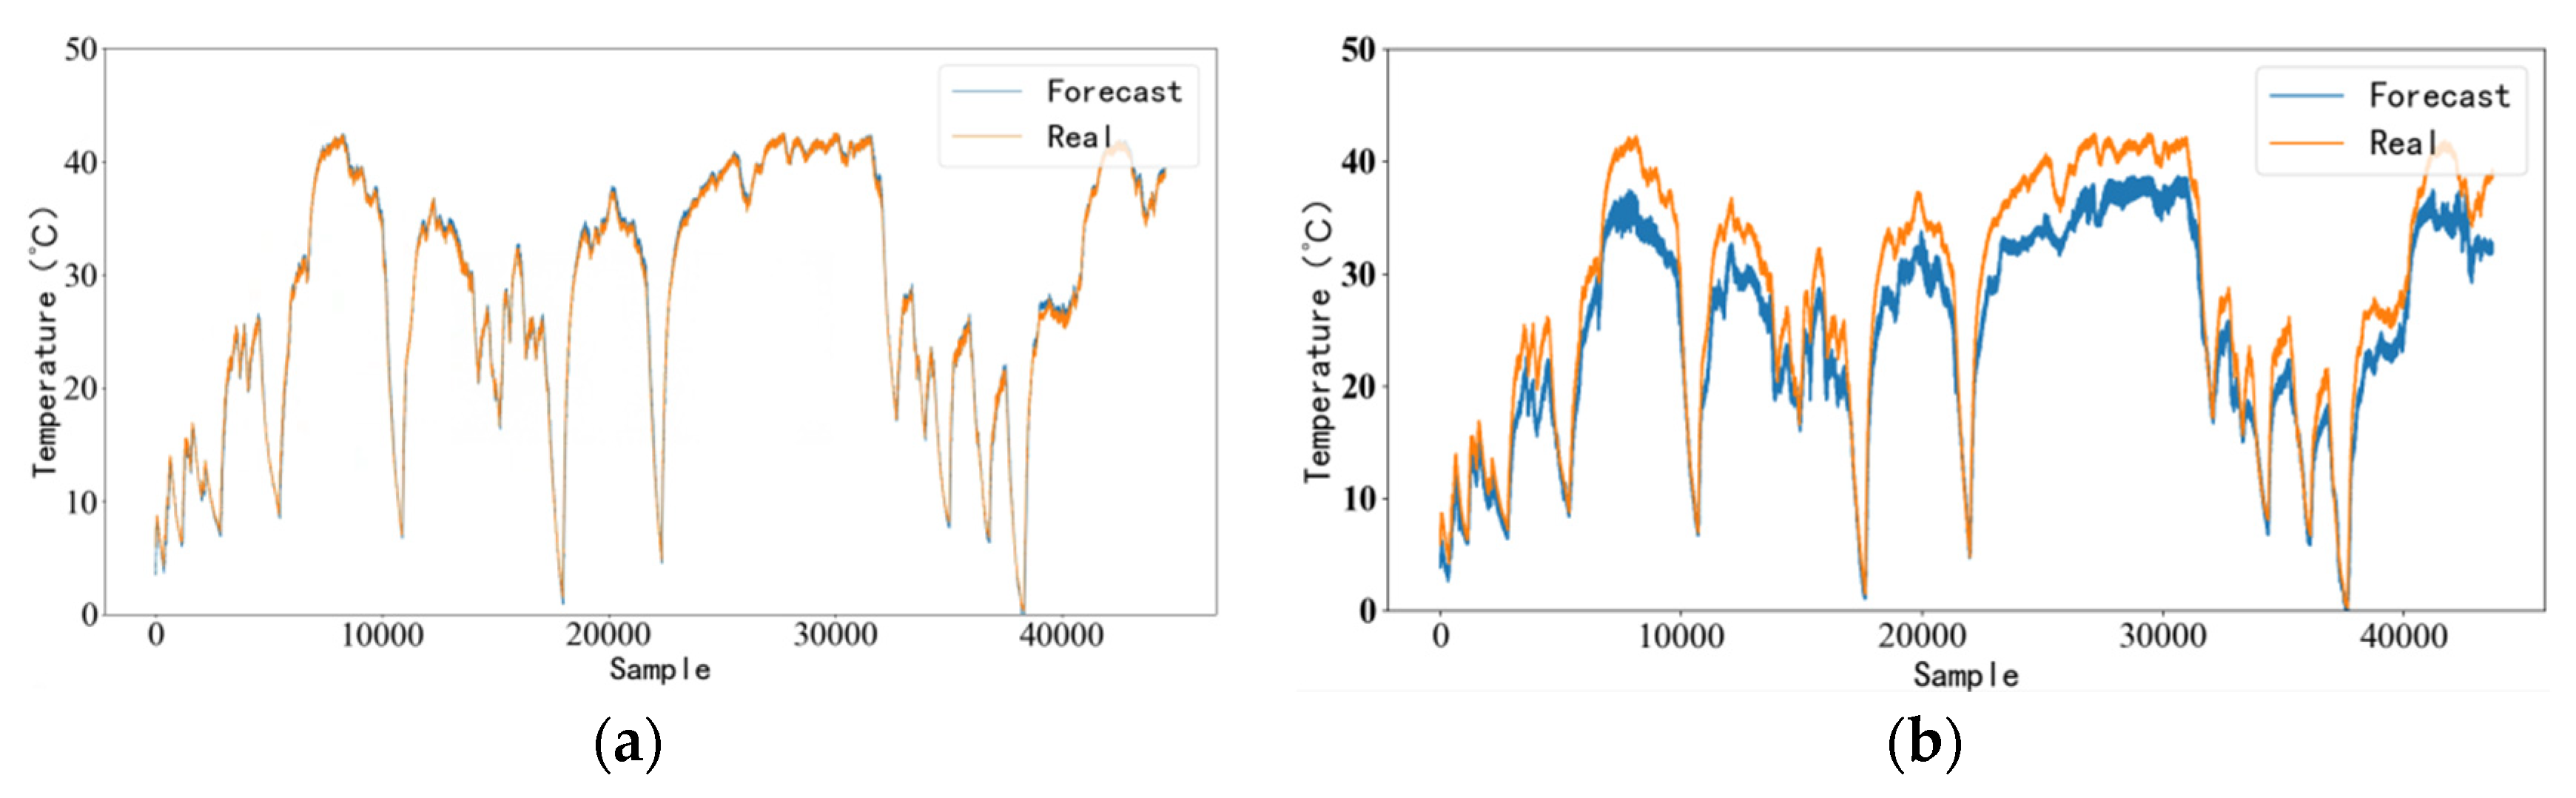
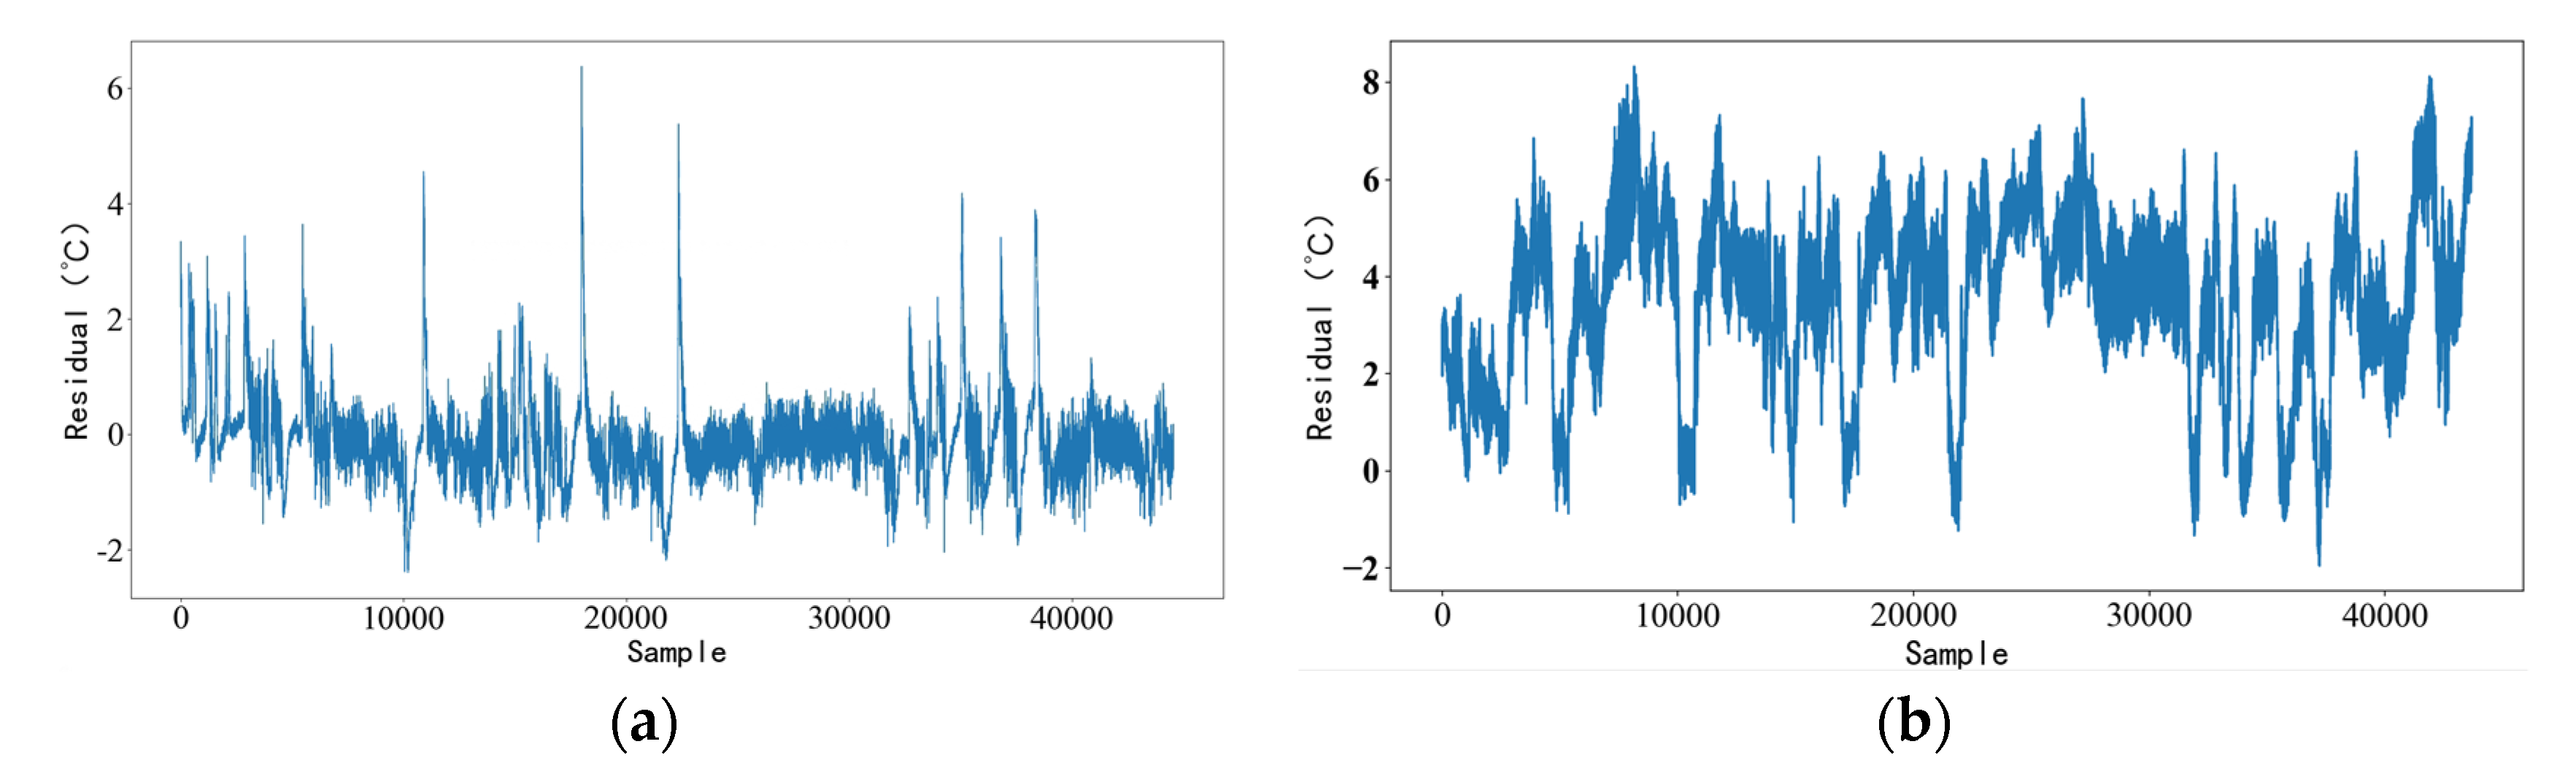
Figure 8 and
Figure 9 show the comparison of the model operation results of the LSTM model of unit B and the CNN-LSTM model of unit B proposed in this paper for the same time period. It can be seen from the figure that there is no obvious separation between the predicted temperature and the actual temperature in the LSTM model, while the model proposed in this paper shows obvious separation, which demonstrates that the model proposed in this paper can find the fault characteristics of the bearing that the LSTM model cannot find. The RMSE of the theoretical temperature and actual temperature of the model proposed in this paper was 4.1494, and the RMSE of the theoretical temperature and actual temperature of the LSTM model was 0.7598.
Table 2 shows the RMSE statistic results for the comparative experiment’s normal and fault units. It can be seen that the RMSE of the CNN-LSTM model shows a greater difference between the normal units and fault units. The RMSE of the LSTM model has a greater degree of differentiation between some faulted units and normal units, while others have a lesser degree between the faulted units and normal units. On average, the RMSE of the CNN-LSTM model of the failed units is larger than that of the LSTM model. To sum up, the CNN-LSTM model is more effective in fault predictions of the wind turbine main bearing.
5. Conclusions
The method proposed in this paper can effectively detect main bearing seal ring damage, grease deterioration, grease foreign matter pollution, and other faults in the wind turbine generator. Using the operation data of a wind farm unit in northwest China, the CNN-LSTM model used in this paper was compared with the separate LSTM model. The results show that the CNN-LSTM model can detect the abnormal state of the main bearing earlier, and the CNN-LSTM model can detect the abnormal state of the main bearing that LSTM cannot.
Compared with the LSTM model, it was found that the RMSE of the LSTM model alone is slightly lower than that of the CNN-LSTM model predicted by the main bearing temperature of the normal unit. However, the CNN-LSTM model will find the abnormal state of the main bearing earlier in the faulty unit, and the CNN-LSTM model can find the abnormal state of the main bearing that the LSTM model cannot find.
The data used in this paper is mainly minute-level data collected by the temperature sensor in the wind turbine SCADA system. The data sampling frequency is still low, and the bearing failure prediction accuracy is not sensitive to temperature changes. For subsequent research, introducing the high-frequency data collected by the vibration sensor into the model to predict and warn of more faults will be considered.


