
Process Improvement of Biogas Production from Sewage Sludge Applying Iron Oxides-Based Additives

Department of Environmental Protection and Water Engineering, Faculty of Environmental Engineering, Vilnius Gediminas Technical University, Saulėtekio al. 11, LT-10223 Vilnius, Lithuania
*
Author to whom correspondence should be addressed.
Energies 2023, 16(7), 3285; https://doi.org/10.3390/en16073285
Submission received: 6 March 2023
/
Revised: 31 March 2023
/
Accepted: 4 April 2023
/
Published: 6 April 2023
(This article belongs to the Special Issue Wastewater Treatment Related to Energy)
Abstract
:Iron additives are effective in the anaerobic sewage sludge digestion process, but the composition and dosage of these additives are not precisely defined. This research investigates the effects of three iron oxides-based additives on the destruction of volatile solids, the production and quality of biogas, as well as the quality of the supernatant. Additive No 1 contained >41.5% of FeO and >41.5% of Fe2O3, additive No 2 contained ≥86% of Fe3O4, and additive No 3 contained ≥98% of Fe3O4. The best results were obtained by applying an iron oxides-based additive with a higher content of divalent iron oxide. The increase in efficiency of the VSs destruction was not significant and on average 2.2%. The increase in biogas production was on average 20% while the average increase in the content of methane in the biogas was 6.3%. Applying the additive, the reduction in the concentration of ammonium nitrogen in the supernatant was up to 28%, as well as a reduction in the concentration of phosphate phosphorus in the supernatant by up to 3.1 times could be expected compared to the case when the additive was not applied. The dose of additive No 1 was between 7.5 g/kg of dry solids and 15 g/kg of dry solids in the lab-scale test. The dose was specified in the full-scale test, and the recommended dose of the additive was 10 g/kg of dry solids to improve biogas production.
1. Introduction
Sewage sludge can be converted into energy and thus promote energy sustainability. Anaerobic digestion aims to reduce the amount of generated sewage sludge as well as to produce biogas [1,2]. Methane in biogas is the most valuable component, which is widely used as a fuel. Although technologies of sewage sludge digestion have been widely applied recently, biogas production is a long-term and complex process, during which only 30–50% of volatile solids (VSs) are destroyed and transformed into biogas [3]. Today, ways and means to reduce the amount of sludge, increase the yield of biogas, and improve the quality of biogas are being researched. Improving the quality and quantity of biogas usually requires pre-treatment to maximize methane yields and/or post-treatment to remove H2S [3,4,5,6]. Pre/post-treatment involves considerable energy consumption and higher costs. The disadvantage of most methods is low-cost efficiency due to high-energy consumption and high-chemical requirements.
Iron-based additives, due to their electron acceptance and donation capabilities, have been emphasized as being exceptional in improving the anaerobic digestion process efficiency among all other enhancement options. It has been observed that Fe2+ and magnetite increase biohydrogen production [7], as well as iron additives increase methane yield [8]. Recently, iron oxide nanoparticles have been used to improve the digestion process. A dose of iron oxide nanoparticles of 20 mg/g VSs increased the removal efficiency of TSs and VSs in the digesting of olive mill wastewater and chicken manure [9]. By digesting cattle manure with an 18 mg/L iron oxide nanoparticle additive, the biogas and methane production increased by 27.6% and 25.4%, respectively [10]. Iron supplements are used in various doses in the anaerobic digestion process [11]. The addition of Fe of different morphologies and valence states during anaerobic digestion to increase biogas (hydrogen and methane) production and simultaneously enhance organic matter degradation has attracted the attention of many researchers in recent years [12]. It has been noticed that zero-valent iron as a reducing material is expected to enhance the anaerobic processes including the hydrolysis-acidification process. Zero valent iron made the methane production increase by 43.5% and the sludge reduction ratio increase by 12.2% [13]. Ferric chloride is considered a beneficial additive as a strategy for odour mitigation. It is used for sulphide control in full-scale WWTPs [14]. It is important to determine the correct dose of an iron additive because an excessive dose of iron powder (6 g in 300 g of sludge) has a significant negative impact on the anaerobic digestion process and methane yield [15]. The anaerobic sludge digestion process is complicated by a high content of nitrogen [16] or sulphur [17,18]. The authors [19] present the main possibility of an efficient gas purification process from hydrogen sulphide using inorganic materials with oxidizing properties based on iron and manganese oxides. Ferric oxide-containing waterworks sludge can be used to reduce the formation of hydrogen sulphide during anaerobic digestion [20]. Compared with the use of fresh ferric chloride, the operational costs are reduced by up to 50% by using sludge. Different doses of zero-valent iron are recommended to improve the efficiency of sewage sludge digestion, for example a nano-sized zero-valent iron dose of 1 g/L is optimal for methanogenesis [21,22], and a micron-sized zero-valent iron dose of 1.5 g/L improved volatile fatty acid accumulation and it was able to remove phosphorus [23]. Most of the studies have been performed under laboratory conditions. In practice, the anaerobic sludge digestion process is affected by various factors [24]. It was noticed that FeCl3 negatively impacted the anaerobic digestion process by reducing the volume of produced biogas [25]. The excessive FeCl3 could inhibit the high-solids anaerobic digestion process, which would be gradually recovered by the ammonia and the microbes acclimated to this environment [26]. Microbial community analysis confirmed that ferric chloride enriched Fe (III)-reducing genera and the bacterial microorganisms related to hydrolysis and acidification, but decreased the richness of methanogens [27].
Today, the exact effect of iron oxides on the sludge digestion process has not been determined and the targeted addition of iron oxides to the sludge digestion process is not well defined [26,28]. This research aimed to investigate the effect of three iron oxides-based additives of different compositions on the destruction of VSs, the production and quality of biogas, and the quality of the supernatant. The best result obtained under laboratory conditions (substance and dose) was verified under full-scale conditions. A detailed analysis of the results of the sludge digestion process with the application of iron oxides-based additives would provide knowledge for future optimization studies of the sludge digestion process.
2. Methodology
2.1. Research Object
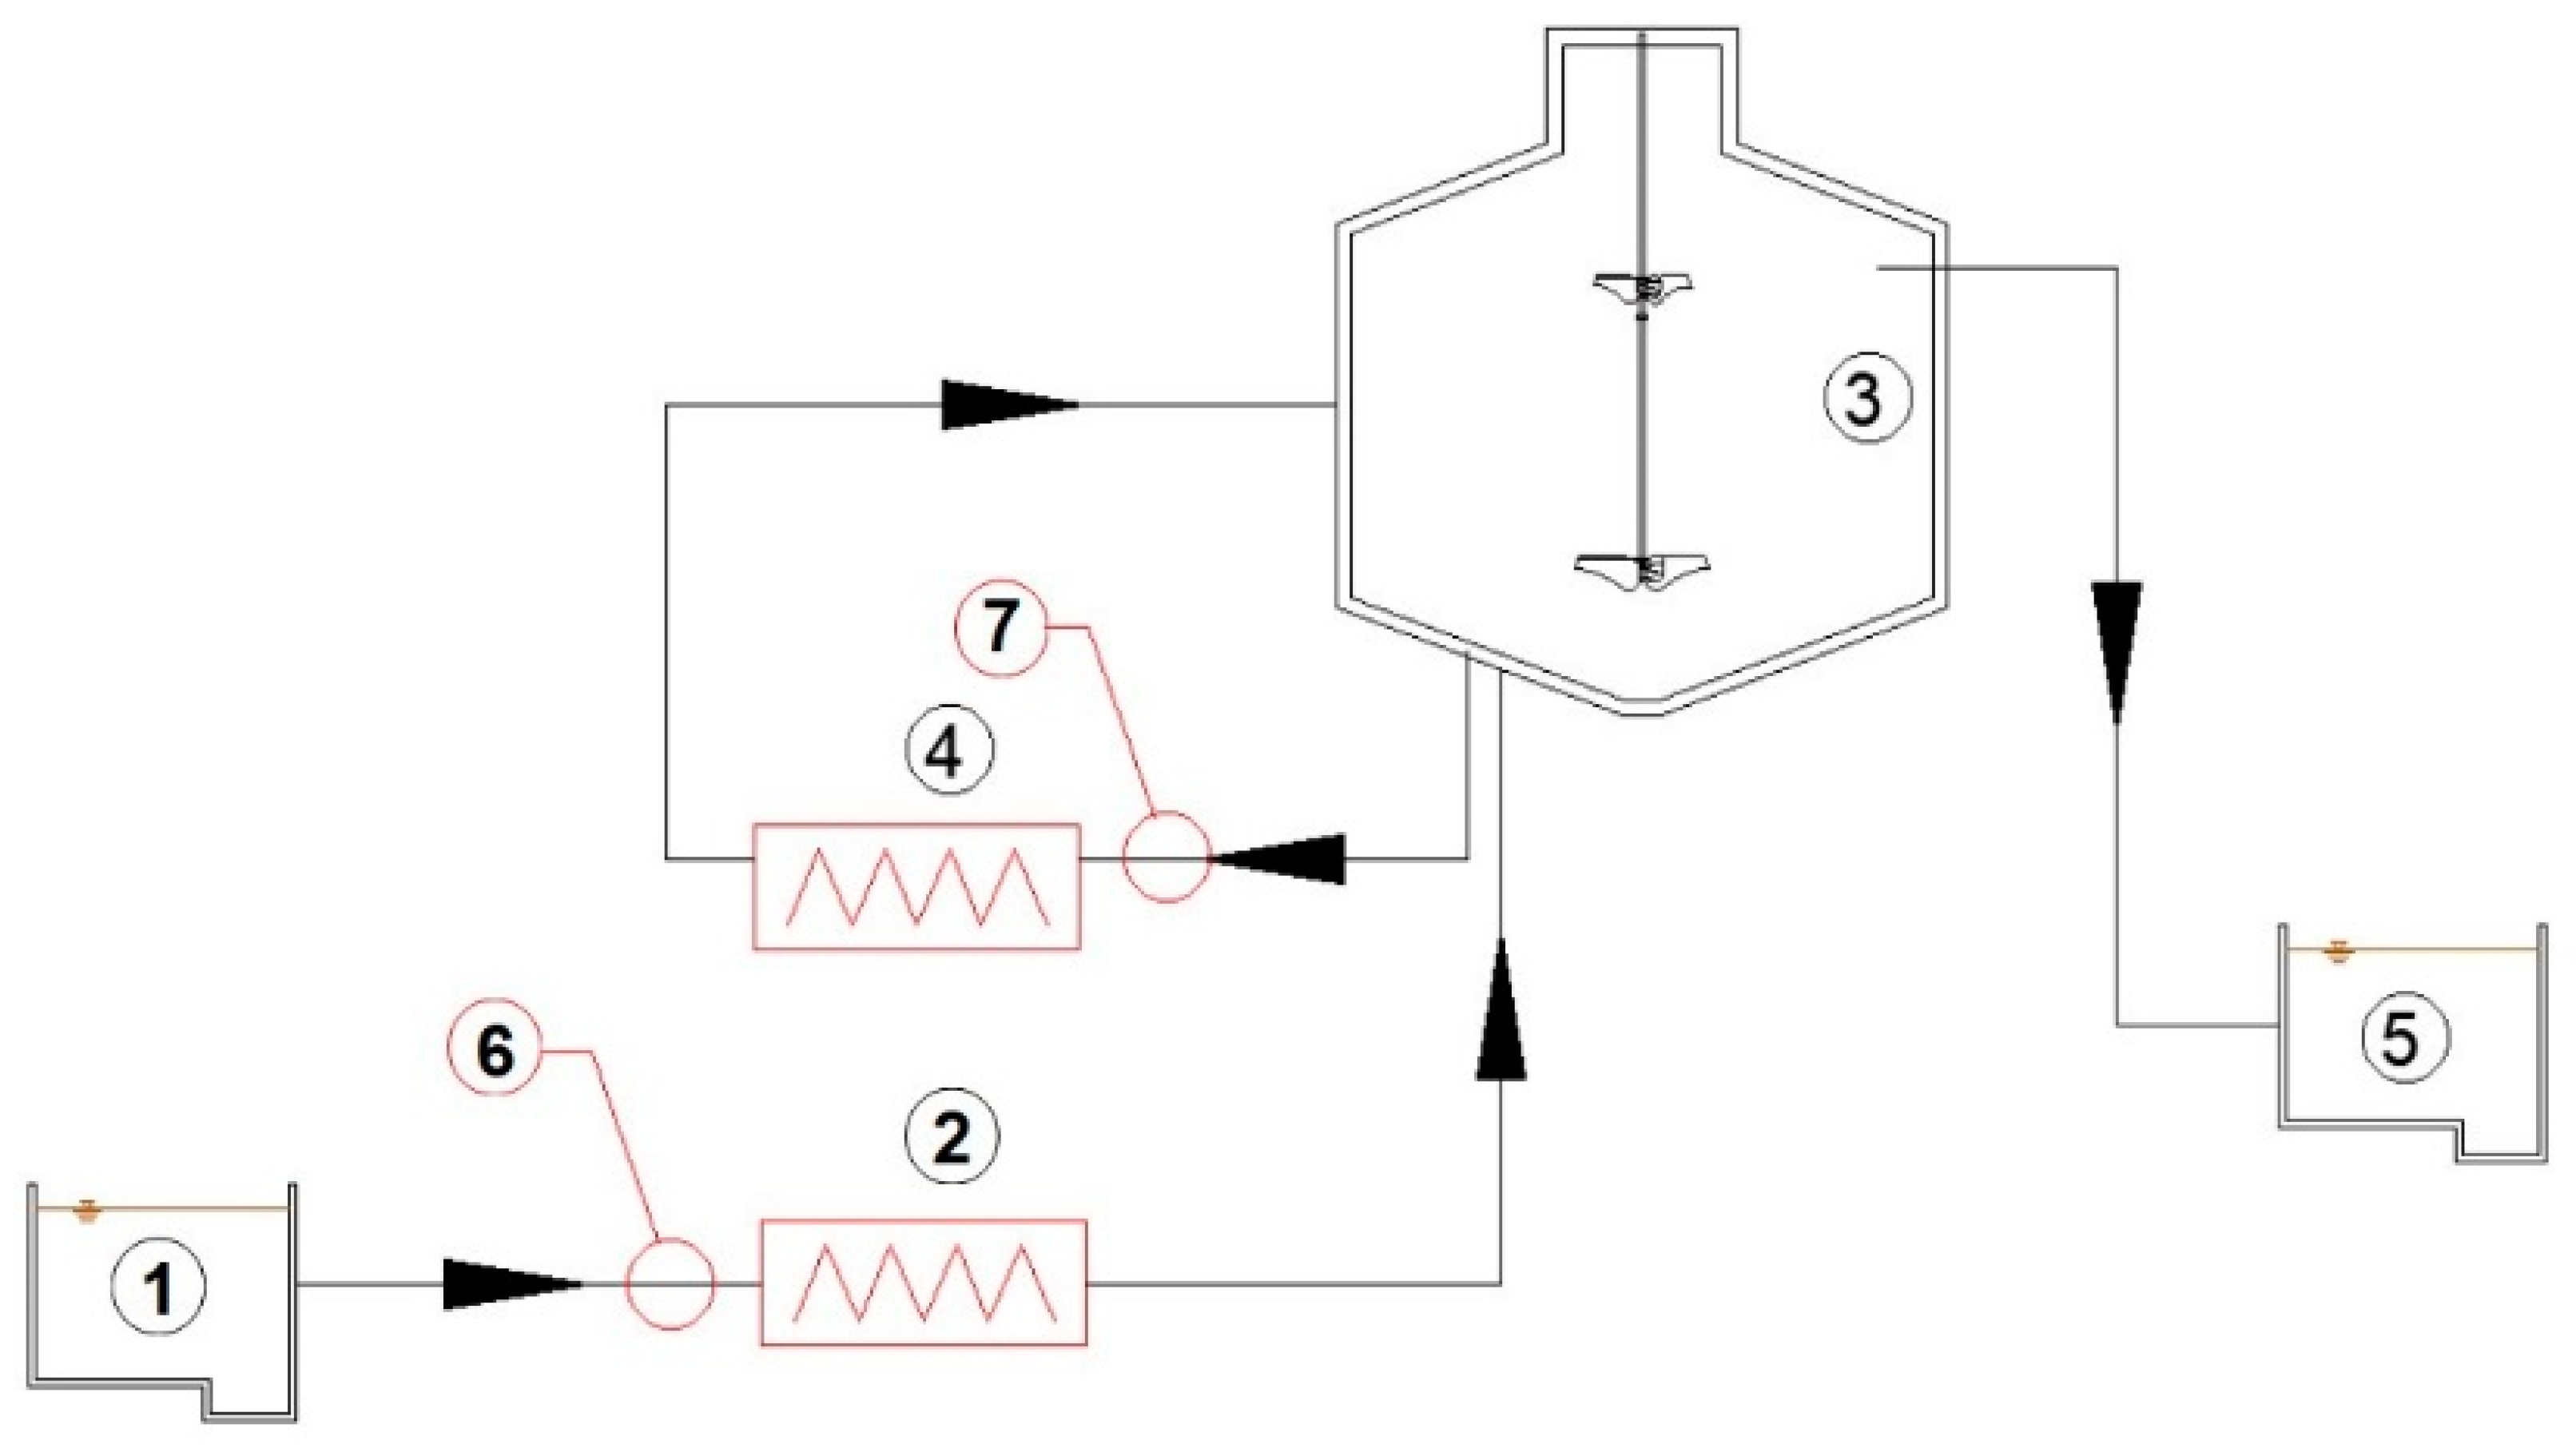
The wastewater treatment plant (WWTP) of Silute City (Lithuania) has a sludge treatment line that receives and anaerobically stabilizes a mixture of primary sludge and excess activated sludge. The mixture of primary and excess sludge taken from the line between the tank of sludge mixture and the digester, and an inoculum taken from the recirculation line of sludge were used for the lab-scale tests (Figure 1).
The sludge mixture contained 35.5% of primary and 66.5% of excess sludge.
2.2. Additives
Materials from different production/extraction sites with different compositions were selected to obtain the best possible result. Three new additives (No 1, No 2 and No 3) containing more than 80% iron oxides were used for the research. The countries of origin were for additive No 1, Austria, additive No 2, Republic of South Africa, and additive No 3, Sweden. All additives are black, water-insoluble, odourless powders. The composition of the additives is presented in Table 1.
Additive No 1 is an iron oxide-based additive containing more than 83% of iron oxides in the form of FeO or Fe2O3 with other trace elements in%: CaO (<0.5), Al2O3 (<0.5), K2O (<0.05), MnO (<1.0), NiO (<0.1), MgO (<0.5), Cr2O3 (<0.2), CoO (<0.05), Zn (<0.1), and Cu (<0.1). It should be noted that additive No 1 contains the same amount of divalent iron oxide as trivalent iron oxide.
Additive No 2 is a magnetite of natural origin containing more than 86% iron oxide in the form of Fe3O4 with other trace elements in%: CaO (≤1.74), Al2O3 (≤0.66), K2O (≤0.07), SiO2 (≤1.34), S (≤0.08), p (≤0.17).
Additive No 3 is a purified magnetite powder. It contains more than 98% of Fe3O4 with other trace elements in%: SiO2 (≤0.3%), Al (≤0.3%), Mn (≤0.1%), Ni (≤0.05%), Se (≤0.05%).
For additives No 2 and No 3, the magnetite dominates, which contains half as much divalent as trivalent iron oxide. The divalent iron oxide was 41.5% in additive No 1, while in additives No 2 and No 3, the divalent iron oxides contents reached 28.7% and 32.7%, respectively. Some authors note that the digestion process and the release of hydrogen are mostly promoted by divalent iron compounds [12].
Results obtained were also compared to a ferric chloride application. Literature indicates that this salt effectively reduces the amount of hydrogen sulphide in biogas, and the concentration of phosphate in the supernatant, while at the same time, allowing for the possibility of struvite formation during the anaerobic digestion process, but also reducing the production of biogas [25].
2.3. Lab-Scale Test
At the beginning of each phase of the test, concentrations of dry solids (DSs) and VSs were determined in the mixture of primary and excess sludge as well as in the inoculum. The sludge mixture was mixed with the inoculum in a ratio of 5:1 based on VSs. From the experience of the authors [6], it was decided that such an amount of inoculum is enough to start the digestion process immediately. The volume of inoculum was calculated according to Equation (1), given by the authors [5]:
where VSMix—concentration of VSs in sludge mixture before digestion, g VS/L; VSIn—concentration of VSs in the inoculum, g VS/L; 4.6—volume of the anaerobic reactor, L; and 5—ratio between vs. parts of sludge mixture to be digested and the inoculum.
At the beginning of each stage of the test, the concentrations of DSs and VSs in the sludge mixture with the inoculum were determined. Both anaerobic reactors were filled with it. In the first stage of the test, an additive was added to one of the reactors only. In the next stages of the test, the additives were added in different doses to each reactor. The primary dose of the additive was calculated according to two criteria: the demand for iron to bind phosphate phosphorus and to remove hydrogen sulphide.
The mass of the additive for phosphate phosphorus binding was calculated according to Equation (2):
where Vsludge—volume of sludge, m3; ΔP—the concentration of phosphates to be removed from the supernatant, g PO4−–P/m3; mFe—demand of iron to bind phosphate phosphorus, g Fe/g PO4−–P; and RFe—amount of iron in the additive,%.
The mass of additive for removing hydrogen sulphide was calculated according to Equation (3):
where β—overdose factor; MFe—molecular weight of iron, g/mol; MS—molecular weight of sulphur, g/mol; —concentration of soluble hydrogen sulphide, g/m3; —the sulphur fraction in soluble hydrogen sulphide,%; Vsludge—volume of sludge, m3; ΔH2S—amount of hydrogen sulphide to be removed from biogas, ppm; —density of hydrogen sulphide, g/L; Vbiogas—volume of biogas, m3; and —amount of iron in the additive,%.
Actual data of Silute WWTP was collected and analysed. According to obtained results, the initial dose of additive No 1 was calculated. The required amount of additive for 20 days was added at the beginning of the phases of the test (0.30 g/g DS/20 d). In addition to the calculated initial dose of the additive, a twice lower dose of 0.15 g/g DS/20 d was selected additionally. The dose of ferric chloride (0.56 g/g DS/20 d) was determined according to the equivalent of the iron content in additive No 1, when the dose of 0.30 g/g DS/20 d of the latter additive was applied. With a ferric chloride dose of 0.56 g/g DS/20 d the digestion process was disrupted during the lab-scale test. Since the digestion process was disrupted immediately and no biogas was produced, the results of the test are not presented, only the fact that the process was disrupted is indicated. Therefore, the ferric chloride dose was reduced to 0.15 g/g DS/20 d and 0.07 g/g DS/20 d in the next stages of the test. The operational details and the design of the tests are presented in Table 2.
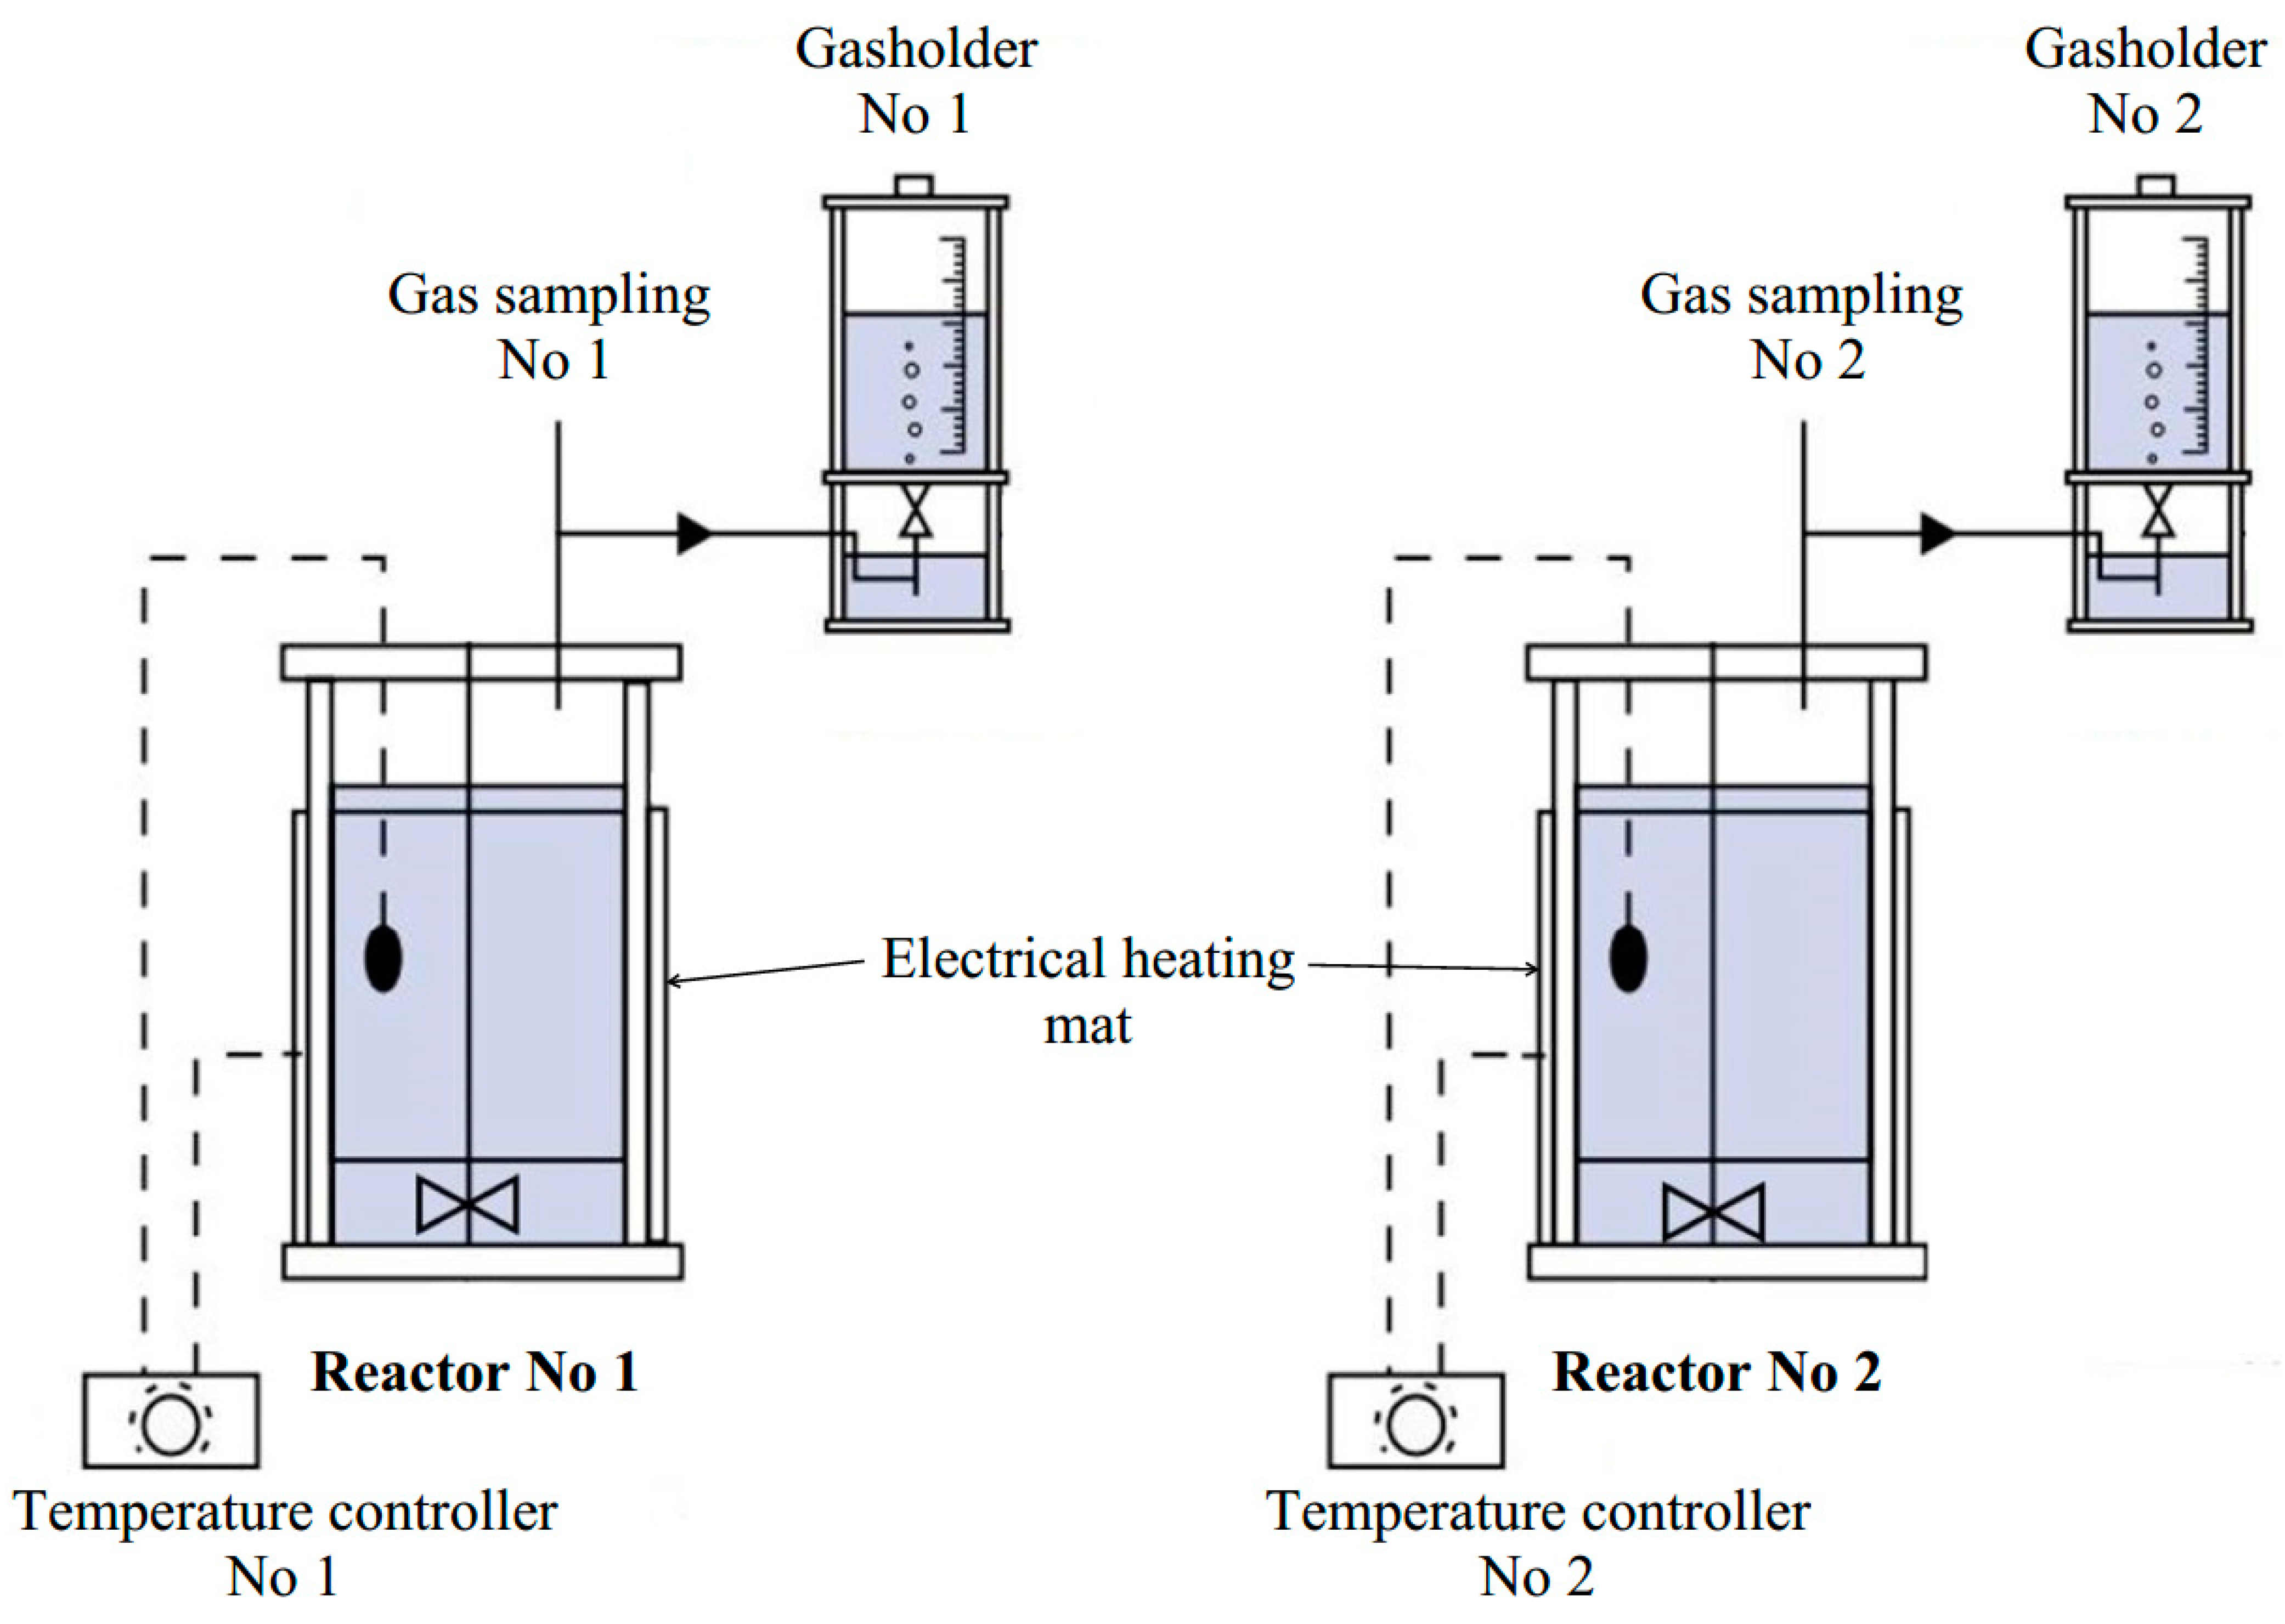
The test was performed at VILNIUS TECH laboratory using the anaerobic digestion model “W8 Armfield Ltd.”, Ringwood, UK (Figure 2).
The model consisted of two parallel working anaerobic reactors. The working volume of each anaerobic reactor was 4.6 l. Solid retention time (SRT) of 15–30 days and mesophilic conditions are typically maintained in digesters [29]. The selected SRT was 20 days. In each reactor, a constant temperature of 37 °C was maintained by an electric mat. The sludge was kept suspended by a mechanical stirrer rotated at 80 rpm. The pH of the sludge mixture varied between 7.2 and 7.3 at all stages of the test.
The produced biogas was measured using a water displacement method and collected in calibrated vessels of 2000 mL volume connected to each reactor. The amount and quality of biogas were measured every day.
Concentrations of DSs and VSs were also determined in the digested sludge of each reactor after 20 days. In addition, before and after the digestion, phosphate phosphorus, and ammonium nitrogen were determined in the supernatant. The values of parameters were analysed 3 times in each test.
2.4. Full-Scale Test
A full-scale test was performed at Klaipeda WWTP (Lithuania). A mixture of primary and excess sludge was digested in the WWTP. Two digesters were used, each with a volume of 3000 m3. The SRT in digesters was on average 18 d. Before the test, 100 kg/d of ferric chloride solution was dosed into the sludge before the digestion process.
During the test, additive No 1 was dosed. It was dosed into the mixing tank before the digesters. The test duration was 28 days. The average dose of the additive was selected according to the results of the lab-scale test (100 kg/d). To determine the most appropriate dose, the test was divided into 3 stages of 7 days each according to the additive dose: 120 kg/d of additive was dosed in the first stage, 100 kg/d of additive was dosed in the second stage and 60 kg/d of additive was dosed in the third stage. After obtaining the best result at the dose of 100 kg/d, the test was extended for 7 days with the mentioned dose. The daily amount of the additive was divided into equal parts and dosed every four hours.
The same parameters were determined during the test as during the lab-scale test, except phosphate phosphorus and ammonium nitrogen in the supernatant.
2.5. Methods of Sample Analysis
Sampling was done according to standards ISO 5667–13:2011, ISO 5667–1: 2006, ISO 5667–10: 2011. The concentration of the DSs was determined according to EN 15934: 2012. The concentration of VSs was determined according to EN 12880:2002. The concentration of phosphate phosphorus was determined according to ISO 6878:2004. The concentration of ammonium nitrogen was determined according to ISO 7150-1. The biogas composition was measured with the gas composition analyser GasData series GFM 410.
3. Results and Discussion
3.1. VSs Destruction
Determined concentrations of DSs and VSs in the sludge mixture with inoculum before the digestion process are presented in Table 3.
The data presented in Table 3 show that the content of DSs and VSs was analogous at all stages of the test (n = 9). Thus, the results obtained at different stages of the test are comparable.
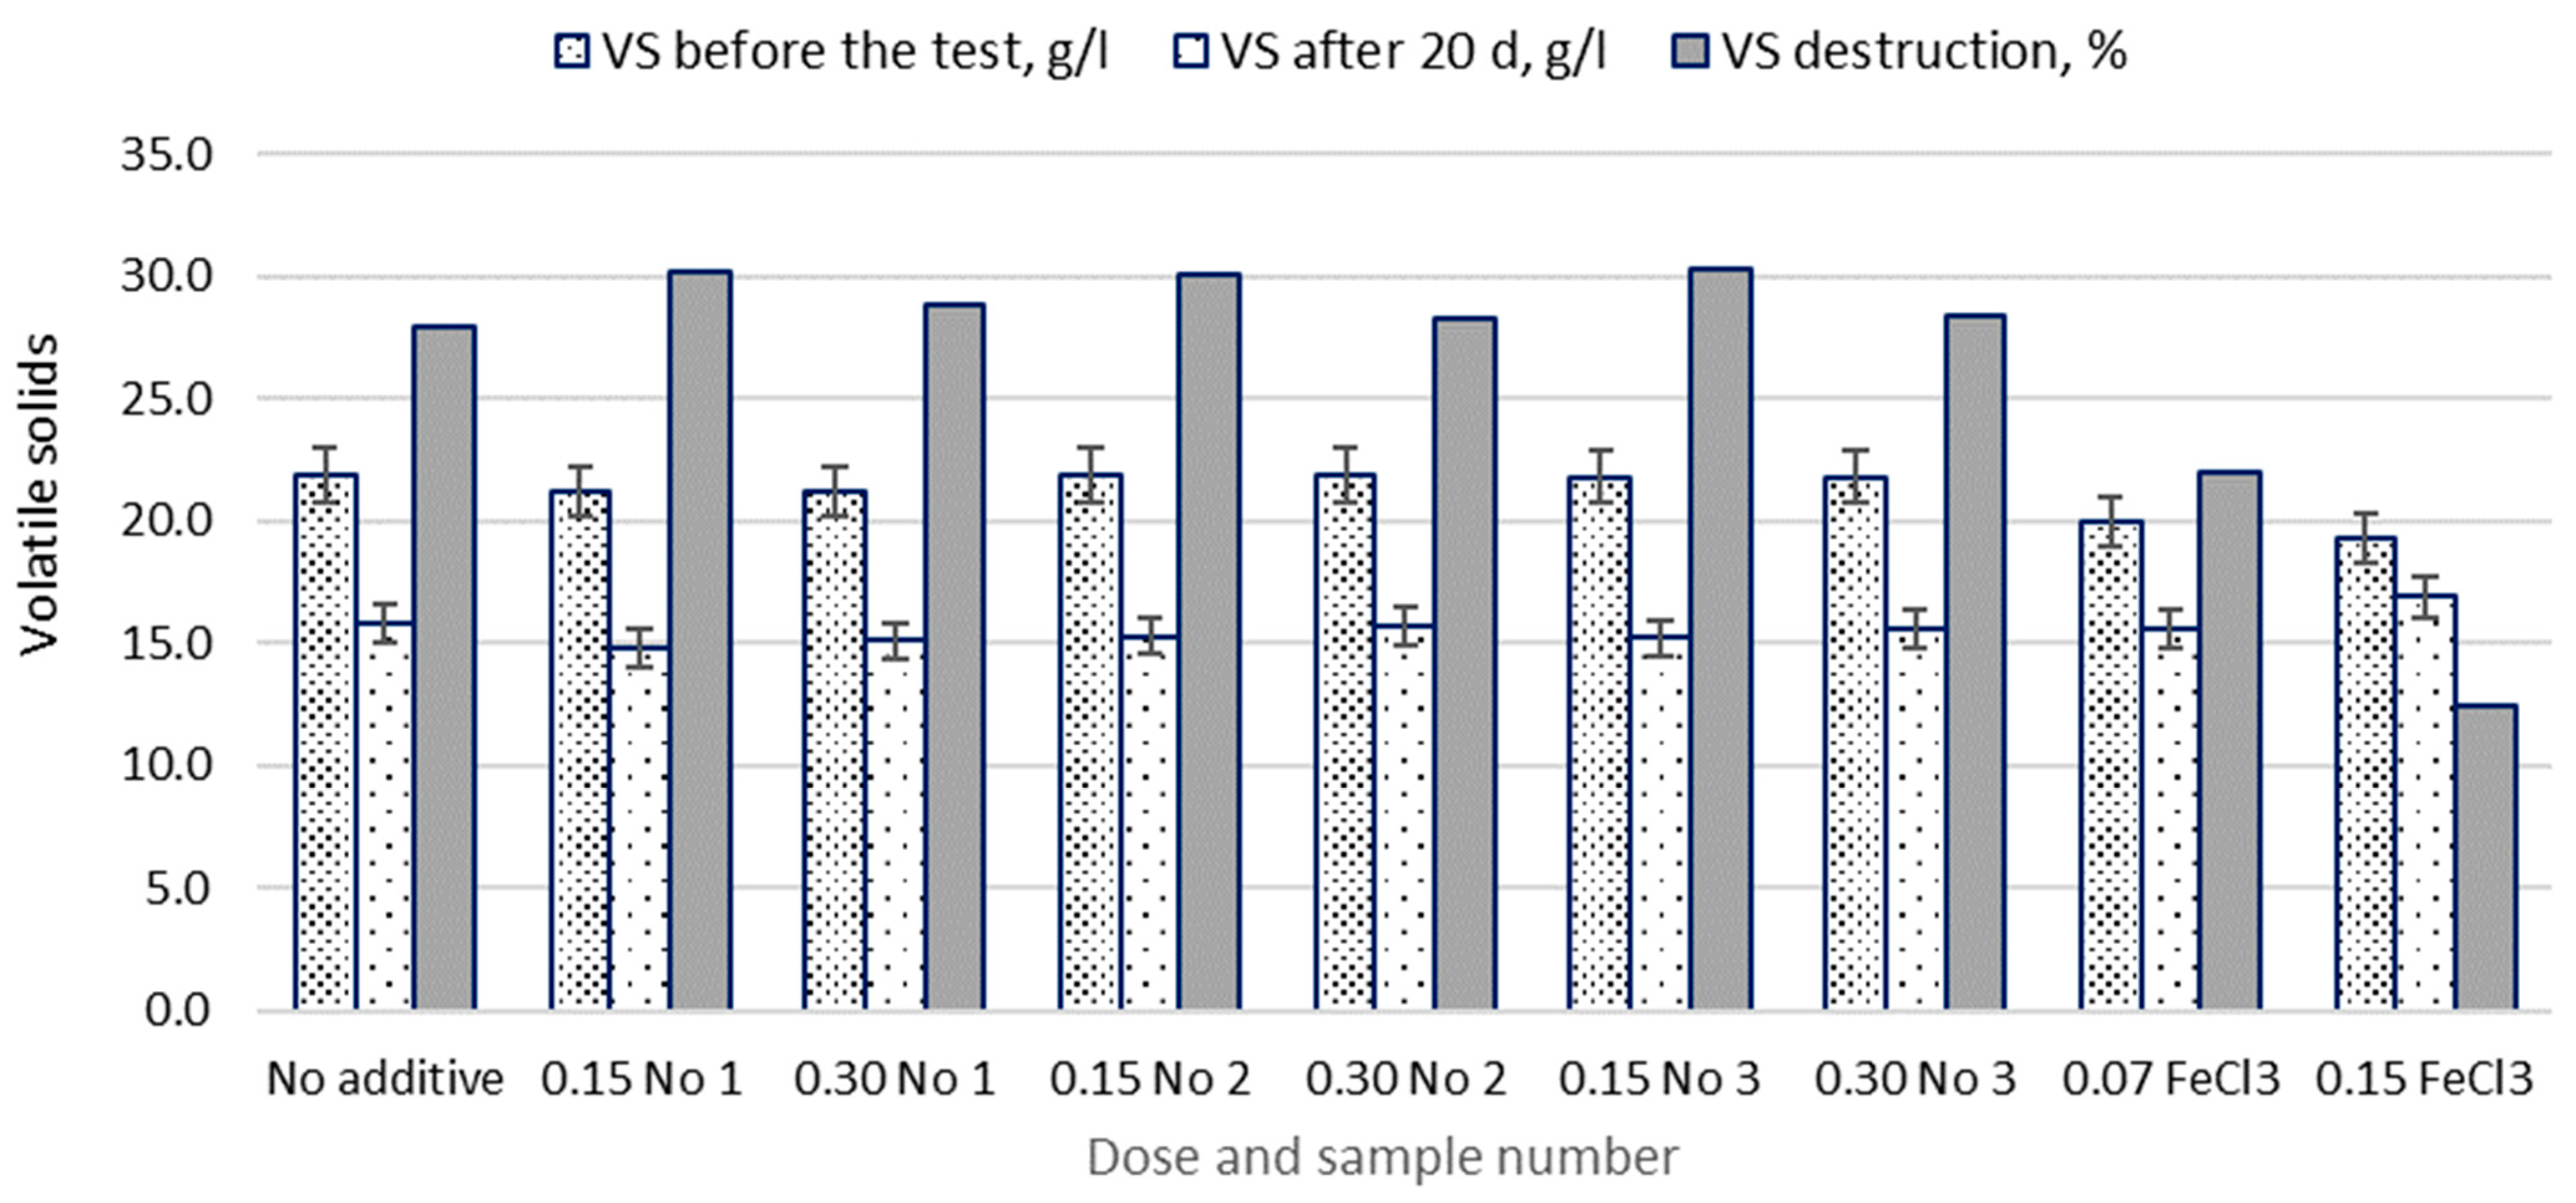
Concentrations of VSs before each stage of the test and after 20 days of digestion, as well as the efficiency of the VSs destruction, are presented in Figure 3.
Figure 3 shows that by applying additives No 1–No 3, the efficiency of the VSs destruction was analogous and it was on average 30% at the dose of 0.15 g/g DS/20 d, and it was on average 28% at the dose of 0.30 g/g DS/20 d. Compared to the control case without additives, the maximum increase in efficiency of the VSs destruction was only 2.2% on average when a dose of 0.15 g/g DS/20 d was applied. A similar result was obtained by the authors [13], who used a zero-valent iron additive to improve the anaerobic digestion process. Compared to the control test, the degradation of protein increased by 21.9%, and the volatile fatty acid production increased by 37.3% by adding zero-valent iron. Zero-valent iron made the sludge reduction ratio increase by 12.2% [13]. It can be stated that the additive dose of 0.15 g/g DS/20 d is more suitable in terms of the efficiency of VSs destruction, but the increase in the efficiency of VSs destruction itself is not significant.
The mechanism and effect of ferric chloride in sewage sludge digestion have not been thoroughly elucidated [27]. An adverse effect of chloride was observed when FeCl3 was used. Therefore, the efficiency of the VSs destruction was lower compared to the case when the sludge was digested without additives; it was on average 6% lower at the dose of 0.07 g/g DS/20 d, and it was on average 15.5% lower at the dose of 0.15 g/g DS/20 d.
3.2. Biogas Production and Quality
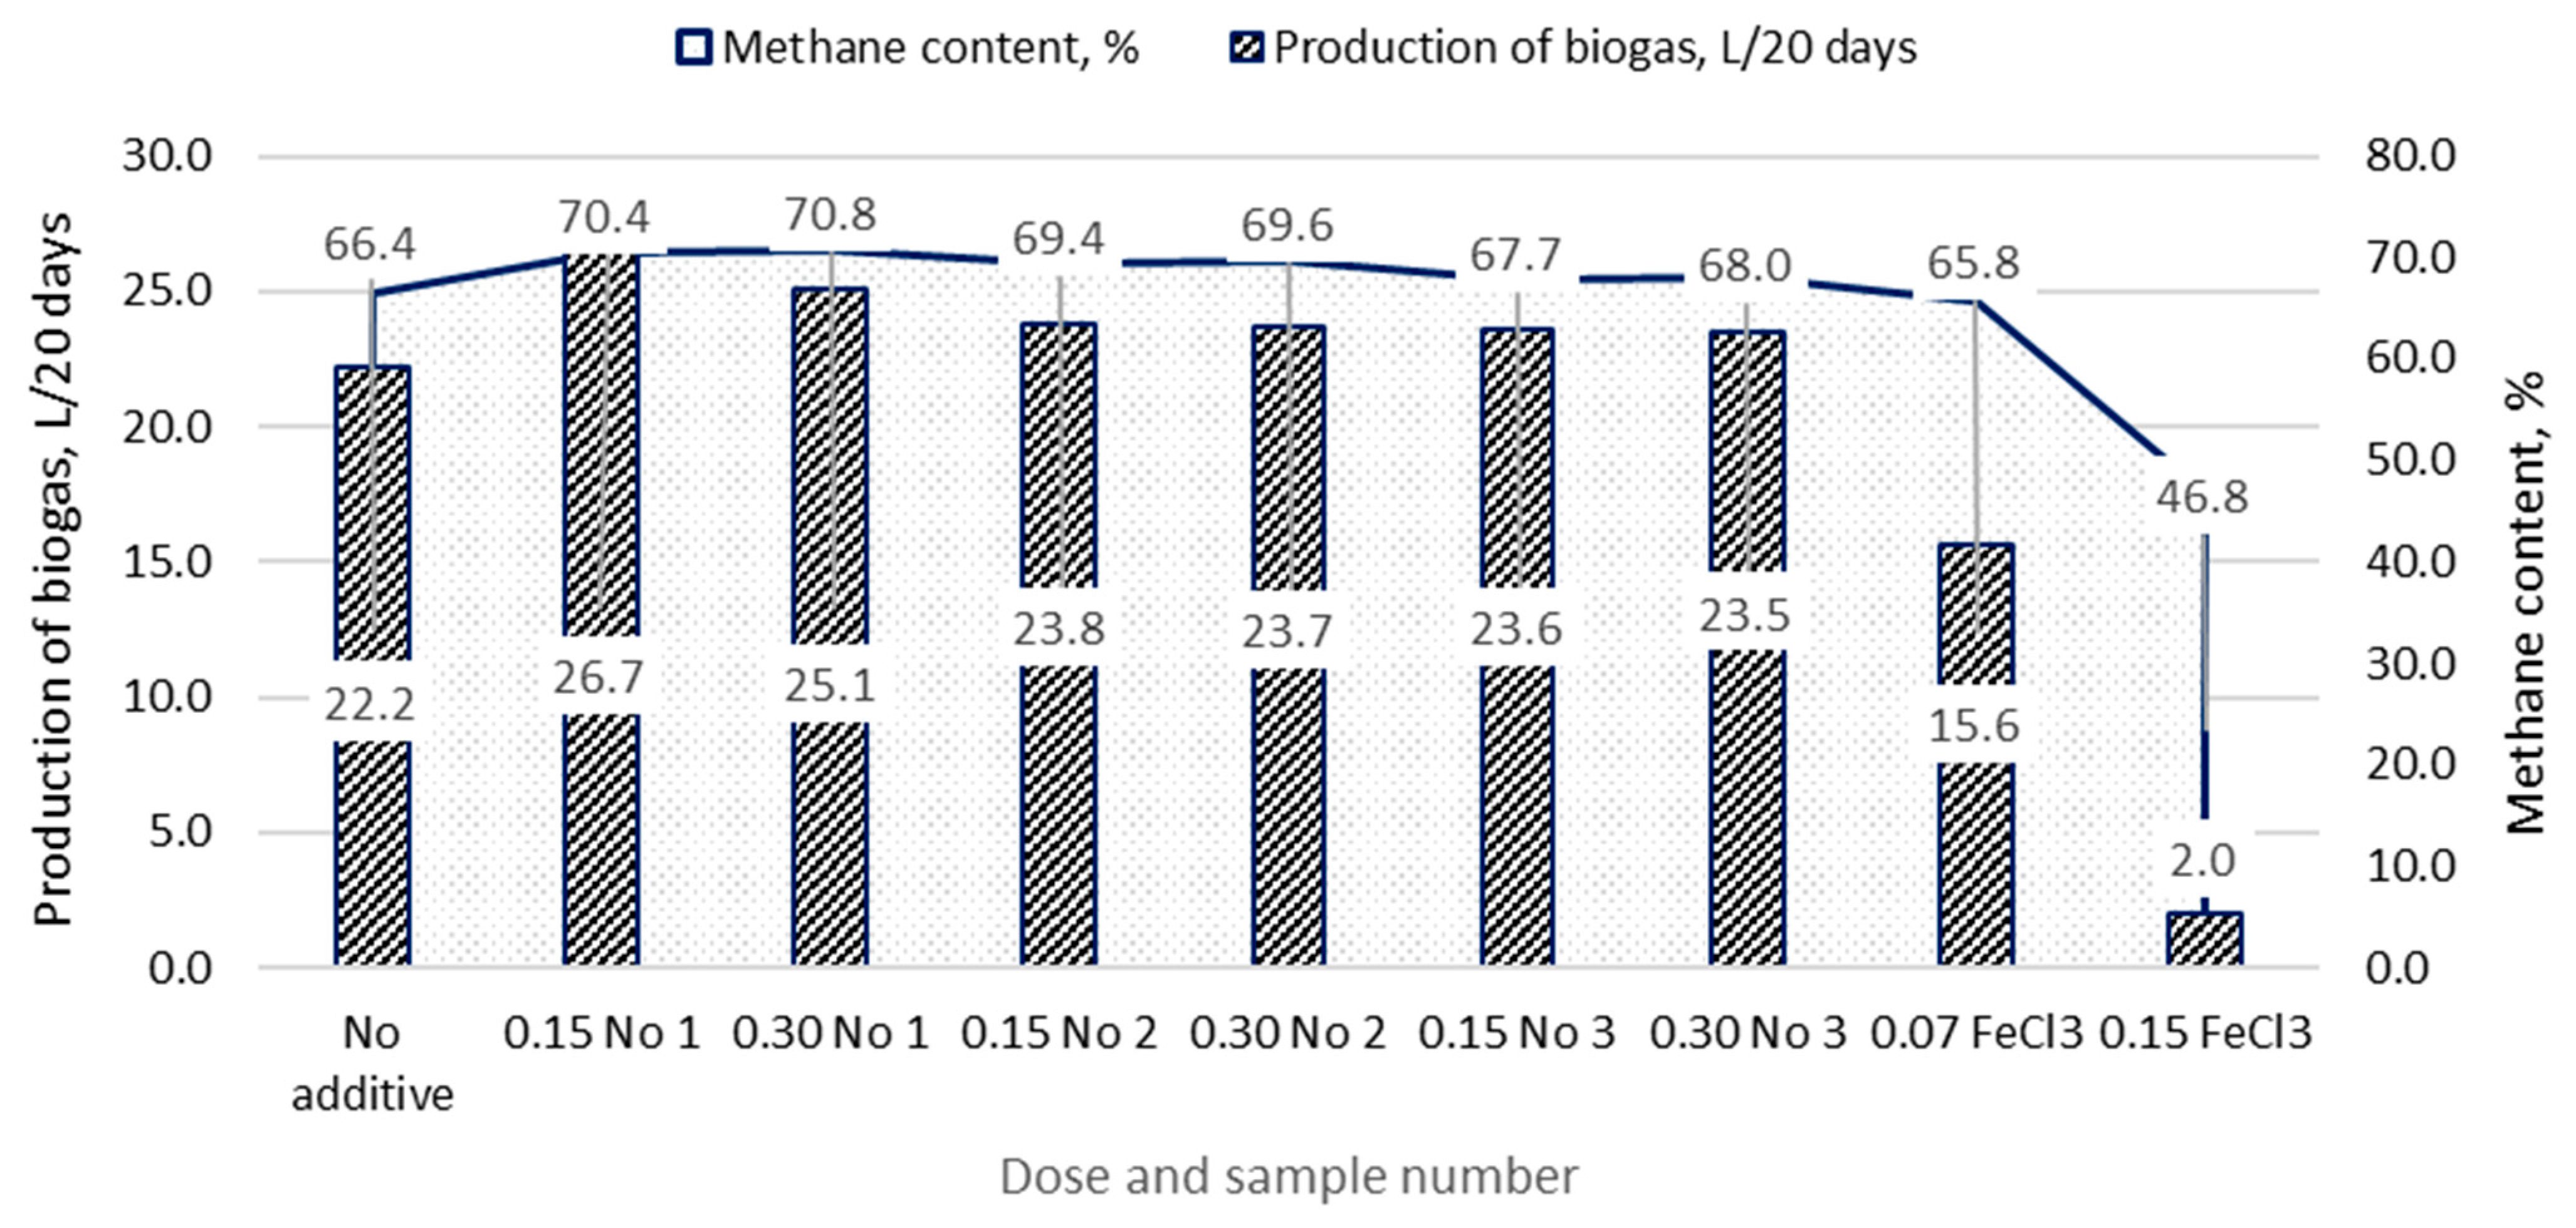
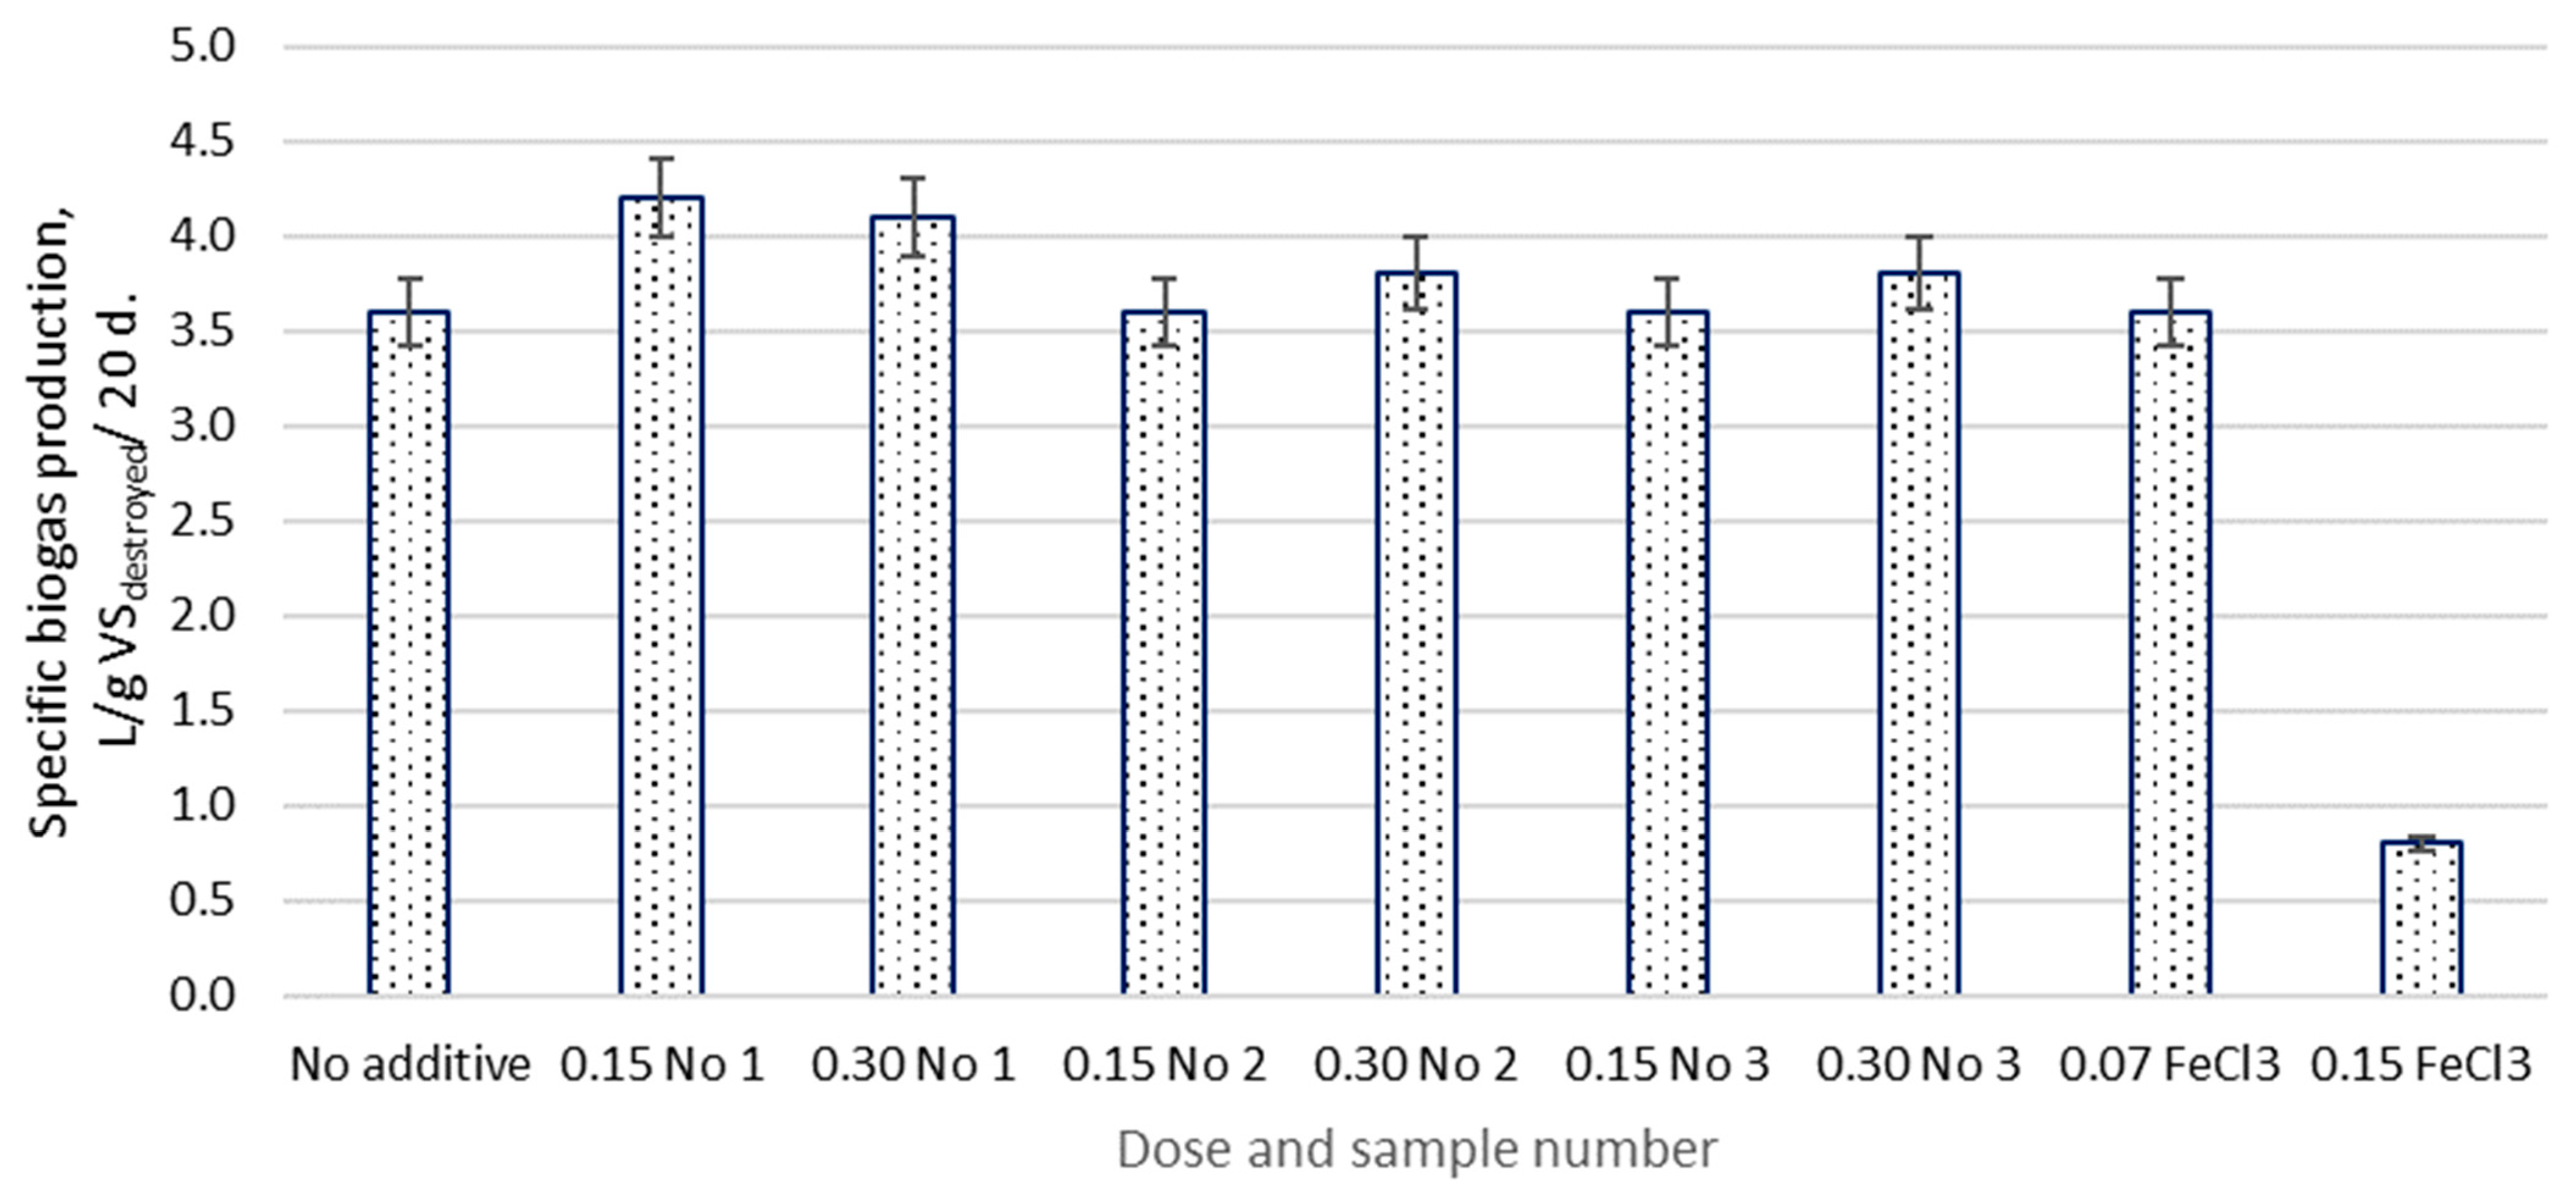
The amount of biogas produced during 20 days of digestion and the content of methane in biogas are presented in Figure 4, and the specific biogas production is presented in Figure 5.
Figure 4 shows that the highest amount of biogas was produced during the digestion process with additive No 1. The increase in the biogas production compared to the digestion process without additives reached 20% at the dose of 0.15 g/g DS/20 d, and 13% at the dose of 0.30 g/g DS/20 d. By applying additives No 2 and No 3, the bigger difference in the increase in the amount of biogas production was not observed at different doses of the additives. In the case of the application of additive No 2, the increase in biogas production compared to the digestion process without additives reached on average 7%, and in the case of the application of additive No 3 it reached on average 6%. It is assumed that the higher biogas production in the case of the application of additive No 1 was caused by a higher amount of divalent iron oxide, which intensifies the anaerobic digestion process. The authors [28] noticed that both iron content and valence were important for methane production. They also found that Fe(II) and Fe(III) promoted more degradation of proteins and amino acids than Fe0.
When FeCl3 was applied, a reduction in biogas production was observed compared to the digestion process without additives. The latter reduction reached 30% at the dose of 0.07 g/g DS/20 d. The obtained results correspond to the results obtained by other authors [25]. After testing the effect of Ni, Co, and Fe chlorides on the biogas production, the authors [30] concluded that the biogas and methane production were in the order of NiCl2 > CoCl2 > FeCl3. It is possible that the activity of microorganisms is inhibited by the higher amount of chlorine contained in FeCl3. The authors [27] found that FeCl3 inhibited methane production from acetoclastic and hydrogenotrophic methanogenesis by 29.2% and 28.4%
The main parameter that determines the quality of biogas is the content of methane in the biogas. Biogas is considered of good quality when the content of methane in the biogas exceeds 55%. Iron-based additives promote the production of acetate which is an essential input to produce methane through methanogenesis process. The concentration of methane in biogas can increase up to 74% if additives are added to the digested sludge [31]. The increase of methane content in biogas using iron additives depends on the type of anaerobically digested material. Methane yields increased by 12–27% during sewage sludge digestion [11]. With iron powder and iron oxide nanoparticle additives, methane yield from cattle manure digestion increased by 57% [18].
During the test, it was determined that the content of methane in biogas was on average 66% when no additives were added. In the cases of application of additives No 1–No 3, the content of methane in the biogas was analogous to applying different doses of the same additive (Figure 4). However, the increase in the content of methane in biogas compared to the digestion process without additives varied by additives with the latter increasing on average by 6.3% in the case of application of additive No 1, increasing on average by 4.7% in the case of application of additive No 2, and increasing on average by 2.2% in the case of application of additive No 3. A similar result was obtained in the study by the authors [7], where a 1.3–4.2 percent increase in methane production yield was obtained during composting of chicken waste with iron oxide nanoparticles.
The dose of 0.07 g/g DS/20 d of FeCl3 had a minimal negative effect on the change of content of methane in biogas, and it decreased on average by 0.9% compared to the digestion process without additives. Thus, the inhibitory effects of chloride appeared on the biogas production, but not on the quality of the biogas. The authors [14,26] observed that the SRT (solids retention time) and dose of ferric chloride are very important when applying ferric chloride in the anaerobic digestion. Good results were obtained when the solids retention time was 30 days [26], while in this research the SRT was shorter (20 days).
In the case of the application of additive No 1, the specific biogas production was increased on average by 15% compared to the digestion process without additives. In the cases of application of additives No 2 and No 3, the specific biogas production increased on average by 5.6% at the dose of 0.30 g/g DS/20 d, while at the dose of 0.15 g/g DS/20 d the specific biogas production value remained the same as it was digesting the sludge without additives, and it was equal to 3.6 L/g VSdestroyed/20 d (Figure 5).
3.3. Quality of Supernatant
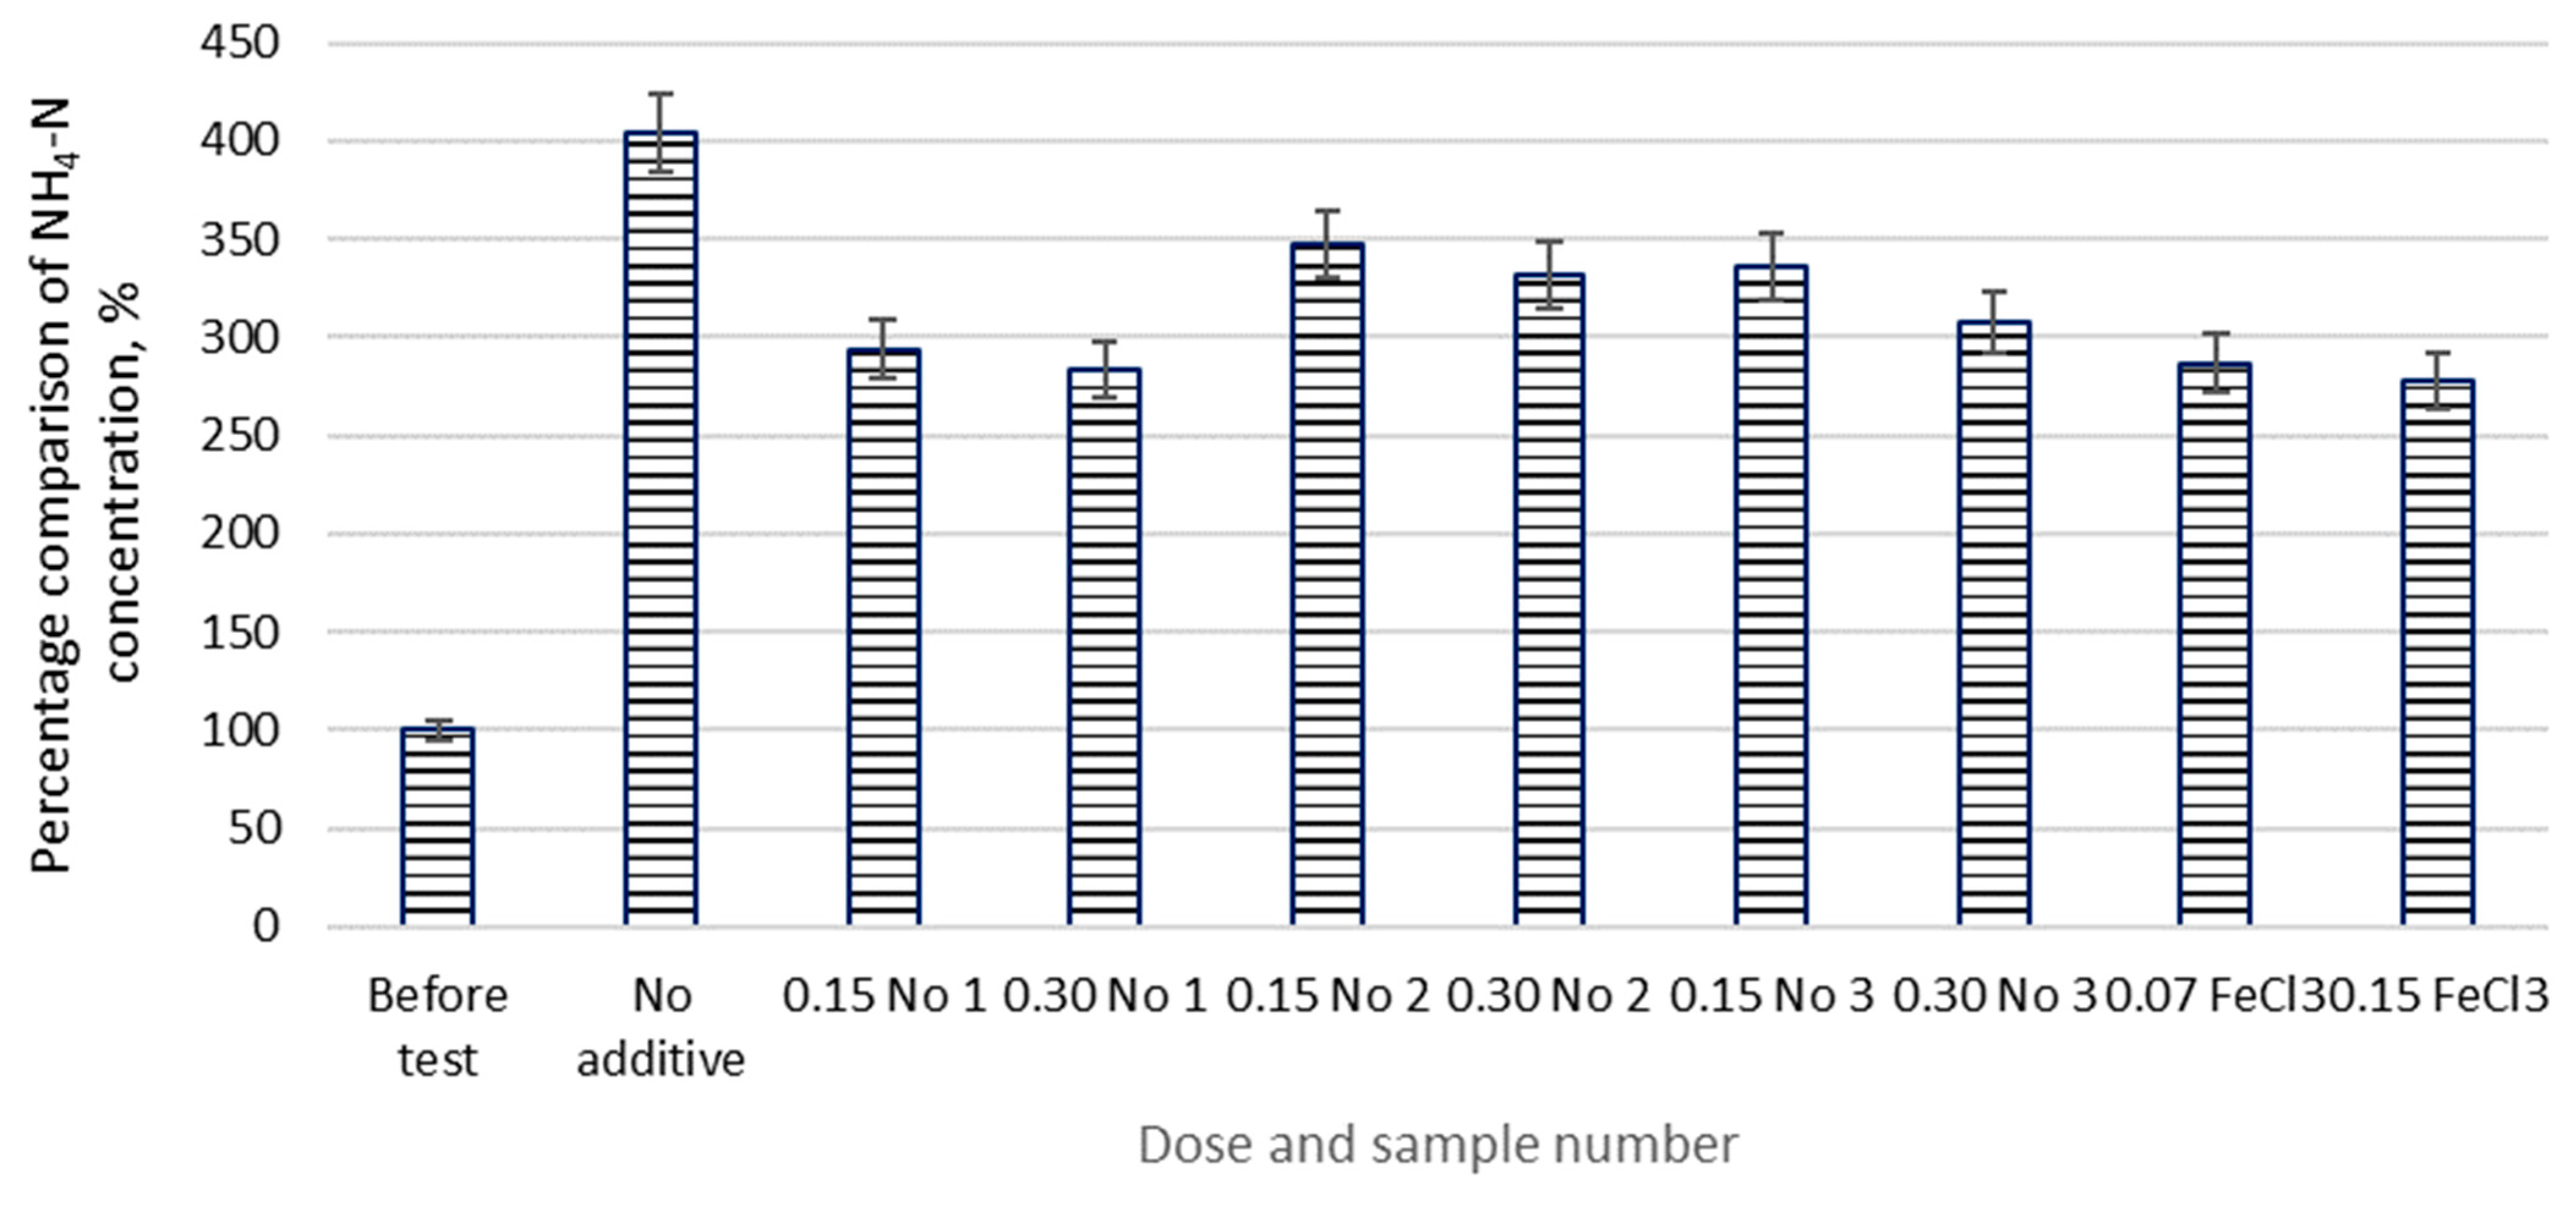
Destruction of organic matter during the anaerobic digestion process leads to the release of nitrogen and phosphorus compounds into the environment. So, the supernatant from the anaerobic digestion process contains high concentrations of ammonium nitrogen, which inhibits the growth of microorganisms [24,32]. High ammonia levels significantly affect the community structure of archaea, which are responsible for CH4 production [33]. The percentage comparison of the ammonium nitrogen concentration in the samples during separate stages of the test is presented in Figure 6.
Values of the ammonium nitrogen concentrations in the supernatant varied between 250 mg/L and 342 mg/L before the digestion process and they varied between 695 mg/L and 1010 mg/L after the digestion process. Figure 6 shows that the concentration of ammonium nitrogen in the supernatant increased four times after the digestion process without additives. The smallest increase in the concentration of ammonium nitrogen was indicated when additives No 1 and FeCl3 were applied. In these cases, the concentration of ammonium nitrogen increased on average by 2.9 times after the digestion process. In cases of application of additives No 2 and No 3, the concentration of ammonium nitrogen increased on average by 3.3 times after the digestion process. It can be stated that by applying the analysed iron oxides-based additives (dose of 0.15–0.30 g/g DS/20d), the concentration of ammonium nitrogen in the supernatant after the digestion process can be reduced by 18–28%, compared to the case when additives were not applied.
One of the results of the sludge digestion process is an increased concentration of phosphate phosphorus in the supernatant, which increases the load of phosphorus on the wastewater treatment process. The latter load can be reduced by adding iron compounds to the digestion process [34].
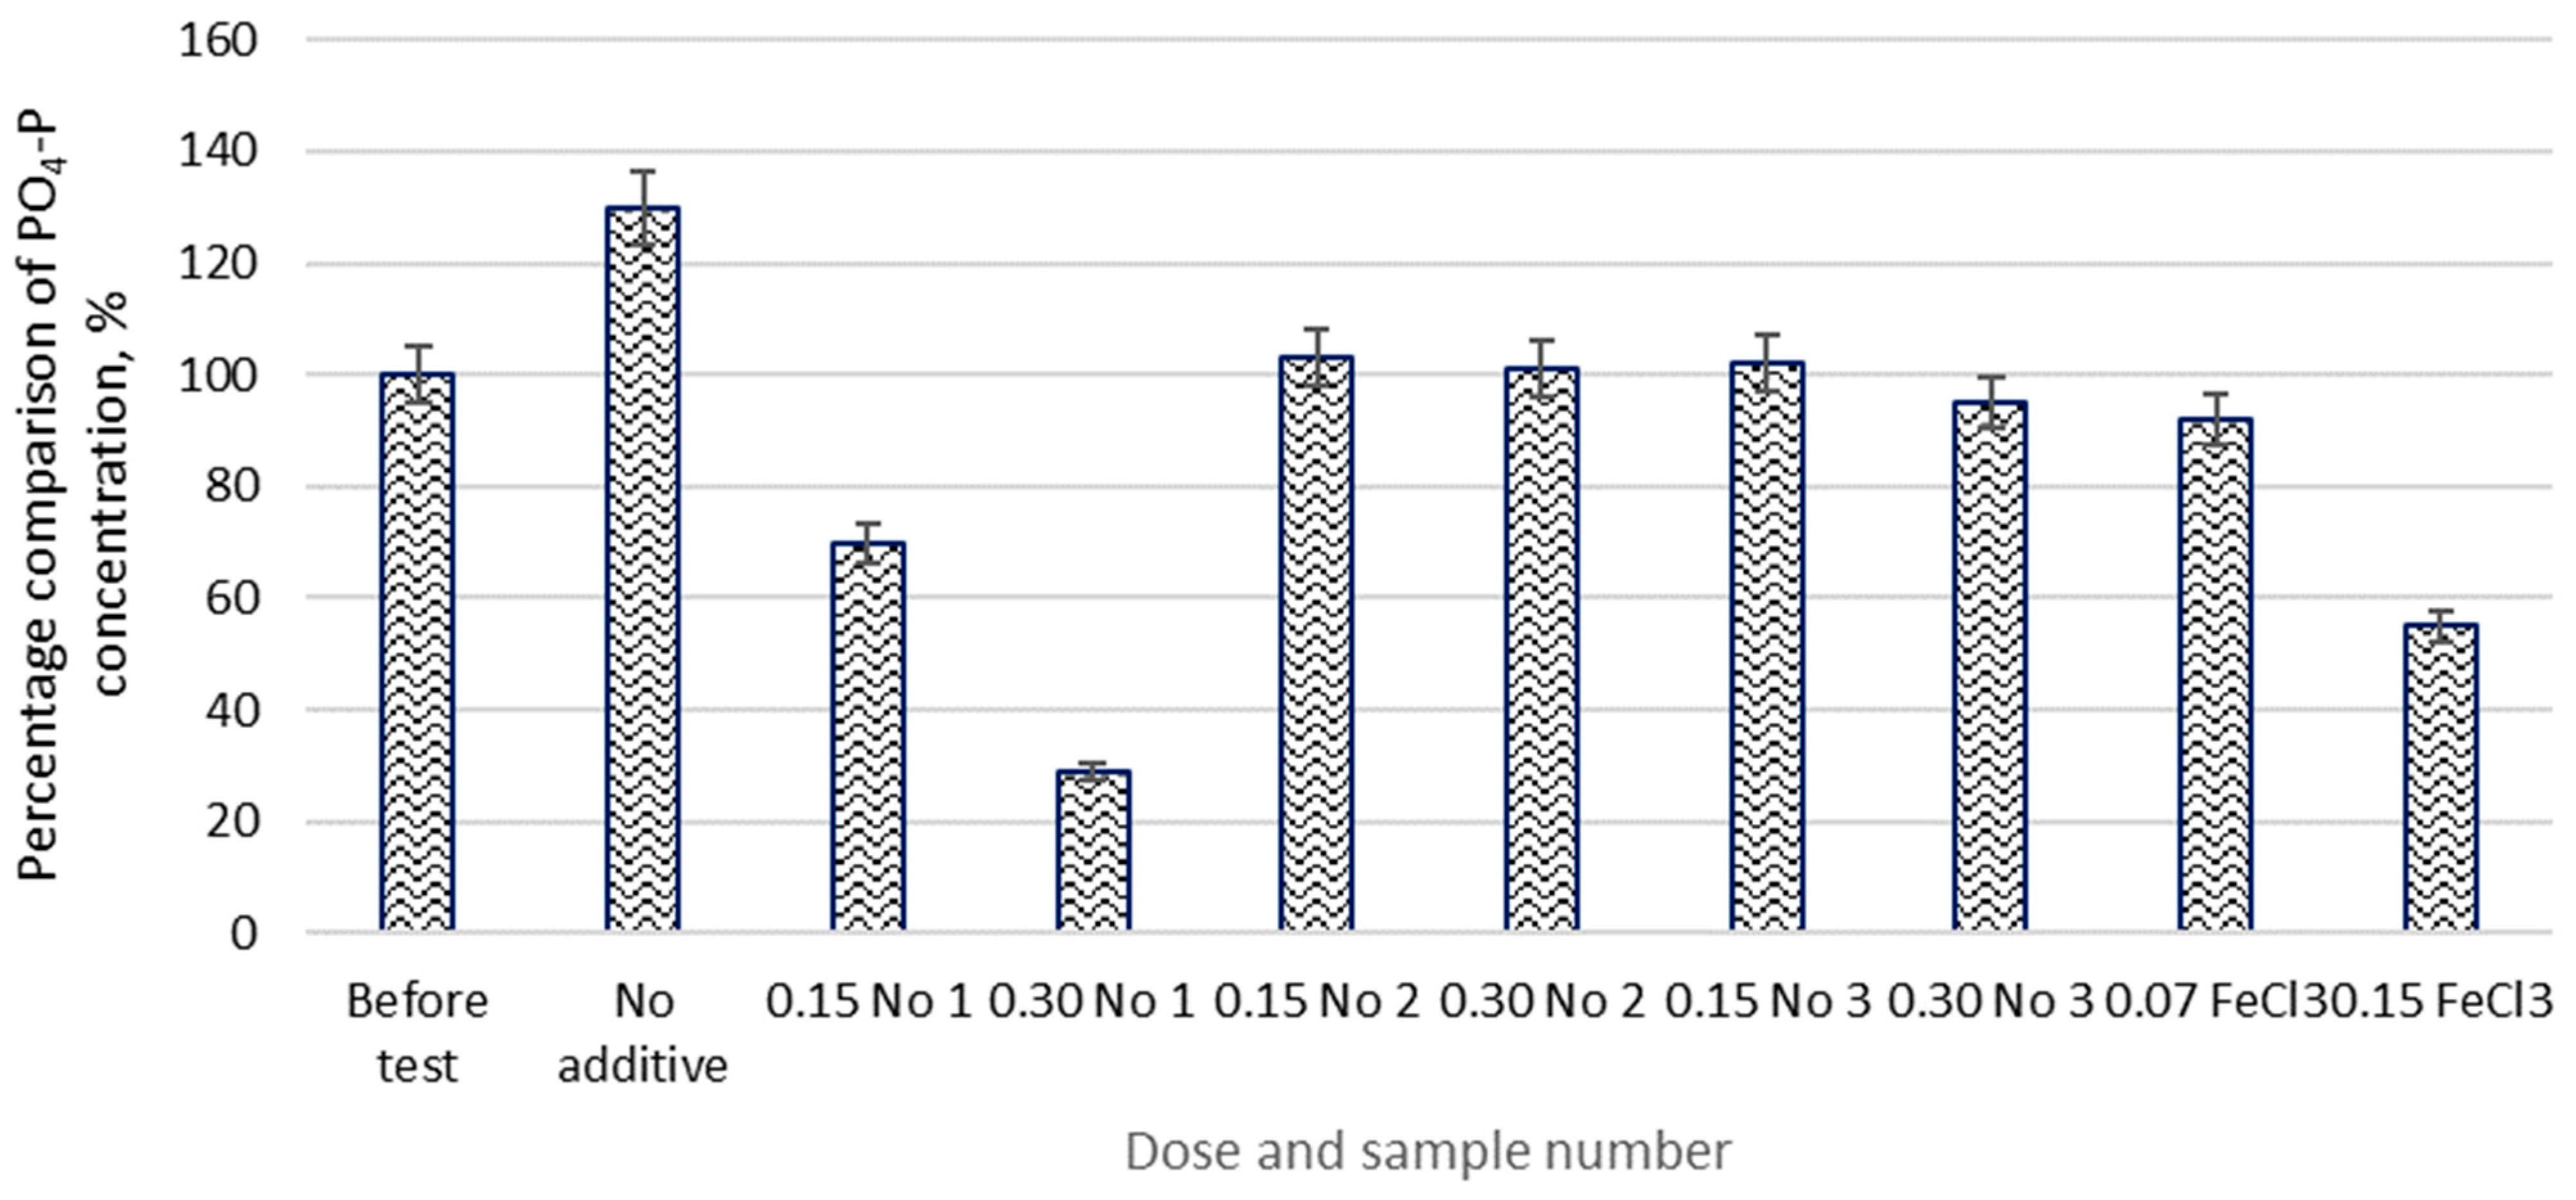
Values of the phosphate phosphorus concentration in the supernatant varied between 303 mg/L and 367 mg/L before the digestion process and they varied between 695 mg/L and 1010 mg/L after the digestion process. The percentage comparison of the phosphate phosphorus concentration in the samples during separate stages of the test is presented in Figure 7.
Figure 7 shows that the concentration of phosphate phosphorus in the supernatant increased by 1.3 times after the digestion process without additives. The highest decrease in the PO4−–P concentration was indicated when additive No 1 was applied. Compared to the concentration before the digestion process, the PO43−–P concentration decreased on average 2.4 times after the digestion process. In cases of the application of additives No 2, No 3 and FeCl3, the average PO43−–P concentration after digestion process was practically the same compared to the PO43−–P concentration before digestion process.
By applying additive No 1 (dose of 0.15–0.30 g/g DS/20 d or 7.5–15 g/kg DS), the concentration of the phosphate phosphorus in the supernatant after the digestion process can be reduced on average by 3.1 times compared to the case when no additives are applied, while applying additives No 2, No 3 and FeCl3 (dose of 0.15–0.30 g/g DS/20 d or 7.5–15 g/kg DS), the PO43−–P concentration can be lowered on average by 1.3 times. The addition of ferric chloride (220 mg/L) and H2O2 into anaerobically digested sludge enhanced the P-removal by more than 80% [35]. The dose of ferric chloride (220 mg/L) given by the authors [35] is inaccurate because it is unclear how often and what mass should be added per gram of sludge dry solids. In addition, simultaneous dosing of iron and hydrogen peroxide boosted P removal efficiency.
3.4. Full-Scale Test
The results obtained during the full-scale test are presented in Figure 8.
Before the full-scale test, 100 kg/d of FeCl3 solution was dosed. This corresponds to a dose of 10.5 kg/t DSs of the reagent. During the lab-scale test, the closest dose of additive would be 0.15 g/g DS/20 d or 7.5 kg/t DSs. Since the latter dose of FeCl3 solution had an inhibitory effect on the digestion process, the results of the full-scale test were compared with the lab-scale results in relation to the digestion process without reagent. A comparison of the results of the full-scale test with the results of the lab-scale test is presented in Table 4.
Figure 8 shows that there was a decrease in VSs destruction in the period from day 18 up to day 35. The reasons for the decrease have not been determined. After eliminating the mentioned period, the average increase in VSs destruction reaches 7.8% (Table 4). The overall increase in the VSs destruction was 0.7%. The result of lab-scale test showed a small increase in the VSs destruction too.
Figure 8 shows that the specific biogas production increased on the second day after the start of additive No 1 dosing. The increase in the specific biogas production reached 52% in the stage when the dose of additive was 120 kg/d. The overall increase in the specific biogas production was 18%, and it followed the result obtained in the lab-scale test (Table 4). It is recommended to keep the dose of the additive at 10 kg/t DSs for higher specific biogas production.
The content of methane in the biogas increased from the first day of dosing additive No 1 and remained stable during the test. The average increase in the content of methane in biogas followed the results obtained for the lab-scale test and was on average 5% (Table 4). Tests have shown that additive No 1 could be used instead of ferric chloride. Divalent and trivalent iron oxides are harmless and do not pollute the environment. According to the authors [20], compared with the use of fresh ferric chloride, the operational costs are reduced by up to 50% by using waterworks sludge which contains ferric oxide. The exact number depends on the substrate composition and the level at which the hydrogen sulphide concentration is reduced. The effects of various iron oxides-based additives on the anaerobic sludge digestion process have not been studied today, so experiments in this area must be continued. This article presents laboratory studies and determined additive doses (g/g DS/20) that can be applied in practice. The additive that showed the best results (additive No 1) was tested in a full-scale WWTP. According to the authors, the research results would provide knowledge for future optimization studies.
4. Conclusions
To increase the production of biogas during the digestion process of sewage sludge, three new additives containing more than 80% iron oxides were tested. It was determined that the effect of additives on the efficiency of the VSs destruction was analogous in the cases of application of additives No 1–No 3, and depended on the applied dose of the additive. The VSs destruction did not increase when the dose of 0.30 g/g DS/20 d was applied, and it increased on average by 2.2% when the dose of 0.15 g/g DS/20 d was applied. Thus, the additive dose of 0.15 g/g SM/20 d is more suitable in terms of the efficiency of the VSs destruction, but the increase in efficiency of the VSs destruction itself is not significant. By applying FeCl3, the inhibitory effect of chloride was observed.
The highest amount of biogas was produced during the digestion process with additive No 1. The increase in the biogas production reached 20% at the dose of 0.15 g/g DS/20 d compared to the digestion process without additives. It is assumed that the higher biogas production in the case of the application of additive No 1 was caused by a higher amount of divalent iron oxide, which intensified the anaerobic digestion process.
The highest increase in the content of methane in the biogas is determined in the case of the application of additive No 1, and it was on average, 6.3% higher than digesting without additives. The average content of methane in biogas was 71%. To achieve the specified results, the dose of 0.15 g/g DS/20 d is suitable.
The additives No 1 and FeCl3 (0.15 g/g DS/20 d dose) reduced the concentration of ammonium nitrogen in the supernatant after the digestion process by up to 28%. The additive No 1 (0.15–0.30 g/g DS/20 d dose) could reduce the concentration of the phosphate phosphorus in the supernatant after the digestion process on average by 3.1 times, compared to the case when additives were not applied.
It can be stated that additive No 1 is the most suitable in terms of increasing biogas production. The recommended dose of additive No 1 would be 0.15 g/g DS/20 d or 7.5 g/kg DSs. If the aim is orientated toward a more effective removal of phosphate phosphorus from the supernatant, then the recommended dose of additive No 1 would be 0.30 g/g DS/20 d or 15 g/kg DSs.
The dose was specified in the full-scale test, and the recommended dose of additive No 1 is 10 g/kg of DSs to improve the specific biogas production, which could be increased up to 52%.
Author Contributions
R.D.: resources, methodology, data curation, validation, writing—original draft, writing—review and editing. A.M.: conceptualization, methodology, investigation, writing—original draft, visualization, writing—review and editing. All authors have read and agreed to the published version of the manuscript.
Funding
This research received no external funding.
Data Availability Statement
Not applicable.
Conflicts of Interest
The authors declare that they have no known competing financial interests or personal relationships that could have appeared to influence the work reported in this paper.
References
- Ibrahim, S.H.; Abdulaziz, M. The Effect of Different Zero-Valent Iron Sources on Biogas Production from Waste Sludge Anaerobic Digestion. J. Biotechnol. Res. 2016, 2, 59–67. [Google Scholar]
- Filer, J.; Ding, H.H.; Chang, S. Biochemical Methane Potential (BMP) Assay Method for Anaerobic Digestion Research. Water 2019, 11, 921. [Google Scholar] [CrossRef] [Green Version]
- Vongvichiankul, C.; Deebao, J.; Khongnakorn, W. Relationship between pH, Oxidation Reduction Potential (ORP) and Biogas Production in Mesophilic Screw Anaerobic Digester. Energy Procedia 2017, 138, 877–882. [Google Scholar] [CrossRef]
- Wang, J.; Zhang, Z.; Ye, X.; Pan, X.; Lv, N.; Fang, H.; Chen, S. Enhanced solubilization and biochemical methane potential of waste activated sludge by combined free nitrous acid and potassium ferrate pretreatment. Bioresour. Technol. 2020, 297, 122376. [Google Scholar] [CrossRef]
- Dauknys, R.; Mažeikienė, A.; Paliulis, D. Effect of ultrasound and high voltage disintegration on sludge digestion process. J. Environ. Manag. 2020, 270, 110833. [Google Scholar] [CrossRef]
- Zagorskis, A.; Dauknys, R.; Pranskevičius, M.; Khliestova, O. Research on Biogas Yield from Macroalgae with Inoculants at Different Organic Loading Rates in a Three-Stage Bioreactor. Int. J. Environ. Res. Public Health 2023, 20, 969. [Google Scholar] [CrossRef] [PubMed]
- Reddy, K.; Nasr, M.; Kumari, S.; Kumar, S.; Gupta, S.K.; Enitan, A.M.; Bux, F. Biohydrogen production from sugarcane bagasse hydrolysate: Effects of pH, S/X, Fe2+, and magnetite nanoparticles. Environ. Sci. Pollut. Res. 2017, 24, 8790–8804. [Google Scholar] [CrossRef]
- Paulo, L.M.; Hidayat, M.R.; Moretti, G.; Stams, A.J.M.; Sousa, D.Z. Effect of nickel, cobalt, and iron on methanogenesis from methanol and cometabolic conversion of 1,2-dichloroethene by Methanosarcina barkeri. Biotechnol. Appl. Biochem. 2020, 67, 744–750. [Google Scholar] [CrossRef] [Green Version]
- Al Bkoor Alrawashdeh, K.; Al-Zboon, K.K.; Al Rabadi, S.; Gul, E.; AL-Samrraie, L.A.; Ali, R.; Al-Tabbal, J.A. Impact of Iron oxide nanoparticles on sustainable production of biogas through anaerobic co-digestion of chicken waste and wastewater. Front. Chem. Eng. 2022, 4, 70. [Google Scholar] [CrossRef]
- Singh, D.; Malik, K.; Sindhu, M.; Kumari, N.; Rani, V.; Mehta, S.; Malik, K.; Ranga, P.; Sharma, K.; Dhull, N.; et al. Biostimulation of Anaerobic Digestion Using Iron Oxide Nanoparticles (IONPs) for Increasing Biogas Production from Cattle Manure. Nanomaterials 2022, 12, 497. [Google Scholar] [CrossRef]
- Muddasar, M. Biogas Production from Organic wastes and Iron as an Additive—A Short Review. Preprints 2022, 2022010026. [Google Scholar] [CrossRef]
- Ma, W.; Xin, H.; Zhong, D.; Qian, F.; Han, H.; Yuan, Y. Effects of different states of Fe on anaerobic digestion: A review. J. Harbin Inst. Technol. 2015, 22, 69–75. [Google Scholar] [CrossRef]
- Feng, Y.; Zhang, Y.; Quan, X.; Chen, S. Enhanced anaerobic digestion of waste activated sludge digestion by the addition of zero valent iron. Water Res. 2014, 52, 242–250. [Google Scholar] [CrossRef] [PubMed]
- Park, C.M.; Novak, J.T. The effect of direct addition of iron(III) on anaerobic digestion efficiency and odor causing compounds. Water Sci. Technol. 2013, 68, 2391–2396. [Google Scholar] [CrossRef] [PubMed]
- Ignace, A.C.; Fidèle, S.; Dimon, B.; Franck, Y.; Lyde, T.A.S.; Daouda, M.; Eni, A.C. Biogas Recovery from Sewage Sludge during Anaerobic Digestion Process: Effect of Iron powder on Methane yield. Int. Res. J. Environ. Sci. 2016, 5, 7–12. [Google Scholar]
- Agani, G.C.; Suanon, F.; Dimon, B.; Ifon, E.B.; Yovo, F.; Wotto, V.D.; Kazeem Abass, O.; Kumwimba, M.N. Enhancement of Fecal Sludge Conversion into Biogas Using Iron Powder during Anaerobic Digestion Process. Earth Energy Environ. 2017, 5, 179. [Google Scholar] [CrossRef] [Green Version]
- Zhuan, R.; Yang, G.; Zhang, G.M.; Wang, W. Effects of Ferric Salts on Sludge Anaerobic Digestion and Desulphurization. Mater. Sci. Forum 2018, 913, 887–892. [Google Scholar] [CrossRef]
- Farghali, M.; Andriamanohiarisoamanana, F.J.; Ahmed, M.M.; Kotb, S.; Yamamoto, Y.; Iwasaki, M.; Yamashiro, T.; Umetsu, K. Prospects for biogas production and H2S control from the anaerobic digestion of cattle manure: The influence of microscale waste iron powder and iron oxide nanoparticles. Waste Manag. 2020, 101, 141–149. [Google Scholar] [CrossRef]
- Cheremisina, E.; Cheremisina, O.; Ponomareva, M.; Bolotov, V.; Fedorov, A. Kinetic Features of the Hydrogen Sulfide Sorption on the Ferro-Manganese Material. Metals 2021, 11, 90. [Google Scholar] [CrossRef]
- Persson, T.; Persson, K.M.; Åström, J. Ferric Oxide-Containing Waterworks Sludge Reduces Emissions of Hydrogen Sulfide in Biogas Plants and the Needs for Virgin Chemicals. Sustainability 2021, 13, 7416. [Google Scholar] [CrossRef]
- Rana, M.S.; Bhushan, S.; Prajapati, S.K. New insights on improved growth and biogas production potential of Chlorella pyrenoidosa through intermittent iron oxide nanoparticle supplementation. Sci. Rep. 2020, 10, 14119. [Google Scholar] [CrossRef] [PubMed]
- Wang, Y.; Wang, D.; Fang, H. Comparison of enhancement of anaerobic digestion of waste activated sludge through adding nano-zero valent iron and zero valent iron. RSC Adv. 2018, 8, 27181–27190. [Google Scholar] [CrossRef] [PubMed] [Green Version]
- Guo, R.; Liu, X.; Hu, Y.; Li, J.; Chen, J.; Pang, L.; Yang, P. Stronger Stimulation of Waste Activated Sludge Anaerobic Fermentation by a Particular Amount of Micron-Sized Zero Valent Iron. Appl. Biochem. Biotechnol. 2020, 192, 313–324. [Google Scholar] [CrossRef] [PubMed]
- Yang, Z.; Wang, W.; He, Y.; Zhang, R.; Liu, G. Effect of ammonia on methane production, methanogenesis pathway, microbial community and reactor performance under mesophilic and thermophilic conditions. Renew. Energy 2018, 125, 915–925. [Google Scholar] [CrossRef]
- Ofverstrom, S.; Dauknys, R.; Sapkaitė, I. The effect of iron salt on anaerobic digestion and phosphate release to sludge liquor. Moksl.–Liet. Ateitis/Sci.–Future Lith. 2011, 3, 123–126. [Google Scholar] [CrossRef]
- Qin, Y.; Chen, L.; Wang, T.; Ren, J.; Cao, Y.; Zhou, S. Impacts of ferric chloride, ferrous chloride and solid retention time on the methane-producing and physicochemical characterization in high-solids sludge anaerobic digestion. Renew. Energy 2019, 139, 1290–1298. [Google Scholar] [CrossRef]
- Zhan, W.; Tian, Y.; Zhang, J.; Zuo, W.; Li, L.; Jin, Y.; Lei, Y.; Xie, A.; Zhang, X. Mechanistic insights into the roles of ferric chloride on methane production in anaerobic digestion of waste activated sludge. J. Clean. Prod. 2021, 296, 126527. [Google Scholar] [CrossRef]
- Yu, Z.; Xiao, K.; Zhu, Y.; Sun, M.; Liang, S.; Hu, J.; Hou, H.; Liu, B.; Yang, J. Comparison of different valent iron on anaerobic sludge digestion: Focusing on oxidation reduction potential, dissolved organic nitrogen and microbial community. Front. Environ. Sci. Eng. 2022, 16, 80. [Google Scholar] [CrossRef]
- Alepu, O.E.; Li, Z.; Ikhumhen, H.O.; Kalakodio, L.; Wang, K.; Segun, G. Effect of Hydraulic Retention Time on Anaerobic Digestion of Xiao Jiahe Municipal Sludge. Int. J. Waste Resour. 2016, 6, 1000231. [Google Scholar] [CrossRef]
- Abdelsalam, E.; Samer, M.; Abdel-Hadi, M.A.; Hassan, H.E.; Badr, Y. Effect of CoCl2, NiCl2 and FeCl3 additives on biogas and methane production. Misr J. Agric. Eng. 2015, 32, 843–862. [Google Scholar] [CrossRef]
- Petrovič, A.; Zirngast, K.; Predikaka, T.C.; Simonič, M.; Čuček, L. The advantages of co-digestion of vegetable oil industry by-products and sewage sludge: Biogas production potential, kinetic analysis and digestate valorisation. J. Environ. Manag. 2022, 318, 115566. [Google Scholar] [CrossRef] [PubMed]
- Markou, G.; Vandamme, D.; Muylaert, K. Ammonia inhibition on Arthrospira platensis in relation to the initial biomass density and pH. Bioresour. Technol. 2014, 166, 259–265. [Google Scholar] [CrossRef] [PubMed] [Green Version]
- Kalamaras, S.D.; Vitoulis, G.; Christou, M.L.; Sfetsas, T.; Tziakas, S.; Fragos, V.; Samaras, P.; Kotsopoulos, T.A. The effect of ammonia toxicity on methane production of a full-scale biogas plant—An estimation method. Energies 2021, 14, 5031. [Google Scholar] [CrossRef]
- Cheng, J.; Zhu, C.; Zhu, J.; Jing, X.; Kong, F.; Zhang, C. Effects of waste rusted iron shavings on enhancing anaerobic digestion of food wastes and municipal sludge. J. Clean. Prod. 2020, 242, 118195. [Google Scholar] [CrossRef]
- Ghodsi, V.; Sarathy, S.R.; Walton, J.R.; Watson, I.; Elbeshbishy, E.; Santoro, D. Enhancing sludge dewaterability and phosphate removal through a novel chemical dosing strategy using ferric chloride and hydrogen peroxide. Water Environ. Res. 2021, 93, 232–240. [Google Scholar] [CrossRef]
Figure 1.
Flow sheet of sludge digestion in Silute WWTP: 1—Tank of sludge mixture, 2—Heat exchanger, 3—Digester, 4—Heat exchanger, 5—Tank of digested sludge, 6—Sampling point of sludge mixture, 7—Sampling point of inoculum.
Figure 1.
Flow sheet of sludge digestion in Silute WWTP: 1—Tank of sludge mixture, 2—Heat exchanger, 3—Digester, 4—Heat exchanger, 5—Tank of digested sludge, 6—Sampling point of sludge mixture, 7—Sampling point of inoculum.

Figure 2.
Model “W8 Armfield Ltd.”.

Figure 3.
Average concentration of VSs and the efficiency of VSs destruction. Doses of the additives are indicated in g/g SM/20 d.
Figure 3.
Average concentration of VSs and the efficiency of VSs destruction. Doses of the additives are indicated in g/g SM/20 d.

Figure 4.
Average amount of biogas produced during 20 days of digestion and average content of methane in biogas. Doses of the additives are indicated in g/g SM/20 d.
Figure 4.
Average amount of biogas produced during 20 days of digestion and average content of methane in biogas. Doses of the additives are indicated in g/g SM/20 d.

Figure 5.
Specific biogas production. Doses of the additives are indicated in g/g SM/20 d.

Figure 6.
Percentage comparison of ammonium nitrogen concentration in samples. Doses of the additives are indicated in g/g SM/20 d.
Figure 6.
Percentage comparison of ammonium nitrogen concentration in samples. Doses of the additives are indicated in g/g SM/20 d.

Figure 7.
Percentage comparison of phosphate phosphorus concentration in samples. Doses of the additives are indicated in g/g SM/20 d.
Figure 7.
Percentage comparison of phosphate phosphorus concentration in samples. Doses of the additives are indicated in g/g SM/20 d.

Figure 8.
Results of full-scale test.


Table 1.
Chemical composition and particle size of the additives.
| Parameter | Composition of the Additive, % | ||
|---|---|---|---|
| No 1 | No 2 | No 3 | |
| Fe (in compounds below) | >60 | ≥62.5 | ≥71 |
| FeO | >41.5 | - | - |
| Fe2O3 (hematite) | >41.5 | - | - |
| Fe3O4 (magnetite) | - | ≥86 | ≥98 |
| Particle size | 200 µm ± 100 µm | 200 µm ± 100 µm | 100 µm ± 50 µm |
Table 2.
The operation details and the design of tests.
| Phase of Tests | Reactor No 1 | Reactor No 2 | ||
|---|---|---|---|---|
| No of Additive | Dose, g/g DS/20 d | No of Additive | Dose, g/g DS/20 d | |
| 1 | No additive | - | 1 | 0.30 |
| 2 | 1 | 0.15 | FeCl3 | 0.56 |
| 3 | 2 | 0.30 | 2 | 0.15 |
| 4 | 3 | 0.30 | 3 | 0.15 |
| 5 | FeCl3 | 0.15 | FeCl3 | 0.07 |
Table 3.
Quality of sludge mixture with inoculum before the digestion process.
| Parameter | n | Average | STDEV |
|---|---|---|---|
| DS (g/L) | 9 | 30.40 | 0.16 |
| VS (g/L) | 9 | 21.22 | 0.95 |
Table 4.
Comparison of the results between lab-scale test and full-scale test when additive No 1 is applied.
Table 4.
Comparison of the results between lab-scale test and full-scale test when additive No 1 is applied.
| Parameter | Lab-Scale Test | Full-Scale Test | Note |
|---|---|---|---|
| Average dose of additive, kg/t DSs | 7.5 | 7.4 | - |
| Average increase in VSs destruction,% | 2.2 | 0.7 | 7.8 without decreased VSs destruction in the period from day 18 to day 35 (Figure 8) |
| Average increase in specific biogas production,% | 15 | 18 | 52 when dose was 120 kg/d |
| Average increase in the content of methane in biogas | 6.3 | 5.0 | - |
Disclaimer/Publisher’s Note: The statements, opinions and data contained in all publications are solely those of the individual author(s) and contributor(s) and not of MDPI and/or the editor(s). MDPI and/or the editor(s) disclaim responsibility for any injury to people or property resulting from any ideas, methods, instructions or products referred to in the content. |
© 2023 by the authors. Licensee MDPI, Basel, Switzerland. This article is an open access article distributed under the terms and conditions of the Creative Commons Attribution (CC BY) license (https://creativecommons.org/licenses/by/4.0/).
Share and Cite
MDPI and ACS Style
Dauknys, R.; Mažeikienė, A. Process Improvement of Biogas Production from Sewage Sludge Applying Iron Oxides-Based Additives. Energies 2023, 16, 3285. https://doi.org/10.3390/en16073285
AMA Style
Dauknys R, Mažeikienė A. Process Improvement of Biogas Production from Sewage Sludge Applying Iron Oxides-Based Additives. Energies. 2023; 16(7):3285. https://doi.org/10.3390/en16073285
Chicago/Turabian StyleDauknys, Regimantas, and Aušra Mažeikienė. 2023. "Process Improvement of Biogas Production from Sewage Sludge Applying Iron Oxides-Based Additives" Energies 16, no. 7: 3285. https://doi.org/10.3390/en16073285
Note that from the first issue of 2016, this journal uses article numbers instead of page numbers. See further details here.