

A Review of CCUS in the Context of Foams, Regulatory Frameworks and Monitoring

Abstract
:
1. Introduction
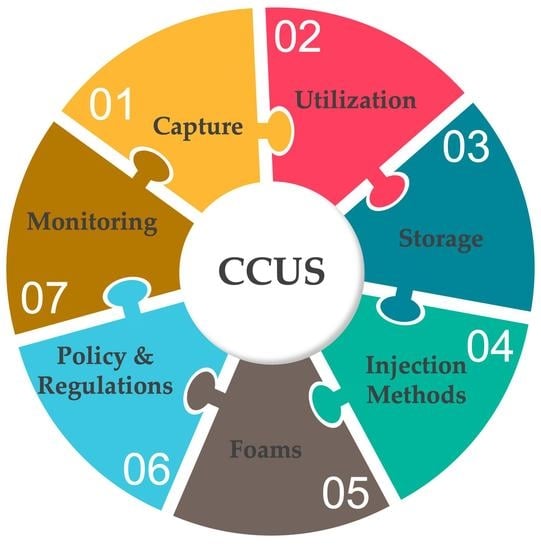
2. CCUS
2.1. Carbon Capture
2.1.1. Direct Air Capture
2.1.2. Precombustion Capture
2.1.3. Post-Combustion Capture
2.1.4. Oxyfuel Combustion
2.2. Utilization
2.2.1. CO2 to Products
CO2 to Methanol
CO2 to Formic Acid and Urea
2.2.2. Biological Sequestration
2.2.3. Geologic Utilization
CO2-EOR
Residual Oil Zones
Enhanced Gas Recovery in Coalbed Methane
2.3. Storage
3. CO2 Injection Methods
3.1. Continuous CO2 Flooding
3.2. Continuous CO2 Chased with Water
3.3. Conventional WAG and Alternating CO2 and Chase Water
3.4. Tapered Water-Alternating Gas (TWAG)
3.5. Alternating CO2 and Water Chased with Water (WAG/Gas)
4. Foams
4.1. Foam Characterization
4.2. Foam Stability
4.3. Nanoparticle-Stabilized Foams
4.4. Foam Formation Mechanisms
4.4.1. Snap-Off
4.4.2. Leave-Behind
4.4.3. Lamella Division
5. Long-Term Storage, Security, Policy, and Regulations
5.1. Long-Term Storage
5.2. CO2 Storage Policy
5.3. Well Classes and Related Regulations
Storage Policy in Europe
6. Monitoring
- (i)
- Monitoring to protect USDWs: Class VI regulations of the underground injection control program under the Safe Drinking Water Act impose monitoring requirements to protect USDWs.
- (ii)
- Monitoring for purposes of reporting CO2 emissions in the atmosphere: EPA’s GHG Reporting Program (GHGRP) requires entities engaged in specific commercial activities to report their atmospheric emissions of GHGs to enable their tabulation. Monitoring of CO2 in geologic storage primarily arises under Subpart R.R. of the GHGRP (“Geologic Sequestration of Carbon Dioxide”). Holders of Class VI permits must report under Subpart R.R. and implement EPA-approved MVA plans [254]. Companies engaged in CO2 EOR injection under Class II permits may opt into Subpart R.R.
- (iii)
- Monitoring to obtain federal tax incentives: The primary federal tax incentive for the geologic storage of CO2 arises under section 45Q of the federal tax code (26 U.S.C. § 45Q). Credit amounts vary by activity, but the general principle is that CO2 must be in “secure geological storage” (see, e.g., id. § 45Q(a)(3)(B)). Via regulation, the Secretary of the Treasury has stated that to satisfy the “secure geological storage” requirement and thus be eligible to obtain the tax credit, taxpayers must either (i) report under Subpart R.R. of the GHGRP to include its M.R.V. requirement, as discussed above; or (ii) comply with ISO standard 27916 (“Carbon dioxide capture, transportation, and geological storage—Carbon dioxide storage using enhanced oil recovery (CO2-EOR)”. On 21 June 2022, the EPA proposed that taxpayers reporting under ISO standard 27916 report under a new set of GHGRP regulations, i.e., Subpart V.V. (87 Fed. Reg. 36920).
- (iv)
- Monitoring to comply with state GHG programs: Some states—most notably California—separately regulate GHG emissions and/or the carbon content of transportation fuels under programs known as low-carbon fuel standards (LCFSs). California’s LCFS, for example, explicitly recognizes the geologic storage of CO2, provided it is conducted following a California Air Resources Board (CARB) protocol (“Carbon Capture and Sequestration Protocol under the Low Carbon Fuel Standard” [255]). CARB’s CCUS protocol separately imposes a variety of CO2 monitoring requirements.
- (v)
- Monitoring to obtain carbon offsets. Carbon market registries—the American Carbon Registry and Verra—are advancing various methodologies enabling eligible CCUS projects to monetize their activities by creating carbon offsets. Once finalized, those methodologies will also address monitoring.
6.1. Atmospheric CO2 Monitoring Technologies
6.1.1. Optical CO2 Sensors
6.1.2. Atmospheric CO2 Tracers
6.1.3. Eddy Covariance Flux Measurement Methods
6.2. Near-Surface CO2 Monitoring
6.2.1. Geochemical Monitoring
6.2.2. Surface Displacement Monitoring Tools
6.2.3. Ecosystem Stress Monitoring Tools
6.3. Subsurface CO2 Monitoring
6.3.1. Well Logging
6.3.2. Downhole Monitoring Tools
6.3.3. Subsurface Fluid Sampling and Tracer Analysis
6.3.4. Seismic Imaging
6.3.5. Electrical and Electromagnetic (EM) Techniques
6.3.6. Gravity Methods
6.4. Emerging CO2 Monitoring Technologies
7. Conclusions
Author Contributions
Funding
Data Availability Statement
Conflicts of Interest
References
- Wolff, E.; Fung, I.; Hoskins, B.; Mitchell, J.F.B.; Palmer, T.; Santer, B.; Shepherd, J.; Shine, K.; Solomon, S.; Trenberth, K.; et al. Climate Change: Evidence & Causes—Update 2020. In The Royal Society and the U.S. National Academy of Sciences; The National Academies Press: Washington, DC, USA, 2020. [Google Scholar]
- National Academy of Sciences. Climate Change: Evidence and Causes: Update 2020; The National Academies Press: Washington, DC, USA, 2020. [Google Scholar] [CrossRef]
- US EPA. Causes of Climate Change. [Overviews and Factsheets]. 19 August 2022. Available online: https://www.epa.gov/climatechange-science/causes-climate-change (accessed on 29 March 2023).
- US EPA. Overview of Greenhouse Gases. 16 May 2022. Available online: https://www.epa.gov/ghgemissions/overview-greenhouse-gases (accessed on 29 March 2023).
- EIA. Greenhouse Gases—U.S. Energy Information Administration (EIA). 2021. Available online: https://www.eia.gov/energyexplained/energy-and-the-environment/greenhouse-gases.php (accessed on 29 March 2023).
- C2ES. Global Anthropogenic GHG Emissions by Gas. 2005. Available online: https://www.c2es.org/content/international-emissions/ (accessed on 29 March 2023).
- Pachauri, R.K.; Mayer, L.; Intergovernmental Panel on Climate Change (Eds.) Climate change 2014: Synthesis report. In Intergovernmental Panel on Climate Change; IPCC: Geneva, Switzerland, 2015. [Google Scholar]
- Rahman, F.A.; Aziz, M.M.A.; Saidur, R.; Bakar, W.A.W.A.; Hainin, M.R.; Putrajaya, R.; Hassan, N.A. Pollution to solution: Capture and sequestration of carbon dioxide (CO2) and its utilization as a renewable energy source for a sustainable future. Renew. Sustain. Energy Rev. 2017, 71, 112–126. [Google Scholar] [CrossRef]
- NOAA Global Monitoring Laboratories. Trends in Atmospheric Carbon Dioxide. Carbon Cycle Greenhouse Gases. 22 October 2022. Available online: https://gml.noaa.gov/ccgg/trends/ (accessed on 29 March 2023).
- U.S. Energy Information Administration (EIA). Where Greenhouse Gases Come from, Energy and the Environment Explained. 24 June 2022. Available online: https://www.eia.gov/energyexplained/energy-and-the-environment/where-greenhouse-gases-come-from.php (accessed on 29 March 2023).
- Global Energy Review: CO2 Emissions in 2021. 2021. Available online: https://www.iea.org/reports/global-energy-review-co2-emissions-in-2021-2 (accessed on 29 March 2023).
- Gür, T.M. Carbon Dioxide Emissions, Capture, Storage and Utilization: Review of Materials, Processes and Technologies. Prog. Energy Combust. Sci. 2022, 89, 100965. [Google Scholar] [CrossRef]
- Yan, J.; Zhang, Z. Carbon Capture, Utilization and Storage (CCUS). Appl. Energy 2019, 235, 1289–1299. [Google Scholar] [CrossRef]
- UNFCCC. The Paris Agreement|UNFCCC. 2020. Available online: https://unfccc.int/process-and-meetings/the-paris-agreement/the-paris-agreement (accessed on 29 March 2023).
- Paris Agreement. Report of the Conference of the Parties to the United Nations Framework Convention on Climate Change, (21st Session, 2015: Paris). Retrieved December, HeinOnline, 2015.
- IPCC. Climate Change and Land: An IPCC Special Report on Climate Change, Desertification, Land Degradation, Sustainable Land Management, Food Security, and Greenhouse Gas Fluxes in Terrestrial Ecosystems; IPCC: Ginevra, Switzerland, 2019. [Google Scholar]
- IEA. Net Zero by 2050—A Roadmap for the Global Energy Sector; National Academies Press: Washington, DC, USA, 2021; p. 224. [Google Scholar]
- Solomon, B.D.; Krishna, K. The coming sustainable energy transition: History, strategies, and outlook. Energy Policy 2011, 39, 7422–7431. [Google Scholar] [CrossRef]
- IRENA. Global Renewables Outlook: Energy Transformation 2050; IRENA: Bonn, Germany, 2020. [Google Scholar]
- IEA. Key World Energy Statistics 2021; International Energy Agency: Paris, France, 2021. [Google Scholar]
- IEA. Global Energy Review 2021; International Energy Agency: Paris, France, 2021. [Google Scholar]
- IRENA. Power System Flexibility for the Energy Transition, Part 1: Overview for Policy Makers; International Renewable Energy Agency: Bonn, Germany, 2018; Available online: https://www.irena.org/-/media/Files/IRENA/Agency/Publication/2018/Nov/IRENA_Power_system_flexibility_1_2018.pdf (accessed on 29 March 2023).
- Zheng, H.; Song, M.; Shen, Z. The evolution of renewable energy and its impact on carbon reduction in China. Energy 2021, 237, 121639. [Google Scholar] [CrossRef]
- EIA. Country Analysis Executive Summary: China (p. 18). U.S. Energy Information Administration. 2020. Available online: https://www.eia.gov/international/content/analysis/countries_long/China/china.pdf (accessed on 29 March 2023).
- IRENA. Country Rankings. /Statistics/View-Data-by-Topic/Capacity-and-Generation/Country-Rankings. 2022. Available online: https://www.irena.org/Statistics/View-Data-by-Topic/Capacity-and-Generation/Country-Rankings (accessed on 29 March 2023).
- ENERGY.GOV, Renewable Energy. Energy.Gov. 2022. Available online: https://www.energy.gov/eere/renewable-energy (accessed on 29 March 2023).
- European Commission. A European Green Deal. European Commission—European Commission. 2022. Available online: https://ec.europa.eu/info/strategy/priorities-2019-2024/european-green-deal_en (accessed on 29 March 2023).
- Mathiesen, B.V.; Lund, H.; Connolly, D.; Wenzel, H.; Østergaard, P.A.; Möller, B.; Nielsen, S.; Ridjan, I.; Karnøe, P.; Sperling, K.; et al. Smart Energy Systems for coherent 100% renewable energy and transport solutions. Appl. Energy 2015, 145, 139–154. [Google Scholar] [CrossRef]
- Dominković, D.F.; Bačeković, I.; Pedersen, A.S.; Krajačić, G. The future of transportation in sustainable energy systems: Opportunities and barriers in a clean energy transition. Renew. Sustain. Energy Rev. 2018, 82, 1823–1838. [Google Scholar] [CrossRef]
- Wilberforce, T.; Baroutaji, A.; Soudan, B.; Al-Alami, A.H.; Olabi, A.G. Outlook of carbon capture technology and challenges. Sci. Total Environ. 2019, 657, 56–72. [Google Scholar] [CrossRef] [Green Version]
- Yang, L.; Zhang, X.; McAlinden, K.J. The effect of trust on people’s acceptance of CCS (carbon capture and storage) technologies: Evidence from a survey in the People’s Republic of China. Energy 2016, 96, 69–79. [Google Scholar] [CrossRef]
- Hasan, M.F.; First, E.L.; Boukouvala, F.; Floudas, C.A. A multi-scale framework for CO2 capture, utilization, and sequestration: CCUS and CCU. Comput. Chem. Eng. 2015, 81, 2–21. [Google Scholar] [CrossRef] [Green Version]
- IEA. Energy Technology Perspectives 2017: Catalysing Energy Technology Transformations; OECD: Paris, France, 2017. [Google Scholar]
- Leonzio, G.; Bogle, D.; Foscolo, P.U.; Zondervan, E. Optimization of CCUS supply chains in the UK: A strategic role for emissions reduction. Chem. Eng. Res. Des. 2020, 155, 211–228. [Google Scholar] [CrossRef]
- DOE. Carbon Storage Atlas: Fifth Edition. 2015. Available online: https://www.netl.doe.gov/sites/default/files/2018-10/ATLAS-V-2015.pdf (accessed on 29 March 2023).
- IEA. Carbon Capture, Utilisation and Storage—Fuels & Technologies. IEA. September 2021. Available online: https://www.iea.org/fuels-and-technologies/carbon-capture-utilisation-and-storage (accessed on 29 March 2023).
- Liu, H.J.; Were, P.; Li, Q.; Gou, Y.; Hou, Z. Worldwide Status of CCUS Technologies and Their Development and Challenges in China. Geofluids 2017, 2017. [Google Scholar] [CrossRef] [Green Version]
- IEA. Direct Air Capture—Analysis. 2021. Available online: https://www.iea.org/reports/direct-air-capture (accessed on 29 March 2023).
- MacDowell, N.; Florin, N.; Buchard, A.; Hallett, J.; Galindo, A.; Jackson, G.; Adjiman, C.S.; Williams, C.K.; Shah, N.; Fennell, P. An overview of CO2 capture technologies. Energy Environ. Sci. 2010, 3, 1645–1669. [Google Scholar] [CrossRef] [Green Version]
- Climate Works. Orca Is Climeworks’ New Large-Scale Carbon Dioxide Removal Plant. 2021. Available online: https://climeworks.com/roadmap/orca (accessed on 29 March 2023).
- DOE. Pre-Combustion Carbon Capture Research. Available online: https://www.energy.gov/fecm/science-innovation/carbon-capture-and-storage-research/carbon-capture-rd/pre-combustion-carbon (accessed on 29 March 2023).
- Theo, W.L.; Lim, J.S.; Hashim, H.; Mustaffa, A.A.; Ho, W.S. Review of pre-combustion capture and ionic liquid in carbon capture and storage. Appl. Energy 2016, 183, 1633–1663. [Google Scholar] [CrossRef]
- Wall, T.F. Combustion processes for carbon capture. Proc. Combust. Inst. 2007, 31, 31–47. [Google Scholar] [CrossRef]
- Jansen, D.; Gazzani, M.; Manzolini, G.; van Dijk, E.; Carbo, M. Pre-combustion CO2 capture. Int. J. Greenh. Gas Control 2015, 40, 167–187. [Google Scholar] [CrossRef] [Green Version]
- Wang, M.; Lawal, A.; Stephenson, P.; Sidders, J.; Ramshaw, C. Post-combustion CO2 capture with chemical absorption: A state-of-the-art review. Chem. Eng. Res. Des. 2011, 89, 1609–1624. [Google Scholar] [CrossRef] [Green Version]
- Zhao, Z.; Cui, X.; Ma, J.; Li, R. Adsorption of carbon dioxide on alkali-modified zeolite 13X adsorbents. Int. J. Greenh. Gas Control 2007, 1, 355–359. [Google Scholar] [CrossRef]
- IPCC. Carbon Dioxide Capture and Storage. IPCC. 2005. Available online: https://www.ipcc.ch/report/carbon-dioxide-capture-and-storage/ (accessed on 29 March 2023).
- Bui, M.; Adjiman, C.S.; Bardow, A.; Anthony, E.J.; Boston, A.; Brown, S.; Fennell, P.S.; Fuss, S.; Galindo, A.; Hackett, L.A.; et al. Carbon capture and storage (CCS): The way forward. Energy Environ. Sci. 2018, 11, 1062–1176. [Google Scholar] [CrossRef] [Green Version]
- Gibbins, J.; Chalmers, H. Carbon capture and storage. Energy Policy 2008, 36, 4317–4322. [Google Scholar] [CrossRef] [Green Version]
- Stanger, R.; Wall, T.; Spörl, R.; Paneru, M.; Grathwohl, S.; Weidmann, M.; Scheffknecht, G.; McDonald, D.; Myöhänen, K.; Ritvanen, J.; et al. Oxyfuel combustion for CO2 capture in power plants. Int. J. Greenh. Gas Control 2015, 40, 55–125. [Google Scholar] [CrossRef]
- Koohestanian, E.; Shahraki, F. Review on principles, recent progress, and future challenges for oxy-fuel combustion CO2 capture using compression and purification unit. J. Environ. Chem. Eng. 2021, 9, 105777. [Google Scholar] [CrossRef]
- Soundararajan, R.; Gundersen, T.; Ditaranto, M. Oxy-combustion coal based power plants: Study of operating pressure, oxygen purity and downstream purification parameters. Chem. Eng. Trans. 2014, 39, 229–234. [Google Scholar] [CrossRef]
- Hong, J.; Chaudhry, G.; Brisson, J.; Field, R.; Gazzino, M.; Ghoniem, A.F. Analysis of oxy-fuel combustion power cycle utilizing a pressurized coal combustor. Energy 2009, 34, 1332–1340. [Google Scholar] [CrossRef] [Green Version]
- Darde, A.; Prabhakar, R.; Tranier, J.-P.; Perrin, N. Air separation and flue gas compression and purification units for oxy-coal combustion systems. Energy Procedia 2009, 1, 527–534. [Google Scholar] [CrossRef] [Green Version]
- Smit, B.; Park, A.-H.A.; Gadikota, G. The Grand Challenges in Carbon Capture, Utilization, and Storage. Front. Energy Res. 2014, 2. [Google Scholar] [CrossRef] [Green Version]
- Baena-Moreno, F.M.; Rodríguez-Galán, M.; Vega, F.; Alonso-Fariñas, B.; Vilches Arenas, L.F.; Navarrete, B. Carbon capture and utilization technologies: A literature review and recent advances. Energy Sources Part A Recovery Util. Environ. Eff. 2019, 41, 1403–1433. [Google Scholar] [CrossRef]
- Coddington, K.; Gellici, J.; Hilton, R.; Wade, S.; Ali, S.; Berger, A.; Carr, M.; Eames, F.; Godec, M.; Harju, J.; et al. CO2 BUILDING BLOCKS Assessing CO2 Utilization Options. National Coal Council. 2016. Available online: https://www.nationalcoalcouncil.org/studies/2016/NCC-CO2-Building-Block-FINAL-Report.pdf (accessed on 29 March 2023).
- Zhang, Z.; Pan, S.-Y.; Li, H.; Cai, J.; Olabi, A.G.; Anthony, E.J.; Manovic, V. Recent advances in carbon dioxide utilization. Renew. Sustain. Energy Rev. 2020, 125, 109799. [Google Scholar] [CrossRef]
- National Academies of Sciences, Engineering, and Medicine. Carbon Dioxide Utilization Markets and Infrastructure: Status and Opportunities: A First Report; National Academies Press: Washington, DC, USA, 2022; p. 26703. [Google Scholar] [CrossRef]
- Steinberg, M. Synthetic carbonaceous fuels and feedstocks from oxides of carbon and nuclear power. Fuel 1978, 57, 460–468. [Google Scholar] [CrossRef]
- Meunier, N.; Chauvy, R.; Mouhoubi, S.; Thomas, D.; De Weireld, G. Alternative production of methanol from industrial CO2. Renew. Energy 2020, 146, 1192–1203. [Google Scholar] [CrossRef]
- Pontzen, F.; Liebner, W.; Gronemann, V.; Rothaemel, M.; Ahlers, B. CO2-based methanol and DME—Efficient technologies for industrial scale production. Catal. Today 2011, 171, 242–250. [Google Scholar] [CrossRef]
- Olah, G.A. Beyond Oil and Gas: The Methanol Economy. Angew. Chem. Int. Ed. 2005, 44, 2636–2639. [Google Scholar] [CrossRef]
- Lü, Y.-J.; Yan, W.-J.; Hu, S.-H.; Wang, B.-W. Hydrogen production by methanol decomposition using gliding arc gas discharge. J. Fuel Chem. Technol. 2012, 40, 698–706. [Google Scholar] [CrossRef]
- Dalena, F.; Senatore, A.; Marino, A.; Gordano, A.; Basile, M.; Basile, A. Methanol Production and Applications: An Overview. In Methanol; Elsevier: Amsterdam, The Netherlands, 2018; pp. 3–28. [Google Scholar] [CrossRef]
- Bertau, M.; Offermanns, H.; Plass, L.; Schmidt, F.; Wernicke, H.-J. (Eds.) Methanol: The Basic Chemical and Energy Feedstock of the Future; Springer: Berlin/Heidelberg, Germany, 2014. [Google Scholar] [CrossRef]
- Driver, J.G.; Owen, R.E.; Makanyire, T.; Lake, J.A.; McGregor, J.; Styring, P. Blue Urea: Fertilizer With Reduced Environmental Impact. Front. Energy Res. 2019, 7, 88. [Google Scholar] [CrossRef] [Green Version]
- Koohestanian, E.; Sadeghi, J.; Mohebbi-Kalhori, D.; Shahraki, F.; Samimi, A. A novel process for CO2 capture from the flue gases to produce urea and ammonia. Energy 2018, 144, 279–285. [Google Scholar] [CrossRef]
- Li, W.; Shi, Y.; Zhu, D.; Wang, W.; Liu, H.; Li, J.; Shi, N.; Ma, L.; Fu, S. Fine root biomass and morphology in a temperate forest are influenced more by the nitrogen treatment approach than the rate. Ecol. Indic. 2021, 130, 108031. [Google Scholar] [CrossRef]
- Yang, Y.; Chen, X.; Liu, L.; Li, T.; Dou, Y.; Qiao, J.; Wang, Y.; An, S.; Chang, S.X. Nitrogen fertilization weakens the linkage between soil carbon and microbial diversity: A global meta-analysis. Glob. Chang. Biol. 2022, 28, 6446–6461. [Google Scholar] [CrossRef]
- Yang, Y.; Li, T.; Pokharel, P.; Liu, L.; Qiao, J.; Wang, Y.; An, S.; Chang, S.X. Global effects on soil respiration and its temperature sensitivity depend on nitrogen addition rate. Soil Biol. Biochem. 2022, 174, 108814. [Google Scholar] [CrossRef]
- Hao, C.; Wang, S.; Li, M.; Kang, L.; Ma, X. Hydrogenation of CO2 to formic acid on supported ruthenium catalysts. Catal. Today 2011, 160, 184–190. [Google Scholar] [CrossRef]
- Bulushev, D.A.; Ross, J.R.H. Towards Sustainable Production of Formic Acid. ChemSusChem 2018, 11, 821–836. [Google Scholar] [CrossRef] [PubMed] [Green Version]
- Sternberg, A.; Jens, C.M.; Bardow, A. Life cycle assessment of CO2-based C1-chemicals. Green Chem. 2017, 19, 2244–2259. [Google Scholar] [CrossRef]
- Leitner, W. Carbon Dioxide as a Raw Material: The Synthesis of Formic Acid and Its Derivatives from CO2. Angew. Chem. Int. Ed. 1995, 34, 2207–2221. [Google Scholar] [CrossRef]
- Goli, A.; Shamiri, A.; Talaiekhozani, A.; Eshtiaghi, N.; Aghamohammadi, N.; Aroua, M.K. An overview of biological processes and their potential for CO2 capture. J. Environ. Manag. 2016, 183, 41–58. [Google Scholar] [CrossRef] [PubMed]
- Bowyer, J.R.; Leegood, R.C.; Dey, P.M.; Harborne, J.B. Plant Biochemistry; Academic Press: Cambridge, MA, USA, 1997. [Google Scholar]
- Moseman, A.; Harvey, C. How Many New Trees Would We Need to Offset Our Carbon Emissions? MIT Climate Portal. 2022. Available online: https://climate.mit.edu/ask-mit/how-many-new-trees-would-we-need-offset-our-carbon-emissions (accessed on 29 March 2023).
- Ramanan, R.; Kannan, K.; Deshkar, A.; Yadav, R.; Chakrabarti, T. Enhanced algal CO2 sequestration through calcite deposition by Chlorella sp. And Spirulina platensis in a mini-raceway pond. Bioresour. Technol. 2010, 101, 2616–2622. [Google Scholar] [CrossRef]
- Surampalli, R.Y.; Zhang, T.C.; Tyagi, R.D.; Naidu, R.; Gurjar, B.R.; Ojha, C.S.P.; Yan, S.; Brar, S.K.; Ramakrishnan, A.; Kao, C.M. (Eds.) Carbon Capture and Storage: Physical, Chemical, and Biological Methods; American Society of Civil Engineers: Reston, VA, USA, 2015. [Google Scholar] [CrossRef] [Green Version]
- Sayre, R. Microalgae: The Potential for Carbon Capture. Bioscience 2010, 60, 722–727. [Google Scholar] [CrossRef]
- Núñez-López, V.; Moskal, E. Potential of CO2-EOR for Near-Term Decarbonization. Front. Clim. 2019, 1, 5. [Google Scholar] [CrossRef] [Green Version]
- Kuuskraa, V.A.; Godec, M.L.; Dipietro, P. CO2 Utilization from “Next Generation” CO2 Enhanced Oil Recovery Technology. Energy Procedia 2013, 37, 6854–6866. [Google Scholar] [CrossRef]
- Aryana, S.A.; Barclay, C.; Liu, S. North cross Devonian unit-a mature continuous CO2 flood beyond 200% HCPV injection. In Proceedings of the SPE Annual Technical Conference and Exhibition SPE, Amsterdam, The Netherlands, 27–29 October 2014. [Google Scholar] [CrossRef]
- Cao, M.; Gu, Y. Physicochemical Characterization of Produced Oils and Gases in Immiscible and Miscible CO2 Flooding Processes. Energy Fuels 2012, 27, 440–453. [Google Scholar] [CrossRef]
- IEA. Number of EOR Projects in Operation Globally, 1971–2017—Charts—Data & Statistics. Available online: https://www.iea.org/data-and-statistics/charts/number-of-eor-projects-in-operation-globally-1971-2017 (accessed on 29 March 2023).
- Jarrell, P.M.; Fox, C.; Stein, M.; Webb, S. Practical Aspects of CO2 Flooding; Society of Petroleum Engineers: Richardson, TX, USA, 2002; Volume 22. [Google Scholar]
- International Reservoir Technologies, Inc. IRT EOR Projects. Available online: http://www.irt-inc.com/eor-projects.html (accessed on 29 March 2023).
- Han, L.; Gu, Y. Optimization of Miscible CO2 Water-Alternating-Gas Injection in the Bakken Formation. Energy Fuels 2014, 28, 6811–6819. [Google Scholar] [CrossRef]
- Jin, L.; Hawthorne, S.; Sorensen, J.; Pekot, L.; Smith, S.; Heebink, L.; Bosshart, N.; Torres, J.; Dalkhaa, C.; Gorecki, C.; et al. Extraction of Oil From the Bakken Shale Formations With Supercritical CO2. In Proceedings of the 5th Unconventional Resources Technology Conference, Austin, TX, USA, 24–26 July 2017. [Google Scholar] [CrossRef]
- ENERGY.GOV, Vast Energy Resource in Residual Oil Zones, FE Study Says. Energy.Gov. June 2022. Available online: https://www.energy.gov/fecm/articles/vast-energy-resource-residual-oil-zones-fe-study-says (accessed on 29 March 2023).
- Honarpour, M.M.; Nagarajan, N.R.; Grijalba, A.C.; Valle, M.; Adesoye, K. Rock-Fluid Characterization for Miscible CO2 Injection: Residual Oil Zone, Seminole Field, Permian Basin. In Proceedings of the SPE Annual Technical Conference and Exhibition, Florence, Italy, 20–22 September 2010. [Google Scholar] [CrossRef]
- Melzer, S. Stranded Oil in The Residual Oil Zone Prepared for Advanced Resources International and U.S. Department of Energy Office of Fossil Energy-Office of Oil and Natural Gas. In Energy Procedia; Elsevier: Amsterdam, The Netherlands, 2006. [Google Scholar] [CrossRef]
- Burton-Kelly, M.E.; Dotzenrod, N.W.; Feole, I.K.; Peck, W.D.; He, J.; Butler, S.K.; Kurz, M.D.; Kurz, B.A.; Smith, S.A.; Gorecki, C.D. Identification of Residual Oil Zones in the Williston and Powder River Basins; DOE-EERC—FE0024453, 1430234; Energy and Environmental Research Center: Grand Forks, ND, USA, 29 March 2018. [Google Scholar] [CrossRef]
- Chen, B.; Pawar, R. Capacity Assessment of CO2 Storage and Enhanced Oil Recovery in Residual Oil Zones. In Proceedings of the SPE Annual Technical Conference and Exhibition, Dallas, TX, USA, 24–26 September 2018. [Google Scholar] [CrossRef]
- Roueché, J.N.; Karacan, C.Ö. Zone Identification and Oil Saturation Prediction in a Waterflooded Field: Residual Oil Zone. In Proceedings of the SPE Improved Oil Recovery Conference, Tulsa, OK, USA, 14–18 April 2018. [Google Scholar] [CrossRef]
- Ren, B.; Duncan, I. Modeling oil saturation evolution in residual oil zones: Implications for CO2 EOR and sequestration. J. Pet. Sci. Eng. 2019, 177, 528–539. [Google Scholar] [CrossRef]
- Ren, B.; Duncan, I.J. Reservoir simulation of carbon storage associated with CO2 EOR in residual oil zones, San Andres formation of West Texas, Permian Basin, USA. Energy 2019, 167, 391–401. [Google Scholar] [CrossRef]
- Puri, R.; Yee, D. Enhanced Coalbed Methane Recovery. In Proceedings of the SPE Annual Technical Conference and Exhibition, New Orleans, Louisiana, 23–26 September 1990. [Google Scholar] [CrossRef]
- Moore, T.A. Coalbed methane: A review. Int. J. Coal Geol. 2012, 101, 36–81. [Google Scholar] [CrossRef]
- Flores, R.M. Coalbed methane: From hazard to resource. Int. J. Coal Geol. 1998, 35, 3–26. [Google Scholar] [CrossRef]
- Qin, Y.; Moore, T.A.; Shen, J.; Yang, Z.; Shen, Y.; Wang, G. Resources and geology of coalbed methane in China: A review. Int. Geol. Rev. 2017, 60, 777–812. [Google Scholar] [CrossRef]
- Liang, W.; Yan, J.; Zhang, B.; Hou, D. Review on Coal Bed Methane Recovery Theory and Technology: Recent Progress and Perspectives. Energy Fuels 2021, 35, 4633–4643. [Google Scholar] [CrossRef]
- Mazzotti, M.; Pini, R.; Storti, G. Enhanced coalbed methane recovery. J. Supercrit. Fluids 2009, 47, 619–627. [Google Scholar] [CrossRef]
- Oudinot, A.Y.; Riestenberg, D.E.; Koperna, G.J. Enhanced Gas Recovery and CO2 Storage in Coal Bed Methane Reservoirs with N2 Co-Injection. Energy Procedia 2017, 114, 5356–5376. [Google Scholar] [CrossRef]
- Kelemen, P.; Benson, S.M.; Pilorgé, H.; Psarras, P.; Wilcox, J. An Overview of the Status and Challenges of CO2 Storage in Minerals and Geological Formations. Front. Clim. 2019, 1, 9. [Google Scholar] [CrossRef] [Green Version]
- National Academies of Sciences, Engineering, and Medicine. Negative Emissions Technologies and Reliable Sequestration: A Research Agenda; National Academies Press: Washington, DC, USA, 2018. [Google Scholar] [CrossRef]
- Global Energy Review: CO2 Emissions in 2022. 2022. Available online: https://iea.blob.core.windows.net/assets/3c8fa115-35c4-4474-b237-1b00424c8844/CO2Emissionsin2022.pdf (accessed on 29 March 2023).
- United States National Energy Technology Laboratory; Office of Fossil Energy. Carbon sequestration ATLAS of the United States and Canada; National Energy Technology Laboratory: Albany, OR, USA, 2007.
- Bachu, S. Screening and ranking of sedimentary basins for sequestration of CO2 in geological media in response to climate change. Environ. Geol. 2003, 44, 277–289. [Google Scholar] [CrossRef]
- Bradshaw, J.; Bachu, S.; Bonijoly, D.; Burruss, R.; Holloway, S.; Christensen, N.P.; Mathiassen, O.M. CO2 storage capacity estimation: Issues and development of standards. Int. J. Greenh. Gas Control 2007, 1, 62–68. [Google Scholar] [CrossRef] [Green Version]
- Michael, K.; Golab, A.; Shulakova, V.; Ennis-King, J.; Allinson, G.; Sharma, S.K.; Aiken, T. Geological storage of CO2 in saline aquifers—A review of the experience from existing storage operations. Int. J. Greenh. Gas Control 2010, 4, 659–667. [Google Scholar] [CrossRef]
- Bruant, R.G.; Guswa, A.J.; Celia, M.A.; Peters, C.A. Safe storage of CO2 in deep saline aquifers. Environ. Sci. Technol. 2002, 36, 240A–245A. [Google Scholar] [CrossRef] [PubMed] [Green Version]
- Jafari, M.; Cao, S.C.; Jung, J. Geological CO2 sequestration in saline aquifers: Implication on potential solutions of China’s power sector. Resour. Conserv. Recycl. 2017, 121, 137–155. [Google Scholar] [CrossRef]
- Hepple, R.P.; Benson, S.M. Geologic storage of carbon dioxide as a climate change mitigation strategy: Performance requirements and the implications of surface seepage. Environ. Geol. 2005, 47, 576–585. [Google Scholar] [CrossRef]
- IEA. Technology Roadmap: Carbon Capture and Storage; OECD Publishing: Paris, France, 2009. [Google Scholar] [CrossRef]
- Corum, M.D.; Jones, K.B.; Warwick, P.D. CO2 Sequestration Potential of Unmineable Coal—State of Knowledge. Energy Procedia 2013, 37, 5134–5140. [Google Scholar] [CrossRef] [Green Version]
- Torp, T.A.; Gale, J. Demonstrating storage of CO2 in geological reservoirs: The Sleipner and SACS projects. Energy 2004, 29, 1361–1369. [Google Scholar] [CrossRef]
- Riddiford, F.; Tourqui, A.; Bishop, C.; Taylor, B.; Smith, M. A Cleaner Development: The in Salah Gas Project, Algeria. In Proceedings of the 6th International Conference on Greenhouse Gas Control Technologies, Kyoto, Japan, 1–4 October 2003; Volume 1, pp. 595–600. [Google Scholar] [CrossRef]
- Maldal, T.; Tappel, I.M. CO2 underground storage for Snøhvit gas field development. Energy 2004, 29, 1403–1411. [Google Scholar] [CrossRef]
- Zhang, L.; Huang, H.; Wang, Y.; Ren, B.; Ren, S.; Chen, G.; Zhang, H. CO2 storage safety and leakage monitoring in the CCS demonstration project of Jilin oilfield, China. Greenh. Gases Sci. Technol. 2014, 4, 425–439. [Google Scholar] [CrossRef]
- Yang, F.; Bai, B.; Tang, D.; Shari, D.-N.; David, W. Characteristics of CO2 sequestration in saline aquifers. Pet. Sci. 2010, 7, 83–92. [Google Scholar] [CrossRef] [Green Version]
- Hassanzadeh, H.; Pooladi-Darvish, M.; Keith, D.W. Accelerating CO2 Dissolution in Saline Aquifers for Geological Storage—Mechanistic and Sensitivity Studies. Energy Fuels 2009, 23, 3328–3336. [Google Scholar] [CrossRef]
- Chadwick, A.; Arts, R.; Bernstone, C.; May, F.; Thibeau, S.; Zweigel, P. (Eds.) Best Practice for the Storage of CO2 in Saline Aquifers: Observations and Guidelines from the SACS and CO2STORE Projects; British Geological Survey: Nottingham, UK, 2008. [Google Scholar]
- De Silva, G.; Ranjith, P.; Perera, M. Geochemical aspects of CO2 sequestration in deep saline aquifers: A review. Fuel 2015, 155, 128–143. [Google Scholar] [CrossRef]
- Bando, S.; Takemura, F.; Nishio, M.; Hihara, E.; Akai, M. Solubility of CO2 in Aqueous Solutions of NaCl at (30 to 60) °C and (10 to 20) MPa. J. Chem. Eng. Data 2003, 48, 576–579. [Google Scholar] [CrossRef]
- Portier, S.; Rochelle, C. Modelling CO2 solubility in pure water and NaCl-type waters from 0 to 300 °C and from 1 to 300 bar: Application to the Utsira Formation at Sleipner. Chem. Geol. 2005, 217, 187–199. [Google Scholar] [CrossRef]
- Pawar, R.J.; Bromhal, G.S.; Carey, J.W.; Foxall, W.; Korre, A.; Ringrose, P.S.; Tucker, O.; Watson, M.N.; White, J.A. Recent advances in risk assessment and risk management of geologic CO2 storage. Int. J. Greenh. Gas Control 2015, 40, 292–311. [Google Scholar] [CrossRef] [Green Version]
- Gadikota, G.; Matter, J.; Kelemen, P.; Park, A.-H.A. Chemical and morphological changes during olivine carbonation for CO2 storage in the presence of NaCl and NaHCO3. Phys. Chem. Chem. Phys. 2014, 16, 4679–4693. [Google Scholar] [CrossRef] [PubMed]
- Zendehboudi, S.; Ahmadi, M.A.; Bahadori, A.; Shafiei, A.; Babadagli, T. A developed smart technique to predict minimum miscible pressure-EOR implications. Can. J. Chem. Eng. 2013, 91, 1325–1337. [Google Scholar] [CrossRef]
- Quijada, M.G. Optimization of a CO2 Flood Design Wasson—West Texas. Master’s Thesis, Texas A&M University, Brazos County, TX, USA, 2005. Available online: https://oaktrust.library.tamu.edu/bitstream/handle/1969.1/4138/etd-tamu-2005B-PETE-Garcia.pdf?sequence=1&isAllowed=y (accessed on 29 March 2023).
- Yellig, W.F.; Metcalfe, R.S. Determination and Prediction of CO2 Minimum Miscibility Pressures (includes associated paper 8876). J. Pet. Technol. 1980, 32, 160–168. [Google Scholar] [CrossRef]
- Verma, M.K. Fundamentals of Carbon Dioxide-Enhanced Oil Recovery (CO2-EOR)—A Supporting Document of the Assessment Methodology for Hydrocarbon Recovery Using CO2-EOR Associated with Carbon Sequestration; Open-File Report; US Geological Survey: Washington, DC, USA, 2015.
- Zhang, N.; Wei, M.; Bai, B. Comprehensive Review of Worldwide CO2 Immiscible Flooding. In Proceedings of the SPE Improved Oil Recovery Conference, East Seminole Field, TX, USA, 17 April 2018. [Google Scholar] [CrossRef]
- Adel, I.A.; Zhang, F.; Bhatnagar, N.; Schechter, D.S. The Impact of Gas-Assisted Gravity Drainage on Operating Pressure in a Miscible CO2 Flood. In Proceedings of the SPE Improved Oil Recovery Conference, Tulsa, OK, USA, 14–18 April 2018. [Google Scholar] [CrossRef]
- Aryana, S.; Kovscek, A.R. Experiments and analysis of drainage displacement processes relevant to carbon dioxide injection. Phys. Rev. E 2012, 86, 066310. [Google Scholar] [CrossRef]
- Zhou, D.; Yan, M.; Calvin Wm, M. Optimization of a Mature CO2 Flood—From Continuous Injection to WAG. In Proceedings of the SPE Improved Oil Recovery Conference, Tulsa, OK, USA, 14–18 April 2012. [Google Scholar] [CrossRef]
- Bellavance, J.F.R. Dollarhide Devonian CO2 Flood: Project performance review 10 years later. In Proceedings of the Permian Basin Oil and Gas Recovery Conference, Midland, TX, USA, 27–29 March 1996. [Google Scholar]
- Wang, X.; Luo, P.; Er, V.; Huang, S. Assessment of CO2 Flooding Potential for Bakken Formation, Saskatchewan. In Proceedings of the Canadian Unconventional Resources and International Petroleum Conference, Calgary, AB, Canada, 19–21 October 2010. [Google Scholar] [CrossRef]
- Ghedan, S. Global Laboratory Experience of CO2-EOR Flooding. In Proceedings of the SPE/EAGE Reservoir Characterization & Simulation Conference, Abu Dhabi, United Arab Emirates, 19–21 October 2009. [Google Scholar] [CrossRef]
- Luis, F.; Al Hammadi, K.; Tanakov, M. Case Study of CO2 Injection to Enhance Oil Recovery into the Transition Zone of a Tight Carbonate Reservoir. In Proceedings of the Abu Dhabi International Petroleum Exhibition & Conference, Abu Dhabi, United Arab Emirates, 7–10 November 2016. [Google Scholar] [CrossRef]
- Parrish, D.R. Flooding Process for Recovery of Oil. U.S. Patent No. 3,244,228, 5 April 1996. [Google Scholar]
- Sohrabi, M.; Tehrani, D.H.; Danesh, A.; Henderson, G.D. Visualisation of Oil Recovery by Water Alternating Gas (WAG) Injection Using High Pressure Micromodels—Oil-Wet & Mixed-Wet Systems. In Proceedings of the SPE Annual Technical Conference and Exhibition, New Orleans, Louisiana, 30 September–3 October 2001. [Google Scholar] [CrossRef]
- Yoosook, H.; Maneeintr, K. CO2 geological storage coupled with water alternating gas for enhanced oil recovery. Chem. Eng. Trans. 2018, 63, 217–222. [Google Scholar] [CrossRef]
- Christensen, J.R.; Stenby, E.H.; Skauge, A. Review of WAG field experience. SPE Reserv. Eval. Eng. 2001, 4, 97–106. [Google Scholar] [CrossRef]
- Panjalizadeh, H.; Alizadeh, A.; Ghazanfari, M. Optimization of the WAG Injection Process. Pet. Sci. Technol. 2015, 33, 294–301. [Google Scholar] [CrossRef]
- Kumar, S.; Mandal, A. A comprehensive review on chemically enhanced water alternating gas/CO2 (CEWAG) injection for enhanced oil recovery. J. Pet. Sci. Eng. 2017, 157, 696–715. [Google Scholar] [CrossRef]
- Kechut, N.I.; Groot, J.A.W.M.; Mustafa, M.A.; Groenenboom, J. Robust Screening Criteria for Foam-Assisted Water-Alternating Gas FAWAG Injection. In Proceedings of the SPE/IATMI Asia Pacific Oil & Gas Conference and Exhibition, Virtual, 10–12 October 2021. [Google Scholar] [CrossRef]
- Omar, S.; Jaafar, M.Z.; Ismail, A.R.; Sulaiman, W.R. Monitoring Foam Stability in Foam Assisted Water Alternate Gas (FAWAG) Processes Using Electrokinetic Signals. In Proceedings of the SPE Enhanced Oil Recovery Conference, Kuala Lumpur, Malaysia, 2–4 July 2013. [Google Scholar] [CrossRef]
- Tetteh, J.T.; Cudjoe, S.E.; Aryana, S.A.; Ghahfarokhi, R.B. Investigation into fluid-fluid interaction phenomena during low salinity waterflooding using a reservoir-on-a-chip microfluidic model. J. Pet. Sci. Eng. 2021, 196, 108074. [Google Scholar] [CrossRef]
- Khan, M.Y.; Kohata, A.; Patel, H.; Syed, F.I.; Al Sowaidi, A.K. Water Alternating Gas WAG Optimization Using Tapered WAG Technique for a Giant Offshore Middle East Oil Field. In Proceedings of the Abu Dhabi International Petroleum Exhibition & Conference, Abu Dhabi, United Arab Emirates, 7–10 November 2016. [Google Scholar] [CrossRef]
- Kohata, A.; Willingham, T.; Yunus Khan, M.; Al Sowaidi, A. Extensive Miscible Water Alternating Gas WAG Simulation Study for a Giant Offshore Oil Field. In Proceedings of the Abu Dhabi International Petroleum Exhibition & Conference, Abu Dhabi, United Arab Emirates, 13–16 November 2017. [Google Scholar] [CrossRef]
- Wang, Y.; Mckinzie, J.; Furtado, F.; Aryana, S.A. Scaling Analysis of Two-Phase Flow in Fractal Permeability Fields. Water Resour. Res. 2020, 56, e2020WR028214. [Google Scholar] [CrossRef]
- Guo, F.; Aryana, S. An experimental investigation of nanoparticle-stabilized CO2 foam used in enhanced oil recovery. Fuel 2016, 186, 430–442. [Google Scholar] [CrossRef]
- Heller, J.P.; Lien, C.L.; Kuntamukkula, M.S. Foamlike Dispersions for Mobility Control in CO2 Floods. Soc. Pet. Eng. J. 1985, 25, 603–613. [Google Scholar] [CrossRef]
- Hosseini, H.; Tsau, J.S.; Wasserbauer, J.; Aryana, S.A.; Ghahfarokhi, R.B. Synergistic foam stabilization and transport improvement in simulated fractures with polyelectrolyte complex nanoparticles: Microscale observation using laser etched glass micromodels. Fuel 2021, 301, 121004. [Google Scholar] [CrossRef]
- Bond, D.C.; Holbrook, O.C. Gas Dreve Ol Recovery Process (United States Patent Office Patent No. 630087). 1956. Available online: https://patentimages.storage.googleapis.com/30/d4/db/dc81eb4f3af9db/US2866507.pdf (accessed on 29 March 2023).
- Afzali, S.; Rezaei, N.; Zendehboudi, S. A comprehensive review on Enhanced Oil Recovery by Water Alternating Gas (WAG) injection. Fuel 2018, 227, 218–246. [Google Scholar] [CrossRef]
- Sheng, J.J. Foams and Their Applications in Enhancing Oil Recovery. In Enhanced Oil Recovery Field Case Studies; Elsevier: Amsterdam, The Netherlands, 2013; pp. 251–280. [Google Scholar] [CrossRef]
- Qingfeng, H.; Zhu, Y.; Luo, Y.; Weng, R. Studies On Foam Flooding EOR Technique For Daqing Reservoirs After Polymer Flooding. In Proceedings of the SPE Improved Oil Recovery Symposium, Tulsa, OK, USA, 14–18 April 2012. [Google Scholar] [CrossRef]
- Guo, F.; Aryana, S.A. Improved sweep efficiency due to foam flooding in a heterogeneous microfluidic device. J. Pet. Sci. Eng. 2018, 164, 155–163. [Google Scholar] [CrossRef]
- Guo, F.; Aryana, S.A. Foam Flooding in a Heterogeneous Porous Medium. In Advances in Petroleum Engineering and Petroleum Geochemistry; Banerjee, S., Barati, R., Patil, S., Eds.; Springer International Publishing: Berlin/Heidelberg, Germany, 2019; pp. 65–67. [Google Scholar] [CrossRef]
- Sunmonu, R.M.; Onyekonwu, M. Enhanced Oil Recovery using Foam Injection; a Mechanistic Approach. In Proceedings of the SPE Nigeria Annual International Conference and Exhibition, Lagos, Nigeria, 5–7 August 2013. [Google Scholar] [CrossRef]
- Ma, K.; Lopez-Salinas, J.L.; Puerto, M.C.; Miller, C.A.; Biswal, S.L.; Hirasaki, G.J. Estimation of Parameters for the Simulation of Foam Flow through Porous Media. Part 1: The Dry-Out Effect. Energy Fuels 2013, 27, 2363–2375. [Google Scholar] [CrossRef]
- Lake, L.W. Enhanced Oil Recovery; Prentice Hall: Englewood Cliffs, NJ, USA, 1989. [Google Scholar]
- Belyadi, H.; Fathi, E.; Belyadi, F. Hydraulic fracturing fluid systems. In Hydraulic Fracturing in Unconventional Reservoirs; Elsevier: Amsterdam, The Netherlands, 2019; pp. 47–69. [Google Scholar] [CrossRef]
- David, A.; Marsden, S.S. The Rheology of Foam. In Proceedings of the Fall Meeting of the Society of Petroleum Engineers of AIME, Denver, Colorado, 28 September–1 October 1969. [Google Scholar]
- Emadi, S.; Shadizadeh, S.R.; Manshad, A.K.; Rahimi, A.M.; Nowrouzi, I.; Mohammadi, A.H. Effect of using Zyziphus Spina Christi or Cedr Extract (CE) as a natural surfactant on oil mobility control by foam flooding. J. Mol. Liq. 2019, 293, 111573. [Google Scholar] [CrossRef]
- Ma, K.; Liontas, R.; Conn, C.A.; Hirasaki, G.J.; Biswal, S.L. Visualization of improved sweep with foam in heterogeneous porous media using microfluidics. Soft Matter 2012, 8, 10669–10675. [Google Scholar] [CrossRef]
- AlQuaimi, B.I.; Rossen, W.R. Foam Generation and Rheology in a Variety of Model Fractures. Energy Fuels 2019, 33, 68–80. [Google Scholar] [CrossRef] [Green Version]
- Gajbhiye, R. Novel CO2/N2 Foam Concept and Optimization Scheme for Improving CO2-foam EOR Process. In Proceedings of the SPE Middle East Oil & Gas Show and Conference, event canceled, 28 November–1 December 2021. [Google Scholar] [CrossRef]
- Chang, S.-H.; Grigg, R.B. Effects of Foam Quality and Flow Rate on CO2-Foam Behavior at Reservoir Temperature and Pressure. SPE Reserv. Eval. Eng. 1999, 2, 248–254. [Google Scholar] [CrossRef]
- Patton, J.T.; Holbrook, S.T.; Hsu, W. Rheology of Mobility-Control Foams. Soc. Pet. Eng. J. 1983, 23, 456–460. [Google Scholar] [CrossRef]
- Khatib, Z.I.; Hirasaki, G.J.; Falls, A.H. Effects of Capillary Pressure on Coalescence and Phase Mobilities in Foams Flowing Through Porous Media. SPE Reserv. Eng. 1988, 3, 919–926. [Google Scholar] [CrossRef]
- Mirzaei, M.; Kumar, D.; Turner, D.; Shock, A.; Andel, D.; Hampton, D.; Knight, T.E.; Katiyar, A.; Patil, P.D.; Rozowski, P.; et al. CO2 Foam Pilot in a West Texas Field: Design, Operation and Results. In Proceedings of the SPE Improved Oil Recovery Conference, Virtual, 31 August–4 September 2020. [Google Scholar] [CrossRef]
- Føyen, T.; Brattekås, B.; Fernø, M.; Barrabino, A.; Holt, T. Increased CO2 storage capacity using CO2-foam. Int. J. Greenh. Gas Control 2020, 96, 103016. [Google Scholar] [CrossRef]
- Sheng, J.; Maini, B.; Hayes, R.; Tortike, W. Experimental Study of Foamy Oil Stability. J. Can. Pet. Technol. 1997, 36, 31–37. [Google Scholar] [CrossRef]
- Yu, W.; Kanj, M.Y. Review of foam stability in porous media: The effect of coarsening. J. Pet. Sci. Eng. 2022, 208, 109698. [Google Scholar] [CrossRef]
- Suffridge, F.E.; Raterman, K.T.; Russell, G.C. Foam Performance Under Reservoir Conditions. In Proceedings of the SPE Annual Technical Conference and Exhibition, San Antonio, TX, USA, 8–11 October 1989. [Google Scholar] [CrossRef]
- Louvet, N.; Rouyer, F.; Pitois, O. Ripening of a draining foam bubble. J. Colloid Interface Sci. 2009, 334, 82–86. [Google Scholar] [CrossRef]
- Saint-Jalmes, A. Physical chemistry in foam drainage and coarsening. Soft Matter 2006, 2, 836–849. [Google Scholar] [CrossRef]
- Fan, C.; Jia, J.; Peng, B.; Liang, Y.; Li, J.; Liu, S. Molecular Dynamics Study on CO2 Foam Films with Sodium Dodecyl Sulfate: Effects of Surfactant Concentration, Temperature, and Pressure on the Interfacial Tension. Energy Fuels 2020, 34, 8562–8574. [Google Scholar] [CrossRef]
- Guo, F.; He, J.; Johnson, P.A.; Aryana, S.A. Stabilization of CO2foam using by-product fly ash and recyclable iron oxide nanoparticles to improve carbon utilization in EOR processes. Sustain. Energy Fuels 2017, 1, 814–822. [Google Scholar] [CrossRef]
- Yu, J.; An, C.; Mo, D.; Liu, N.; Lee, R. Foam Mobility Control for Nanoparticle-Stabilized CO2 Foam. In Proceedings of the SPE Improved Oil Recovery Symposium, Tulsa, OK, USA, 14–18 April 2012. [Google Scholar] [CrossRef]
- Nazari, N.; Tsau, J.-S.; Barati, R. CO2 Foam Stability Improvement Using Polyelectrolyte Complex Nanoparticles Prepared in Produced Water. Energies 2017, 10, 516. [Google Scholar] [CrossRef]
- Binks, B.P. Particles as surfactants similarities and differences. Interface Sci. 2002, 7, 21–41. [Google Scholar]
- Binks, B.P.; Horozov, T.S. Aqueous Foams Stabilized Solely by Silica Nanoparticles. Angew. Chem. Int. Ed. 2005, 44, 3722–3725. [Google Scholar] [CrossRef]
- Fu, C.; Liu, N. Rheology and stability of nanoparticle-stabilized CO2 foam under reservoir conditions. J. Pet. Sci. Eng. 2021, 196, 107671. [Google Scholar] [CrossRef]
- Rognmo, A.; Heldal, S.; Fernø, M. Silica nanoparticles to stabilize CO2-foam for improved CO2 utilization: Enhanced CO2 storage and oil recovery from mature oil reservoirs. Fuel 2018, 216, 621–626. [Google Scholar] [CrossRef]
- Alargova, R.G.; Warhadpande, D.S.; Paunov, V.N.; Velev, O.D. Foam Superstabilization by Polymer Microrods. Langmuir 2004, 20, 10371–10374. [Google Scholar] [CrossRef]
- Guo, F.; Aryana, S.A. Nanoparticle-Stabilized CO2 Foam Flooding. In Advances in Petroleum Engineering and Petroleum Geochemistry; Banerjee, S., Barati, R., Patil, S., Eds.; Springer International Publishing: Berlin/Heidelberg, Germany, 2019; pp. 61–63. [Google Scholar] [CrossRef]
- Worthen, A.J.; Parikh, P.S.; Chen, Y.; Bryant, S.L.; Huh, C.; Johnston, K.P. Carbon Dioxide-in-Water Foams Stabilized with a Mixture of Nanoparticles and Surfactant for CO2 Storage and Utilization Applications. Energy Procedia 2014, 63, 7929–7938. [Google Scholar] [CrossRef] [Green Version]
- Worthen, A.J.; Bryant, S.L.; Huh, C.; Johnston, K.P. Carbon dioxide-in-water foams stabilized with nanoparticles and surfactant acting in synergy. AIChE J. 2013, 59, 3490–3501. [Google Scholar] [CrossRef]
- Agista, M.N.; Guo, K.; Yu, Z. A state-of-the-art review of nanoparticles application in petroleum with a focus on enhanced oil recovery. Appl. Sci. 2018, 8, 871. [Google Scholar] [CrossRef] [Green Version]
- Liu, Q.; Qu, H.; Liu, S.; Zhang, Y.; Zhang, S.; Liu, J.; Peng, B.; Luo, D. Modified Fe3O4 nanoparticle used for stabilizing foam flooding for enhanced oil recovery. Colloids Surf. A Physicochem. Eng. Asp. 2020, 605, 125383. [Google Scholar] [CrossRef]
- Liu, Q.; Zhang, Y.; Zhao, X.; Ye, H.; Luo, D. Enhanced oil recovery by foam flooding using foam stabilized with modified Fe3O4 nanoparticles. J. Pet. Sci. Eng. 2022, 209, 109850. [Google Scholar] [CrossRef]
- Nazari, N.; Hosseini, H.; Tsau, J.S.; Shafer-Peltier, K.; Marshall, C.; Ye, Q.; Ghahfarokhi, R.B. Development of highly stable lamella using polyelectrolyte complex nanoparticles: An environmentally friendly scCO2 foam injection method for CO2 utilization using EOR. Fuel 2020, 261, 116360. [Google Scholar] [CrossRef]
- Bhatt, S.; Saraf, S.; Bera, A. Perspectives of Foam Generation Techniques and Future Directions of Nanoparticle-Stabilized CO2 Foam for Enhanced Oil Recovery. Energy Fuels 2023, 37, 1472–1494. [Google Scholar] [CrossRef]
- Rossen, W.R. A critical review of Roof snap-off as a mechanism of steady-state foam generation in homogeneous porous media. Colloids Surf. A Physicochem. Eng. Asp. 2003, 225, 1–24. [Google Scholar] [CrossRef]
- Ransohoff, T.C.; Radke, C.J. Mechanisms of Foam Generation in Glass-Bead Packs. SPE Reserv. Eng. 1988, 3, 573–585. [Google Scholar] [CrossRef] [Green Version]
- Gauteplass, J.; Chaudhary, K.; Kovscek, A.R.; Fernø, M.A. Pore-level foam generation and flow for mobility control in fractured systems. Colloids Surf. A Physicochem. Eng. Asp. 2015, 468, 184–192. [Google Scholar] [CrossRef] [Green Version]
- Wu, Y.; Fang, S.; Dai, C.; Sun, Y.; Fang, J.; Liu, Y.; He, L. Investigation on bubble snap-off in 3-D pore-throat micro-structures. J. Ind. Eng. Chem. 2017, 54, 69–74. [Google Scholar] [CrossRef]
- Hosseini, H.; Guo, F.; Ghahfarokhi, R.B.; Aryana, S.A. Microfluidic Fabrication Techniques for High-Pressure Testing of Microscale Supercritical CO2 Foam Transport in Fractured Unconventional Reservoirs. J. Vis. Exp. 2020, 161, 61369. [Google Scholar] [CrossRef]
- Holloway, S. (Ed.) The Underground Disposal of Carbon Dioxide; British Geological Survey: Nottingham, UK, 1996. [Google Scholar]
- Damen, K.; Faaij, A.; Turkenburg, W. Health, Safety and Environmental Risks of Underground CO2 Storage—Overview of Mechanisms and Current Knowledge. Clim. Chang. 2006, 74, 289–318. [Google Scholar] [CrossRef] [Green Version]
- He, M.; Luis, S.; Rita, S.; Ana, G.; Euripedes, V.; Zhang, N. Risk assessment of CO2 injection processes and storage in carboniferous formations: A review. J. Rock Mech. Geotech. Eng. 2011, 3, 39–56. [Google Scholar] [CrossRef] [Green Version]
- Piessens, K.; Dusar, M. CO2-Sequestration in Abandoned Coal Mines; Royal Belgian Institute for Natural Sciences: Brussels, Belgium, 2003; Available online: https://www.naturalsciences.be/sites/default/files/sequestration.pdf (accessed on 29 March 2023).
- Price, P.N.; McKone, T.E.; Sohn, M.D. Carbon Sequestration Risks and Risk Management; Lawrence Berkeley National Laboratory: Berkeley, CA, USA, 2008. Available online: https://escholarship.org/uc/item/0x18n8qm (accessed on 29 March 2023).
- Solomon, S. Carbon Dioxide Storage: Geological Security and Environmental Issues—Case Study on the Sleipner Gas Field in Norway. Bellona report. 2006. Available online: https://bellona.no/content/uploads/Carbon-Dioxide-Storage.pdf (accessed on 29 March 2023).
- Jarup, L. Hazards of heavy metal contamination. Br. Med. Bull. 2003, 68, 167–182. [Google Scholar] [CrossRef] [PubMed] [Green Version]
- Siirila, E.R.; Navarre-Sitchler, A.K.; Maxwell, R.M.; McCray, J.E. A quantitative methodology to assess the risks to human health from CO2 leakage into groundwater. Adv. Water Resour. 2012, 36, 146–164. [Google Scholar] [CrossRef]
- Do, H.-K.; Yun, S.-T.; Yu, S.; Ryuh, Y.-G.; Choi, H.-S. Evaluation of long-term impacts of CO2 leakage on groundwater quality using hydrochemical data from a natural analogue site in South Korea. Water 2020, 12, 1457. [Google Scholar] [CrossRef]
- Mortezaei, K.; Vahedifard, F. Numerical Simulation of Induced Seismicity in Carbon Capture and Storage Projects. Geotech. Geol. Eng. 2015, 33, 411–424. [Google Scholar] [CrossRef]
- Zoback, M.D.; Harjes, H.-P. Injection-induced earthquakes and crustal stress at 9 km depth at the KTB deep drilling site, Germany. J. Geophys. Res. Solid Earth 1997, 102, 18477–18491. [Google Scholar] [CrossRef]
- Rutqvist, J. The Geomechanics of CO2 Storage in Deep Sedimentary Formations. Geotech. Geol. Eng. 2012, 30, 525–551. [Google Scholar] [CrossRef] [Green Version]
- Mathieson, A.; Midgley, J.; Dodds, K.; Wright, I.; Ringrose, P.; Saoul, N. CO2 sequestration monitoring and verification technologies applied at Krechba, Algeria. Geophysics 2010, 29, 216–222. [Google Scholar] [CrossRef]
- Teatini, P.; Gambolati, G.; Ferronato, M.; Settari, A.; Walters, D. Land uplift due to subsurface fluid injection. J. Geodyn. 2011, 51, 1–16. [Google Scholar] [CrossRef] [Green Version]
- Healy, J.H.; Rubey, W.W.; Griggs, D.T.; Raleigh, C.B. The Denver Earthquakes. Science 1968, 161, 1301–1310. [Google Scholar] [CrossRef] [PubMed] [Green Version]
- Abanades, J.C.; Akai, M.; Benson, S.; Leone, S.; Doctor, R.; Gale, J.; Keith, D.; Mazzotti, M.; Metz, B.; Meyer, L.; et al. IPCC Special Report—Carbon Dioxide Capture and Storage. 2005. Available online: https://www.ipcc.ch/site/assets/uploads/2018/03/srccs_summaryforpolicymakers-1.pdf (accessed on 29 March 2023).
- Bickle, M.J. Geological carbon storage. Nat. Geosci. 2009, 2, 815–818. [Google Scholar] [CrossRef]
- Vilarrasa, V.; Olivella, S.; Carrera, J.; Rutqvist, J. Long term impacts of cold CO2 injection on the caprock integrity. Int. J. Greenh. Gas Control 2014, 24, 1–13. [Google Scholar] [CrossRef]
- Gaus, I. Role and impact of CO2–rock interactions during CO2 storage in sedimentary rocks. Int. J. Greenh. Gas Control 2010, 4, 73–89. [Google Scholar] [CrossRef]
- Busch, A.; Amann, A.; Bertier, P.; Waschbusch, M.; Krooss, B.M. The Significance of Caprock Sealing Integrity for CO2 Storage. In Proceedings of the SPE International Conference on CO2 Capture, Storage, and Utilization, New Orleans, LA, USA, 10–12 November 2010. [Google Scholar] [CrossRef]
- Carroll, S.; Carey, J.W.; Dzombak, D.; Huerta, N.J.; Li, L.; Richard, T.; Um, W.; Walsh, S.D.; Zhang, L. Review: Role of chemistry, mechanics, and transport on well integrity in CO2 storage environments. Int. J. Greenh. Gas Control 2016, 49, 149–160. [Google Scholar] [CrossRef] [Green Version]
- Anderson, S.T. Risk, Liability, and Economic Issues with Long-Term CO2 Storage—A Review. Nat. Resour. Res. 2017, 26, 89–112. [Google Scholar] [CrossRef] [Green Version]
- McElmo Dome. 2021. Available online: https://www.gem.wiki/McElmo_Dome (accessed on 29 March 2023).
- Varanasi, A. You Asked: Does Carbon Capture Technology Actually Work? 27 September 2019. Available online: https://news.climate.columbia.edu/2019/09/27/carbon-capture-technology/#:~:text=The%20first%20carbon%20capture%20plant,Sleipner%2C%20in%20the%20North%20Sea (accessed on 29 March 2023).
- US EPA. History of the UIC Program—Injection Well Time Line. 4 May 2012. Available online: https://web-ded.uta.edu/cedwebfiles/eti/OP_Fact_Sheet/Underground_Injection_Control/UIC%20History.pdf (accessed on 29 March 2023).
- US EPA. Federal Requirements Under the Underground Injection Control (UIC) Program for Carbon Dioxide (CO2) Geologic Sequestration (GS) Wells; Final Rule. Fed. Regist. 2010, 75. Available online: https://www.govinfo.gov/content/pkg/FR-2010-12-10/pdf/2010-29954.pdf (accessed on 29 March 2023).
- DOE. Carbon Storage Research. Energy.Gov. 2022. Available online: https://www.energy.gov/fecm/science-innovation/carbon-capture-and-storage-research (accessed on 29 March 2023).
- UNFCCC. What is the Kyoto Protocol?|UNFCCC. 2022. Available online: https://unfccc.int/kyoto_protocol (accessed on 29 March 2023).
- Global CCS Institute. CCS: A Solution to Climate Change Right Beneath Our Feet. 2018. Available online: https://unfccc.int/sites/default/files/resource/40_UNFCCC%20Submission_Global%20CCS%20Institute.pdf (accessed on 29 March 2023).
- Dwortzan, M. This Is How Carbon Capture Could Help Us Meet Key Paris Agreement Goals. World Economic Form. 2 August 2021. Available online: https://www.weforum.org/agenda/2021/08/this-is-how-carbon-capture-could-help-us-meet-key-paris-agreement-goals (accessed on 29 March 2023).
- UNFCCC. Carbon Capture, Use and Storage. United Nations Framework Convention on Climate Change. 2014. Available online: https://unfccc.int/resource/climateaction2020/tep/thematic-areas/carbon-capture/index.html (accessed on 29 March 2023).
- HSBC. Carbon Capture & Storage. HSBC. 3 November 2020. Available online: https://www.sustainablefinance.hsbc.com/carbon-transition/carbon-capture-and-storage (accessed on 29 March 2023).
- Bazilian, M.; Coddington, K. Carbon Capture, Utilization, and Storage Under the Paris Agreement. The Hill. 15 April 2020. Available online: https://thehill.com/opinion/energy-environment/492990-carbon-capture-utilization-and-storage-under-the-paris-agreement/ (accessed on 29 March 2023).
- Internal Revenue Code. Title 26. 2022. Available online: https://www.govinfo.gov/content/pkg/USCODE-2021-title26/pdf/USCODE-2021-title26-subtitleA-chap1-subchapA-partIV-subpartD-sec45Q.pdf (accessed on 29 March 2023).
- Orr, F.M.J. Carbon Capture, Utilization, and Storage: An Update. SPE J. 2018, 23, 2444–2455. [Google Scholar] [CrossRef]
- Pollak, M.; Phillips, S.J.; Vajjhala, S. Carbon capture and storage policy in the United States: A new coalition endeavors to change existing policy. Glob. Environ. Chang. 2011, 21, 313–323. [Google Scholar] [CrossRef]
- Carbon Capture Coalition. Federal Policy Blueprint. 2021. Available online: https://carboncapturecoalition.org/wp-content/uploads/2021/02/2021_Blueprint.pdf (accessed on 29 March 2023).
- US EPA. Underground Injection Control Well Classes [Overviews and Factsheets]. 11 June 2015. Available online: https://www.epa.gov/uic/underground-injection-control-well-classes (accessed on 29 March 2023).
- US EPA. Primary Enforcement Authority for the Underground Injection Control Program [Overviews and Factsheets]. 22 May 2015. Available online: https://www.epa.gov/uic/primary-enforcement-authority-underground-injection-control-program (accessed on 29 March 2023).
- EASAC. Carbon Capture and Storage in Europe. 2013. Available online: https://easac.eu/fileadmin/Reports/Easac_13_CCS_Web_Complete.pdf (accessed on 29 March 2023).
- UNEP. Basel Convention; United Nations Environment Programme (UNEP): Nairobi, Kenya, 2020. [Google Scholar]
- OSPAR. OSPAR Convention. 2007. Available online: https://www.ospar.org/convention/text (accessed on 29 March 2023).
- IMO. Convention on the Prevention of Marine Pollution by Dumping of Wastes and Other Matter. International Marine Organisation. 2006. Available online: https://www.imo.org/en/OurWork/Environment/Pages/London-Convention-Protocol.aspx (accessed on 29 March 2023).
- European Commission. Implementation of Directive 2009/31/EC on the Geological Storage of Carbon Dioxide: Guidance Document 2, Characterisation of the Storage Complex, CO2 Stream Composition, Monitoring and Corrective Measures. Publications Office. 2011. Available online: https://data.europa.eu/doi/10.2834/98293 (accessed on 29 March 2023).
- Arts, R.; Winthaegen, P. Monitoring Options for CO2 Storage. In Carbon Dioxide Capture for Storage in Deep Geologic Formations; Elsevier: Amsterdam, The Netherlands, 2005; pp. 1001–1013. [Google Scholar] [CrossRef]
- Kikani, J. Reservoir Surveillance; Society Of Petroleum Engineers: Richardson, TX, USA, 2013. [Google Scholar] [CrossRef]
- DOE/NETL. BEST PRACTICES: Monitoring, Verification, and Accounting (MVA) for Geologic Storage Projects. 2017. Available online: https://netl.doe.gov/sites/default/files/2018-10/BPM-MVA-2012.pdf (accessed on 29 March 2023).
- DOE/NETL. Permanence and Safety of CCS. Netl.Doe.Gov. 2022. Available online: https://netl.doe.gov/coal/carbon-storage/faqs/permanence-safety (accessed on 29 March 2023).
- Benson, S.M.; Myer, L.R.; Oldenburg, C.M.; Doughty, C.A.; Pruess, K.; Lewicki, J.; Hoversten, M.; Gasperikova, E.; Daley, T.; Majer, E.; et al. GEO-SEQ Best Practices Manual. Geologic Carbon Dioxide Sequestration: Site Evaluation to Implementation; LBNL—56623; Lawrence Berkeley National Laboratory (LBNL): Berkeley, CA, USA, 2004; p. 842996. [CrossRef] [Green Version]
- Plasynski, S.I.; Litynski, J.T.; McIlvried, H.G.; Vikara, D.M.; Srivastava, R.D. The critical role of monitoring, verification, and accounting for geologic carbon dioxide storage projects. Environ. Geosci. 2011, 18, 19–34. [Google Scholar] [CrossRef]
- EPA. Subpart RR—Geologic Sequestration of Carbon Dioxide. 2023. Available online: https://www.epa.gov/ghgreporting/subpart-rr-geologic-sequestration-carbon-dioxide (accessed on 29 March 2023).
- California Air Resources Board, 2018, Carbon Capture and Sequestration Protocol under the Low Carbon Fuel Standard. 13 August 2018. Available online: https://ww2.arb.ca.gov/sites/default/files/2020-03/CCS_Protocol_Under_LCFS_8-13-18_ada.pdf (accessed on 29 March 2023).
- Chadwick, R.A.; Marchant, B.P.; Williams, G.A. CO2 storage monitoring: Leakage detection and measurement in subsurface volumes from 3D seismic data at Sleipner. Energy Procedia 2014, 63, 4224–4239. [Google Scholar] [CrossRef] [Green Version]
- Pak, N.M.; Rempillo, O.; Norman, A.-L.; Layzell, D.B. Early atmospheric detection of carbon dioxide from carbon capture and storage sites. J. Air Waste Manag. Assoc. 2016, 66, 739–747. [Google Scholar] [CrossRef] [Green Version]
- Cámara, C.; Pérez-Conde, C.; Moreno-Bondi, M.C.; Rivas, C. Fiber optical sensors applied to field measurements. In Techniques and Instrumentation in Analytical Chemistry; Elsevier: Amsterdam, The Netherlands, 1995; Volume 17, pp. 165–193. [Google Scholar] [CrossRef]
- Park, J.; Cho, H.; Yi, S. NDIR CO2 gas sensor with improved temperature compensation. Procedia Eng. 2010, 5, 303–306. [Google Scholar] [CrossRef] [Green Version]
- McNeal, M.P.; Moelders, N.; Pralle, M.U.; Puscasu, I.; Last, L.; Ho, W.; Greenwald, A.C.; Daly, J.T.; Johnson, E.A.; George, T. Development of Optical MEMS CO2 Sensors. In Proceedings of the SPIE Atmospheric Radiation Measurements and Applications in Climate, Seattle, WA, USA, 5 September 2002; Volume 4815, pp. 30–35. [Google Scholar] [CrossRef]
- Charpentier, F.; Bureau, B.; Troles, J.; Boussard-Plédel, C.; Pierrès, K.M.-L.; Smektala, F.; Adam, J.-L. Infrared monitoring of underground CO2 storage using chalcogenide glass fibers. Opt. Mater. 2009, 31, 496–500. [Google Scholar] [CrossRef]
- Jones, D.; Barlow, T.; Beaubien, S.; Ciotoli, G.; Lister, T.; Lombardi, S.; May, F.; Möller, I.; Pearce, J.; Shaw, R. New and established techniques for surface gas monitoring at onshore CO2 storage sites. Energy Procedia 2009, 1, 2127–2134. [Google Scholar] [CrossRef] [Green Version]
- Leuning, R.; Etheridge, D.; Luhar, A.; Dunse, B. Atmospheric monitoring and verification technologies for CO2 geosequestration. Int. J. Greenh. Gas Control 2008, 2, 401–414. [Google Scholar] [CrossRef]
- Etheridge, D.; Leuning, R.; Luhar, A.; Spencer, D.; Coram, S.; Steele, L.P.; Zegelin, S.; Allison, C.; Fraser, P.; Porter, L.; et al. Atmospheric monitoring and verification of geosequestration at the CO2CRC Otway Project. 2007. Available online: http://www.cmar.csiro.au/e-print/open/2007/etheridgedm_a.pdf (accessed on 29 March 2023).
- Etheridge, D.; Luhar, A.; Loh, Z.; Leuning, R.; Spencer, D.; Steele, P.; Zegelin, S.; Allison, C.; Krummel, P.; Leist, M.; et al. Atmospheric monitoring of the CO2CRC Otway Project and lessons for large scale CO2 storage projects. Energy Procedia 2011, 4, 3666–3675. [Google Scholar] [CrossRef] [Green Version]
- Aubinet, M.; Vesala, T.; Papale, D. (Eds.) Eddy Covariance: A Practical Guide to Measurement and Data Analysis; Springer: Dordrecht, The Netherlands, 2012. [Google Scholar] [CrossRef]
- Rixen, T.; Wit, F.; Hutahaean, H.; Schlüter, A.; Baum, A.; Klemme, A.; Müller, M.; Pranowo, W.S.; Samiaji, J.; Warneke, T. Carbon cycle in tropical peatlands and coastal seas. In Science for the Protection of Indonesian Coastal Ecosystems (SPICE); Elsevier: Amsterdam, The Netherlands, 2022. [Google Scholar] [CrossRef]
- Massman, W.; Lee, X. Eddy covariance flux corrections and uncertainties in long-term studies of carbon and energy exchanges. Agric. For. Meteorol. 2002, 113, 121–144. [Google Scholar] [CrossRef]
- Leuning, R.; King, K.M. Comparison of eddy-covariance measurements of CO2 fluxes by open- and closed-path CO2 analysers. Bound. Layer Meteorol. 1992, 59, 297–311. [Google Scholar] [CrossRef]
- Suyker, A.E.; Verma, S.B. Eddy correlation measurement of CO2 flux using a closed-path sensor: Theory and field tests against an open-path sensor. Bound. Layer Meteorol. 1993, 64, 391–407. [Google Scholar] [CrossRef]
- Lewicki, J.L.; Hilley, G.E.; Fischer, M.L.; Pana, L.; Oldenburg, C.M.; Dobeck, L.; Spangler, L. Detection of CO2 leakage by eddy covariance during the ZERT project’s CO2 release experiments. Energy Procedia 2009, 1, 2301–2306. [Google Scholar] [CrossRef] [Green Version]
- Whittaker, S.; Rostron, B.; Hawkes, C.; Gardner, C.; White, D.; Johnson, J.; Chalaturnyk, R.; Seeburger, D. A decade of CO2 injection into depleting oil fields: Monitoring and research activities of the IEA GHG Weyburn-Midale CO2 Monitoring and Storage Project. Energy Procedia 2011, 4, 6069–6076. [Google Scholar] [CrossRef] [Green Version]
- Emberley, S.; Hutcheon, I.; Shevalier, M.; Durocher, K.; Gunter, W.; Perkins, E. Geochemical monitoring of fluid-rock interaction and CO2 storage at the Weyburn CO2-injection enhanced oil recovery site, Saskatchewan, Canada. Energy 2004, 29, 1393–1401. [Google Scholar] [CrossRef]
- Sayegh, S.G.; Krause, F.F.; Girard, M.; DeBree, C. Rock/Fluid Interactions of Carbonated Brines in a Sandstone Reservoir: Pembina Cardium, Alberta, Canada. SPE Form. Eval. 1990, 5, 399–405. [Google Scholar] [CrossRef]
- May, F.; Waldmann, S. Tasks and challenges of geochemical monitoring. Greenh. Gases Sci. Technol. 2014, 4, 176–190. [Google Scholar] [CrossRef]
- Freifeld, B.M.; Trautz, R.C. Real-time quadrupole mass spectrometer analysis of gas in borehole fluid samples acquired using the U-tube sampling methodology. Geofluids 2006, 6, 217–224. [Google Scholar] [CrossRef] [Green Version]
- Zimmer, M.; Erzinger, J.; Kujawa, C. The gas membrane sensor (GMS): A new method for gas measurements in deep boreholes applied at the CO2SINK site. Int. J. Greenh. Gas Control 2011, 5, 995–1001. [Google Scholar] [CrossRef]
- McColpin, G.R. Surface Deformation Monitoring As a Cost Effective MMV Method. Energy Procedia 2009, 1, 2079–2086. [Google Scholar] [CrossRef] [Green Version]
- Du, J.; Brissenden, S.J.; McGillivray, P.; Bourne, S.; Hofstra, P.; Davis, E.J.; Roadarmel, W.H.; Wolhart, S.L.; Wright, C.A. Mapping Fluid Flow in a Reservoir Using Tiltmeter-Based Surface-Deformation Measurements. In Proceedings of the SPE Annual Technical Conference and Exhibition, Dallas, TX, USA, 9–12 October 2005. [Google Scholar] [CrossRef]
- Harbert, W.; Daley, T.M.; Bromhal, G.; Sullivan, C.; Huang, L. Progress in monitoring strategies for risk reduction in geologic CO2 storage. Int. J. Greenh. Gas Control 2016, 51, 260–275. [Google Scholar] [CrossRef] [Green Version]
- Hu, B.; Li, H.; Zhang, X.; Fang, L. Oil and Gas Mining Deformation Monitoring and Assessments of Disaster: Using Interferometric Synthetic Aperture Radar Technology. IEEE Geosci. Remote Sens. Mag. 2020, 8, 108–134. [Google Scholar] [CrossRef]
- Vasco, D.W.; Dixon, T.H.; Ferretti, A.; Samsonov, S.V. Monitoring the fate of injected CO2 using geodetic techniques. Geophysics 2020, 39, 29–37. [Google Scholar] [CrossRef] [Green Version]
- Vasco, D.W.; Rucci, A.; Ferretti, A.; Novali, F.; Bissell, R.C.; Ringrose, P.S.; Mathieson, A.S.; Wright, I.W. Satellite-Based Measurements of Surface Deformation Reveal Fluid Flow Associated with the Geological Storage of Carbon Dioxide. Geophys. Res. Lett. 2010, 37. [Google Scholar] [CrossRef] [Green Version]
- US EPA. Class VI—Wells used for Geologic Sequestration of Carbon Dioxide. 12 September 2022. Available online: https://www.epa.gov/uic/class-vi-wells-used-geologic-sequestration-carbon-dioxide (accessed on 29 March 2023).
- Freifeld, B.M.; Daley, T.M.; Hovorka, S.D.; Henninges, J.; Underschultz, J.; Sharma, S. Recent advances in well-based monitoring of CO2 sequestration. Energy Procedia 2009, 1, 2277–2284. [Google Scholar] [CrossRef] [Green Version]
- Gould, J.; Wackier, J.; Quirein, J.; Watson, J. CO2 Monitor Logging: East Mallet Unit, Slaughter Field, Hockley County, TX, USA. In Proceedings of the SPWLA 32nd Annual Logging Symposium, Midland, TX, USA, 16–19 June 1991. [Google Scholar]
- Müller, N.; Ramakrishnan, T.; Boyd, A.; Sakruai, S. Time-lapse carbon dioxide monitoring with pulsed neutron logging. Int. J. Greenh. Gas Control 2007, 1, 456–472. [Google Scholar] [CrossRef]
- Mito, S.; Xue, Z. Post-Injection monitoring of stored CO2 at the Nagaoka pilot site: 5 years time-lapse well logging results. Energy Procedia 2011, 4, 3284–3289. [Google Scholar] [CrossRef] [Green Version]
- Xue, Z.; Tanase, D.; Watanabe, J. Estimation of CO2 Saturation from Time-Lapse CO2 well Logging in an Onshore Aquifer, Nagaoka, Japan. Explor. Geophys. 2006, 37, 19–29. [Google Scholar] [CrossRef]
- Sakurai, S.; Ramakrishnan, T.S.; Boyd, A.; Mueller, N.; Hovorka, S. Monitoring Saturation Changes for CO2 Sequestration: Petrophysical Support of the Frio Brine Pilot Experiment. Petrophysics-SPWLA J. Form. Eval. Reserv. Descr. 2006, 47. [Google Scholar]
- Freifeld, B.; Daley, T.; Cook, P.; Trautz, R.; Dodds, K. The Modular Borehole Monitoring Program: A research program to optimize well-based monitoring for geologic carbon sequestration. Energy Procedia 2014, 63, 3500–3515. [Google Scholar] [CrossRef] [Green Version]
- Daley, T.; Miller, D.; Dodds, K.; Cook, P.; Freifeld, B. Field testing of modular borehole monitoring with simultaneous distributed acoustic sensing and geophone vertical seismic profiles at Citronelle, Alabama. Geophys. Prospect. 2016, 64, 1318–1334. [Google Scholar] [CrossRef] [Green Version]
- Liebscher, A.; Möller, F.; Bannach, A.; Köhler, S.; Wiebach, J.; Schmidt-Hattenberger, C.; Weiner, M.; Pretschner, C.; Ebert, K.; Zemke, J. Injection operation and operational pressure–temperature monitoring at the CO2 storage pilot site Ketzin, Germany—Design, results, recommendations. Int. J. Greenh. Gas Control 2013, 15, 163–173. [Google Scholar] [CrossRef] [Green Version]
- Henninges, J.; Zimmermann, G.; Büttner, G.; Schrötter, J.; Erbas, K.; Huenges, E. Wireline Distributed Temperature Measurements and Permanent Installations Behind Casing. In Proceedings of the World Geothermal Congress, Antalya, Turkey, 24–29 April 2005. [Google Scholar]
- Würdemann, H.; Möller, F.; Kühn, M.; Heidug, W.; Christensen, N.P.; Borm, G.; Schilling, F.R. CO2SINK—From site characterisation and risk assessment to monitoring and verification: One year of operational experience with the field laboratory for CO2 storage at Ketzin, Germany. Int. J. Greenh. Gas Control 2010, 4, 938–951. [Google Scholar] [CrossRef] [Green Version]
- Sato, K.; Mito, S.; Horie, T.; Ohkuma, H.; Saito, H.; Watanabe, J.; Yoshimura, T. Monitoring and simulation studies for assessing macro- and meso-scale migration of CO2 sequestered in an onshore aquifer: Experiences from the Nagaoka pilot site, Japan. Int. J. Greenh. Gas Control 2011, 5, 125–137. [Google Scholar] [CrossRef]
- Burgess, K.A.; MacDougall, T.D.; Siegfried, R.W.; Fields, T.G. Wireline-Conveyed Through-Casing Formation Tester Preserves Casing Integrity. In Proceedings of the SPE Eastern Regional Meeting, Canton, OH, USA, 17–19 October 2001. [Google Scholar]
- Myers, M.; Stalker, L.; Pejcic, B.; Ross, A. Tracers—Past, present and future applications in CO2 geosequestration. Appl. Geochem. 2013, 30, 125–135. [Google Scholar] [CrossRef]
- Rein, E.; Schulz, L.K. Applications of natural gas tracers in the detection of reservoir compartmentalisation and production monitoring. J. Pet. Sci. Eng. 2007, 58, 428–442. [Google Scholar] [CrossRef]
- Chandrasekharan, P.; Tay, Z.W.; Zhou, X.Y.; Yu, E.; Orendorff, R.; Hensley, D.; Huynh, Q.; Fung, K.L.B.; VanHook, C.C.; Goodwill, P.; et al. A perspective on a rapid and radiation-free tracer imaging modality, magnetic particle imaging, with promise for clinical translation. Br. J. Radiol. 2018, 91, 20180326. [Google Scholar] [CrossRef]
- Hassoun, S.; McBride, T.; Russell, D.A. Development of perfluorocarbon tracer technology for underground leak location. J. Environ. Monit. 2000, 2, 432–435. [Google Scholar] [CrossRef]
- Dugstad, Ø.; Bjørnstad, T.; Hundere, I.A. Measurements of gas tracer retention under simulated reservoir conditions. J. Pet. Sci. Eng. 1993, 10, 17–25. [Google Scholar] [CrossRef]
- Galdiga, C.U.; Greibrokk, T. Ultra trace detection of perfluorocarbon tracers in reservoir gases by adsorption/thermal desorption in combination with NICI-GC/MS. Anal. Bioanal. Chem. 2000, 367, 43–50. [Google Scholar] [CrossRef]
- Tomich, J.F.; Dalton, R.J.; Deans, H.A.; Shallenberger, L.K. Single-Well Tracer Method To Measure Residual Oil Saturation. J. Pet. Technol. 1973, 25, 211–218. [Google Scholar] [CrossRef]
- Khaledialidusti, R.; Kleppe, J.; Skrettingland, K. Numerical Interpretation of Single Well Chemical Tracer (SWCT) Tests to Determine Residual Oil Saturation in Snorre Reservoir. In Proceedings of the EUROPEC 2015, Madrid, Spain, 1–4 June 2015. [Google Scholar] [CrossRef]
- Du, Y.; Guan, L. Interwell Tracer Tests: Lessons Learned from Past Field Studies. In Proceedings of the SPE Asia Pacific Oil and Gas Conference and Exhibition, Jakarta, Indonesia, 5–7 April 2005; p. 9. [Google Scholar]
- Stalker, L.; Boreham, C.; Perkins, E. A Review of Tracers in Monitoring CO2 Breakthrough: Properties, Uses, Case Studies, and Novel Tracers; AAPG: Tulsa, OK, USA, 2009; p. 14. [Google Scholar]
- Wells, A.W.; Diehl, J.R.; Bromhal, G.; Strazisar, B.R.; Wilson, T.H.; White, C.M. The use of tracers to assess leakage from the sequestration of CO2 in a depleted oil reservoir, New Mexico, USA. Appl. Geochem. 2007, 22, 996–1016. [Google Scholar] [CrossRef]
- Vandeweijer, V.; van der Meer, B.; Hofstee, C.; Mulders, F.; D’Hoore, D.; Graven, H. Monitoring the CO2 injection site: K12-B. Energy Procedia 2011, 4, 5471–5478. [Google Scholar] [CrossRef] [Green Version]
- Daley, T.M.; Myer, L.R.; Peterson, J.E.; Majer, E.L.; Hoversten, G.M. Time-lapse crosswell seismic and VSP monitoring of injected CO2 in a brine aquifer. Environ. Geol. 2008, 54, 1657–1665. [Google Scholar] [CrossRef] [Green Version]
- Lawton, D.; Couëslan, M.; Bland, H.; Jones, M. Seismic Survey Design for Monitoring CO2 Storage: Integrated Multicomponent Surface and Borehole Seismic Surveys, Penn West Pilot, Alberta, Canada. In Proceedings of the 8th International Conference on Greenhouse Gas Control Technologies, Trondheim, Norway, 19–22 June 2006. [Google Scholar]
- Saito, H.; Nobuoka, D.; Azuma, H.; Xue, Z.; Tanase, D. Time-Lapse Crosswell Seismic Tomography for Monitoring Injected CO2 in an Onshore Aquifer, Nagaoka, Japan. Explor. Geophys. 2006, 37, 30–36. [Google Scholar] [CrossRef]
- Nalonnil, A.; Marion, B. High-Resolution Reservoir Monitoring Using Crosswell Seismic. SPE Reserv. Eval. Eng. 2012, 15, 25–30. [Google Scholar] [CrossRef]
- Zhang, W.; Youn, S.; Doan, Q.T. Understanding Reservoir Architectures and Steam-Chamber Growth at Christina Lake, Alberta, by Using 4D Seismic and Crosswell Seismic Imaging. SPE Reserv. Eval. Eng. 2007, 10, 446–452. [Google Scholar] [CrossRef]
- Sambo, C.; Iferobia, C.C.; Babasafari, A.A.; Rezaei, S.; Akanni, O.A. The Role of Time Lapse(4D) Seismic Technology as Reservoir Monitoring and Surveillance Tool: A Comprehensive Review. J. Nat. Gas Sci. Eng. 2020, 80, 103312. [Google Scholar] [CrossRef]
- Chadwick, R.; Arts, R.; Eiken, O.; Kirby, G.A.; Lindeberg, E.; Zweigel, P. 4D Seismic Imaging of an Injected CO2 Plume at the Sleipner Field, Central North Sea. Geol. Soc. Lond. Mem. 2004, 29, 311–320. [Google Scholar] [CrossRef] [Green Version]
- Watanabe, S.; Han, J.; Hetz, G.; Datta-Gupta, A.; King, M.J.; Vasco, D.W. Streamline-Based Time-Lapse-Seismic-Data Integration Incorporating Pressure and Saturation Effects. SPE J. 2017, 22, 1261–1279. [Google Scholar] [CrossRef] [Green Version]
- Liang, C.; O’Reilly, O.; Dunham, E.M.; Moos, D. Hydraulic fracture diagnostics from Krauklis-wave resonance and tube-wave reflections. Geophysics 2017, 82, D171–D186. [Google Scholar] [CrossRef] [Green Version]
- Shih, P.-J.R.; Frehner, M. Laboratory Evidence for Krauklis Wave Resonance in Fractures. Geophysics 2015, 81, T285–T293. [Google Scholar] [CrossRef] [Green Version]
- Djuraev, U.; Jufar, S.R.; Vasant, P. A review on conceptual and practical oil and gas reservoir monitoring methods. J. Pet. Sci. Eng. 2017, 152, 586–601. [Google Scholar] [CrossRef]
- Frehner, M. Krauklis Wave Initiation in Fluid-Filled Fractures by a Passing Body Wave. In Proceedings of the Poromechanics V: Proceedings of the Fifth Biot Conference on Poromechanics, Vienna, Austria, 10–12 July 2013; pp. 92–100. [Google Scholar] [CrossRef] [Green Version]
- Cao, H. Physical Modeling of the Krauklis Waves: Insights from two Experimental Apparatuses. Diploma Thesis, Michigan Technological University, Houghton, MI, USA, 2020. [Google Scholar] [CrossRef]
- Burnison, S.A. Field Demonstration of CO2 Injection Monitoring Using Krauklis and Other Guided Waves; EERC: Grand Forks, ND, USA, 2018. [Google Scholar]
- Davis, T.L.; Landrø, M.; Wilson, M. (Eds.) Geophysics and Geosequestration; Cambridge University Press: Cambridge, UK, 2019. [Google Scholar]
- Carrigan, C.R.; Yang, X.; LaBrecque, D.J.; Larsen, D.; Freeman, D.; Ramirez, A.L.; Daily, W.; Aines, R.; Newmark, R.; Friedmann, J.; et al. Electrical resistance tomographic monitoring of CO2 movement in deep geologic reservoirs. Int. J. Greenh. Gas Control 2013, 18, 401–408. [Google Scholar] [CrossRef]
- Daily, W.; Ramirez, A.; Labrecque, D.; Nitao, J. Electrical resistivity tomography of vadose water movement. Water Resour. Res. 1992, 28, 1429–1442. [Google Scholar] [CrossRef]
- Karhunen, K.; Seppänen, A.; Lehikoinen, A.; Monteiro, P.J.; Kaipio, J.P. Electrical Resistance Tomography imaging of concrete. Cem. Concr. Res. 2010, 40, 137–145. [Google Scholar] [CrossRef]
- Ramirez, A.; Daily, W.; Labrecque, D.; Owen, E.; Chesnut, D. Monitoring an underground steam injection process using electrical resistance tomography. Water Resour. Res. 1993, 29, 73–87. [Google Scholar] [CrossRef]
- Kiessling, D.; Schmidt-Hattenberger, C.; Schuett, H.; Schilling, F.; Krueger, K.; Schoebel, B.; Danckwardt, E.; Kummerow, J. Geoelectrical methods for monitoring geological CO2 storage: First results from cross-hole and surface–downhole measurements from the CO2SINK test site at Ketzin (Germany). Int. J. Greenh. Gas Control 2010, 4, 816–826. [Google Scholar] [CrossRef]
- Schmidt-Hattenberger, C.; Bergmann, P.; Labitzke, T.; Wagner, F.; Rippe, D. Permanent crosshole electrical resistivity tomography (ERT) as an established method for the long-term CO2 monitoring at the Ketzin pilot site. Int. J. Greenh. Gas Control 2016, 52, 432–448. [Google Scholar] [CrossRef]
- Strickland, C.E.; Vermeul, V.R.; Bonneville, A.; Sullivan, E.C.; Johnson, T.C.; Spane, F.A.; Gilmore, T.J. Geophysical Monitoring Methods Evaluation for the FutureGen 2.0 Project. Energy Procedia 2014, 63, 4394–4403. [Google Scholar] [CrossRef] [Green Version]
- von Hebel, C.; Rudolph, S.; Mester, A.; Huisman, J.A.; Kumbhar, P.; Vereecken, H.; van der Kruk, J. Three-dimensional imaging of subsurface structural patterns using quantitative large-scale multiconfiguration electromagnetic induction data. Water Resour. Res. 2014, 50, 2732–2748. [Google Scholar] [CrossRef] [Green Version]
- Ayani, M.; Grana, D.; Liu, M. Stochastic inversion method of time-lapse controlled source electromagnetic data for CO2 plume monitoring. Int. J. Greenh. Gas Control 2020, 100, 103098. [Google Scholar] [CrossRef]
- Nabighian, M.N.; Ander, M.E.; Grauch, V.J.S.; Hansen, R.O.; LaFehr, T.R.; Li, Y.; Pearson, W.C.; Peirce, J.W.; Phillips, J.; Ruder, M.E. Historical development of the gravity method in exploration. Geophysics 2005, 70, 63ND–89ND. [Google Scholar] [CrossRef] [Green Version]
- Gasperikova, E.; Hoversten, G.M. Gravity monitoring of CO2 movement during sequestration: Model studies. Geophysics 2008, 73, WA105–WA112. [Google Scholar] [CrossRef] [Green Version]
- Nooner, S.L.; Eiken, O.; Hermanrud, C.; Sasagawa, G.S.; Stenvold, T.; Zumberge, M.A. Constraints on the in situ density of CO2 within the Utsira formation from time-lapse seafloor gravity measurements. Int. J. Greenh. Gas Control 2007, 1, 198–214. [Google Scholar] [CrossRef]
- Fabriol, H.; Bitri, A.; Bourgeois, B.; Delatre, M.; Girard, J.; Pajot, G.; Rohmer, J. Geophysical methods for CO2 plume imaging: Comparison of performances. Energy Procedia 2011, 4, 3604–3611. [Google Scholar] [CrossRef] [Green Version]
- Sugihara, M.; Nawa, K.; Nishi, Y.; Ishido, T.; Soma, N. Continuous Gravity Monitoring for CO2 Geo-sequestration. Energy Procedia 2013, 37, 4302–4309. [Google Scholar] [CrossRef] [Green Version]
- Power Engineering. Glitter-Sized Sensors That Detect CO2 Leaks at Storage Sites. 19 December 2022. Available online: https://www.power-eng.com/coal/glitter-sized-sensors-that-detect-co2-leaks-at-storage-sites/ (accessed on 29 March 2023).
- Sandia National Laboratories. Surveilling Carbon Sequestration: A Smart Collar to Sense Leaks. 13 December 2022. Available online: https://newsreleases.sandia.gov/smart_collar/ (accessed on 29 March 2023).
- University of Wyoming. SER Researcher Charles Nye Conducts Collaborative Soil Gas Sampling to Advance Wyoming CarbonSAFE Project. 4 September 2021. Available online: http://www.uwyo.edu/ser/news/2021/04/soil-gas-monitoring.html (accessed on 29 March 2023).
- Gonzalez, K.; Misra, S. Unsupervised learning monitors the carbon-dioxide plume in the subsurface carbon storage reservoir. Expert Syst. Appl. 2022, 201, 117216. [Google Scholar] [CrossRef]
- Ridley, K.; de Villiers, G.; Vovrosh, J.; Vincent, C.; Wilkinson, P.; Holynski, M. Quantum Technology Based Gravity and Gravity Gradiometry as a Tool for CCS Monitoring and Investigation. In Proceedings of the 16th Greenhouse Gas Control Technologies Conference (GHGT-16), Lyon, France, 23–27 October 2022. [Google Scholar] [CrossRef]
- White House. FACT SHEET: President Biden Sets 2030 Greenhouse Gas Pollution Reduction Target Aimed at Creating Good-Paying Union Jobs and Securing U.S. Leadership on Clean Energy Technologies; U.S. White House: Washington, DC, USA, 2021.


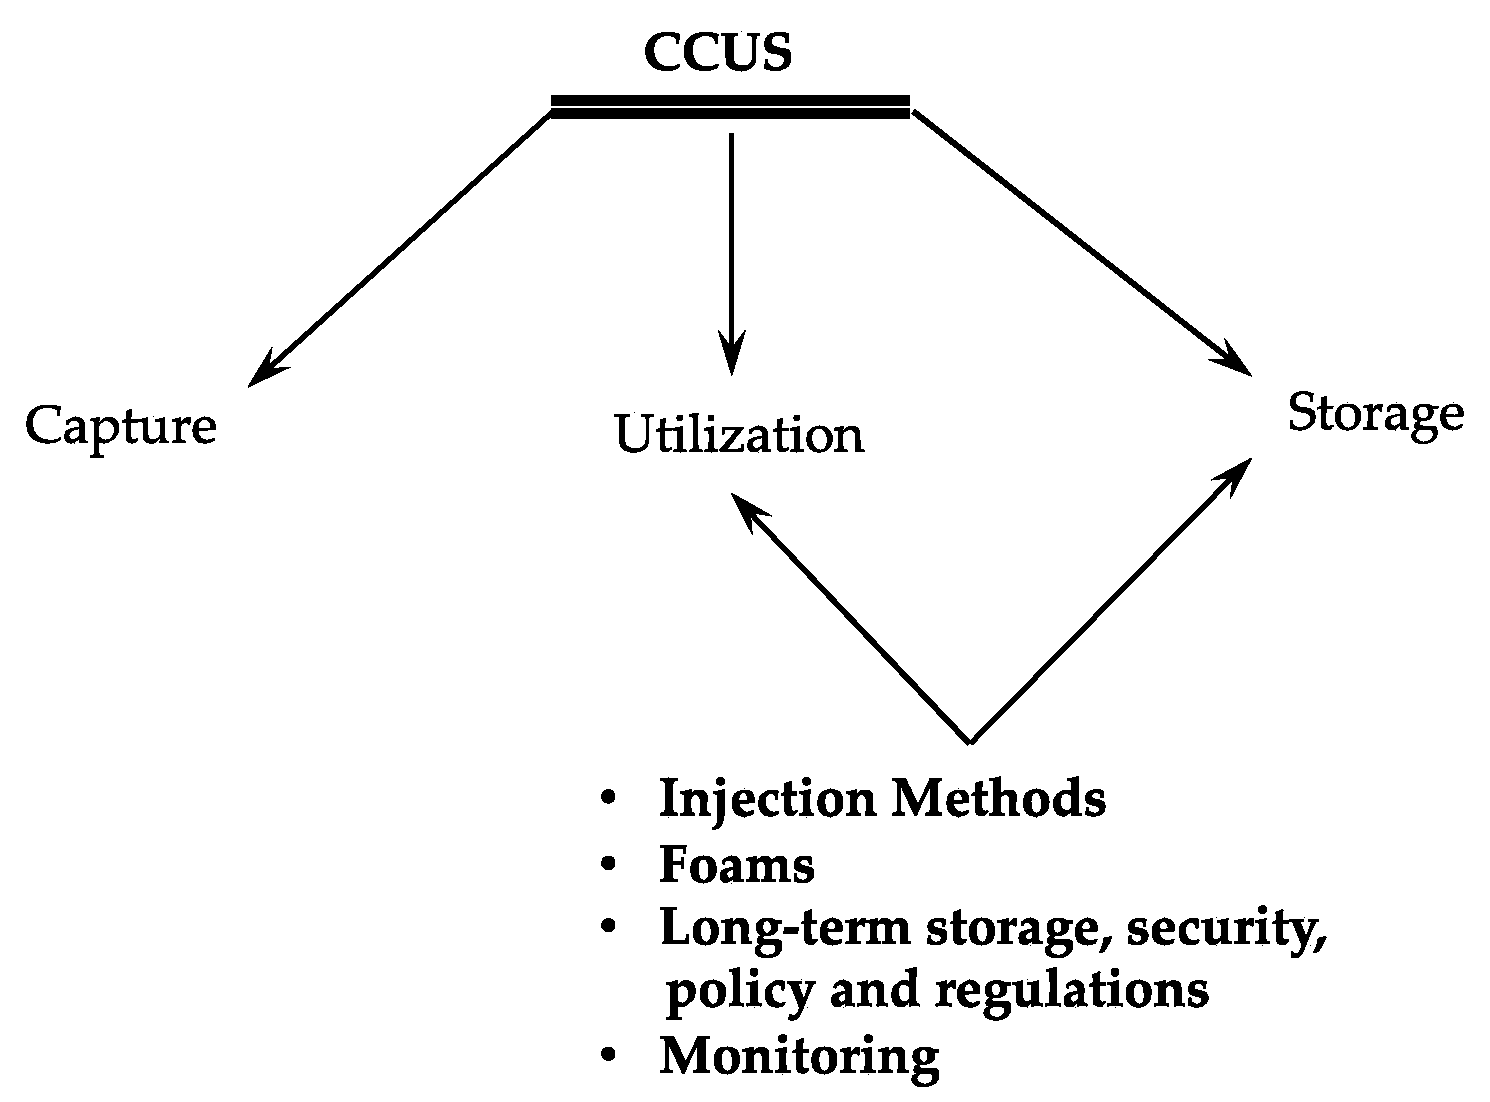
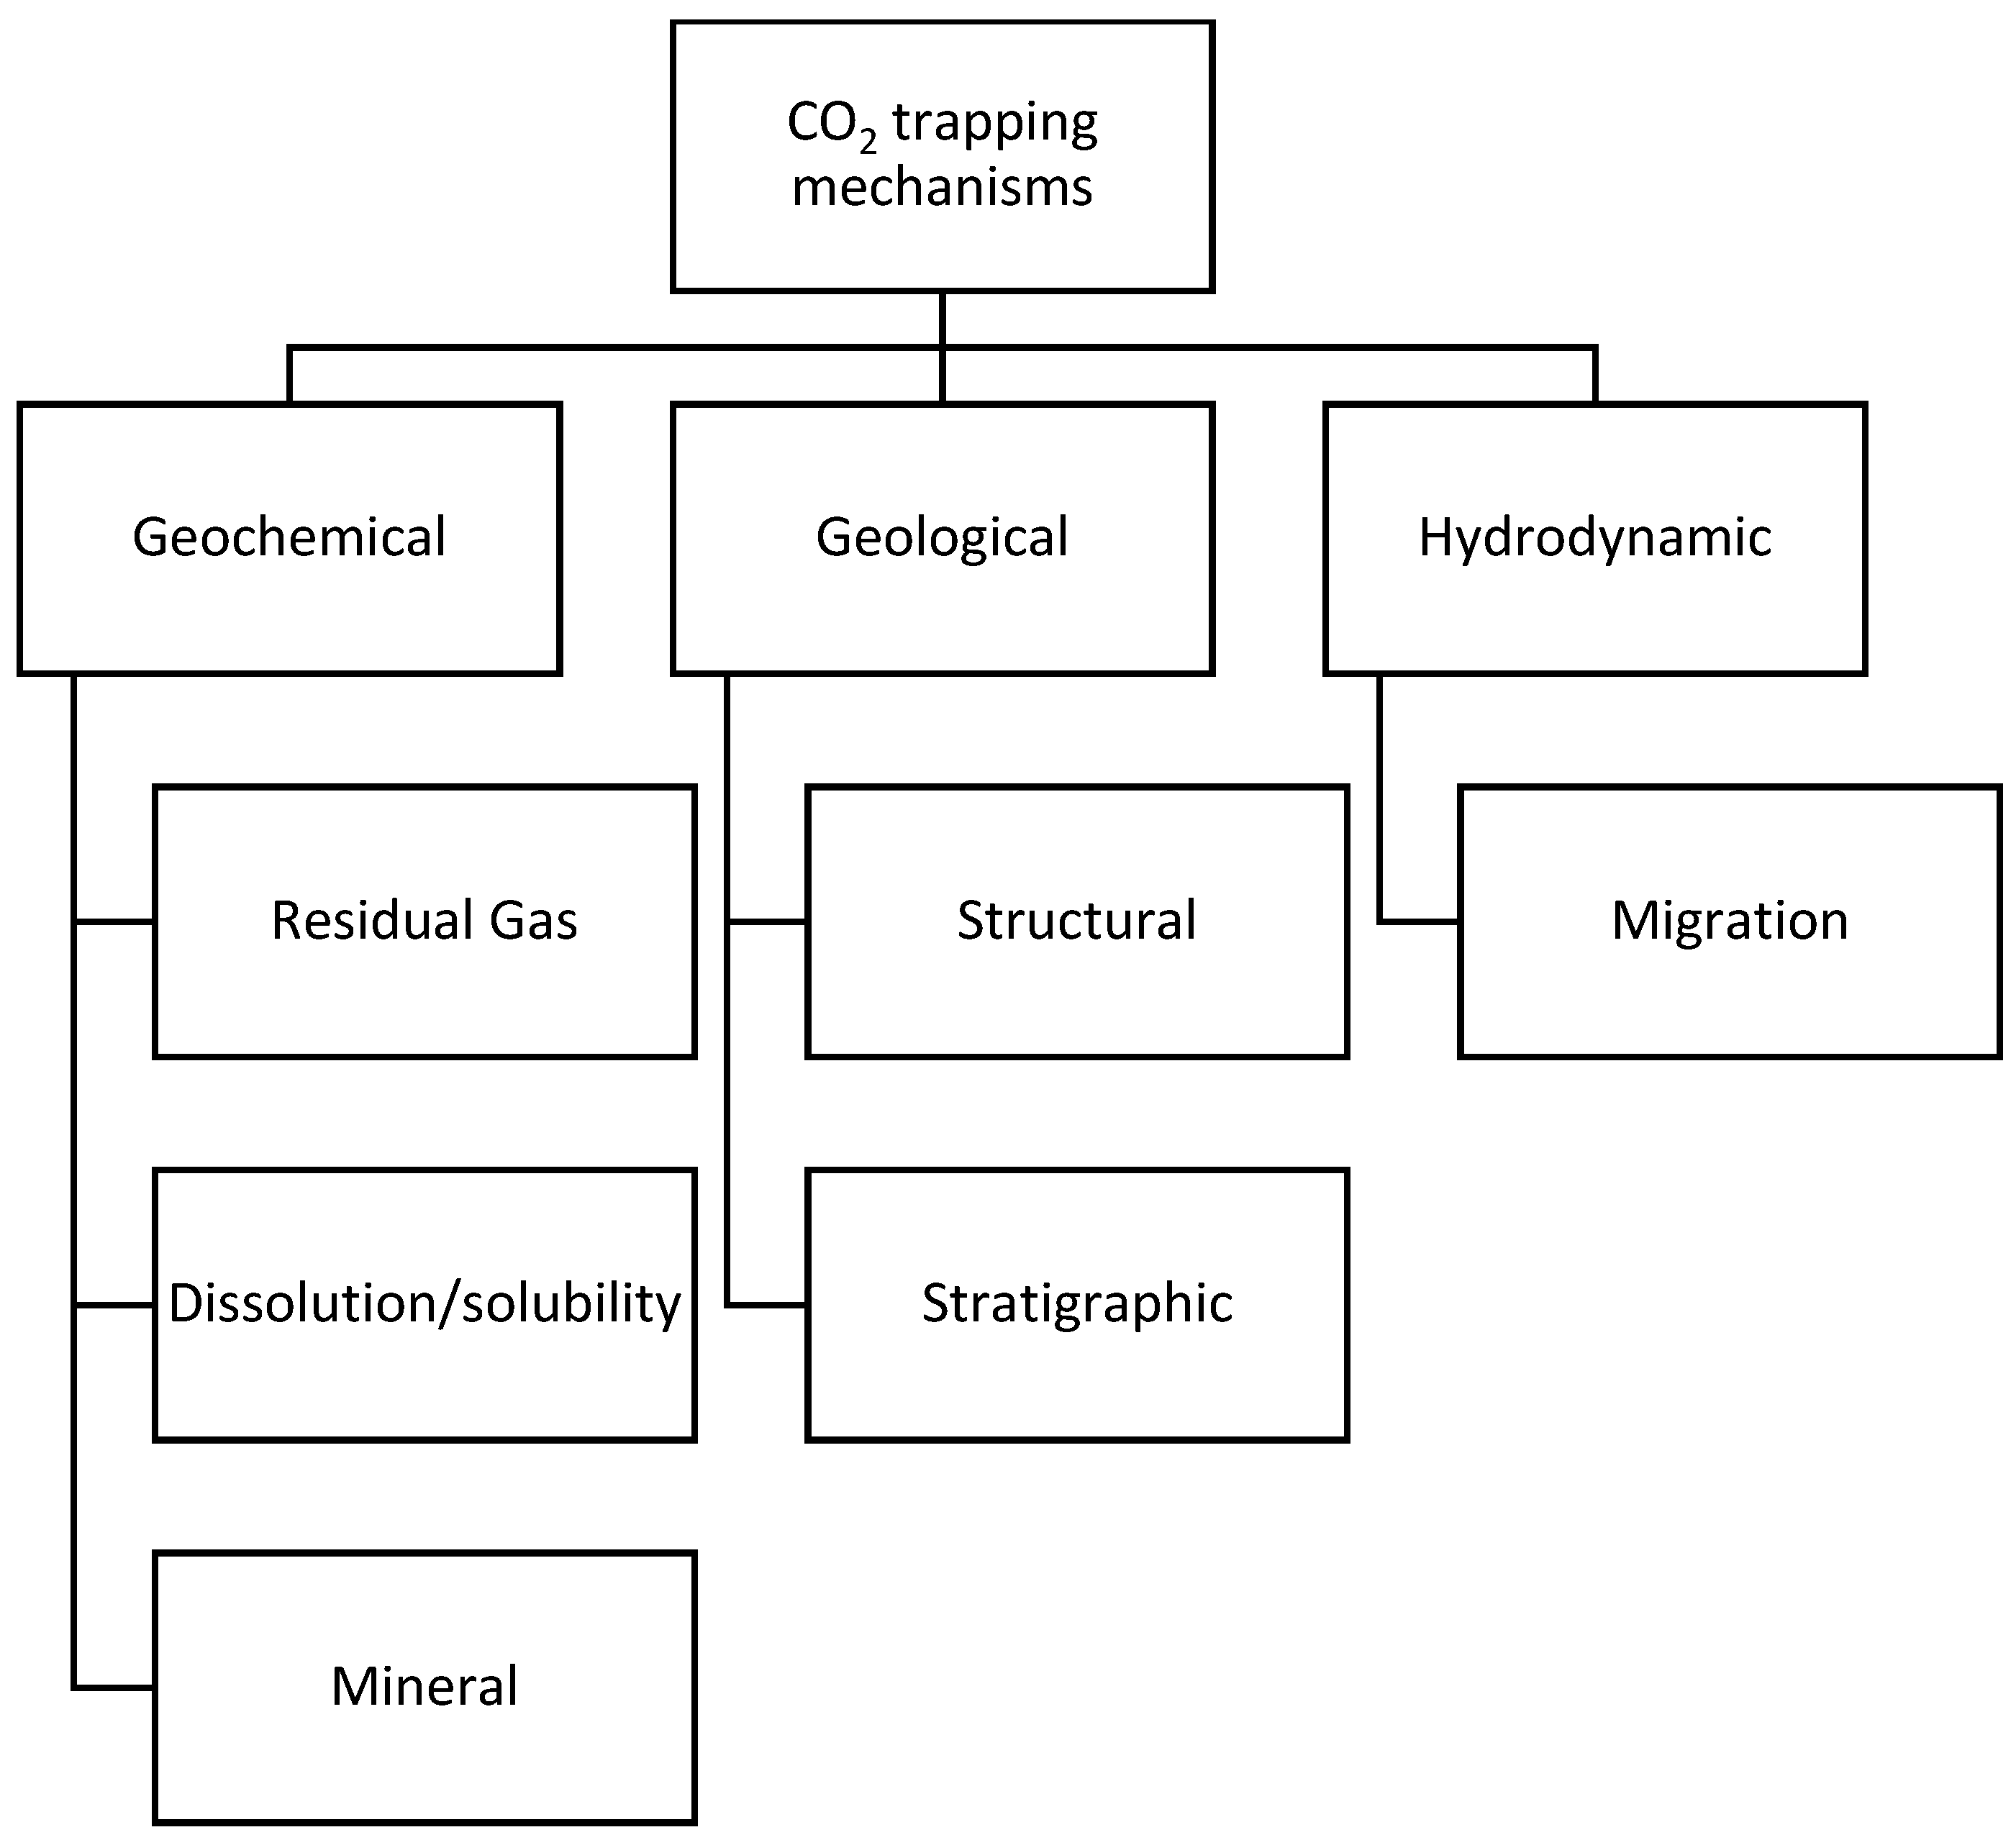
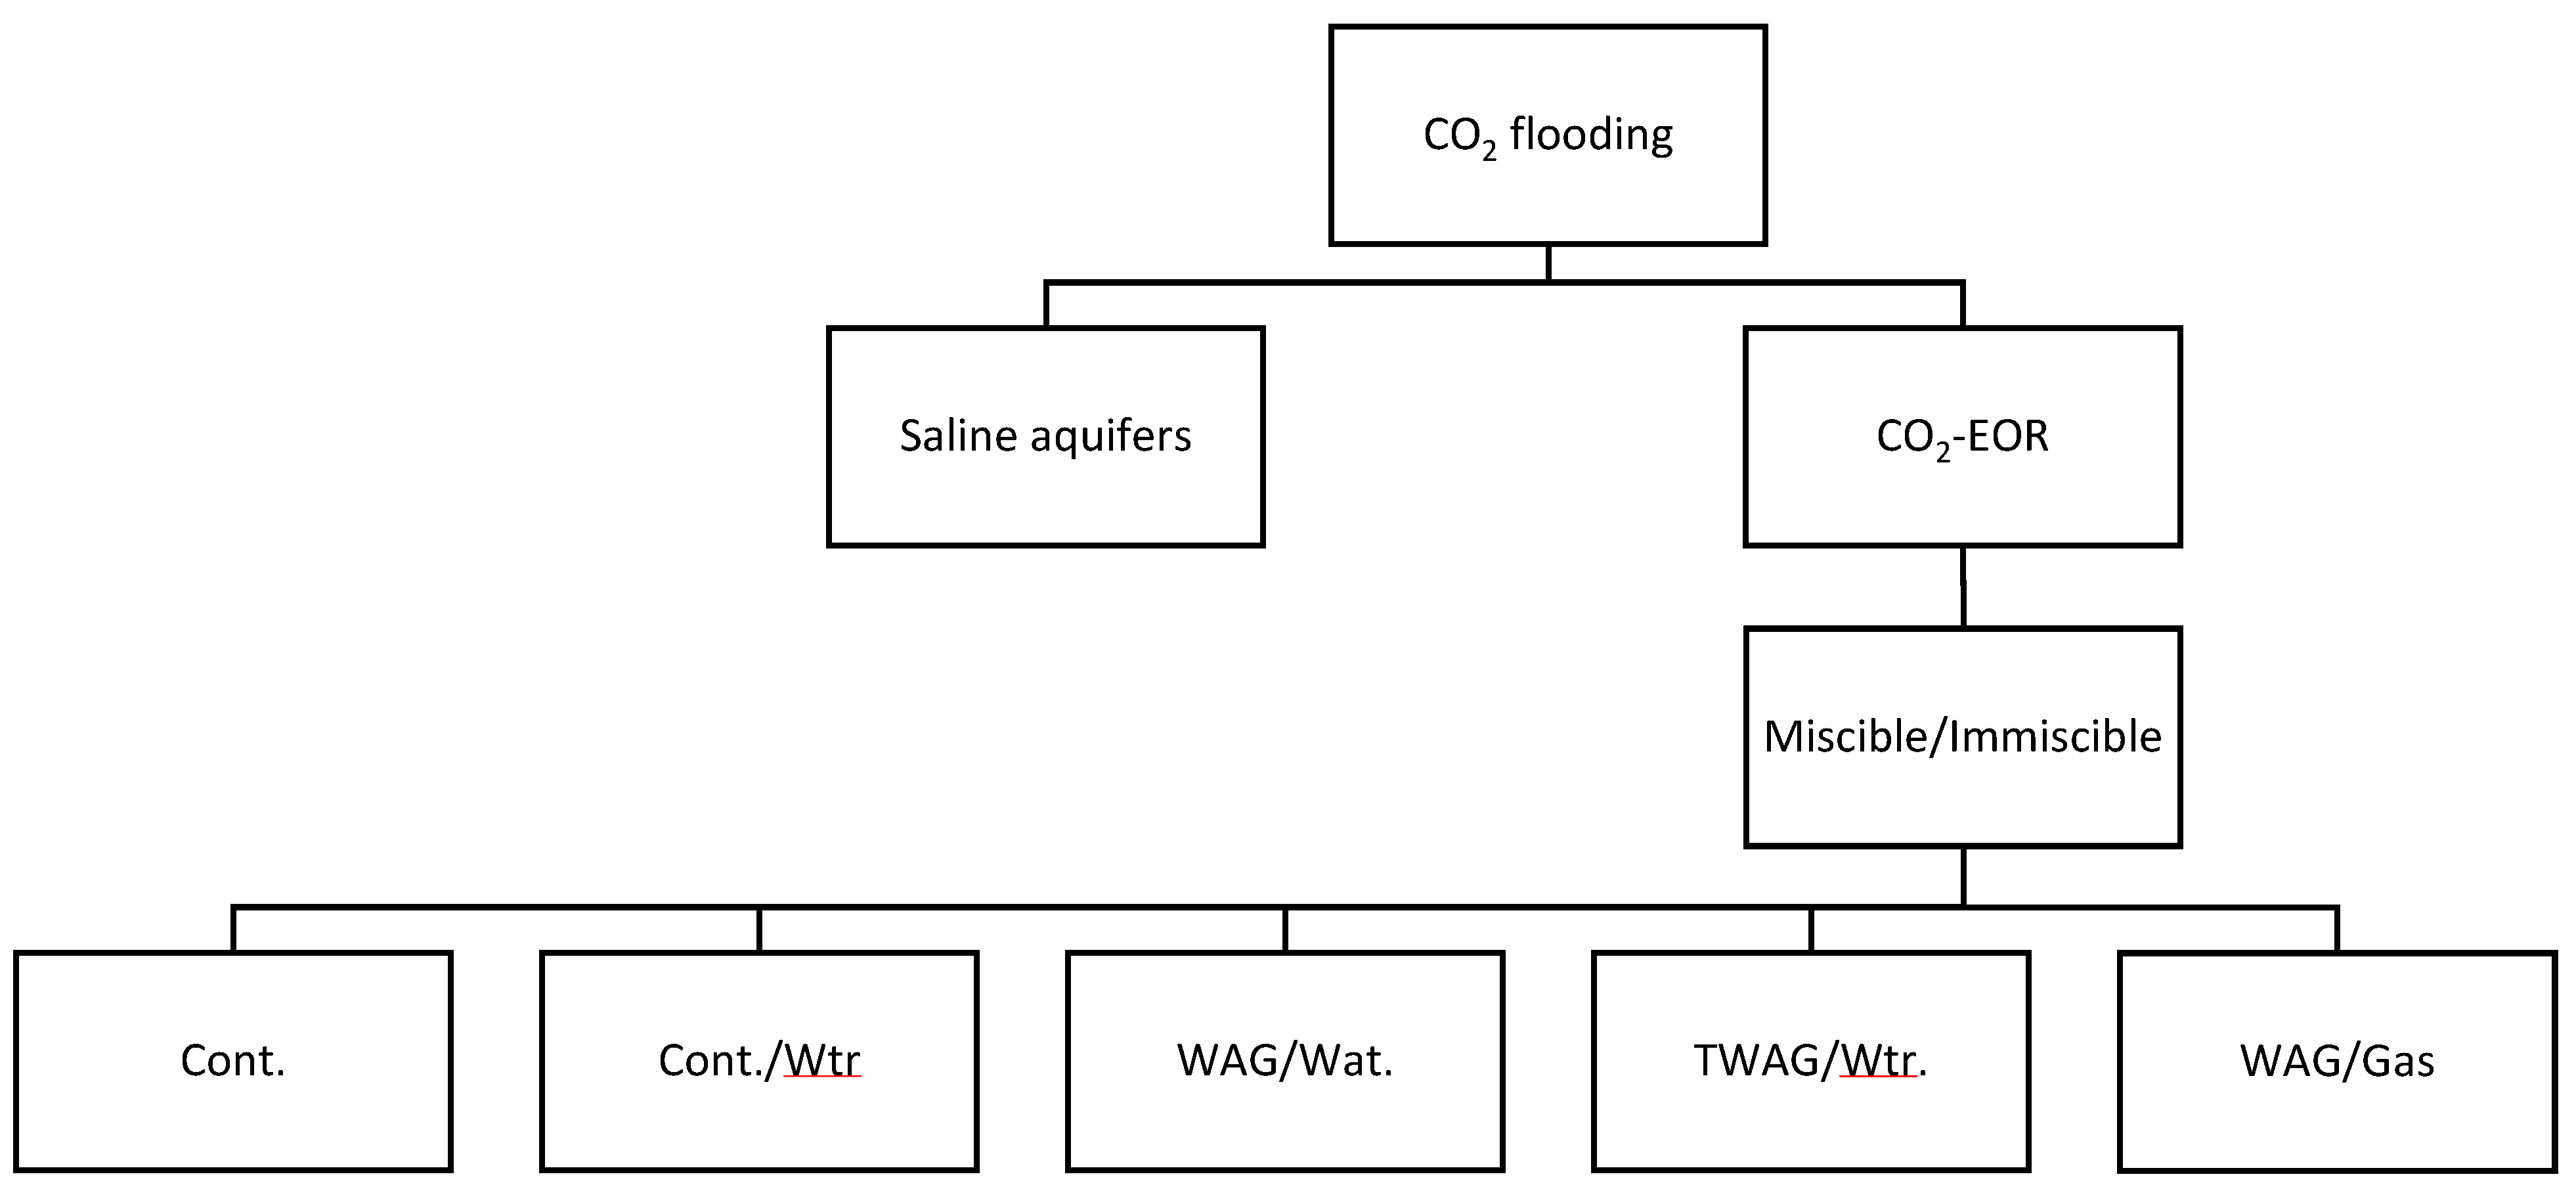
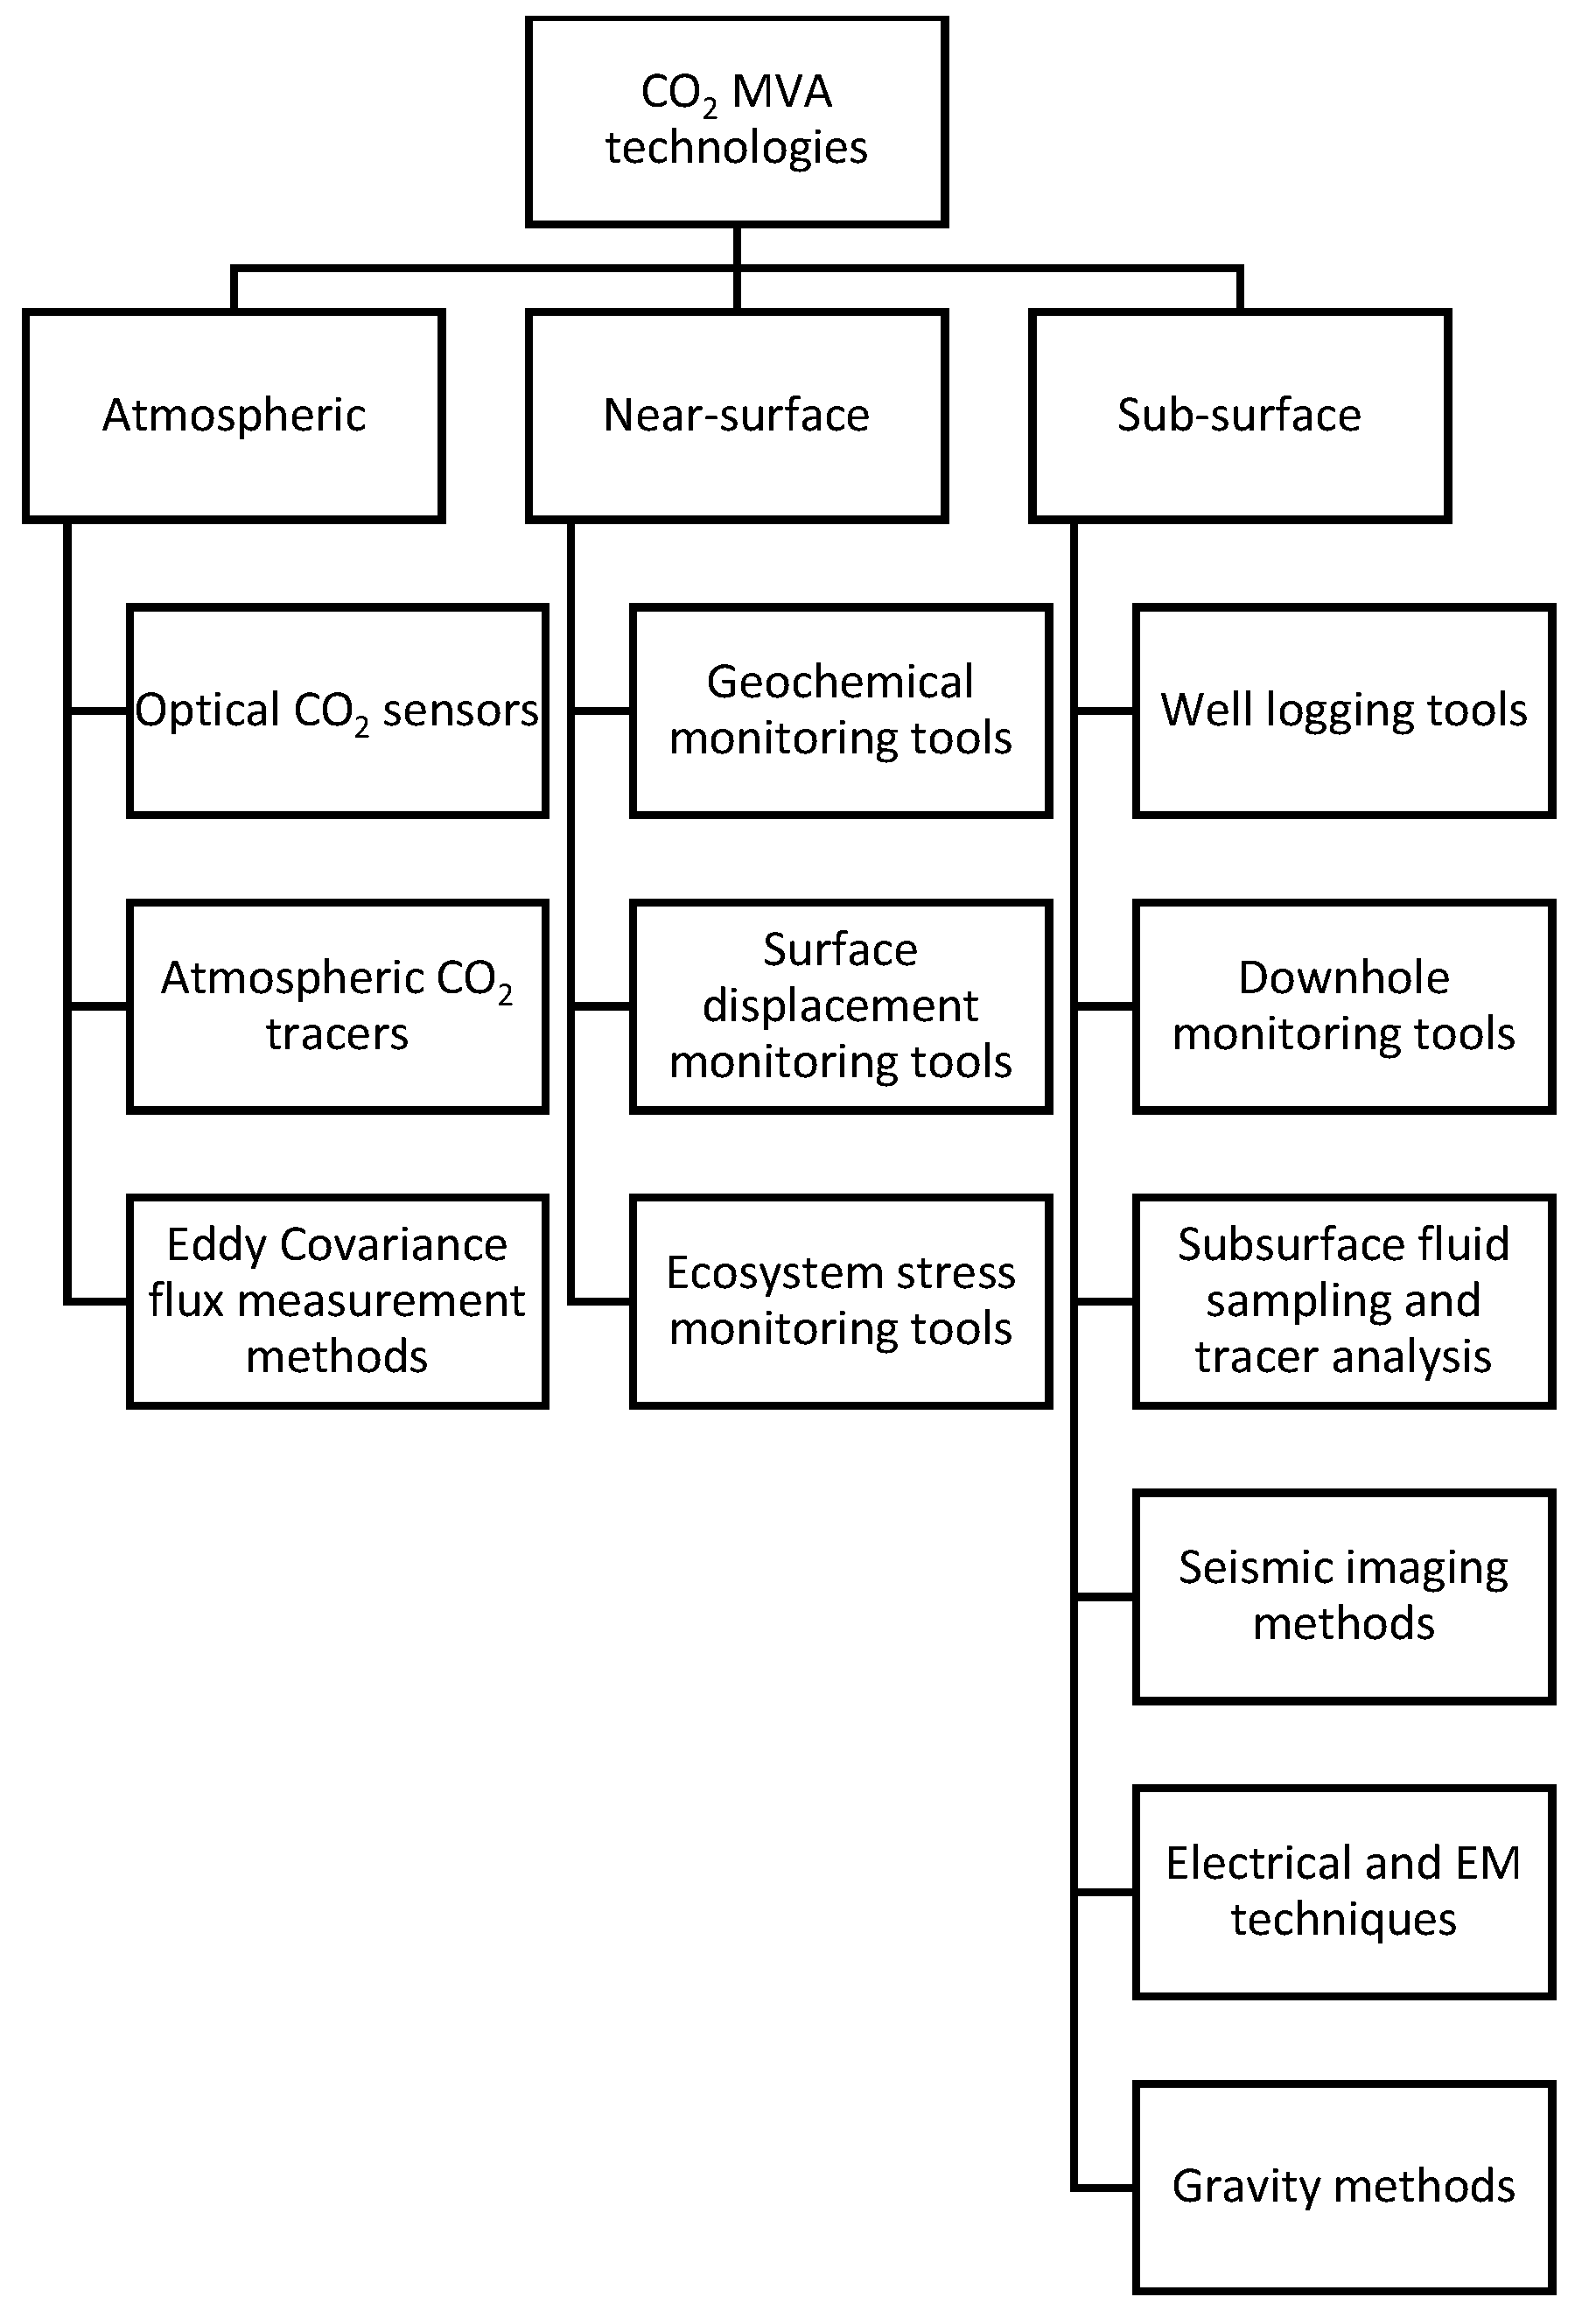
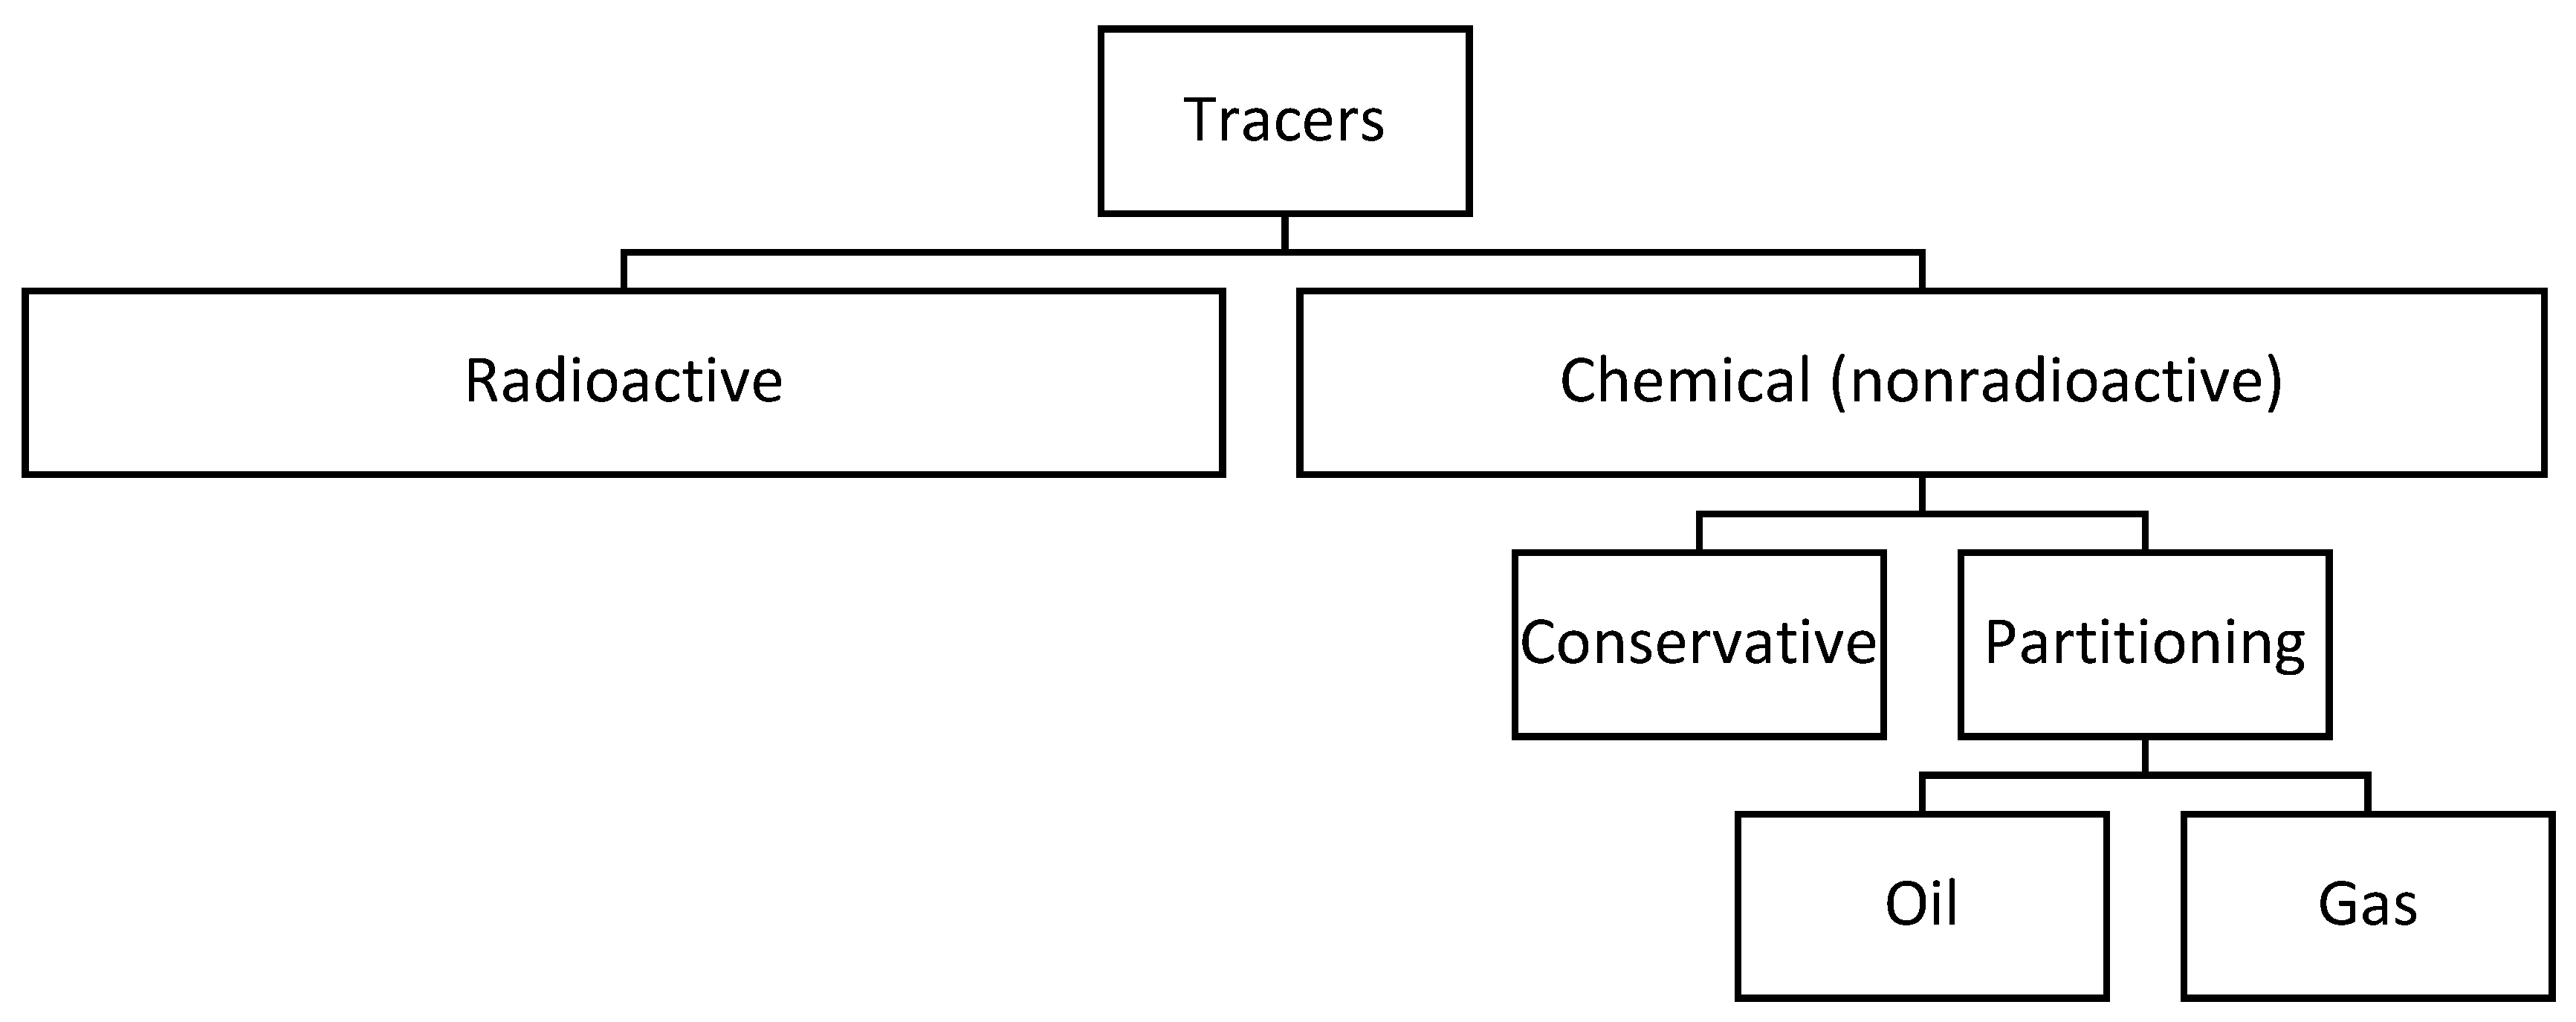
| Well Class | Description | Examples | Requirements | |
|---|---|---|---|---|
| Class I | Industrial and municipal waste disposal |
|
| |
| Class II | Oil-and-gas-related injection wells |
|
| |
| Class III | Mining solution wells |
|
| |
| Class IV | Shallow hazardous and radioactive injection wells | The EPA banned the use of these wells in 1984 | ||
| Class V | Underground injection wells of non-hazardous fluids | Shallow wells |
| Operation of these wells is “authorized by rule”, meaning that they can be operated without a permit as long as injection does not endanger USDW |
| Complex Class V wells |
| |||
| Class VI | Geological sequestration of CO2 | Injection of CO2 into deep geological formations |
| |
Disclaimer/Publisher’s Note: The statements, opinions and data contained in all publications are solely those of the individual author(s) and contributor(s) and not of MDPI and/or the editor(s). MDPI and/or the editor(s) disclaim responsibility for any injury to people or property resulting from any ideas, methods, instructions or products referred to in the content. |
© 2023 by the authors. Licensee MDPI, Basel, Switzerland. This article is an open access article distributed under the terms and conditions of the Creative Commons Attribution (CC BY) license (https://creativecommons.org/licenses/by/4.0/).
Share and Cite
Orujov, A.; Coddington, K.; Aryana, S.A. A Review of CCUS in the Context of Foams, Regulatory Frameworks and Monitoring. Energies 2023, 16, 3284. https://doi.org/10.3390/en16073284
Orujov A, Coddington K, Aryana SA. A Review of CCUS in the Context of Foams, Regulatory Frameworks and Monitoring. Energies. 2023; 16(7):3284. https://doi.org/10.3390/en16073284
Chicago/Turabian StyleOrujov, Alirza, Kipp Coddington, and Saman A. Aryana. 2023. "A Review of CCUS in the Context of Foams, Regulatory Frameworks and Monitoring" Energies 16, no. 7: 3284. https://doi.org/10.3390/en16073284