

Global Hydrogen and Synfuel Exchanges in an Emission-Free Energy System
by
 , , ,
, , ,
Felix Lippkau
1,
David Franzmann
2,3,
Thushara Addanki
4,
Patrick Buchenberg
4,
Heidi Heinrichs
2,
Philipp Kuhn
4,
Thomas Hamacher
4 and
Markus Blesl
1,* 1
Institute of Energy Economics and Rational Energy Use (IER), University of Stuttgart, 70565 Stuttgart, Germany
2
Forschungszentrum Jülich GmbH, Institute of Energy and Climate Research—Techno-Economic Systems Analysis (IEK-3), 52425 Jülich, Germany
3
Chair for Fuel Cells, Faculty of Mechanical Engineering, RWTH Aachen University, 52062 Aachen, Germany
4
Chair for Renewable and Sustainable Energy Systems, Technical University of Munich, 85748 Garching b. München, Germany
*
Author to whom correspondence should be addressed.
Energies 2023, 16(7), 3277; https://doi.org/10.3390/en16073277
Submission received: 15 February 2023
/
Revised: 14 March 2023
/
Accepted: 29 March 2023
/
Published: 6 April 2023
(This article belongs to the Special Issue Transformation of Energy Systems: From the Perspective of Climate and Energy Policies)
Abstract
:This study investigates the global allocation of hydrogen and synfuels in order to achieve the well below 2 °C, preferably 1.5 °C target set in the Paris Agreement. For this purpose, TIMES Integrated Assessment Model (TIAM), a global energy system model is used. In order to investigate global hydrogen and synfuel flows, cost potential curves are aggregated and implemented into TIAM, as well as demand technologies for the end use sectors. Furthermore, hydrogen and synfuel trades are established using liquid hydrogen transport (LH2), and both new and existing technologies for synfuels are implemented. To represent a wide range of possible future events, four different scenarios are considered with different characteristics of climate and security of supply policies. The results show that in the case of climate policy, the renewable energies need tremendous expansion. The final energy consumption is shifting towards the direct use of electricity, while certain demand technologies (e.g., aviation and international shipping) require hydrogen and synfuels for full decarbonization. Due to different security of supply policies, the global allocation of hydrogen and synfuel production and exports is shifting, while the 1.5 °C target remains feasible in the different climate policy scenarios. Considering climate policy, Middle East Asia is the preferred region for hydrogen export. For synfuel production, several regions are competitive, including Middle East Asia, Mexico, Africa, South America and Australia. In the case of security of supply policies, Middle East Asia is sharing the export volume with Africa, while only minor changes can be seen in the synfuel supply.
1. Introduction
In the Paris Agreement [1], the states of the world agreed to limit global warming well below 2 °C, preferably to 1.5 °C. The 2018 published IPCC report [2] advertised that this would mean a net global CO2 budget of 420 Gt, with the best likelihood to prevent exceeding the 1.5 °C target. Over the last decades, the global gross CO2 emissions were rising continuously. In 2022, the global gross CO2 emissions were recorded at roughly 36 Gt [3]. Maintaining the status quo would lead to exceeding the Paris Agreement goals in less than 15 years. To follow the agreement, more climate policy must be implemented and innovative mitigation plans applied.
To achieve a tremendous reduction in CO2 emissions and reaching net zero all sectors must be decarbonized. Decarbonizing the power sector is common practice. Renewable energies have proven to be cost-competitive compared to fossil fuel power generation; even countries without climate policy are installing renewable potentials [4]. Despite the trend towards electrification in all sectors, there are certain technologies that still rely on fossil energy carriers. Fortunately, hydrogen and synfuels are suitable to fill this gap, although both energy carriers are likely to be more expensive than the fossil competitors, if externalities are not accounted for. To enter hydrogen and synfuels into energy systems, climate policies like carbon price or subsidies need to be applied.
In 2019, the European Union (EU) announced the Green New Deal [5]. In addition to the determination of carbon reduction goals and greenhouse gas neutrality by 2050, it was also announced to boost the hydrogen economy. In parallel, Germany has set its own tight goals with the agreement on net zero by 2045 [6]. As Germany’s gross domestic product (GDP) heavily relies on its partly difficult to decarbonize industry, hydrogen and synfuels will most likely play a crucial role to achieve this goal.
In 2022, the US passed the Inflation Reduction Act (IRA) [7], making the decision to sustainably strengthen the hydrogen economy. In addition to the members of the EU and the US, many other countries entered or already pursued the plan to build up a hydrogen economy. Therefore, it is necessary to expand renewable energy generation technologies as hydrogen and synfuels rely on electricity for electrolysis and the Fischer–Tropsch processes.
This analysis deals with the question of the available technology transformation pathways of the global energy system in order to achieve the 1.5 °C target set in the Paris Agreement. To fulfill that target, hydrogen and synfuels are required to fill the gap of today’s oil and gas technologies and lead to a sustainable transformation within the energy system. Furthermore, this analysis is questioning the exchanges of hydrogen and synfuels across regions in a cost-optimal transformation pathway. Therefore, the global energy system model TIAM is used. There are several conceivable ways to produce hydrogen, for example, via fossil energy carriers (grey hydrogen). If carbon capture and storage (CCS) is combined with fossil energy carriers, the hydrogen is labeled as blue hydrogen. If the electricity comes from nuclear power, the hydrogen is considered pink. In this study, only green hydrogen and synfuels resulting of green hydrogen are considered. Hydrogen and synfuels are regionally aggregated and implemented into TIAM. Renewable energy production is limited by the available potential, and therefore, the use of electricity for direct electric use, hydrogen and synfuel production is investigated. Four different scenarios are implemented to cover possible future events, including no climate policy, climate policies and different characteristics of security of supply. Due to the different scenarios, the results and possible pathways towards an emission-free energy system are concluded and discussed.
2. Literature Review
Previous work was done in the analysis of the future production costs of synfuels and hydrogen based on the generation technologies themselves, the availability of cheap variable electricity generation costs based on the availability of renewable electricity generation and the transport and worldwide trade of emission-free energy carriers.
The production costs of synfuels and hydrogen are discussed in Agora [8]. Therefore, wind offshore is the most expensive option, whereas photovoltaics (PV) seems to be the cheapest, especially in Africa and the Near East. Geothermal could also be an option, but the global potentials are rather small. Hydrogen imports are cheaper than local production in Europe, as the results show. In a total comparison of hydrogen production, Nikolaidis and Poullikkas [9] have concluded that steam methane reforming (SMR) is the cheapest option. Overall CO2 prices are not considered as well as a carbon budget. Schmidt et al. [10] investigated the production route of synfuels by using renewable energies. According to the results, the source of carbon has a huge impact on the costs. Using direct air capture (DAC) technology, synfuels costs are reported at 42 EUR/GJ, whereas synfuels costs using concentrated CO2 by using carbon capture use and storage (CCUS) are referred to as 31.3 EUR/GJ. High temperature electrolysis is applied for both routes. Fasihi et al. [11] investigated the production chain of synfuels in several regions. Beneficial regions are Africa, South America, Asia and Australia. Production costs start at 79 USD/barrel and grow to a maximum of 135 USD/barrel. The costs are highly sensitive to certain factors, e.g., left-over oxygen for sale or waste heat recovery. Chapman et al. [12] investigated the production in Australia in three different locations for the trade of hydrogen with Japan, in order to replace remaining coal trades. Currently, hydrogen production with coal gasification and CCS is cheapest, but in the long term renewable electricity and water electrolysis could lead to lower costs of hydrogen production. Rosen et al. [13] discussed the importance of hydrogen technologies in the energy system. They also considered rising demand, and showed via the literature analysis that hydrogen could be supplied in the future for as low as 1.7 USD/kg. In 2017, Fasihi et al. [14] published another study, which calculated the production costs of synfuels considering the whole production chain in the Maghreb states. The study resulted in diesel and kerosene prices of 88 EUR/MWh in 2030 and 83 EUR/MWh in 2040. Libya has the best potential in the Maghreb states. In 2021, Ueckerdt et al. [15] investigated the production of synfuels. Transport from Africa to Germany was also considered. They concluded that mitigation costs could be in the range of 19–267 EUR/tCO2 in 2050. In 2018, Blanco et al. [16] investigated the hydrogen demand using the JRC, a European model. According to their findings, the hydrogen demand could rise to 20–120 Mt/a. It would mostly be used for synfuel production and transport, as well as for industry purposes. As far as CCS is not an option, electrolysis is the favored production route for hydrogen. If policy-makers allow CCS, SMR would be the choice of hydrogen production.
In addition to the costs of hydrogen and synfuels, the question of suitable supraregional transport is essential. An analysis with the JRC model [17] indicated that for short distances, pipelines are the best choice, and for distances between 3000 and 16,000 km, LH2 compared to the transport of hydrogen via LH2, ammonia and LOHC is the favored choice. The report by IRENA [18] showed that LH2 is cheapest below 5000 km. Overall, it strongly depends on the capacities transported in the long term.
Furthermore, there are studies that combine both aspects of the costs of hydrogen and synfuels as well as transport options in one model. A report by EWI [19] compared 94 countries in 6 continents on producing hydrogen. Starting from 2030, hydrogen production by electrolysis could become cost-competitive to SMR. The cheapest option is PV in sun-rich countries, whereas wind offshore is reported as the most expensive route. In the case of transport, LH2 is the favored choice for distances longer than 7000 km. In contrast, Niemann et al. [20] came to a fairly different result. While LH2 is a good option, LOHC was cheapest due to the reason of energy losses during transport and storage. However, a report by the German Aerospace Center [21] showed, too, that LH2 transport is the cost-minimal way of hydrogen transport starting in 2030 compared to LOHC and other carriers. Gallardo et al. [22] investigated the production of hydrogen via concentrated solar power (CSP) and PV, as well as the transport via ammonia or LH2. Production via PV resulted in being the cheaper choice, while ammonia could have advantages if used as the end product. In 2025, ammonia will have a production cost of 3.94 USD/kg whereas liquid hydrogen is reported as 4.89 USD/kg. Wijayanta et al. [23] had a similar approach. They also concluded that ammonia is cheapest if used as the end demand product. Otherwise, LH2 could become cheaper in 2050 if hydrogen is demanded. Furthermore, LOHC was investigated as well, which has shown to be the overall most expensive option. Ishimoto et al. [24] studied the pathways of hydrogen production and hydrogen carrier transport from Norway to Japan. Results show that hydrogen production via autothermal reforming (ATR) and ammonia production via SMR are the cheapest. As far as hydrogen is demanded, LH2 is the best transport option. If ammonia is demanded as an end use product, the transport of ammonia is cheaper in comparison to hydrogen. In Stiller et al. [25], the route of hydrogen production in Norway was analyzed. The levelized costs of electricity from wind energy are reported as 9.6–10.4 Ct/KWh. For the transport of hydrogen to Germany, LH2 was proposed with costs starting at 11.4 Ct/KWh. Kamiya et al. [26] analyzed the hydrogen pathway from Australia to Japan via LH2. The production route was via lignite and CCS. Fraunhofer IWES [27] conducted an analysis of the hydrogen production globally, based on the global wind atlas. It showed that Africa has a low cost of production and is exporting hydrogen to Europe, which has higher costs of production. Teichmann et al. [28] share the same result. Furthermore, they concluded that high voltage direct current (HVDC) could also be an option instead of hydrogen export. Heuser et al. [29] discussed the production of hydrogen via onshore wind and PV with liquid hydrogen transport pathways afterwards, and showed that Europe imports hydrogen from Africa. In a study by adelphi et al. [30], the political and economic frameworks are discussed for hydrogen export to Europe. The study concluded that Norway and Morocco are the best choices as they both offer hydrogen for low costs, while also being politically stable.
Several studies discuss the state-of-the-art hydrogen technologies and purpose in the emission-free energy system. Yue et al. [31] concluded that hydrogen systems are not cost-optimal compared to today’s alternative systems. Staffel et al. [32] showed a huge collection of hydrogen technologies for all relevant sectors including industry, residential and transport and discussed mitigation options by using hydrogen. Another study by Brandon et al. [33] in 2017 discussed the use of hydrogen in energy systems in different sectors. Quarton et al. [34] also considered hydrogen in the energy system. They came to the result that temporal resolution has an impact on the demand of hydrogen, and thus hydrogen demand could be underestimated in today’s models. Dodds et al. [35] have more focus on the heating sector as they investigated fuel cells for residential demand. This study discussed the technology’s readiness and concluded that most results of energy system models do not show hydrogen in residential applications, which veils the usability of hydrogen for decision-makers. In the industrial sector, in accordance to IRENA [36], hydrogen will be important for chemical industry, steel, international shipping, aviation and high temperature heat generation.
Germany’s energy system was covered in several investigations known as “big 5” [37,38,39,40,41] towards the transformation to net zero until 2045. In a study by BCG [38], hydrogen and synfuels are used in transport, industry and the residential sector. A total demand of 240 TWh is reported, while 130 TWh need to be imported. In a study by dena [37], a final energy demand of 226 TWh of hydrogen can be found, while 597 TWh need to be imported overall. In a study [39] by the Ariadne project, the results show that hydrogen can play a major role. Germany records a hydrogen demand of 40 TWh by 2030. To satisfy the total energy demand, imports are necessary. The report shows up to 1500 TWh/a and up to 900 TWh/a of foreign electricity production to satisfy the synfuel and hydrogen demand. In Sensfuss et al. [40], either an import of 510 TWh of hydrogen or 750 TWh of synfuels is necessary to decarbonize Germany’s energy system. Finally, in a study by Öko-Institut et al. [41], 36% of the 265 TWh demanded hydrogen is supplied by domestic production. All five studies rely on hydrogen and synfuel imports, while the demand for direct electric use in the final energy consumption is also rising tremendously.
The literature review shows that there has been intensive scientific study of the production and distribution of hydrogen or synfuels. However, little attention has been paid to the global allocation. A study with a global view taking hydrogen and synfuels into account in terms of import and export under consideration of the 1.5 °C target and the security of supply policies of world regions is not discussed so far.
3. Methodology
To analyze the role of hydrogen and synfuel usage and trades across regions, the global energy system model TIAM is used (see Section 3.1). To handle the technical and economical availability of synfuels and hydrogen, the model is extended. In Section 3.2, the implementation of the cost potential curves is discussed and shown on the example of hydrogen. Section 3.3 and Section 3.4 show details on the calculation of the hydrogen and synfuel cost potential curves, as well as the underlying potentials for renewable energies. Lastly, in Section 3.5 the sectors of TIAM and the implementations of end use demand technologies for hydrogen and synfuels are covered.
3.1. Global Energy System Model TIAM
Energy system models are used to measure the impact of climate policy and find path dependencies when decarbonizing the energy system.
In this study, the global energy system TIAM [42] is used. TIAM is a technology-rich bottom-up optimization model minimizing the total discounted system costs. On a spatial level, TIAM considers 16 regions, in which some regions are their own countries (e.g., the US) and others are aggregated (e.g., Africa); see Figure 1. Table A3 provides further information about the TIAM regions.
As a starting point of the underlying methodology, commodities are provided by domestic mining or imports as primary energy for further processing. Certain parameters are exogenously set as energy prices or potentials for mining. The primary energy is provided to be converted to the final energy sectors to satisfy the end use demand.
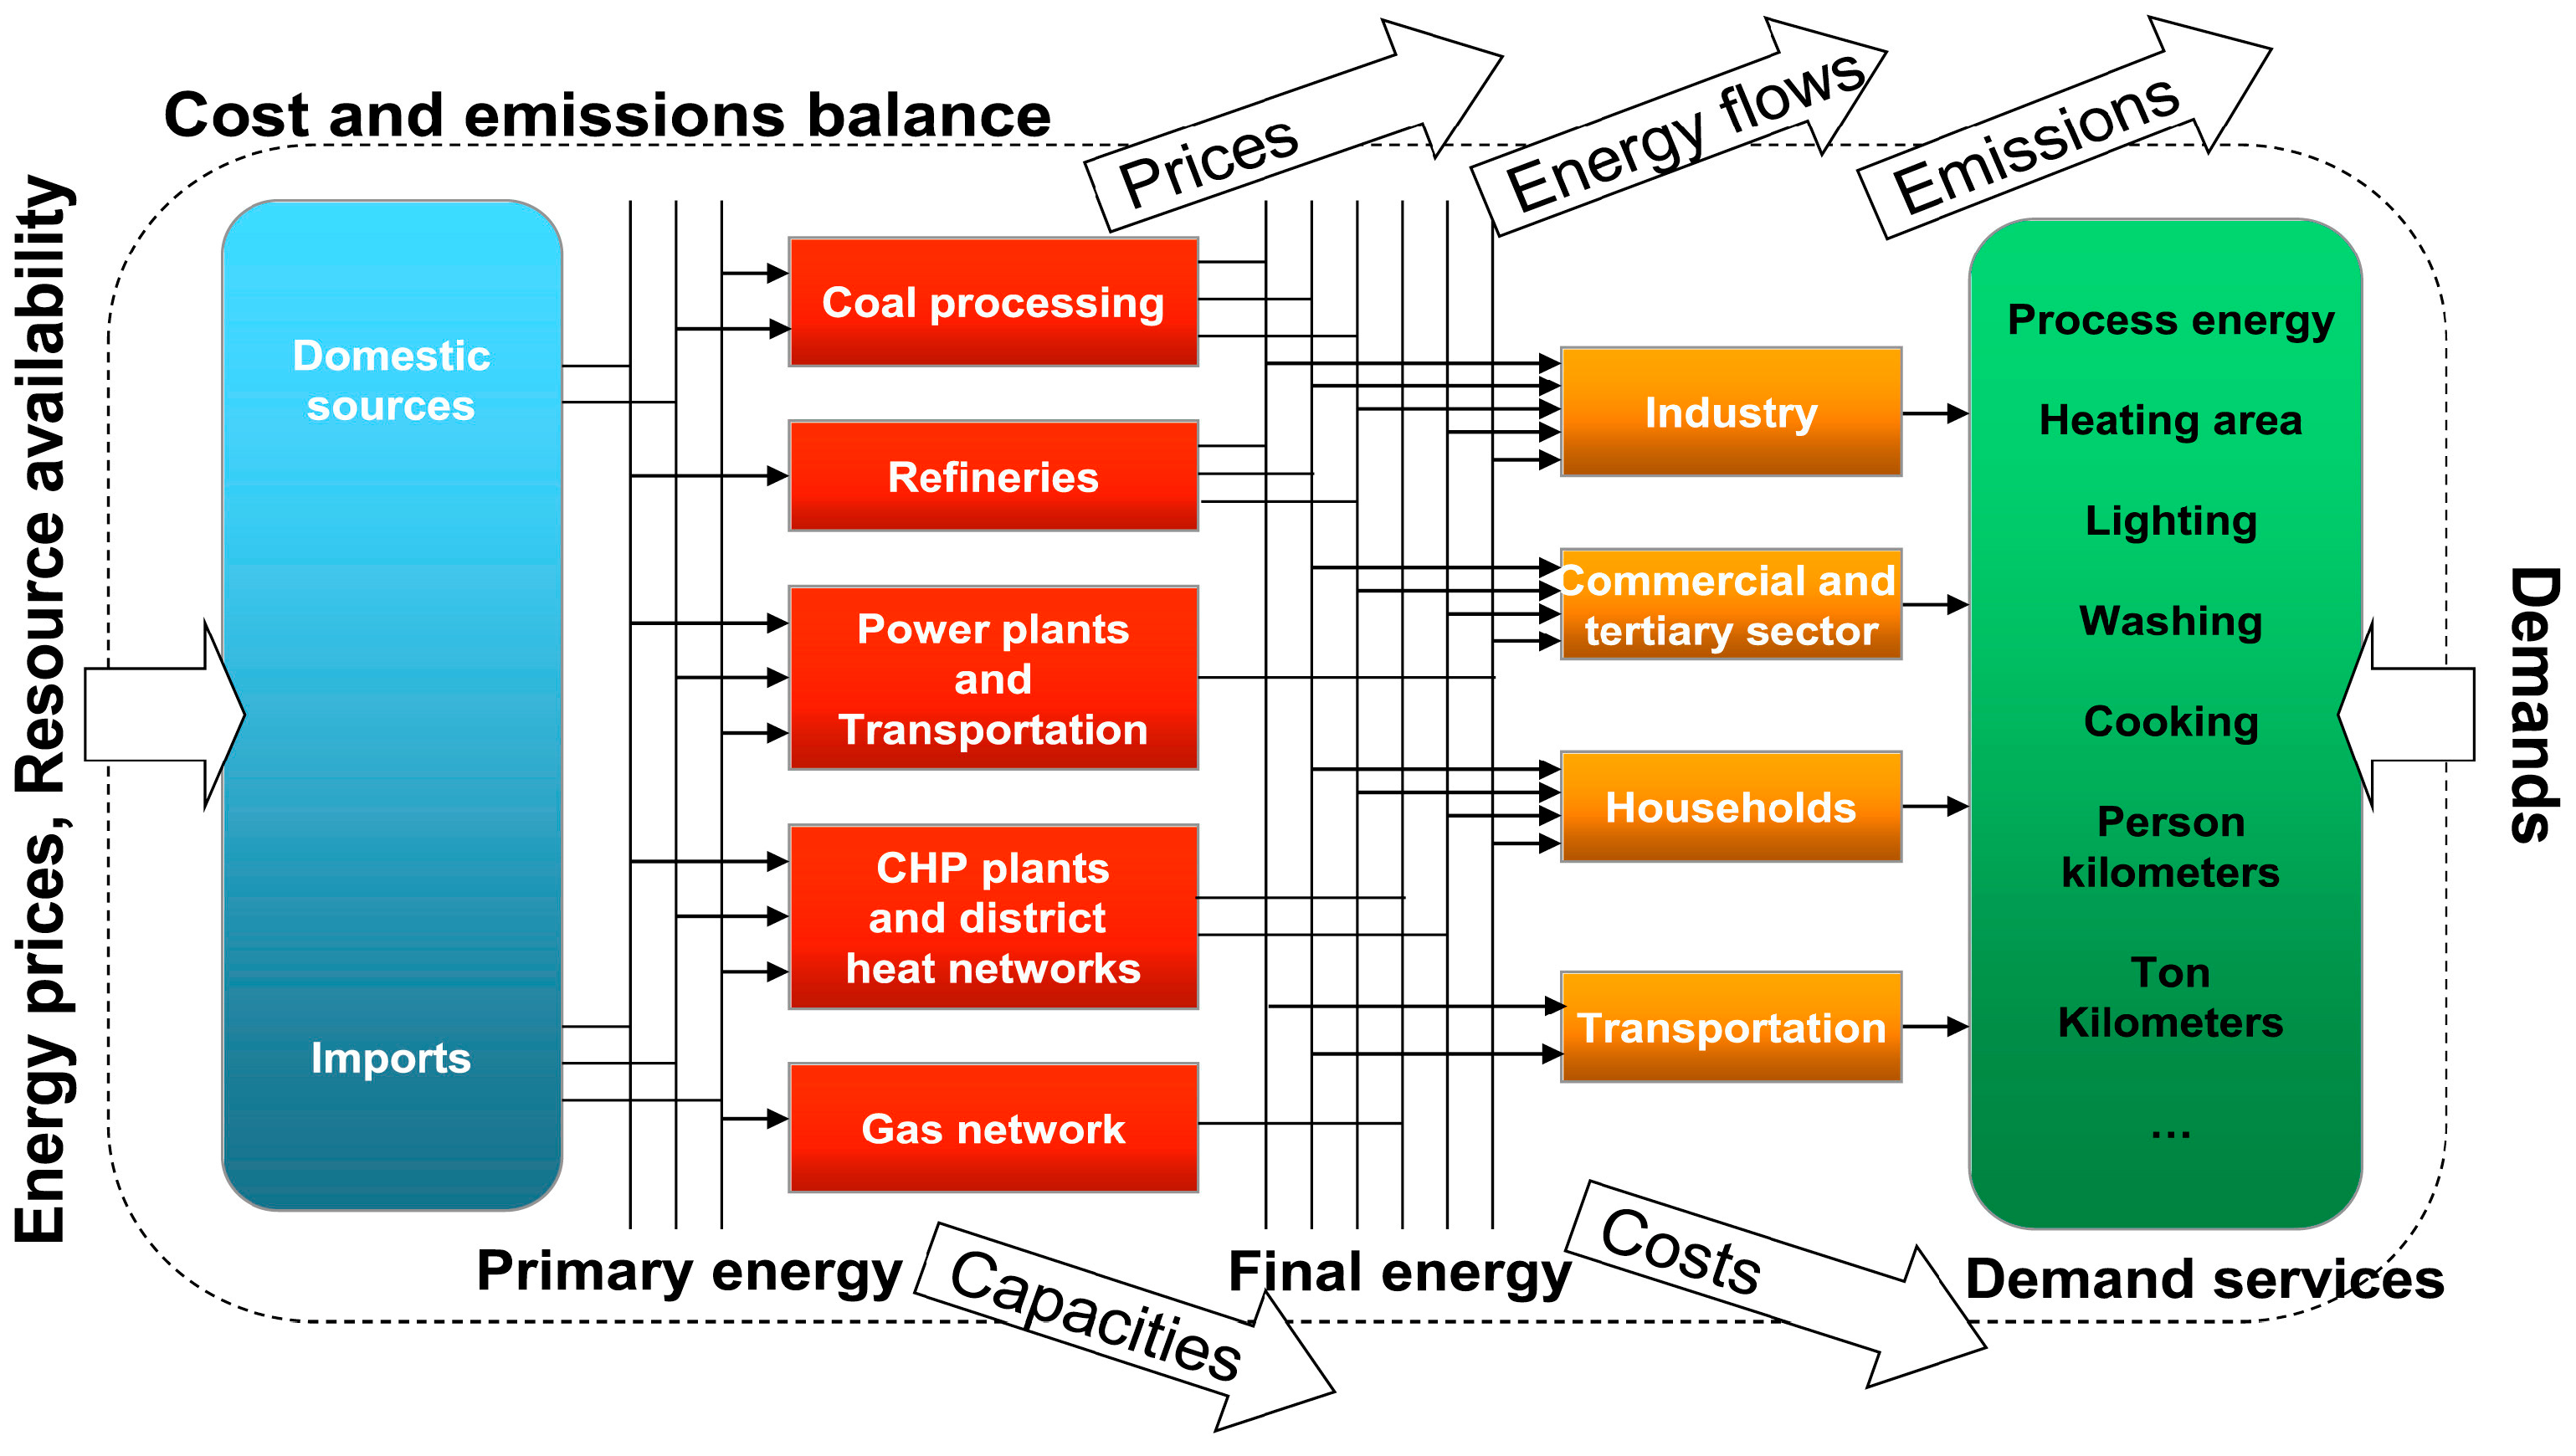
The end use sectors in TIAM are split into five different sectors (industry, transport, households, commercial and agriculture) (see Figure 2). TIAM distinguishes between processes and commodities. Processes are meant as all technologies that produce or provide commodities, e.g., cars in the transport sector or heating technologies in the household sector. All technologies have certain properties, such as their lifetime, investment costs, operation and maintenance costs and availability. The whole procedure is based on investment decisions. These properties ensure that there is a competition of all the technologies and a cost-optimal path can be found. Commodities are defined as all energy carriers (e.g., coal, oil, hydrogen, etc.) or materials (e.g., steel, cement, etc.) and can be produced out of technology processes, as well as emissions.
The time horizon TIAM considers starts in 2015 and ends in 2100. The demand is based on the statistics of the base year in 2015, and it is projected via drivers such as GDP or changes in population. Furthermore, TIAM distinguishes between twelve time slices. There are four for each season and three for day, night and the peak hour.
3.2. Modeling of the Supply Curves in TIAM
Energy system models can only make limited statements with regard to high geographic resolution. To implement hydrogen and synfuels geographically well in TIAM, the approach of discrete cost supply curves was chosen. Therefore, different steps were derived based on GIS data, as explained in the next section. The specific implementation of the supply curves in TIAM is shown in Figure 3. H2SupplyLOC and H2SupplyEXP represent the cost curves for both local and export hydrogen with full costs (full production of hydrogen, storage and transport). Inputs and outputs of the hydrogen production are both integrated in TIAM, in order to evaluate the expansion of renewable energies, too. Furthermore, capacities are represented to ensure that the overall technical potentials of renewable energies are not exceeded and that the competition of all sectors using the mentioned capacities is given. The techno–economic data for hydrogen and synfuel production is provided in Table 1 Hydrogen and synfuels can then be used for local or export demands. Shipping technologies are provided for oversea transport; compare Table A1. Local distribution technologies are implemented to map the transport and distribution costs of hydrogen and synfuels within one region.
3.3. Supply Curve Hydrogen
Based on the methodology and results described in Franzmann et al. [44] for each of the 16 world regions in TIAM, at least one country with beneficial renewable wind or solar conditions was selected to serve as the green hydrogen hub of the respective region. The regionally and spatially resolved renewable energy potentials serve as the input for the electrolysis for hydrogen production, as well as an input for the liquefaction of hydrogen in the export harbor. The water supply for the electrolysis is considered as an additional cost factor. Competing demand for the renewable electricity is not considered in the export cost potentials of liquid hydrogen. Hence, at this step, the full renewable energy potentials of wind turbines and open-field photovoltaic are assumed to be available for hydrogen production and liquefaction. The hydrogen export energy system is holistically optimized within FINE [45] using the optimal combination of curtailment, storages, wind and PV combination and grid expansions. In a postprocessing step, the local grid connection costs are considered by modelling the electric grid connections of the location-specific turbines and PV parks from the optimization via a minimum spanning tree approach.

To implement the detailed cost potential curves into TIAM (see Figure 3), each step is used as a separate technology in TIAM representing a specific amount of the liquid green hydrogen at the harbor and its respective costs. In this study, we have chosen 8 evenly-spaced hydrogen costs steps to maintain a sufficient level of detail, while avoiding too big an increase in calculation time for TIAM as each step increases the model size. This aggregation is repeated for different years starting from 2020 until 2050, in 10 year steps. For the range of 2050–2100, the values of 2050 are used. The obtained cost for each liquid hydrogen potential part contains the whole system cost across the full process chain from renewable energy technologies to the ready to export liquid hydrogen in the harbor.
A brief overview of the total liquid green hydrogen export potentials is given in Table 2. As expected, the results indicate that the size of the region and the size of the hydrogen potential depend on one another. Regarding the export cost, a clear pattern with a lower hydrogen cost in regions with beneficial solar conditions can be identified as already discussed in Franzmann et al. [44].
3.4. Supply Curve Synthetic Fuels
It is assumed that all available renewable energies are not competing and available just for synfuel production. In other words, the local and competing demand of renewable energy is neglected.
The synthetic fuels’ potentials and costs are determined by aggregating a decentralized cost-minimal energy system based on the open-source tool urbs [49]. The production of synfuels is basically a hydrogen production with intermediate storage and a subsequent Fischer–Tropsch process. The needed carbon for the Fischer–Tropsch process stems from either biomass or the atmosphere by the DAC process. The water supply for the electrolysis is described by a fixed-cost factor equal to the one for the hydrogen supply. The transport costs are estimated by the distance to the nearest maritime port; all ports can be found in Table A2.
3.5. Sector Modeling
In the power sector, hydrogen can be used as fuel input for combined cycle turbines [51]. The capex is slightly higher compared to gas turbines, but it can also contribute to peak load. Furthermore, hydrogen combined heat and power (CHP) plants are included that can take the power output for the power sector [52].
In the residential and commercial sector, hydrogen burners for room heating are modelled and included. The outgoing heat from CHP processes can also be used via the district heating network for households [53,54].
The transport sector provides mostly fossil-fueled technologies based on the 2015 starting year of the model. The technologies that use diesel can switch to synthetic diesel without reinvesting. The same works for all existing aviation technologies based on fossil jet fuel. Technologies for future investment also have the possibility to switch between fossil and synthetic fuel during their whole lifetime. In addition to the fuel switching option of fossil-fueled technologies, hydrogen-based technologies are also taken into consideration, especially for heavy load trucks, buses, shipping and aviation (cf. [55,56,57]).
In industry, hydrogen can be used for direct reduced iron (DRI). It can also be used as feedstock for ammonia production via a Haber–Bosch process, as well as a feedstock for methanol production. As well as the non-energy use of hydrogen, it can also be used for processing heat and steam [36].
4. Results
4.1. Scenario Definitions
To evaluate the transformation of the global energy system, four scenarios are compared (see Table 4). In the BAU scenario, no climate policy is implemented. This is used as a reference scenario to evaluate the transformation. In the 1_5D scenario, a climate budget is specified according to IPCC, which may be consumed over the model horizon of 2015–2100. In this scenario, there are no trade restrictions or minimum production levels of hydrogen and synfuels. In order to study energy security and transformation impacts, the SoS1 scenario assumes 50% domestic production of hydrogen and synfuels, with no minimum number of trading partners. In scenario SoS2, a minimum local production of 33% per region is provided. In order to ensure energy security despite reduced own production, trade is only possible with at least two independent regions, where none of the trading regions may cover more than 33% of the total demand.
4.2. CO2 Reduction Measures
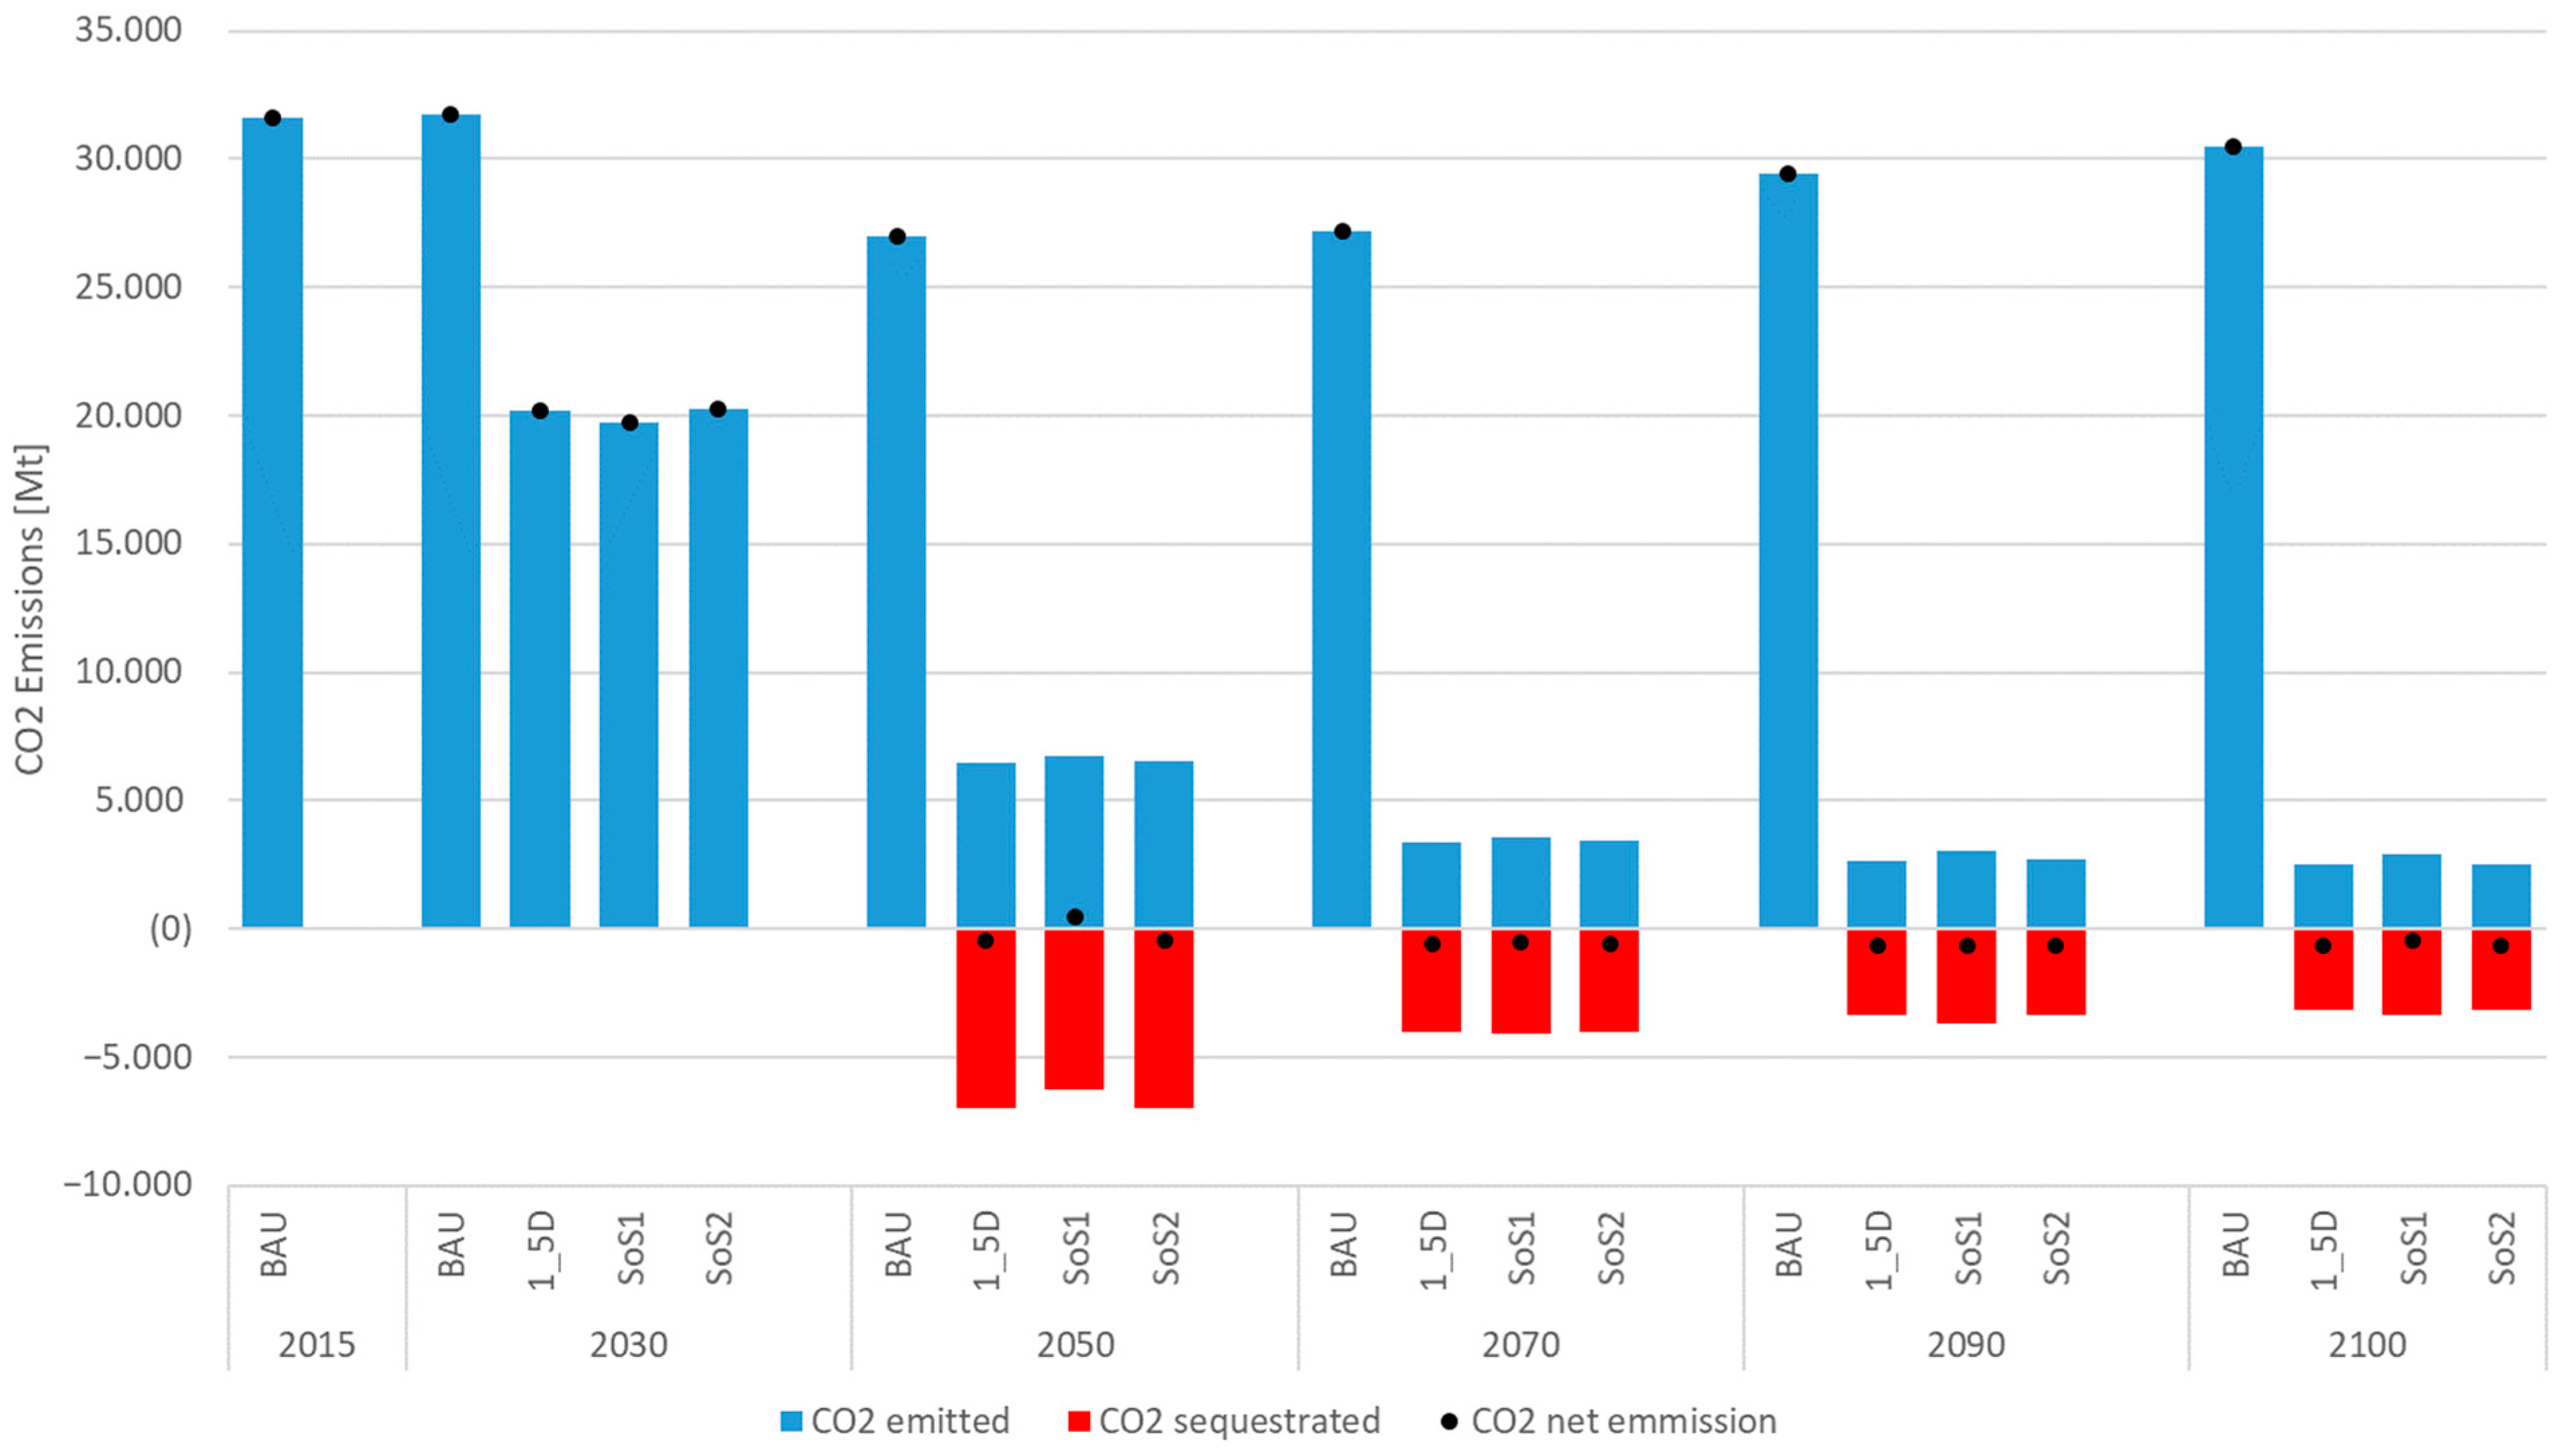
In order to achieve the 1.5 °C target, the global net emissions need to decline drastically. Starting in 2015, over 30 Gt of CO2 net emissions were emitted (cf. [3]). This is due to the reason of massive shares of fossil fuels in both electricity generation and final energy consumption in 2015. In order to keep the carbon budget for the 1.5 °C target, a massive transformation to net zero is necessary (see Figure 4). This is firstly done by phasing out coal in 2030, which already has a massive effect in CO2 mitigation and leads to a reduction of over 10 Gt of CO2. In 2040, the possible use of CCS leads to a shift towards biomass CCS (BECCS) as well as gas CCS in the climate mitigation scenarios (1_5D, SoS1 and SoS2). This makes net zero possible in 2050, whereas CO2 emissions of the BAU scenario show only a little difference.
The share of CCS in 2050 is quite high, as over five Gt of CO2 must be sequestrated, because of emissions which cannot be set to zero, such as those in the agriculture sector. Even in transport and industry, the shift in technologies is slow as some technologies, especially in the industry, have lifetimes of more than 30 years. Therefore, BECCS is used to have negative emissions in order to achieve net zero in 2050; see Figure 5.
As the expansion of renewable energies as well as the transformation in the end use sectors is ongoing, the amount of CO2 is declining over the years for the scenarios with climate policy. The differences in these scenarios are not huge, because the transformation pathway within the regions is almost identical even if there are security of supply scenarios applied to the production and trading of hydrogen and synfuels. No application of climate policies leads to remaining emissions of roughly 30 Gt in 2100, as coal and gas are still used in the final energy consumption as well as in electricity generation.
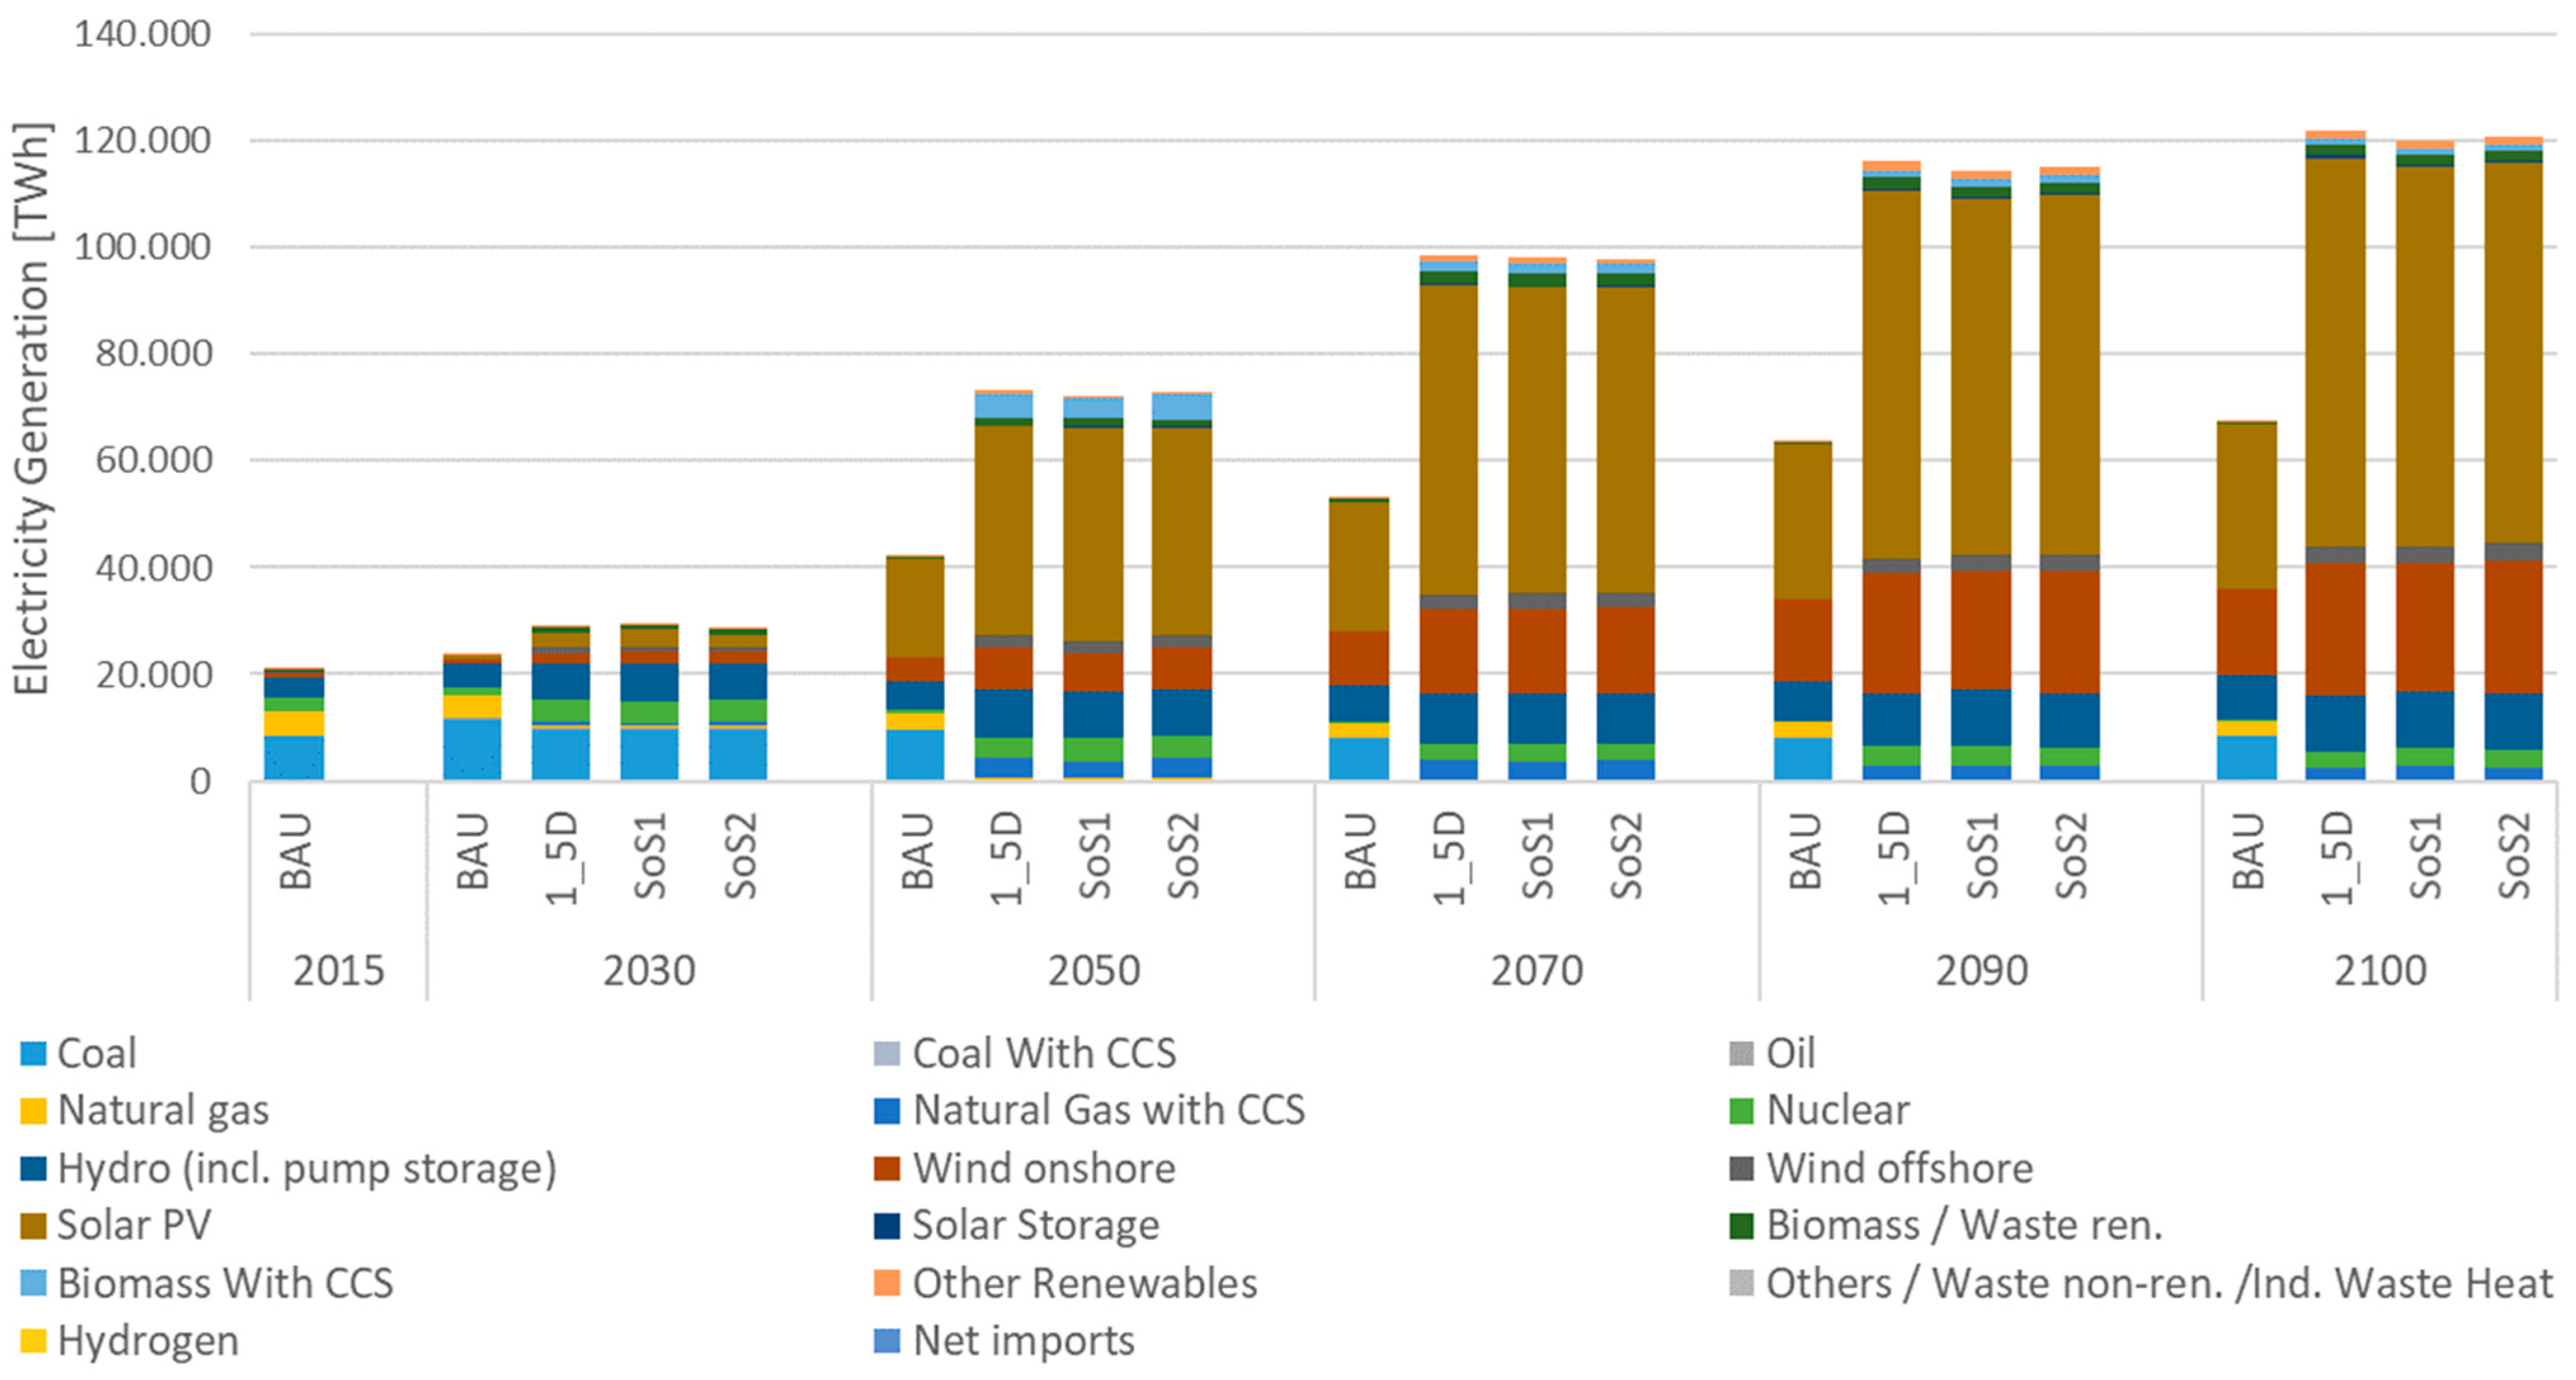
The electricity generation mix based on [4] is recorded as 24,292 TWh (cf. Figure 5). With over 40% of coal and 21% of natural gas share in 2015, the global electricity generation needs a huge transformation towards renewable energies to decarbonize the sector. In addition to the fact that the electricity generation is mostly fossil-based in 2015, even more electricity is needed to decarbonize the other sectors as well as dealing with economic growth, which will also lead to a rising demand in energy.
In 2030, the transformation process can be seen already. While in the BAU scenario the rising total demand is satisfied by adding more fossil fuels, the scenarios with climate policies (1_5D, SoS1 and SoS2) show more generation by renewable energies. The amount of hydropower is expanded to its maximum, while gas and coal are both decreasing. The scenarios with climate policies applied show 24% more electricity generation compared to BAU.
In 2050, most of the electricity sector is already fossil-free in the climate policy scenarios. Coal as an energy carrier is almost faded out, with only 108, 62 and 102 TWh remaining for 1_5D, SoS1 and SoS2, respectively. However, the biggest difference can be seen in the amount of generation by PV and wind onshore. In comparison, 75% more electricity generation is needed for climate action, compared to BAU.
This trend is continued until 2100. In 2070, the electricity sector becomes fully carbon neutral while gas and biomass plants with CCS are applied to satisfy the peak residual load demand. The demand for hydrogen and synfuels can also be seen in Figure 5, as hydrogen needs roughly 1.7× and synfuels 2.1×–2.5× of their energy content as input, while the overall electricity demand is rising, too. This leads to a total demand of 120,000 TWh in 2100 in order to achieve the 1.5 °C target. Compared to this, in the case of no climate protection the total amount of electricity still rises to 67,000 TWh. Overall, the electricity demand rises to 6× the amount in 2015 considering climate action and additionally does more than triple in the case of BAU. Even though there is no climate policy implemented in BAU, a transformation towards renewable energies can also be seen, while peak load demand is satisfied with gas and coal plants.
The comparison of 1_5D, SoS1 and SoS2 shows that through all those years the electricity generation profiles do not show huge differences. This means that the feasible renewable potentials are high enough for each region to achieve the 1.5 °C target, and trading regions can be substituted (compare SoS1 and SoS2) without an appreciable increase of the production intensity of hydrogen or synfuels.
4.3. Final Energy Demand
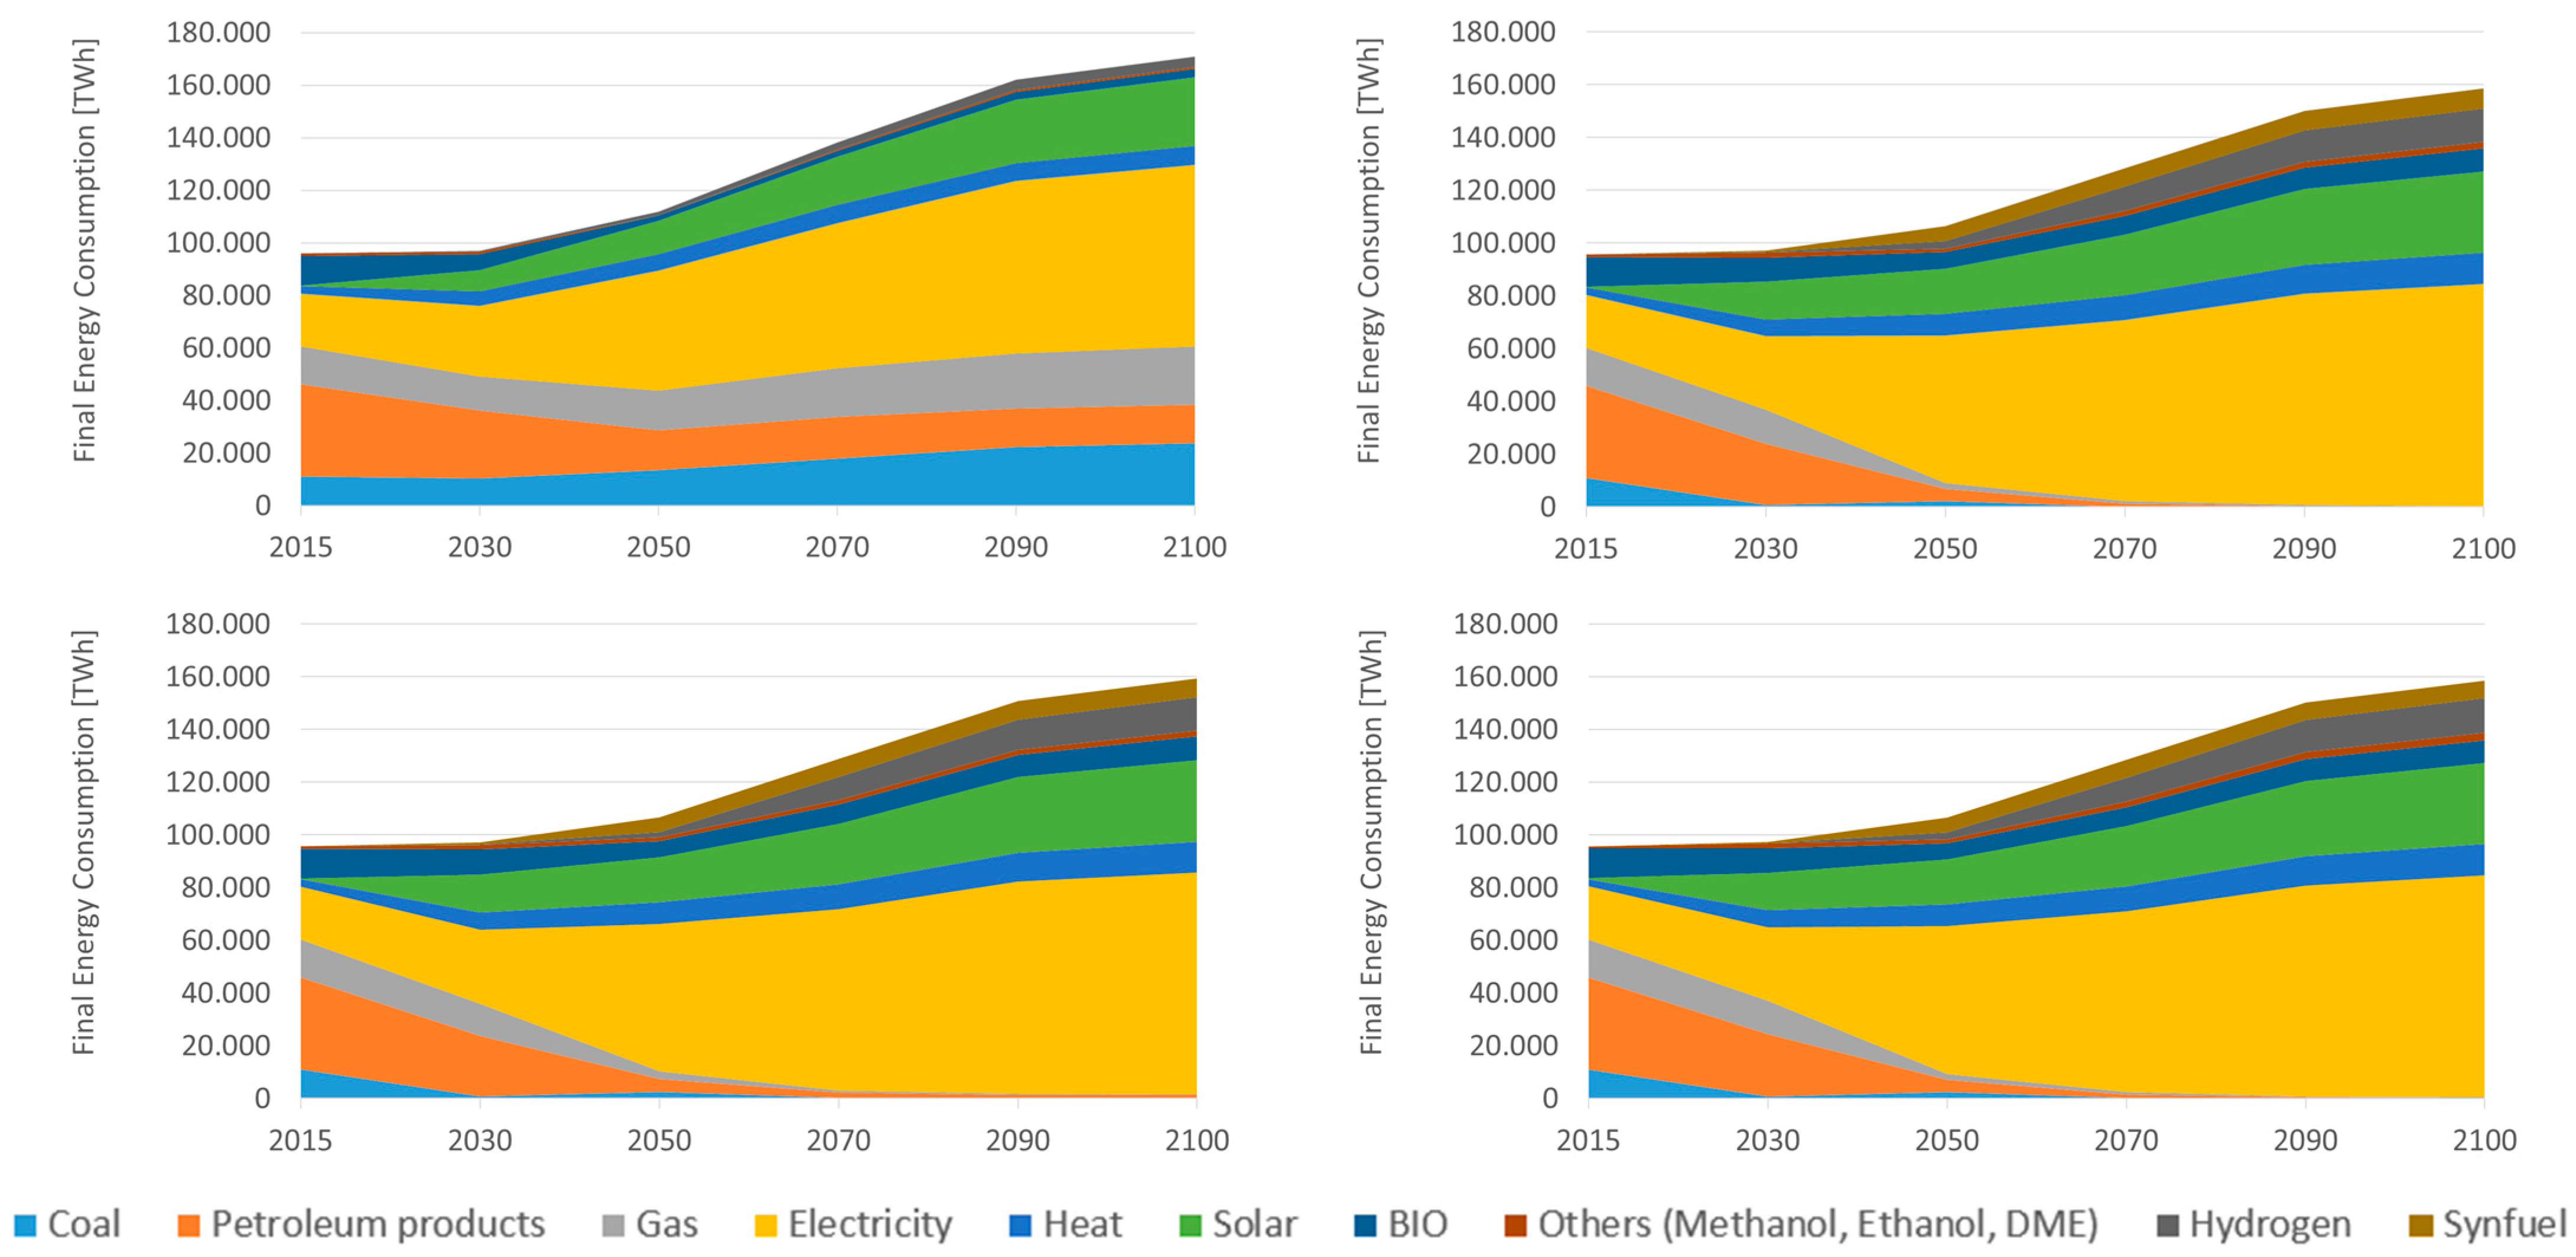
The global final energy demand was close to 96,000 TWh in 2015. Coal, gas and petroleum products have a total share of over 50% (see Figure 6). In 2030, the amount of electricity in the final energy consumption mix is rising. In all sectors, electric technologies mostly have efficiency advantages. The first steps towards a renewable energy system can be seen. In the BAU scenario, the amount of coal is rising, whereas in 1_5D, SoS1 and So2 coal phase-out is already starting. Compared to 2015, the remaining share of coal is only 10% for all scenarios with the 1.5 °C target.
In 2050, most of the energy system, considering climate action, is decarbonized. The residential and commercial sector both switch fuel for heat demand mostly to electricity by using heat pumps for all regions with a cold winter. District heating also plays its role. All regions with a higher average temperature also have a rise in electricity demand for room cooling. The transport sector is transforming towards direct electric usage. Passenger cars use electricity as input, while domestic and international aviation and shipping move to a split share of hydrogen and synfuels. In the 1_5D scenario, the hydrogen demand is 2776 TWh; for SoS1 it is 2055 TWh and for SoS2 it accounts for 2688 TWh. The synfuel demand is 5761 TWh, 5745 TWh and 5572 TWh. There are two reasons for this effect. First, the security of supply policies of domestic production in SoS1 (minimum of 50%) and SoS2 (minimum of 33%) lead to exceeding the feasible technical potentials of renewable energies for some regions, so direct electric use is favored. Secondly, in SoS2, demand must be fulfilled by at least two different export regions, if it is not possible to produce 100% domestically. This exogenously required flexibility leads to more total usage of hydrogen and synfuels in SoS2 in 2050. As SoS1 has the lowest absolute demand in hydrogen and synfuels in 2050, the demand for electricity is therefore higher. Without climate policies, the demand in coal is rising; see BAU. Nevertheless, the share of electricity is also rising, which shows that direct electric technologies are also economically without CO2 pricing.
Towards 2100, the energy system is fully decarbonized in the climate policy scenarios, mostly fueled by electricity, whereas BAU still has an over 30% share in fossil fuels. The effect of 2050 with the climate action scenarios can also be seen in 2100. With a total demand of 20,182 TWh of synfuels and hydrogen, the 1_5D scenario has the highest demand compared to SoS1 with 19,559 TWh and SoS2 with 19,615 TWh. Even if the results do not differ much, it can be seen that there is at least a minimal impact on the demand considering security of supply policies on production and trading.
As both international and domestic aviation and shipping as well as some processes in the industrial sector cannot switch towards direct electric use, hydrogen and synfuels are necessary to fully decarbonize the energy system, which is only applied by climate policy.
4.4. Global Hydrogen and Synfuel Production
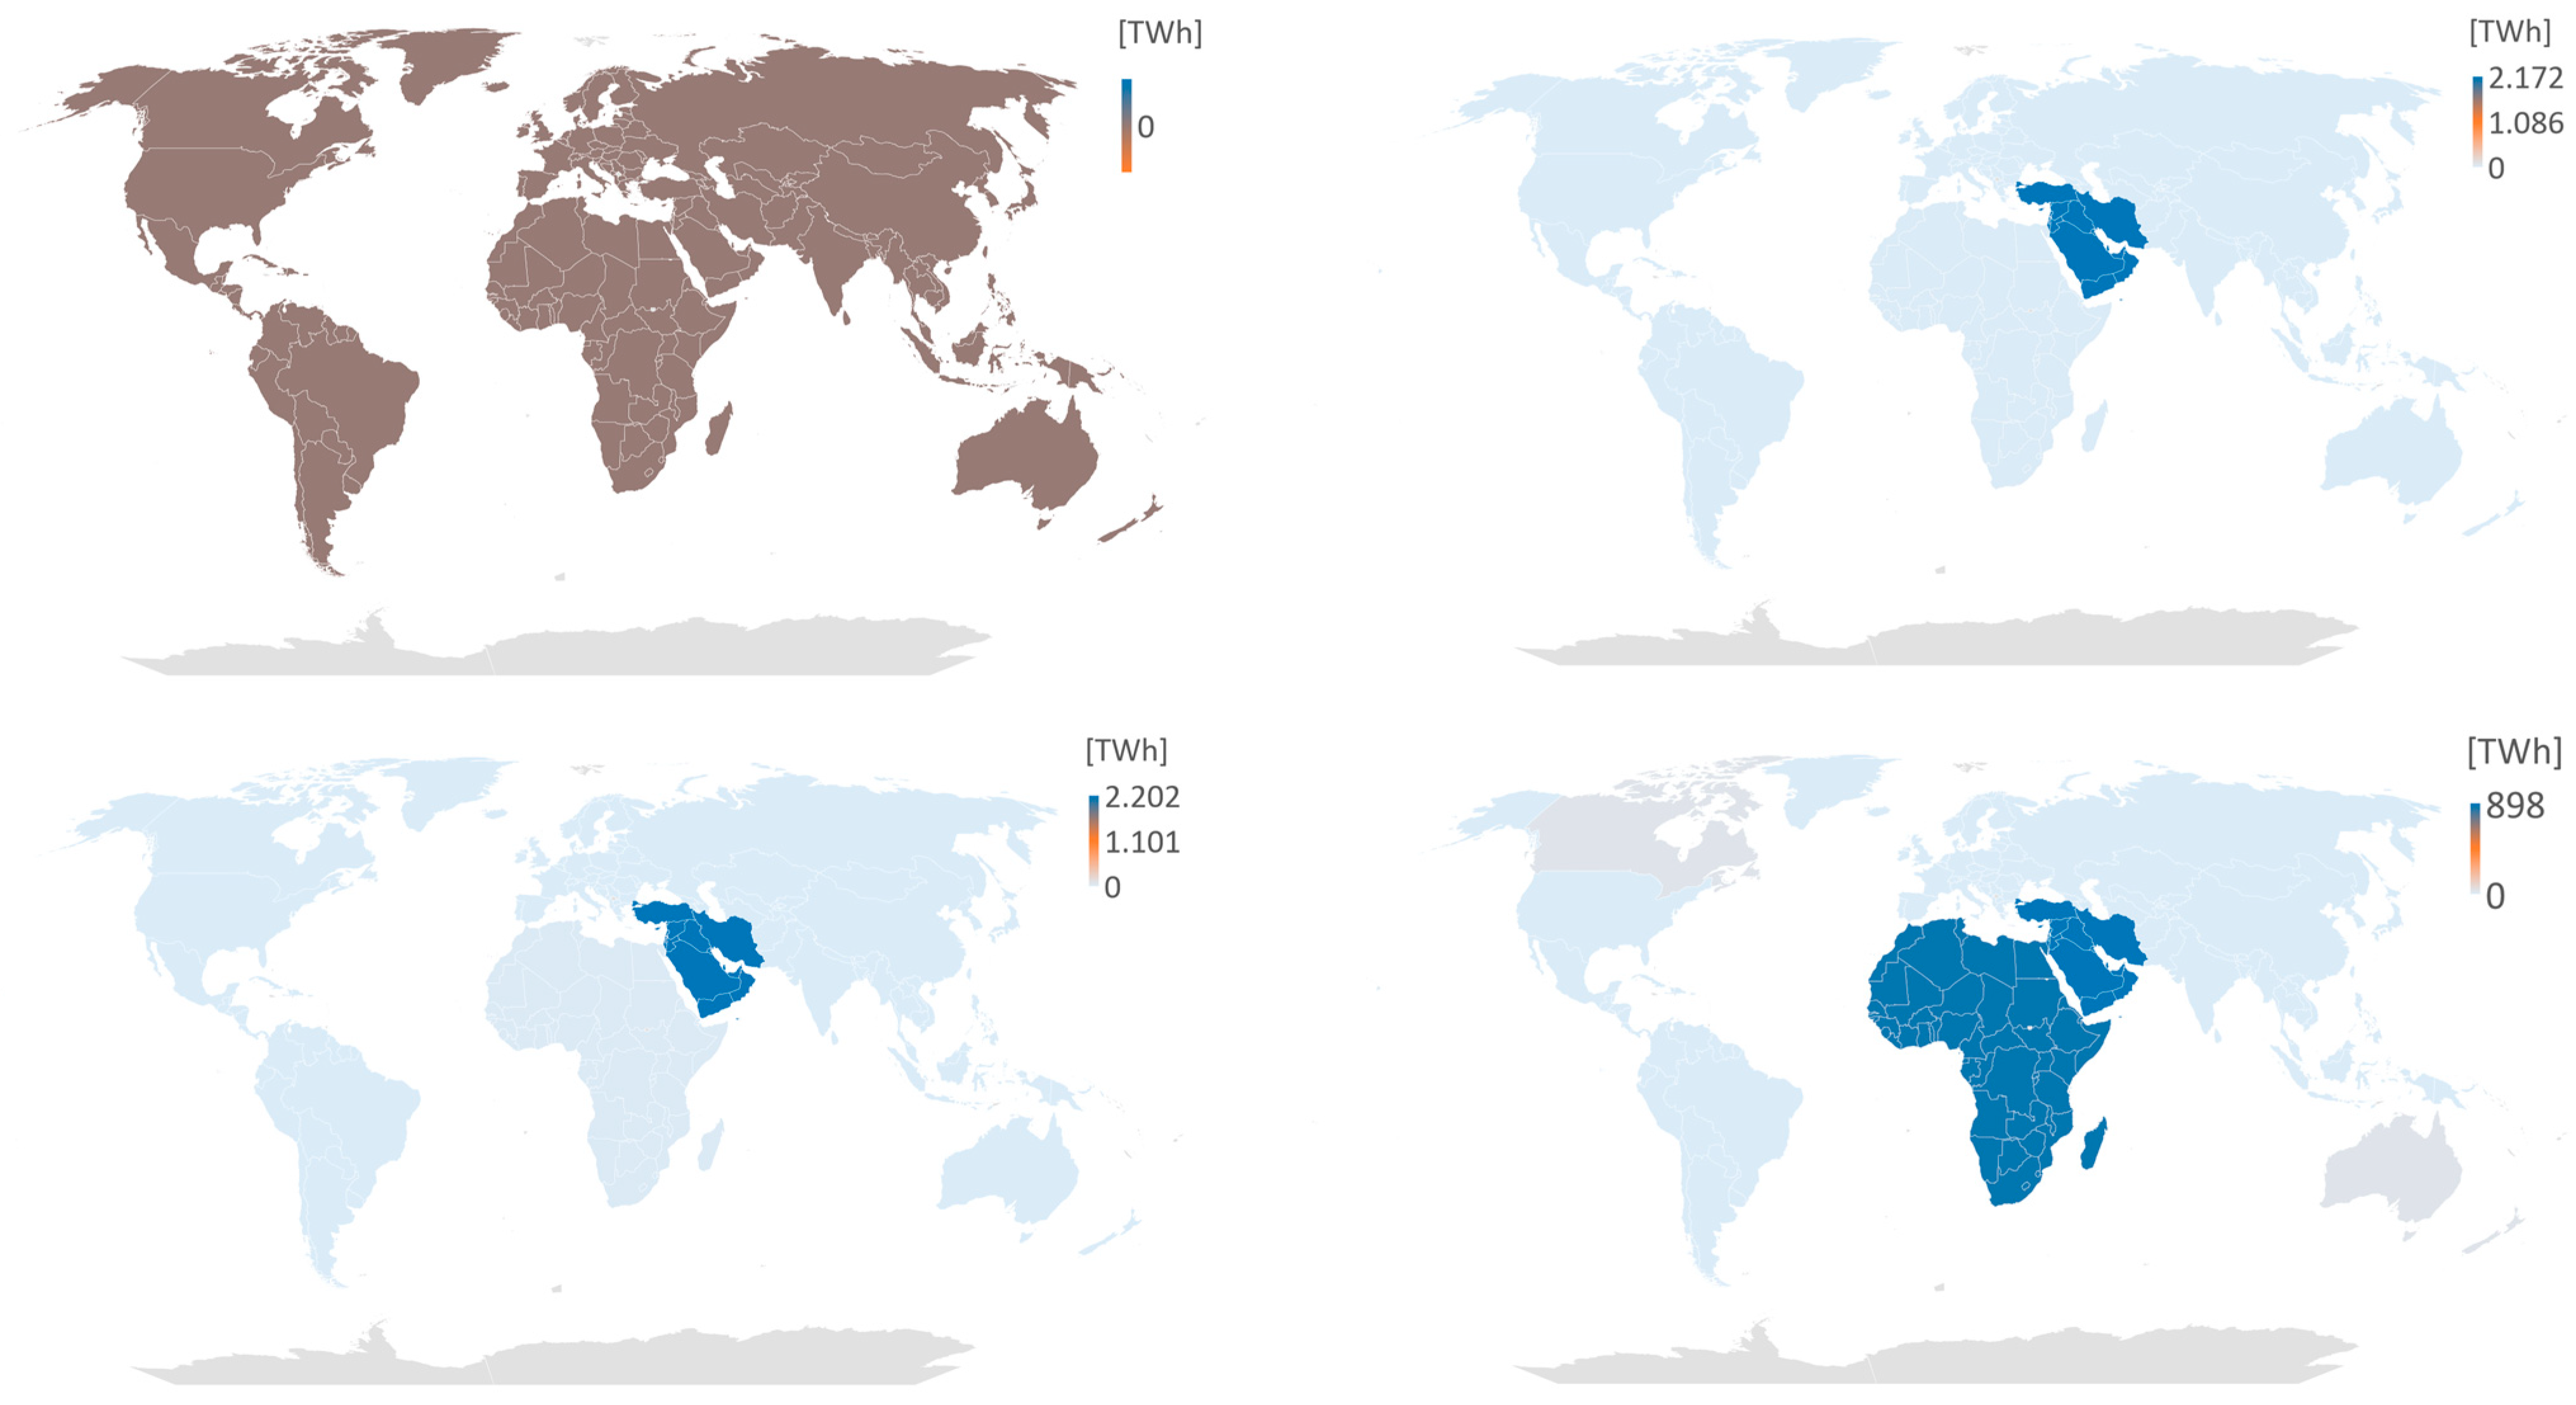
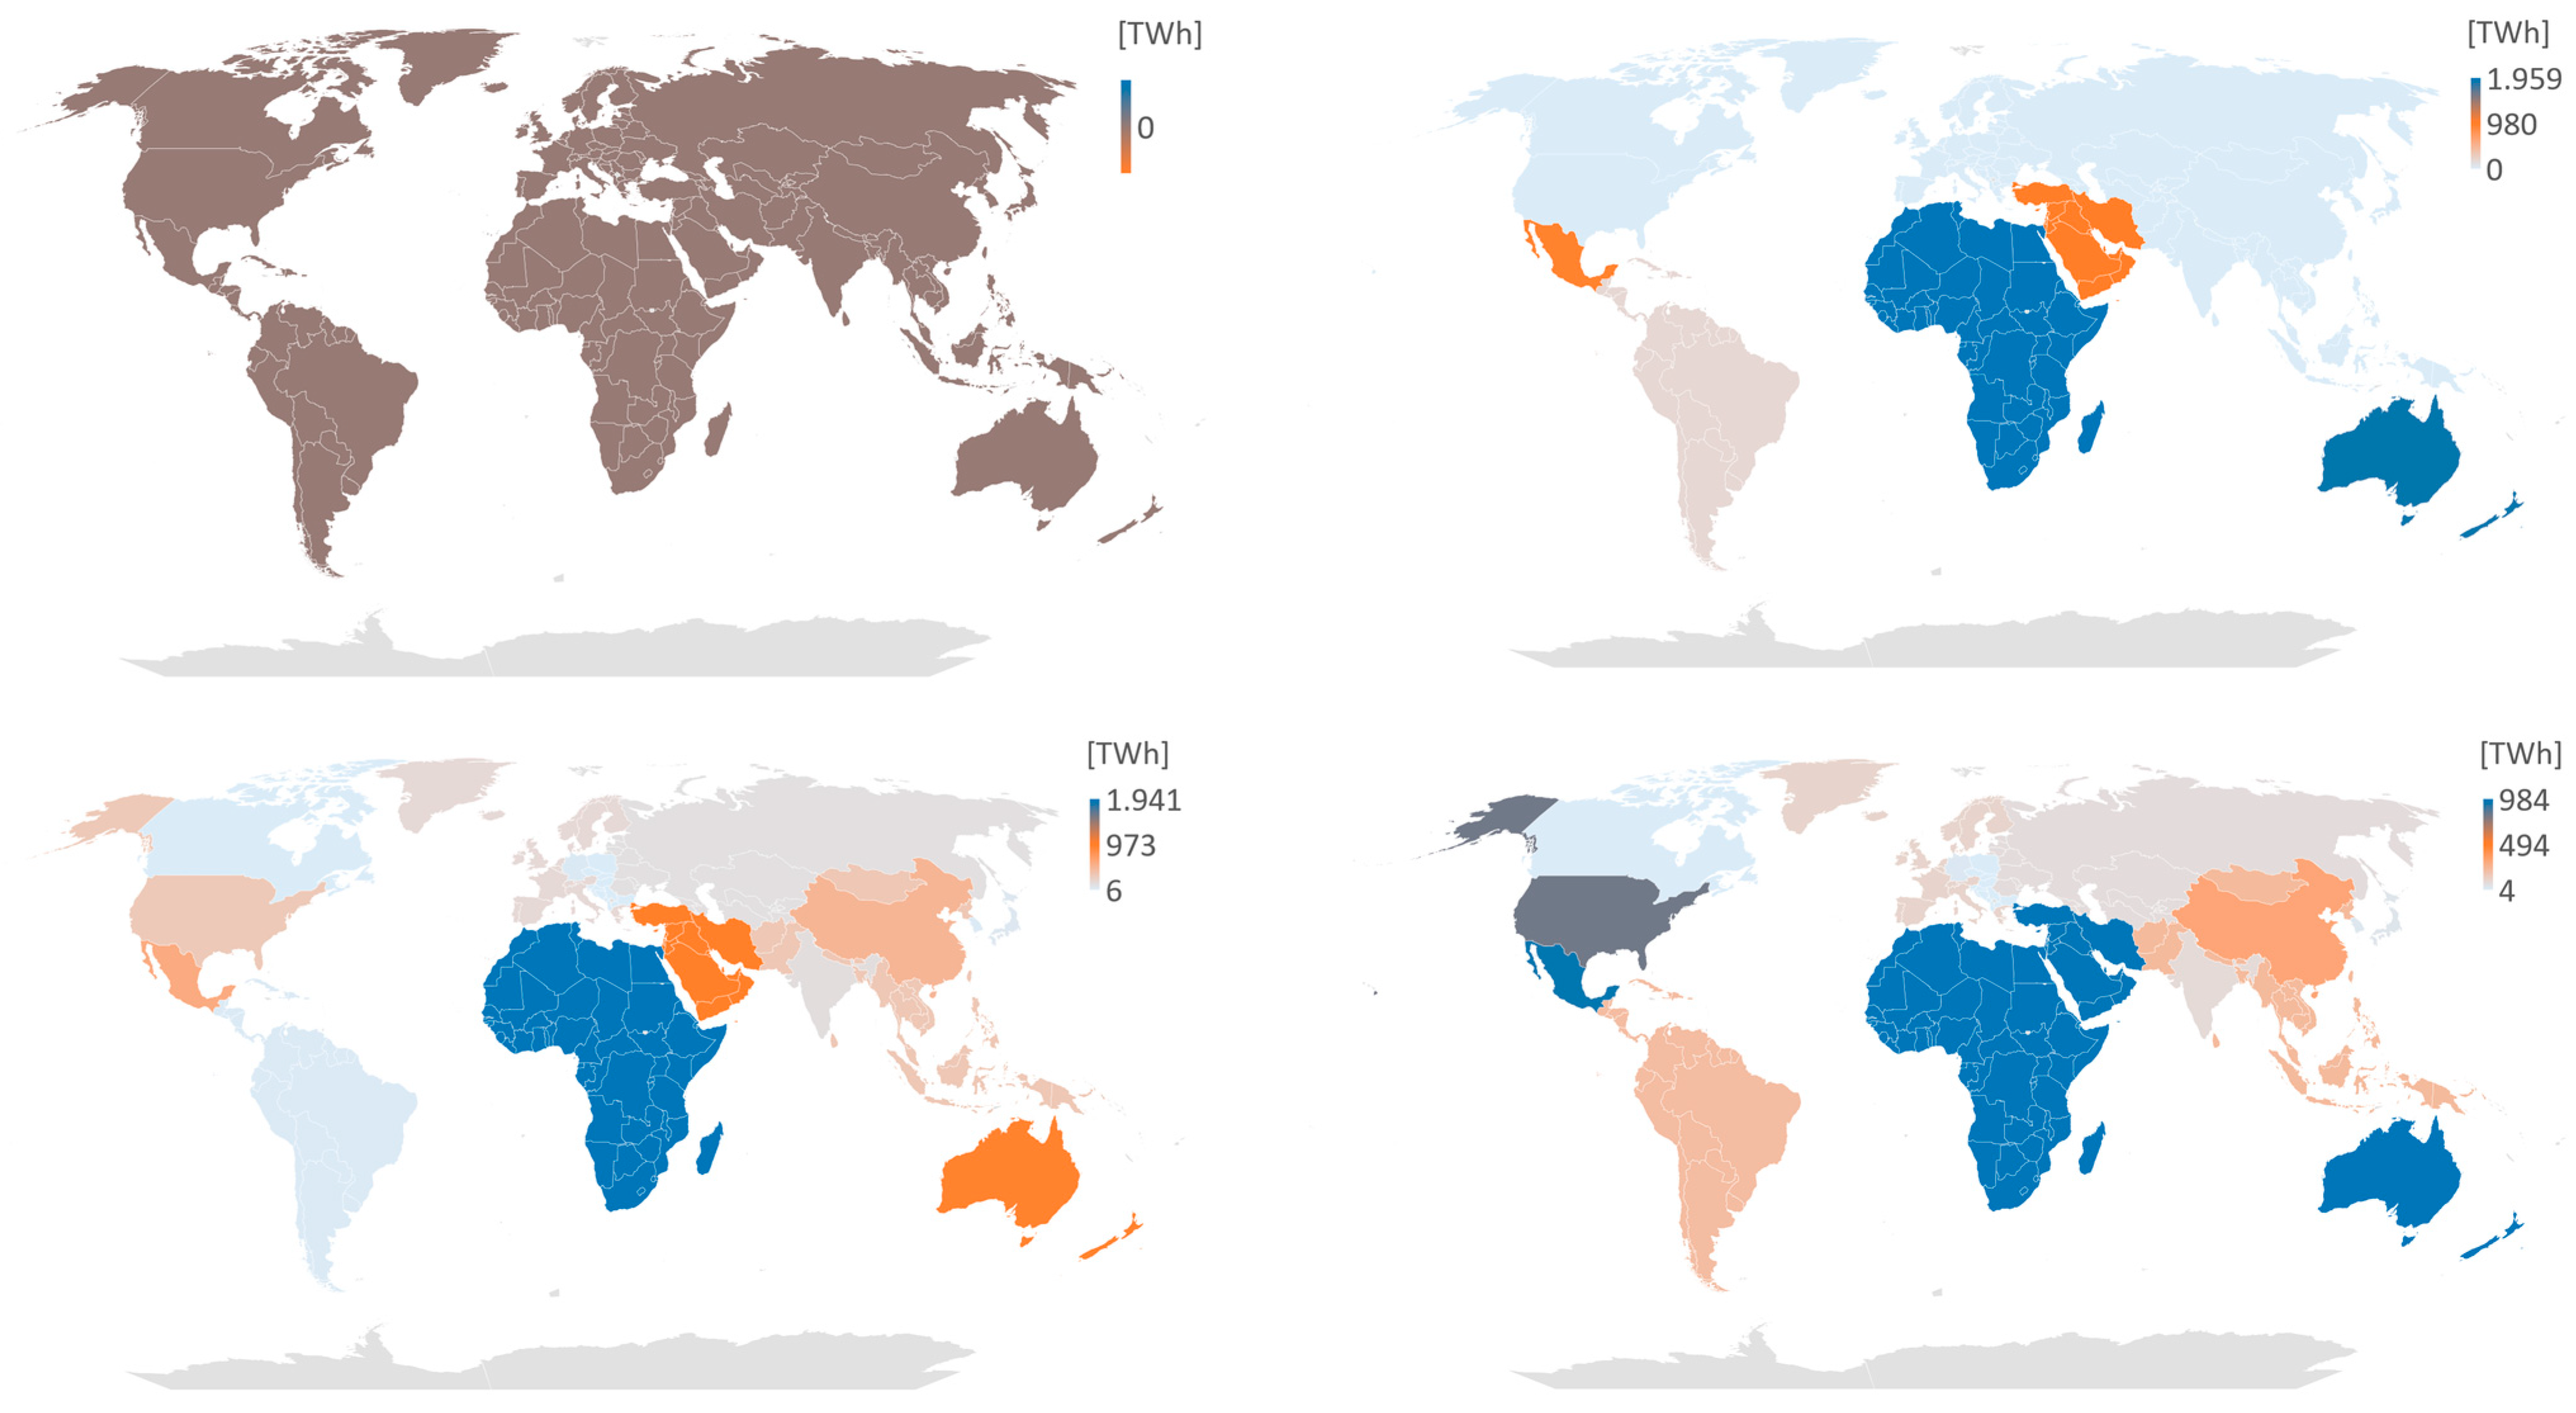
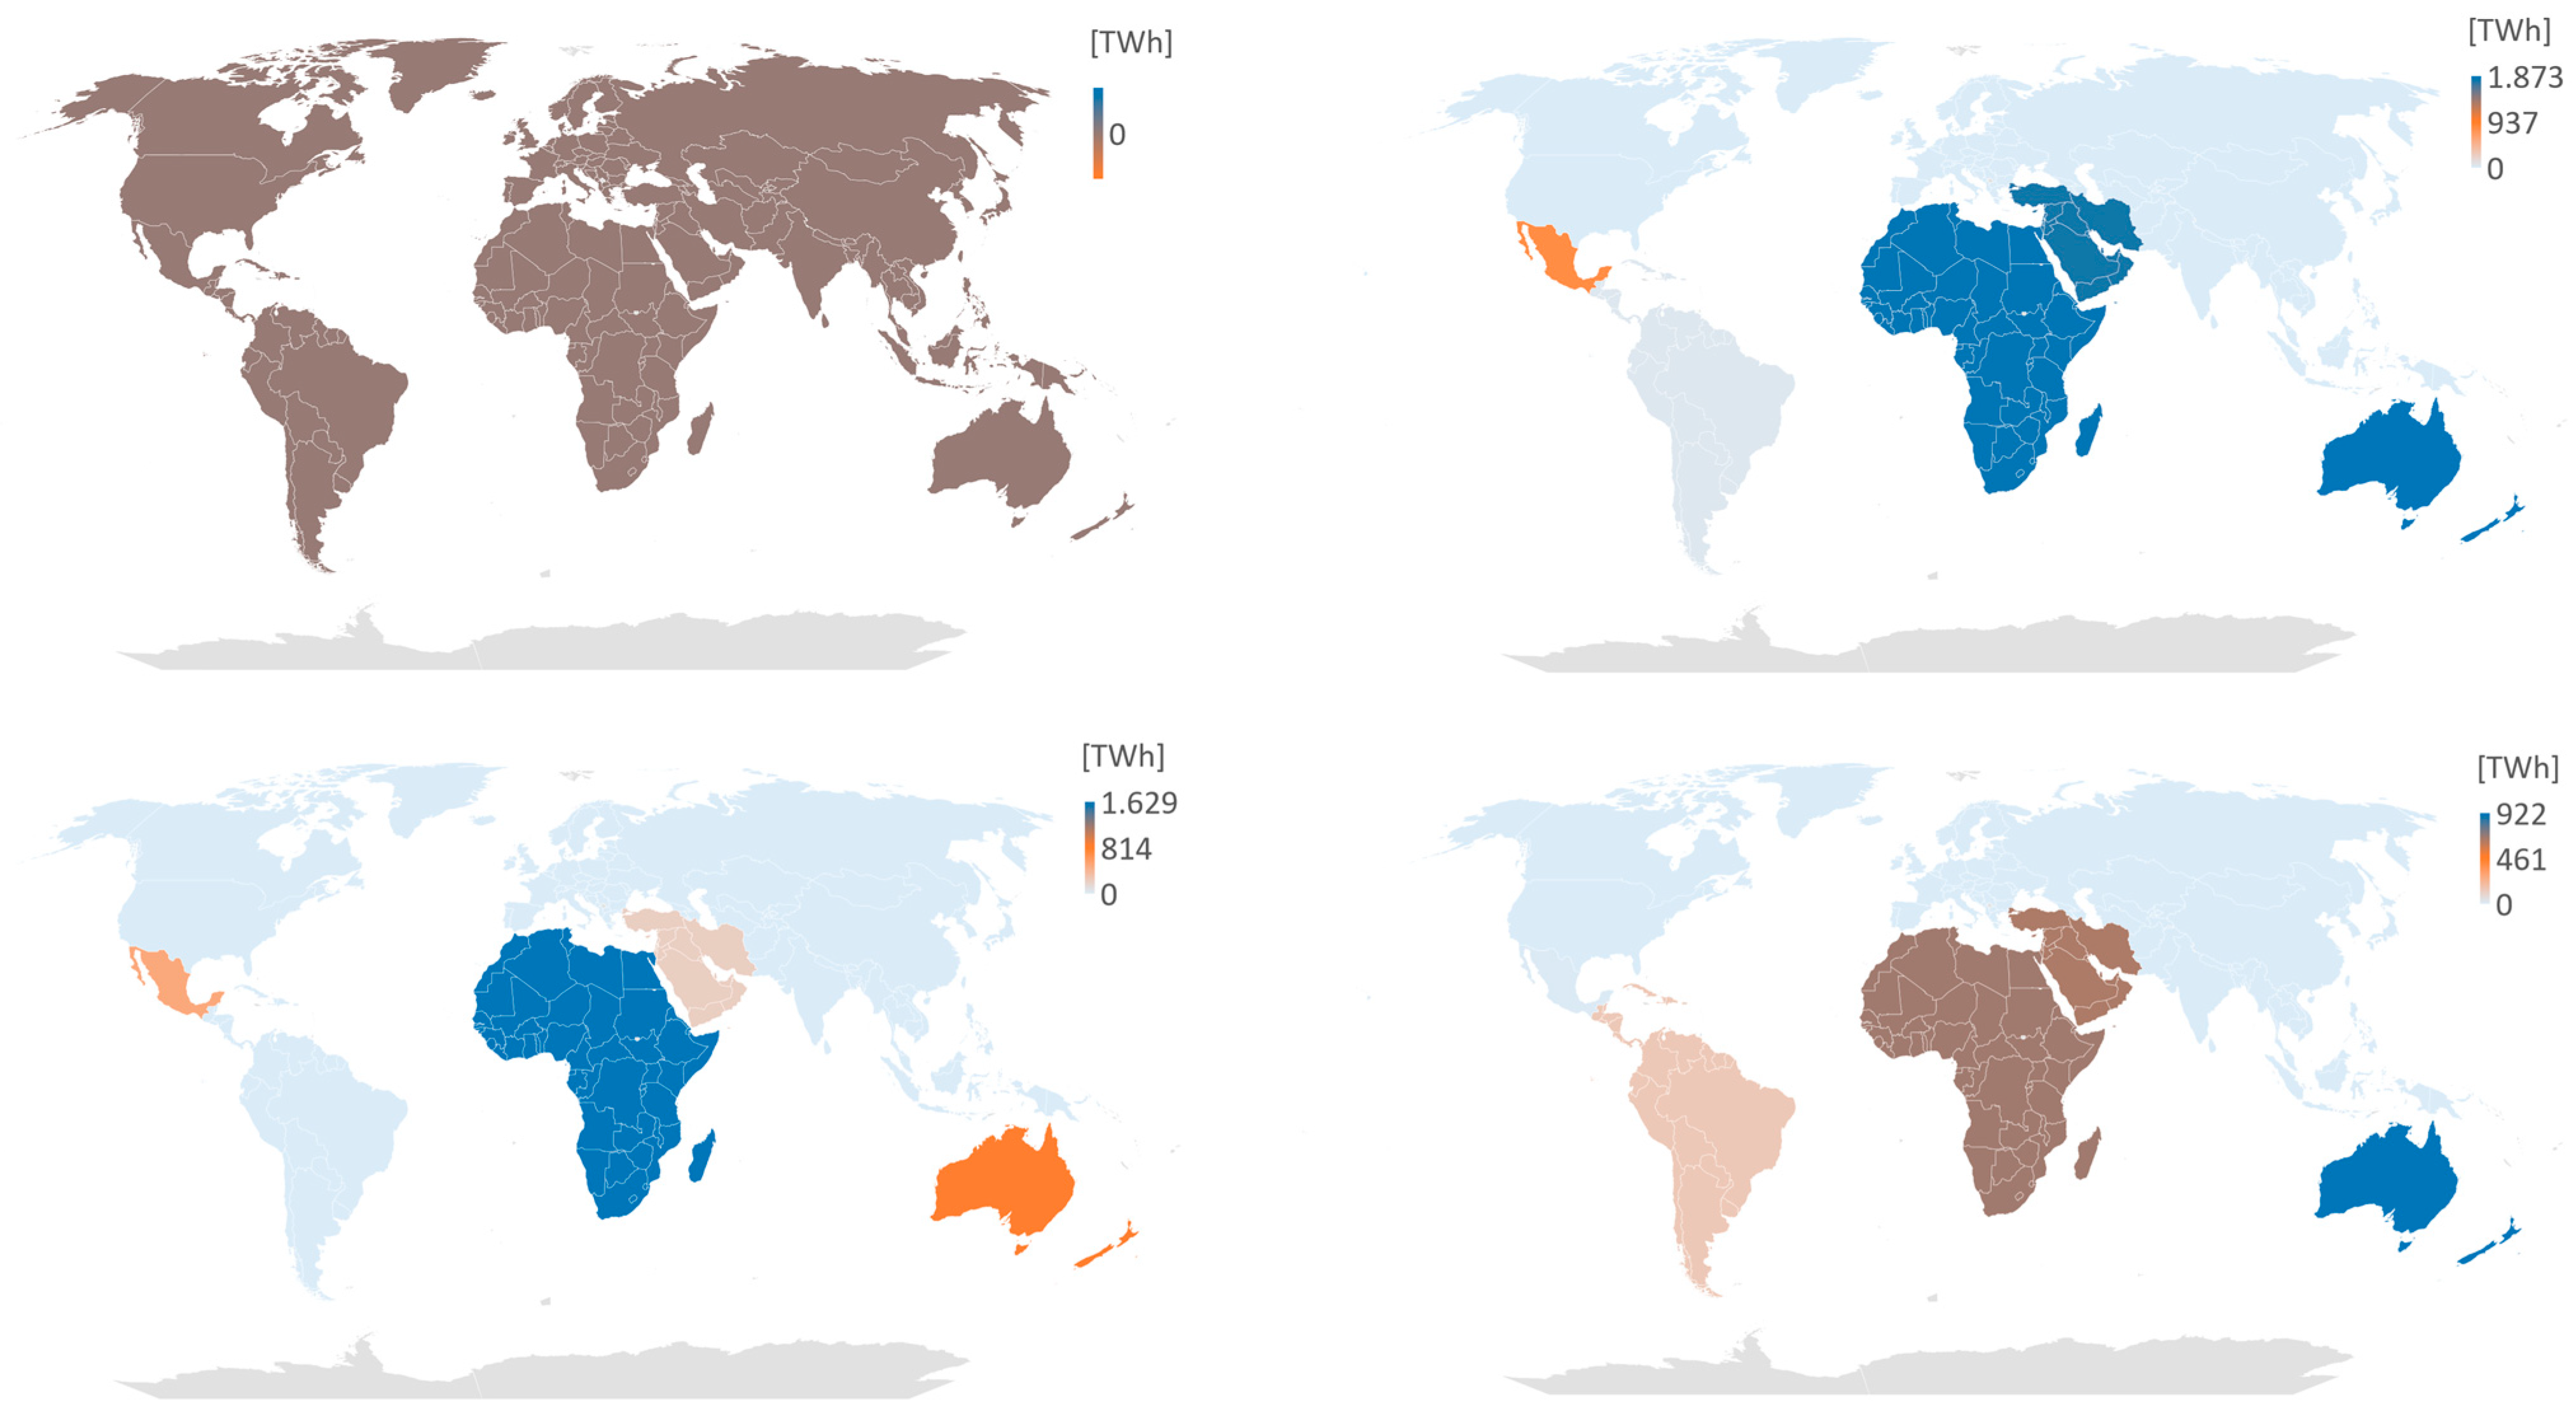
One of the key questions of transforming the energy system towards carbon neutrality is the allocation structure of the hydrogen production. As some regions are limited in adding additional capacities for PV and wind onshore, this could be the limiting factor when trying to keep the carbon budget until 2100. Considering the BAU scenario, the results show that hydrogen is used in the final energy consumption, as seen in Figure 6, and therefore is locally produced. There is no export of hydrogen in 2100, while synfuels are neither produced nor exported; see Figure 7, Figure 8 and Figure 9. The detail value information is found in Table A4.
The structure of production is starting to change as more and more renewable energy capacities are required to satisfy the overall electricity demand; compare Figure 5. Without security of supply applied to trading and production, India has the highest amount of domestic production in the 1_5D scenario with 3153 TWh; see Figure 6. Furthermore, there are certain regions where hydrogen is not produced at all, especially in the whole of Europe and Canada. By applying security of supply to have a minimum production of 50% in each region, there is already a shift visible. While the overall synfuels and hydrogen amount is shrinking in SoS1 compared to 1_5D, it can be seen that hydrogen production is boosting in comparison to synfuels; compare Figure 7 and Figure 9. As a minimum of 50% of domestic production for synfuels and hydrogen is mandatory, the shift is going onwards to hydrogen production; see SoS1 in Figure 7. This is due to the reason that hydrogen production is less energy-intense, and some regions have fewer potentials for PV and wind onshore to produce hydrogen and synfuels. It also depends on the overall structure. Given the case of India, without security of supply in the 1_5D case, the hydrogen production is the highest of all regions while there is no production of synfuels at all (see Figure 9). Synfuels are 100% imported in that case. By adding security of supply with a minimum of 50% domestic production, India is shrinking its hydrogen production while boosting the synfuels production. The residual demand is satisfied by imports of other regions.
Given the case of a minimum of 33% in domestic production and at least two independent trading regions, there is another shift in hydrogen and synfuels allocation visible. Middle East Asia and Africa are starting to boost the hydrogen production in SoS2 as they become the main global exporters; compare Figure 8. As the domestic production share of synfuels and hydrogen on the total demand is less than in SoS1, many regions can use the feasible renewable potentials to produce more local hydrogen as synfuels can be imported to a maximum share of 66%.
The export allocation structure for hydrogen in Figure 8 shows clearly that Middle East Asia has the lowest levelized costs on hydrogen production globally. Furthermore, the location is predestined for LH2 transport to Europe as the distance is relatively short, and transport costs have a huge impact on the total costs of hydrogen. As far as there is no security of supply scenario applied to trading (1_5D and SoS1), Middle East Asia remains the main global exporter of hydrogen.
By adding security of supply to trading in the case of SoS2, Middle East Asia is no longer allowed to satisfy the export demand as one region. This results in Africa and Middle East Asia sharing the export demand, as they both have huge technical potentials as well as being a short distance to Europe, which is the main importer.
In 1_5D, it can be seen that the import demand for synfuels is highest; compare Figure 10. Middle East Asia, Africa and Australia are the main exporters and share more or less the same amount of synfuel exports. Mexico also exports some synfuels, especially to Canada and the US.
Considering the SoS1 scenario, the demand of synfuels export is shrinking, especially in the regions of Middle East Asia and Australia, while the regional allocation structure is still the same. The lowest export demand is observed in the case of SoS2. A switch in export allocation can be seen as Mexico is replaced by Central and South America. Australia, Middle East Asia and Africa still remain the main exporter of synfuels.
5. Conclusions and Outlook
The scenario analysis with the energy system TIAM shows that CO2 mitigation due to technological transformation, electrification and a new allocation of energy carriers, especially hydrogen and synfuels, is necessary.
To achieve the 1.5 °C target, the transformation of the power sector is crucial. On the one hand, a large share of the final energy consumption is covered by direct electric use. On the other hand, it must be ensured that hydrogen and synfuels can be produced despite the high use of electricity to replace those technologies that cannot switch to direct electric, such as aviation, shipping and some high temperature process heat processes in the industrial sector.
The scenario analysis also shows, independently of the import structure and requirements related to security of supply or the diversity of energy imports, that the electricity sector and the end use sectors decarbonize in a fairly similar way. Electricity is the preferred energy source. The share of hydrogen and synfuels depends on the difference in the security of supply policies exogenously applied to the scenarios, but both play an important role in global markets.
In the only scenario with climate action and no security of supply policy, it shows that not all regions start the production of hydrogen and synfuels, because the renewable energy potentials for this are not sufficient and competitive compared to direct electricity usage. This is particularly evident in Europe. Preference in those regions is given to importing hydrogen from Middle East Asia. Synfuels show a higher degree of diversification and therefore a different allocation in terms of export. Africa, Middle East Asia and Australia have similar export shares.
To conclude this investigation, it can be said that the technical renewable potentials are high enough to decarbonize the global energy system. The structure of hydrogen and synfuel allocation is fairly different in the case of security of supply policies on production and trading. Shifts can be observed as sun-rich regions are more predestined to produce hydrogen and synfuels. Furthermore, the transformation process will not only be influenced by the availability of renewable electricity generation, but also by the infrastructure costs, which are included in the supply curves that TIAM is using as an input. This does also have an impact on the energy carrier allocation regarding the final energy consumption, but it does not necessarily threaten the 1.5 °C target.
The energy system model TIAM has a high degree of technology richness. Nevertheless, mitigation strategies are required as material efficiency and circular economy will have a huge impact on the overall energy supply as well as on the hydrogen and synfuel demand. By using secondary routes for material production, direct electric usage could become the leader in certain sectors, e.g., the steel or chemical industries. There are also uncertainties in supply technologies that could lead to a shift towards direct electric use, for example, molten oxide electrolysis for primary steel production. A diffusion with such a technology could potentially set hydrogen demand in primary steel production to almost zero. This example shows the uncertainty related with future hydrogen demands.
It is also unclear how states will behave on boosting the hydrogen economy. As the results show, little changes already have impact on the allocation structure. Moreover, the model results fully rely on levelized costs of hydrogen and synfuels. Tax subsidies such as those in the IRA could lead to a shift in hydrogen production, expansion of renewable energies and therefore, a total new global allocation of energy carriers.
Author Contributions
Conceptualization, F.L. and M.B.; methodology, F.L., M.B., D.F., T.A., P.B., H.H., P.K. and T.H.; validation, F.L. and M.B.; investigation, F.L.; writing—original draft preparation, F.L.; writing—review and editing, D.F., H.H. and P.B.; visualization, F.L.; supervision, M.B. All authors have read and agreed to the published version of the manuscript.
Funding
The major part of this work has been carried out within the framework of the ETSAP-DE project (03EI1032 A-C) funded by the German Federal Ministry for Economic Affairs and Climate Action (BMWK).![Energies 16 03277 i001]()

Data Availability Statement
The data presented in this study is available on request from the corresponding author.
Conflicts of Interest
The authors declare no conflict of interest.
Appendix A
Table A1.
Distance matrix for shipping based on [58].
Table A1.
Distance matrix for shipping based on [58].
| km | CAN | USA | MEX | CSA | EEU | GER | AFR | FSU | MEA | ODA | IND | CHI | SKO | JPN | AUS | WEU |
|---|---|---|---|---|---|---|---|---|---|---|---|---|---|---|---|---|
| CAN | 13,187 | 4820 | 17,600 | 7327 | 6493 | 9587 | 8313 | 13,836 | 15,420 | 16,407 | 22,781 | 21,292 | 18,851 | 23,658 | 5820 | |
| USA | 13,187 | 7200 | 16,051 | 16,337 | 16,727 | 16,776 | 19,076 | 22,646 | 21,843 | 20,577 | 10,648 | 9834 | 9182 | 18,534 | 17,852 | |
| MEX | 4820 | 7200 | 13,296 | 14,546 | 11,147 | 14,904 | 12,464 | 15,554 | 24,272 | 18,997 | 13,105 | 12,323 | 11,521 | 22,000 | 12,284 | |
| CSA | 17,600 | 16,051 | 13,296 | 13,865 | 12,562 | 13,546 | 14,691 | 21,161 | 24,261 | 19,466 | 23,022 | 23,853 | 24,264 | 21,366 | 14,433 | |
| EEU | 7327 | 16,337 | 14,546 | 13,865 | 819 | 6986 | 1191 | 9167 | 16,044 | 12,836 | 21,483 | 22,348 | 22,232 | 20,772 | 1393 | |
| GER | 6493 | 16,727 | 11,147 | 12,562 | 819 | 6722 | 1637 | 8130 | 12,834 | 12,329 | 20,235 | 21,591 | 21,484 | 21,156 | 917 | |
| AFR | 9587 | 16,776 | 14,904 | 13,546 | 6986 | 6722 | 11,349 | 4257 | 8847 | 11,755 | 25,177 | 26,677 | 16,500 | 16,686 | 6412 | |
| FSU | 8313 | 19,076 | 12,464 | 14,691 | 1191 | 1637 | 11,349 | 9852 | 17,188 | 13,854 | 21,903 | 22,888 | 23,430 | 22,641 | 2461 | |
| MEA | 13,836 | 22,646 | 15,554 | 21,161 | 9167 | 8130 | 4257 | 9852 | 4758 | 4254 | 12,530 | 13,119 | 13,497 | 12,895 | 7745 | |
| ODA | 15,420 | 21,843 | 24,272 | 24,261 | 16,044 | 12,834 | 8847 | 17,188 | 4758 | 513 | 10,249 | 10,802 | 12,436 | 9598 | 11,804 | |
| IND | 16,407 | 20,577 | 18,997 | 19,466 | 12,836 | 12,329 | 11,755 | 13,854 | 4254 | 513 | 9539 | 10,308 | 11,100 | 9342 | 11,917 | |
| CHI | 22,781 | 10,648 | 13,105 | 23,022 | 21,483 | 20,235 | 25,177 | 21,903 | 12,530 | 10,249 | 9539 | 838 | 1850 | 8048 | 19,939 | |
| SKO | 21,292 | 9834 | 12,323 | 23,853 | 22,348 | 21,591 | 26,677 | 22,888 | 13,119 | 10,802 | 10,308 | 838 | 1662 | 8792 | 25,557 | |
| JPN | 18,851 | 9182 | 11,521 | 24,264 | 22,232 | 21,484 | 16,500 | 23,430 | 13,497 | 12,436 | 11,100 | 1850 | 1662 | 9542 | 23,037 | |
| AUS | 23,658 | 18,534 | 22,000 | 21,366 | 20,772 | 21,156 | 16,686 | 22,641 | 12,895 | 9598 | 9342 | 8048 | 8792 | 9542 | 20,010 | |
| WEU | 5820 | 17,852 | 12,284 | 14,433 | 1393 | 917 | 6412 | 2461 | 7745 | 11,804 | 11,917 | 19,939 | 25,557 | 23,037 | 20,010 |
Appendix B
Table A2.
Ports in TIAM for hydrogen and synfuel import and export. This is our own research.
| Region | Port Name | Lat | Lon |
|---|---|---|---|
| AFR | Port of Walvis Bay | −2,294,438,616 | 1,448,237,595 |
| SKO | Port of Busan | 3,510,370,188 | 1,290,414,886 |
| CSA | Port of Buenos Aires | −3,456,909,495 | −5,838,273,273 |
| AUS | Fremantle Ports | −320,529,628 | 1,157,408,536 |
| CAN | Port of Quebec | 4,682,265,707 | −7,120,249,041 |
| CHI | Port of Shanghai | 3,063,068,515 | 1220,847,303 |
| GER | Port of Hamburg | 535,410,807 | 9,986,766,343 |
| WEU | Port of Birmingham | 5,363,207,459 | −185,406,508 |
| IND | Mundra Port | 2,274,104,731 | 697,157,146 |
| JPN | Port of Keihin | 3,542,669,641 | 1,396,843,441 |
| AFR | Port of Benghazi | 3,211,470,309 | 200,423,606 |
| MEX | Puerto De Manzanillo | 197,070,599 | −71,744,7426 |
| ODA | Port of Karachi | 2,483,708,206 | 6,698,086,793 |
| EEU | Port of Gdynia | 545,360,318 | 1,853,554,754 |
| FSU | Port of Saint Petersburg | 5,988,860,049 | 3,018,117,919 |
| MEA | Port of Jeddah | 2,149,503,622 | 391,551,345 |
| USA | Port of Los Angeles | 3,372,839,414 | −1,182,402,335 |
Appendix C
Table A3.
Description of TIAM regions; compare [59].
Table A3.
Description of TIAM regions; compare [59].
| TIAM Region | Region Name | Further Description |
|---|---|---|
| AFR | Africa | Full African continent |
| AUS | Australia | Australia, New Zealand |
| CAN | Canada | - |
| CHI | China | - |
| CSA | Central and South America | Full South America and North America except Canada, USA and Mexico |
| EEU | Eastern European Union | Albania, Bosnia–Herzegovina, Bulgaria, Croatia, Czech Republic, Hungary, Macedonia, Poland, Romania, Slovakia, Slovenia, Yugoslavia |
| FSU | Former Soviet Union | Russia and old Soviet states |
| GER | Germany | - |
| IND | India | - |
| JPN | Japan | - |
| MEX | Mexico | - |
| MEA | Middle East Asia | Near East except Africa |
| ODA | Other Developing Asia | Asia except China, India, Japan and South Korea |
| SKO | South Korea | - |
| USA | United States of America | - |
| WEU | Western European Union | Portugal, Spain, France, Great Britain, Sweden, Norway, Finland, Italy, Greece, Switzerland, Austria |
Appendix D
Table A4.
Production and export amounts of hydrogen and synfuels. All values in TWh.
| Hydrogen Production | Hydrogen Export | Synfuel Production | Synfuel Export | |||||||||||||
|---|---|---|---|---|---|---|---|---|---|---|---|---|---|---|---|---|
| BAU | 1_5D | SoS1 | SoS2 | BAU | 1_5D | SoS1 | SoS2 | BAU | 1_5D | SoS1 | SoS2 | BAU | 1_5D | SoS1 | SoS2 | |
| AFR | 125 | 1154 | 1276 | 2593 | 0 | 13 | 18 | 866 | 0 | 1959 | 1941 | 984 | 0 | 1835 | 1629 | 672 |
| AUS | 15 | 13 | 39 | 59 | 0 | 0 | 0 | 32 | 0 | 1873 | 939 | 984 | 0 | 1873 | 852 | 922 |
| CAN | 11 | 2 | 4 | 2 | 0 | 0 | 0 | 0 | 0 | 0 | 8 | 5 | 0 | 0 | 0 | 0 |
| CHI | 826 | 734 | 734 | 1050 | 0 | 0 | 0 | 0 | 0 | 0 | 487 | 318 | 0 | 0 | 0 | 92 |
| CSA | 247 | 972 | 871 | 894 | 0 | 0 | 0 | 0 | 0 | 184 | 21 | 217 | 0 | 41 | 0 | 152 |
| EEU | 4 | 8 | 10 | 6 | 0 | 0 | 0 | 0 | 0 | 0 | 6 | 4 | 0 | 0 | 0 | 0 |
| FSU | 180 | 1577 | 1416 | 1477 | 0 | 0 | 0 | 0 | 0 | 0 | 121 | 75 | 0 | 0 | 0 | 0 |
| GER | 18 | 0 | 8 | 5 | 0 | 0 | 0 | 0 | 0 | 0 | 30 | 20 | 0 | 0 | 0 | 0 |
| IND | 59 | 3153 | 2962 | 3035 | 0 | 0 | 0 | 0 | 0 | 0 | 139 | 86 | 0 | 0 | 0 | 0 |
| JPN | 53 | 31 | 49 | 25 | 0 | 0 | 0 | 0 | 0 | 0 | 46 | 36 | 0 | 0 | 0 | 0 |
| MEA | 589 | 2480 | 3736 | 2431 | 0 | 1236 | 2202 | 898 | 0 | 2187 | 957 | 976 | 0 | 1764 | 220 | 650 |
| MEX | 27 | 10 | 7 | 5 | 0 | 0 | 0 | 0 | 0 | 838 | 585 | 91 | 0 | 811 | 501 | 7 |
| ODA | 875 | 1485 | 1227 | 1205 | 0 | 0 | 0 | 0 | 0 | 0 | 334 | 228 | 0 | 0 | 0 | 0 |
| SKO | 102 | 14 | 41 | 25 | 0 | 0 | 0 | 0 | 0 | 0 | 23 | 25 | 0 | 0 | 0 | 0 |
| USA | 189 | 850 | 850 | 817 | 0 | 0 | 0 | 0 | 0 | 0 | 318 | 807 | 0 | 0 | 0 | 0 |
| WEU | 323 | 36 | 146 | 93 | 0 | 0 | 0 | 0 | 0 | 0 | 180 | 112 | 0 | 0 | 0 | 0 |
References
- United Nations. Framework Convention on Climate Change (COP21) Paris Agreement. 2016. Available online: https://unfccc.int/process-and-meetings/the-paris-agreement/the-paris-agreement (accessed on 22 January 2023).
- IPCC. Mitigation Pathways Compatible with 1.5 °C in the Context in the Context of Sustainable Development; IPCC: Geneva, Switzerland, 2018. [Google Scholar]
- GlobalCarbonAtlas. 2023. Available online: http://www.globalcarbonatlas.org/en/CO2-emissions (accessed on 28 February 2023).
- BP. Statistical Review of World Energy 2022. 2022. Available online: https://www.bp.com/en/global/corporate/energy-economics/statistical-review-of-world-energy.html (accessed on 28 February 2023).
- European Commission. Communication from the Comission to the European Parliament. The European Green Deal. 2019. Available online: https://commission.europa.eu/publications/communication-european-green-deal_en (accessed on 2 March 2023).
- Bundesregierung Deutschland. Klimaschutzgesetz. 2021. Available online: https://www.bundesregierung.de/breg-de/themen/klimaschutz/klimaschutzgesetz-2021-1913672 (accessed on 7 February 2023).
- Senate of the United States. Inflation Reduction Act. 2022. Available online: https://www.democrats.senate.gov/imo/media/doc/inflation_reduction_act_of_2022.pdf (accessed on 25 January 2023).
- Agora Verkehrswende; Agora Energiewende. Die Zukünftigen Kosten Strombasierter Synthetischer Brennstoffe. 2018. Available online: https://www.agora-energiewende.de/fileadmin/Projekte/2017/SynKost_2050/Agora_SynCost-Studie_WEB.pdf (accessed on 2 March 2023).
- Nikolaidis, P.; Poullikkas, A. A comparative overview of hydrogen production processes. Renew. Sustain. Energy Rev. 2017, 67, 597–611. [Google Scholar] [CrossRef]
- Schmidt, P.; Batteiger, V.; Roth, A.; Weindorf, W.; Raksha, T. Power-to-Liquids as Renewable Fuel Option for Aviation: A Review. Chem. Ing. Tech. 2018, 90, 127–140. [Google Scholar] [CrossRef]
- Fasihi, M.; Bogdanov, D.; Breyer, C. Techno-Economic Assessment of Power-to-Liquids (PtL) Fuels Production and Global Trading Based on Hybrid PV-Wind Power Plants. Energy Procedia 2016, 99, 243–268. [Google Scholar] [CrossRef] [Green Version]
- Chapman, A.J.; Fraser, T.; Itaoka, K. Hydrogen import pathway comparison framework incorporating cost and social preference: Case studies from Australia to Japan. Int. J. Energy Res. 2017, 41, 2374–2391. [Google Scholar] [CrossRef]
- Rosen, M.A.; Koohi-Fayegh, S. The prospects for hydrogen as an energy carrier: An overview of hydrogen energy and hydrogen energy systems. Energy Ecol. Environ. 2016, 1, 10–29. [Google Scholar] [CrossRef] [Green Version]
- Fasihi, M.; Bogdanov, D.; Breyer, C. Long-Term Hydrocarbon Trade Options for the Maghreb Region and Europe—Renewable Energy Based Synthetic Fuels for a Net Zero Emissions World. Sustainability 2017, 9, 306. [Google Scholar] [CrossRef] [Green Version]
- Ueckerdt, F.; Bauer, C.; Dirnaichner, A.; Everall, J.; Sacchi, R.; Luderer, G. Potential and risks of hydrogen-based e-fuels in climate change mitigation. Nat. Clim. Chang. 2021, 11, 384–393. [Google Scholar] [CrossRef]
- Blanco, H.; Nijs, W.; Ruf, J.; Faaij, A. Potential for hydrogen and Power-to-Liquid in a low-carbon EU energy system using cost optimization. Appl. Energy 2018, 232, 617–639. [Google Scholar] [CrossRef]
- European Union. Assessment of Hydrogen Delivery Options. 2011. Available online: https://joint-research-centre.ec.europa.eu/system/files/2021-06/jrc124206_assessment_of_hydrogen_delivery_options.pdf (accessed on 2 March 2023).
- IRENA. Global Hydrogen Trade to Meet the 1.5 °C Climate Goal. Part II: Technology Review of Hydrogen Carriers. 2022. Available online: https://www.irena.org/publications/2022/Apr/Global-hydrogen-trade-Part-II (accessed on 2 March 2023).
- Brändle, G.; Schönfisch, M.; Schulte, S. Estimating Long-Term Global Supply Costs for Low-Carbon Hydrogen. 2020. Available online: https://www.ewi.uni-koeln.de/cms/wp-content/uploads/2021/03/EWI_WP_20-04_Estimating_long-term_global_supply_costs_for_low-carbon_Schoenfisch_Braendle_Schulte-1.pdf (accessed on 2 March 2023).
- Niermann, M.; Timmerberg, S.; Drünert, S.; Kaltschmitt, M. Liquid Organic Hydrogen Carriers and alternatives for international transport of renewable hydrogen. Renew. Sustain. Energy Rev. 2021, 135, 110171. [Google Scholar] [CrossRef]
- DLR. Wasserstoff als ein Fundament der Energiewende. Teil 1: Technologien und Perspektiven für Eine Nachhaltige und ökonomische Wasserstoffversorgung. 2020. Available online: https://elib.dlr.de/137796/1/DLR_Wasserstoffstudie_Teil_1_final.pdf (accessed on 2 March 2023).
- Gallardo, F.I.; Monforti Ferrario, A.; Lamagna, M.; Bocci, E.; Garcia, D.A.; Baeza-Jeria, T.E. A Techno-Economic Analysis of solar hydrogen production by electrolysis in the north of Chile and the case of exportation from Atacama Desert to Japan. Int. J. Hydrogen Energy 2021, 46, 13709–13728. [Google Scholar] [CrossRef]
- Wijayanta, A.T.; Oda, T.; Purnomo, C.W.; Kashiwagi, T.; Aziz, M. Liquid hydrogen, methylcyclohexane, and ammonia as potential hydrogen storage: Comparison review. Int. J. Hydrogen Energy 2019, 44, 15026–15044. [Google Scholar] [CrossRef]
- Ishimoto, Y.; Voldsund, M.; Nekså, P.; Roussanaly, S.; Berstad, D.; Gardarsdottir, S.O. Large-scale production and transport of hydrogen from Norway to Europe and Japan: Value chain analysis and comparison of liquid hydrogen and ammonia as energy carriers. Int. J. Hydrogen Energy 2020, 45, 32865–32883. [Google Scholar] [CrossRef]
- Stiller, C.; Svensson, A.M.; Møller-Holst, S.; Bünger, U.; Espegren, K.A.; Holm, Ø.B.; Tomasgard, A. Options for CO2-lean hydrogen export from Norway to Germany. Energy 2008, 33, 1623–1633. [Google Scholar] [CrossRef]
- Kamiya, S.; Nishimura, M.; Harada, E. Study on Introduction of CO2 Free Energy to Japan with Liquid Hydrogen. Phys. Procedia 2015, 67, 11–19. [Google Scholar] [CrossRef] [Green Version]
- Fraunhofer IWES. Mittel- Und Langfristige Potenziale Von Ptl-Und H2-Importen Aus Internationalen Ee-Vorzugsregionen. 2017. Available online: https://www.erneuerbar-mobil.de/sites/default/files/2019-10/Teilbericht_Potenziale_PtL_H2_Importe_FraunhoferIWES.pdf (accessed on 28 February 2023).
- Teichmann, D.; Arlt, W.; Wasserscheid, P. Liquid Organic Hydrogen Carriers as an efficient vector for the transport and storage of renewable energy. Int. J. Hydrogen Energy 2012, 37, 18118–18132. [Google Scholar] [CrossRef]
- Heuser, M.P.; Grube, T.; Heinrichs, H.; Robinius, M.; Stolten, D. Worldwide Hydrogen Provision Scheme Based on Re-newable Energy. 2020. Available online: https://www.preprints.org/manuscript/202002.0100/v1 (accessed on 2 March 2023).
- adelphi Consult GmbH. Grüner Wasserstoff: Internationale Kooperationspotenziale für Deutschland. Kurzanalyse zu ausgewählten Aspekten potenzieller Nicht-EU-Partnerländer. 2020. Available online: https://www.adelphi.de/de/system/files/mediathek/bilder/Gr%C3%BCner%20Wasserstoff_Internationale%20Kooperationspotenziale%20f%C3%BCr%20Deutschland_finale%20Version.pdf (accessed on 2 March 2023).
- Yue, M.; Lambert, H.; Pahon, E.; Roche, R.; Jemei, S.; Hissel, D. Hydrogen energy systems: A critical review of technologies, applications, trends and challenges. Renew. Sustain. Energy Rev. 2021, 146, 111180. [Google Scholar] [CrossRef]
- Staffell, I.; Scamman, D.; Velazquez Abad, A.; Balcombe, P.; Dodds, P.E.; Ekins, P.; Shah, N.; Ward, K.R. The role of hydrogen and fuel cells in the global energy system. Energy Environ. Sci. 2019, 12, 463–491. [Google Scholar] [CrossRef] [Green Version]
- Brandon, N.P.; Kurban, Z. Clean energy and the hydrogen economy. Philos. Trans. R. Soc. A Math. Phys. Eng. Sci. 2017, 375, 20160400. [Google Scholar] [CrossRef] [PubMed] [Green Version]
- Quarton, C.J.; Tlili, O.; Welder, L.; Mansilla, C.; Blanco, H.; Heinrichs, H.; Leaver, J.; Samsatli, N.J.; Lucchese, P.; Robinius, M.; et al. The curious case of the conflicting roles of hydrogen in global energy scenarios. Sustain. Energy Fuels 2020, 4, 80–95. [Google Scholar] [CrossRef] [Green Version]
- Dodds, P.E.; Staffell, I.; Hawkes, A.D.; Li, F.; Grünewald, P.; McDowall, W.; Ekins, P. Hydrogen and fuel cell technologies for heating: A review. Int. J. Hydrogen Energy 2015, 40, 2065–2083. [Google Scholar] [CrossRef] [Green Version]
- International Renewable Energy Agency (IRENA). Green Hydrogen for Industry: A Guide to Policy Making. 2022. Available online: https://www.irena.org/publications/2022/Mar/Green-Hydrogen-for-Industry (accessed on 2 March 2023).
- Deutsche Energie-Agentur GmbH. Dena-Leitstudie Aufbruch Klimaneutralitaet. 2021. Available online: https://www.dena.de/fileadmin/dena/Publikationen/PDFs/2021/Abschlussbericht_dena-Leitstudie_Aufbruch_Klimaneutralitaet.pdf (accessed on 2 March 2023).
- BCG. Klimapfade 2.0. Ein Wirtschaftsprogramm für Klima und Zukunft. 2021. Available online: https://web-assets.bcg.com/f2/de/1fd134914bfaa34c51e07718709b/klimapfade2-gesamtstudie-vorabversion-de.pdf (accessed on 2 March 2023).
- Luderer, G.; Kost, C.; Sörgel, D. Deutschland auf dem Weg zur Klimaneutralität 2045—Szenarien und Pfade im Modellvergleich. 2021. Available online: https://ariadneprojekt.de/media/2021/11/Ariadne_Szenarienreport_Oktober2021_Kapitel1_Gesamtperspektive.pdf (accessed on 2 March 2023).
- Sensfuss, F.; Sensfuß, F.; Lux, B.; Bernath, C.; Kiefer, C.; Pfluger, B.; Kleinschmitt, C.; Franke, K.; Deac, G.; Brugger, H.; et al. Langfristszenarien für die Transformation des Energiesystems in Deutschland 3. Kurzbericht: 3 Hauptszenarien. 2021. Available online: https://www.isi.fraunhofer.de/content/dam/isi/dokumente/cce/2021/LFS_Kurzbericht.pdf (accessed on 2 March 2023).
- Öko-Institut e.V.; Wuppertal Institut; Prognos. Klimaneutrales Deutschland 2045. 2021. Available online: https://static.agora-energiewende.de/fileadmin/Projekte/2021/2021_04_KNDE45/A-EW_209_KNDE2045_Zusammenfassung_DE_WEB.pdf (accessed on 2 March 2023).
- ETSAP TIMES Documentation—Part II. Available online: https://github.com/etsap-TIMES/TIMES_Documentation/blob/master/Documentation_for_the_TIMES_Model-Part-II.pdf (accessed on 7 February 2023).
- Remme, U. Overview of TIMES: Parameters, Primal Variables & Equations. 2007. Available online: https://iea-etsap.org/workshop/brazil_11_2007/times-remme.pdf (accessed on 2 March 2023).
- Franzmann, D.; Heinrichs, H.; Lippkau, F.; Addanki, T.; Winkler, C.; Buchenberg, P.; Hamacher, T.; Blesl, M.; Linßen, J.; Stolten, D. Future Projections of Global Green Liquid Hydrogen Cost-Potentials for Export Needs. arXiv 2023. [Google Scholar] [CrossRef]
- Welder, L.; Ryberg, D.; Kotzur, L.; Grube, T.; Robinius, M.; Stolten, D. Spatio-temporal optimization of a future energy system for power-to-hydrogen applications in Germany. Energy 2018, 158, 1130–1149. [Google Scholar] [CrossRef]
- Pietzcker, R.C.; Osorio, S.; Rodrigues, R. Tightening EU ETS targets in line with the European Green Deal: Impacts on the decarbonization of the EU power sector. Appl. Energy 2021, 293, 116914. [Google Scholar] [CrossRef]
- IEA. Projected Costs of Generating Electricity. 2020. Available online: https://www.iea.org/reports/projected-costs-of-generating-electricity-2020 (accessed on 3 March 2023).
- Kost, C.; Schlegl, T.; Fraunhofer ISE. Stromgestehungskosten erneuerbare Energien. 2018. Available online: https://www.ise.fraunhofer.de/content/dam/ise/de/documents/publications/studies/DE2018_ISE_Studie_Stromgestehungskosten_Erneuerbare_Energien.pdf (accessed on 28 February 2023).
- TUM-ENS Urbs. Available online: https://github.com/tum-ens/urbs (accessed on 7 February 2023).
- Buchenberg, P.; Addanki, T.; Franzmann, D.; Winkler, C.; Lippkau, F.; Hamacher, T.; Kuhn, P.; Heinrichs, H.; Blesl, M. Global Potentials and Costs of Synfuels via Fischer–Tropsch Process. Energies 2023, 16, 1976. [Google Scholar] [CrossRef]
- Pyo, M.-J.; Moon, S.-W.; Kim, T.-S. A Comparative Feasibility Study of the Use of Hydrogen Produced from Surplus Wind Power for a Gas Turbine Combined Cycle Power Plant. Energies 2021, 14, 8342. [Google Scholar] [CrossRef]
- IEA. Technology Roadmap Hydrogen and Fuel Cells. 2015. Available online: https://www.iea.org/reports/technology-roadmap-hydrogen-and-fuel-cells (accessed on 2 March 2023).
- International Energy Agency—IEA. The Future of Hydrogen; IEA: Paris, France, 2019. [Google Scholar]
- CSIRO. Opportunities for Hydrogen in Commercial Aviation. 2020. Available online: https://www.csiro.au/-/media/Do-Business/Files/Futures/Boeing-Opportunities-for-hydrogen-in-commercial-aviation.pdf (accessed on 2 March 2023).
- McKinsey & Company. Hydrogen-Powered Aviation. A Fact-Based Study of Hydrogen Technology, Economics, and Climate Impact by 2050. 2020. Available online: https://op.europa.eu/en/publication-detail/-/publication/55fe3eb1-cc8a-11ea-adf7-01aa75ed71a1/language-en (accessed on 28 February 2023).
- IEA. G20 Hydrogen Report: Assumptions. 2020. Available online: https://iea.blob.core.windows.net/assets/a02a0c80-77b2-462e-a9d5-1099e0e572ce/IEA-The-Future-of-Hydrogen-Assumptions-Annex.pdf (accessed on 2 March 2023).
- Noland, J.K. Hydrogen Electric Airplanes: A disruptive technological path to clean up the aviation sector. IEEE Electrif. Mag. 2021, 9, 92–102. [Google Scholar] [CrossRef]
- Routescanner. Available online: https://www.routescanner.com/ (accessed on 7 January 2023).
- ETSAP-TIAM: Some Details on Model and Database. Available online: https://iea-etsap.org/TIAM_f/TIAM%20description_slides.pdf (accessed on 20 January 2023).
Figure 1.
TIAM map with selected harbors (red dots) for each region.

Figure 2.
Energy system model TIAM scheme. Source: [43].
Figure 2.
Energy system model TIAM scheme. Source: [43].

Figure 3.
Implementation of aggregated cost supply curves shown on the example of hydrogen.

Figure 4.
Global CO2 emissions across all scenarios.

Figure 5.
Global electricity generation.

Figure 6.
Global final energy consumption along all scenarios. BAU is top left, 1_5D is top right, SoS1 is bottom left and SoS2 is bottom right.
Figure 6.
Global final energy consumption along all scenarios. BAU is top left, 1_5D is top right, SoS1 is bottom left and SoS2 is bottom right.

Figure 7.
Hydrogen production along all scenarios in 2100. BAU is top left, 1_5D is top right, SoS1 is bottom left and SoS2 is bottom right.
Figure 7.
Hydrogen production along all scenarios in 2100. BAU is top left, 1_5D is top right, SoS1 is bottom left and SoS2 is bottom right.

Figure 8.
Hydrogen Export along all scenarios in 2100. BAU is top left, 1_5D is top right, SoS1 is bottom left and SoS2 is bottom right.
Figure 8.
Hydrogen Export along all scenarios in 2100. BAU is top left, 1_5D is top right, SoS1 is bottom left and SoS2 is bottom right.

Figure 9.
Synfuel production along all scenarios in 2100. BAU is top left, 1_5D is top right, SoS1 is bottom left and SoS2 is bottom right.
Figure 9.
Synfuel production along all scenarios in 2100. BAU is top left, 1_5D is top right, SoS1 is bottom left and SoS2 is bottom right.

Figure 10.
Synfuel export along all scenarios in 2100. BAU is top left, 1_5D is top right, SoS1 is bottom left and SoS2 is bottom right.
Figure 10.
Synfuel export along all scenarios in 2100. BAU is top left, 1_5D is top right, SoS1 is bottom left and SoS2 is bottom right.

Table 2.
Liquid green hydrogen export potentials and costs per region in 2050 [44].
Table 2.
Liquid green hydrogen export potentials and costs per region in 2050 [44].
| AFR | AUS | CAN | CHI | CSA | GER | EEU | FSU | IND | JPN | SKO | MEA | MEX | ODA | USA | WEU | |
|---|---|---|---|---|---|---|---|---|---|---|---|---|---|---|---|---|
| Potential [TWh] | 188 | 433 | 76.9 | 155 | 154 | 0.5 | 1.1 | 104 | 21.8 | 0.7 | 0.1 | 196 | 53.6 | 24.5 | 128 | 3.8 |
| Minimal Costs [EUR/MWh] | 58.5 | 71.6 | 117 | 99.4 | 62.4 | 94 | 93 | 76.2 | 70.8 | 89 | 85 | 53.9 | 103 | 63.8 | 79.4 | 84.7 |
Table 3.
Synfuels’ export potentials and costs per TIAM regions in 2050 [50].
Table 3.
Synfuels’ export potentials and costs per TIAM regions in 2050 [50].
| AFR | AUS | CAN | CHI | CSA | GER | EEU | FSU | IND | JPN | SKO | MEA | MEX | ODA | USA | WEU | |
|---|---|---|---|---|---|---|---|---|---|---|---|---|---|---|---|---|
| Potential [TWh] | 139,463 | 321,855 | 54,953 | 113,924 | 113,060 | 436 | 873 | 83,303 | 16,120 | 482 | 112 | 145,219 | 39,621 | 18,158 | 95,650 | 2839 |
| Minimal Costs [EUR/MWh] | 80.3 | 81.6 | 117.9 | 82.4 | 80.8 | 97.8 | 94.1 | 100.9 | 88.8 | 108.9 | 94.6 | 81.1 | 85.0 | 79.9 | 90.3 | 85.0 |
Table 4.
Scenario description.
| No. | Scenario Name | Description |
|---|---|---|
| 1 | BAU | No climate policy. |
| 2 | 1_5D | 1.5 °C conform scenario based on given CO2 budget for 2015–2100 (cf. [2]). |
| 3 | SoS1 | Security of Supply scenario, based on 1_5D scenario. Further implementation: at least 50% of hydrogen and synfuels must be out of domestic production. No restriction for trading. |
| 4 | SoS2 | Security of Supply scenario, based on 1_5D scenario. Further implementation: at least 33% of hydrogen and synfuels must be out of domestic production. At least two trading partners. Each trading partner can satisfy a maximum share of 33% of the local demand. |
Disclaimer/Publisher’s Note: The statements, opinions and data contained in all publications are solely those of the individual author(s) and contributor(s) and not of MDPI and/or the editor(s). MDPI and/or the editor(s) disclaim responsibility for any injury to people or property resulting from any ideas, methods, instructions or products referred to in the content. |
© 2023 by the authors. Licensee MDPI, Basel, Switzerland. This article is an open access article distributed under the terms and conditions of the Creative Commons Attribution (CC BY) license (https://creativecommons.org/licenses/by/4.0/).
Share and Cite
MDPI and ACS Style
Lippkau, F.; Franzmann, D.; Addanki, T.; Buchenberg, P.; Heinrichs, H.; Kuhn, P.; Hamacher, T.; Blesl, M. Global Hydrogen and Synfuel Exchanges in an Emission-Free Energy System. Energies 2023, 16, 3277. https://doi.org/10.3390/en16073277
AMA Style
Lippkau F, Franzmann D, Addanki T, Buchenberg P, Heinrichs H, Kuhn P, Hamacher T, Blesl M. Global Hydrogen and Synfuel Exchanges in an Emission-Free Energy System. Energies. 2023; 16(7):3277. https://doi.org/10.3390/en16073277
Chicago/Turabian StyleLippkau, Felix, David Franzmann, Thushara Addanki, Patrick Buchenberg, Heidi Heinrichs, Philipp Kuhn, Thomas Hamacher, and Markus Blesl. 2023. "Global Hydrogen and Synfuel Exchanges in an Emission-Free Energy System" Energies 16, no. 7: 3277. https://doi.org/10.3390/en16073277
Note that from the first issue of 2016, this journal uses article numbers instead of page numbers. See further details here.