Article

Gas Hydrates Reserve Characterization Using Thermo-Hydro-Mechanical Numerical Simulation: A Case Study of Green Canyon 955, Gulf of Mexico

1
Formerly Craft and Hawkins Department of Petroleum Engineering, Louisiana State University, Baton Rouge, LA 70803, USA
2
Craft and Hawkins Department of Petroleum Engineering, Louisiana State University, Baton Rouge, LA 70803, USA
*
Authors to whom correspondence should be addressed.
Energies 2023, 16(7), 3275; https://doi.org/10.3390/en16073275
Submission received: 15 February 2023 / Revised: 28 March 2023 / Accepted: 4 April 2023 / Published: 6 April 2023
(This article belongs to the Section H: Geo-Energy)

Abstract

:
The Gulf of Mexico is a widely explored and producing region for offshore oil and gas resources, with significant submarine methane hydrates. Estimates of hydrate saturation and distribution rely on drilling expeditions and seismic surveys that tend to provide either large-scale estimates or highly localized well data. In this study, hydrate reserve characterization is done using numerical simulation at Green Canyon block 955 (GC955). In addition, coupled thermo-hydro-mechanical (THM) simulation results show that hydrate saturation and geobody distribution are determined by the thermodynamic conditions as well as reservoir structures, stratigraphic differences, and permeability differences. Hydrate formation due to upflow of free gas and dissociation due to gas production and oceanic temperature rise due to climate change are simulated. The abundance of free gas under the hydrate stability zone and favorable pressure and temperature meant little hydrate was depleted from the reservoir. Furthermore, the maximum displacement due to warming reached 0.5 m in 100 years and 4.2 m in 180 days based on a simulation of constant production of methane gas. The displacement direction and magnitude suggest that there is little possibility of slope failure. Therefore, the GC955 site studied in this paper can be considered a favorable site for potential hydrate exploitation.

1. Introduction

Gas hydrates are ice-like compounds with gas molecules trapped in the crystalline structure. The gas molecule can be methane, ethane, propane, carbon dioxide, or a combination of two or more gases, although the majority of natural hydrate reserves predominantly consist of methane gas [1]. They are formed at high pressure and low temperature conditions with sufficient gas and water molecules in submarine sediments and permafrost [1,2]. Submarine gas hydrates are observed around the world, with some locations having large hydrate saturations that can potentially be used as energy sources [3]. Although the energy potential is immense, uncertainties in production capacity, limitations in existing technologies, economic feasibility, and potential geological risks have thwarted the production of methane gas from hydrates [3,4]. Furthermore, the potential impact of the exploitation of hydrate resources on climate change needs to be studied. The thermodynamic stability of methane hydrates is studied to characterize and quantify hydrate reserves [5,6,7]. Hydrates are naturally unstable at atmospheric conditions, which pose a challenge for experimental and field estimation of hydrate resources [8]. The study of subsurface pressure and temperature, pore water salinity, and the availability of hydrate-forming gas are used to statistically quantify hydrate reserves [9]. The depths at which hydrate formation is possible according to the thermodynamic properties of porewater and hydrate-forming gases are known as the gas hydrate stability zone (GHSZ). Depending on the source of the gas, hydrates can be thermogenic (formed by the migration of deep-lying methane gas) or biogenic (formed by the biological production of methane gas), which is usually determined by the gas content and age of hydrates [6]. The relative position of rock matrix may or may not be affected while hydrate crystals spread in pore spaces [4].
The Gulf of Mexico is one of the regions that has been extensively studied for hydrate occurrence. It is an area that is exploited for hydrocarbon resources such as oil and gas and has a large presence of research and industry infrastructure dedicated to producing and transporting hydrocarbon resources. There are 56 permanent platforms and 547 permanent boreholes in the region at water depths greater than 1000 feet [10], and at its peak, 1.6 billion barrels of oil were being produced annually [11]. It is estimated that there are 607 trillion cubic meters of gas hydrates in the Gulf of Mexico [12]. The nature and formation mechanism of hydrates depends on the region, thermodynamic conditions, and the availability of hydrate-forming gases. There is evidence of both biogenic and thermogenic methane hydrates [13,14,15,16,17,18,19,20]. Due to its energy potential and importance, a joint industry project (JIP) was formed in 2001 with industry partners and the US Mineral Management Service [21]. Two drilling expeditions from the JIP collected logging-while-drilling (LWD) data from the northern Gulf of Mexico to evaluate and characterize the hydrate reserve in the area (Figure 1) [21,22]. The leg I drilling expedition focused on locations at Atwater Valley and Keathley Canyon to study hydrate occurrence [21]. The leg II expedition drilled at Alaminos Canyon, Green Canyon, and Walker Ridge [22]. The two expeditions have formed the basis for other expeditions and research on gas hydrates in the region. In this study, we focus on the Green Canyon Block 955 that was drilled as part of the JIP leg II expedition [22,23].
Green Canyon Block 955 (GC955) in the Gulf of Mexico is a channel levee system that is known to contain large amounts of hydrates [22,24]. Sandstone reservoirs at GC955 are known to host a large amount of hydrates at high saturation [24]. The GC955 lease block is about 235 km south of New Orleans in the Gulf of Mexico [25]. It has been estimated using logging-while-drilling (LWD) data that the GC955 site contains highly saturated hydrates of up to 80% in a sandy zone approximately 30 m thick [23,26,27]. It is part of the Deepwater Mississippi Delta, which consists of channels and levee systems [24]. The seafloor dips in a south-east direction at a depth of 1975–2250 m [28]. The site is highly faulted and compartmentalized, with some faults acting as high-permeability conduits for gas migration from deeper gas sources to the hydrate stability zone [20,24]. Three LWD site data sets, namely GC955-H, GC955-Q, and GC955-I, are available from the JIP expeditions that provide an in-depth estimation of hydrate presence in the area [12]. The three sites are at depths of 2033 m, 2033 m, and 1986 m from sea level, respectively, and the base of the hydrate system is observed at an average of about 400 m below the seafloor, as represented by the three sites [24]. The hydrate distribution is likely heterogeneous and subdivided into layers of different thickness; however, in the scope of this study, a lower resolution grid size is used, and we are assuming that the hydrates are continuously distributed across the depths. At the GC955-H site, it is likely that the hydrates are divided into three distinct layers, with the thickest layer at around 250 m below the seafloor and water-saturated sand in between [12,20]. In contrast, the GC955-Q zone is characterized by a gas layer below the hydrate-bearing zone observed with a distinct bottom simulating reflector (BSR) [24,25]. It is observed using seismic imaging that the hydrate layer may not be continuous and may be separated by a large gas chimney running through the two sites [25]. High-resolution seismic images were interpreted using the full-wave inversion method [25], and Archie’s method was used to estimate hydrate saturation from the LWD resistivity data [26]. Haines et al. [24] estimate that a total reservoir volume of 6.6 × 10⁸ m3 of gas is in place in the form of gas hydrates. Recent investigation in the region estimates a highly saturated hydrate layer at 413–442 m depth, with 79–93% of the porous volume occupied by gas hydrates in sandy-silty sediments [14]. There are interbedded zones with lower hydrate saturation (less than 30%) [29]. Furthermore, a different data collection expedition at the GC955 block found anticlinal structures, a clay-rich seal layer, and fault zones acting as pathways as well as compartmentalizing structures [20]. They also postulate that long-distance free gas transport from deeper sources into the hydrate stability zone is the major driving force in hydrate formation at GC955 [20].
At the GC955 site, a sandy layer lies at the base of the hydrate stability zone (BHSZ) [20,23]. The site is characterized by interbedded sandy and clayey silts with a reservoir interval of about 26 m. The sandy silts are rich in hydrates, reaching hydrate saturation levels higher than 80%, with clayey silts containing very little hydrate [20]. Hydrate formation in submarine sediments may occur due to local biogenesis, local diffusion, methane recycling, solidification of the gas reservoir, or upward migration of water-soluble and free methane gas [19]. Transport of methane gas may occur due to diffusion of dissolved gas, advection of dissolved gas, or advection of free gas [19]. In order to characterize hydrate reserves, we must understand the formation mechanism of hydrates. Free and dissolved gas migration in submarine sediments has been studied extensively to hypothesize the formation mechanism of hydrates [19,30,31,32,33]. Different formation mechanisms for hydrates in the region have been suggested [13,15,16,34,35,36,37,38]. One of the suggested phenomena is the upward migration of methane gas into the hydrate stability zone to form the hydrate-rich layer [34,39]. The nature and composition of methane gas collected from the hydrates in the region suggest that it is biogenic in nature with some contribution from thermogenic sources [18,19,20,40]. However, the presence of an underlying gas layer with major fault zones acting as highly permeable pathways suggests that the formation mechanism is upflow over short and long distances [20,24,34,35,37].
Production simulations with an inclined sandy hydrate-rich layer between shale layers performed at Nankai Trough, Japan, indicated that paralleling the hydrate layer increases production efficiency [41]. Yadav et al. [42] used microwave heating to couple with depressurization to enhance production. Wu et al. [43] employed a coupled thermo-hydro-chemical (THC) method to perform production simulation by depressurization. Wei et al. [44] determined the geomechanical properties of hydrate-bearing sediments from the South China Sea. Similarly, numerical simulation-based resource characterization has been previously done to quantify submarine hydrate reserves [19,31,37,40,45,46,47,48,49,50]. However, the dynamic nature of the reservoir, considering the formation timeline and structural and stratigraphic details, has been taken into consideration in this study. It has been established that geological structures, stratigraphic thickness, and permeability anisotropies impact hydrate distribution and geobodies [45,46]. In this study, we use field data from past studies and use a well-established geomechanical model and methodology to simulate hydrate formation and dissociation using both coupled thermo-hydro (TH) simulation and thermo-hydro-mechanical (THM) simulation and compare the two methodologies. Multiphysics simulations have their own inherent higher computational costs and complexity [51]. However, they are more representative of the natural and scientific processes ranging from geological systems [52,53,54] to energy system modeling [55,56]. We use high-resolution seismic data interpretations [24,25] and LWD data from GC955-H and GC955-Q [12,23] to create a representative reservoir model and simulate the formation of hydrates between the two sites. The same hydrate-bearing reservoir model is used to simulate the dissociation of hydrates and quantify gas production and geohazards associated with it. This study adds to the previous literature on the hydrate reserves in the Gulf of Mexico by incorporating the formation and dissociation models into a single THM framework.

2. Methodology

This study uses numerical simulation for the characterization of the gas hydrate reserve at the GC955 site between two wells (GC955-Q and GC955-H) and the exploration of geohazards due to hydrate dissociation. For the characterization of hydrate resources, we have used numerical tools (TOUGH + Hydrate [57]) to simulate the formation of gas hydrates in the region. It is assumed that, at initial conditions, there is a natural gas deposit below the hydrate stability zone, starting at around 300–500 m depth below the sea floor [24,25]. Numerous faults run through the hydrate stability zone, and the gas deposits function as flow conduits. We have attempted to mimic short- and long-distance migration of methane gas from the deeper gas sources by using previously employed numerical tools [45,46,47]. Reservoir characterization is done by using a coupled heat and mass transport model (TH) in TOUGH + Hydrate [57] and a coupled thermo-hydro-mechanical (THM) model in TOUGH + Hydrate + FLAC3D [58]. The reservoir model is based on the seismic images and LWD data collected at the GC955-Q and GC-955-H sites and the literature available from the Green Canyon block [12,21,22,23,24,25,59]. The model is two-dimensional, 1.5 km long, and 700 m thick, with a gentle slope of 3% toward the east (Figure 2). The grid discretization of 20 m × 20 m is used with four major faults of one grid length and width each. The mesh size sensitivity of the model was performed on a mesh size of 10–50 m [45,46,47] with less than 5% deviation between primary variables. The porosity and lithology distribution are based on the LWD data interpolated using a Python code between the two sites [60].
Initially, a hydrostatic pressure profile and thermal gradient of 32 °C/km are assumed, with the seafloor temperature assumed to be uniform at 4 °C [61,62]. The porosity is interpolated based on density porosity logs from the two LWD sites [22] and ranges from 0.4 to 0.7 with a decreasing trend with depth as sediments are more consolidated. The permeability ranges from (3.0 × 10⁻¹⁶ m2) to 9.3 md (9.3 × 10⁻¹⁵ m2) and is interpolated based on porosity values and lithological classification [63]. The vertical permeability is increased by two orders of magnitude in the fault zones. Geomechanical stress is initialized by assuming a vertical stress of 19 MPa/km and a maximum horizontal stress equal to the vertical stress parallel to the model [64]. The boundaries of the model are assumed to be no-flow boundaries on all sides except the top of the model. The top of the model slopes from west to east, with constant pressure and temperature at the seafloor. The seafloor depths are at 1986 m below seafloor at well GC955-Q and 2033 m below seafloor at well GC955-H. In addition, the bottom of the model has source terms that mimic the flow of free gas from deeper gas sources.
The stable hydrate reserve is subjected to hydrate dissociation scenarios: warming of the ocean floor and depressurization for gas production. The scenarios are tested using the TOUGH + Hydrate + FLAC3D THM model [57,58,65] to quantitatively analyze the production potential and associated geohazards in the region.
The warming scenario assumes that the seafloor temperature rises by up to 1 °C over the next 100 years, and three different cases are simulated with different warming rates [47,66,67]. Depressurization is performed using a horizontal well at a depth of 450 m, targeting the highly saturated coarse-grained layer. Production is performed at a constant rate of 0.1 kg/s from the well, and hydrate dissociation, gas production, and displacement are observed after 180 days based on realistic production scenarios employed in the South China Sea [68]. THM modeling is performed using the TOUGH + Hydrate + FLAC3D methodology [58]. The coupling is done at each timestep to update the porosity and permeability based on stress calculated from FLAC3D [65], and pore pressure, temperature, and phase saturations are updated after each TOUGH + Hydrate timestep [58,69].
· σ + ρ g = 0
where σ is the effective stress tensor, g is the acceleration due to gravity, and ρ is the average density of the mass considered.
In this study, we use the structure I type hydrates [2] that are the most common in submarine sediments and a modified Mohr-Coulomb failure criterion to an elastoplastic mechanical model on the host medium, taking the cementing effect of hydrates into account [58,70]. Rutqvist, J., and G. Moridis [58] presented a linear model relating cohesion, bulk, and shear moduli with hydrate saturation based on Toyura sand [71]. While it is a widely used model for predicting the geomechanical strength of hydrate-bearing sands, in this study, we use predicted moduli based on sonic logs from GC955 [25] (Equations (2)–(4)). The linear model is extrapolated based on hydrate saturation and sonic velocity at saturations ranging from 0–60%. The change in moduli is assumed to be linearly dependent on hydrate saturation.
K = 2000 + 6667 S h
G = 1200 + 3000 S h
c = 0.5 + 1.5 S h
where K is the bulk modulus of elasticity, G is the shear modulus of elasticity, and c is the cohesion (MPa). Sh is the hydrate saturation in fractions (0–1). The frictional angle and dilation angle are fixed for cementitious hydrate-bearing sediments at 30° and 10°, respectively.
Conservation of mass and energy consists of the mass and heat accumulation term (MK), flux term (FK), and source/sink term (qK) for component K.
d d t V n M K d V = Γ n F K · n   ^ d A ^ + V n q K d V
The geomechanical part of the simulator is solved by a forward explicit scheme to a static state at each timestep, while TOUGH + Hydrate uses the Newton-Raphson method for first-order fully implicit time integration and an integrated finite difference method for space discretization [52].
The numerical simulation was performed on a Dell Precision T7810 Windows computer (Dell Inc., Round Rock, TX, USA) with 32 GB of RAM and Intel i7 processors with a 2.2 GHz processing speed. The parallel capability of TOUGH + Hydrate [52] was not used in this study. The runtimes for the simulation ranged from 4 h to 72 h, depending on the complexity of the simulations and the inclusion of geomechanics.
The THM model is used to model three different simulation cases:
  • Reservoir characterization of the prolific hydrate-bearing region of the Green Canyon 955 site between two wells, GC955-Q and GC955-H.
  • Warming of seafloor temperature by 1 °C over the next 100 years, mimicking a rise in seawater and bottom water temperature due to climate change.
  • Production of methane gas from the hydrate reserve using a horizontal well between the two previously drilled wells at the hydrate stability zone.

3. Results

Reservoir characterization by numerical simulation is achieved by using a coupled heat and mass transport model (TH) in TOUGH + Hydrate [57] and a coupled thermo-hydro-mechanical (THM) model in TOUGH + Hydrate + FLAC3D [57,58,65]. Three different cases are simulated, where we investigate the importance of inter-well details in reservoir characterization and the impact of using a coupled THM model.

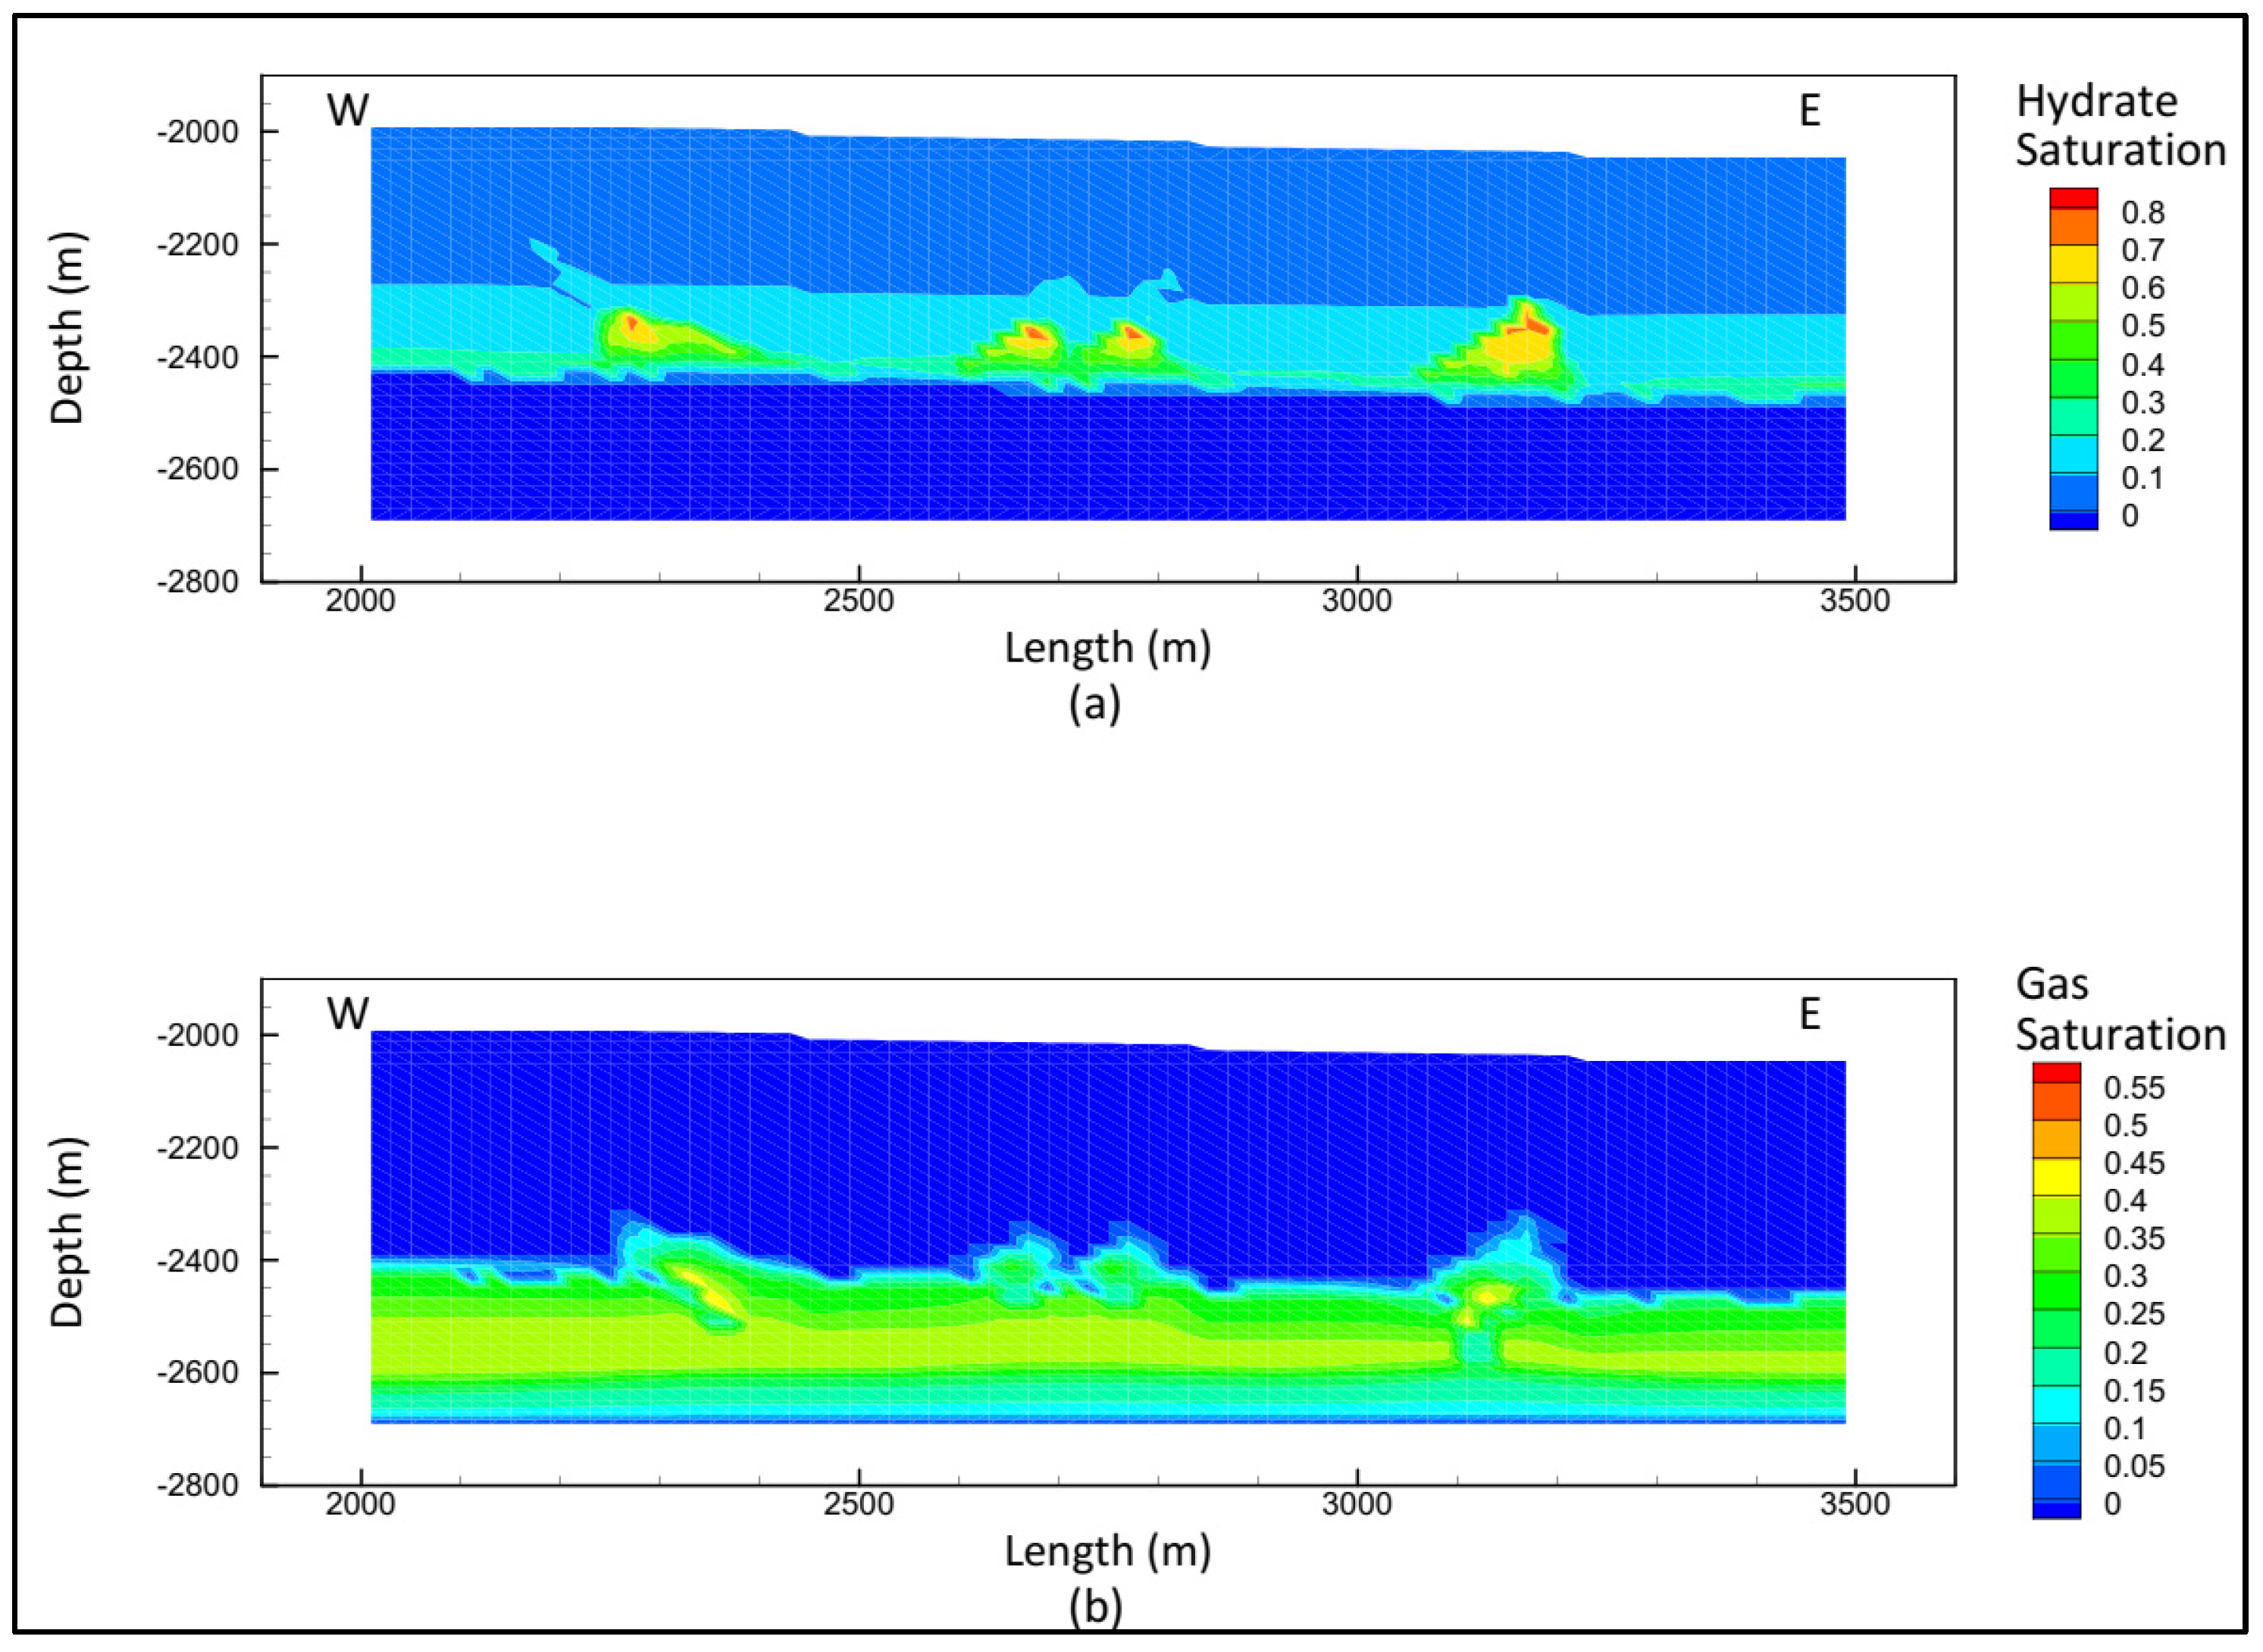
3.1. Reservoir Characterization of Hydrate Formation

The first case assumes that there are no high-permeability faults acting as pathways. A slow upward migration of gas occurs to form a hydrate zone above the gas layer (Figure 3). The migration of gas occurs due to buoyancy, and the absence of faults makes the process slow. The total hydrate mass reached 3 × 10⁷ kg per unit cross-section depth. It takes about 100 thousand years for the reservoir to reach steady-state conditions, which is much higher than the estimated formation timeline for hydrates in the region [72]. The model suggests that a reservoir model based on well data interpolation alone cannot accurately predict the complex formation mechanism of submarine hydrates [19,45].
A second characterization model is simulated using seismic data and includes the four major high-permeable faults in the reservoir model. The simulation resulted in a more complex hydrate formation, with hydrates forming around fault zones at a higher concentration and gas migrating upwards through the faults. The major migration mechanism for the deeper gas source is the permeability difference between the faults combined with buoyancy. The hydrate reservoir reaches a steady state after about 16,000 years and yields a total hydrate mass of 5.1 × 10⁷ kg per unit cross-section depth. The maximum hydrate saturation in the reservoir reached 78% (Figure 4).
A third hydrate formation model is simulated employing the coupled THM model. The THM model reached steady state earlier, after just less than 15,000 years, and a slightly higher hydrate saturation (82%) is observed (Figure 5). The total mass of the hydrates within the reservoir is less than 4.7 × 10⁷ kg per unit cross-sectional depth. The maximum hydrate saturation corroborates the high saturation values observed by Haines et al. [24]. Since the saturations were estimated based on resistivity logs, both models with fault zones can be classified as accurate characterizations of the hydrate reserves.
In all three characterization models, the hydrate stability zone is at a depth of 300–450 m below sea floor. The hydrates are more concentrated along the depths of 400–450 m and along the fault zones. In all three models, the upward migration of methane gas from the gas-rich reservoir zone to the hydrate stability zone is the major formation mechanism for hydrates [34]. In order to accurately implement the dissociation scenarios in the hydrate reserve, we used the THM model.

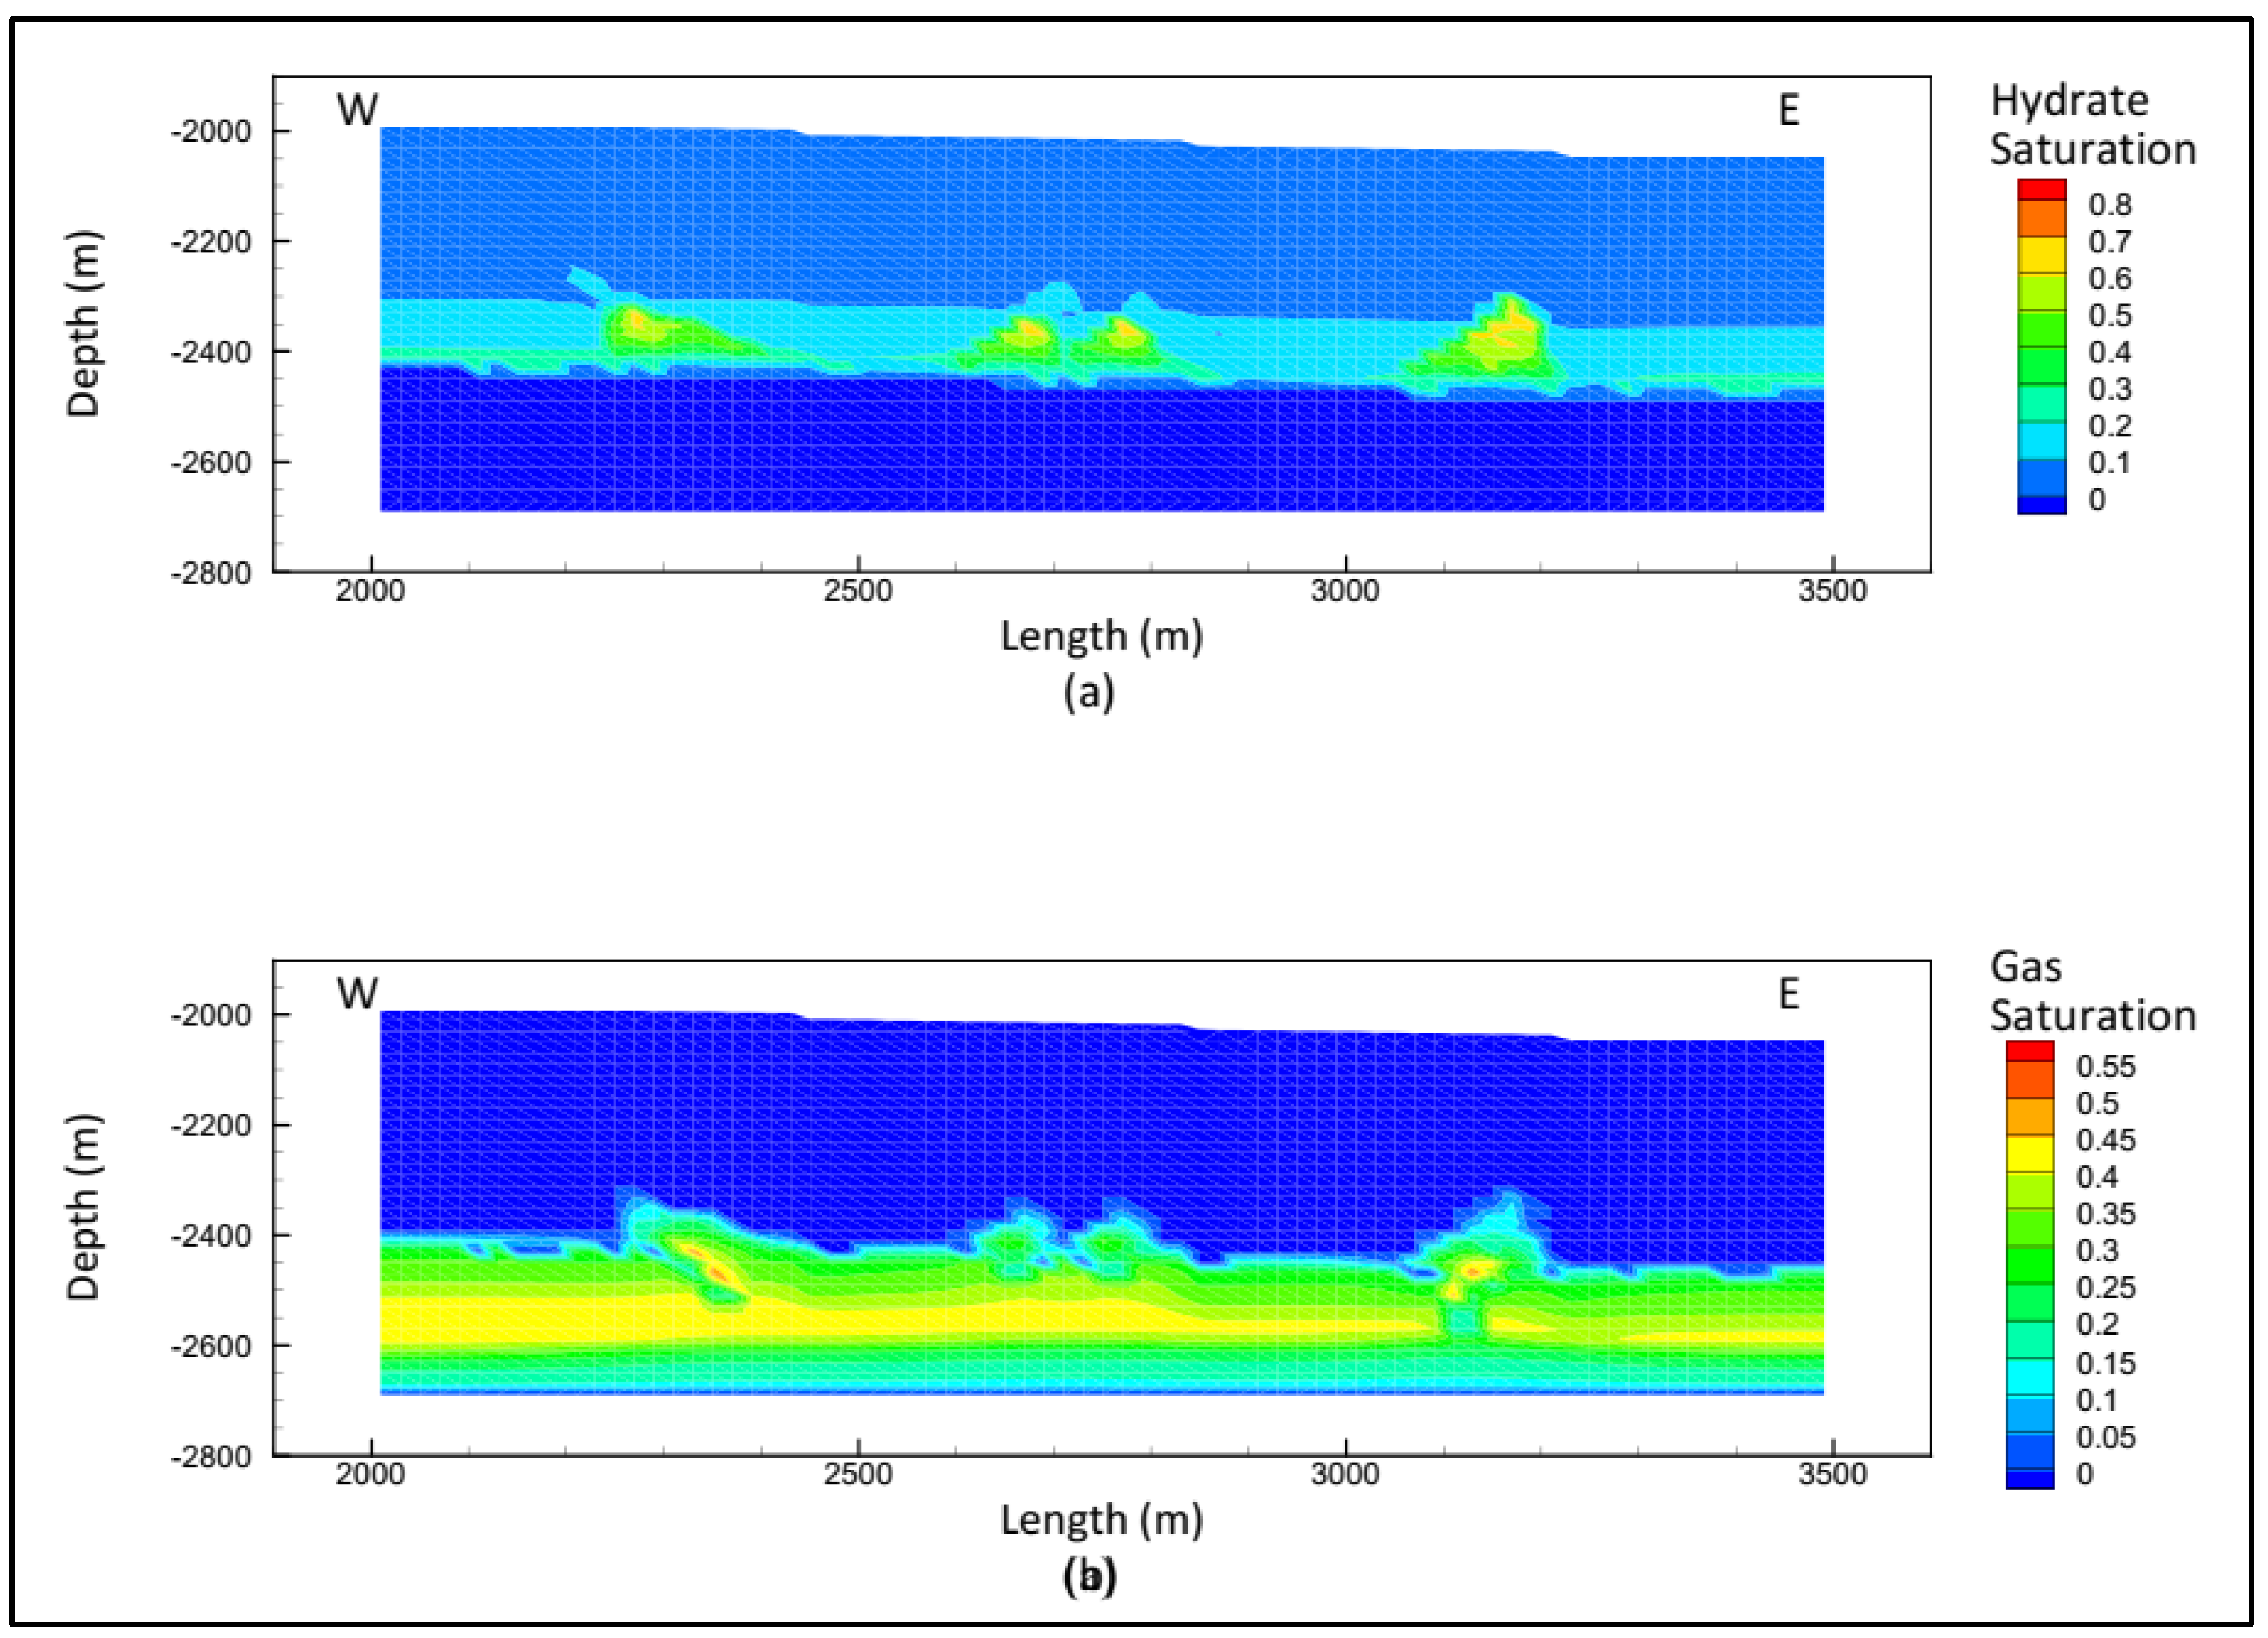
3.2. Dissociation Due to Warming of the Seafloor

The model assumes a steady increase in seafloor temperature of 1 °C over the next 100 years based on climate predictions for the region [67]. The boundary conditions are the same except for the top layer, which increases in temperature. The overall mass of the hydrate in the reservoir decreases by 2.6 × 10⁵ kg, and the hydrate saturation decreases by 0.1%, which closely matches with the predicted methane release rate from the Gulf of Mexico [67]. The hydrate dissociation initiated along the base of the hydrate zone, and the gas layer along the bottom increased in volume (Figure 6).
The decline in strength due to the hydrate dissociation causes the overall reservoir to undergo negligible compaction with a maximum displacement of 0.5 m (Figure 7). Considering the large domain and the time period, the displacement cannot be considered significant enough to cause concern for geological stability.

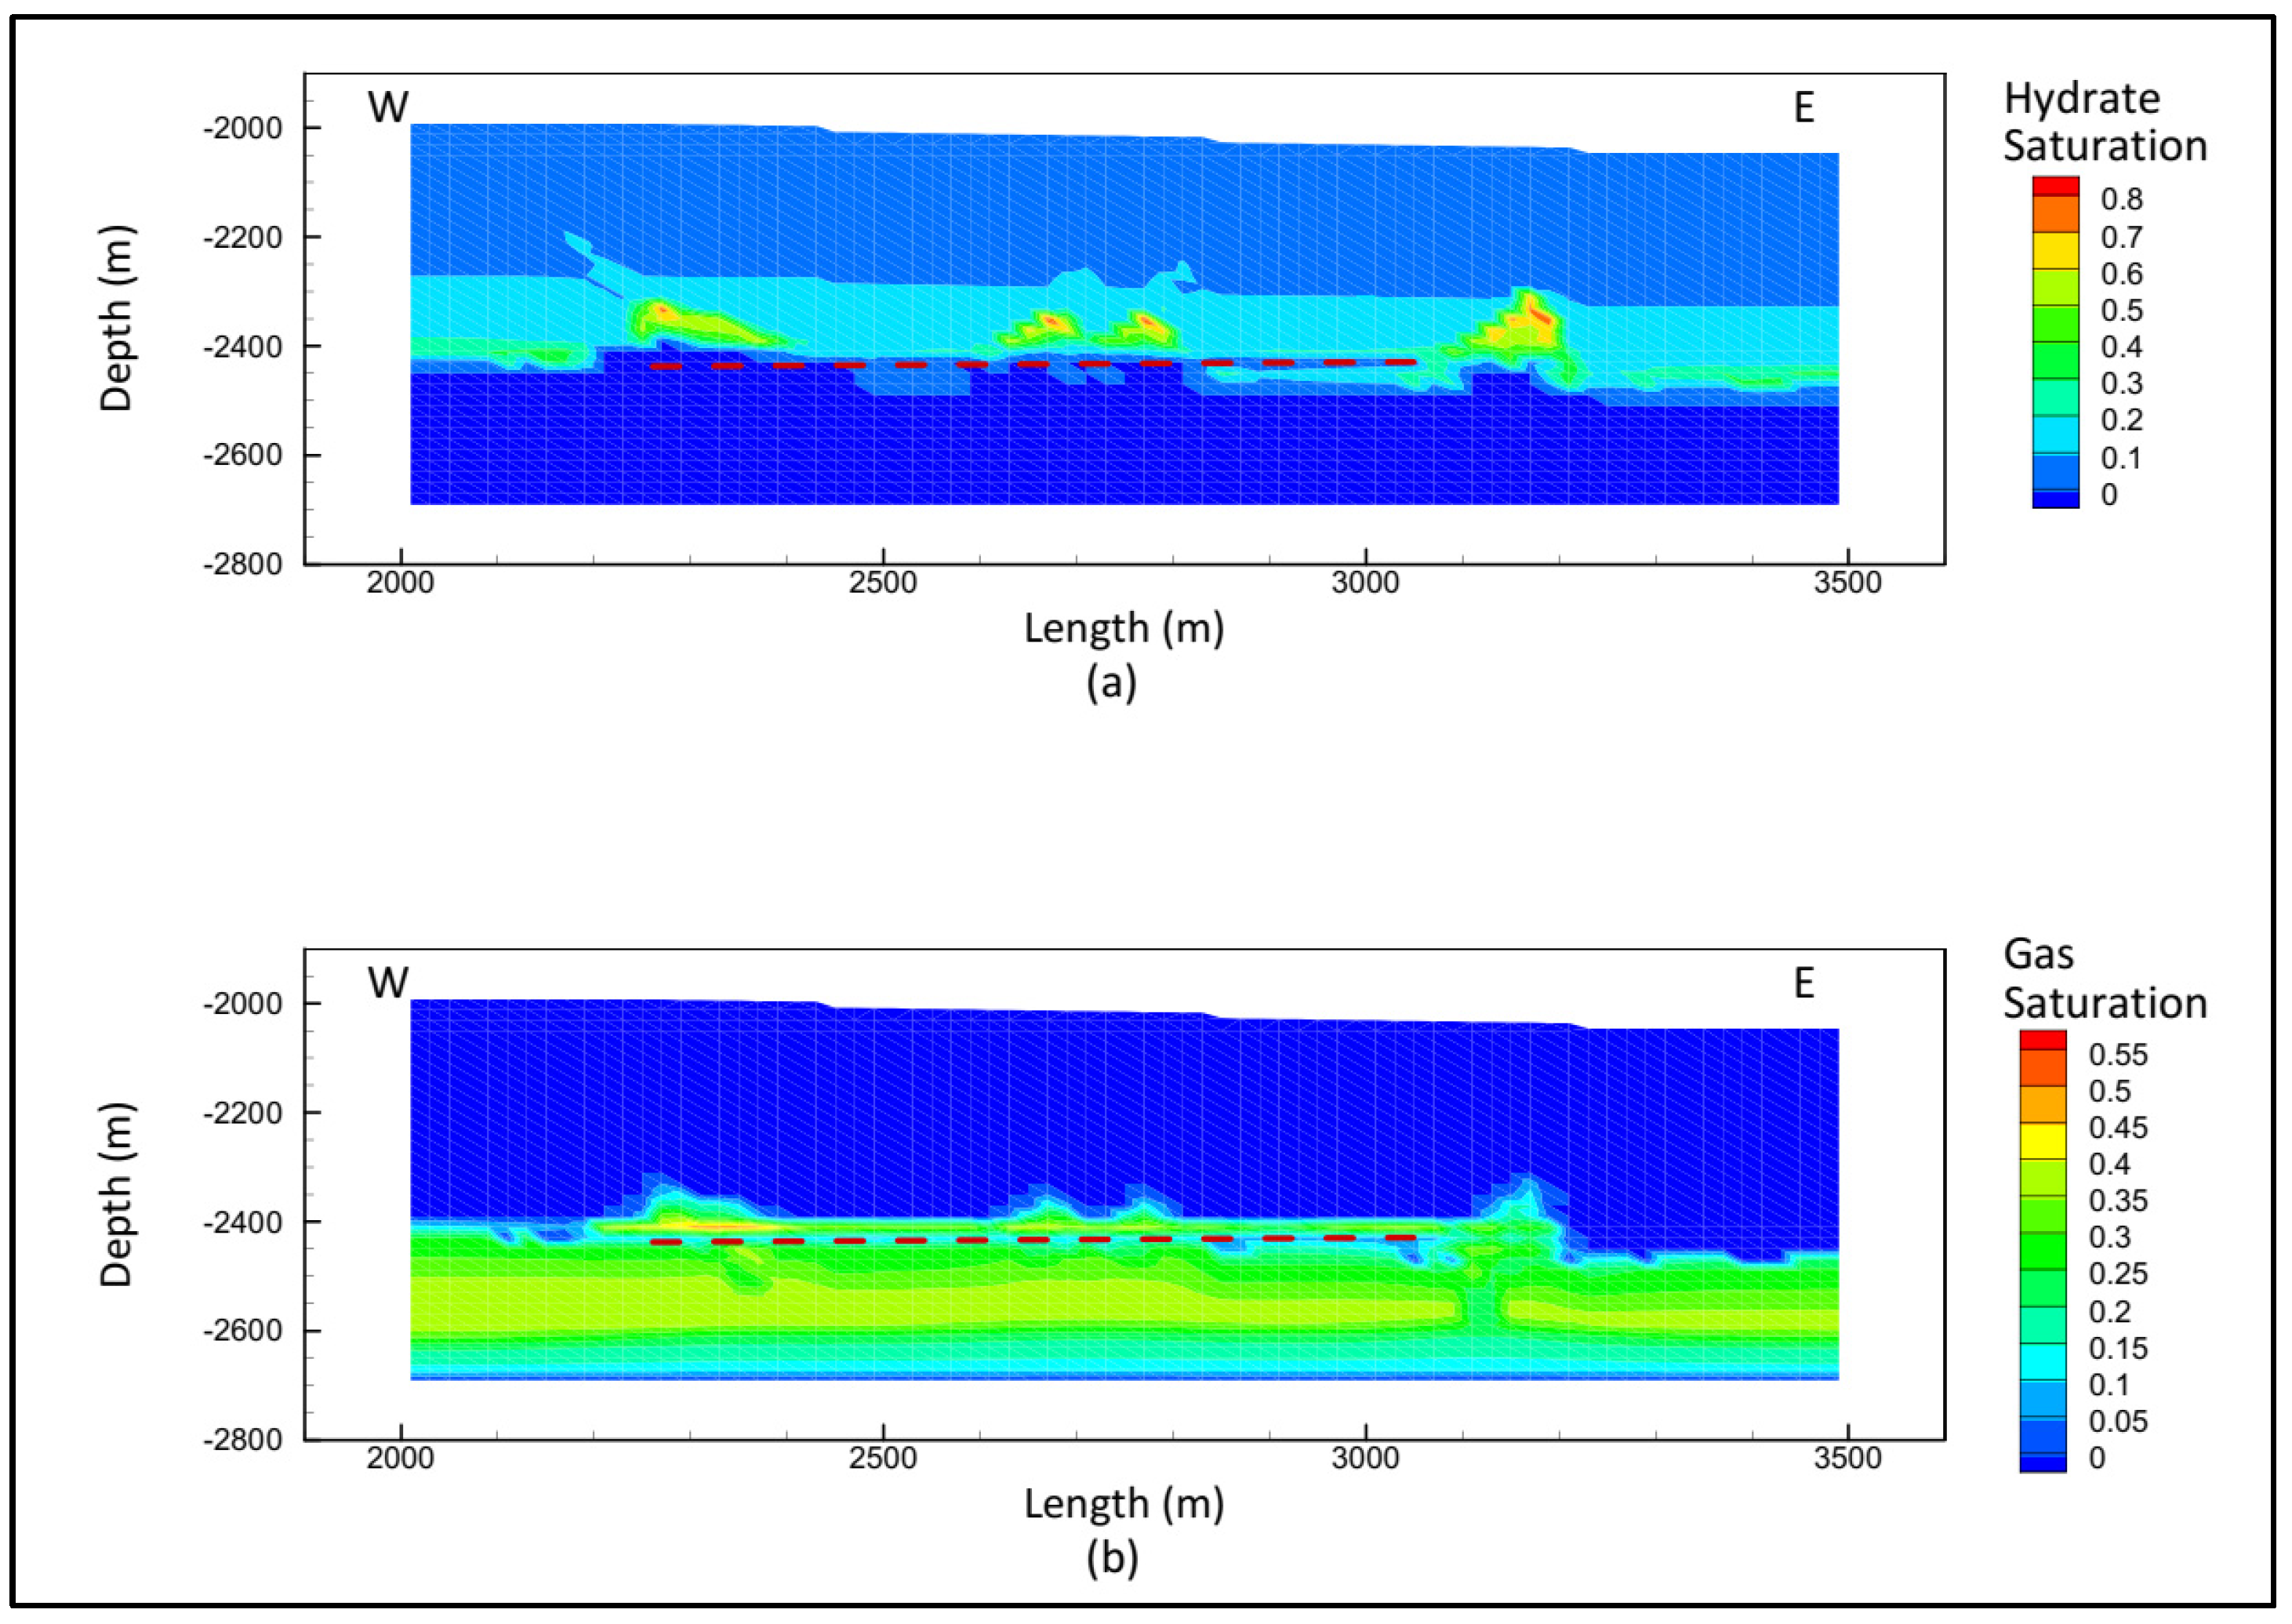
3.3. Dissociation Due to Production of Methane Gas
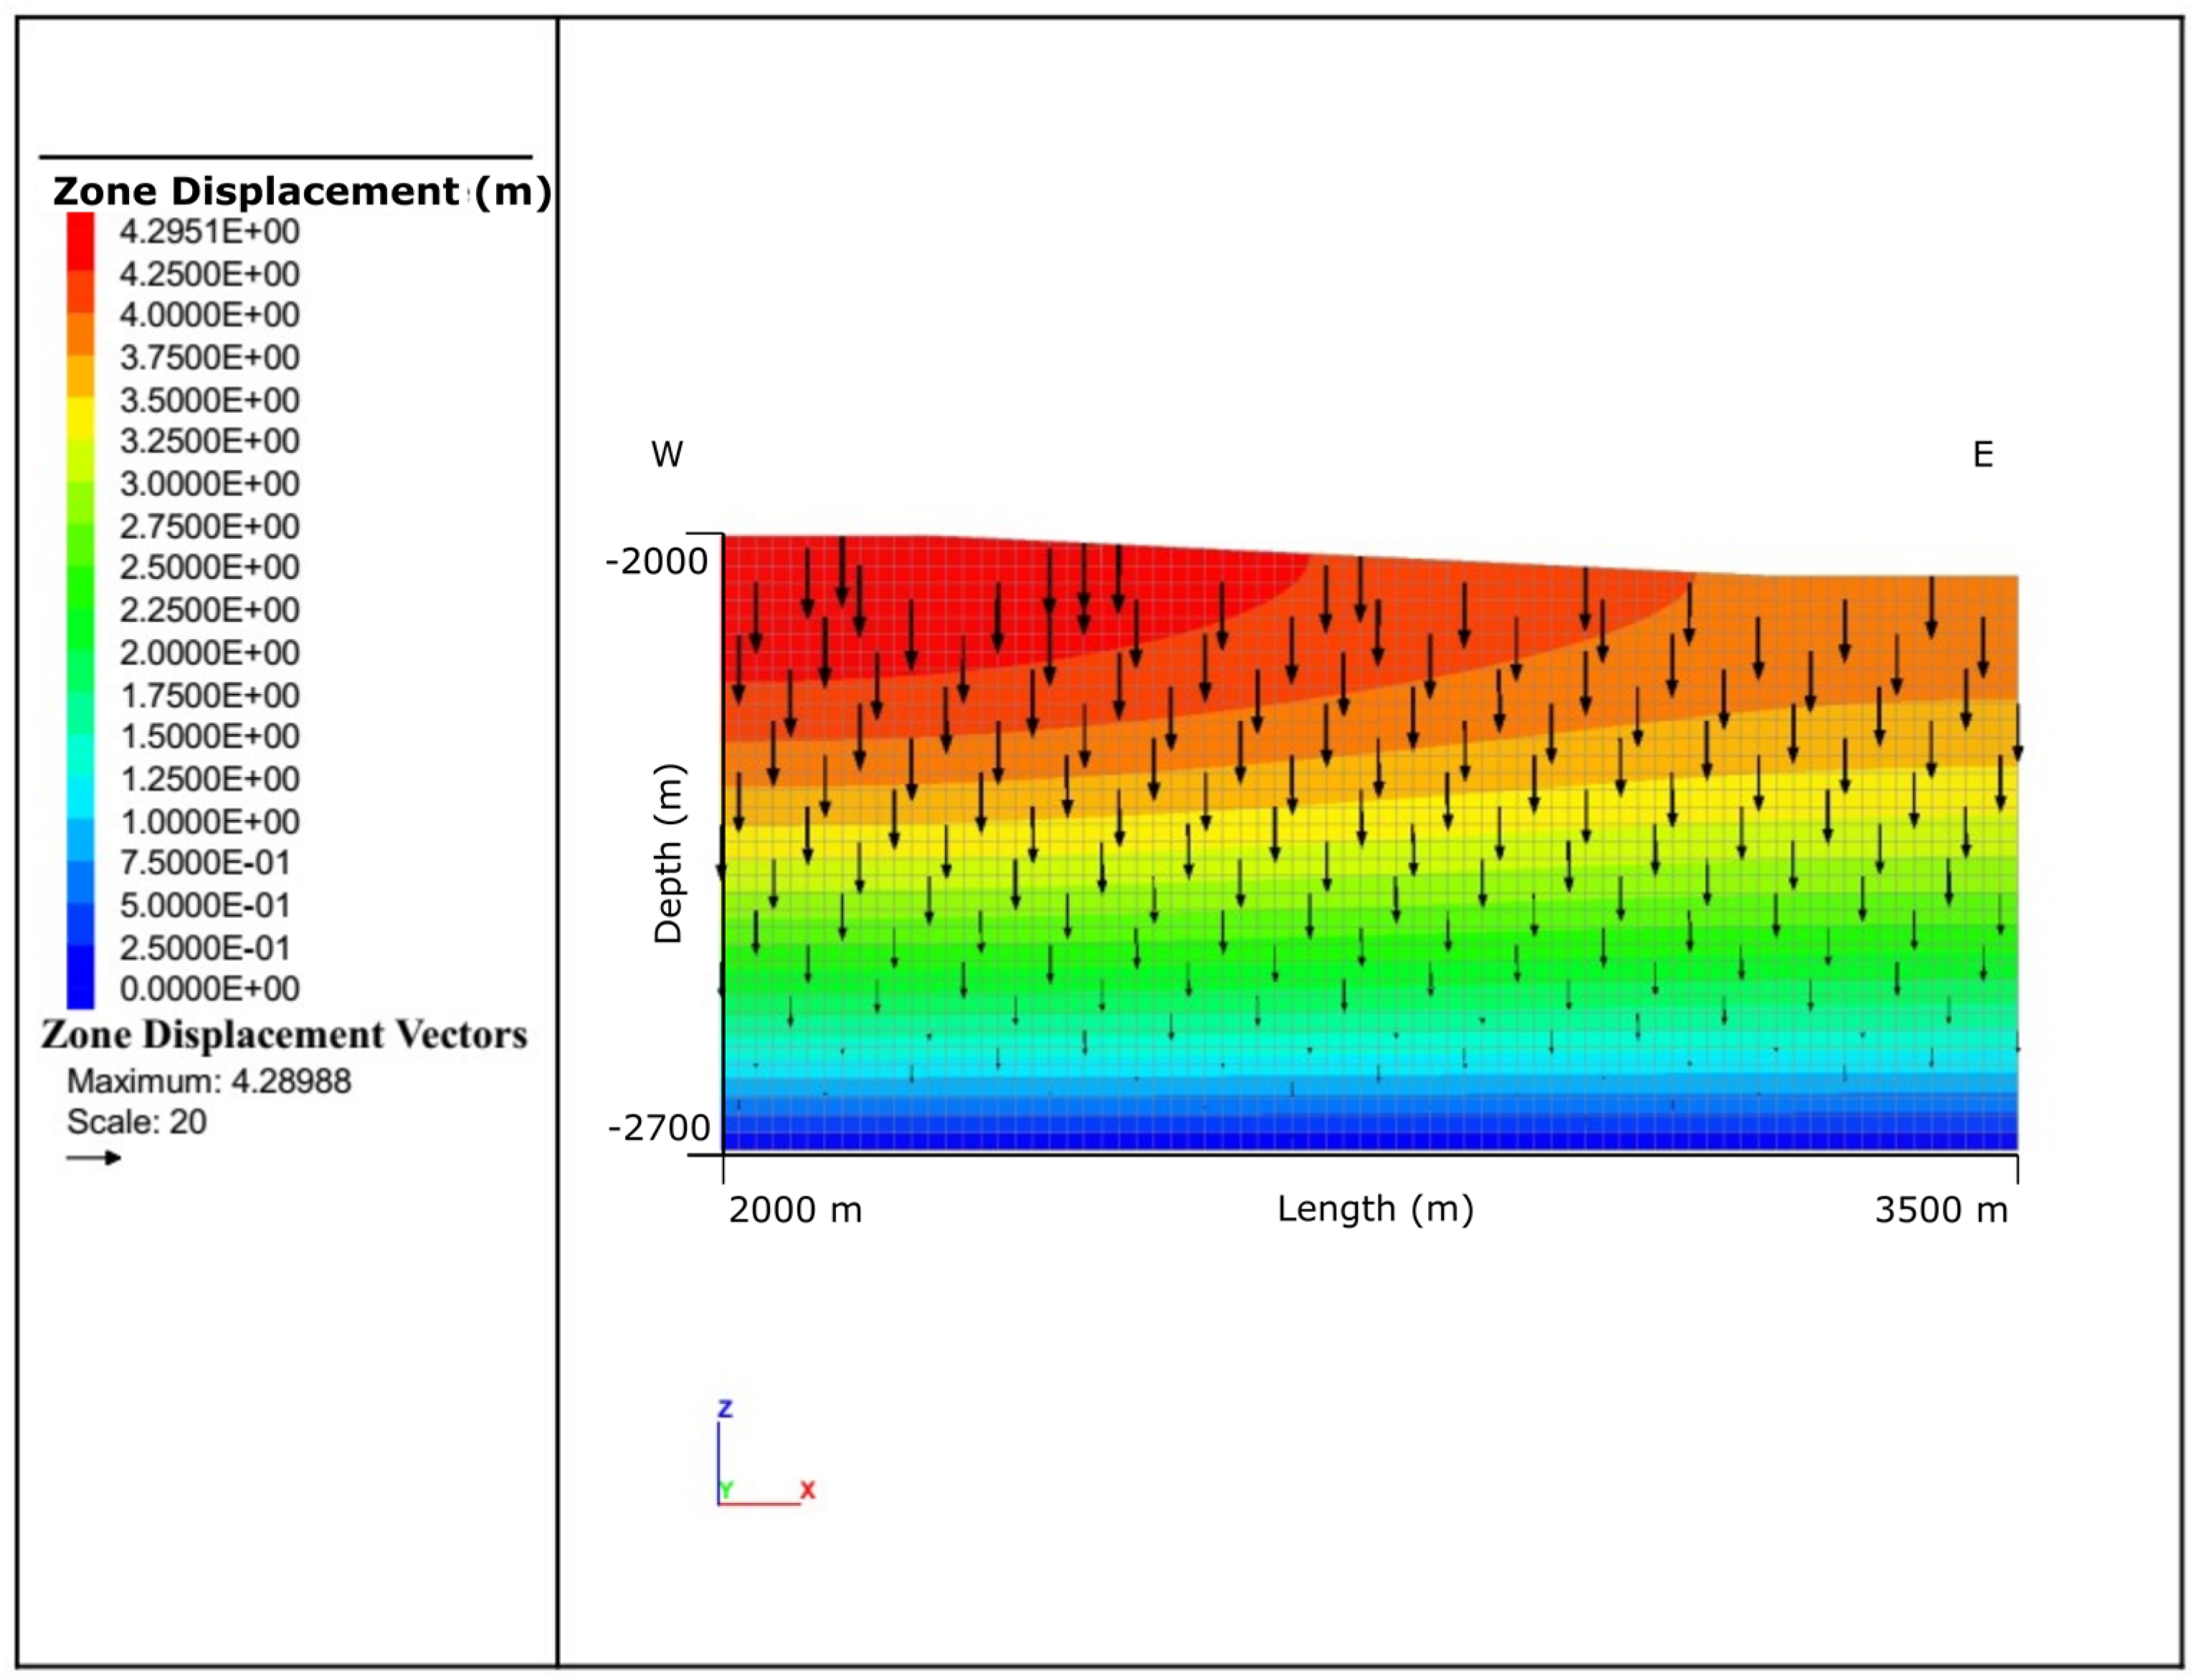
A constant production simulation of 0.1 kg/s from the wells for 180 days was performed using the THM model, with the minimum pressure restrained at 10 MPa. The abundance of hydrates and the underlying gas layer meant that the total hydrates in the reservoir did not decrease significantly. However, the low permeability of the domain meant that hydrate dissociation was more localized, with hydrate saturation decreasing by ~10% on layers just below the production grids. The steady production rate restrained the minimum pressure, making the total saturated zone almost identical after 180 days with a minor decrease in saturation locally (Figure 8). The total methane gas produced from the reservoir was 1.03 × 10⁶ m3, with 5 × 10⁵ m3 of free gas reforming hydrates as production occurred. The hydrate depletion from the reservoir was therefore only about half the total produced hydrate mass, with the other half replenished from the underlying gas layer.
The mechanical displacement of the reservoir due to production is an important aspect while considering the THM model for hydrate exploitation. The hydrate production for 180 days did not result in a major displacement in the reservoir domain (Figure 9). The maximum displacement was less than 5 m. Since there was not a significant reduction in the saturation of hydrates in the domain, the displacement can be attributed to elevated effective stress due to depressurization. There is no slope failure observed in the domain.

4. Discussion

Hydrate reserve characterization using the numerical method has many facets that need to be explored to accurately predict the potential resource and associated geo-hazards. Numerical results are only a part of the rigorous study that needs to be done in the reserve characterization process. The thermo-hydro (TH) model predicted a very similar hydrate saturation to the thermo-hydro-mechanical (THM) model; however, the THM model gives extra information on how geohazards could be triggered by dissociation. Past studies using seismic images and well logging techniques gave us the data needed to create the reservoir model and compare our results. Previous studies in the region have also concluded that the fault zones present below the hydrate stability zone may act as flow pathways for free and dissolved gas. Our numerical simulation confirms those findings. In addition, numerical modeling gives us the higher resolution hydrate estimate and inter-well details that cannot be obtained from well logging or seismic images alone. The results are compared with past estimates because the information collected in the seismic surveys and drilling expeditions forms the basis for our reservoir model. Therefore, this method can be described as complementary to the existing methodology for hydrate reservoir characterization.
The numerical model itself is applied to the region in the northern Gulf of Mexico and may not be equally accurate in other locations. The estimated hydrate reserves are based on the assumption that the reservoir model was created using simple interpolation between two wells and the addition of features using seismic images. The numerical simulator itself assumes that the hydrate-forming gas is pure methane; there is no salt precipitation or mechanical dispersion; and the mass flow follows Darcy’s law. The field may have anisotropy and uncertainties not captured in the seismic surveys or the resolution of the reservoir model. Other uncertainties in the model may arise from the geomechanical relationships, porosity and permeability correlations and their evolution, impurities in the hydrate-forming gas, and heterogeneity in pressure or temperature gradients. It is, however, reasonable to assume that these uncertainties may only slightly alter the hydrate distribution as the reservoir model has captured as much information as possible from past literature.
In the Gulf of Mexico, the hydrate reserve in the Green Canyon 955 block is a prolific reserve with exciting potential for methane gas production and minimal geohazards associated with it. In addition, it can also be considered advantageous that the slope is gentle at about 3% and the rock is consolidated enough to mitigate any failure due to hydrate dissociation. However, the north-south slope, which is about 7%, is also pertinent, and further LWD data needs to be collected to accurately quantify slope stability in that direction. The low permeability of the hydrate layer may pose a production challenge as more time and resources may be required to produce gas. However, the natural fractures in the hydrate-bearing zone are not considered in the scope of this study, which could potentially be valuable in a production scenario.

5. Conclusions

Hydrate reserves in the Gulf of Mexico Green Canyon 955 block can be characterized as non-uniform, highly saturated, and concentrated around the four major faults between the two wells GC955-Q and GC-955-H. The hydrates are distributed with a maximum saturation of 82% and major chimney-like structures prominent above the hydrate stability zone. The numerical simulation works as a tool for characterizing hydrate reserves with details that cannot be captured from well logs or seismic images. It is clear from the three hydrate formation simulations that the structural and stratigraphic nature of the reservoir need to be accurately represented to characterize the reserve.
The thermo-hydro-mechanical (THM) simulation of hydrate formation did not yield a significantly different result than the thermo-hydro (TH) simulation. However, it is vital to characterize not only the resource potential for the hydrate-bearing reserves but the geo-hazards associated with them. In this study, we use established geomechanical relationships for hydrate-bearing sediments and THM methodology to characterize the hydrate reserve in the Gulf of Mexico.
Additionally, the dissociation scenarios evaluated in this study did not result in a high displacement of hydrate-bearing sediments. The displacement is concentrated toward the top of the reservoir in both cases, and little shear failure is seen. The displacement observed due to ocean warming may simply be due to hydrate layer compaction over 100 years as pore-filling hydrates dissociate. While the production scenario resulted in higher subsidence, a maximum displacement of 4.2 m is not significant enough to trigger a large geohazard and can be managed by reducing the depressurization rate. There was no indication of slope failure in this direction due to the gentle slope of about 3%. It is also important to quantify slope stability in the north-south direction for production, which would require further drilling expeditions in that direction. The Gulf of Mexico is not a seismically active region with large earthquakes, which also reduces the potential for any slope failure. Therefore, it is evident from this study that the hydrates in Green Canyon Block 955 can be exploited to produce methane gas. However, since the Gulf of Mexico is a region with significant subsea infrastructure for oil and gas, any drilling or production activity must be done taking the region’s geomechanical properties into consideration.

Author Contributions

Conceptualization, S.D. and I.G.; methodology, S.D.; validation, S.D.; formal analysis, S.D. and I.G.; investigation, S.D.; resources, I.G.; data curation, S.D.; writing—original draft preparation, S.D.; writing—review and editing, I.G.; visualization, S.D.; supervision, I.G.; project administration, I.G.; funding acquisition, I.G. All authors have read and agreed to the published version of the manuscript.

Funding

This research received no external funding.

Data Availability Statement

Publicly available datasets were analyzed in this study. This data can be found here: https://mlp.ldeo.columbia.edu/logdb/gas_hydrates_jip/.

Acknowledgments

The authors thank the Economic Development Assistantship (EDA), Louisiana State University (LSU), for research funds to Gupta for the work reported in this article.

Conflicts of Interest

The authors declare no conflict of interest.

References

  1. Sloan, E.D. Physical/chemical properties of gas hydrates and application to world margin stability and climatic change. Geol. Soc. Lond. Spec. Publ. 1998, 137, 31–50. [Google Scholar] [CrossRef]
  2. Sloan, E.D.; Koh, C. Clathrate Hydrates of Natural Gases; CRC Press: Boca Raton, FL, USA, 2007. [Google Scholar]
  3. Kvenvolden, K. A primer on the geological occurrence of gas hydrate. Geol. Soc. Lond. Spec. Publ. 1998, 137, 9–30. [Google Scholar] [CrossRef]
  4. Makogon, Y.F. Natural gas hydrates–A promising source of energy. J. Nat. Gas Sci. Eng. 2010, 2, 49–59. [Google Scholar] [CrossRef]
  5. Kim, H.; Bishnoi, P.; Heidemann, R.; Rizvi, S. Kinetics of methane hydrate decomposition. Chem. Eng. Sci. 1987, 42, 1645–1653. [Google Scholar] [CrossRef]
  6. Selim, M.S.; Sloan, E.D. Heat and mass transfer during the dissociation of hydrates in porous media. AIChE J. 1989, 35, 1049–1052. [Google Scholar] [CrossRef]
  7. Clarke, M.; Bishnoi, P.R. Determination of the activation energy and intrinsic rate constant of methane gas hydrate decomposition. Can. J. Chem. Eng. 2001, 79, 143–147. [Google Scholar] [CrossRef]
  8. Yamamoto, K. Overview and introduction: Pressure core-sampling and analyses in the 2012–2013 MH21 offshore test of gas production from methane hydrates in the eastern Nankai Trough. Mar. Pet. Geol. 2015, 66, 296–309. [Google Scholar] [CrossRef]
  9. Sloan, E.D. Fundamental principles and applications of natural gas hydrates. Nature 2003, 426, 353–363. [Google Scholar] [CrossRef]
  10. BSEE. Bureau of Safety and Environmental Enforcement Database. The Offshore Infrastructure Dashboard. 2023. Available online: https://www.data.bsee.gov/ (accessed on 27 March 2023).
  11. Murawski, S.A.; Hollander, D.J.; Gilbert, S.; Gracia, A. Deepwater oil and gas production in the Gulf of Mexico and related global trends. In Scenarios and Responses to Future Deep Oil Spills; Springer: Berlin/Heidelberg, Germany, 2020; pp. 16–32. [Google Scholar]
  12. Boswell, R.; Collett, T.S.; Frye, M.; Shedd, W.; McConnell, D.R.; Shelander, D. Subsurface gas hydrates in the northern Gulf of Mexico. Mar. Pet. Geol. 2012, 34, 4–30. [Google Scholar] [CrossRef]
  13. Brooks, J.; Kennicutt, M.; Fay, R.; McDonald, T.; Sassen, R. Thermogenic gas hydrates in the Gulf of Mexico. Science 1984, 225, 409–411. [Google Scholar] [CrossRef]
  14. Fang, Y.; Flemings, P.B.; Daigle, H.; Phillips, S.C.; Germaine, J.T. Insight of in-situ porosity and compressibility of the GC 955 Gulf of Mexico hydrate reservoir. In E3S Web of Conferences 2020; EDP Sciences: Les Ulis, France, 2020; Volume 2005, p. 11005. [Google Scholar]
  15. Hillman, J.I.; Cook, A.E.; Daigle, H.; Nole, M.; Malinverno, A.; Meazell, K.; Flemings, P.B. Gas hydrate reservoirs and gas migration mechanisms in the Terrebonne Basin, Gulf of Mexico. Mar. Pet. Geol. 2017, 86, 1357–1373. [Google Scholar] [CrossRef]
  16. Daigle, H.; Cook, A.; Malinverno, A. Permeability and porosity of hydrate-bearing sediments in the northern Gulf of Mexico. Mar. Pet. Geol. 2015, 68, 551–564. [Google Scholar] [CrossRef] [Green Version]
  17. Santra, M.; Flemings, P.B.; Heidari, M.; You, K. Occurrence of high-saturation gas hydrate in a fault-compartmentalized anticline and the role of seal, Green Canyon, Abyssal Northern Gulf of Mexico. AAPG Bull. 2021, 106, 981–1003. [Google Scholar] [CrossRef]
  18. You, K.; Flemings, P. Methane Hydrate Formation and Evolution During Sedimentation. J. Geophys. Res. Solid Earth 2021, 126, e2020JB021235. [Google Scholar] [CrossRef]
  19. You, K.; Flemings, P.B.; Malinverno, A.; Collett, T.; Darnell, K. Mechanisms of Methane Hydrate Formation in Geological Systems. Rev. Geophys. 2019, 57, 1146–1196. [Google Scholar] [CrossRef]
  20. Flemings, P.; Boswell, R.; Collett, T.S.; Cook, A.; Divins, D.; Frye, M.; Guerin, G.; Goldberg, D.; Malinverno, A.; Meazell, K. GOM2: Prospecting, Drilling and Sampling Coarse-Grained Hydrate Reservoirs in the Deepwater Gulf of Mexico; National Energy Technology Laboratory (NETL): Pittsburgh, PA, USA; Morgantown, WV, USA, 2017. [Google Scholar]
  21. Ruppel, C.; Boswell, R.; Jones, E. Scientific results from Gulf of Mexico gas hydrates Joint Industry Project Leg 1 drilling: Introduction and overview. Mar. Pet. Geol. 2008, 25, 819–829. [Google Scholar] [CrossRef]
  22. Guerin, G.; Cook, A.; Mrozewski, S.; Collett, T.; Boswell, R. Gulf of Mexico gas hydrate joint industry project leg ii Green Canyon 955 LWD operations and results. Mar. Pet. Geol. 2010, 34, 41–61. [Google Scholar]
  23. Boswell, R.; Frye, M.; Shelander, D.; Shedd, W.; McConnell, D.R.; Cook, A. Architecture of gas-hydrate-bearing sands from Walker Ridge 313, Green canyon 955, and Alaminos canyon 21: Northern deepwater Gulf of Mexico. Mar. Pet. Geol. 2012, 34, 134–149. [Google Scholar] [CrossRef]
  24. Haines, S.S.; Hart, P.E.; Collett, T.S.; Shedd, W.; Frye, M.; Weimer, P.; Boswell, R. High-resolution seismic characterization of the gas and gas hydrate system at Green Canyon 955, Gulf of Mexico, USA. Mar. Pet. Geol. 2017, 82, 220–237. [Google Scholar] [CrossRef] [Green Version]
  25. Wang, J.; Jaiswal, P.; Haines, S.S.; Hart, P.E.; Wu, S. Gas hydrate quantification using full-waveform inversion of sparse ocean-bottom seismic data: A case study from Green Canyon Block 955, Gulf of Mexico. Geophysics 2018, 83, B167–B181. [Google Scholar] [CrossRef]
  26. Lee, M.W.; Collett, T.S. Pore- and fracture-filling gas hydrate reservoirs in the Gulf of Mexico Gas Hydrate Joint Industry Project Leg II Green Canyon 955 H well. Mar. Pet. Geol. 2012, 34, 62–71. [Google Scholar] [CrossRef]
  27. Cook, A.E.; Anderson, B.I.; Rasmus, J.; Sun, K.; Li, Q.; Collett, T.S.; Goldberg, D.S. Electrical anisotropy of gas hydrate-bearing sand reservoirs in the Gulf of Mexico. Mar. Pet. Geol. 2012, 34, 72–84. [Google Scholar] [CrossRef] [Green Version]
  28. Meazell, P.K.; Flemings, P.B.; Santra, M.; Johnson, J.E. Sedimentology and stratigraphy of a deep-water gas hydrate reservoir in the northern Gulf of Mexico. AAPG Bull. 2020, 104, 1945–1969. [Google Scholar] [CrossRef]
  29. Phillips, S.C.; Flemings, P.B.; Holland, M.E.; Schultheiss, P.J.; Waite, W.F.; Jang, J.; Petrou, E.G.; Hammon, H. High concentration methane hydrate in a silt reservoir from the deep-water Gulf of Mexico. AAPG Bull. 2020, 104, 1971–1995. [Google Scholar] [CrossRef]
  30. Liu, J.; Haeckel, M.; Rutqvist, J.; Shuhong, W.; Wen, Y. The mechanism of methane gas migration through the gas hydrate stability zone; insights from numerical simulations. J. Geophys. Res. Solid Earth 2019, 124, 4399. [Google Scholar] [CrossRef] [Green Version]
  31. Liu, X.; Flemings, P.B. Passing gas through the hydrate stability zone at southern Hydrate Ridge, offshore Oregon. Earth Planet. Sci. Lett. 2006, 241, 211–226. [Google Scholar] [CrossRef]
  32. Riedel, M.; Tréhu, A.M.; Spence, G.D. Characterizing the thermal regime of cold vents at the northern Cascadia margin from bottom-simulating reflector distributions, heat-probe measurements and borehole temperature data. Mar. Geophys. Res. 2010, 31, 1–16. [Google Scholar] [CrossRef]
  33. Hyndman, R.D.; Spence, G.D. A seismic study of methane hydrate marine bottom simulating reflectors. J. Geophys. Res. Solid Earth 1992, 97, 6683–6698. [Google Scholar] [CrossRef]
  34. Milkov, A.; Sassen, R. Estimate of gas hydrate resource, northwestern Gulf of Mexico continental slope. Mar. Geol. 2001, 179, 71–83. [Google Scholar] [CrossRef]
  35. Sassen, R.; Macdonald, I.R. Hydrocarbons of experimental and natural gas hydrates, Gulf of Mexico continental slope. Org. Geochem. 1997, 26, 289–293. [Google Scholar] [CrossRef]
  36. Burwicz, E.; Reichel, T.; Pinero, E.; Hensen, C.; Wallmann, K.; Haeckel, M. Gas Hydrate Dynamics at the Green Canyon Site, Gulf of Mexico-Recovery Prospects Based on New 3-D Modeling Study; China Geological Survey: Beijing, China, 2014. [Google Scholar]
  37. Burwicz, E.; Reichel, T.; Wallmann, K.; Rottke, W.; Haeckel, M.; Hensen, C. 3-D basin-scale reconstruction of natural gas hydrate system of the Green Canyon, Gulf of Mexico. Geochem. Geophys. Geosyst. 2017, 18, 1959–1985. [Google Scholar] [CrossRef] [Green Version]
  38. Dhakal, S.; Gupta, I. Thermogenic Gas Hydrates Formation in Offshore Environments-Results from Numerical Simulations. In Proceedings of the Offshore Technology Conference, Houston, TX, USA, 30 April–3 May 2018. [Google Scholar]
  39. Milkov, A.; Sassen, R. Thickness of the gas hydrate stability zone, Gulf of Mexico continental slope. Mar. Pet. Geol. 2000, 17, 981–991. [Google Scholar] [CrossRef]
  40. You, K.; Summa, L.; Flemings, P.; Santra, M.; Fang, Y. Three-Dimensional Free Gas Flow Focuses Basin-Wide Microbial Methane to Concentrated Methane Hydrate Reservoirs in Geological System. J. Geophys. Res. Solid Earth 2021, 126, e2021JB022793. [Google Scholar] [CrossRef]
  41. Mao, P.; Sun, J.; Ning, F.; Chen, L.; Wan, Y.; Hu, G.; Wu, N. Numerical simulation on gas production from inclined layered methane hydrate reservoirs in the Nankai Trough: A case study. Energy Rep. 2021, 7, 8608–8623. [Google Scholar] [CrossRef]
  42. Yadav, R.; Gupta, A.K.; Das, M.K.; Panigrahi, P.K. Investigations on a controlled microwave heating technique for efficient depressurization in methane hydrate reservoirs. Energy Rep. 2022, 8, 7825–7839. [Google Scholar] [CrossRef]
  43. Wu, H.; Zhang, X.; Yang, Z.; Liu, D. Numerical simulation on depressurization extraction of natural gas hydrate based on a coupled thermal–hydraulic–chemical model. Energy Rep. 2022, 8, 269–278. [Google Scholar] [CrossRef]
  44. Wei, J.; Yang, L.; Liang, Q.; Liang, J.; Lu, J.; Zhang, W.; Zhang, X.; Lu, X. Geomechanical properties of gas hydrate-bearing sediments in Shenhu Area of the South China Sea. Energy Rep. 2021, 7, 8013–8020. [Google Scholar] [CrossRef]
  45. Dhakal, S.; Gupta, I. Predictive Modeling of Thermogenic Methane Hydrate Formation and Geobody Distribution–Results from Numerical Simulations. J. Nat. Gas Sci. Eng. 2020, 75, 103154. [Google Scholar] [CrossRef]
  46. Dhakal, S.; Gupta, I. Simulating gas hydrate formation in the southern hydrate ridge, Cascadia Margin. J. Nat. Gas Sci. Eng. 2021, 88, 103845. [Google Scholar] [CrossRef]
  47. Dhakal, S.; Gupta, I. Slope instability of submarine sediments due to hydrate dissociation: A case study of Northern Cascadia Margin. Geoenergy Sci. Eng. 2023, 223, 211558. [Google Scholar] [CrossRef]
  48. Burwicz, E.; Rüpke, L. Thermal State of the Blake Ridge Gas Hydrate Stability Zone (GHSZ)—Insights on Gas Hydrate Dynamics from a New Multi-Phase Numerical Model. Energies 2019, 12, 3403. [Google Scholar] [CrossRef] [Green Version]
  49. You, K.; Flemings, P.B. Methane hydrate formation in thick sandstones by free gas flow. J. Geophys. Res. Solid Earth 2018, 123, 4582–4600. [Google Scholar] [CrossRef]
  50. Zhu, H.; Xu, T.; Zhu, Z.; Yuan, Y.; Tian, H. Numerical modeling of methane hydrate accumulation with mixed sources in marine sediments: Case study of Shenhu Area, South China Sea. Mar. Geol. 2020, 423, 106142. [Google Scholar] [CrossRef]
  51. Keyes, D.E.; McInnes, L.C.; Woodward, C.; Gropp, W.; Myra, E.; Pernice, M.; Bell, J.; Brown, J.; Clo, A.; Connors, J. Multiphysics simulations: Challenges and opportunities. Int. J. High Perform. Comput. Appl. 2013, 27, 4–83. [Google Scholar] [CrossRef] [Green Version]
  52. Liu, X.; Qu, Z.; Guo, T.; Sun, Y.; Rabiei, M.; Liao, H. A coupled thermo-hydrologic-mechanical (THM) model to study the impact of hydrate phase transition on reservoir damage. Energy 2021, 216, 119222. [Google Scholar] [CrossRef]
  53. Samala, R.; Chaudhuri, A. Coupled THMC modeling of dissociation induced deformation of gas hydrate bearing media. Comput. Geosci. 2022, 166, 105162. [Google Scholar] [CrossRef]
  54. Wan, Y.; Wu, N.; Chen, Q.; Li, W.; Hu, G.; Huang, L.; Ouyang, W. Coupled thermal-hydrodynamic-mechanical–chemical numerical simulation for gas production from hydrate-bearing sediments based on hybrid finite volume and finite element method. Comput. Geotech. 2022, 145, 104692. [Google Scholar] [CrossRef]
  55. Kim, S.; Wee, J.; Peters, K.; Huang, H.-Y.S. Multiphysics coupling in lithium-ion batteries with reconstructed porous microstructures. J. Phys. Chem. C 2018, 122, 5280–5290. [Google Scholar] [CrossRef]
  56. Zhang, H.; Guo, J.; Lu, J.; Niu, J.; Li, F.; Xu, Y. The comparison between nonlinear and linear preconditioning JFNK method for transient neutronics/thermal-hydraulics coupling problem. Ann. Nucl. Energy 2019, 132, 357–368. [Google Scholar] [CrossRef]
  57. Moridis, G.J. TOUGH+ HYDRATE v1. 2 User’s Manual: A Code for the Simulation of System Behavior in Hydrate-Bearing Geologic Media; LBL Publications: Berkeley, CA, USA, 2014. [Google Scholar]
  58. Rutqvist, J.; Moridis, G. Numerical studies on the geomechanical stability of hydrate-bearing sediments. In Proceedings of the Offshore Technology Conference, Houston, TX, USA, 29 April–2 May 2007. [Google Scholar]
  59. Jaiswal, P. Structural and Stratigraphic Controls on Methane Hydrate Occurrence and Distribution: Gulf of Mexico, Walker Ridge 313 and Green Canyon 955; Oklahoma State University: Stillwater, OK, USA, 2017. [Google Scholar]
  60. Murphy, B.S. PyKrige: Development of a kriging toolkit for Python. In Proceedings of the AGU Fall Meeting Abstracts, San Francisco, CA, USA, 15–19 December 2004. [Google Scholar]
  61. Forrest, J.; Marcucci, E.; Scott, P. Geothermal Gradients and Subsurface Temperatures in Northern Gulf of Mexico. GCAGS 2005, 55, 233–248. [Google Scholar]
  62. Christie, C.H.; Nagihara, S. Geothermal gradients of the northern continental shelf of the Gulf of Mexico. Geosphere 2016, 12, 26–34. [Google Scholar] [CrossRef] [Green Version]
  63. Fang, Y.; Flemings, P.B.; Daigle, H.; Phillips, S.C.; O’Connell, J. Permeability of methane hydrate-bearing sandy silts in the deep-water Gulf of Mexico (Green Canyon block 955). AAPG Bull. 2021, 106, 1071–1110. [Google Scholar] [CrossRef]
  64. Riedel, M.; Malinverno, A.; Wang, K.; Goldberg, D.; Guerin, G. Horizontal compressive stress regime on the northern Cascadia margin inferred from borehole breakouts. Geochem. Geophys. Geosyst. 2016, 17, 3529–3545. [Google Scholar] [CrossRef] [Green Version]
  65. Itasca. FLAC3D (Fast Lagrangian Analysis of Continua in 3 Dimensions) Version 6 User’s Manual; Itasca Consulting Group, Inc.: Minneapolis, MN, USA, 2017. [Google Scholar]
  66. Reagan, M.T.; Moridis, G.J. Oceanic gas hydrate instability and dissociation under climate change scenarios. Geophys. Res. Lett. 2007, 34. [Google Scholar] [CrossRef]
  67. Kretschmer, K.; Biastoch, A.; Rüpke, L.; Burwicz, E. Modeling the fate of methane hydrates under global warming. Glob. Biogeochem. Cycles 2015, 29, 610–625. [Google Scholar] [CrossRef]
  68. Sun, X.; Wang, L.; Luo, H.; Song, Y.; Li, Y. Numerical modeling for the mechanical behavior of marine gas hydrate-bearing sediments during hydrate production by depressurization. J. Pet. Sci. Eng. 2019, 177, 971–982. [Google Scholar] [CrossRef]
  69. Rutqvist, J.; Tsang, C.-F. TOUGH-FLAC: A numerical simulator for analysis of coupled thermal-hydrologic-mechanical processes in fractured and porous geological media under multi-phase flow conditions. In Proceedings of the TOUGH Symposium, Berkeley, CA, USA, 12–14 May 2003; pp. 12–14. [Google Scholar]
  70. Sultan, N.; Garziglia, S. Geomechanical constitutive modelling of gas-hydrate-bearing sediments. In Proceedings of the 7th International Conference on Gas Hydrates (ICGH 2011), Edinburgh, UK, 17–21 July 2011. [Google Scholar]
  71. Masui, A.; Haneda, H.; Ogata, Y.; Aoki, K. Effects of methane hydrate formation on shear strength of synthetic methane hydrate sediments. In Proceedings of the Fifteenth International Offshore and Polar Engineering Conference, Seoul, Republic of Korea, 19–24 June 2005. [Google Scholar]
  72. Chen, D.F.; Cathles, L.M., III. A kinetic model for the pattern and amounts of hydrate precipitated from a gas steam: Application to the Bush Hill vent site, Green Canyon Block 185, Gulf of Mexico. J. Geophys. Res. Solid Earth 2003, 108. [Google Scholar] [CrossRef]
Figure 1. Joint Industry Project sites in the Northern Gulf of Mexico. Five locations, namely, Alaminos Canyon (AC21), Keathly Canyon (KC151), Walker Ridge (WR313), Green Canyon (GC955), and Atwater Valley (AT13/14) were explored for hydrate occurrence and wellbore stability while drilling through hydrate layers [12].
Energies 16 03275 g001
Figure 2. (a) West-East Seismic transect at Green Canyon block 955 [59]. A subset represented by the red box represents the area used for reservoir simulation. (b) Reservoir model with grid discretization of 20 m × 20 m (Vertical exaggeration: 1). The green cells represent the four major high permeability faults that are visible in the hydrate stability zone. Blue lines represent the two LWD sites.
Energies 16 03275 g002
Figure 3. Hydrate formation after 100 thousand years, assuming slow upward migration due to buoyancy. (a) The hydrate saturation reaches a maximum of 55% and is uniformly distributed along the length of the reservoir model. (b) The underlying gas layer is typical in hydrate reservoirs at Green Canyon.
Energies 16 03275 g003
Figure 4. Hydrate formation after sixteen thousand years in the reservoir domain. (a) The hydrate saturation reaches a maximum of 78% and is distributed along the length of the reservoir model, with peaks along faults and highly permeable regions. (b) The underlying gas layer is typical in hydrate reservoirs at Green Canyon, with chimney structures forming around faults.
Energies 16 03275 g004
Figure 5. Hydrate formation after fifteen thousand years in the reservoir domain. (a) The hydrate saturation reaches a maximum of 82% and is distributed along length of the reservoir model, with peaks along faults and highly permeable regions. (b) The underlying gas layer with notable chimney structures is observed consistently with field observations at Green Canyon.
Energies 16 03275 g005
Figure 6. (a) Hydrate saturation after 100 years of steady warming by 1 °C. The hydrate mass decreases by 0.1%, and the maximum saturation is 72%. (b) The total mass and sediment volume of the gas layer increased as hydrates started dissociating along the base of the stability zone.
Energies 16 03275 g006
Figure 7. Displacement magnitude (m) and vectors due to hydrate dissociation for 100 years of steady warming of 1 °C. The maximum displacement of 0.5 m is due to vertical compaction due to hydrate dissociation and cannot be considered significant in the large domain range and simulation timeline.
Energies 16 03275 g007
Figure 8. (a) The hydrate distribution is not impacted by the steady production of 0.1 kg/s for 180 days in the reservoir using horizontal production well (red dotted line). The maximum hydrate saturation remains the same along faults, although the total hydrate in the reservoir decreases by 5 × 10⁴ kg. (b) The underlying gas layer contributes to the production as much as the hydrate layer, and that facilitates upward migration into the hydrate stability zone.
Energies 16 03275 g008
Figure 9. Displacement (m) due to depressurized production for 180 days. The maximum displacement reaches 4.28 m. The displacement vectors suggest that there is subsidence in the reservoir due to hydrate dissociation and reduction in pore pressure.
Energies 16 03275 g009
Disclaimer/Publisher’s Note: The statements, opinions and data contained in all publications are solely those of the individual author(s) and contributor(s) and not of MDPI and/or the editor(s). MDPI and/or the editor(s) disclaim responsibility for any injury to people or property resulting from any ideas, methods, instructions or products referred to in the content.

