Review

Review of Methods to Create Meteorological Data Suitable for Moisture Control Design by Hygrothermal Building Envelope Simulation

Department Hygrothermics, Fraunhofer Institute for Building Physics, Fraunhoferstr. 10, 83626 Valley, Germany
*
Author to whom correspondence should be addressed.
Energies 2023, 16(7), 3271; https://doi.org/10.3390/en16073271
Submission received: 15 February 2023 / Revised: 24 March 2023 / Accepted: 4 April 2023 / Published: 6 April 2023
(This article belongs to the Special Issue Energy Efficiency of the Buildings II)

Abstract

:
Hygrothermal simulations have become essential for sustainable and resilient building design because moisture is the major cause of problems in buildings. Appropriate meteorological input data are important to obtain meaningful simulation results. Therefore, this article reviews different methods to create Hygrothermal Reference Years (HRY) as severe or average climate inputs. The current standards define HRYs solely based on outdoor temperature, although moisture problems are caused by a combination of climate parameters, including driving rain and other loads. Therefore, there are also methods considering several impact parameters. The existing methods can be classified into two categories: construction-independent and construction-dependent methods. The former determines HRY based on a weather data analysis and is useful for large-scale parametric studies comprising many climatic parameters acting on buildings. The latter is based in addition to computer simulations to verify the HRY also in the context of specific construction types. It is a more comprehensive approach since the moisture responses of constructions are the decisive outcome for performance predictions. The advantages and disadvantages of the different methods are summarized and compared. Lastly, further research questions and simplifications aimed at practitioners are pointed out to arrive at reliable hygrothermal building performance predictions.

1. Introduction

Excessive moisture in the building structure may lead to serious problems with mold/algae growth, wood decay, corrosion, weathering, soiling, decrease in hardness and strength, thermal performance degradation of insulation materials, and so on [1]. Moisture in the building envelope also has an impact on indoor air humidity, which in turn affects indoor air quality and thermal comfort [2]. Especially humidity plays a significant role in occupants’ health since damp buildings have been related to respiratory and skin symptoms [3]. Despite an improvement in building energy efficiency requirements, moisture problems in buildings have remained or even increased. In wintertime, more insulation reduces the temperature of the external building envelope layers, while improved air-tightness levels increase indoor humidity. Both effects raise the risk of interstitial condensation or mold growth [4,5]. Additionally, climate change may lead to more intense rain spells, resulting in higher exposure to moisture-susceptible. Ultimately, moisture damage and accelerated aging raise the costs for maintenance and repair during the service life of a building [6]. Therefore, architects and engineers have always been concerned with adequate moisture control design to prevent moisture problems in buildings.
In the past, the standard method to analyze the risk of interstitial condensation has been the so-called dewpoint or Glaser method, a steady-state vapor diffusion calculation. However, numerous simplifications, such as neglecting capillary flow or moisture storage, represent the severe weaknesses of this method. It has been demonstrated that traditional condensation control is not sufficient to solve moisture-related building failures [7]. Transient hygrothermal models can calculate the coupled transport of heat and moisture over varying environmental conditions and predict the risks of moisture damage. Moreover, up-to-date transient hygrothermal simulation models also include functions accounting for the possible imperfections of the building envelope, such as rainwater penetration and indoor air infiltration through gaps [8,9]. However, the results of the models are highly dependent on climate parameters, so representative and reliable weather data is required in moisture design calculations to simulate the hygrothermal responses of the building envelope under real-life conditions.
For the hygrothermal building envelope simulation, two types of weather data are required: one dataset representing the long-term climate loads over the service life of a building and other datasets representing extreme climate conditions occurring once in a decade, imposing more severe hygrothermal stress onto the building envelop. A number of methods to generate the typical weather data have been found, and they have been widely used for different locations in the world; Test Reference Year (TRY) [10] and Typical Meteorological Year (TMY) [11,12,13]. Although these methods have different names, the basic principle for the typical weather data is the same. They use weighting factors to express the relative importance of particular climatic parameters, mainly for building energy performances: temperature, humidity, solar radiation, and wind speed. On the other hand, representative climatic data for hygrothermal simulations must provide all moisture parameters with sufficient accuracy and the required level of severity with regard to moisture problems. Various acronyms are used in moisture applications: Hygrothermal Reference Year (HRY), Moisture Reference Year (MRY), Design Reference Year (DRY), Moisture-Design Reference Year (MDRY), and so on. In this study, the authors have adopted Hygrothermal Reference Year (HRY) as an acceptable acronym for weather data developed for moisture control analysis. This is because International, European, and German standards use the acronym of HRY. In contrast to typical weather data, current standard methods for extreme weather data have limitations as input for transient hygrothermal simulation. They deal mainly with temperature extremes for the heating period and the cooling period, respectively. However, moisture problems are often caused by a combination of several extreme weather conditions. Therefore, temperature-based methods are only partly suitable for creating HRYs. This article focuses primarily on methods to develop meteorological datasets for moisture control design by hygrothermal building envelope simulations.
For moisture control design, in addition to average climatic data, datasets that impose more severe stress on the structure should be available to ensure a safety margin regarding moisture damage. The International Energy Agency (IEA) has adopted a 10-year return period as an acceptable safety factor for an HRY [14]. As part of the IEA project Annex 24, a basic concept was developed that the HRY is determined relating to the interstitial condensation situation in constructions. Geving [15] proposed using data from the coldest or warmest year in 10 years for hygrothermal analysis instead of data from an average year. The so-called “10%-year” has been finally denoted as a critical reference year during which hygrothermal stress imposed onto the construction has been regarded as severe enough to indicate the risk of moisture damage due to interstitial condensation.
The main objective of the literature review is to provide a concise overview of the existing available methods to generate HRYs for moisture control design by hygrothermal building envelope simulation. This paper also discusses the environmental moisture loads acting on the building envelope beforehand because it is very important to understand how individual climatic parameters have an influence on the hygrothermal performance of the building envelope and how the current technology of a transient hygrothermal simulation reproduces the moisture boundary condition. This literature review will follow the path shown in Figure 1.

2. Environmental Moisture Loads

Protecting indoor conditions from outdoor climate fluctuations represents the main function of the building enclosure. Therefore, it is important to understand the moisture loads acting on the building envelope to predict their influence on the hygrothermal building envelope performance and to plan adequate moisture control measures [16]. The hygrothermal loads relevant to building envelope design according to ASHRAE [17] are represented schematically for an external wall in Figure 2. Generally, they show large diurnal and seasonal variations at the exterior surface, getting much smaller at the interior surface. During the day, the exterior surface is heated by solar radiation, causing moisture to evaporate. In the evening, when solar radiation ceases, long-wave radiation to the sky may lead to overcooling of the façade, and exterior surface condensation may occur. The façade is also exposed to moisture from driving rain. Generally, several load cycles overlap, such as summer/winter, day/night, and rain/sun. Therefore, a thorough analysis of the expected hygrothermal loads is a prerequisite to appropriate building envelope design. However, the magnitude of the loads also depends on building geometry and the characteristics of the envelope. A hygrothermal analysis is generally based on hourly weather data. In contrast to outside air temperature and humidity data of climate datasets, vectorial quantities such as solar radiation and the driving rain must be converted to the respective orientation and inclination prior to the simulation. The actual conditions at the surface of the envelope depend on the surface characteristics, e.g., the surface color, the type of finishing materials, and the microclimate at the surface.

2.1. Temperature and Humidity

Ambient temperature and humidity are continuously changing parameters, permanently acting on both sides of the building envelope. The temperature differences between outdoors and indoors cause partial vapor pressure differences responsible for vapor diffusion through the building envelope. Consequently, interstitial condensation may occur on the cold side of the insulation layer. As a countermeasure, vapor control layers are often placed on the warm side of the insulation. Another severe load is caused by air pressure differences over the building envelope resulting from thermal buoyancy, wind, or unbalanced mechanical ventilation. The buoyancy or stack effect is a permanent load, and the stack pressure may act in the same direction as vapor pressure: from inside to outside during the heating season and in the opposite direction during the cooling season. The pressure-driven convective airflow through unsealed joints or other leaks may also lead to interstitial condensation. To prevent moisture damage, airflow through building assembles should be prevented by a continuous air barrier [17]. The convective moisture entry through leakages is a multidimensional effect. However, due to the lack of information concerning the exact configuration of flow paths, an exact flow analysis is rarely feasible. Therefore, a simplified approach [18] to quantify the moisture sources caused by vapor flow through leaks has been developed and checked for plausibility [9]. This one-dimensional model assumes that vapor in the indoor air, penetrating the envelope through moisture leaks, condenses at the cold side of the insulation. It neglects energy leaks which are kept warm by the air flow through them, focusing on so-called moisture leaks representing small and tortuous channels where the air velocity is so slow that the air cools down within the flow path, as shown in Figure 3.

2.2. Driving Rain

Driving rain is the main exterior moisture load for external walls. It represents a directional parameter, often having one dominant orientation. The driving rain load also depends on the exposure and the height of the building. The rain load is usually higher at the upper end of the façade; however, the lower part often shows more water-related damage. The reasons are drainage of excess water coupled with a smaller evaporation potential due to the lower wind and solar radiation exposure at the bottom. The worst scenario represents rainwater penetration through joints and connections. Ideally, the façade should be waterproof, but perfect and durable sealings are difficult to achieve, especially around windows. Other connections may also provide entry to rainwater, such as roof-wall connections and penetrating pipes or ducts. ASHRAE Standard 160 [19] and DIN 4108-3 [20] suppose that through small rainwater leaks, as much as 1% of the driving rain load can penetrate the exterior cladding (Figure 4). This leakage water is assumed to be deposited on the exterior surface of the water-resistive barrier or even behind an exterior insulation finishing system (EIFS) if no water-resistive barrier is installed. Most current hygrothermal simulation models can account for intentional rainwater leakage during driving rain spells [8].

2.3. Solar Radiation

Solar radiation is the main thermal load on the exterior surface of the building envelope. Its impact is usually accounted for by an external surface heat source that depends on the radiation intensity, the angle between the sun, the normal of the exposed surface, and the short-wave absorptivity of the surface color. Since solar radiation helps to dry the building envelope, it is usually considered beneficial unless an envelope component is completely shaded. However, in some cases, solar radiation on reservoir cladding, being wet because of driving rain exposure, can lead to severe moisture problems [17]. When the sun heats up the wet cladding, the water will dry out in both directions, and a significant part of the evaporating water may also move inwards, thereby also increasing the water content of assembly layers further away from the external surface. This effect, known as “solar vapor drive”, is demonstrated in Figure 5 [16]. Depending on the construction, it may cause condensation and potential damage to moisture susceptible materials. This phenomenon has been studied by Derome et al. [21] and is also described in the ASHRAE Handbook Chapter 25 [17]. The impact of solar vapor drive may be alleviated by providing cladding ventilation [22,23]. It is obvious that steady-state diffusion calculation methods cannot capture this effect because it is highly dynamic and requires tools that can model the combination of driving rain events and sunny spells.

2.4. Long-Wave Radiation

Long-wave radiation exchange of the envelope surface with the environment represents a continuous (24 h/d) heat transfer process (Figure 6). It becomes visible during clear nights when the radiative temperature of the sky drops well below the outdoor air temperature. As a result, the external surface of the building assembly cools down rapidly, and condensation occurs once the dewpoint of the outdoor air is reached. In some cases, condensation may also form on the backside of the exterior cladding. Although this might quickly evaporate the next day, there can be a sufficient accumulation of condensate to cause drainage or dripping. Heavy-weight structures with high thermal inertia do not lose enough heat overnight and are mostly spared from this effect. However, many modern building assemblies with low thermal inertia, such as lightweight roofs or EIFS, are often subject to considerable amounts of exterior condensation [24]. While this may not cause any real damage, it often results in staining by microbial growth or dirt. Therefore, an explicit full radiation balance model [25] should be applied to cover this effect when performing the hygrothermal simulation. It explicitly computes the full radiation balance and thus allows, in principle, to quantitatively determine nighttime overcooling and subsequent condensation loads.

2.5. Rising Damp

High groundwater tables or surface water running toward the building are important moisture loads for foundations or basements [17]. Wicking of ground- or surface water into porous walls by capillary action is called “rising damp”. It can be an indication of poor drainage or waterproofing of buildings. These loads should be controlled by grading the ground away from the building, perimeter drainage, and waterproofing of basements and foundations. Figure 7a shows an example of measures to prevent rising damp on the lower ground floor. The lower ground floor consists of the materials in the following order from the ground: compacted stone base, extruded polystyrene insulation, vapor retarder, and a reinforced concrete slab. Moisture loads in the ground may also impair the performance of exterior basement insulation applied on the outside of the waterproofing layer. Hence, careful measures must be taken to protect the insulation from moisture accumulation unless the insulation material is impermeable to water and vapor. Figure 7b shows a waterproofing measure for basement walls consisting of the materials in the following order from the ground: cavity drain waterproofing membrane, extruded polystyrene insulation, bituminous waterproofing, and a reinforced concrete wall. Rising damp is difficult to assess by hygrothermal simulation because the boundary conditions in the ground are often unknown. Therefore, simulating rising damp may be of limited accuracy, but it can help to compare the performance of different options.
In summary, the impact of moisture on building envelope components is not restricted to vapor diffusion and interstitial condensation. In the past, moisture problems were mostly associated with the cold season. However, rainwater penetration and solar vapor drive, which are often more dominant in summer, can also cause severe problems. In hot and humid climates, vapor diffusion and possibly airflow from the outside to the inside represent major loads. Therefore, we need tools to evaluate moisture risks that are beyond the scope of steady-state calculation methods. For these tools, we also need climate datasets that contain more than just temperature and relative humidity. Since driving rain has an important impact on the durability of building envelope constructions, the selection of meteorological datasets should not be based on annual temperature only. The following section describes the literature review of the existing available approaches to generate an HRY for moisture control design by hygrothermal building envelope simulations.

3. Hygrothermal Reference Year

The results of a hygrothermal simulation depend strongly on the input data, such as the boundary conditions. In contrast to the normal indoor climate with a relatively small temperature and humidity range, the exterior boundary conditions are often subject to large daily and seasonal variations. They also vary with the location, i.e., altitude, exposure, neighborhood (e.g., forest, lake, urban or rural environment) and most importantly, with the climate zone. Most weather stations are located in undisturbed surroundings such as airports, mountains or coastlines. In order to obtain weather data for other locations, tools like Weather Research & Forecasting Model (WRF) [26] may be employed. A local climate model [27] was developed using correction functions relating to different environmental locations: city, lake, mountain, and valley (Figure 8). The correction functions describe the climatic deviations for the different locations from the reference location in the form of seasonally varying correction factors applied to all relevant hourly climate parameters. As an example, this raises the temperature in the city and increases the humidity near a lake. In addition, the impact of climate change is another factor that is often discussed at all levels, but it can be particularly relevant to buildings because they could be exposed to very different conditions during their service life. All this demonstrates the challenges involved in selecting appropriate meteorological data for moisture control design purposes [28].
At the beginning of applying hygrothermal simulation tools, weather data developed for building energy simulations, the so-called TRY, were used. This worked reasonably well as long as driving rain was not an issue. The problems with the TRY data in Germany, and not only there, became evident when the impact of driving rain on masonry walls was simulated with TRY and rain data measured for the same location showed different results. The analysis of the different datasets resulted in different average durations of the rain spells [29]. It turned out that the rain data in the German TRYs were modelled data and not recorded on an hourly basis. Since precipitation is not a big issue for energy calculations, the updated German TRYs come without any rain data. This is one reason why the development of HRY became necessary. Other reasons that were put forward are safety concerns. Damage is more likely to occur during severe weather conditions, while the main idea behind the TRYs was to represent typical meteorological data for a certain location.
Before looking at the different approaches to developing weather data for moisture control design, it appears worthwhile to summarize the issues that hygrothermal analyses should address. Assessing the problem of interstitial condensation during the heating period would require a severely cold year. Assessing a similar problem during the cooling period in a hot and humid climate would require a severely hot and humid year. If driving rain is assumed to cause damage, a severely wet year with much rain and high humidity would be required. To evaluate the risk of frost damage, a year with frequent freeze and thaw cycles would represent a worst-case scenario. To assess the progress of long-term phenomena such as corrosion, aging mechanisms, slow moisture accumulation (inverted roofs) or microbial growth (algae, rot), an average year that is applied repeatedly in the simulation would probably be the best choice. These examples are certainly not exhaustive, but they show the potential range of applications which may require different types of hygrothermal weather datasets. The literature review in this section starts with the most common approach to assessing the problem of interstitial condensation in cold and moderate climates, followed by some more recent proposals to consider the impact of rainwater.
The International Energy Agency (IEA) has adopted a 10-year return period as an acceptable safety factor for HRYs. The HRYs are determined by selecting the most severe year of a period of ten years. Thus, a minimum of ten consecutive years of hourly meteorological weather data is required. The datasets must contain dry-bulb air temperature, humidity, solar radiation, wind speed and direction, rainfall, as well as sky radiation or cloud index. The following standards on moisture-control design of buildings ISO 13788 [30], EN 15026 [31], DIN 4108-3 [20], ASHRAE Standard 160 (2016) [32], and BS 5250 [33] recommend the use of such a HRY as external boundary condition for hygrothermal simulation if data for at least 30 consecutive years are not available. To be precise, these standards propose a method to determine an HRY with the mean temperature for the 10th-percentile coldest year in the heating period and the 10th-percentile warmest year in the cooling period. As explained above, moisture problems are often caused by a combination of several meteorological parameters. The standards determine HRYs only based on the mean temperature ignoring other loads, such as humidity, solar radiation, driving rain, and so on. For this reason, the boundary conditions derived by the standard method have only limited applicability. A number of methods have been developed to determine the 10th-percentile severe climate dataset for hygrothermal simulation, taking into account more than one climatic parameter. The existing methods to determine HRYs can be classified into two categories: the construction-independent and the construction-dependent methods. The construction-independent methods determine HRYs only based on weather data analysis and are probably useful for large-scale parametric studies comprising many climatic parameters acting on building components. The climatic parameters mostly considered are temperature, humidity, rainfall, wind speed and direction, and solar radiation. So, a reference year can be a summary of external climate conditions for a particular location or region. The construction-dependent methods require computer simulation models to identify HRYs in the context of a specific construction type. Moisture conditions within a construction serve as indicators in determining the 10% level of weather data. This is a more comprehensive approach since the moisture responses of building envelopes vary considerably with the boundary conditions as well as with the composition of building material layers. The following literature review summarizes the construction-independent methods, the construction-dependent methods, and the Standard methods as categorized in Figure 9.

3.1. Construction-Independent Method

Construction-independent methods determine HRYs based only on a weather data analysis. Djebbar [34] suggested the following criteria to select HRY with the construction-independent method. HRYs should be a summary of the external climate for the geographic location under consideration. HRYs should reflect climate variability of locality considering true frequencies, sequences, and correlation. HRYs should be location-specific and not construction specific. HRYs should span a least 1 year for moisture-related problems. Lastly, HRYs should provide severe moisture stress on the building envelope, such as the worst or the return period of 10 years. Cornick et al. [35] state that although there are many studies related to the selection of HRYs, there is no universal method arrived at by consensus for identifying severe HRY. For this reason, a number of construction-independent methods have been developed to determine the 10th-percentile severe climate of the building envelope, taking into account different climatic parameters. The following methods are reviewed by climatic parameters concerned: mean temperature method, drying potential method, moisture load method, and combined index method.

3.1.1. Mean Temperature Method

Examples of construction-independent methods were first suggested in the IEA Annex 24. Authors such as Ali Mohamed and Hens [36] and Sanders [37] suggested that the severe year could be associated with the annual or the monthly mean outdoor temperature. A variant of these methods suggests that HRY should be the year with the outdoor temperature at the lower 10th percentile, for example, such that only 10% of the years in the climatological record are that cold or colder. Künzel and Schmidt [38] also reached the conclusion that the annual mean temperature correlates best with the results of the transient hygrothermal simulations. The coldest and the warmest year result in the greatest moisture problems in relation to the winter condensation in the externally vapor-tight roof and to the summer condensation in double-shell brick walls, respectively. In addition, they proposed to modify the expression of the10th-percentile year in such a way that it is appropriate to designate the selected data sets with HRY-10% for the coldest and HRY-90% for the warmest in ten years for a clear statistical distinction.

3.1.2. Drying Potential Method

Hagentoft and Harderup [39] introduced the Π-factor method that considers the humidity on the external surface of the building envelope, solar/sky/ground radiation, surface heat transfer coefficients, and the building’s orientation. In addition, the HRY is selected from whole-year climate data in these methods. The year with the lowest value of the Π-factor is selected as the wet year with respect to the HRY. The year with the highest drying potential is selected as the drying year. Kalamees and Vinha [40] presented a hygrothermally critical year for the risk of water vapor condensation, which can occur once in ten years. The HRY was chosen with the help of the saturation deficit method using air temperature and relative humidity. The saturation deficit is defined as Equation (1):
Δ v s a t , d e f = v s a t T o u t v o u t ¯
with the saturation deficit, Δνsat,def [g/m3], that is defined as the mean value of the difference between the absolute humidity by volume of the outdoor air at saturation at a temperature, νsat(Tout) [g/m3], and the absolute humidity by volume of the outdoor air, νout [g/m3], over a given time period.
The saturation deficit describes the drying potential of outdoor air. When it is small, the drying potential for a wet construction is low. When it is larger, the potential for drying out is higher. The average value of saturation deficit during the winter period, from December to February, was taken into account in selecting the critical year for the risk of water vapor condensation in construction. The saturation deficits were calculated, ignoring sun/sky/ground radiation, rainfall, and wind data. The principles of these two methods are quite similar, but the main difference between the Π-factor method and the saturation deficit method is that the former considers the external wall outer surface humidity, also calculating the radiation balance, surface heat transfer coefficients, and the building’s orientation. The Π-factor method is more exact than saturation deficit methods, but it also requires many kinds of available climatic parameters, and the analysis method is more complicated. In addition, the Π-factor method selects HRYs from whole-year climate data. However, the saturation deficit method selected only three winter months’ data.

3.1.3. Moisture Load Method

Karagiozis [41] developed the ANK/ORNL method and refined it, including the impact of air flow. The moisture load includes all the hygric loads available for the construction to accumulate moisture. This method includes both static and dynamic hygrothermal loads. The static component includes the amount of hygric potential due to ambient conditions. The moisture load in the air is summed over a period of a year and is expressed as a bulk moisture quantity. The dynamic component is the key component in this method: driving rain and moisture due to air flow. The potential impact of air flow through the structure is considered moisture deposition due to hourly interactions of infiltration and exfiltration. The moisture load provides the net moisture available due to diffusion, capillary transport of driving rain and air flow movement in a particular year as Equation (2):
M T Y = t = 0 8760 u + t = 0 8760 m a i r · ρ a i r + t = 0 8760 Q d r i v i n g r a i n
with the annual moisture load potential, MTY [kg/m3], the moisture content of air, u [kg/m3], the moisture load due to infiltration and exfiltration, mairρair [kg/m3], and the moisture load due to driving rain, Qdriving rain [kg/m3].
The higher the moisture load, the greater potential to cause moisture-induced damage. The worst year and the 10% year were selected. These two years in succession, such as the 10% year first and then the worst year, were used for simulation purposes and are repeated when more than two years of analysis are required.

3.1.4. Combined Index Method

In the above methods, the selection of the HRY is either based on a drying term or a wetting term, not on both. Cornick et al. [42] formulated a Moisture Index method to select HRYs, which comprises both wetting and drying indices. The wetting index is based on the annual driving rain load in the direction of predominate rainfall. The drying index represents the annual evaporation potential which is the sum of the hourly difference between the saturation vapor ratio and the actual vapor ratio of the ambient air. As the wetting index and drying index have different units, they are normalized. The hypothesis is that the higher the Moisture Index, the more severe the year in terms of moisture loading in the wall. The Moisture Index and the normalization scheme are defined as Equations (3) and (4):
M I = W I n o r m a l i z e d 2 + ( 1 D I n o r m a l i z e d ) 2
I n o r m a l i z e d = ( I I m i n ) / ( I m a x I m i n )
with the Moisture Index, MI [−], the wetting index, WI [−], and the drying index, DI [−]. In addition, the wetting and drying index can be the index, I [−], for normalization.
The wetting function is chosen to be the annual driving rain in the direction of predominate rainfall calculated by Straube’s method [43] for the year in question. The drying index that relates to evaporation is the difference between the humidity ratio at saturation and the humidity ratio present in the ambient air. It is calculated from the dry bulb temperature and relative humidity. The drying index is calculated as the sum of the hourly values of the difference as Equation (5):
D I = t = 0 8760 w s a t ( 1 μ )
with the humidity ratio at saturation, wsat [kg water/kg air], and the degree of saturation, µ [−], that is, the humidity ratio in the ambient air, wambient [kg water/kg air], divided by that at saturation.
The advantage of the Moisture Index method is that it reflects actual environmental conditions as subjected to a wall during wetting or drying. There is a general agreement on the various methods. The authors proposed that the method can be revised to enhance its consistency and reliability as an indicator of the moisture-related performance of walls. Zhou et al. [44] proposed Climate Index to create the Swiss Hygrothermal Reference Year. The Climate Index can be calculated by dividing the annual driving rain load on a façade as the wetting index by the annual potential evaporation of a façade as the drying index having the same units. The Climatic Index can be considered a measure of the balance between the wetting and the drying components. It can be presented as Equation (6):
C I = A n n u a l   d r i v i n g   r a i n   l o a d A n n u a l   p o t e n t i a l   e v a p o r a t i o n
The numerator represents the annual driving rain load [kg/(m2∙a)] as the wetting component, while the denominator represents the annual potential evaporation [kg/(m2∙a)] as the drying component. HRYs are determined in the direction of the predominate Climatic Index for locations under consideration. A higher Climatic Index value represents a higher moisture risk for the building envelope. The annual driving rain load for different wall orientations was calculated according to ASHRAE Standard 160 [19]. The annual potential evaporation was calculated by a full evaporation model with air temperature, humidity, net radiation, wind speed and direction on the twelve façade orientations. Compared to the previously proposed Moisture Index, the Climatic Index does not need a normalization since both wetting and drying components have the same units. The authors demonstrated that the selection of HRYs based on the 10% level criterion of the Climatic Index, however, may lack robustness for the location and the wall types in the study. They compared the rankings of CI of each year with the rankings of moisture conditions in a material layer by hygrothermal simulations. The correlation between them was rather poor.
Table 1 summarizes the construction-independent methods. Many researchers have investigated the interaction between values of temperature, relative humidity, solar radiation, etc. and the risks of moisture damage. Most methods use datasets of complete years for their analysis. However, the influences of climatic parameters on the building envelope differ with the seasons. A severe winter combines low temperatures and little solar radiation, and high relative humidity. A severe summer may mean a large amount of driving rain, high solar radiation, and hot and humid conditions. Therefore, it may be appropriate to determine two HRYs, one for the severe winter and one for the severe summer, respectively. Furthermore, it should be noted that the available methods can be restrictive because not all of the weather stations provide a complete set of weather data.

3.2. Construction-Dependent Methods

Construction-dependent methods require hygrothermal simulation models and modeling information on specific construction types. Moisture conditions within a construction serve as criteria to determine the one in ten severe years of the weather data. Since the moisture response of the construction is the outcome that designers are looking for, this approach appears to be sensible. The caveat lies in the response of different construction types. Not all assemblies will be sensitive to the same combination of climate parameters. Therefore, these methods may result in different climate files for different construction types. The principles used by these methods can be summarized in four steps [34]. Firstly, a set of typical wall constructions and typical boundary conditions should be defined. Secondly, the critical construction orientation should be prescribed. Third, hygrothermal simulations for all the years of hourly data should be performed. Lastly, HRYs should be determined by proper criteria to determine ranks of the simulated years: the mean/maximum moisture content of a material layer or a whole construction and certain damage functions of the expected moisture-related problems.

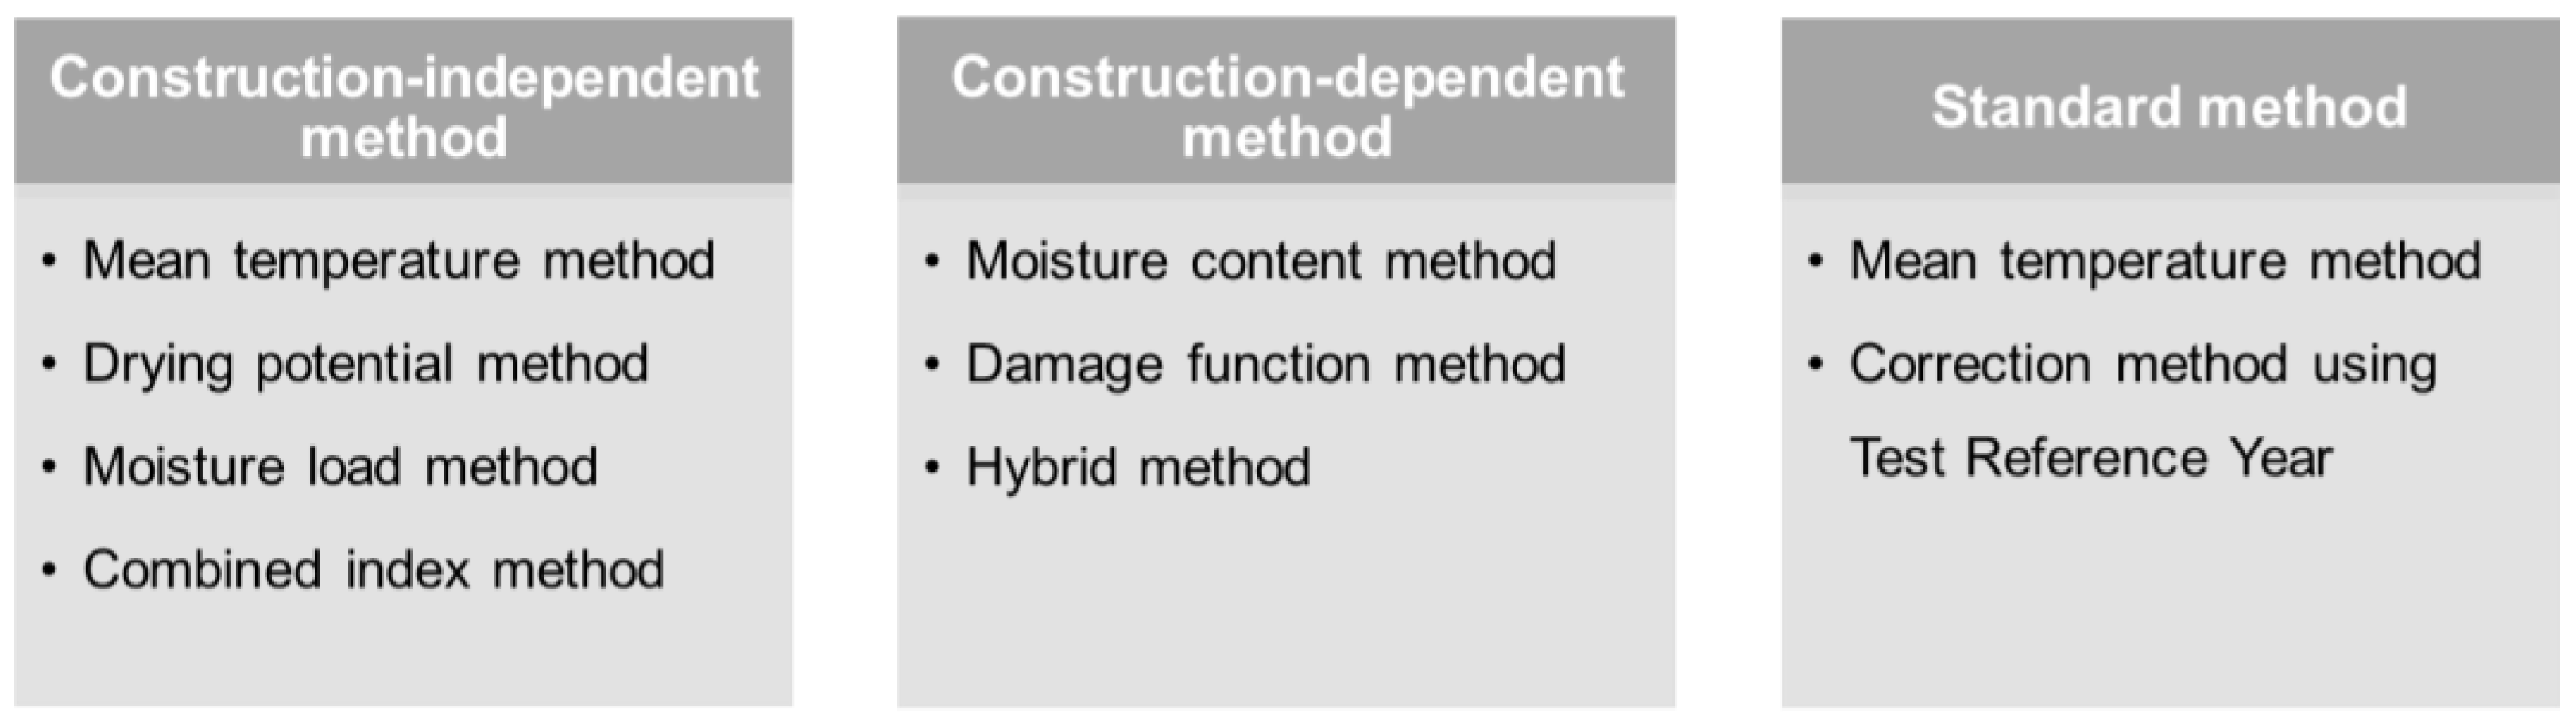
3.2.1. Moisture Content Method

The Rode method [45] is a construction-dependent method that requires the use of a reliable hygrothermal simulation tool in determining the hourly HRY. An HRY represents the year characterized by the occurrence of the worst moisture condition. It can be the highest moisture content for the construction or the critical layer within a construction. The procedure involves conducting hygrothermal simulations for as many years as there are available hourly data, for several different constructions and with different orientations. The moisture content is calculated for each year, which is then ranked in accordance with the severity of moisture conditions. The higher the moisture content integral, the worst moisture conditions in the construction. Juráš and Žilinský [46] followed the same method to determine a hygrothermal reference year for Bratislava, Slovenia. A total of two walls were considered: aerated clay brick wall with/without an external thermal insulation composite system made of expanded polystyrene insulation.
The Geving method [15] was developed within the framework of the IEA Annex 24. For the purpose of moisture accumulation effect in wintertime, it was examined for the applicability of this method for different climates, six construction types, orientations, indoor climate conditions, initial moisture content of the construction, and duration, as shown in Table 2.
The author used a 1-D coupled transient heat and mass transfer computer software to perform calculations. For each preselected construction type, the maximum moisture content of the hygroscopic layer just outboard of the insulation and the mean moisture content of the entire construction were gained from the simulation results. From the normal distribution function, it is determined for the 10% level (90th-percentile) moisture content for both maximum and average moisture content criteria of each construction, and calculated mean and standard deviation. Each construction will have two corresponding values and a total of 12 HRYs values are generated for each location. The next steps are as follows:
  • Rank every year and for each construction in accordance with the average moisture content value determined with a hygrothermal simulation. The year with the highest average moisture content is ranked 1st, with the subsequent and monotonously decreasing years being ranked 2, 3, 4, 5, and so on. For example, with 30 years of weather data, the 10% level will be represented by the 3rd year.
  • Select all the years that occurred in the 5 worst year groups for half or more of the constructions and calculate the sum of the rankings for every construction. For example, Table 3 [15] shows that 5 years 1989, 1990, 1991, 1992, and 1994 were each found to be in the 5 worst years in at least 5 of the 6 constructions.
  • Select two or three years with the lowest mean rankings.
  • Assuming a normal distribution function, calculate the average probability level for each selected year using the average moisture content.
  • Repeat the first three steps using the maximum moisture content criteria. It is important that the same years as those selected for the average moisture content (in the second step) must be selected. In this case, the years 1989, 1990, 1991, 1992 and 1994 must be selected.
  • Calculate the average probability level for the average and the maximum moisture content for each year selected.
  • The year with the lowest probability level is selected to be the HRY for the specific location.

3.2.2. Damage Function Method

The damage function method is suitable for the location where a typical damage pattern caused by the external environment is well known. In addition, the main ideas of this method can be applied for many purposes if thresholds that moisture damages start have been clearly proved. The general procedure of the damage function method follows consecutive steps. The wall systems and weather data for locations should be defined. Computer simulations of their hygrothermal performance should be performed, and the damage function using the simulation outputs of interest should be calculated. Then, an inverse analysis of the damage-function values with the data of climatic variables should be conducted. Lastly, selection of the critical weather year.
The current ASHRAE Standard 160 [19] uses the simple approximate method that was developed by Salonvaara [47] using a damage function method. The author analyzed several existing HRY selection methods and compared their performance by simulating two wall systems: one lightweight wall and one massive concrete masonry wall. The analysis included 30 years of hourly weather data for 12 locations in the US and Canada. However, the analysis showed that none of the existing methods produced consistent simulation results. Therefore, the author proposed a new construction-independent method by analyzing the weather data and the simulation results of the constructions. The basic idea was to use yearly average weather data parameters and use regression analysis to fit the parameters of an equation that can be used to calculate a predicted damage function value for each year. A simple approximate model was developed as Equation (7):
I s e v = 108.307 241 × E v 1391 × I c l 312,326 × φ + 183.308 × r w d + 15.2 × p v + 27.3 × T o 2 + 261.079 × φ 2 0.009272 × p v 2
with the severity index as a predicted damage function, Isev [−], the vapor pressure, pv [Pa], the relative humidity, φ [−] where 0 ≤ φ ≤ 1, the dry-bulb temperature, To [°C], the driving rain, rwd [kg/(m2∙h)], the cloud index, Icl [−] where 0 ≤ Icl ≤ 8, and the solar radiation on the wall with orientation receiving the least solar radiation, Ev [W/m2].
The year with the third highest severity index value is proposed as the year to be selected for hygrothermal designs. For the regression analysis, the severity index was derived from the damage function RHT-index in the OSB layer of the lightweight wood frame wall. The RHT-index [48] is calculated as Equation (8):
R H T = T T L · ( R H R H L ) , f o r   T > T L   a n d   R H > R H L
with the temperature, T [°C], the relative humidity, RH [% rh], in the OSB layer of the lightweight wood frame wall from the results of hygrothermal simulations and the limiting values, TL = 0 °C, RHL = 70 % rh.
The significance of individual coefficients to the severity index was identified by t-values. Only the regression equations having an absolute value of at least 2.0 were applied to the equation to minimize the error between the damage function values resulting from simulations and the predictions from the equation. The authors showed the matrix of correlation between the damage function and the mean annual weather data.
J. Kocí et al. [49] utilized the damage function method to select a critical weather year for the Czech Republic. The severity of every year was ranked by the newly expressed damage function, Winter Index. Afterwards, the mathematical relations between the weather data and its severity to an investigated structure are determined. Lastly, the derived mathematical formulas are used to select the critical weather year using the monthly means of partial weather data for the locations. The freeze/thaw cycles in the external surface layers of the building envelope were determined as typical moisture-related damage by the external environment. The Winter Index (WI) was calculated using the RHT-index [48] as Equation (9):
W I = T T L · ( R H R H L ) , f o r   T < T L   a n d   R H > R H L
with the temperature, T [°C], the relative humidity, RH [% rh], of the external plaster otherwise the position 10 mm under the exterior surface and the limiting values, TL = 0 °C, RHL = 95% rh.
The selection process continued by ranking each chosen by the Winter Index damage function with the defined damage function and the necessary weather data. Following this, the relation between the damage function values and the selected principal parameters of the weather years was derived for each envelope of the 16 types. In this way, the mathematical relations between the weather data and the Winter Index were found as Equation (10):
Y p r e d = c 0 + c 1 · T w · R H w + c 2 · T w · R R w + c 3 · T s · R H s + c 4 · T s · R R s
with the predicted value of the Winter Index, Ypred [−]; the optimized coefficients for each construction type, c0c4; the monthly average of temperature, relative humidity, and precipitation in the winter period from November to March, Tw [°C], RHw [% rh], RRw [mm], respectively; and those in the summer period from April to October, Ts [°C], RHs [% rh], RRs [mm], respectively.
The optimized coefficients for each construction type, c0c4, were determined by the inverse relation for 16 constructions. As a final step, the derived mathematical formulas were used to select the critical weather year using the monthly mean weather data for the given location.
The damage function method can be successful in selecting the worst years in all analyzed locations and is consistent in its predictions in similar climate regions. However, the method should include all the input data necessary for the hygrothermal simulation and address the specific problem under investigation. Furthermore, the approximate equations and coefficients are optimized by weather data, simulation results, and damage functions, so future users must beware of using the proposed equations without much consideration for moisture control design by hygrothermal building envelope simulation.

3.2.3. Hybrid Climate Analysis and Hygrothermal Performance Method

Another proceeding, described in [50], couples both statistical methods to preselect single real measured months to combine them to a representative year and hygrothermal simulations of rather moisture-sensitive constructions to further adapt the single climate elements in a way that repeated use of the created year leads to similar conditions like a simulation with real measured long-term data. Therefore, it is called a hybrid model. Temperature and driving rain were chosen as the main influencing factors for selecting the single measured months. On a monthly basis, the statistical key numbers such as mean, minimum, maximum, and median value, as well as 75th- and 25th-percentile, were matched with the same numbers for a mean year out of an eight-year period. This was performed for each month of the year, and the HRY was generated as a combination of the months which best match the mean of the indices of both climate elements. In a second step, hygrothermal simulations of constructions were performed, which are particularly sensitive concerning moisture accumulation depending on the influence of the different outdoor climate elements. In case of relevant differences in the moisture performance of the assemblies simulated with the new HRY or with long-term measured data, the relevant climate elements were identified and adjusted in an appropriate manner. The method developed within the framework of [51] was used to create, in total, 11 HRY data sets that represented the different climate regions in Germany and were adopted by [20] for hygrothermal design purposes. In addition to the slightly critical but representative years, which shall be normally used; also, cold years were proposed, which can be used to assess on a single-year basis non-cumulative damage mechanisms such as frost or mold growth on thermal bridges, which occur in particularly cold winters.

3.3. Summary of Selection Methods for Hygrothermal Reference Years

The following Table 4 summarizes the advantages and disadvantages of different selection methods for hygrothermal reference years.

3.4. Standards on Moisture-Control Design of Buildings

The standards on moisture-control design of buildings such as ISO 13788 [30], EN 15026 [31], DIN 4108-3 [20], WTA 6-2 [52], ASHRAE Standard 160 (2016) [32], and BS 5250 [33] define that HRYs can be selected as the extreme year that occurs once in 10 years. These standards indicate a method to determine an HRY only with the mean temperature for the 10th-percentile coldest year in the heating period and the 10th-percentile warmest year in the cooling period. However, moisture problems are often caused by a combination of several extreme weather conditions, so the mean temperature method in the standards can be used only for certain constructions without additional moisture loads, e.g., due to driving rain. However, in practice, moisture may accumulate over several years without reaching critical limits during the first year. This problem can only be discovered when running the simulation over several years. On the other hand, employing the same extreme dataset for simulating the hygrothermal behavior over more than one year considerably increases the safety margin of the simulation’s outcome. That is fine as long as the investigated building assembly passes this test. If not, it does not mean that the assembly will fail in practice. Therefore, a different approach is necessary here. The determination of the severe and the mean climate specified by standards are summarized in Table 5.
ASHRAE Standard 160 [19] specifies performance-based design criteria for moisture control in buildings. These criteria include analytic procedures, inputs, and evaluation of outputs. The previous version of ASHRAE Standard 160 (2016) [32] defined an HRY as the year having the 10th-percentile warmest and 10th-percentile coldest years from a 30-year weather analysis. The current standard defines HRYs as the 93rd-percentile year in severity index for hygrothermal performance from an analysis of 30 years of weather data. Its definition was derived from ASHRAE RP-1325 [47], summarized in the Section 3.2 ‘Construction-dependent methods’.
BS 5250 [33] gives recommendations and guidance on avoiding problems with high moisture levels and condensation in buildings. This British Standard describes that a once-in-ten-year climate year shall be appropriate for condensation risk analysis in most buildings. Additionally, the standard provides various return periods that can be created by applying the corrections to the temperature and the relative humidity of any mean year, as shown in Table 6. This is because it is better to use the worst climate predicted to occur once in N years, where N is a number that reflects the likely consequences of condensation occurring in the building under consideration, such as computer centers, art galleries, or hospitals where a lower failure rate might be required. The calculation of long-term performance is appropriate with an average year.
ASTM E3054 [54] offers guidance for the characterization and use of hygrothermal models for the moisture control design of building envelopes. This guide provides guidance regarding the reliability of input and how the corresponding results can be analyzed. In contrast to other standards and guidelines, this standard states only the general definition of an HRY as a year of hourly weather data that have been selected for use in the hygrothermal analysis.

4. Conclusions

The outcome of the moisture analysis of building assemblies by hygrothermal simulation depends strongly on the input of the meteorological dataset. As most TRY or similar weather datasets developed for building energy simulation do not focus enough on the climate elements required for moisture transfer calculations, the use of HRY is recommended. This paper has shown that there are different approaches to creating such datasets. Analogous to the TRY, there is a need for an HRY representing an average year to assess the long-term performance of building assemblies. In addition, more severe yearly datasets may be required to assess more short-term phenomena, such as interstitial condensation or rainwater impacts. These datasets are certainly important for research and for building forensics. However, architects and engineers might be overwhelmed by the number of datasets to choose from, depending on the anticipated problems. There is also the risk that specific severe datasets will be applied in a sequence that will not occur in a thousand years in real life. While this would lead to extremely resilient constructions, it is unlikely that anybody would be willing to pay for such exceptionally moisture-tolerant envelope assemblies. Even worse, sustainable constructions assembled from bio-based materials will not be able to pass these severe tests. The idea behind selecting severe weather is a safety concept that ensures that assemblies do not fail only because one year is colder or warmer than the long-term average. However, in the case of interstitial condensation, this can also be achieved by applying more severe indoor climate conditions for design purposes, which is usually already performed. This approach does not help if driving rain is a major source of concern. However, these cases are comparatively rare. In summary, more research is necessary for this field.
From a future perspective, firstly, the target should be a single HRY dataset for each region, which may be adapted by some kinds of modulation functions to account for temporal climate variations as well as long-term climate change scenarios. Secondly, one of the simplest modulation functions is the already mentioned addition or subtraction of 2 K for every outdoor temperature value, but there will certainly be more sophisticated approaches available, as shown for the local climate adaptation. Lastly, exterior boundary conditions vary with the location, i.e., altitude, exposure, and neighborhood. However, most weather stations are in undisturbed surroundings. The methods to obtain weather data for other situations derived from a representative hygrothermal reference year should be further elaborated and validated by weather data monitoring at various specific locations.

Author Contributions

Conceptualization, H.M.K. and S.K.; methodology, S.K., D.Z. and H.M.K.; analysis, S.K., D.Z. and H.M.K.; investigation, S.K.; data curation, S.K., D.Z. and H.M.K.; writing—original draft preparation, S.K.; writing—review and editing, S.K., H.M.K. and D.Z.; visualization, S.K.; supervision, H.M.K.; project administration, D.Z.; funding acquisition, H.M.K. All authors have read and agreed to the published version of the manuscript.

Funding

This research was supported by a grant (22AUDP-B151639-04) from the Infrastructure and Transportation Technology Promotion Research Program funded by the Ministry of Land, Infrastructure and Transport of the Korean government.

Conflicts of Interest

The authors declare no conflict of interest. The authors declare that there are no known conflicts of interest associated with this publication, and there has been no financial support for this work apart from the grant mentioned above. The authors confirm that the manuscript has been read and approved by all named authors and that there are no other persons who satisfied the criteria for authorship but are not listed. The authors also confirm that we have given due consideration to the protection of intellectual property associated with this work and that there are no impediments to publication, including the timing of publication, with respect to intellectual property. In so doing, the authors confirm that we have followed the regulations of our institutions concerning intellectual property.

References

  1. ISO 22185-1; Diagnosing Moisture Damage in Buildings and Implementing Countermeasures–Part 1: Principles, Nomenclature and Moisture Transport Mechanisms. International Standards Organization: London, UK, 2021.
  2. Künzel, H.M. Raumluftfeuchte in Wohngebäuden–Randbedingung für die Feuchteschutzbeurteilung, Zeitschrift für Wärmeschutz, Kälteschutz, Schallschutz. Brandschutz 2006, 51, 31–41. [Google Scholar]
  3. American Society of Heating, Refrigerating and Air-Conditioning Engineer. Damp Buildings, Human Health, and HVAC Design; American Society of Heating, Refrigerating and Air-Conditioning Engineer: Atlanta, GA, USA, 2020. [Google Scholar]
  4. Bundesministerium für Wirtschaft und Energie. Energieeffizienz-Strategie Gebäude-Wege zu Einem Nahezu Klimaneutralen Gebäudebestand, Kapital 2–1.4 Restriktionen zur Reduktion des Endenergiebedarfs Durch Effizienzmaßnahmen; Bundesministerium für Wirtschaft und Energie: Berlin, Germany, 2015. [Google Scholar]
  5. U.S. Environmental Protection Agency (USEPA). Moisture Control Guidance for Building Design, Construction and Maintenance; U.S. Environmental Protection Agency (USEPA): Washington, DA, USA, 2013.
  6. VHV Allgemeine Versicherung AG. VHV-Bauschadenbericht Hochbau 2021/22, Kapitel 4 Aktuelle Schadenanalyse; Fraunhofer-Informationszentrum Raum und Bau IRB: Stuttgart, Germany, 2022. [Google Scholar]
  7. Künzel, H.M. Moisture risk assessment of roof constructions by computer simulation in comparison to the standard Glaser-method. In Proceedings of the International Building Physics Conference, Eindhoven, The Netherlands, 18–21 September 2000. [Google Scholar]
  8. Künzel, H.M.; Zirkelbach, D. Advances in hygrothermal building component simulation–Modelling moisture sources likely to occur due to rainwater leakage. J. Build. Perform. Simul. 2013, 5, 346–353. [Google Scholar] [CrossRef]
  9. Künzel, H.M.; Zirkelbach, D.; Schafaczek, B. Vapour control design of wooden structures including moisture sources due to air exfiltration. In Proceedings of the 9th Nordic Symposium on Building Physics, Tampere, Finland, 29 May–2 June 2011; pp. 189–196. [Google Scholar]
  10. ISO 15927-4; Hygrothermal Performance of Buildings–Calculation and Presentation of Climatic Data–Part 4: Hourly Data for Assessing the Annual Energy Use for Heating and Cooling. International Standards Organization: London, UK, 2005.
  11. Hall, I.J.; Prairie, R.R.; Anderson, H.E.; Boes, E.C. Generation of a typical meteorological year. In Proceedings of the Annual Meeting of the American Section of the International Solar Energy Society, Denver, CO, USA, 28–31 August 1978; pp. 669–671. [Google Scholar]
  12. Marion, W.; Urban, K. User’s Manual for TMY2s Derived from the 1961–1990 National Solar Radiation Data Base; National Renewable Energy Laboratory: Golden, CO, USA, 1995.
  13. Wilcox, S.; Marion, W. User’s Manual for TMY3 Data Sets; National Renewable Energy Laboratory: Golden, CO, USA, 2008.
  14. Sanders, C. Environmental conditions. In Energy Conservation in Buildings and Community Systems, Annex 24 Heat-Air and Moisture Transfer in Insulated Envelope Parts (HAMTIE); International Energy Agency: Paris, France, 1996. [Google Scholar]
  15. Geving, S. Moisture Design of Building Constructions: Hygrothermal Analysis Using Simulation Models–Part I and II. Ph.D. Thesis, Norwegian University of Science and Technology, Faculty of Civil and Environmental Engineering, Trondheim, Norway, 1997. [Google Scholar]
  16. Künzel, H.M.; Karagiozis, A. Vapor control in cold and coastal climate zones. In Proceedings of the 3th Conference of International Building Performance Simulation Association-Canada, Sydney, Australia, 14–16 November 2004; pp. 55–60. [Google Scholar]
  17. ASHRAE Fundamental Handbook, Chapter 25 Heat, Air, and Moisture Control in Building Assemblies–Fundamentals; American Society of Heating and Air-Conditioning Engineers: Atlanta, GA, USA, 2017.
  18. TenWolde, A.; Carll, C.G.; Malinauskas, V. Air Pressures in wood frame walls. In Proceedings of the Conference Proceedings Thermal Envelopes VII, Clearwater Beach, FL, USA, 6–10 December 1999; pp. 665–675. [Google Scholar]
  19. ANSI/ASHRAE Standard 160-2021; Criteria for Moisture-Control Design Analysis in Buildings. American Society of Heating and Air-Conditioning Engineers: Atlanta, GA, USA, 2021. Available online: https://www.techstreet.com/ashrae/standards/ashrae-160-2021?product_id=2242192 (accessed on 3 April 2023).
  20. DIN 4108-3; Thermal Protection and Energy Economy in Buildings–Part 3: Protection against Moisture Subject to Climate Conditions–Requirements, Calculation Methods and Directions for Planning and Construction. Deutsches Institut für Normung: Berlin, Germany, 2018.
  21. Derome, D.; Karagiozis, A.; Carmeliet, J. The Nature, Significance and Control of Solar-Driven Diffusion in Wall Systems; ASHRAE research report RP-1235; ASH RAE: Washington, DC, USA, 2009. [Google Scholar]
  22. Finch, G.; Straube, J. Ventilated wall claddings: Review, field Performance, and hygrothermal Modeling. In Proceedings of the Buildings X Conference, American Society of Heating and Air-Conditioning Engineers, Atlanta, GA, USA, 2–7 December 2007. [Google Scholar]
  23. Burnett, E.; Straube, J.; Karagiozis, A. Development of design strategies for rainscreen and sheathing membrane performance in wood frame walls. In ASHRAE Research Project RP-1091; ASH RAE: Washington, DC, USA, 2004. [Google Scholar]
  24. Künzel, H.M. Factors determining surface moisture on external walls. In Proceedings of the Buildings X Conference, Atlanta, GA, USA, 2–7 December 2007; American Society of Heating and Air-Conditioning Engineers: Atlanta, GA, USA, 2007. [Google Scholar]
  25. Kehrer, M.; Schmidt, T. Temperaturverhältnisse an Außenoberflächen unter Strahlungseinflüssen. In Proceedings of the Conference of International Building Performance Simulation Association-BauSIM, Bruges, Belgium, 1–3 September 2006. [Google Scholar]
  26. Mesoscale and Microscale Meteorology Laboratory. Weather Research & Forecasting Model (WRF). Available online: https://www.mmm.ucar.edu/models/wrf (accessed on 3 February 2023).
  27. Tanaka, E.; Zirkelbach, D.; Schöner, T. Lokalklima–Modelle zur Anpassung von Referenzklimadaten auf die lokalen Verhältnisse; IBP-Mitteilung 551; Fraunhofer-Institut für Bauphysik IBP: Stuttgart, Germany, 2017. [Google Scholar]
  28. Eibl, M.; Kilian, R. Climate for Culture-Measurement Guideline; Fraunhofer Institute for Building Physics: Stuttgart, Germany, 2011. [Google Scholar]
  29. Künzel, H.M. Regendaten für die Berechnung des Feuchtetransports; IBP-Mitteilung 265; Fraunhofer-Institut für Bauphysik IBP: Stuttgart, Germany, 1995. [Google Scholar]
  30. ISO 13788; Hygrothermal Performance of Building Components and Building Elements–Internal Surface Temperature to Avoid Critical Surface Humidity and Interstitial Condensation–Calculation Methods. International Standards Organization: London, UK, 2012.
  31. EN 15026; Hygrothermal Performance of Building Components and Building Elements–Assessment of Moisture Transfer by Numerical Simulation. European Committee for Standardization: Bruxelles, Belgium, 2007.
  32. ANSI/ASHRAE Standard 160-2016; Criteria for Moisture-Control Design Analysis in Buildings. American Society of Heating and Air-Conditioning Engineers: Atlanta, GA, USA, 2016. Available online: https://www.techstreet.com/ashrae/standards/ashrae-160-2016?product_id=1939166 (accessed on 3 April 2023).
  33. BS 5250; Code of Practice for Control of Condensation in Buildings. British Standards Institution: Cambridge, UK, 2011.
  34. Djebbar, R.; van Reenen, D.; Kumaran, M.K. Indoor and outdoor weather analysis tool for hygrothermal modelling. In Proceedings of the 8th Conference on Building Sciences and Technology–Solutions to Moisture Problems in Building Enclosures, Toronto, ON, Canada, 6–8 May 2001; pp. 140–157. [Google Scholar]
  35. Cornick, S.M.; Dalgliesh, W.A.; Said, N.M.; Djebbar, R.; Tariku, F.; Kumaran, M.K. Task 4 Environmental Conditions Final Report; IRC–RR–113; Institute for Research in Construction, National Research Council of Canada: Ottawa, ON, Canada, 2002. [Google Scholar]
  36. Ali Mohamed, F.; Hens, H. Outdoor Climate: Reference Years–Equivalent Temperature for Condensation. In Energy Conservation in Buildings and Community Systems, Annex 24 Heat-Air and Moisture Transfer in Insulated Envelope Parts (HAMTIE); Report T2-B-92/03; International Energy Agency: Paris, France, 1992. [Google Scholar]
  37. Sanders, C. Proposals for work resulting from the Glasgow meeting. In Energy Conservation in Buildings and Community Systems, Annex 24 Heat-Air and Moisture Transfer in Insulated Envelope Parts (HAMTIE); International Energy Agency: Paris, France, 1993. [Google Scholar]
  38. Künzel, H.M.; Schmidt, T. Auswahl und Aufbereitung von meteorologischen Datensätzen für Feuchtetransportberechnungen. In Proceedings of the Tagungsband Bauklimatisches Symposium, Dresden, Germany, 27–29 September 1999; pp. 637–647. [Google Scholar]
  39. Hagentoft, E.; Harderup, E. Climatic influences on the building envelope using the Π-Factor. In Energy Conservation in Buildings and Community Systems, Annex 24 Heat-Air and Moisture Transfer in Insulated Envelope Parts (HAMTIE); Task 2. Environmental Conditions; International Energy Agency: Paris, France, 1996. [Google Scholar]
  40. Kalamees, T.; Vinha, J. Estonian climate analysis for selecting moisture reference years for hygrothermal calculations. J. Therm. Envel. Build. Sci. 2004, 27, 199–220. [Google Scholar] [CrossRef]
  41. Karagiozis, A.N. Weather File Analyzer Software; Oak Ridge National Laboratory: Oak Ridge, TN, USA, 2003.
  42. Cornick, S.; Djebbar, R.; Dalgliesh, W.A. Selecting moisture reference years using a Moisture Index approach. Build. Environ. 2003, 38, 1367–1379. [Google Scholar] [CrossRef]
  43. Straube, J.F. Moisture Control and Enclosure Wall Systems. Ph.D. Thesis, Civil Engineering Department, University of Waterloo, Waterloo, ON, Canada, 1998. [Google Scholar]
  44. Zhou, X.; Derome, D.; Carmeliet, J. Robust moisture reference year methodology for hygrothermal simulations. Build. Environ. 2016, 110, 23–35. [Google Scholar] [CrossRef]
  45. Rode, C. Reference years for moisture calculations. In Energy Conservation in Buildings and Community Systems, Annex 24 Heat-Air and Moisture Transfer in Insulated Envelope Parts (HAMTIE); International Energy Agency: Paris, France, 1993. [Google Scholar]
  46. Juráš, P.; Žilinský, J. Comparison of HAM simulation with different reference years for Bratislava. In Advanced Materials Research; Trans Tech Publications Ltd.: Zürich, Switzerland, 2013; Volume 855, pp. 149–153. [Google Scholar]
  47. Salonvaara, M. Environmental Weather Loads for Hygrothermal Analysis and Design of Buildings; ASHRAE Research Report RP-1325; ASHRAE: Washington, DC, USA, 2011. [Google Scholar]
  48. Mukhopadhyaya, P.; Kumaran, K.; Tariku, F.; Van Reenen, D. Application of hygrothermal modeling tool to assess moisture response of exterior walls. J. Archit. Eng. 2006, 12, 178–186. [Google Scholar] [CrossRef] [Green Version]
  49. Kocí, J.; Madera, J.; Cerný, R. Generation of a critical weather year for hygrothermal simulations using partial weather data sets. Build. Environ. 2014, 76, 54–61. [Google Scholar] [CrossRef]
  50. Schöner, T.; Zirkelbach, D. Development of hygrothermal reference years for Germany. In Proceedings of the Central European Symposium on Building Physics, Dresden, Germany, 14–16 September 2016; pp. 133–140. [Google Scholar]
  51. Fraunhofer Institute for Building Physics, Department Hygrothermics. Energieoptimiertes Bauen Klima-und Oberflächenübergangsbedingungen für die Hygrothermische Bauteilsimulation; IBP-Bericht HTB-021/2016; Fraunhofer Institute for Building Physics: Stuttgart, Germany, 2016. [Google Scholar]
  52. WTA 6-2; Simulation Wärme-und Feuchtetechnischer Prozesse. Wissenschaftlich-Technische Arbeitsgemeinschaft für Bauwerkserhaltung und Denkmalpflege: Juelich, Germany, 2014.
  53. ISO 15927-1; Hygrothermal Performance of Buildings–Calculation and Presentation of Climatic Data–Part 1: Monthly Means of Single Meteorological Elements. International Standards Organization: London, UK, 2003.
  54. ASTM E3054; Standard Guide for Characterization and Use of Hygrothermal Models for Moisture Control Design in Building Envelopes. American Society for Testing and Materials: West Conshohocken, PA, USA, 2016.
Figure 1. Structure of the literature review.
Energies 16 03271 g001
Figure 2. Hygrothermal loads and interchanging periodical directions on building envelope.
Energies 16 03271 g002
Figure 3. Types of indoor air leaks through joints or connections.
Energies 16 03271 g003
Figure 4. EIFS showing the deposit location of rainwater penetration through leaks.
Energies 16 03271 g004
Figure 5. Solar vapor drive and interstitial condensation.
Energies 16 03271 g005
Figure 6. Long-wave radiation conditions on a vertical exterior surface.
Energies 16 03271 g006
Figure 7. Measures to prevent rising damp on a construction site in Germany: (a) measures for a lower ground floor, (b) measures for basement walls.
Energies 16 03271 g007
Figure 8. Local climate model using correction functions for locally different exposure conditions.
Energies 16 03271 g008
Figure 9. Three types of current methods to create Hygrothermal Reference Years.
Energies 16 03271 g009
Table 1. Summary of construction-independent methods.
Construction-Independent MethodEvaluated IndexRequired Climatic ParameterEvaluated Period
Mean temperature method [36,37,38]Mean temperatureAir temperatureAnnual
Drying potential methodΠ-factor method [39]Π-factorAir temperature, relative humidity, solar radiation, sky/ground counter radiation, and wind speed/directionAnnual
Saturation deficit method [40]Saturation deficitAir temperature and relative humidityWinter (December–February)
Moisture load methodANK/ORNL method [41]Moisture load potentialAir temperature, relative humidity, air pressure, rainfall, and wind speed/directionAnnual
Combined index methodMoisture Index method [42]Moisture IndexAir temperature, relative humidity, rainfall, and wind speed/directionAnnual
Climate Index method [44]Climate IndexAir temperature, relative humidity, solar radiation, sky/ground counter radiation, wind speed/direction, rainfallAnnual
Table 2. Input data for hygrothermal simulations used in Geving method.
Construction
  • Lightweight flat roof without a vapor barrier
  • Lightweight façade wall without a vapor barrier
  • Lightweight metallic façade wall without a vapor barrier, but completely vapor tight at the exterior surface, and without hygroscopic materials
  • Compact flat roof with concrete on the inside
  • Wood frame wall having high initial moisture content
  • Concrete wall insulated on the inside
Orientation
-
North orientation for a wall (in Northern hemisphere)
-
Horizontal plane for a roof
Outdoor climateAir temperature, relative humidity, and global radiation
Indoor climate
-
Temperature: 21 °C kept constant
-
Humidity: moisture concentration difference between indoor and outdoor at 3 g/m3
Initial conditionEquilibrium moisture content at 80% rh
DurationFive-year period starting on 1 October and ending on 30 September
Table 3. Rankings related to the worst year groups.
Year19891990199119921994
Construction 121435
Construction 245671
Construction 365241
Construction 431427
Construction 541325
Construction 641325
Ave. ranking3.82.33.73.34
Table 4. Advantages and disadvantages of different selection methods for hygrothermal reference years.
MethodAdvantageDisadvantage
Construction-independent methodMean temperature
-
Simple to calculate.
-
Be able to gain the required climatic parameter at the most weather station
-
Determines HRYs only with the mean air temperature ignoring other climatic parameters, such as humidity, solar radiation, driving rain, and so on.
Drying potential
-
Simple to calculate.
-
Be able to gain the required climatic parameters at the most weather station.
-
Determines HRYs only with the air temperature and humidity ignoring other climatic parameters, such as humidity, solar radiation, driving rain, and so on.
Moisture load
-
Considers all available moisture loads
-
Determines HRYs without drying effects by temperature, humidity, and solar radiation.
Combined index
-
Combines wetting and drying factors into one index
-
Full method is very labor intensive and complicated.
-
Requires a data set with most climatic parameters.
Construction-dependent methodMoisture content
-
Simulates different constructions available, such as walls and roofs.
-
Use of real hourly weather data.
-
Effects of climate on moisture conditions in different constructions are evaluated.
-
Influence of various factors is involved: orientations, construction, exterior and interior climate, which remains unclear.
-
Time-consuming and extensive computational effort is required in conducting simulations and analyzing data.
Damage function
-
Takes into account a specific damage case.
-
Simulates different constructions, such as walls and roofs.
-
Use of real hourly weather data.
-
Damage criteria are not well known, mostly, and they work with dynamic conditions.
-
Too much simplification of damage functions could result in a wrong selection of HRYs.
-
Influence of various factors, including orientations, construction, and exterior and interior climate, on the selection method, remains unclear.
Hybrid method
-
Statistical evaluation of important climate elements.
-
Largely use of real measured data for single months.
-
Use of real long-term data.
-
Stronger weighting of the climate elements temperature and rain.
-
Time-consuming simulation of the long-term performance of different constructions.
Table 5. Determination of the mean and the severe climate specified by standards.
StandardSevere ClimateMean Climate
ISO 13788 [30]
(1)
Return period method
-
Heating period: 10th-percentile coldest years
-
Cooling period: 10th-percentile warmest years
(2)
Corrected mean climate method
-
Heating period:−2 K to the mean climate data
-
Cooling period: +2 K to the mean climate data
Mean value according to ISO 15927-1 [53]
EN 15026 [31]TRY according to ISO 15927-4 [10]
WTA 6-2 [52]
DIN 4108-3 [20]TRY determined by main climatic parameters, including rainfall data according to ISO 15927-4 [51]
ASHRAE Standard 160 (2016) [32]
-
Heating period: 10th-percentile coldest years
-
Cooling period: 10th-percentile warmest years
N/A
ASHRAE Standard 160 (2021) [19]93rd-percentile year in Severity IndexN/A
BS 5250 [33]
(1)
Return period method
-
Heating period: 10th-percentile coldest years
-
Cooling period: 10th-percentile warmest years
(2)
Corrected mean climate method
-
Different return periods depending on the sensitivity of a building (see Table 6)
Mean value according to ISO 15927-1 [53]
ASTM E3054 [54]N/AN/A
Table 6. Different return periods with corrections to temperature and relative humidity.
Return PeriodTemperature [K]Relative Humidity [%rh]
1 in 5−1+2
1 in 10−1+4
1 in 20−2+4
1 in 50−4+6
Disclaimer/Publisher’s Note: The statements, opinions and data contained in all publications are solely those of the individual author(s) and contributor(s) and not of MDPI and/or the editor(s). MDPI and/or the editor(s) disclaim responsibility for any injury to people or property resulting from any ideas, methods, instructions or products referred to in the content.

