1. Introduction
The harnessing of electricity may be the technical advance with the greatest impact on human life and culture in recorded history. The tools of modern life are increasingly powered by electricity, and life without electricity would be unrecognizable. There is, however, a price to pay for this advancement: exposure to electrical hazards is inherent to this modern life, and electrical injuries can happen at home, during leisure, and during work activities [
1,
2]. An electrical hazard is a hazardous condition that can result in an electric shock, electrocution, or electric arc. When associated with the possibility of occurrence and the severity of the event’s results, the existing electrical hazard defines the electric risk. Among the hazards associated with electricity, electric shock is the most common and obvious, while electric arcs are associated with the release of a large amount of energy, which can lead to severe or even fatal consequences, as highlighted by [
3].
In an energized grid, the possibility of an electric arc will always exist [
4], no matter how careful the design of the distribution grids and the sizing of the devices are [
5], so every worker who performs activities in an energized environment may be exposed to the risk of an electric arc, to a greater or lesser extent, depending on the activity performed [
6]. Therefore, assessing the possibility of occurrence and the potential severity of damage associated with arc flash is part of a process called arc flash risk assessment, which is performed across a broad segment of utility, industrial, commercial, and institutional electrical power systems [
7] and which also includes determining the need for additional protective measures [
8]. Thus, arc flash risk assessment aims to determine strategies that allow the worker to carry out intervention activities in the occurrence of an electric arc with due safety.
Arc flash-related hazards are varied (including thermal burns, molten metal particles, shrapnel, explosions, pressure waves, intense light and sound, fires, toxic vapors, and gases, in addition to the effect of plasma and intense magnetic fields) [
9,
10,
11,
12,
13,
14]. Among these risks, the thermal risk is considered the most relevant since most hospitalizations resulting from accidents of electrical origin are due to burns from electric arcs [
15]. The proposition of the first model to estimate the thermal energy released by electric arcs, published in 1982, was based on the research from the 1960s by Stoll and Chianta and the 1970s by Artz, Moncrief, and Pruitt on the endurance of the human body in the face of increased temperature. A more detailed description of these effects can be found in [
16].
Thus, the severity of this type of event, in terms of the arc flash risk assessment process, is derived from the incident energy released by the arc flash source [
17,
18]. Therefore, estimating the level of incident energy that may occur in a task is paramount since, in addition to characterizing the degree of severity of the event, this value is used in the definition of protection strategies against electric arc effects.
In this paper, the authors review methodologies for estimating incident energy throughout history, demonstrating the applicability of each method to help the reader select the appropriate method for analysis in the context of electric power distribution grids. Additionally, five case studies of electric arcs occurring near or at maintenance points of a distribution grid are also presented. In each case study, an estimation method is chosen from the methods presented, the incident energy level is estimated, and the need for and selection of appropriate protective equipment is defined. The aim of presenting these case studies is to assist the reader in understanding the arc flash risk assessment process.
2. Electric Arc Incident Energy Estimation Methods: A Historical Review
The problems caused by electric arcs in distribution grids have been observed since the middle of the 20th century, first highlighted in a scientific publication in 1960 [
19]. Subsequently, other works [
20,
21] gained relevance on the subject, even though all research was directed at the consequences of the electric arc in material terms since this type of event used to be the cause of fires in power distribution installations.
Only in the 1980s did research on the electric arc start to consider its effects on occupational health and safety, mainly driven by the publication of [
16], in which the first method of estimating the thermal energy released by the electric arc was discussed. In the following decade, other models were proposed with relevance to [
22] and, at the turn of the millennium, the IEEE published a guide to orient incident energy estimation processes [
23]. At the end of the 2010s, after several scientific and technical community considerations, the IEEE published a new version of its guide for carrying out incident energy estimates [
24].
In addition to the mentioned mathematical methods, computer programs dedicated to analyzing the risk of electric arcs were also developed. Among these tools, ArcPro stands out, initially developed in 1996 by Kinectrics [
25] and widely used in safety codes and standards, such as OSHA CFR 1910 [
26] and NESC C2 [
27].
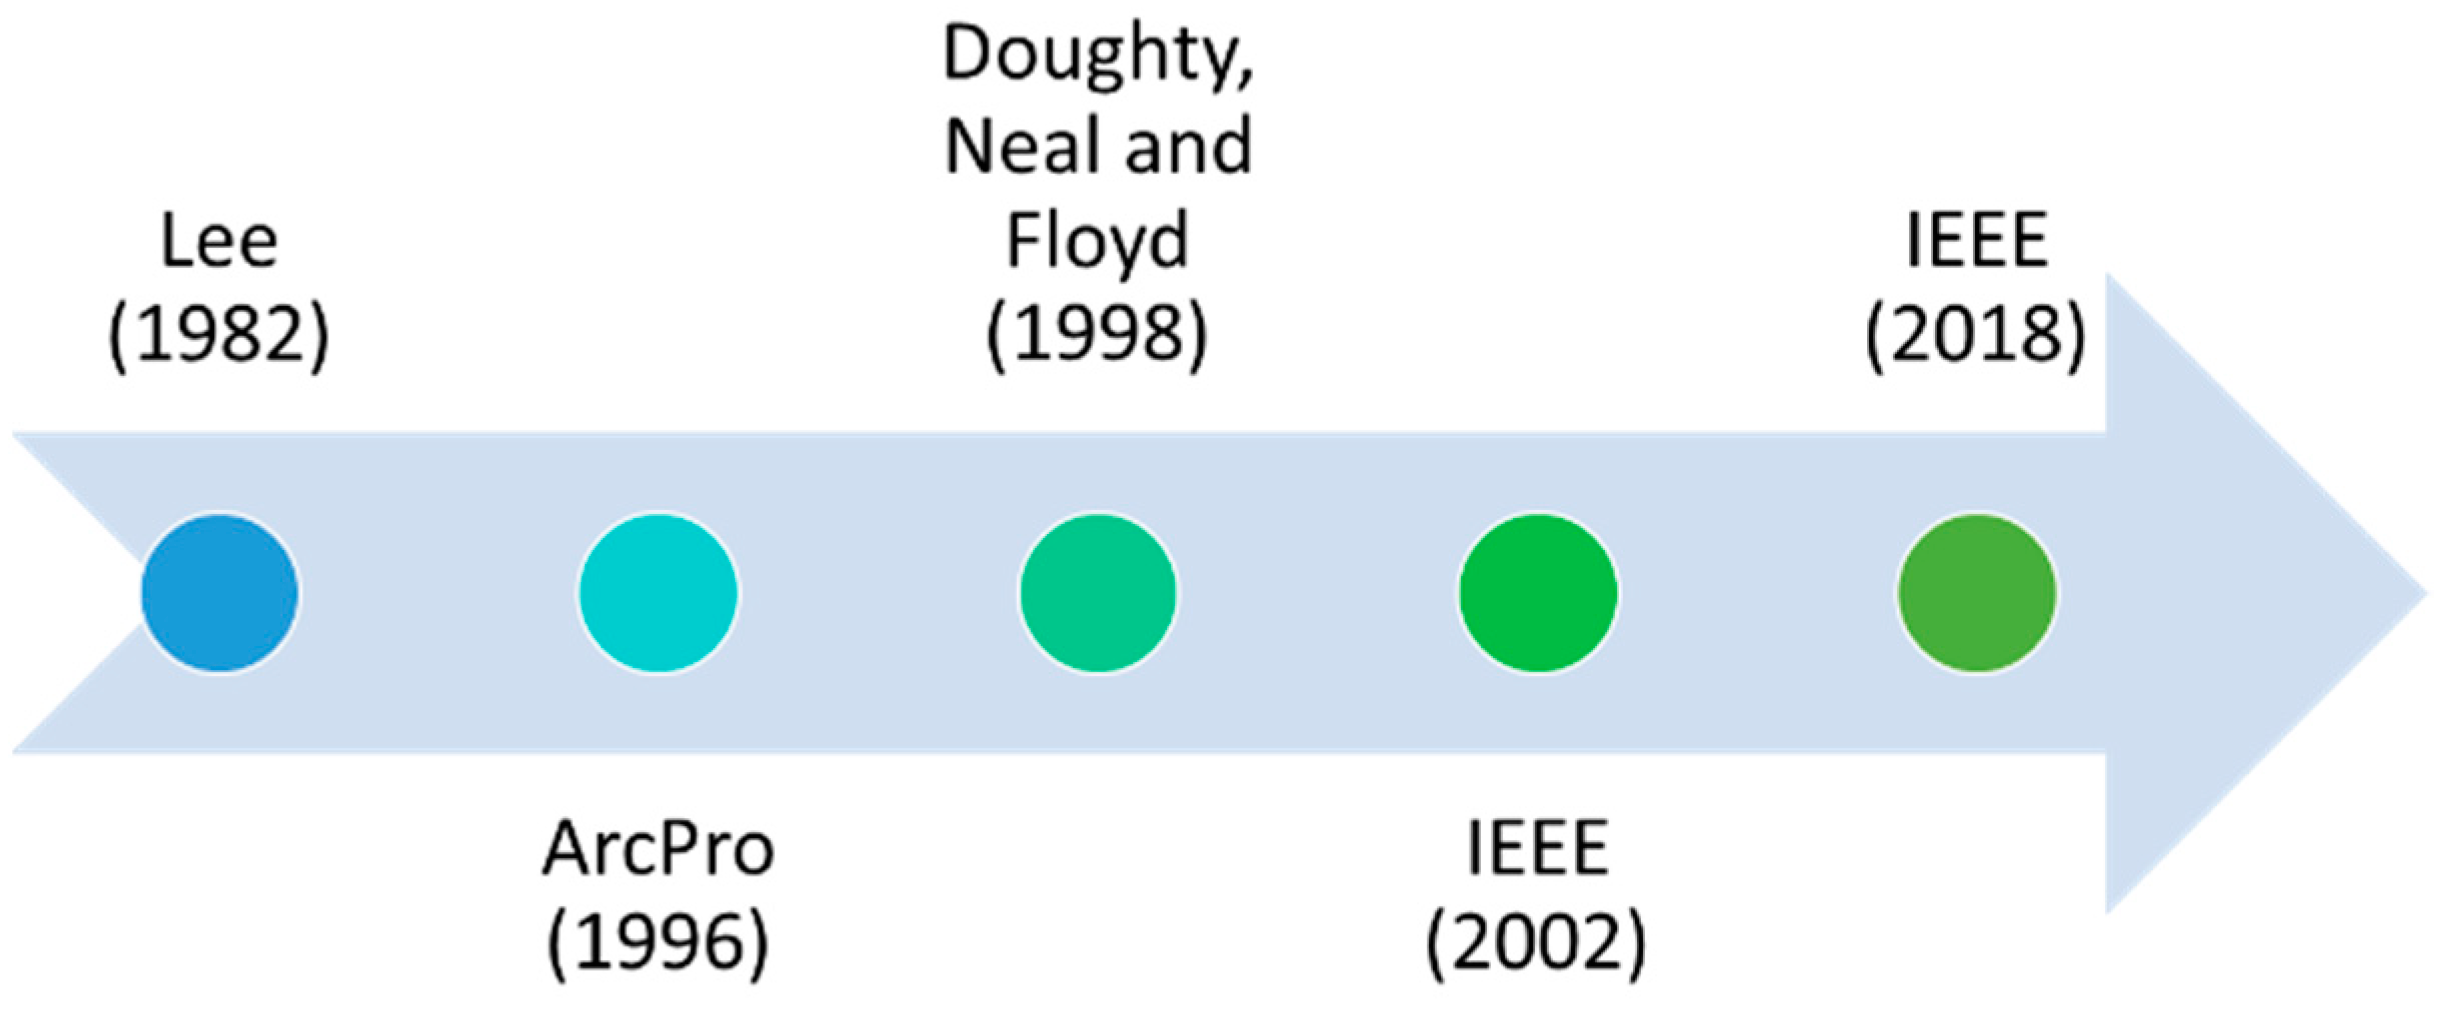
The methods discussed above are repeatedly cited as references in scientific articles, codes, and standards, thus having a greater representation than other methods proposed over the last 40 years. Analyzing them within this period shows that the concern for quantifying the electric arc’s thermal effect is recent, as shown in
Figure 1.
2.1. Lee’s Model
In 1982, Lee proposed the first mathematical model for evaluating electric arcs as a risk to people’s physical integrity. In summary, Lee’s model (also known as the theoretical model) proposes equations to determine the maximum power of the electric arc received by an object (or a person) and the distances between the point of occurrence of the arc and the point of intervention for burns of the curable and fatal types.
All analyses and expressions proposed in [
16] are established for electric arcs resulting from three-phase faults in an open environment, and consider only factors such as electric voltage and current, short circuit capacity, and protection actuation time (exposure time). The application limits of the model (in terms of voltage and current, among others), are not established in the paper. However, its applicability is limited to systems up to 600 V since the results from the application of this model are increasingly conservative as the voltage increases. An analysis proposed by [
28] confirms this limitation by presenting hyperbolic results using this method in analyses between 1 kV and 15 kV.
Furthermore, the expressions proposed to calculate the intervention distances for a curable burn and a fatal burn indicate the direct relationship between the arc extinction time and the intervention distance; that is, time is directly associated with the level of thermal risk caused by the electric arc. This assertion, established through the equations of Lee’s theoretical model, is solidly accepted as a premise in the field of arc flash risk analysis.
Finally, it is also important to highlight that, even though the author reviews the supportability of the human body under temperature increase at length, the proposed model does not consider the heat absorbed by the skin and the heat reflected by the surfaces around the point of occurrence of the electric arc.
2.2. Doughty, Neal, and Floyd’s Model
During the 1990s, researchers Doughty and Neal were involved in arc flash testing programs aimed at developing arc-resistant protective clothing, having published the results of this test program on three occasions: 1996 [
29], 1997 [
30], and 1998 [
22]. Of this trio, the last published work is known as Doughty, Neal, and Floyd’s model.
In [
29], Doughty and Neal, followed by Bingham, proposed three setups of electric arc tests. The type 2 and 3 tests involved incident energy measurements and provided complementary observations to those published by Lee some 14 years earlier. The type 2 test regimen included single-phase and phase-to-phase open-air arc tests at 600 V and 2.4 kV. The measured arc power in 600 V scenarios was less than 80% of the predicted arc power using Lee’s model; in 2.4 kV tests, it was observed that the measured arc power was less than 50% of the predicted arc power, thus proving the conservatism of Lee’s theoretical method in systems with voltages greater than 600 V. Furthermore, based on the measurements made during the tests of the type 2 test regime, an expression was proposed for systems up to 600 V, in an open environment, which relates the incident energy to the arc energy (thermal energy) and the working distance. Here, the inverse relationship between the incident energy and the working distance is practically quadratic, confirming the premise proposed in [
16]. The type 3 test regime, in turn, did not result in the proposition of any mathematical expression but provided results for comparing incident energy levels resulting from phase-to-phase and three-phase confined electric arcs, and included the grounding effect of the boxes. While the incident energy of a three-phase electric arc in a grounded box is about 2.5 times greater than that resulting from a two-phase arc in the same environment, this factor increases between 3.2 and 4.3 times for ungrounded boxes.
In 1997, Dear joined Doughty, Bigham, and Neal in updating the test program proposed in [
29], since results for three-phase arcs in an open environment were not obtained for this test program. Thus, the performance of tests of three-phase arcs in open and confined environments, all at 600 V, was discussed in [
30] to simulate the worst scenario of three-phase faults in industrial power systems. In this work, mathematical expressions were not proposed relating the incident energy with other factors involved in the scenario of the occurrence of an electric arc; however, the significant effect of the enclosure of the electric arc on the incident energy levels observed was established. The incident energy resulting from an in-a-box electric arc can be up to three times greater than that from an open-air electric arc, depending on the box dimensions.
Considering the observations made in [
29,
30], Doughty, Neal, and Floyd published [
22], in which the authors established a set of expressions for determining the incident energy resulting from three-phase electric arcs in open and closed environments. Such expressions were algebraically rearranged to determine the approximation distances to the electric arc for both confined and unconfined arcs, being helpful in defining the arc flash boundary or the protection limit based on the AR of the clothing used in that location. This set of expressions is valid for systems up to 600 V and with three-phase fault currents between 16 kA and 50 kA, and established the incident energy as a function of the working distance, the bolted fault current, and the arc duration.
The model proposed by Doughty, Neal, and Floyd differs from Lee’s theoretical model because it establishes specific equations for calculating the incident energy released by the electric arc and defines their application limits. In addition, it also considers the effect of confinement of the electric arc, being the first applicable model for analyzing the risk of electric arcs in closed environments, such as switchgear.
From [
22], the minimum parameters to be known in any incident energy estimation process were established, namely: the open circuit voltage and the bolted fault current at the point of occurrence of the electric arc, the duration of the arc (time of protection actuation added to the coordination and selectivity times), the configuration and the spacing between the electrodes, the compartment surrounding the arc—if any—and the distance between the electric arc and the worker. All these variables were considered in incident energy estimation models proposed after [
22], such as the methods established by [
23,
24].
2.3. IEEE Std 1584 Method
In 2002, the IEEE published a document developed by the PCIC/IAS to guide the implementation of incident energy estimation calculations. This guide became known as IEEE Std 1584, and proposed empirically developed mathematical models for systems up to 15 kV. Considering aspects of [
16,
22], the method proposed in [
23] has become the most widespread method for incident energy estimation.
Amendments to [
23] were published on two occasions (2004 and 2011) and, in 2018, given the volume of research related to the models proposed therein, the second version of the guide, currently in force, was published. The mathematical models proposed in [
24] are entirely revised in relation to those of [
23], even though the same assumptions and variables are considered, with few modifications.
The models included in [
24] propose specific equations for calculating the electric arc current, the incident energy, and the arc flash boundary for extensive but well-defined application ranges. As in [
16,
22], the IEEE Std 1584 method is applied to electric arcs resulting from three-phase faults but differs from other models when considering the environment (open or closed) and the arrangement (horizontal or vertical) of the electrodes.
2.3.1. IEEE Std 1584-2002
The first version of the IEEE Std 1584 guide proposed two distinct models to carry out incident energy estimates: an empirically derived model for systems with voltages from 208 V to 15 kV and a theoretical model derived from Lee’s model, applicable to any level of voltage. Since Lee’s model has been previously discussed in this article, only aspects of the empirical model will be discussed.
The model proposed by IEEE Std 1584-2002 was based on statistical analysis and curve fitting programs, and applied to three-phase faults in systems with:
Voltages in the range of 208 V up to 15 kV, three-phase;
Frequencies of 50 Hz or 60 Hz;
Bolted fault currents varying from 700 A up to 106 kA;
Grounding of all types and ungrounded;
Box and open-air configurations;
Gaps between electrodes of 13 mm to 152 mm.
This model proposed estimating the incident energy level at an intervention point and determining the arc flash boundary to that point based on the system voltage, the bolted three-phase short-circuit current, the spacing between the electrodes, the type of environment where the arc occurs (open or closed), the type of existing grounding, and the working distance. With these data, it would be possible to carry out such estimates in four steps:
Determine the electric arc current;
Determine the duration of the electric arc;
Determine the incident energy;
Determine the distance between the arc point and the worker, whether defined by the exposure threshold for unprotected skin or the AR of protective clothing.
Among the four steps mentioned, only the arc current calculation had different expressions according to the voltage level, with one equation dedicated to points with voltages below 1 kV and another for systems of 1 kV or more (limited to 15 kV). The remaining steps (3 and 4) used the same expressions throughout the applicable voltage range.
2.3.2. IEEE Std 1584-2018
The current version of the IEEE Std 1584, called IEEE Std 1584-2018, presents a mathematical method based on empirically derived mathematical models like the previous version of the guide, but with much more expressive mathematical refinement.
The method proposed by IEEE Std 1584-2018 is composed of two mathematical models intended to estimate the incident energy level resulting from a three-phase electric arc, and what differentiates them is the voltage level of the point under analysis; there is a model dedicated to systems with voltages from 208 V to 600 V (both included) and another model for systems with voltages above 600 V and up to 15 kV (included). Each model comprises a set of equations for determining the electric arc current, the incident energy, and the arc flash boundary, thus following the same estimation sequence proposed in the 2002 version.
Some application parameters, such as voltage and frequency, remain as in the previous version of the guide, while others have been adjusted for the new models, namely:
Bolted fault current varying from 500 A to 106 kA (208 V to 600 V model) and from 200 A to 65 kA (600 V to 15 kV model).
Gaps between the electrodes can vary from 6.35 mm to 76.2 mm (208 V to 600 V model) and from 19.05 mm to 254 mm (600 V to 15 kV model).
In addition, electric arcs began to be differentiated not only based on their surroundings (confined or open-air) but also according to the orientation of the electrodes (vertical, vertical ending in an insulating barrier, and horizontal). The working distance is limited to at least 305 mm.
2.4. Kinectrics’s ArcProTM Method
Unlike the model proposed in [
16], based on circuit theory, and the models proposed in [
22,
23,
24], based on electric arc tests, ArcPro includes the modeling of electric arcs based on the physics of this phenomenon. This software models high-power arcs considering variables such as gas properties, electrode material, thermal radiation, and energy dissipation by convection [
25].
ArcPro is a paid software and the only software listed by OSHA for incident energy calculations. It has become the industry’s most widely respected application for computing arc hazards and selecting protective clothing for single-phase arc situations, particularly for medium- and high-voltage transmission and distribution applications that other methods do not address [
31].
In [
31], it is stated that, in addition to alternating single-phase arc scenarios, the current version of this software (ArcPro
TM 4) can, among other features, perform three-phase arc flash calculations with different electrode orientations using the IEEE 1584-2018 equation, as well as direct-current in-box arc flash calculations. Moreover, the system frequency can be specified (50 Hz, 60 Hz, or 100 Hz) for worldwide and specialized applications, such as generating, saving, and printing warning labels.
2.5. Comparing Incident Energy Estimation Methods
To select the most appropriate incident energy estimation method for each application, one must know the applications and the limitations of existing methods. Therefore,
Table 1 summarizes the applications and limitations of each of the methods previously mentioned in this review. It should also be noted that all models presented are recurrently suggested in safety codes and standards, as in [
8,
26,
27].
2.6. Other Incident Energy Estimation Methods
The previously presented and compared methods are widely known and used for several reasons, from the vanguard in the subject to the recommendation by safety codes and standards. For example, NFPA 70E [
8] lists the methods proposed in [
16,
22,
24] for performing incident energy estimation in AC systems, and OSHA 1910 cites these methods and ArcPro.
On the other hand, the text of [
26] clarifies that the methods listed therein (which are the same ones presented in
Table 1) are not the only usable methods for employers to comply with the standard and that they can select other methods to perform their incident energy estimates. Considering arc flash risk assessment in electric power distribution grids, five different estimation methods are compared in [
28], aiming to analyze interventions in live lines with voltages from 15 kV.
Among these methods are Lee’s theoretical model and ArcPro, which have been discussed earlier in this review, in addition to the Duke Heat Flux Calculator (Duke HFC), EPRI [
32], and Terzija and Koglin’s [
33] methods. While ArcPro is a paid software, Duke HFC is a DOS-based and free software, capable of estimating the incident energy based on parameters such as the nominal voltage and the fault current at the point under analysis, the spacing between the electrodes, the working distance, and protection actuation time. The Terzija and Koglin’s method, published in 2002, and the EPRI method, from 2011, are based on mathematical models developed for evaluating open-air electric arcs, applied to faults in overhead distribution and transmission systems.
Given the conservatism observed in the results applying Lee’s method, only the other methods were compared. Their results were very similar for voltages between 1 kV and 46 kV. From 46 kV onwards, the results of all four methods vary more or less depending on the changes required for higher voltages in electrode spacings and working distance. Finally, the data analysis allows greater proximity between the data obtained using ArcPro and the EPRI method to be observed, which can also be effectively used to determine the heat flux and incident energy for electric arcs generated by phase-to-ground faults in overhead distribution and transmission systems [
28].
3. Electric Arc Incident Energy Estimation in Electric Power Distribution Grids: Case Studies Using ArcPro
Arc flash risk assessment based on IEEE Std 1584 and NFPA 70E is the world’s most common method, as ratified by [
34], once IEEE Std 1584 has a wide application range and suits industrial scenarios in terms of incident energy. On the other hand, ArcPro is a highly effective tool that offers proven value in helping utilities and other industries select protective clothing and meet workplace regulations for safety apparel [
34]. Therefore, given the applicability of ArcPro to estimate incident energy levels produced by electric arcs resulting from single-phase faults in distribution grids, five case studies are proposed to demonstrate the incident energy estimation process and the derived analysis of the results presented by the software.
The methodology used in the case studies is shown in
Figure 2, a flowchart that includes stages of the incident energy estimation process using ArcPro and the selection of appropriate clothing and PPE based on the results from this software. The IEEE 13-Node system will be used in all case studies, a small circuit commonly used to test electric power distribution software features. In addition, it is worth highlighting the use of ATPDraw to simulate short circuits in all case studies. ATPDraw was chosen because this software is used to analyze power systems under both steady and transient conditions and to model different fault scenarios [
35]. Furthermore, it is free software.
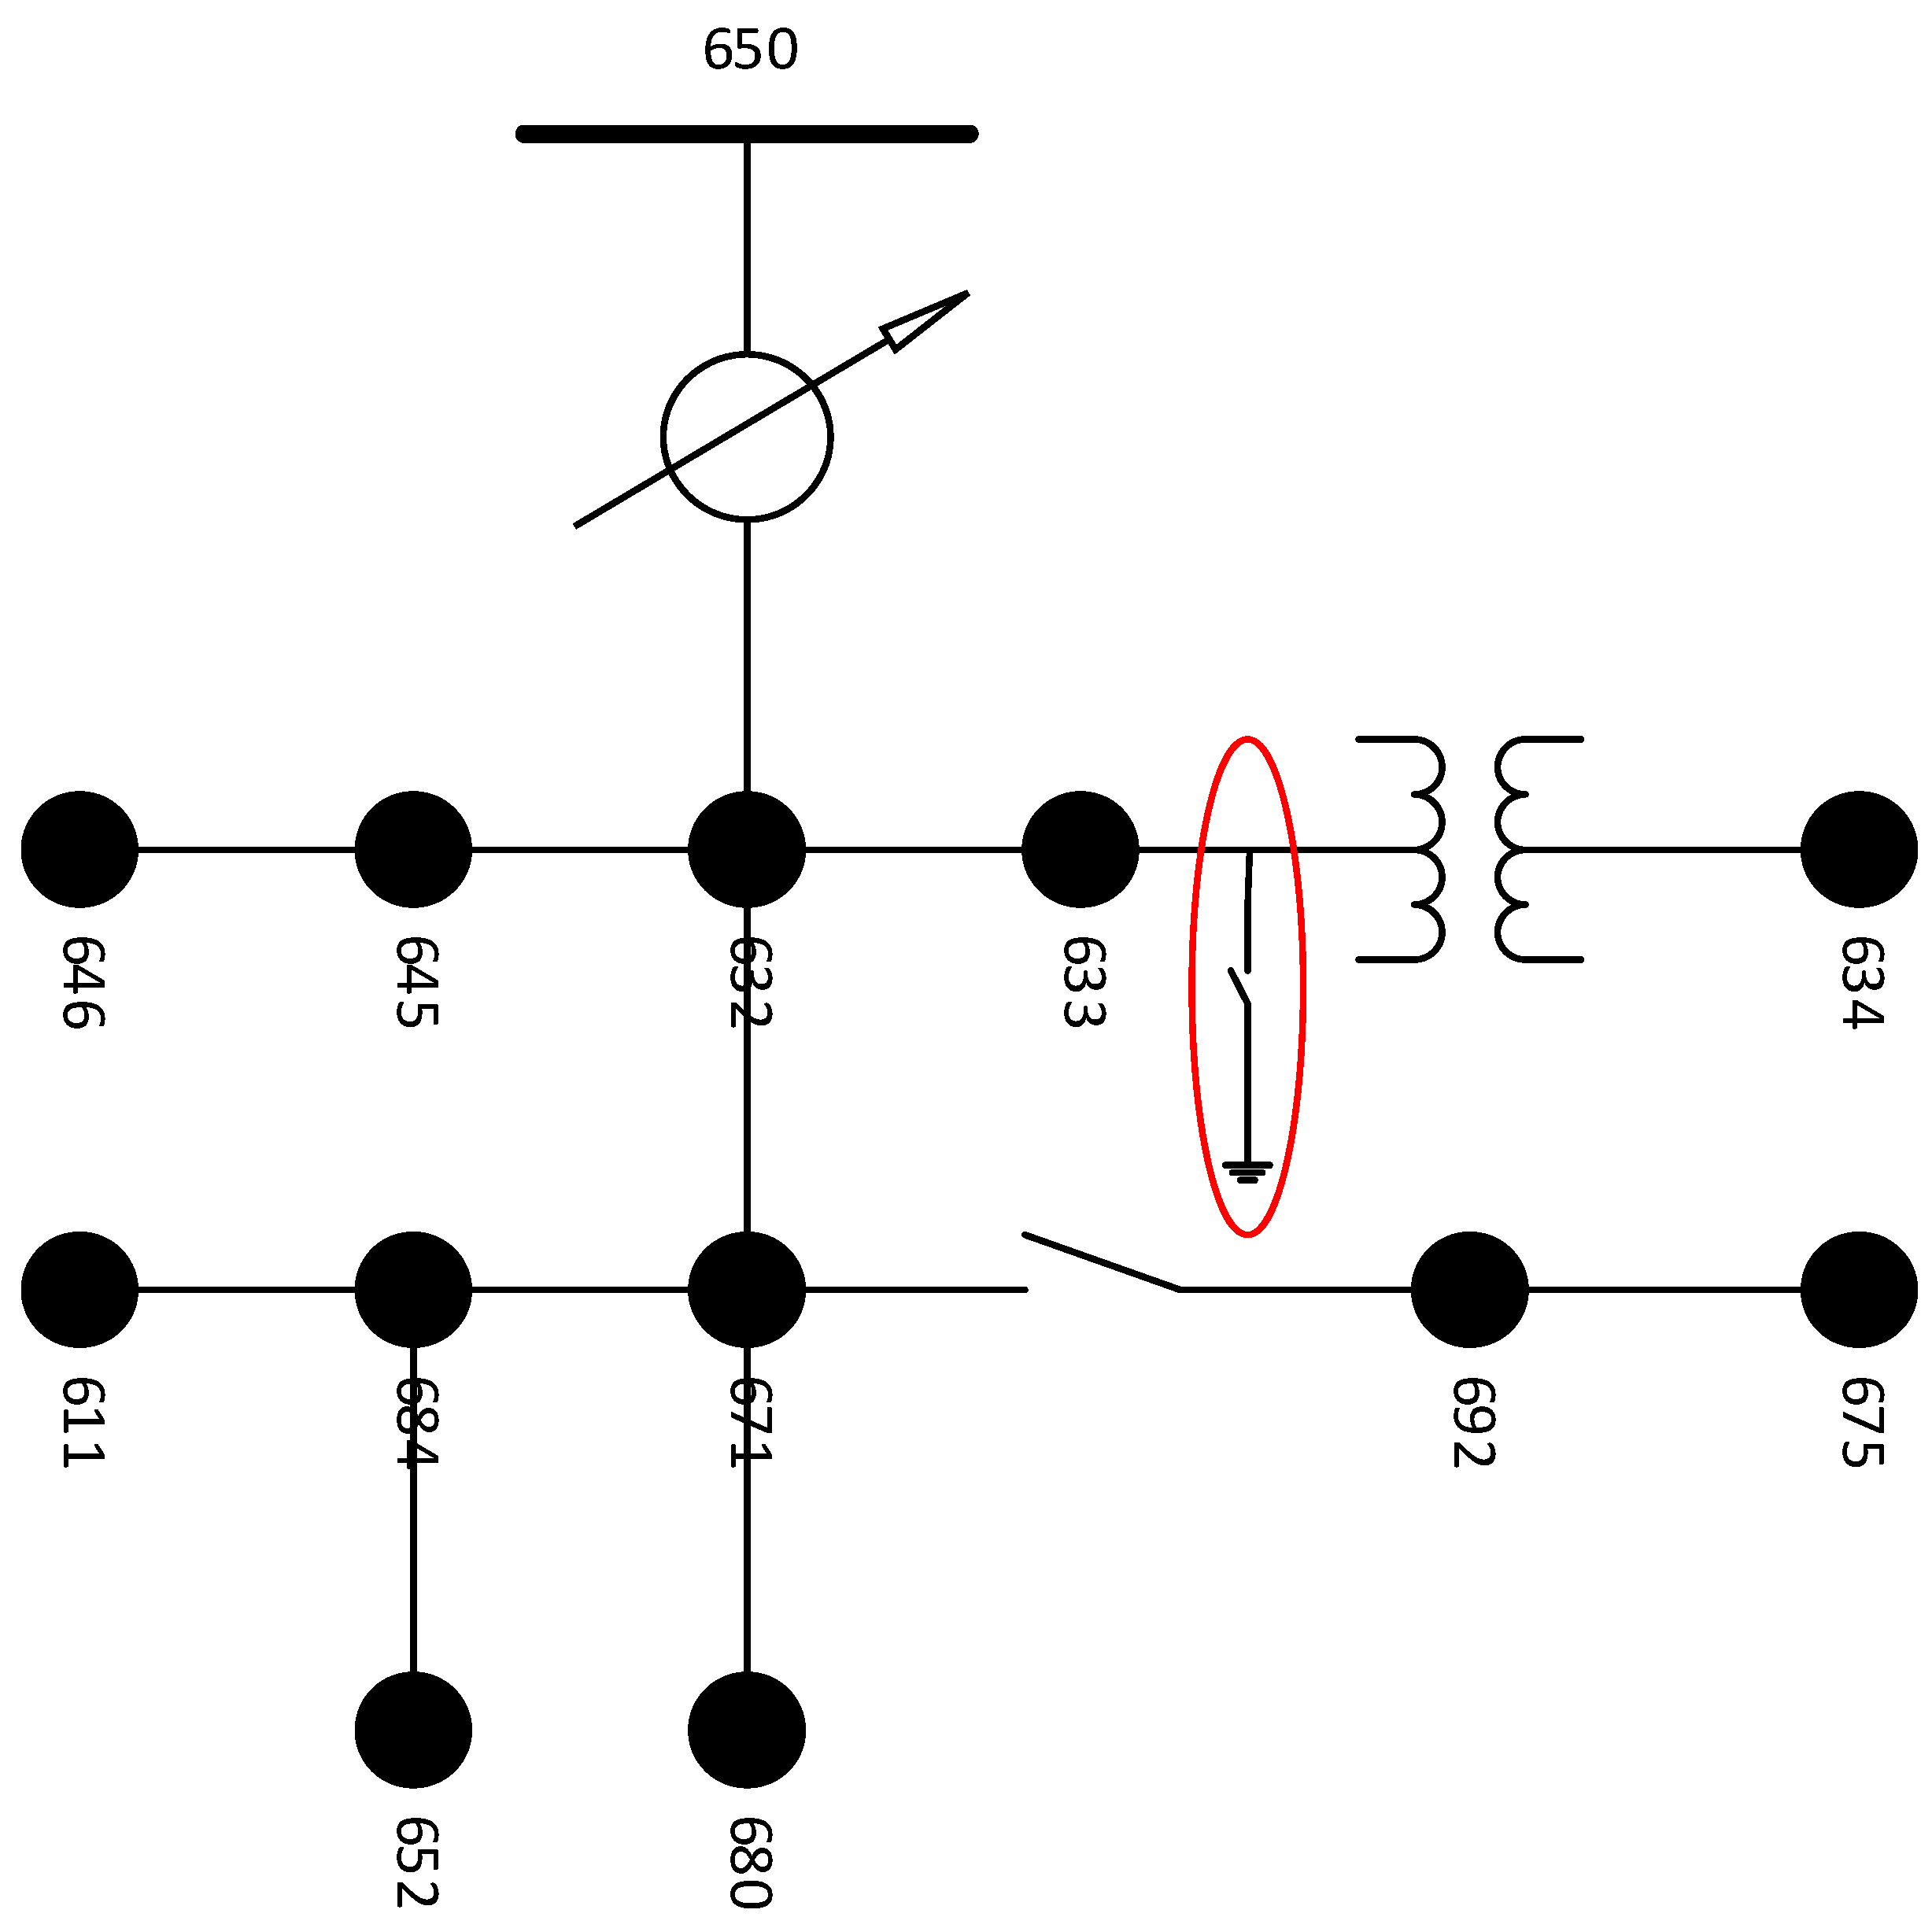
3.1. Case Study 1
In this case study, a single-phase short circuit is simulated on the medium-voltage side of the only existing transformer in the IEEE 13-Node system, indicated in red in
Figure 3. This simulation uses the ATPDraw software, and it results in a phase-to-ground short-circuit current.
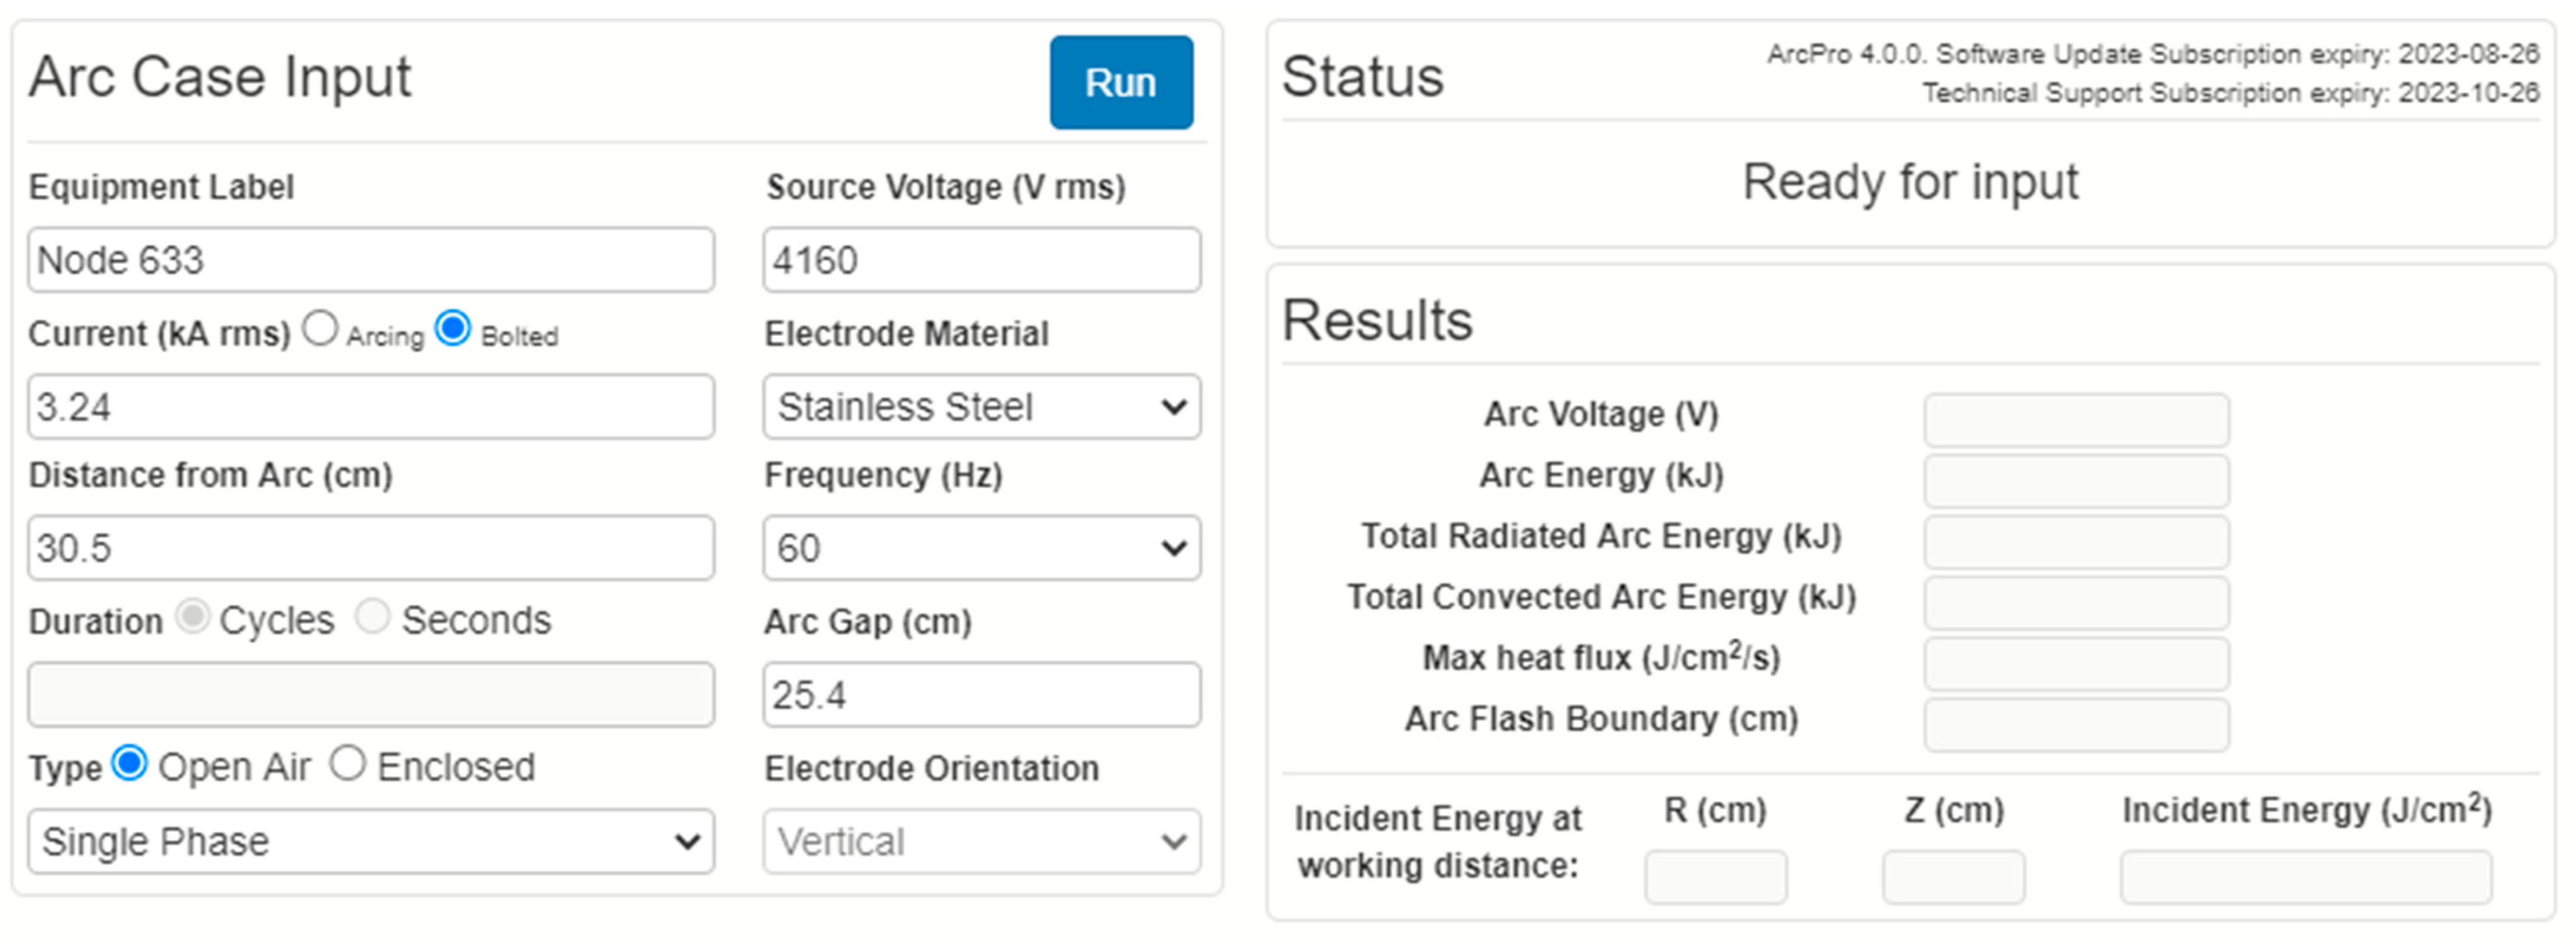
The phase-to-ground short-circuit current and the nominal voltage at the point of occurrence of the electric arc are electric variables required as simulation inputs in ArcPro, which also include spatial factors such as the type of environment (confined or unconfined), the distance from the arc (often called the working distance), and the spacing between the electrodes. The input data used are shown in
Figure 4 and listed in
Table 2.
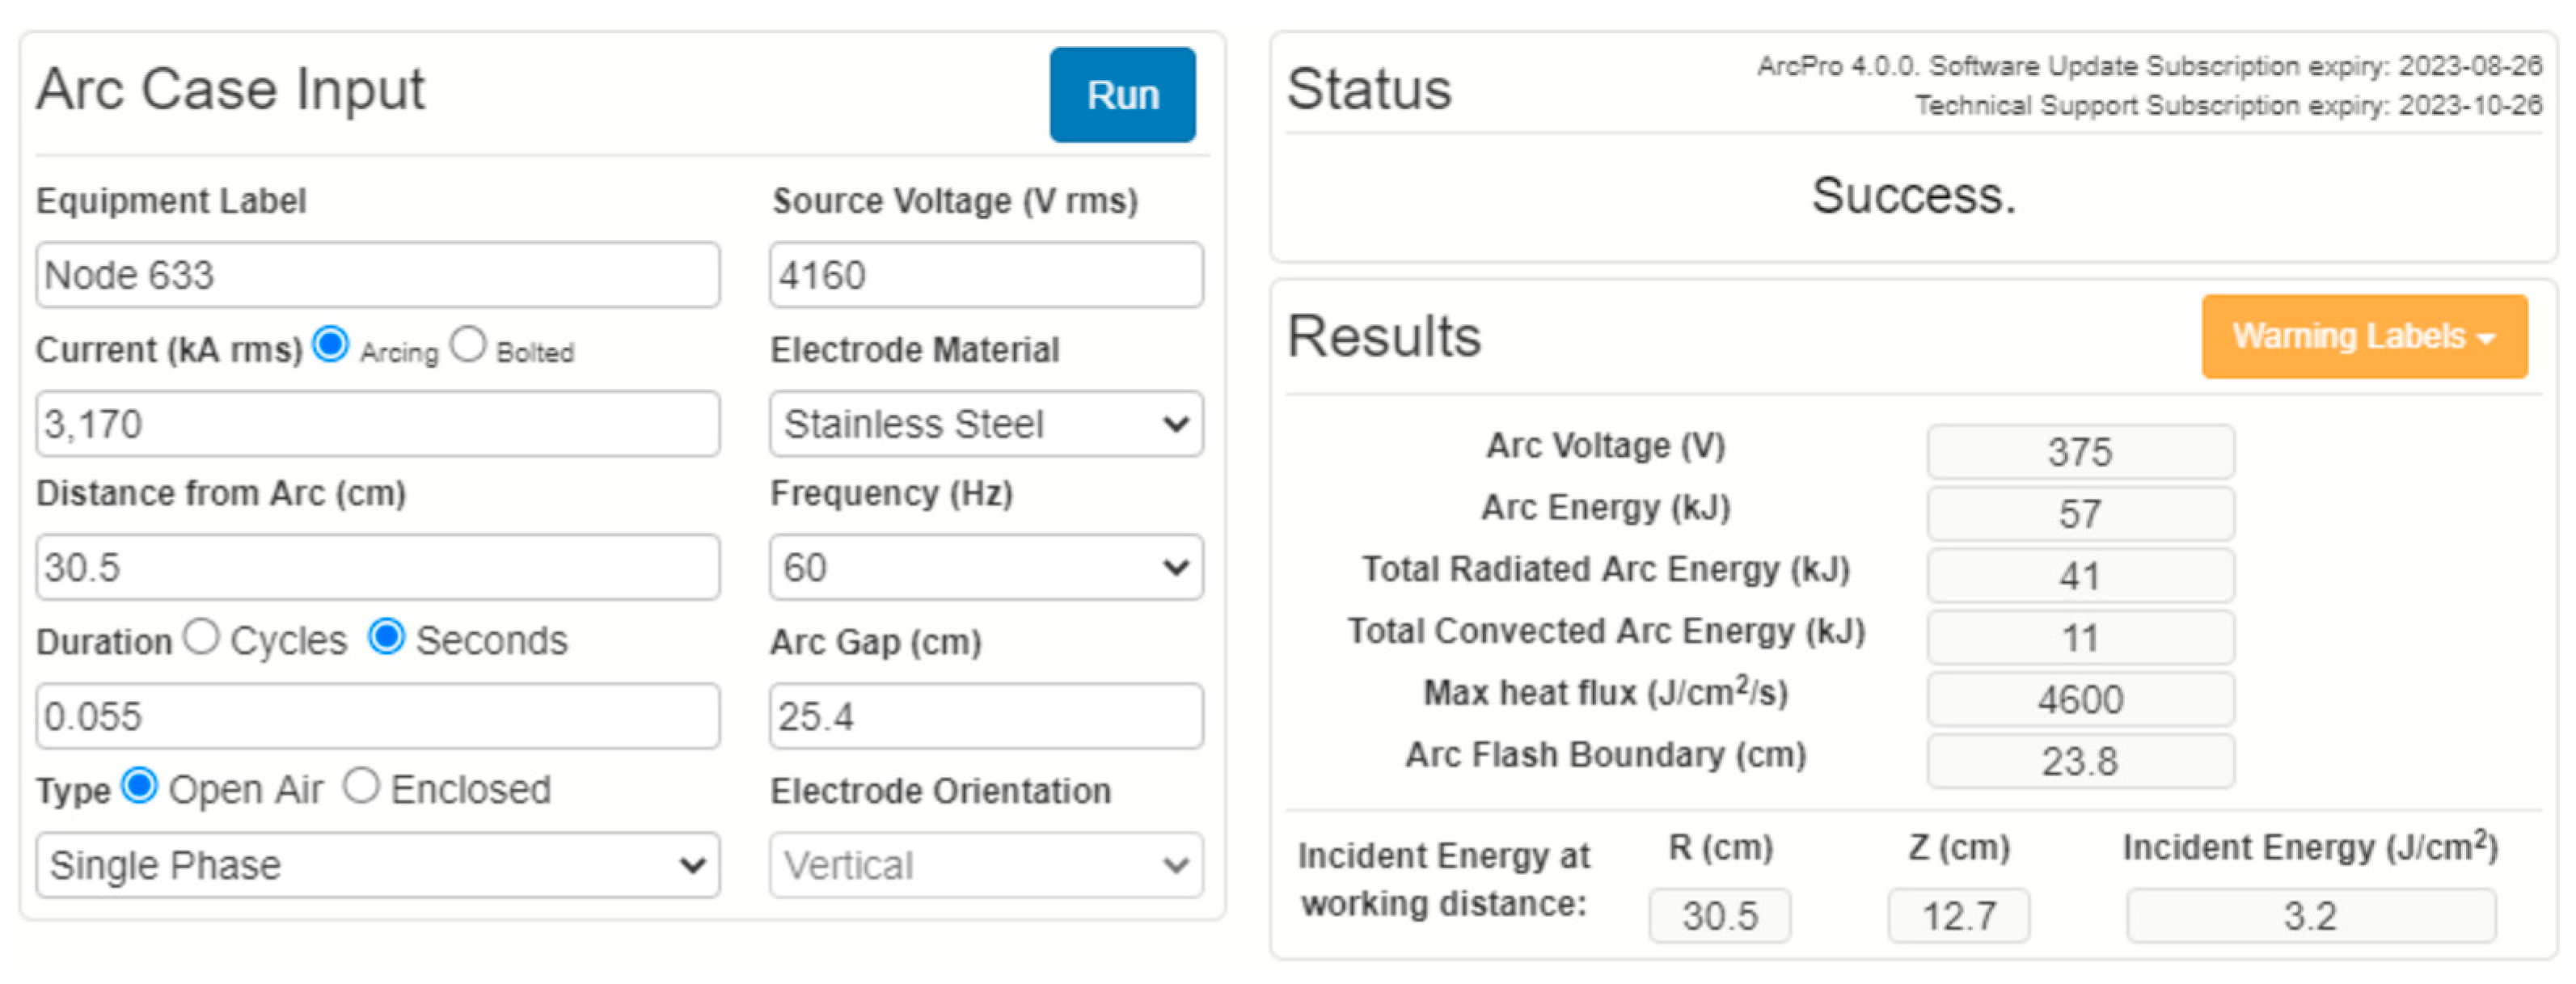
The simulation in ArcPro has two stages: first, input data are entered so that the software returns an electric arc current value. This value makes it possible to determine the arc duration based on a protection device. This time will then be inserted as input, and the software will return the simulation results, which are the incident energy and the arc flash boundary. The first stage of this case study simulation consists of obtaining the electric arc current, which is presented on the screen next to the first shown in
Figure 3 and is used to determine the duration of the electric arc. In the present simulation, the resulting arc current is 3.17 kA, considering an X/R ratio equal to 5. Next, the arc current is used, together with the nominal voltage of the fault point, to select the protection device to be used and, consequently, determine the duration of the electric arc.
Considering the power of the transformer (500 kVA), the nominal voltage at the point of occurrence of the electric arc (4.16 kV), and the previously determined electric arc current, the selected fuse model has a capacity of 200 A. This device extinguishes the arc in 55 milliseconds, and the duration is the last input of the simulation, whose results are shown in
Figure 5.
The most relevant results for determining individual protection measures are presented in
Table 3. The estimated incident energy level (3.2 J/cm
2 or 0.76 cal/cm
2) is lower than the incident energy level capable of causing a curable burn (second-degree burn), so arc-rated (AR) clothing and PPE are not required in this scenario. The minimum distance from the electric arc where exposure would be sufficient to cause a second-degree burn is 23.8 cm, at which distance the incident energy level would be 5 J/cm
2 or 1.2 cal/cm
2, and this value increases as the arc–worker distance decreases.
3.2. Case Study 2
In this case study, the fault that originates in the electric arc occurs on the low-voltage side of the transformer, circled in red in
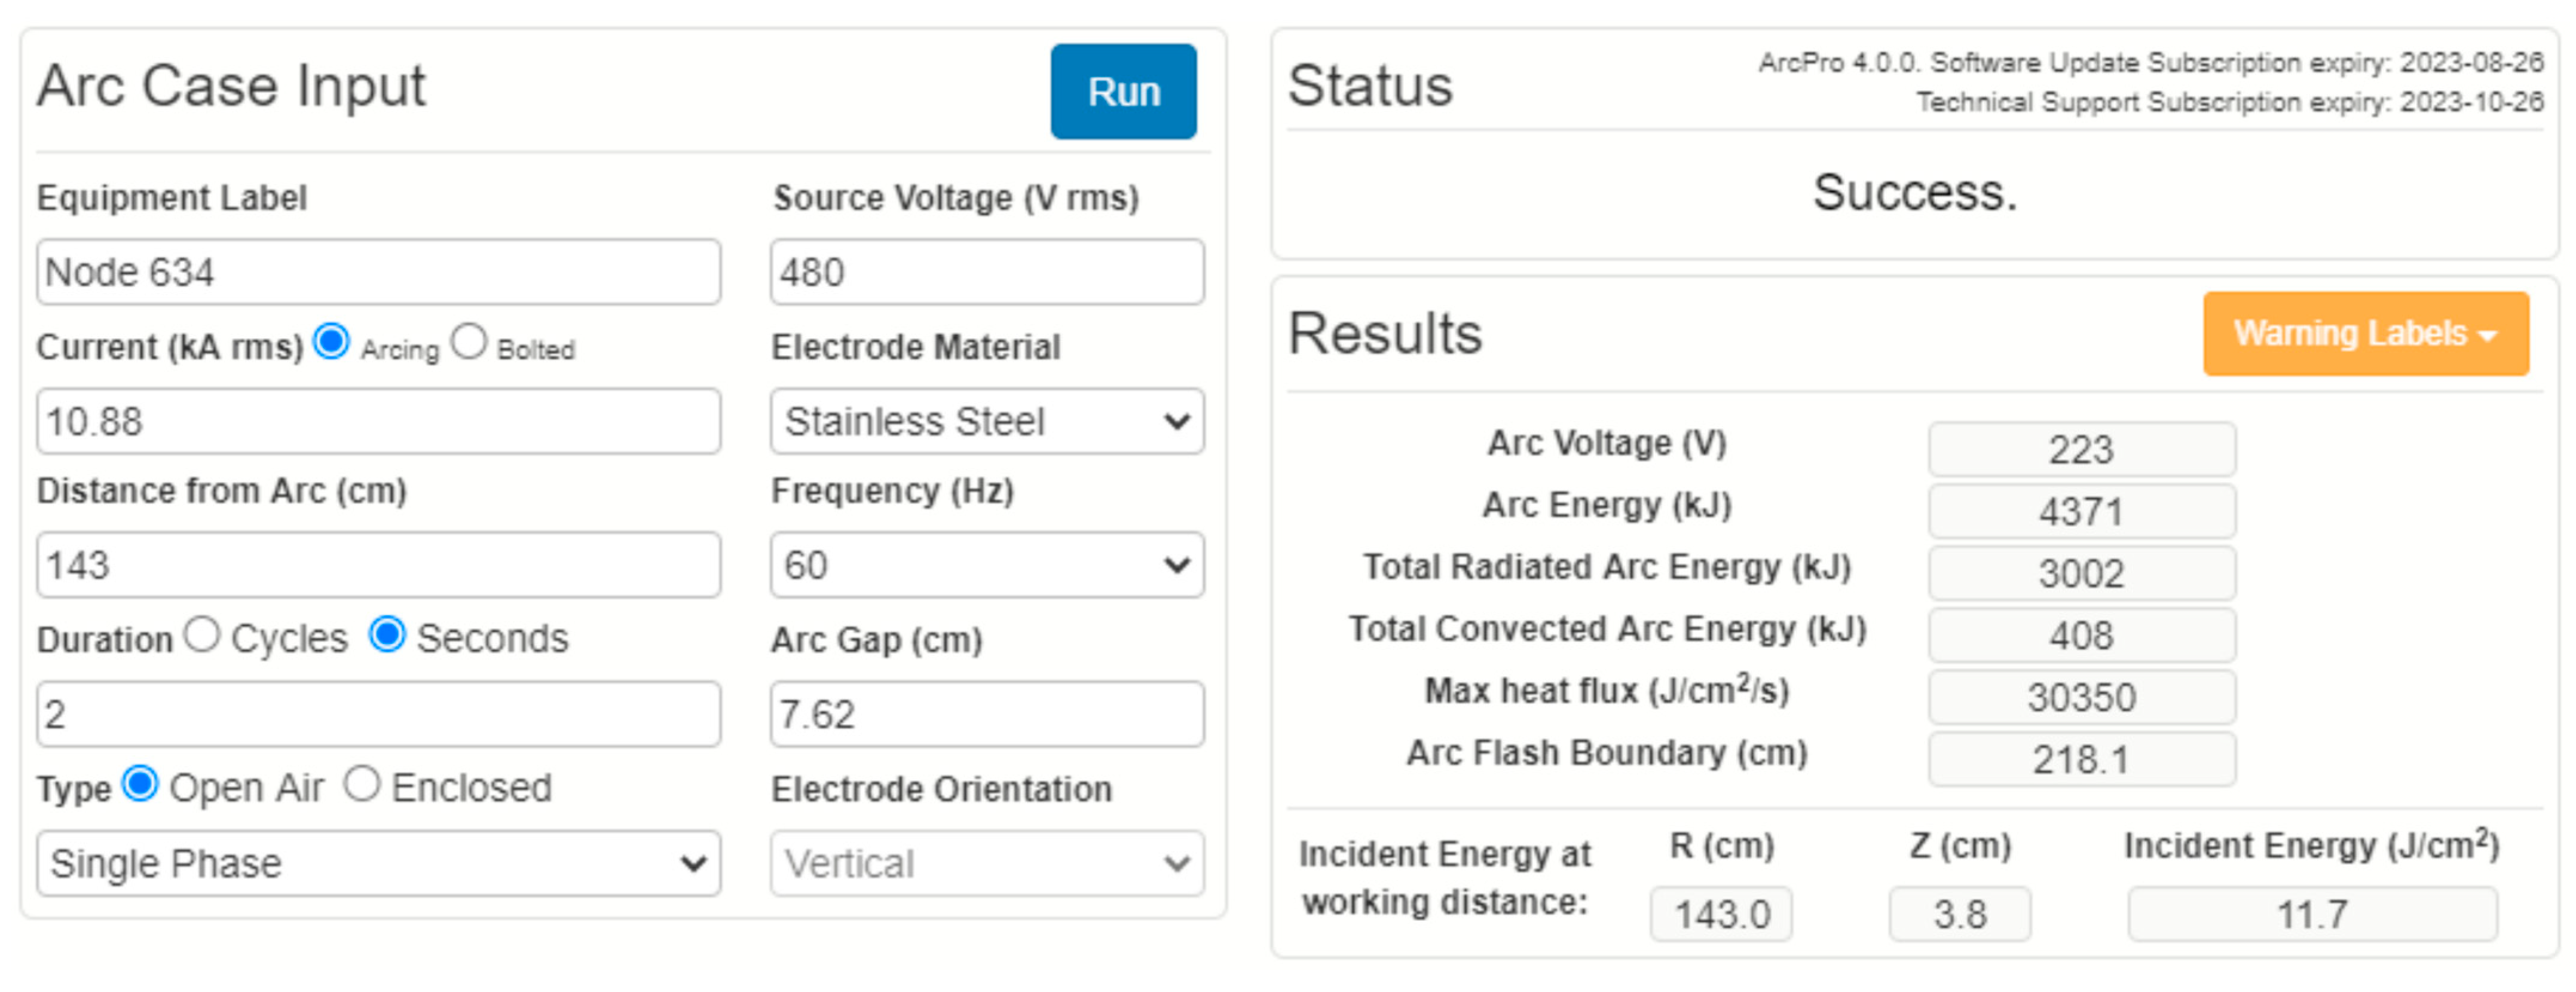
Figure 6. The same methodology used in case study 1 was adopted, so the phase-to-ground short circuit at the point under analysis is simulated using the ATPDraw software. The current resulting from the simulation, along with other data, is used in ArcPro as input for the case study. All input data from case study 2 are presented in the ArcPro interface in
Figure 7 and listed in
Table 4.
The first result of this simulation is the arc current, whose resulting value is 10.88 kA, considering an X/R ratio equal to 5. The duration of the electric arc is determined considering the same protection device used in case study 1. However, now the arc current must be reflected in the transformer’s primary since the protection device is installed in the medium voltage. For the 200 A fuse, installed on the 4.16 kV side and sensitized by an electric arc of 1.26 kA, the duration of the electric arc will be 2 s. The simulation results are presented in
Figure 8, while
Table 5 gathers the main results (arc current, arc duration, incident energy, and arc flash boundary).
The results shown in
Table 5 are relevant for determining individual protection measures. The estimated incident energy (11.7 J/cm
2 or 2.79 cal/cm
2) is higher than the minimum exposure level capable of causing second-degree burns (5 J/cm
2 or 1.2 cal/cm
2), so in this scenario, it is necessary to use AR clothing and PPE for thermal protection of category 1 or greater (according to the PPE categorization method) or with an AR greater than 11.7 J/cm
2 (according to the incident energy analysis method). In addition, the safe distance between the electric arc point and the worker is 218.1 cm, a value greater than the working distance considered, reinforcing the need to use AR protective clothing and PPE.
3.3. Case Study 3
In this case study, it is considered that the stretch between nodes 632 and 634 of the IEEE 13-Node system is built underground. In this grid type, three-phase faults are more common once many circuits are installed in panels, so a three-phase short circuit is simulated as a fault in node 633, as illustrated in
Figure 3.
It is important to highlight that, besides modifying the short circuit and the type of environment in which the arc occurs (from open-air to confined), the change in the type of material of the electrodes was also considered since it is more common to use copper bars and conductors for circuits in panels.
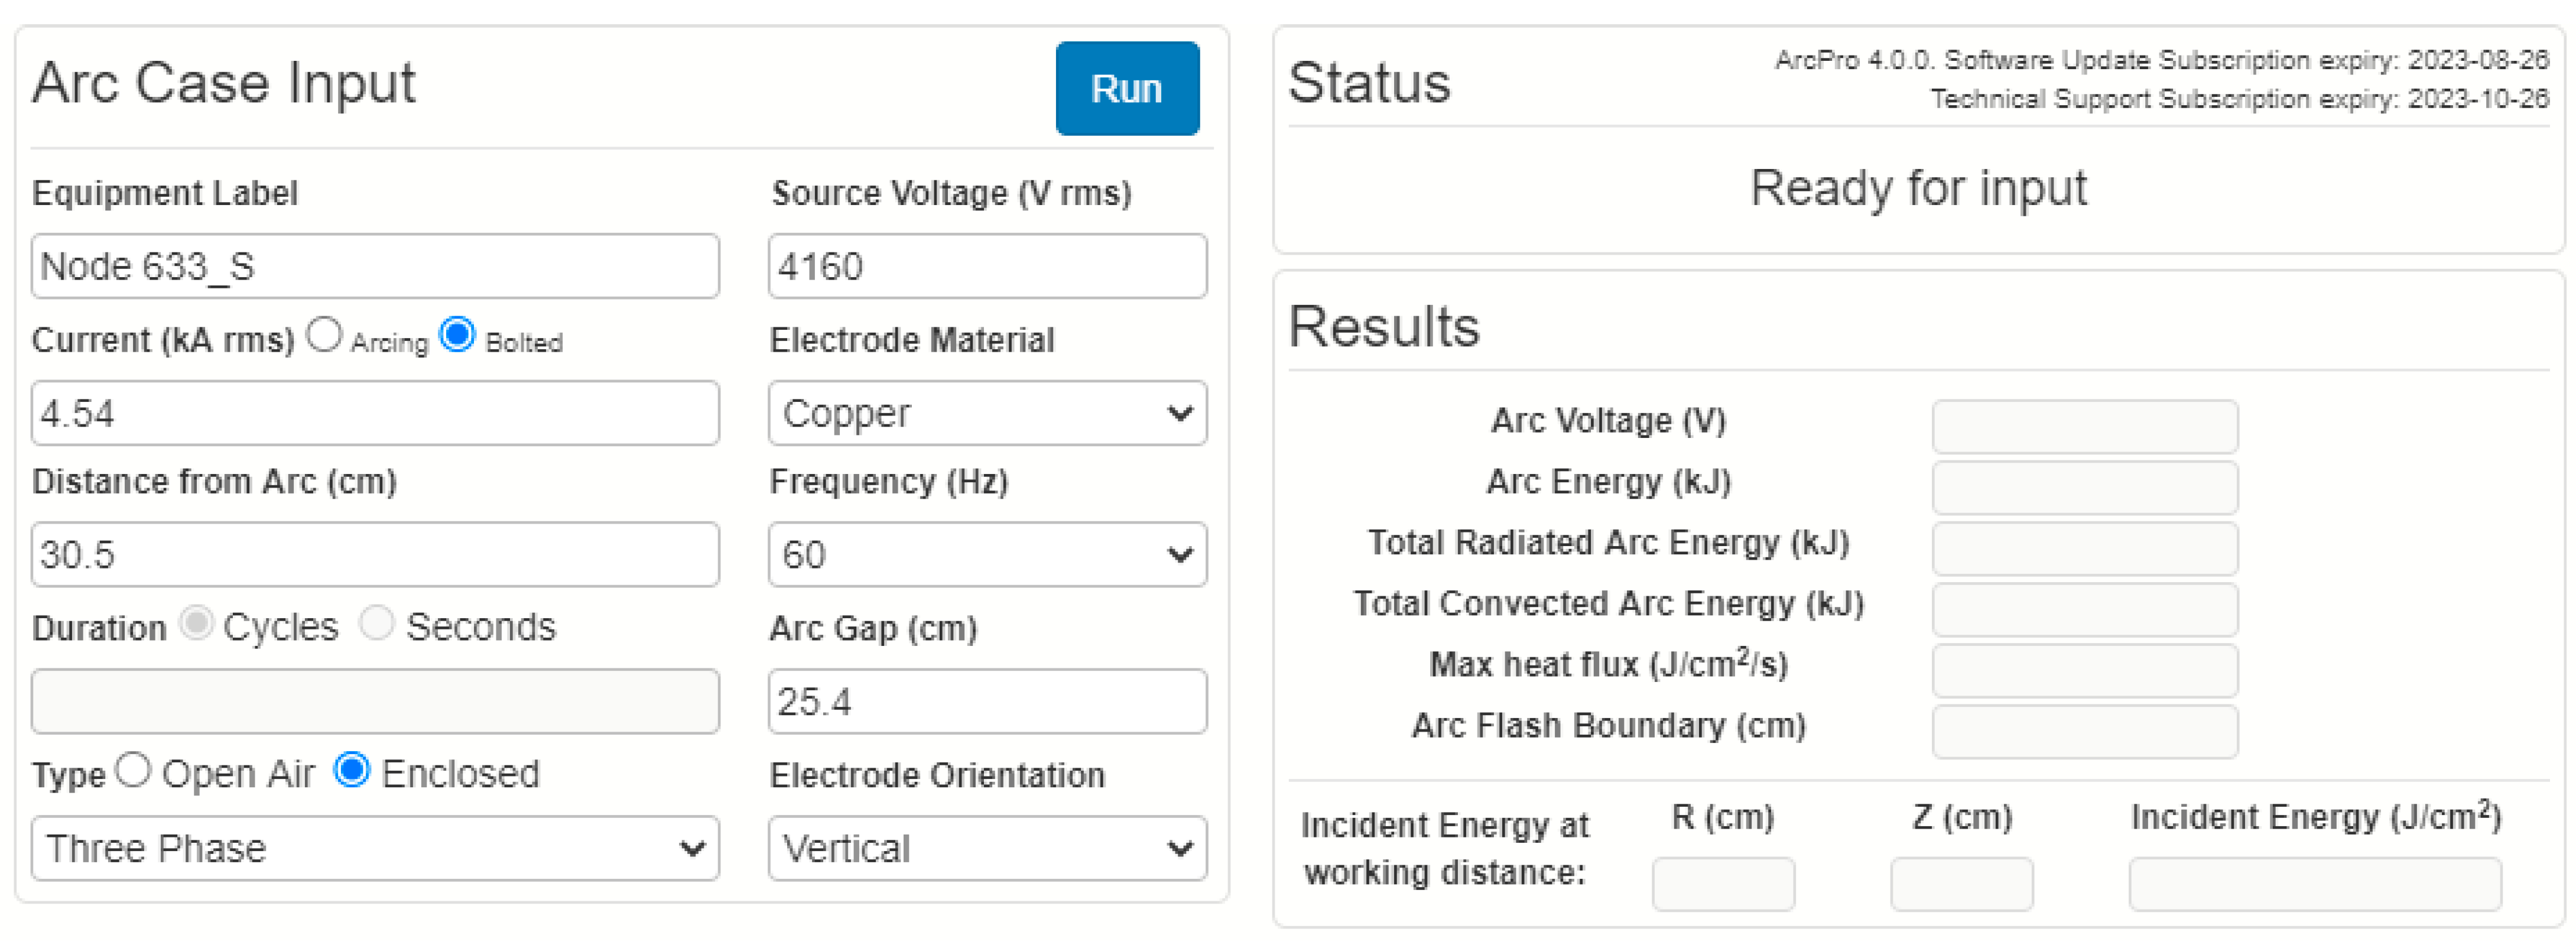
As in case studies 1 and 2, the three-phase short circuit at the point under analysis is simulated using the ATPDraw software, and the current resulting from the simulation, along with other data, is used in ArcPro as input for the case study. All the inputs considered in the ArcPro simulation are presented both in
Figure 9 and in
Table 6.
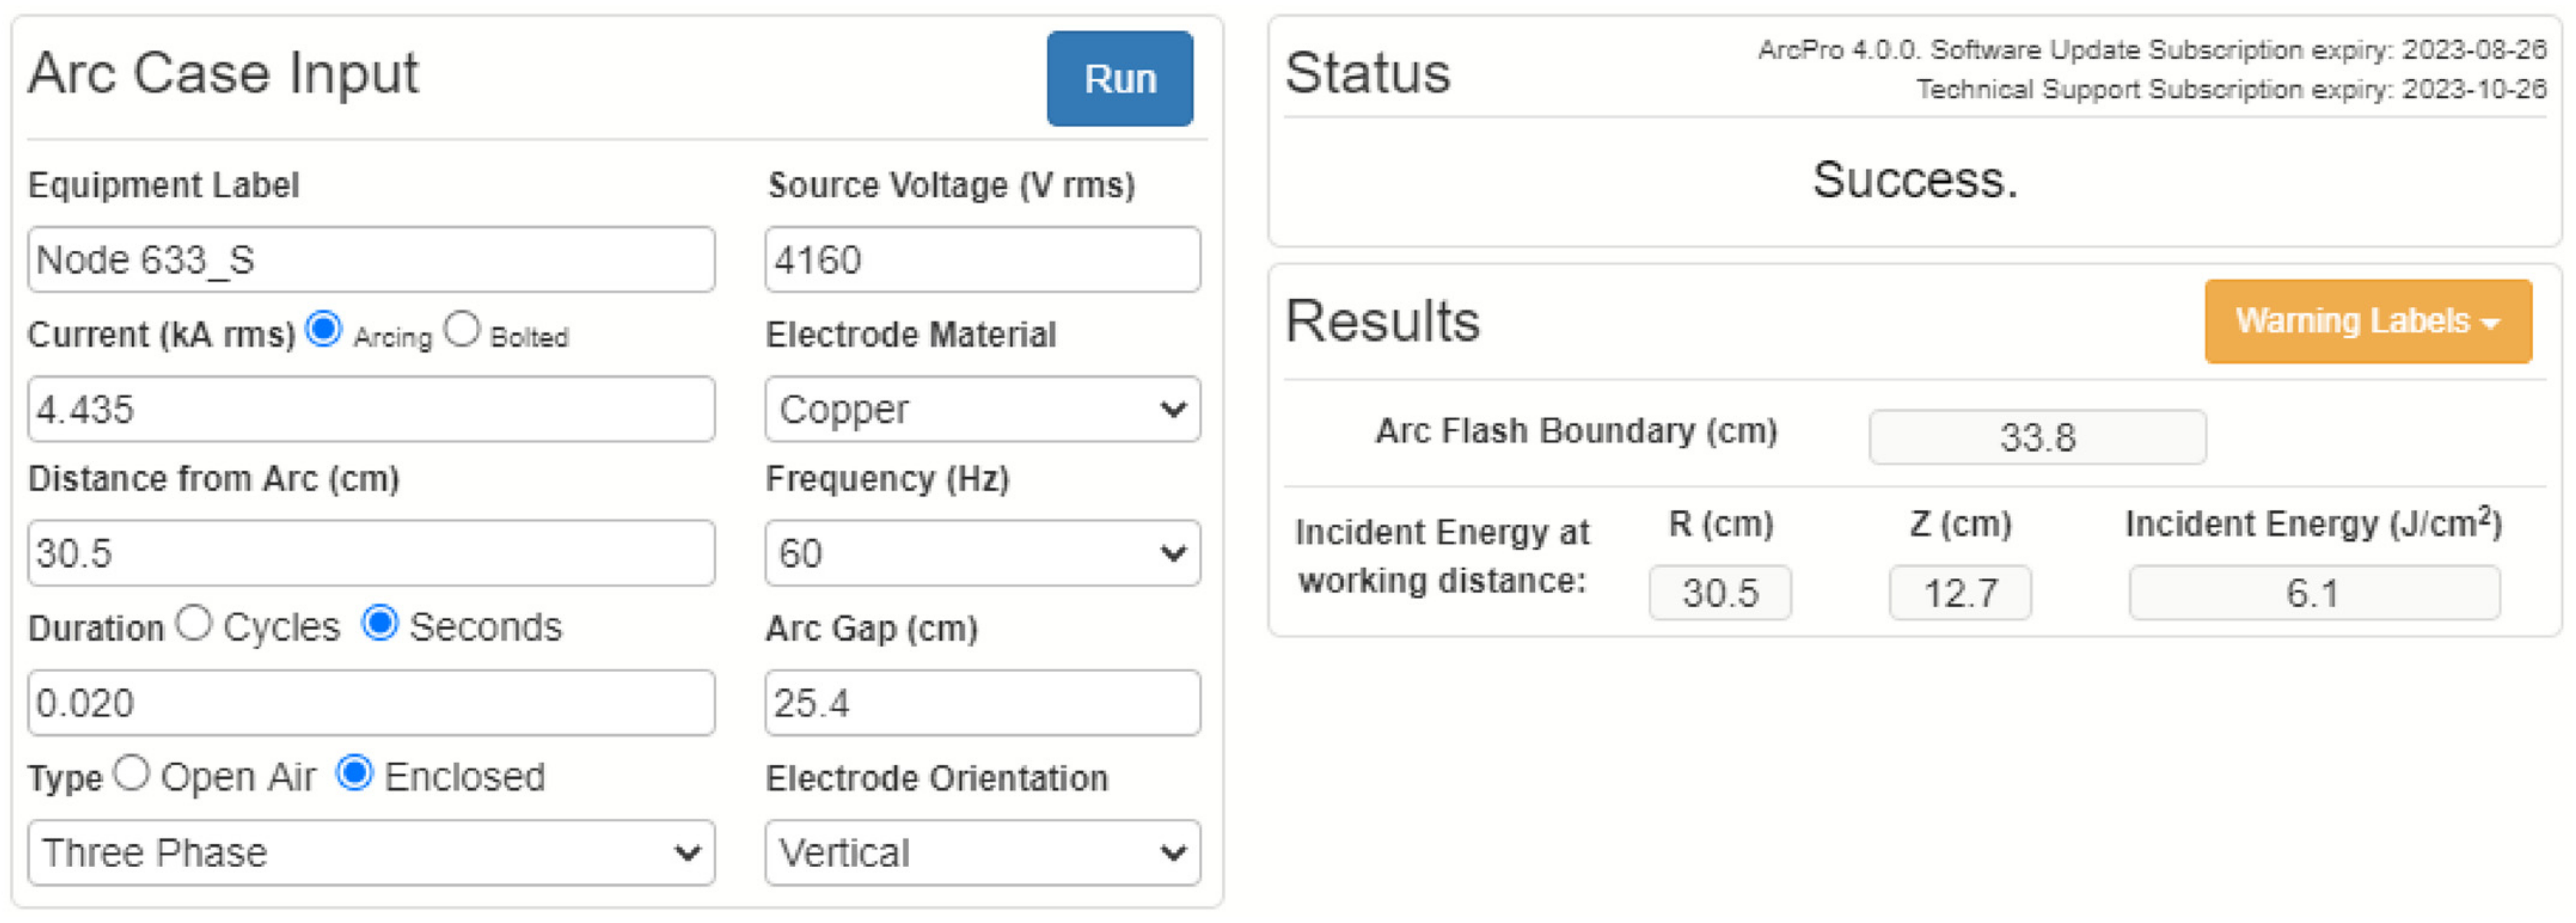
The arc current is the first result of the ArcPro simulation, whose resulting value is 4.43 kA with an X/R ratio equal to 5. Next, the duration of the electric arc is determined considering the same protective device employed in both case studies (1 and 2), so the arc duration is 20 milliseconds, which is the last input of the simulation, whose results are presented in
Figure 10.
The most relevant results for determining individual protection measures are presented in
Table 7. The estimated incident energy (6.1 J/cm
2 or 1.46 cal/cm
2) is above the second-degree burn limit, so it will be necessary to employ AR clothing and PPE to protect the worker against the thermal effects of the electric arc. For this level of exposure, the employed clothing and PPE must be of category 1 (protects up to 4 cal/cm
2 exposures) or greater—if the PPE categorization method is considered—or with AR greater than 6.1 J/cm
2 (according to the incident energy analysis method). Moreover, the arc flash boundary (33.8 cm) is greater than the working distance considered (30.5 cm), and this tiny difference can be noted as a flag to consider selecting another intervention technique. For example, a suggested technique can result in an incident energy level exposure that does not require additional individual protection measures.
3.4. Case Study 4
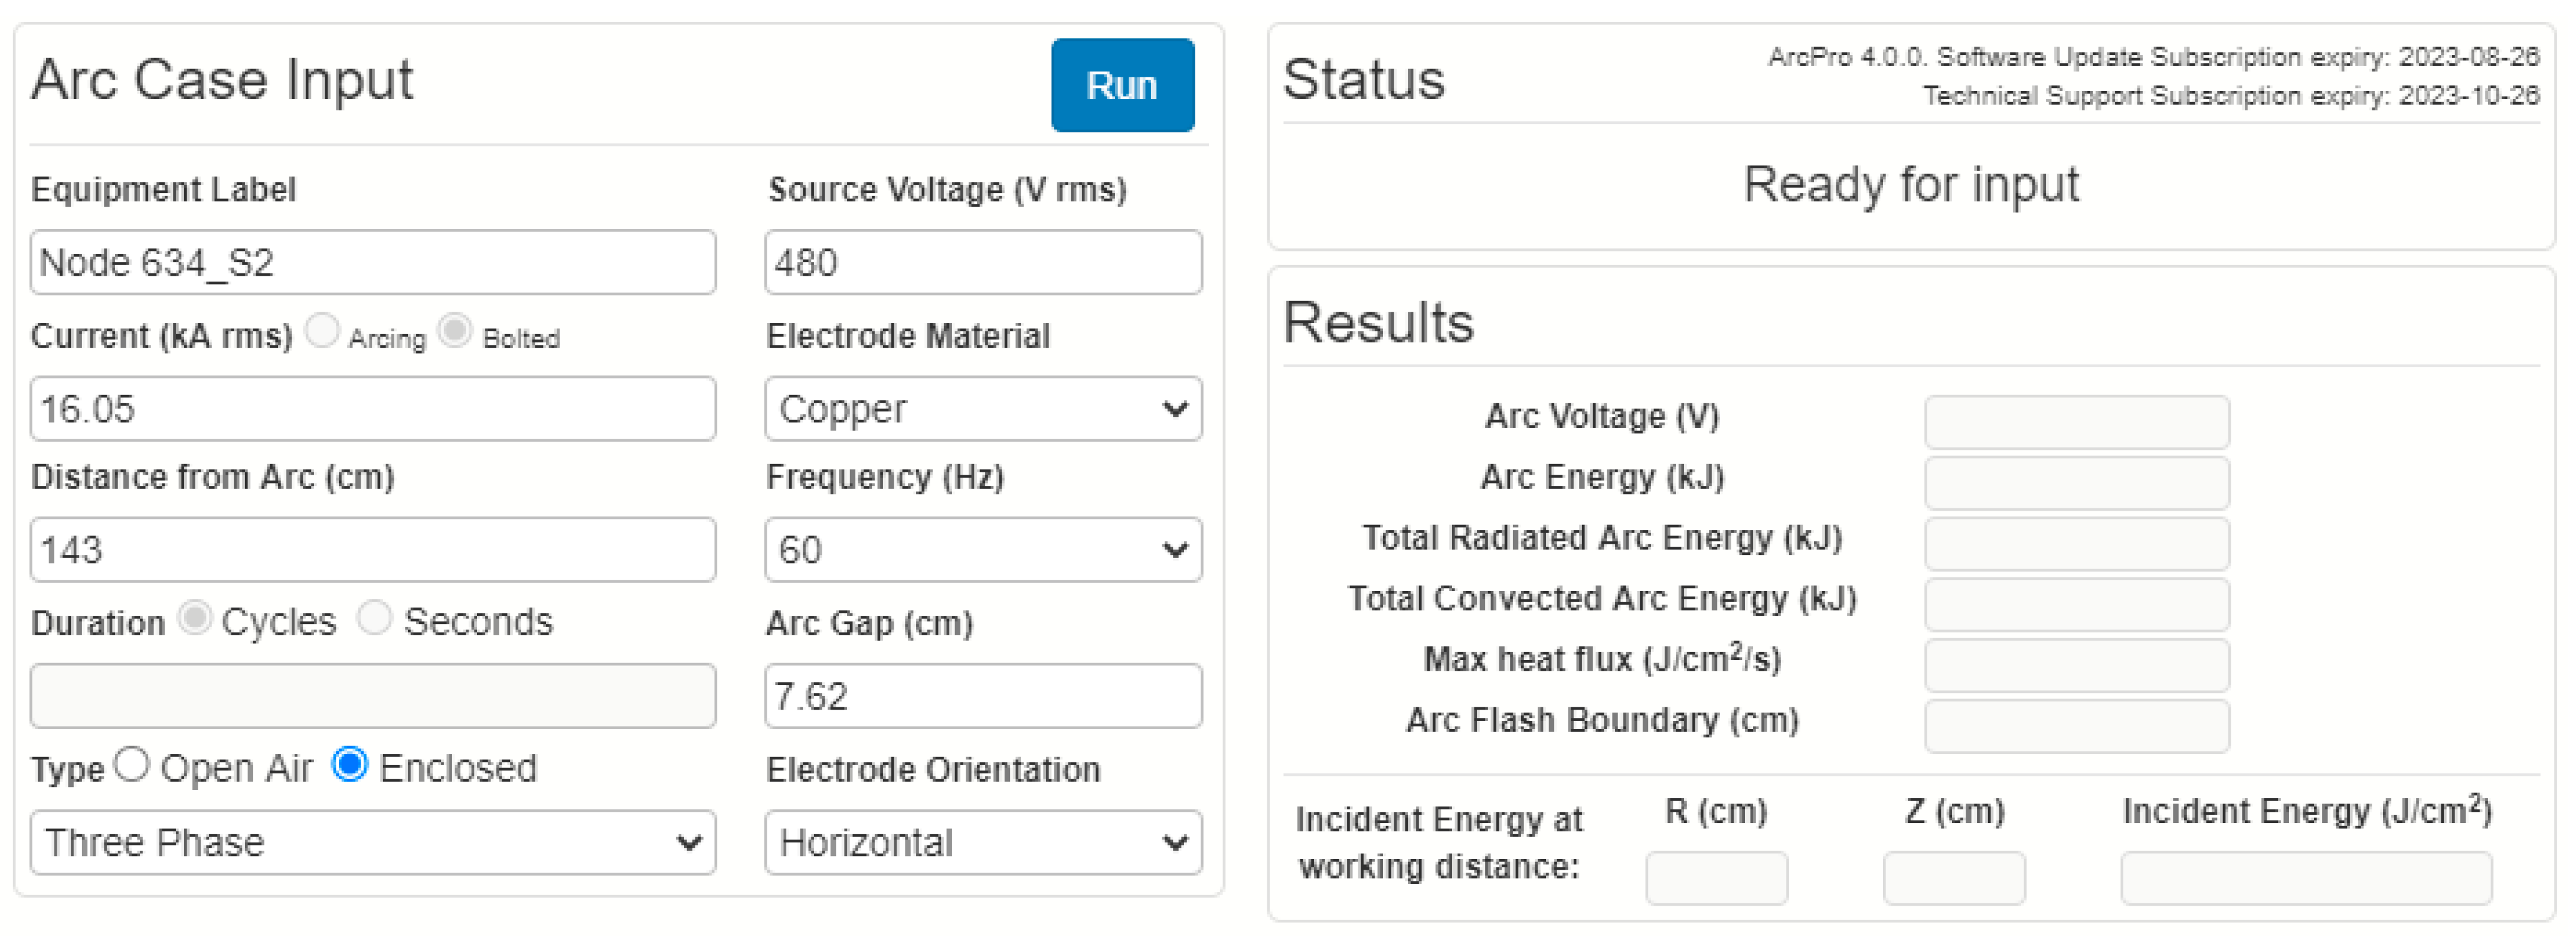
Both the same assumptions made in case study 3 and its methodology are considered in this case study. However, the three-phase fault where the arc originated was located at node 634 of the IEEE 13-Node system, whose location is indicated in
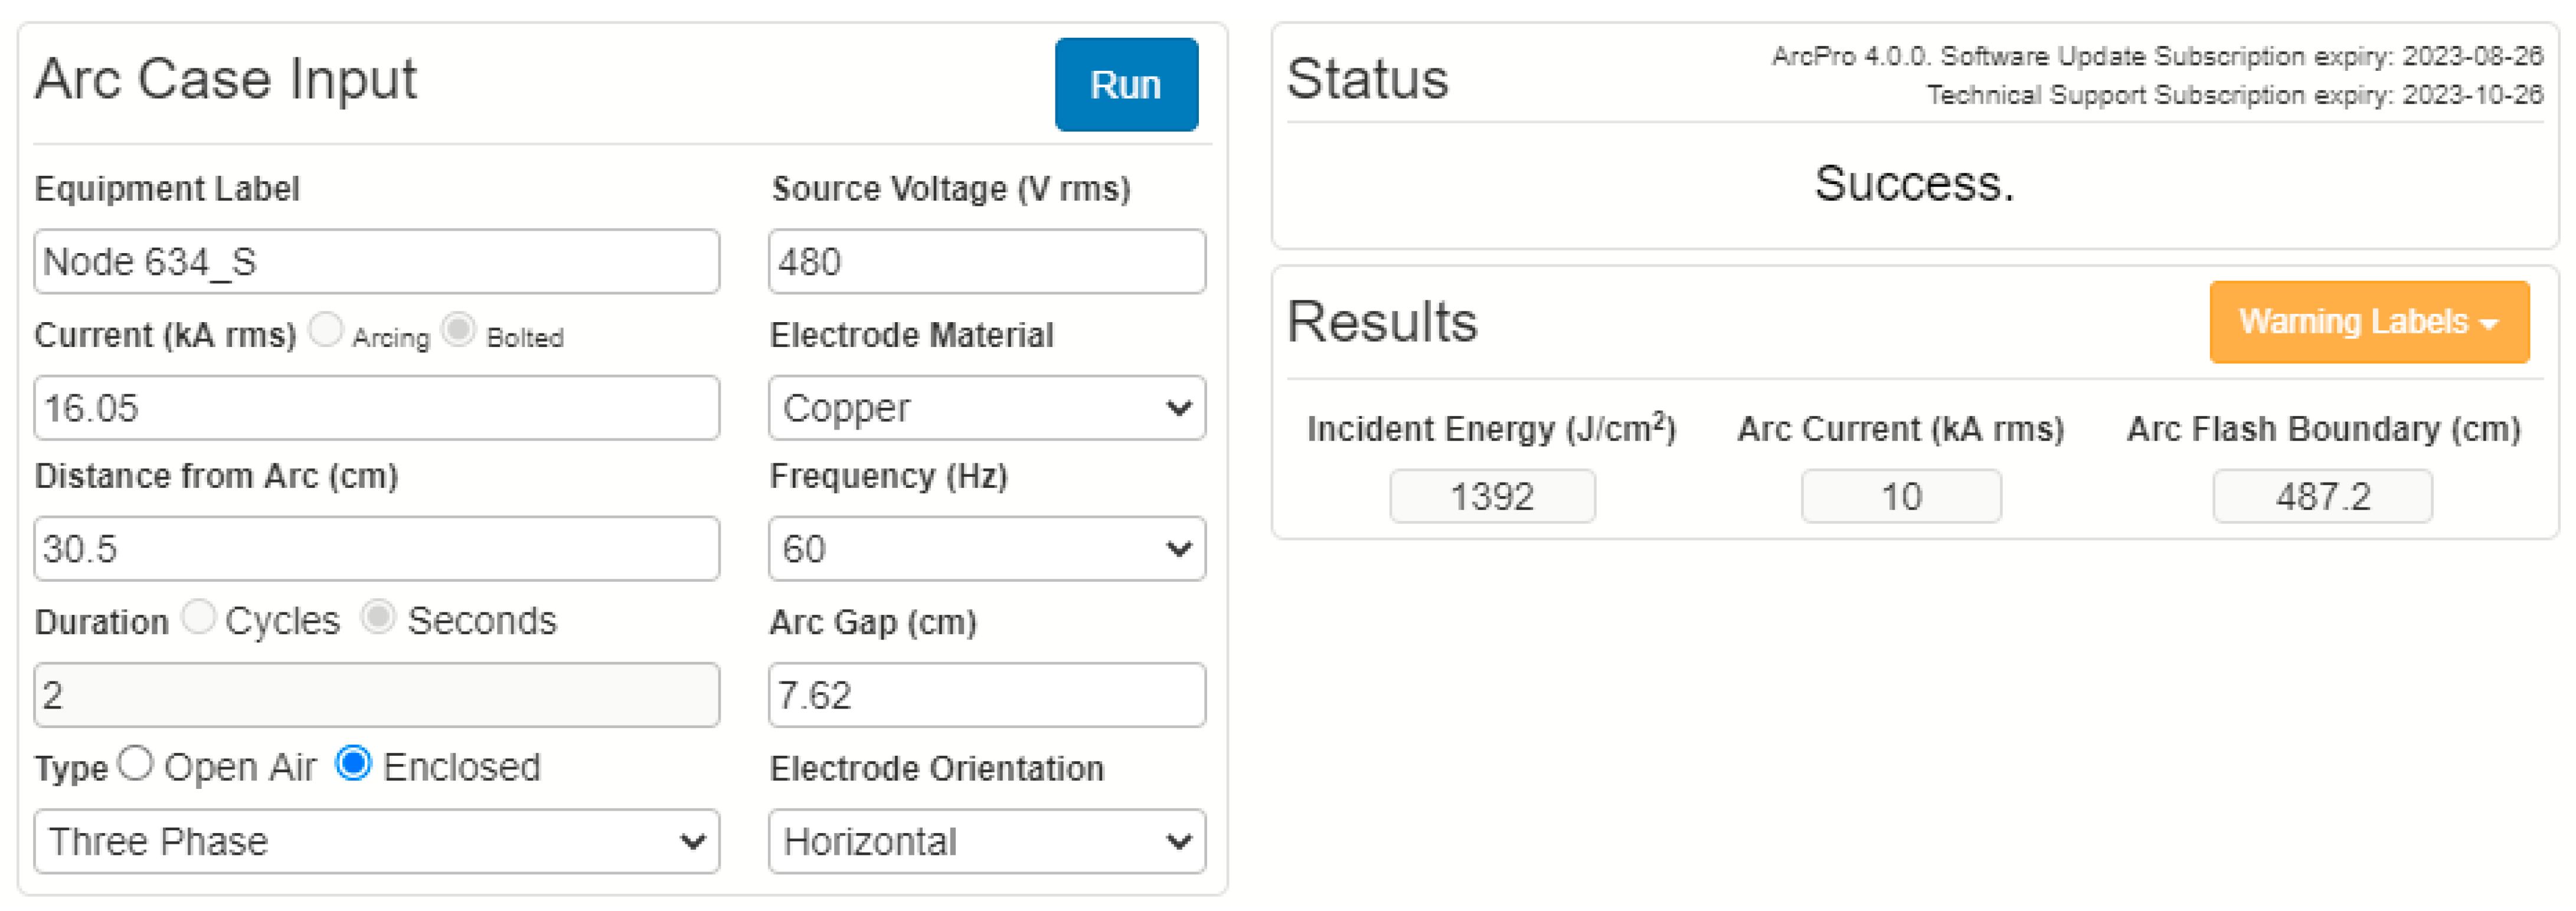
Figure 6. The current resulting from the simulation of the three-phase short-circuit at the point under analysis (using the ATPDraw software) and other data are used in ArcPro as input for the case study. All the inputs considered in the ArcPro simulation are presented both in
Figure 11 and in
Table 8.
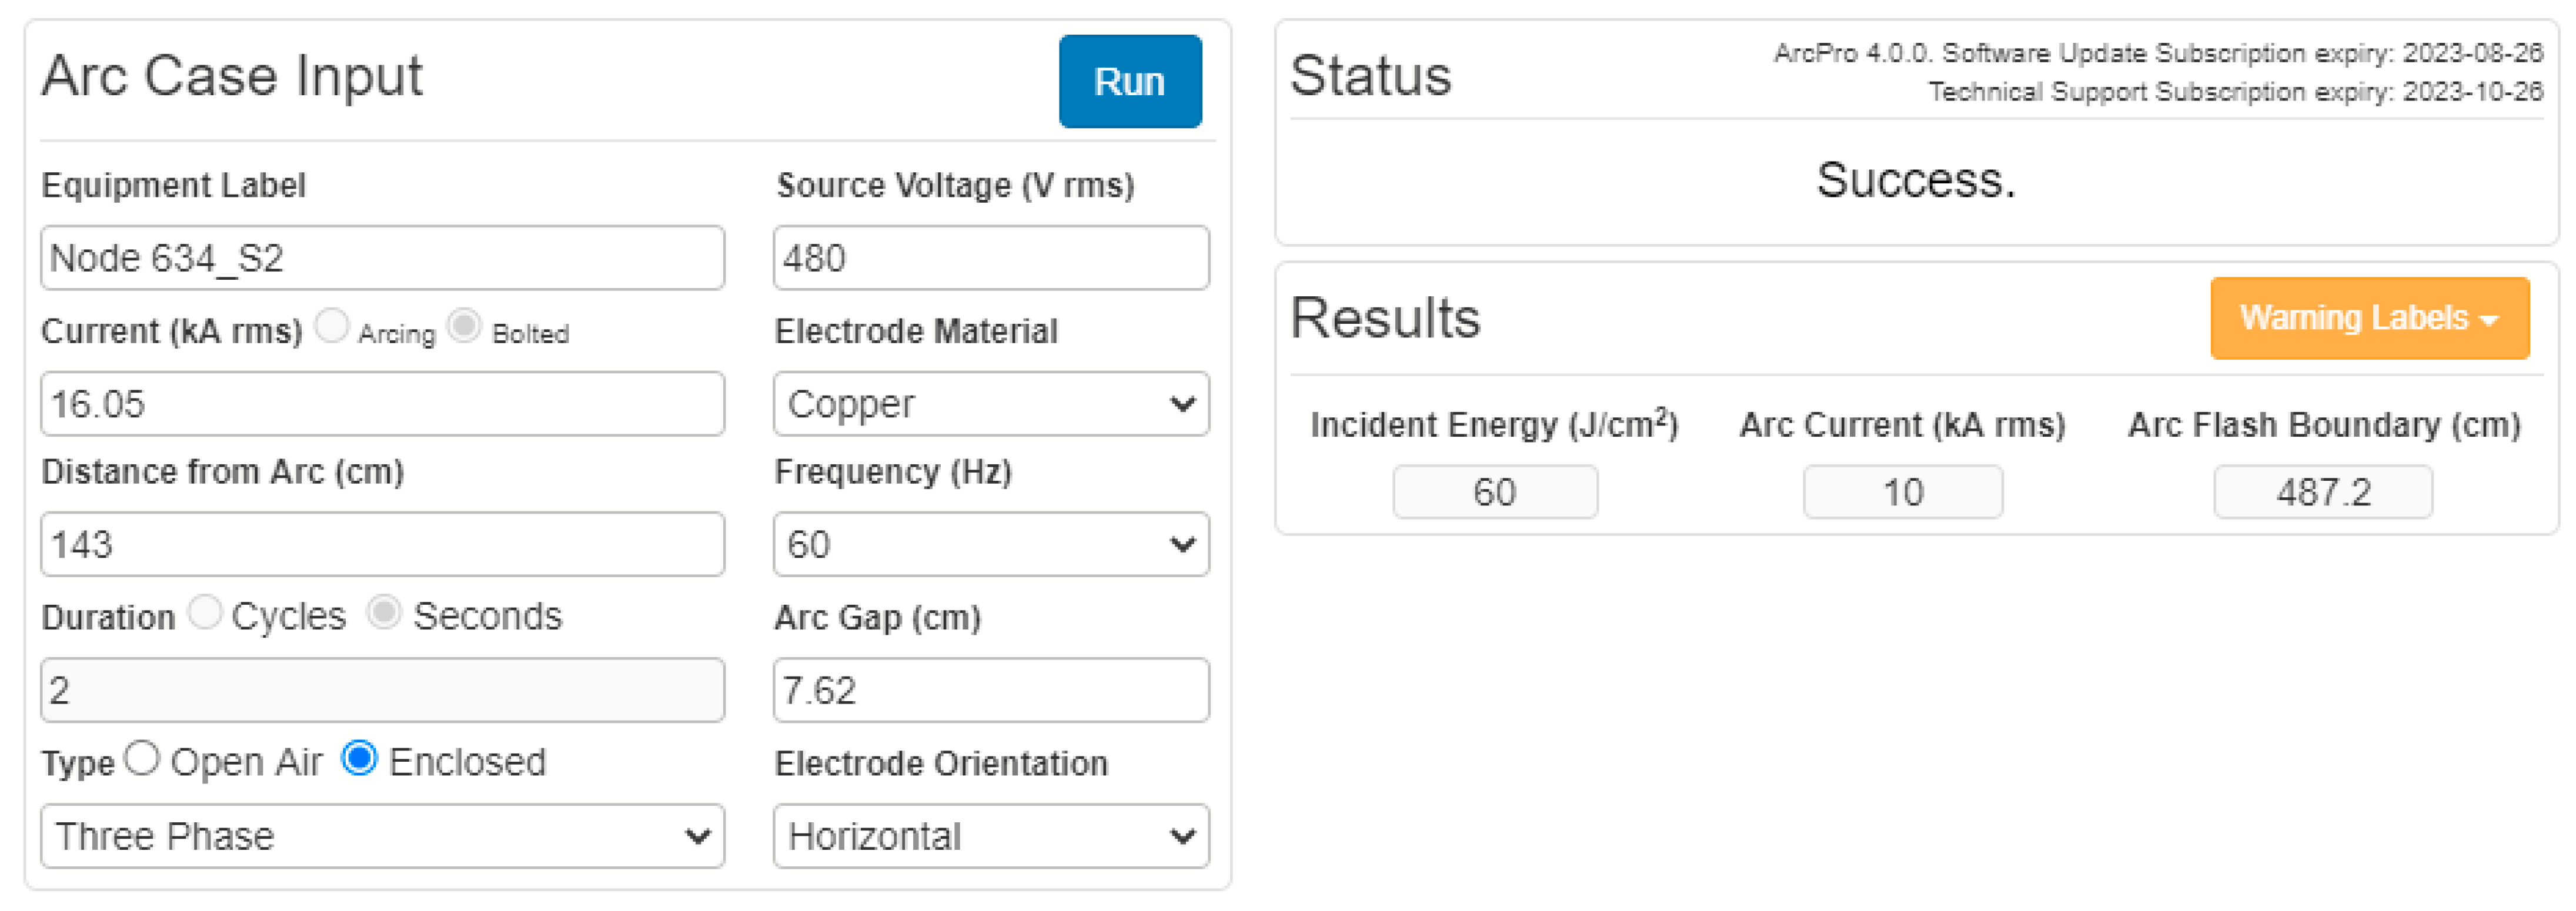
The ArcPro simulation returns the arc current as the first result, whose value is 10 kA (X/R ratio is considered equal to 5). It is considered that the protective device is installed in the transformer’s medium-voltage side (as in the previous study cases), so the current that sensitizes this device is the value obtained on ArcPro reflected to the transformer primary (1.15 kA). With this current, the arc duration is determined as equal to 2 s, which is the last input of ArcPro simulation, and the results are presented in
Figure 12 and in
Table 9.
The last two results presented in
Table 9 (incident energy and arc flash boundary) are typically used to determine if additional individual protective measures are needed. In this case, the estimated level of exposure is enormous (1392 J/cm
2 or 332.69 cal/cm
2), which makes it impossible to intervene in an energized environment under simulated conditions. The value observed can be explained by the combination of multiple factors, such as the arc duration, a small working distance, and the fact that the arc is confined and has electrodes in the horizontal position, which throws the cloud of heat and plasma generated by the arc directly onto the operator. Lastly, the arc flash boundary value (487.2 cm) only reinforces the observed incident energy value once the arc flash boundary is almost 16 times greater than the considered working distance.
3.5. Case Study 5
The scenario of case study 4 was modified only in terms of working distance for the present case study. Here, it is considered that the activity will be carried out using a maneuvering instrument, increasing the working distance. All inputs used in case study 5 are presented in
Figure 13 and
Table 10, including the result of a three-phase short circuit in node 634 of the IEEE 13-Node System, obtained from simulation in the ATPDraw software.
The change in the working distance does not affect the electric arc current, the first result obtained in the case study simulation in ArcPro. Thus, the results of the electric arc current and duration of the electric arc remain as in case study 4 (10 kA and 2 s). The effect of increasing the working distance is verified regarding incident energy, according to the results shown in
Figure 14 and
Table 11.
The incident energy and arc flash boundary results presented in
Table 11 are relevant to know the exposition level caused by the arc and the safe approach distance from the arc. The incident energy value indicates whether there is a need to employ necessary individual protection measures and, consequently, assists in selecting these measures. In this case study, the incident energy level observed (14.34 cal/cm
2) indicates the need to select clothing and PPE, which should be either category 3 (according to the PPE categorization method) or with an AR greater than 14.34 cal/cm
2 (according to the incident energy analysis method)—both methods are valid. Only one of the options should be chosen to avoid ambiguity in the use of individual protection strategies.
Only the incident energy estimate was changed by modifying the working distance of case study 4 to create case study 5. As happened for the arc current and duration, the arc flash boundary did not change and kept its value of 487.2 cm, more than three times the adopted working distance.
3.6. Comparing Case Studies
The five case studies presented differ in several aspects. Among the most relevant are the type of short circuit, the type of environment where the electric arc occurs, and the working distance adopted. Changing just one of these aspects can result in a different scenario regarding incident energy; therefore, knowing each case study’s inputs is as important as the simulation result itself (incident energy).
Table 12 summarizes the results of these five case studies, gathering information on incident energy, arc flash boundary, and appropriate PPE category. To compare the case studies, the authors evaluated them in pairs according to shared characteristics: pairs 1–3 and 2–4 (voltage level) and pairs 1–2 and 3–4 (type of short circuit). Additionally, a comparison is proposed for pair 4–5, which differs only in terms of the working distance.
3.6.1. Comparing Case Studies with Same Voltage Level
Case studies 1 and 3 refer to points with a voltage of 4.16 kV. When compared, it is noted that the incident energy level estimated for case study 3 is 47.5% greater than the incident energy value obtained for case study 1. This increase is attributed to the type of environment considered in case study 3 (confined), while the difference in level and type of short circuit (case study 3 employed a three-phase short circuit, while in case study 1, a single-phase short circuit was considered) did not show a significant contribution to the incident energy value, having been surpassed by the confinement effect of the electric arc. Furthermore, the difference in the estimated incident energy level implied the need to use AR clothing and PPE in case study 3 (category 1 PPE was selected, according to the PPE categorization method), while in case study 1, there was no need to apply this type of protection. Finally, it should be noted that the previously mentioned effects are not so expressive in terms of the arc flash boundary, which differs by 10 cm (approximately 30%) between the two case studies.
Case studies 2 and 4, even though both were simulated for points of the same voltage (480 V), present numerous differences that justify the striking difference between the incident energy levels observed: the incident energy of case study 4 is 120 times greater than the incident energy resulting from the simulation of case study 2. Furthermore, while case study 2 considers an open environment and a greater working distance (use of maneuvering device), in case study 4, the environment is confined, and the intervention is made on contact; that is, the thermal risk associated with case study 4 is exponentially more significant than in case study 2 since the incident energy is inversely proportional to the square of the working distance. Moreover, the incident energy level estimated for case study 4 makes it impossible to intervene in an energized environment, as it prevents the selection of AR clothing and PPE, as categorized PPE only protects exposures up to 167.5 J/cm2 or 40 cal/cm2 (the largest category of thermal protective clothing and PPE is category 4). Lastly, the arc flash distance obtained in case study 4 is at least twice the value obtained in case study 2. However, both distances could be used in the intervention using telescopic maneuvering poles.
Case studies 1 and 3 refer to faults on the medium-voltage side of the transformer, while case studies 2 and 4 simulate arc flash scenarios on the low-voltage side of this equipment. It is observed that in these comparisons, there is no difference in the duration of the electric arc (case studies 2 and 4), or the observed difference is tiny (in case study 3, the electric arc is extinguished 35 milliseconds faster than in case study 1). However, the comparison between case studies 1 and 2 and case studies 3 and 4, i.e., pairs of case studies where the arcing happens on opposite sides of the transformer, demonstrates the effect of arc duration on the estimated incident energy levels. In both comparisons, a case study is evaluated in which the protection acts quickly (case studies 1 and 3) and another in which the protection is slow (case studies 2 and 4). The protection is located on the medium-voltage side, so the actuation is quick if the fault occurs on the side the protection device is installed. However, if the short circuit happens on the low-voltage side, the protection device is sensitized by a small arc current value (value reflected to the primary), so the actuation is slow.
3.6.2. Comparing Case Studies with Same Type of Short Circuit
In case studies 1 and 2, this difference in the protection actuation time (1.95 s) is counterbalanced by a greater working distance in the case of slower actuation, resulting in an incident energy level approximately 73% higher on the low-voltage side. Such a difference in the duration of the electric arc also implies the need to use additional individual protection measures in case study 2, and the difference between the arc flash distance values is almost ten times greater on the low-voltage side. When comparing case studies 3 and 4, the difference between the protection actuation times (1.98 s) is slightly greater than the difference observed between case studies 1 and 2. However, this difference is added to the confined scenario of the electric arc and maintaining the working distance in both cases, implying a substantially higher level of incident energy on the low-voltage side. Because of this, the statement made when analyzing case studies 2 and 4 becomes clear since, given the level of incident energy observed in case study 4, it is mandatory that it is impossible to work in an energized environment in this scenario.
3.6.3. Comparing Case Studies with Different Working Distances
Case study 5 was proposed to demonstrate the effect of applying a technique to mitigate the incident energy level. This case study differs from case study 4 in terms of the working distance only; that is, while case study 4 considers touch work (working distance around arm’s length), case study 5 considers the use of a maneuvering device to carry out the activity. Comparing both incident energy results, case study 4 presents a colossal incident energy level (1392 J/cm2), while the level observed in case study 5 is much lower (60 J/cm2).
Therefore, in this analysis, by increasing the working distance by almost five times (from 30.5 cm to 143 cm), the incident energy level obtained was reduced by about 23 times (1392 J/cm2 to 60 J/cm2), exposing the inverse quadratic relationship between these variables. Moreover, this technique makes it possible to intervene in an energized environment once the worker subject to the incident energy resulting from the case study 5 scenario is protected by AR clothing and PPE (categorized AR clothing and PPE protect up to exposures of 167.5 J/cm2).
4. Discussion
4.1. Arc Flash Risk Assessment Goals
An arc flash risk assessment has three goals: (i) to identify arc flash hazards; (ii) to estimate the likelihood of occurrence of injury or damage to health and the potential severity of injury or damage to health; and (iii) to determine if additional protective measures are required, including the use of PPE [
8]. It should be noted that the emphasis is on health; that is, the whole process aims to protect the worker. How the worker will be protected is defined based on the analysis of incident energy, an estimation process that aims to define the level of energy to which the worker will be subjected during their work activities and determines, among other things, the need for employment additional protective measures, including the use of protective clothing and PPE.
4.2. Selecting the Right Incident Energy Estimation Method
The incident energy estimation process must select the most appropriate method for the type of electric arc that may occur in the system under study. For example, while the models proposed by [
16,
22,
23,
24] apply to three-phase arcing scenarios, supported by the fact that this type of fault is prevalent in industrial applications [
36] and by the discussion of how most electric arcs can escalate to three-phase arcing in a few cycles [
37], the method employed by [
25] can estimate the thermal energy released by electric arcs resulting from both single-phase and three-phase faults.
Faults involving only one phase are the most recurrent type of fault (about 70% of occurrences) in overhead distribution grids, so arc flash risk assessment for distribution grids should preferably be carried out employing methods capable of estimating the incident energy produced by electric arcs caused by single-phase faults, such as ArcPro software. For this reason, it can be used to analyze arcs in overhead distribution grids, as well as in underground distribution grids and electric power distribution substations, where three-phase faults occur more frequently.
4.3. Techniques for Mitigating Incident Energy Levels
The mathematical models of [
16,
22,
23,
24], consolidated in academic and industrial areas, indicate and confirm two points, which are (i) the direct relationship between incident energy and arc duration and (ii) the inverse relationship between incident energy and working distance. Most techniques for mitigating incident energy levels were created and practiced based on these observations, aiming to reduce the incident energy by reducing the duration of the electric arc, increasing the working distance, or both.
Incident energy mitigation techniques seek to reduce the duration of the arc through protection device selection and/or protection technique utilization capable of extinguishing the electric arc as quickly as possible. To do so, adjusting the configuration of protection devices or techniques such as zone selective interlocking (ZSI) and busbar differential protection (87B) may be resorted to. While busbar differential protection is well known but limited to application in medium-and high-voltage equipment due to the cost and space required [
38], ZSI emerged as a more economical alternative to differential protection and has been applied in power distribution systems for decades [
39].
In power distribution grids, fuses are generally used as protective devices thanks to their high fault-current-interrupting capabilities and current-limiting features [
40]. For example, in overhead distribution grids, it is typical for the protection device closest to the fault occurrence point to be a set of fuses installed on the medium-voltage side of the distribution transformers; using the fuse in this position implies a longer arc duration on the low-voltage side, contributing to higher incident energy levels at these points. On the other hand, in underground distribution grids and power distribution substations, where most of the installation is inside panels, other protective devices are installed, such as circuit breakers and relays. In this case, these devices could be installed on the medium- and/or low-voltage sides, contributing to a quick arc extinguishment.
While reducing the duration of the electric arc is a more complex process since this requires the repeating the entire protection study of the installation and, if its applicability is verified, change the parameterization of protection devices and/or change the existing (slower) devices with faster devices, the working distance can be increased using devices such as maneuver sticks and barriers between the worker and the intervention point, as well as the use of remote racking devices.
Finally, it is relevant to clarify that, of all the data used as simulation inputs in the previously presented case studies, only the protection actuation time and the working distance are variables that can be changed when the system is already in operation to reduce incident energy levels.
5. Conclusions
The primary objective of estimating incident energy levels throughout a system, regardless of the type of installation (residential, commercial, or industrial, and distribution, transmission, or generation of electricity), is to ensure the safety of those who interact with it, especially the workers responsible for keeping these systems working and serving other people in society with the amenities offered by access to electricity.
The concern for ensuring safety in work activities involving electricity goes hand in hand with the proposition of methods for estimating incident energy, a combination about 40 years old, born from the publication of Lee’s work in 1982. Since then, many ways to quantify the thermal energy released by an electric arc have been proposed and will continue to be, because improving workplace safety is an ongoing challenge faced by all organizations, including power utilities [
41].
This article reviews the most relevant incident energy estimation methods in terms of applicability and scientific literature. All the methods discussed are recommended for arc flash risk assessments by various safety codes and standards. The applicability and limitations of each of the methods were also discussed, with the aim of assisting the reader in selecting suitable estimation methods. Five case studies were proposed simulating electric arc events in overhead and underground power distribution grids based on the review of these methods. These case studies aimed to select an adequate estimation method, obtain the expected incident energy level, and determine the need and select, when applicable, clothing and PPE dedicated to protection against the thermal effects of the electric arc. Finally, this study compared and discussed the results found in terms of the interaction of each of the aspects of the electric arc scenario impacting the level of incident energy and ways to reduce exposure to this energy when necessary.
The discussions presented in this article and in all the works cited herein must be continued in order to support the continuous search for engineering solutions that guarantee safe working environments and the protection of electrical energy supply facilities. Even with all this awareness built daily, the risks continue to exist and, therefore, safe work practices must be employed without exception. This includes reinforcing the importance of PPE, which, despite any inconvenience or interference with work, must be acknowledged and discussed in open dialog between employees and trainers or management [
42].


 ,
, 


