Article

Study of the Heat Exchange and Relaxation Conditions of Residual Stresses Due to Welding of Austenitic Stainless Steel

by
Hamza Djeloud
1,
Mustafa Moussaoui
1,
Rahmani Kouider
2,
Awf Al-Kassir
3,* and
Juan Pablo Carrasco-Amador
4
1
Laboratory of Development in Mechanics and Materials, Ziane Achour University of Djelfa, Djelfa 17000, Algeria
2
Research Laboratory Modeling Simulation and Optimization of Real Complex Systems, Djelfa 17000, Algeria
3
Department of Mechanical, Energy and Materials Engineering, School of Industrial Engineering, University of Extremadura, Avenida de Elvas, s/n, 06006 Badajoz, Spain
4
Department of Graphic Expression, School of Industrial Engineering, University of Extremadura, Avenida de Elvas, s/n, 06006 Badajoz, Spain
*
Author to whom correspondence should be addressed.
Energies 2023, 16(7), 3176; https://doi.org/10.3390/en16073176
Submission received: 6 March 2023 / Revised: 27 March 2023 / Accepted: 28 March 2023 / Published: 31 March 2023
(This article belongs to the Section J1: Heat and Mass Transfer)

Abstract

:
The present study presents a numerical prediction of residual stresses (RS) using the single-pass tungsten inert gas (TIG) welding process for stainless steel plates and the two-pass TIG welding process for stainless steel pipes. The effect of heat exchange between welding material and the environment was studied. The work consists of two parts: The first one is based on the determination of the existence of residual stresses numerically using Cast3M software, which has been validated by literature results. The second part addresses the means envisaged to attenuate the amplitudes of these residual stresses by practical methods. Two parameters with significant influence on the residual stresses have been chosen: the welding bead thickness and the torch displacement speed. The finite element model used has been validated experimentally, and the results obtained for the residual stresses have been compared with those given by the numerical study. The results obtained were found to be in agreement with references results. In addition, the microstructural analysis of different areas after welding of the solder joint (base metal, heat-affected zone and solder zone) was carried out using optical microscopy analysis.

1. Introduction

It is widely acknowledged that welding processes are found in most industrial fields, such as steel framing, aviation, shipbuilding, and automotive industries. During the welding thermal cycle, the temperature increases around the weld zone, then decreases rapidly, which leads to some microscopic elasto-plastic distortions; these in turn cause a number of macroscopic deformations. It was found that these unexpected deformations mainly involve longitudinal and transverse shrinkage, as well as longitudinal and transverse bending with some angular distortion. All these contortions could have direct adverse effects on the accuracy of local welding and even on the performance of the entire welding equipment assembly. All these undesirable phenomena lead to the formation of residual stresses (RS) within the assembly [1]. The residual stresses are generally defined as those stresses that remain in a solid material even after their original cause is removed without any subjected external force. These stresses could also develop when a region of the metal is prevented by adjacent regions from expanding, contracting, or releasing elastic stresses.
Furthermore, the combined application of tension and compression on a solid part can also generate RS after the removal of the loads. It has been taken into account that these stresses are classified as residual mechanical stresses because they occur through a mechanical event. It is also worth mentioning some other types of residual stresses that could result from rapid heating and cooling processes or cycles. The high-rate cooling is generally found in multi-pass welding processes, which lead to high residual stresses that are usually localized in the heat affected zone (HAZ) and the weld metal zone (WMZ). These two zones could, in some cases, reach the elastic limit of the material. Therefore, welding deformation and residual stress due to local heating are considered to be major problems that could occur in welded structures [2,3]. It is widely known that welded structures can be adversely affected by the residual stresses that grow in and around the weld regions, because they can create cracks and may eventually damage the structure. As a consequence, the heat flux that emerges during the welding process, in addition to the non-uniform distribution of heat, might generate severe deformations in the structure.
Furthermore, residual stresses at weld joints might lead to fatigue failures in welded structures, like the brittle fracture, hot cracking of the weld zone, initiation, and propagation of cold cracks, etc. [4,5]. Also, fatigue cracks might occur at ambient temperature. In addition, a welded joint could have a low resistance to corrosion. Indeed, corrosion might engender cracking and rapid failure of a weld joint that is exposed to a corrosive environment. Welded metal is susceptible to attack from bidifferential volumetric expansion and contraction at the macroscopic and microscopic levels. Furthermore, the macroscopic volumetric changes that occur during the cooling cycle are formed by metallurgical transformations developed in the WMZ and the HAZ [6,7]. It is broadly acknowledged that residual stress analysis is considered to be one of the compulsory stages that ought to be thoroughly conducted during the design and manufacture processes of structures, because this would greatly help to assess and analyze their reliability under various loading conditions. Several methods are employed for measuring and evaluating residual stress. These methods are classified in two different categories. The first one includes destructive methods and non-destructive methods that can be applied in measuring and assessing actual and mock-up structures. With regard to the destructive methods, the superposition concept assumes that the material behaves elastically during the relaxation of residual stress. Authors in [8] used the contour method (CM), that was applied according to the following steps: (a) Cutting, (b) Surface contour measurement, (c) Data handling, and (d) Stress computation. Similarly, authors in reference [9] applied the same method and used a wire electrode machine to split steel blocks and weld beads in three perpendicular directions. Deformations occurring in surfaces due to the production of residual stresses were measured using a 3D optical measurement technique. The surface topography was employed as a boundary condition in the finite element method, in order to estimate the resulting residual stresses. The second category comprises non-destructive methods. One of these is the artificial neural network (ANN) method which is used to simulate the predicted RC in the welding process. It should be mentioned that the ANN model allows determining the correlation between the input variables and the corresponding mechanical properties [10,11,12]. The effectiveness and accuracy of the numerical computation model can be improved using the momentum-consistent smoothed particle Galerkin (MC-SPG) method that was initially suggested by Wu et al. [13]. On the other hand, it was revealed that the finite element method (FEM) is broadly used for predicting and analyzing welding RC. Some other studies available in the literature made significant contributions to the determination of the effects of RS on the properties of materials when using the friction stir welding technique [14]. In this context, Moattari et al. [15] investigated the effect of welding repair on RS; they learned that the RS peak diminishes about a quarter on the welded structures, and that the RS levels in the weld joints with different repair lengths were identical. With regard to Rong et al. [16] they developed a weld strength prediction method. It should be noted that the automated resistance welding can be evaluated using a pre-trained multi-layer neural network that utilizes the signals captured from the moving measurement windows during the welding process. The training and testing of the ANN model was performed using more than 50 experimental datasets that were provided by the response surface analysis (RSA). Afterwards, the performance of the neural network was evaluated using a regression model that was developed using the same experimental datasets that were employed for the neural network [17]. Furthermore, a backpropagation artificial neural network (BP-ANN) within the Arrhenius [18] constitutive model was developed to predict the flow stress of the alloy Ti-44Al-5Nb-1Mo-2V-0.2B (at. %) under hot stress. The physical constants were calculated while considering the effect of deformation; then a comparison was carried out between the models. Particular attention was paid to the evolution of the microstructure under different deformation conditions. The deformation mechanisms, which took place within the alloy under study, were also investigated [19]. In addition, the impact of the welding current on the angular distortion was also examined. It should also be indicated that two super duplex stainless steel filler metals, i.e., ER 2594 and duplex ER 2209, were utilized for welding the UNS s31803 grade duplex stainless steel in order to determine the relationship between various mechanical properties. Afterwards, the microstructure of the welded joints was analyzed using optical microscopy (OM) and scanning electron microscopy (SEM) techniques [20]. It is worth emphasizing that many studies have shown that any phase transformation leads to a change in the volume during the heating and cooling cycles. Moreover, a number of computational procedures have been developed to predict the RS resulting from phase transformation [21,22,23,24].
The present work mainly aims to analyze the effect of welding on the RS and to examine the evolution of the longitudinal stresses distribution in the welded plates and circumferential in the welded cylindrical pieces. The results obtained were then compared with those reported in the literature. During welding, parameters contribute to the evolution of these RS. We have opted for two parameters that can produce an important influence on the RS, which are the weld bead thickness and the speed of movement of the welding torch.
It is well known that there are different origins of RS—they come from three origins, namely, mechanical by clamping of the part, thermal by the welding heat source, and metallurgical by the structural modifications induced by the variations of temperatures. We are then interested in the RS formed during welding Figure 1.
A micrographic analysis has been carried out after welding and HV-microhardness measurements, in order to examine the structural changes induced by the welding operation of austenitic steel materials. The heat treatment side was also discussed to show the residual stress amplitudes as a consequence of the effects generated on the structure.

2. Materials and Methods

It is widely acknowledged that the austenitic stainless steel 304 is one of the most globally used materials in the aircraft fuel tank industry, due to its high strength and superior resistance to corrosion. This type of steel is also used in the production of high-strength weldments and in the manufacturing of components that operate at high temperatures, as in nuclear power plants. In addition, SUS304 stainless steel is one kind of austenitic stainless steel that is mainly composed of elements like chromium (18.9%) and nickel (8.07%). It also contains manganese (2%), nitrogen (0.1%), sulphur (0.3%), carbon (0.08%), silicon (0.75%) and phosphorous (0.045%). This steel possesses good weldability. In fact, it can be welded by conventional welding techniques without any pre-welding heat treatment. It is also important to know that when welding parts having large dimensions, it is highly recommended to use the low carbon stainless steel SUS304L. In addition, it was found that the high resistance of stainless steel to corrosion is essentially due to the presence of chromium, which prevents chloride corrosion. It was revealed that Young’s modulus decreases slowly for temperatures ranging from 0 °C to 400 °C. Then, it continues to decline at a faster rate after the temperature of 400 °C, until it reaches 1500 °C, as it is clearly illustrated in Figure 2b.
Furthermore, the filler metal Y308L is composed of two main elements, namely chromium (18%), which provides this steel with a good resistance to corrosion, and nickel (9.6%). It was found that this filler metal comprises manganese (1.92%), carbon (0.04%), and silicon (0.34%).
The present study primarily focuses on the welding of two SUS304 stainless steel tubes with an outside diameter R o u = 114.3   mm , inside diameter R i n = 108.3   mm , and length L = 400   mm , as illustrated in Figure 3. The torch, which is installed on the other side of the plane, moves symmetrically to it.
A second case was also considered in this study. It consists of welding two SUS304 stainless steel square plates with the following dimensions: L = 100   mm and thickness e = 5   mm , as depicted in Figure 4.
It is widely recognized that most industrial applications require using the most reliable and appropriate welding method. The most suitable parameters for welding high resistance stainless steel are: current = 130 A, voltage = 27 V, gas flow rate = 17 L/min and welding wire diameter = 0.8 mm. It must be kept in mind that the voltage and gas flow rate are expected to increase during the welding process [25]. Similarly, both tensile strength and hardness improved when welding voltage and gas flow rate were increased. The abovementioned welding parameters are reported in Table 1.

3. Theoretical Background

During the welding process, two phenomena of heat transfer can arise: heat by convection and by conduction. In this case, the heat flows through the weld metal and generates shrinkage and therefore leads to a decrease in its volume. This would increase the compressibility of the upper part of the welded sample (see Figure 5).
It is noted that the lower zone has a lower cooling rate because the heat exchange occurs through conduction in one-way only. In addition, the weld metal has poor heat conductivity, and can exchange heat with the thermally damaged area, which causes the rising of temperature and therefore leads to elongation, as can be seen in Figure 5.
Based on convective and conduction heat transfer, the heat input requires a complex numerical analysis modeling. The stresses depend on the temperature distributions in the piece, which themselves depend on the model used for the source. Several models have been developed to represent the heat input during welding. Two main methods are used by these models: the representation of a source as a heat flux imposed on a given surface, and the representation in the form of heat generation inside a given volume.
The first mathematical modeling of a heat source was presented by Rosenthal [26] in 1941. From Fourier’s development of the heat equation, assuming a quasi-steady state, Rosenthal obtains the temperature distribution in a plate by representing the source punctually. Equation (1) represents the temperature distribution in a semi-infinite three-dimensional plate.
T T 0 = Q 2 π k e λ v ξ e λ v r r  
where:
T ; temperature at a given point;
T 0 ; initial temperature;
Q ; total heat applied to the plate;
k ; thermal conductivity coefficient;
λ ; thermal diffusivity of the material;
ν ; welding speed;
ξ ; coordinate parallel to the direction of the weld;
r ; radial position.
Another model applied to the circular surface named disc model, originally proposed by Pavelic et al. [27], uses heat flow over a circular surface following a Gaussian distribution. This distribution is determined from the following equation:
Q r = q 0 e C r 2  
where:
q r ; heat flux (W/m2)
q 0 ; maximum heat flux at the center of the source (W/m2)
r ; radial position (m)
C ; concentration coefficient (m−2)
A ; relation between q 0 and C can be established by supposing that a constant flow of value q 0 and imposed on a circle of diameter d = 2 / C is equivalent to the total power
Q = q 0 π d 2 / 4  
q 0 = Q C / π  
Equation (2) becomes:
q r = Q C π e C r 2  
Goldak’s double ellipsoid [28] is the state-of-the-art model for thermal simulations of a moving source of heat flux. The MIG/MAG and TIG welding can be simulated with outstanding results, using the double ellipsoid modelling. This model has been used in many papers [29,30,31] in numerous welded forms, such as butt-welded plates, girth joints, fillet and cruciform welds.
The authors proposed a volume distribution that consists of two semi-ellipsoids, behind and in front of the axis of the electrode, as is shown in Figure 6. Note that x, y, and z are the coordinates of the solid point that is considered in the mobile reference frame which is linked to the heat source. Also, c f and c r are the radius along the welding path (x-axis) of the half-ellipsoids at the front and rear of the torch.
Furthermore, U I η   is the energy transferred to the welded structures from the torch, a is the radius along the transverse axis ( y -axis) of the half-ellipsoid, b is the radius along the z-axis of the half ellipsoid, and f f and f r are the fractions of the energy that are applied to the front and rear of the torch. As with arc pressure, heat flow is strongly influenced by several factors such as current, voltage, radial distance, process efficiency, shielding gas, and electrode grinding angle.
q r x , y , z = 6 3 U I η f r a b c r π π e x p 3 x 2 c r 2 3 y 2 a 2 3 z 2 b 2  
q f x , y , z = 6 3 U I η f f a b c f π π e x p 3 x 2 c f 2 3 y 2 a 2 3 z 2 b 2  
The expressions (8) and (9), given below, define the quantities f r ,   and   f f :
f r = 2 c r c r + c f  
f f = 2 c f c r + c f  
When the welding torch moves along the weld centerline, the heat is disseminated throughout different parts of the material by conduction, which results in non-uniform temperature states. Obviously, the heat flow q   W / m 3 passes from the high temperature zone to the low temperature one. According to the Fourier law, this heat flow is linearly dependent on the temperature gradient. Therefore, Equation (10) given below governs the nonlinear transient heat conduction.
x k T T x + y k T T y + z k T T z + Q = ρ T c p T T t  
where ρ   Kg / m 3 is the material’s density, C P   j / Kg is the specific heat capacity, k [W/m.K] the thermal conductivity for isotropic materials, T [°C] the temperature, and Q [ W / m 3 ] the welding heat input. Therefore, when the problem is solved in the solidus and liquidus domains by treating heat diffusion using an enthalpy-based formulation, the equation that governs the heat transfer then becomes:
ε = ε ˙ e + ε ˙ p + ε ˙ t h  
Here ε ˙ e is the elastic strain, ε ˙ p the plastic strain, and ε ˙ t h the thermal strain. The elastic strain may be modeled using the isotropic Hooke’s law with the temperature-dependent Young’s modulus and Poisson’s ratio. In addition, the temperature-dependent coefficient of thermal expansion is also used to calculate the thermal strain. A rate-independent plastic model is used with the plastic strain characteristics. Moreover, the surface temperature-dependent mechanical characteristics were produced by the Von Mises flow stress [32]. The Equation below defines the corresponding stress.
σ v = 1 2 [ σ 1 σ 2 2 + σ 2 σ 3 2 + σ 3 σ 1 2 ]  
Finite element simulation of the welding process is very difficult since it involves mechanical, thermal, and metallurgical interactions, as the material is subjected to a differential thermal cycle. The residual stress analysis based on thermo-elastic-plastic FEM is usually applied. Figure 7 illustrates the finite element simulation process adopted in this work.

4. Discussion

4.1. Analysis of Residual Stress Distribution

It is worth recalling that this study focuses on the process of welding two SUS304 stainless steel pipes. All dimensions and welding directions are explicitly represented in Figure 2.
This figure depicts a 3-D finite element model with 8500 parallelepiped elements and 11,500 nodes. It should be noted that in the vicinity of the weld joint, the mesh is refined so that more accurate results can be obtained, because the thermal gradient in this zone is quite high. However, when moving away from the joint, the temperature decreases and therefore the mesh can be taken roughly, as shown in Figure 8.
The first part of the study consisted of joining two stainless steel SUS304 tubes using a weld torch in which the welding electrode can rotate in a circular motion. The multipass welding procedure was employed to fill the joint and the high temperature produced locally affected molten metal (base metal + filler metal). Hence, a thermal gradient was generated, and some modifications were then introduced in the structures of the materials. Our numerical results were compared with experimental results presented in [33], which represents the distribution analysis of the inside axial stress and inside hoop stress. The evolution of these two stress types during the welding process allows noting that in Figure 9a there is a peak stress value of the order of 400 MPa at the center of the weld joint, followed by a stress decline far from the central zone, in the direction of the inside axial stresses, and another peak stress value of 300 MPa in the direction of the inside hoop stresses, as is shown in Figure 9b.
This section concentrates on the welding of two stainless steel SUS304 plates; all the dimensions and welding directions are illustrated in Figure 4, which shows a 3-D finite element model with 9000 parallelepiped elements and 10,673 nodes.
The density of the mesh is distributed in a non-uniform way. Indeed, the mesh density is quite high near the welding arc because this region is subjected to a higher-pressure gradient. Then, the mesh gradually expands as it approaches the other side. It should be noted that the purpose of reducing the number of nodes and elements is to diminish the computation time, while maintaining the accuracy of the results obtained, as shown in Figure 10.
The abovementioned stresses generate tension stresses as well as compressive stresses in the center zone. However, once the base material has undergone plastic deformations under compression, it contracts, while the rest of the piece opposes that contraction, which induces some residual tensile stresses at that point, as depicted in Figure 11b. The RS appears during the solidification phase of the filler metal and also during its subsequent cooling. Then, the filler metal solidifies. In addition, the weld bead contracts during the cooling phase. It should be noted that if the weld bead did not undergo any longitudinal restriction, then it would reach the length of the sample. The contraction of the bead is in fact prevented by the rest of the plate.
The thermo-mechanical forces are generated. It is necessary to underline that once the assembly is entirely cooled, the RS longitudinal component can reach a value as high as that of the yield strength, and plastic deformations can be produced within the weld bead. Moreover, in the transverse direction, the stress intensity strongly depends on the welding procedure used. These stresses are then added to those produced by the contraction of the base metal.
(a) 
Effect of welding speed on residual stress
In this part of the study, we are interested in the effect of welding parameters on the evolution of residual stresses; this topic has been addressed in many experimental studies [34,35,36,37]. Interest is focused on the welding speed, which can play a role in the evolution of residual stresses. The variation of the welding speed considered is to find the effect of the speed on the evolution of residual stresses; for this we selected a range of welding speeds V = 140 ,   180 ,   and   220   mm / Min to be able to predict this evolution of RS. The RS values are distributed along the plate as shown in Figure 12.
When we talk about welding speed, we are talking about welding efficiency. Welding efficiency is typically between 0.6 and 0.8, according to Figure 13. In better welding conditions, the choice of the upper limit of 0.8 corresponds to the appropriate welding of the TIG process. Its impact on the RS field is shown in Figure 11, which represents the distribution of RS as a function of distance for each selected speed, ranging from 140   mm / Min to 220   mm / min . It can be seen that increasing the speed of the welding process caused a decrease in the value of the RS; austenitic transformations when passing the torch at high speed accompanied by an increase in volume will not be complete.
This phase transformation in the weld seam and in the surrounding region has the consequence of inducing a residual compressive stress field in the weld zone, which is superimposed on the tensile stress field, due to the thermal gradient. During the solidification of the filler metal and its subsequent cooling, the contraction of the weld seam is prevented by the rest of the plate, and thermomechanical forces are generated.
The welding rate directly governs the growth rate of the solidification front, and thereby, the shape of the weld pool as well. The heterogeneity of the weld could be greatly reduced when the welding speed increases. The use of a more appropriate welding speed causes irreversible defects during the welding operation, such as lack of fusion or sticking, porosities, lack of filler metal penetration, etc.
The slow welding speed results in a temperature higher than the melting temperature of the metal. This affects the course of the welding by the influence of this temperature, as well as the solidification of the metal and the sticking of the two ends to be welded. The high welding speed turns out to be too high, leading to the risk of the two ends to be welded not sticking, and the melting temperature of the metal will be delayed. Consequently, an optimal speed can be determined, which ensures the assembly of welding and the bonding of the two ends to be welded from the start until the end of welding with perfect welding.
(b) 
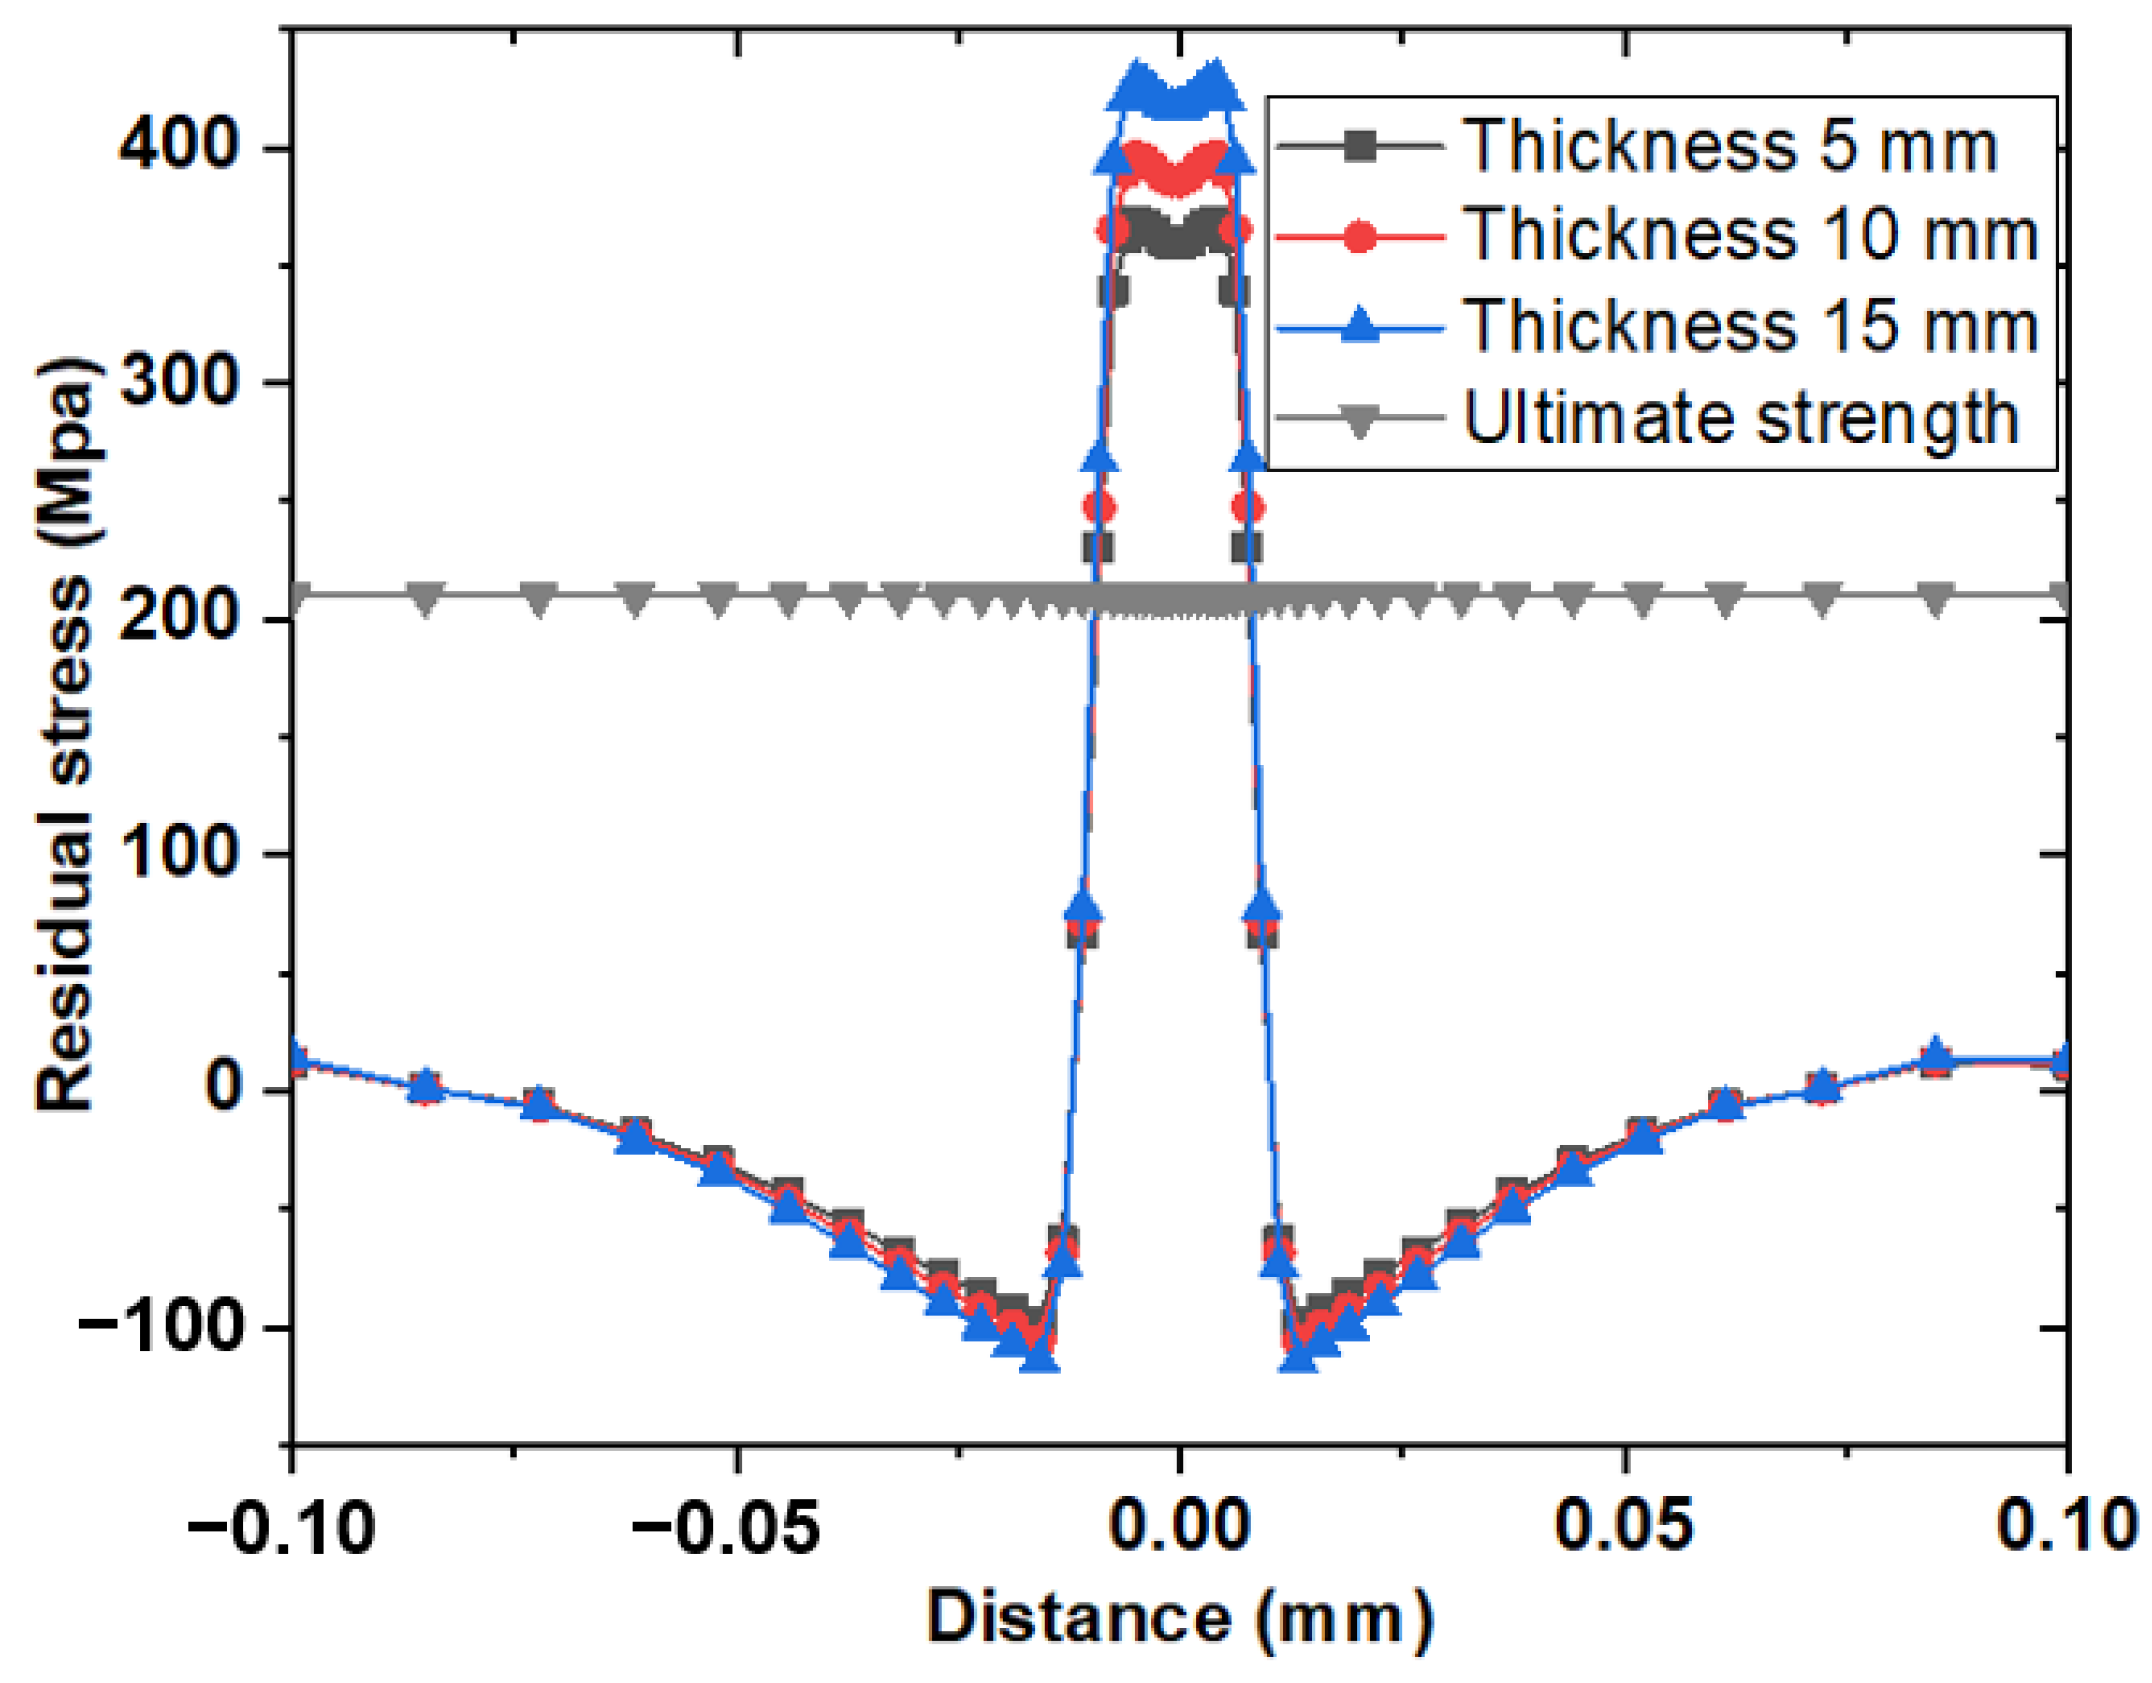
Effect of thickness on residual stress
To make sure a welded structure performs satisfactorily, the quality of the welds must be determined by adequate testing procedures. Therefore, they are proof tested under conditions that are the same or more severe than those encountered by the welded structures in the field. For this purpose, the study of the effect of the thickness of welded pieces on the RS was chosen. We made sure to use all previous simulation inputs, with only a change in the thickness of the welded plates to e = 5, 10 and 15 mm. The RS for different thickness values is distributed along the plate shown in the Figure 14.
As a weld pass cools, the material is likely to form brittle structures. The appearance of these phases depends on the nature of the material but also on the thickness to be welded and the welding energy. In order to avoid the formation of this type of structure, it is preferable to maintain the solder at a temperature of around 200 °C. In Figure 13, interest is focused on the effect of the thickness to be welded on the RS field; the pace generated during the realization of the welding operation shows compressive stresses near the joint to be welded, and a maximum is reached in the middle caused by tensile stresses. However, the amplitude of the stresses increases with the thickness according to the elastic limit of the material. In the case of low thickness, the plastic flow during the solidification of the filler metal generated by tensile stresses is faster and restrained by contracting stresses in the surrounding regions. The maximum temperature is reached during a short time relative to high thickness, producing transformations of austenitic phases. Our numerical results are consistent with a large number of experimental work done by [39,40].

4.2. Metallurgical Transformation

(a) 
Analysis metallographic
It is well known that the elevation and reduction of temperature to significant levels always leads to structural transformations and reorganization of atoms in materials; in this sense the welding process always induces these transformations. Experimental tests of micrographic analysis are carried out by technical procedures on stainless steel samples. Welding simulation tests are made for assembly of two plates and two pipes to prove the existence of residual stresses from where the structural transformations and reorganization of atoms in material is induced by the welding operation. The last one needs to be examined to determine the elements that will form the new areas of the material. This examination has only been done through experimental tests with micrographic analysis. Samples that were intended for metallographic observations were taken from the transverse section to the welding direction of the welded joint; they were prepared using conventional techniques. The mechanical polishing was done using 0.5   μ m alumina powder and water polish for the purpose of obtaining a mirror state. Then, the sample was exposed to electrolytic etching in 10% oxalic acid at 4 Volts, for a period of 50 s. The microstructural analysis of the different zones of the weld joint, namely, the base metal (BM), HAZ, and weld zone (WZ), was carried out using the optical microscope Nikon Eclipse LV100ND, as illustrated in Figure 15.
With regard to Figure 16, it shows the microstructure of the 304 austenitic stainless- steel BM which consists of equiaxed (coaxial) austenite grains of several sizes, limited by grain boundaries. Moreover, twin crystals can be observed in the austenitic matrix (γ) in addition to small amounts of delta ferrite (δ) in the grain boundaries. No carbide precipitate was found in the microstructures, a consequence of the good annealing treatment that was applied after cold rolling [32,41].
As for Figure 17, it shows the microstructure of the HAZ of 304 austenitic stainless- steel. The structure subjected to the rolling process transforms into dendrite-like grains as the welding heat input increases towards the weld centerline. Consequently, the ZAT when approaching the fusion zone (FZ) suffers an increase in the austenitic grain size. Similarly, it is observed that a delta ferrite phase is not produced in that zone and that the annealing twins are formed more effectively [42,43].
As explicitly illustrated in Figure 18, the structure of the weld metal is very fine in comparison with the BM structure. Indeed, it has a dendritic solidification aspect; it involves two phases: the austenitic γ-phase and the δ-ferrite phase. It is characterized by a vermicular morphology [44,45].
(b) 
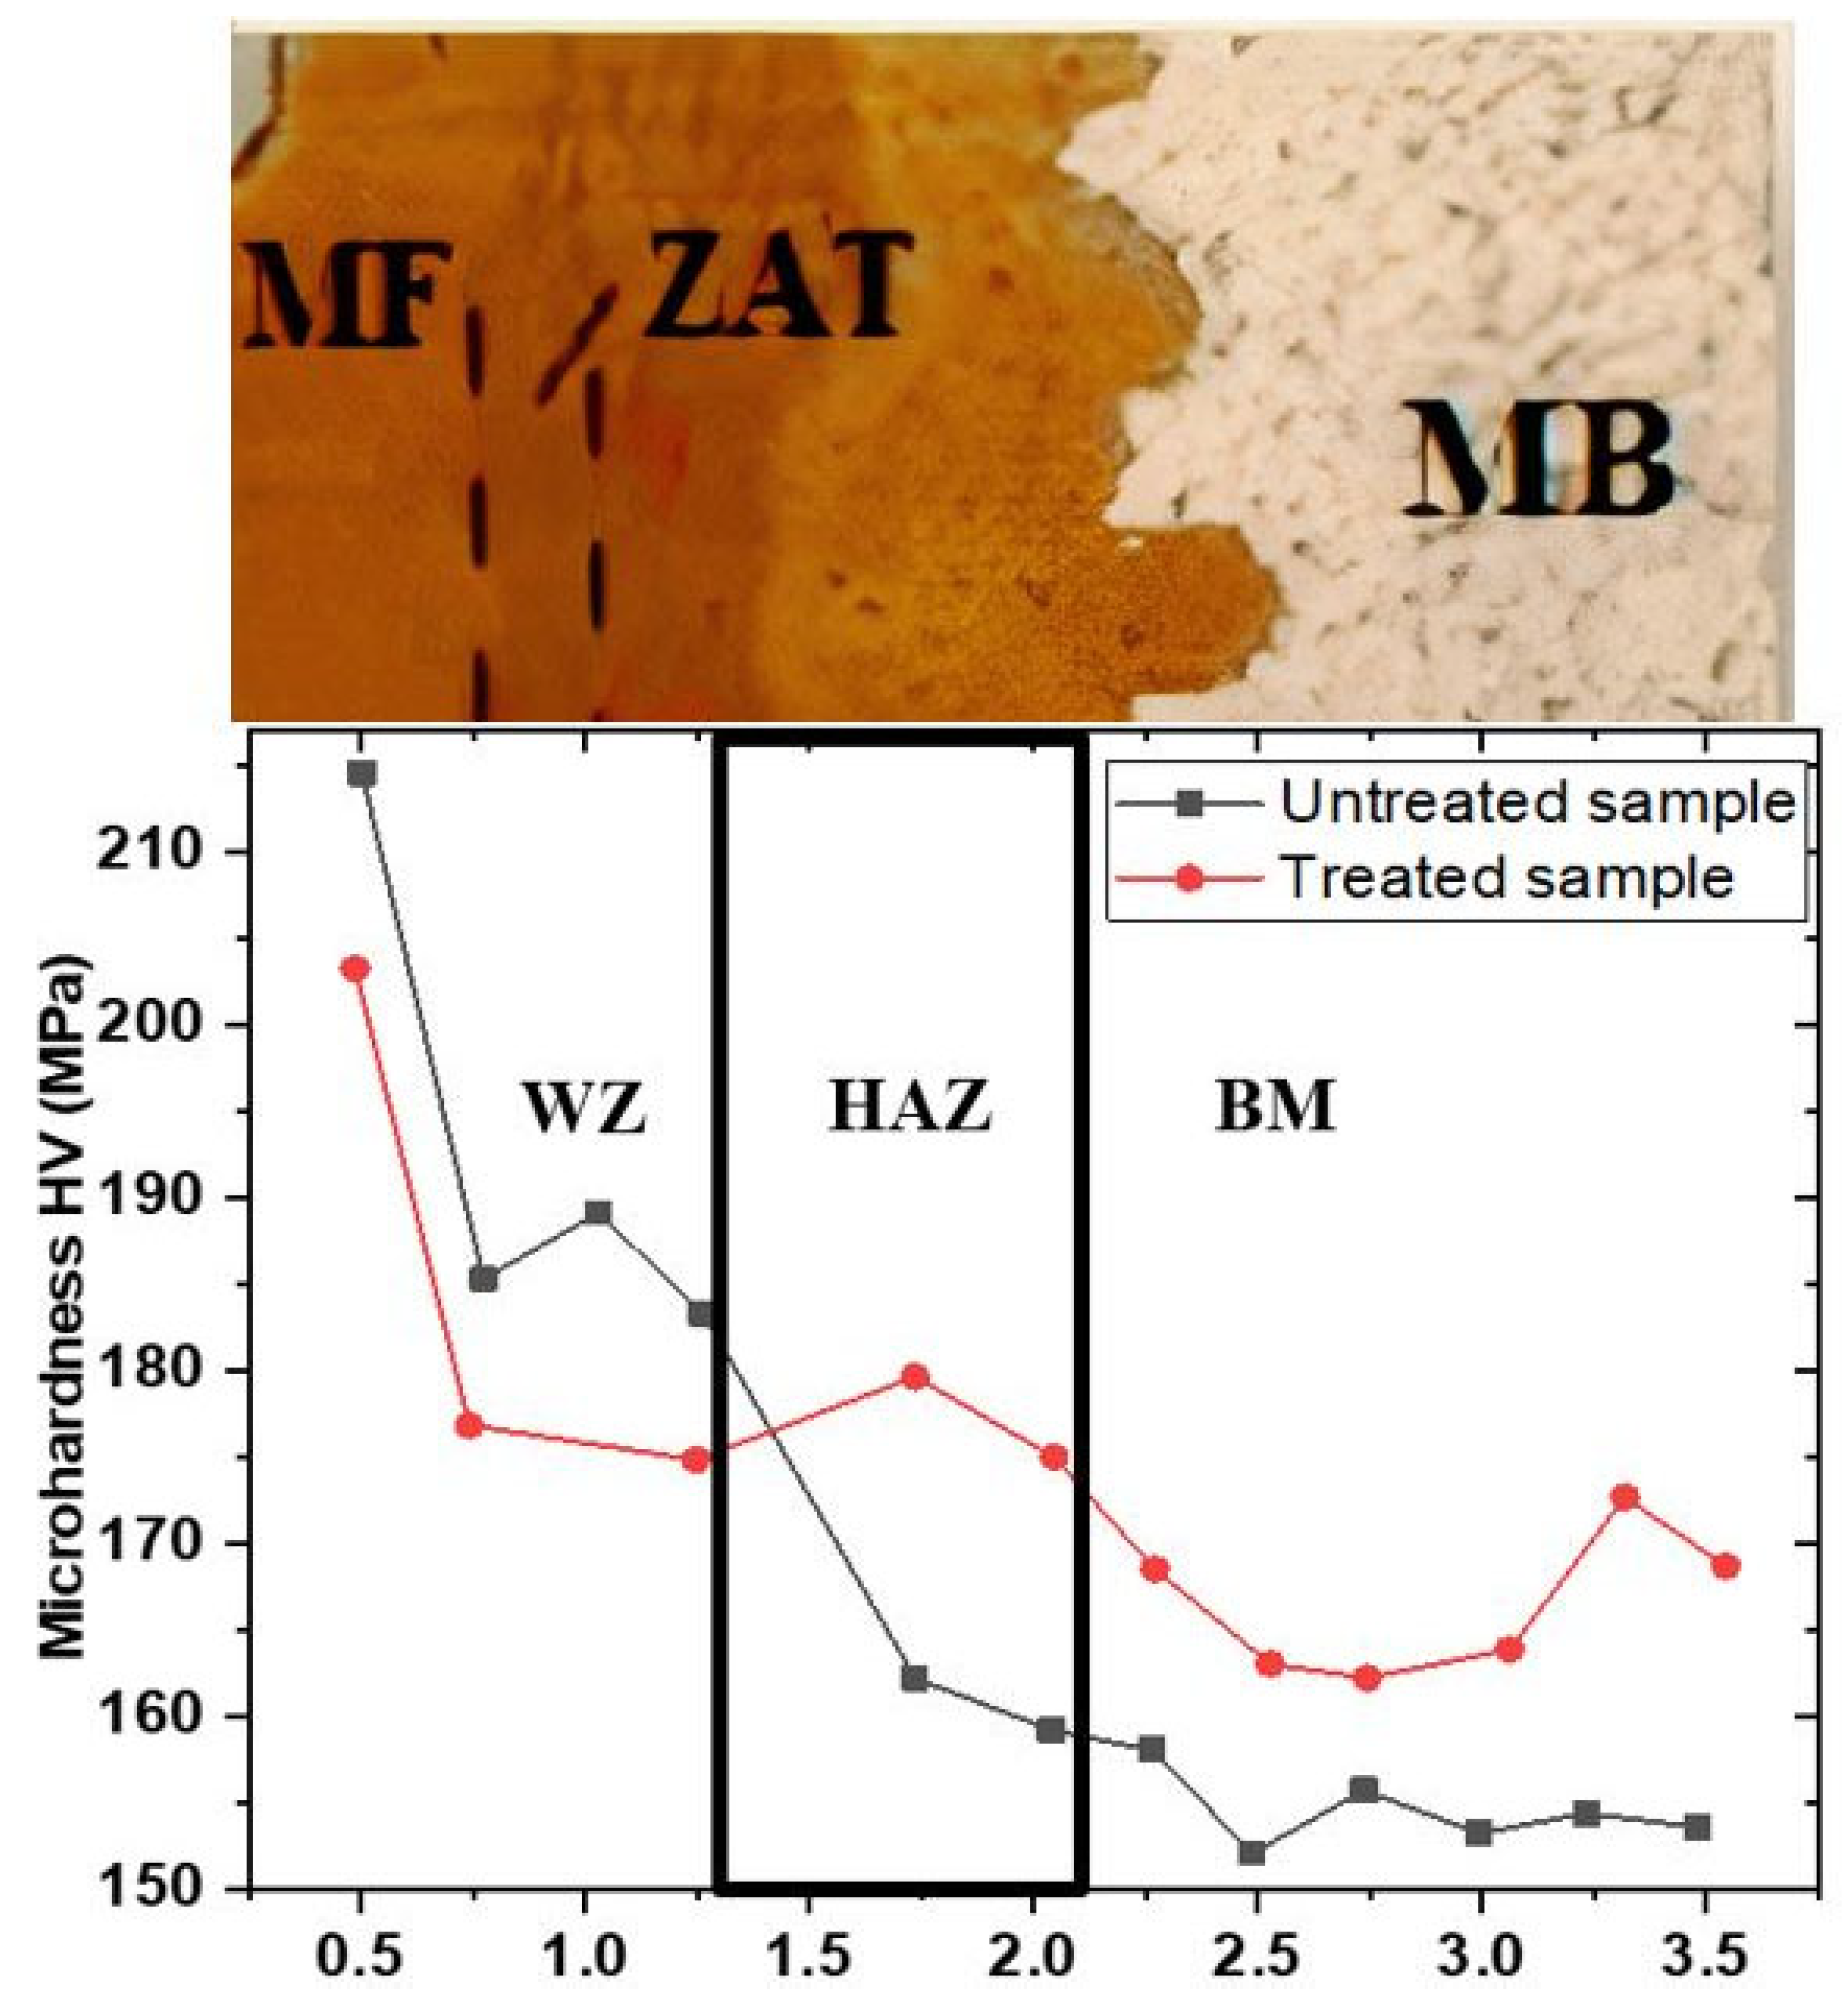
Analysis by HV microhardness test
A detention treatment is carried out after welding, which consists in evaluating the effect induced by the residual stresses using Vickers microhardness measurements (HV); this also makes it possible to highlight the different welding zones and to see the microstructural changes resulting from the welding. Figure 19 shows a decrease in hardness after treatment from the molten zone to the base metal. Thus, the hardness decreases as a function of the maximum temperature reached in the different parts of the material. The hardness tends to stabilize at the base metal zone in both cases (treated and untreated). The base metal that is located in this zone is unaffected by thermal variations. The heat treatment applied to the samples made it possible to reduce the hardness at the level of the molten zone and the increase in the base metal part. This is due to an austenitization during the heating, which is effectively due to an attenuation of the residual stresses.
(c) 
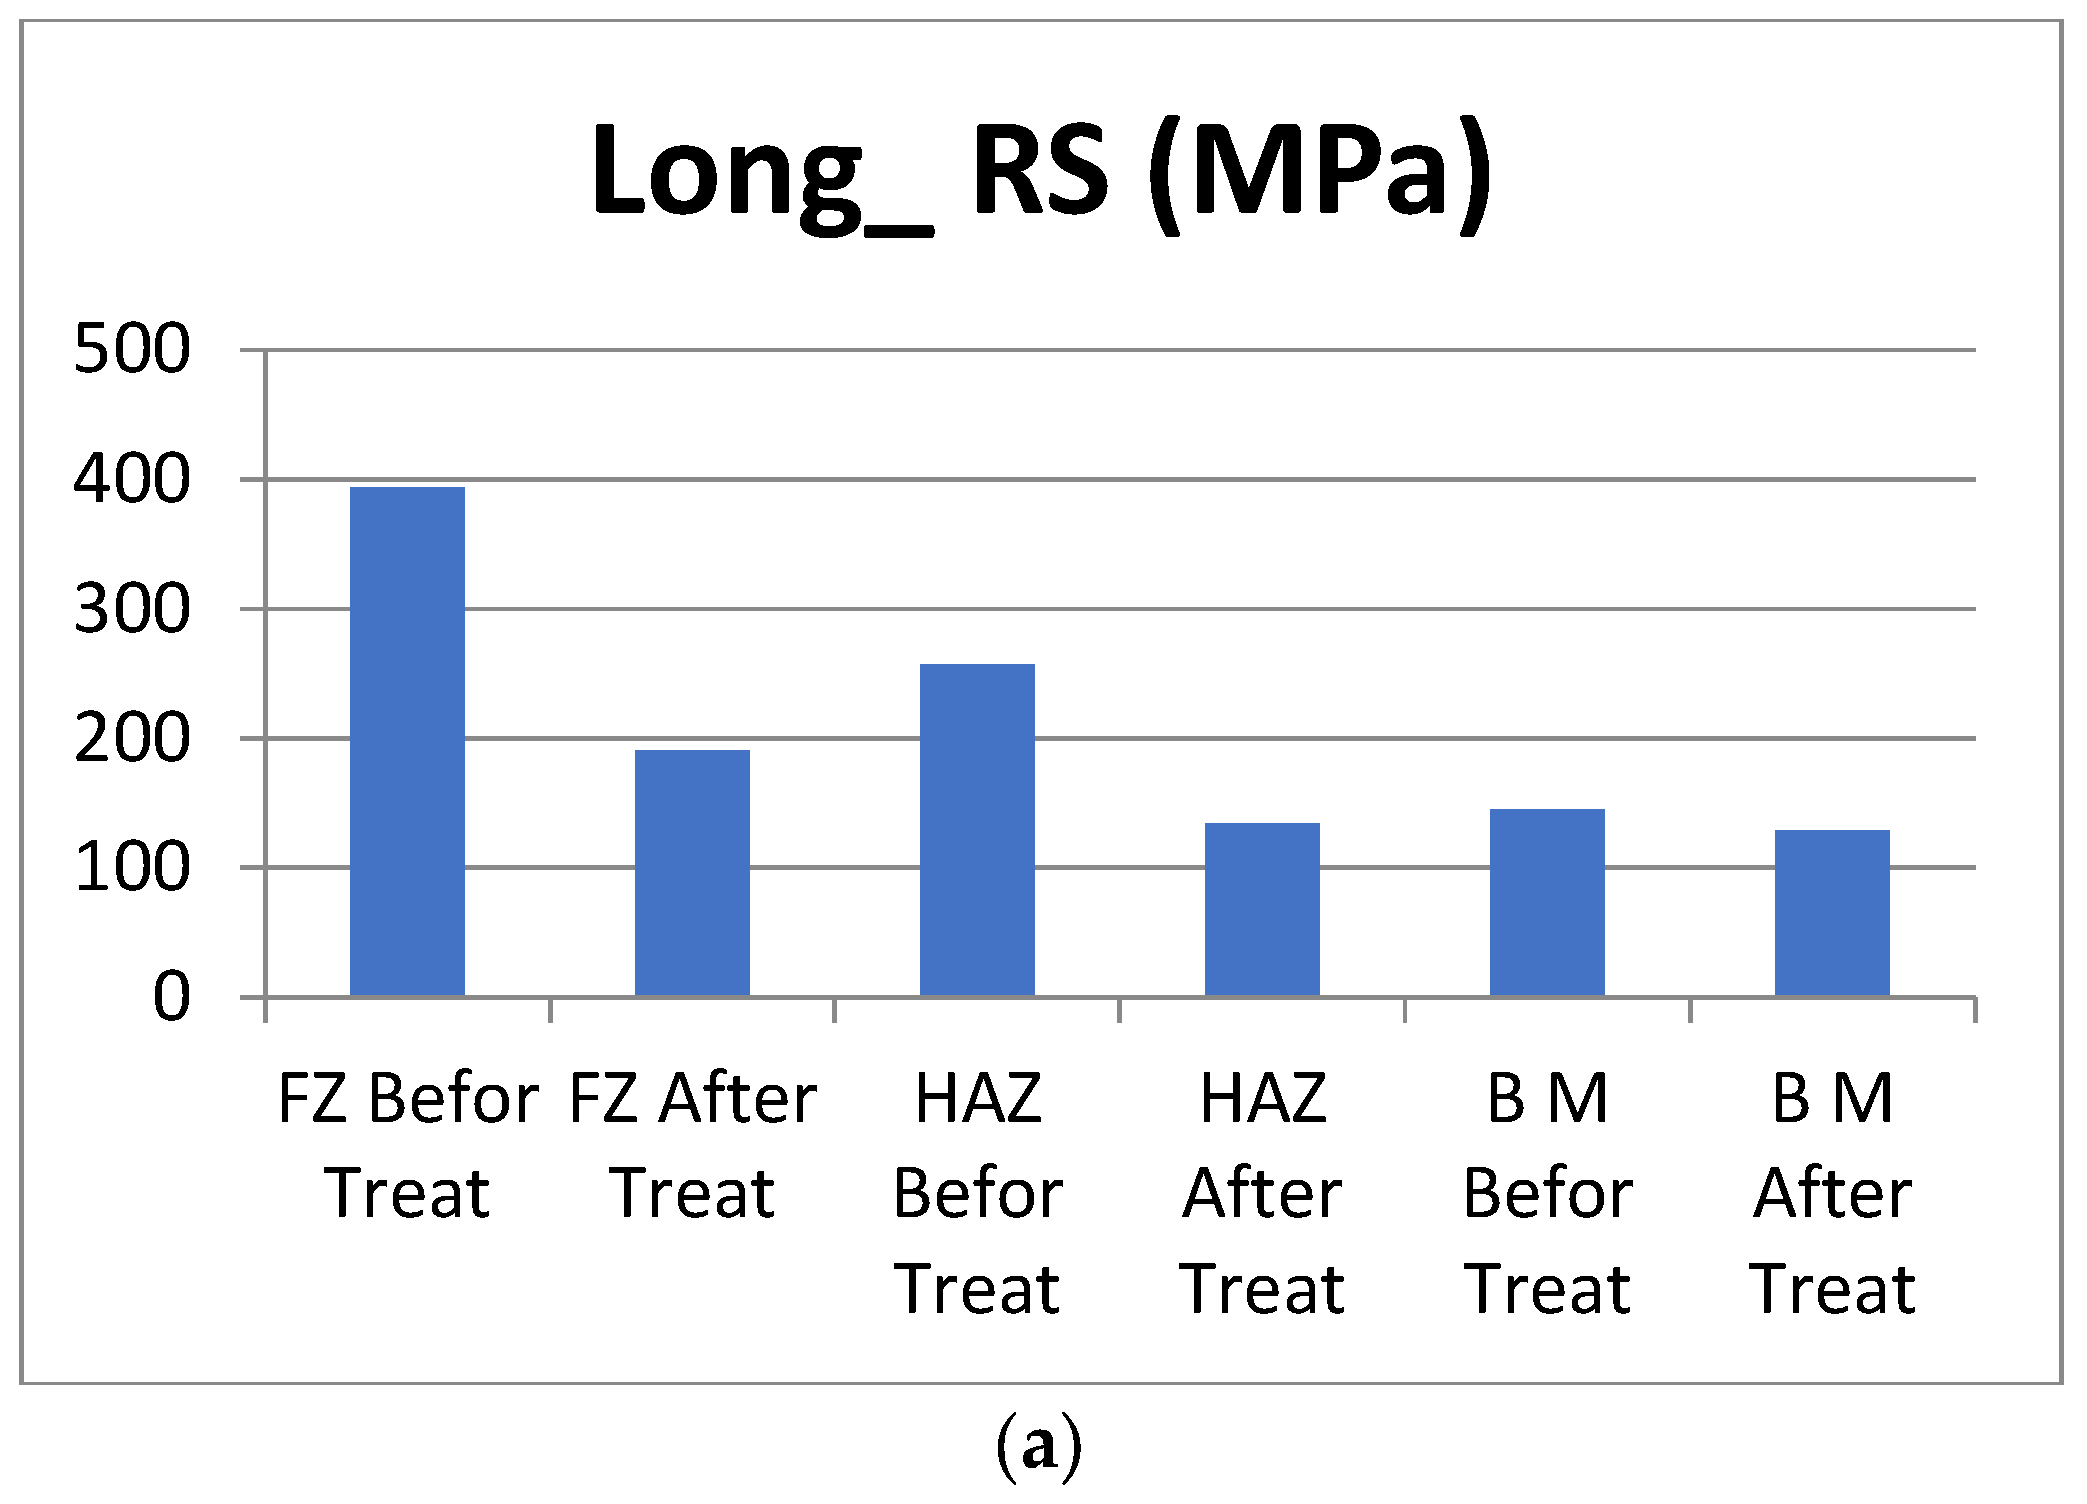
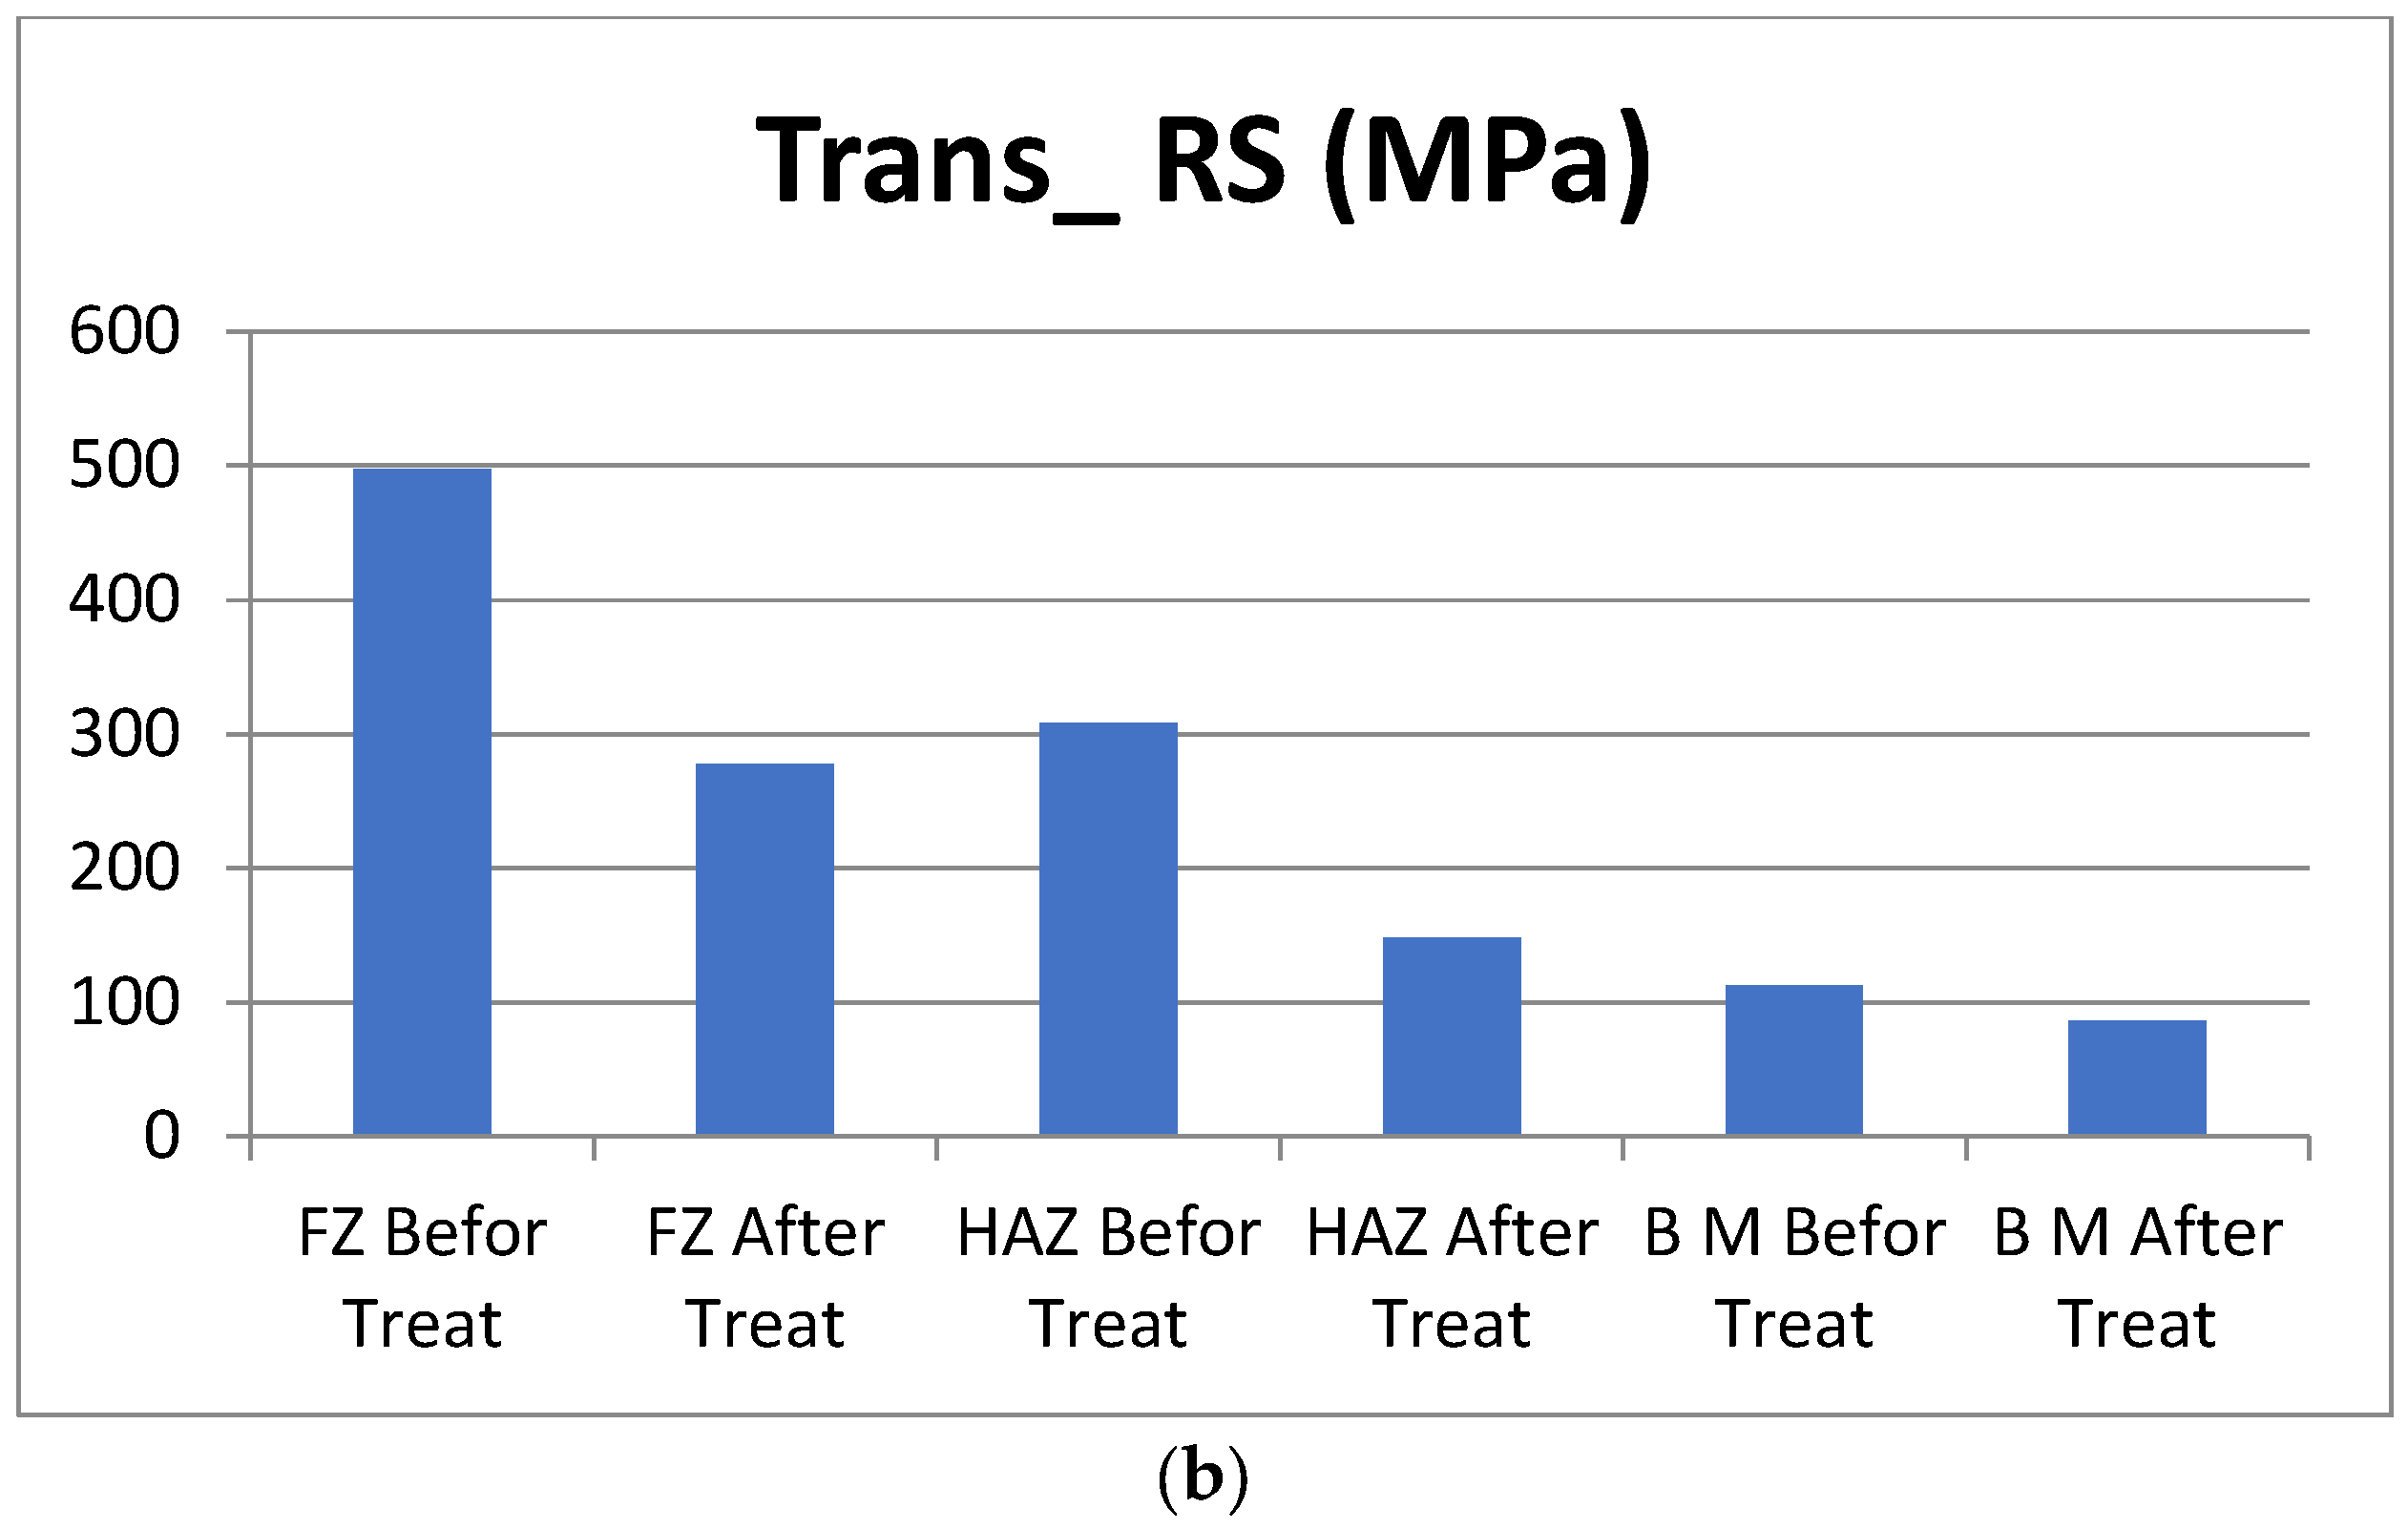
Residual stresses Distribution in the longitudinal and transverse direction of the weld
The experimental method used for the calculation of the residual stresses consists in measuring the deformations by the extensometric method injected into the mathematical expressions. The destruction technic (removal of layers) is used and controlled by the electrochemical means of the samples.
These microdeformation measurements are determined using bidirectional extensometric gauges placed on the opposite face of the weld beads, on the side of the substrate.
The residual stress measurement operation used the following equipment’s: potentiostat and extensometry bridge for measuring deformations (μm/m) for each material removal pass, two gauges (Long and Trans), a digital micrometer for measuring the thickness of the removed layers, and an electropolishing cell.
The removal of a layer of thickness Δh causes a normal force and a bending moment in the remaining thickness, which results in linear variations of the stresses Δ σ l o n g and Δ σ t r a n s . The balance of forces and moments provide the expressions of the longitudinal and transverse residual stresses, according to the deformations which are expressed as follows:
Δ σ l o n g = d h 7 h + d h + h 2 d h h + d h 2 h 2 × E 1 μ 2 Δ ε l o n g + μ . Δ ε t r a n s
Δ σ t r a n s = d h 7 h + d h + h 2 d h h + d h 2 h 2 × E 1 μ 2 Δ ε t r a n s + μ . Δ ε l o n g
where:
E: Young’s modulus (MPa)
μ: Poisson’s ratio
The attenuation of the residual stress intensities in the longitudinal and transverse directions, after the detention treatment operation, is observed in Figure 20 for the three zones (FZ, HAZ and BM), at the level of the melted zone, the RS stresses are attenuated. At a rate of 50%, this leads to a stable structural rearrangement of the material and in the base metal, the reduction is of the order of 30%, which is explained by a weak influence of the thermal gradient in this zone.

5. Conclusions

The present work is split into two parts. The first part focuses on determining the existence of residual stresses numerically and validated with literature results. The second part is interested in the means envisaged to attenuate the amplitudes of these residual stresses by practical means.
It was found that material deposition at high temperatures produces a very large temperature gradient as a consequence of the significant deformations caused to the material. Shrinkage at the weld joint, during the cooling phase, induces some thermal stress disturbance that might store the material. Then it could be added to the operating stresses which are produced by the association of internal pressure and thermal stresses that were in effect during operation. It was demonstrated that successive welding passes amplify the thermal stress concentration phenomenon. Therefore, it was deemed necessary to undertake a numerical study for the purpose of assessing the effect induced by welding on the RS of SUS304 stainless steel.
The present work allowed drawing the following conclusions:
-
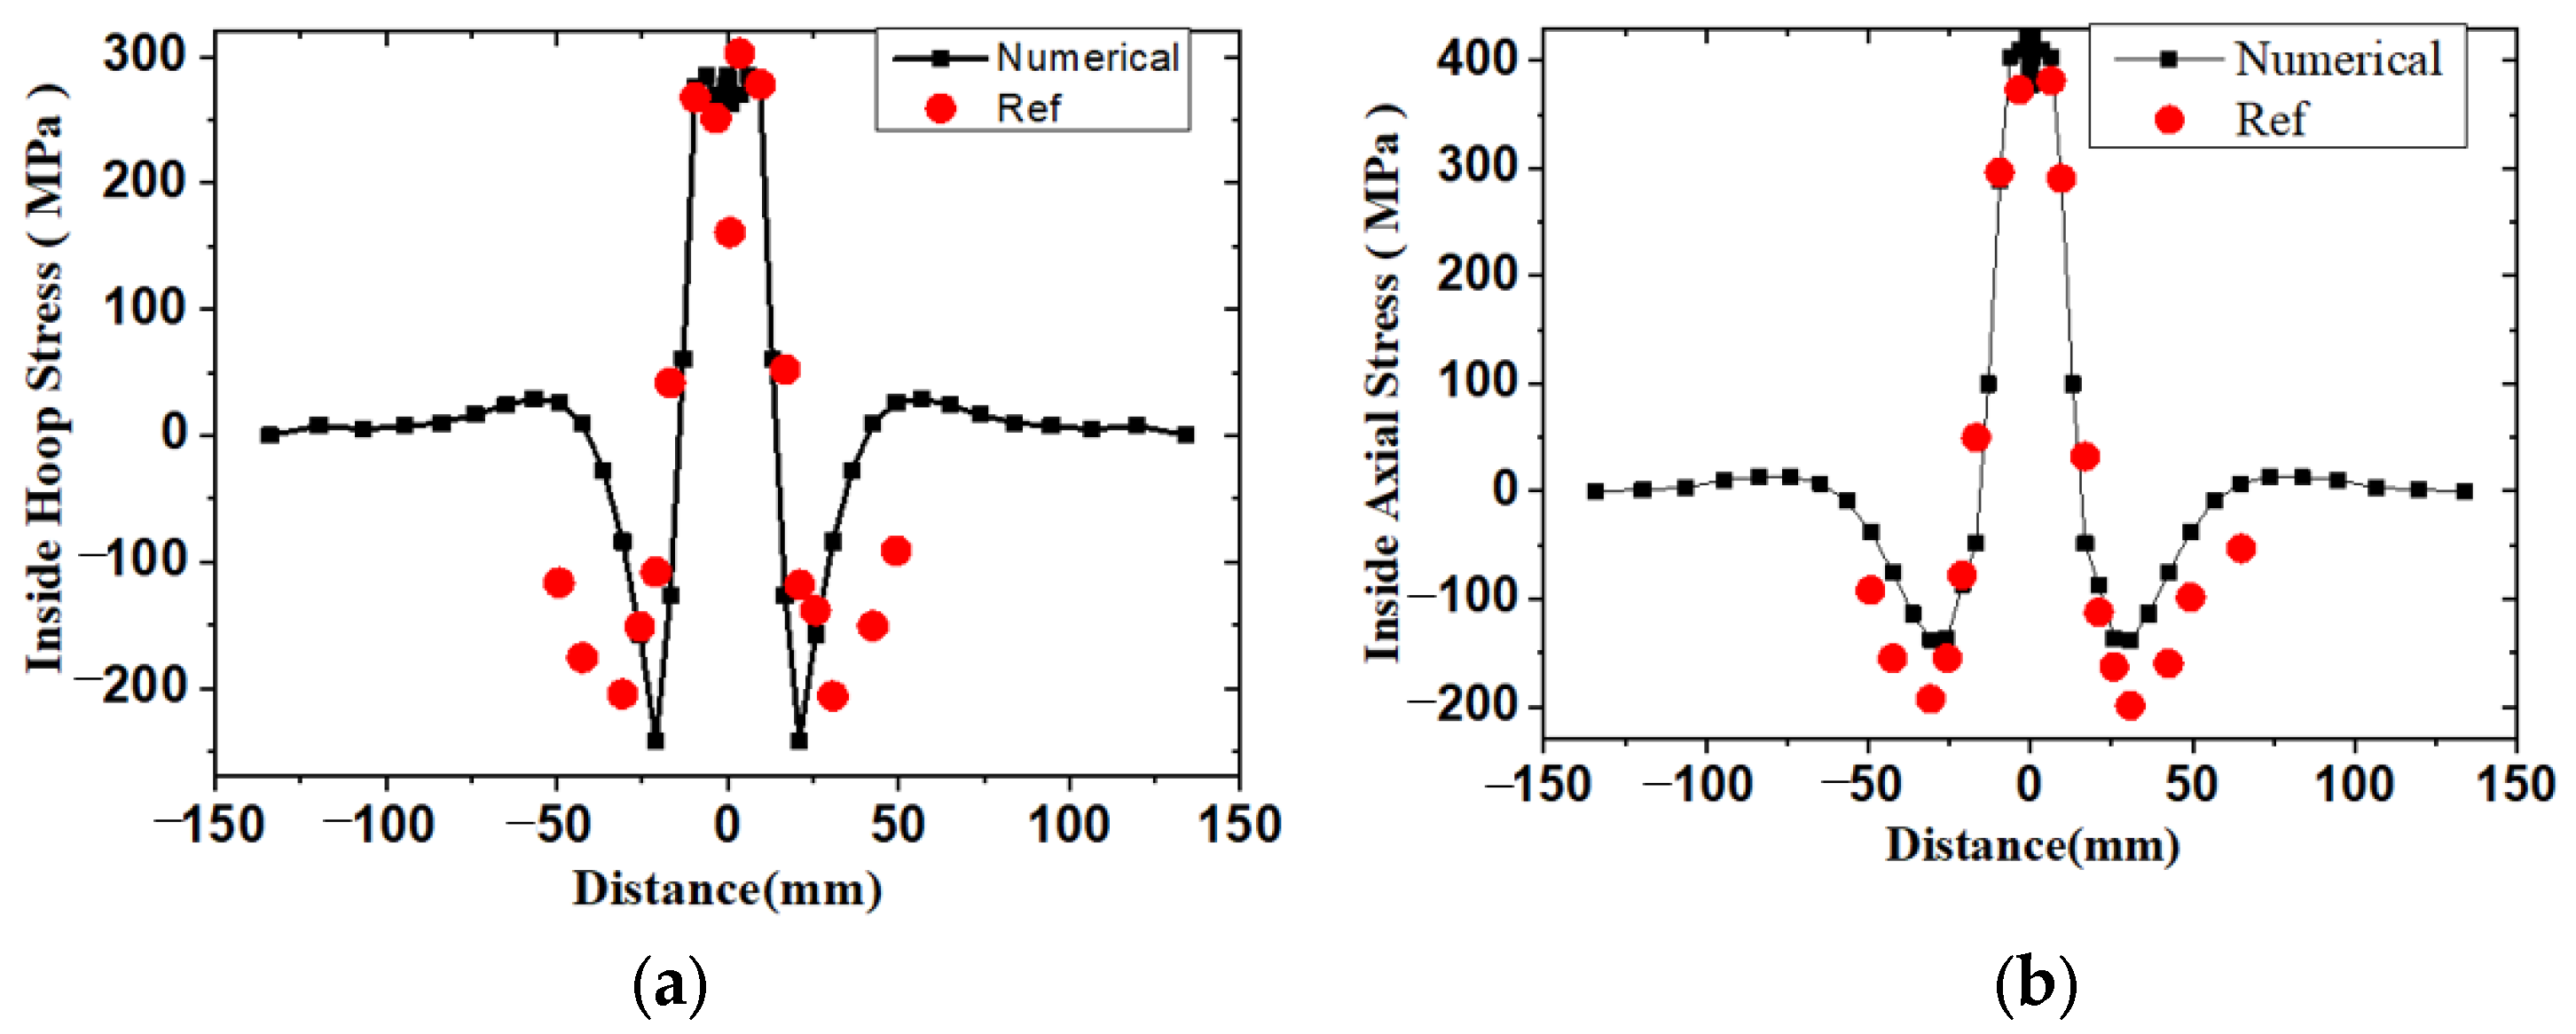
The results obtained for the RS distribution using the finite element model are in agreement with those provided by the reference [33] (experimental values).
-
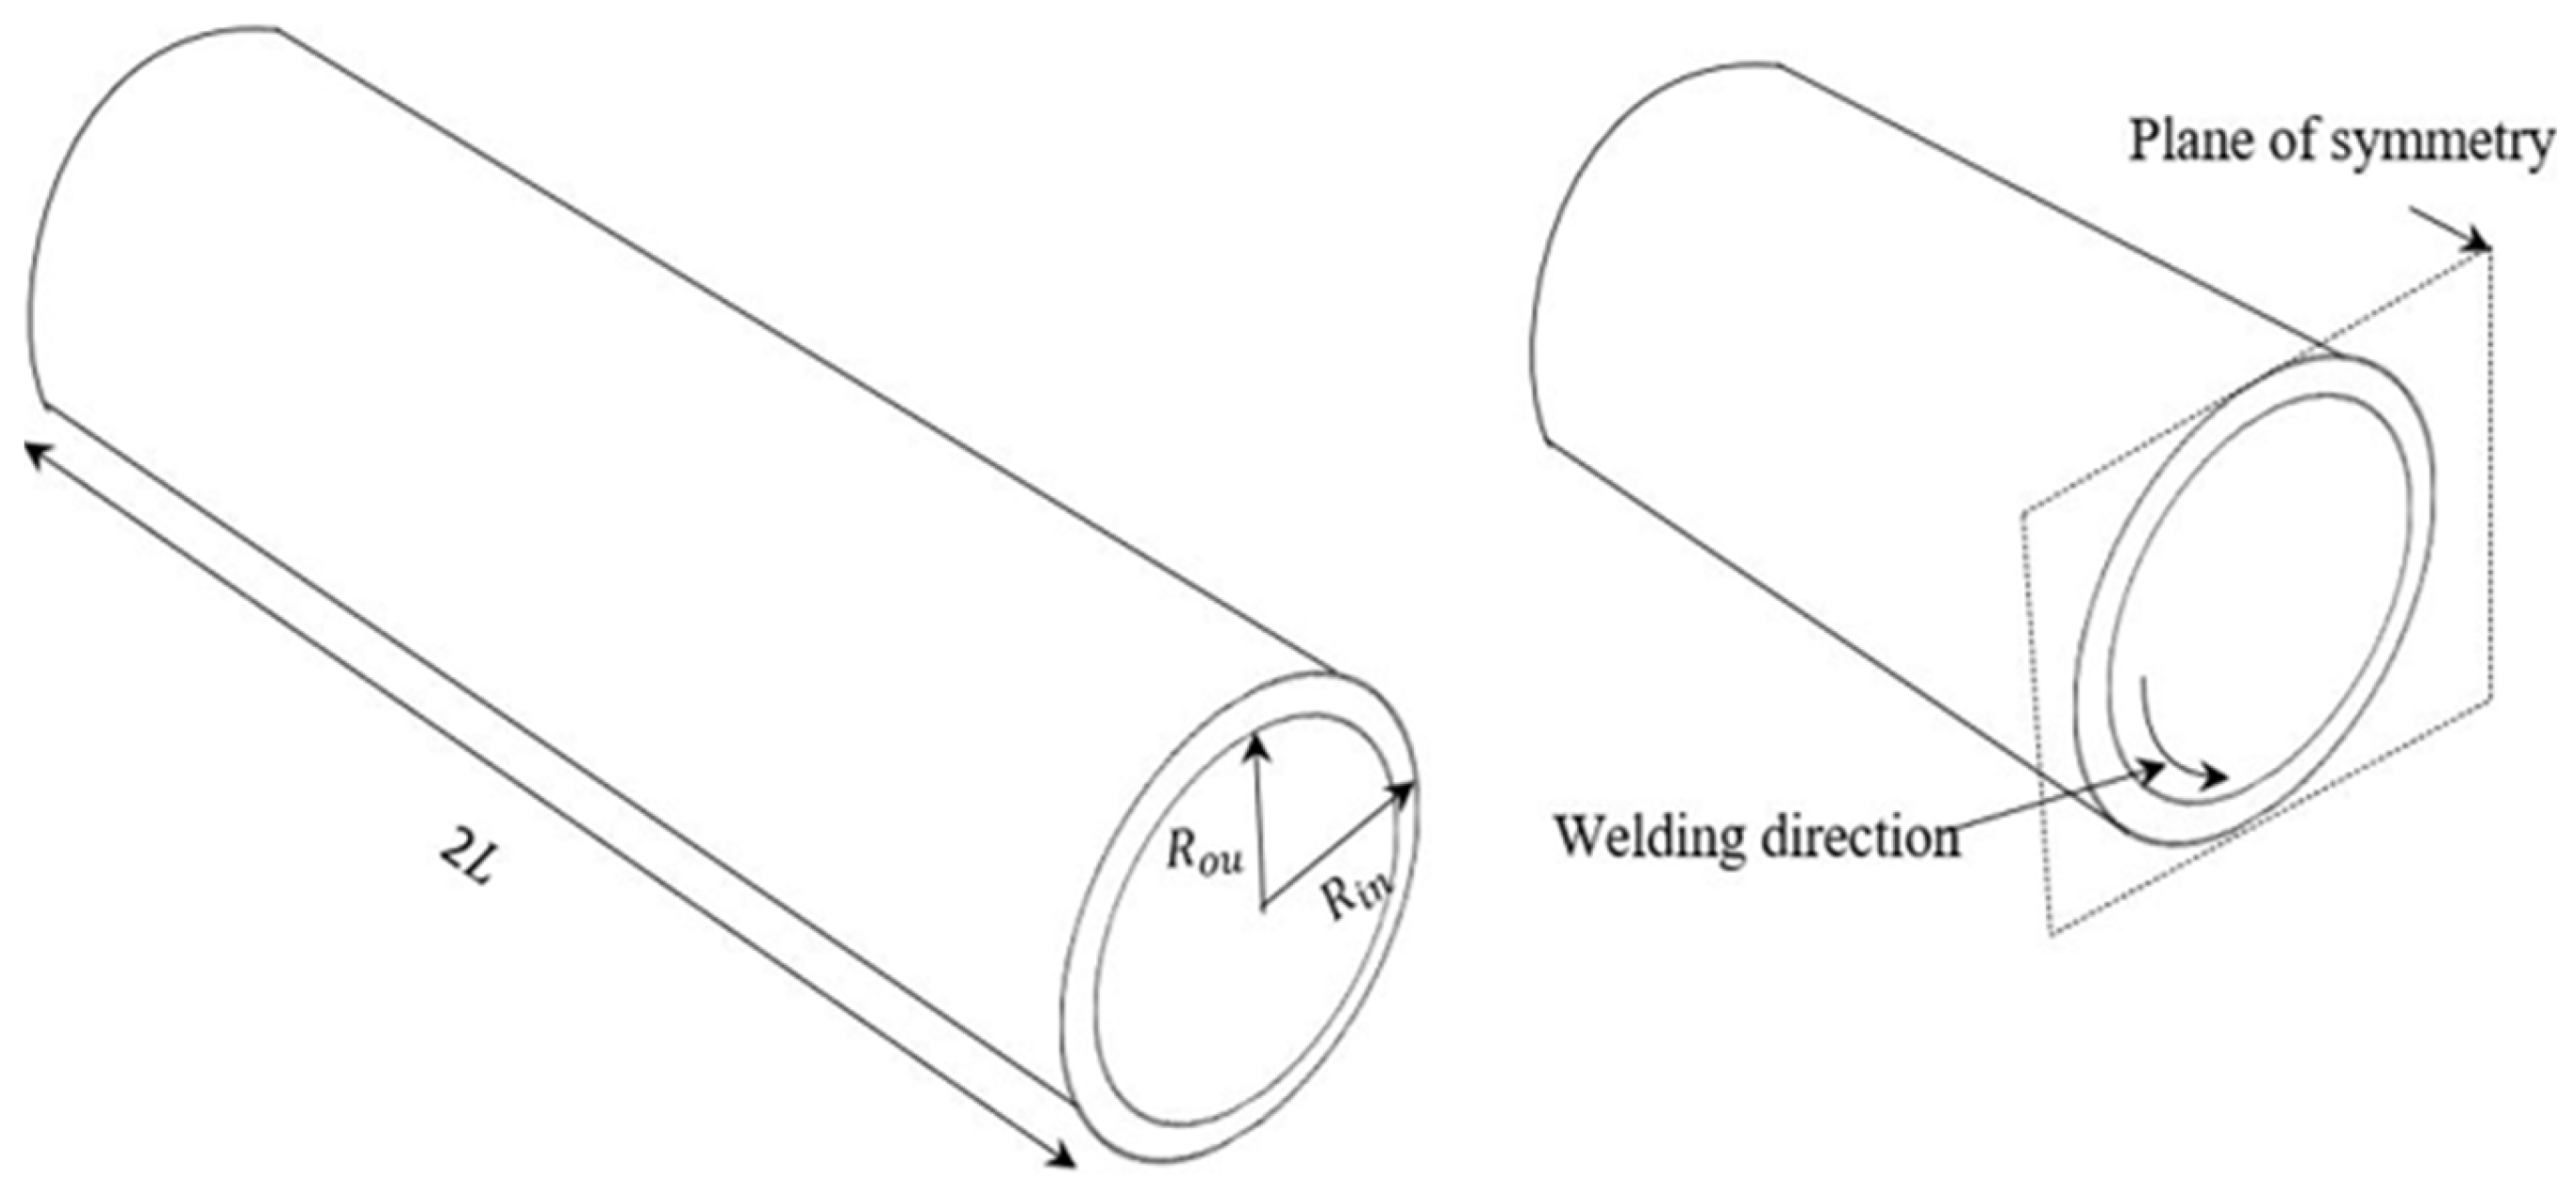
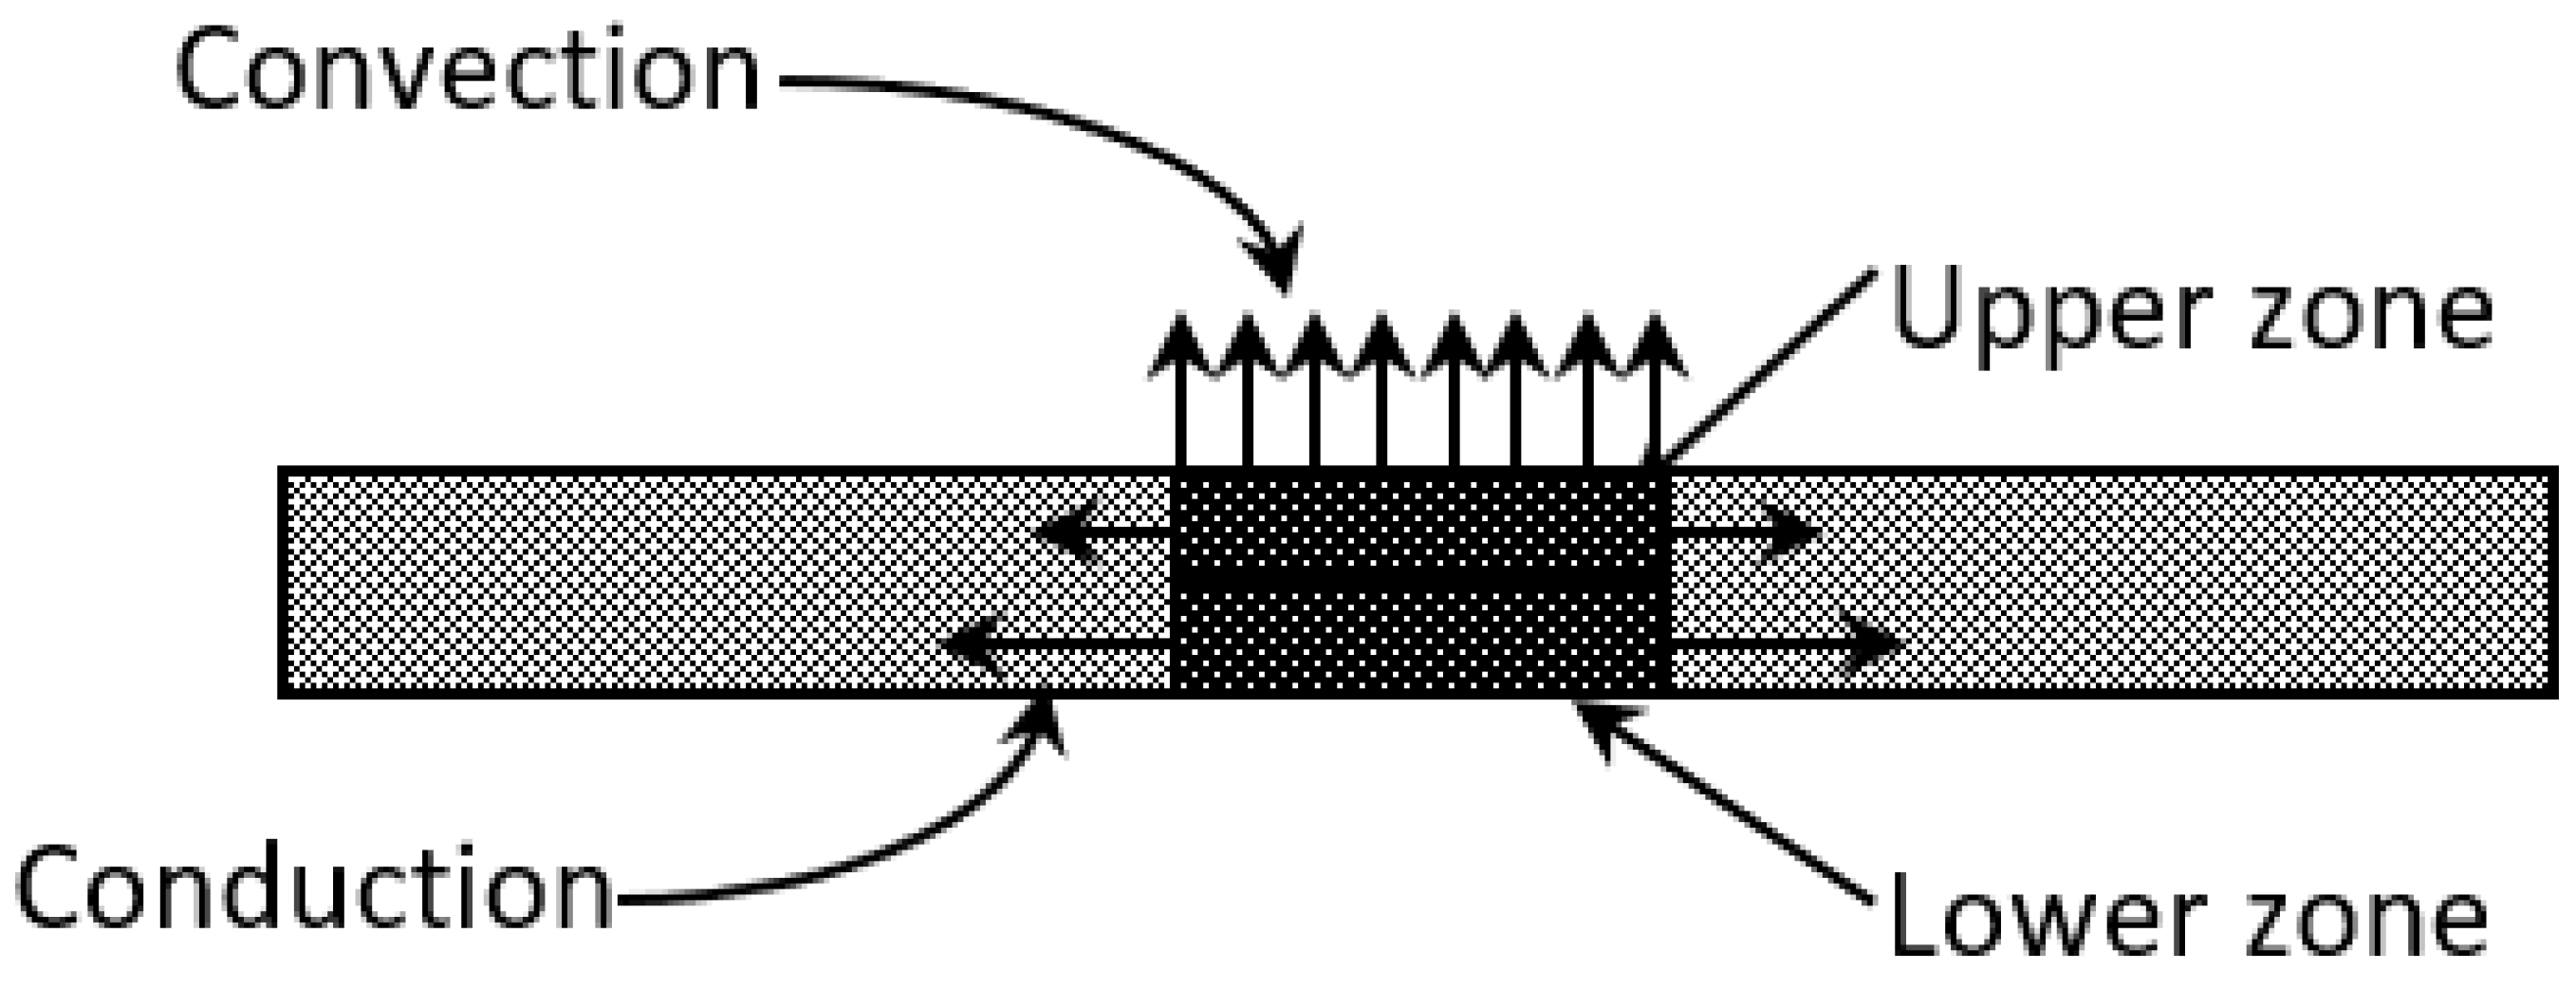
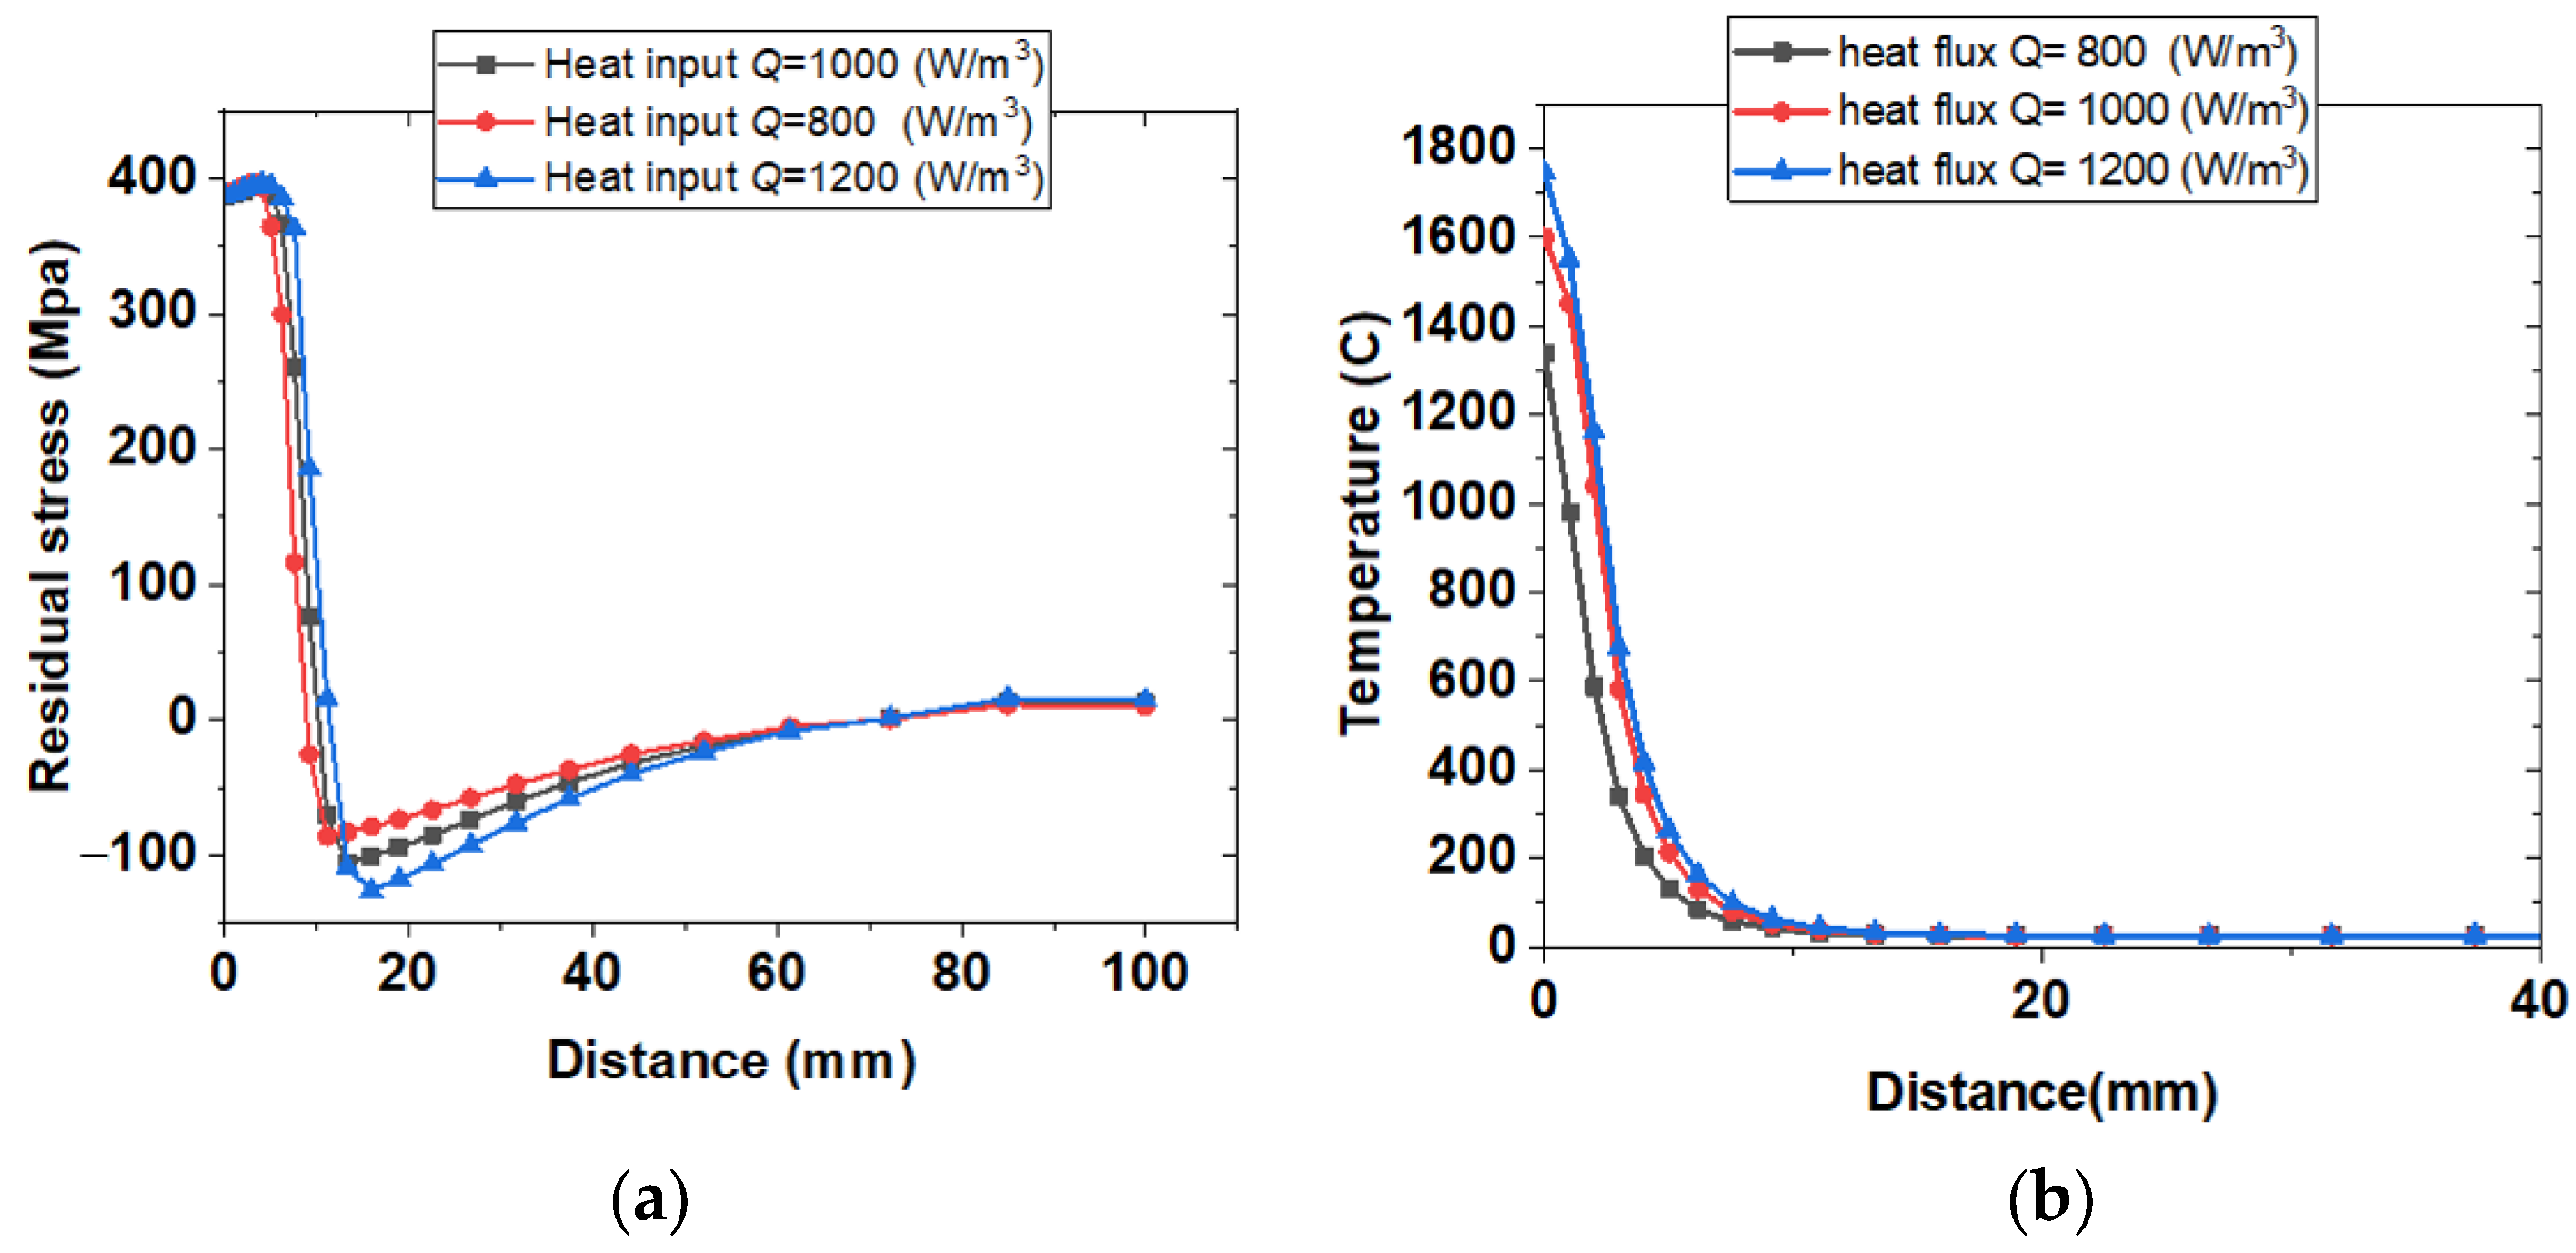
According to the results simulated by the 3-D model and based on the reference data, the temperature distribution around the heat source is constant while the welding torch goes around the stainless-steel pipe.
-
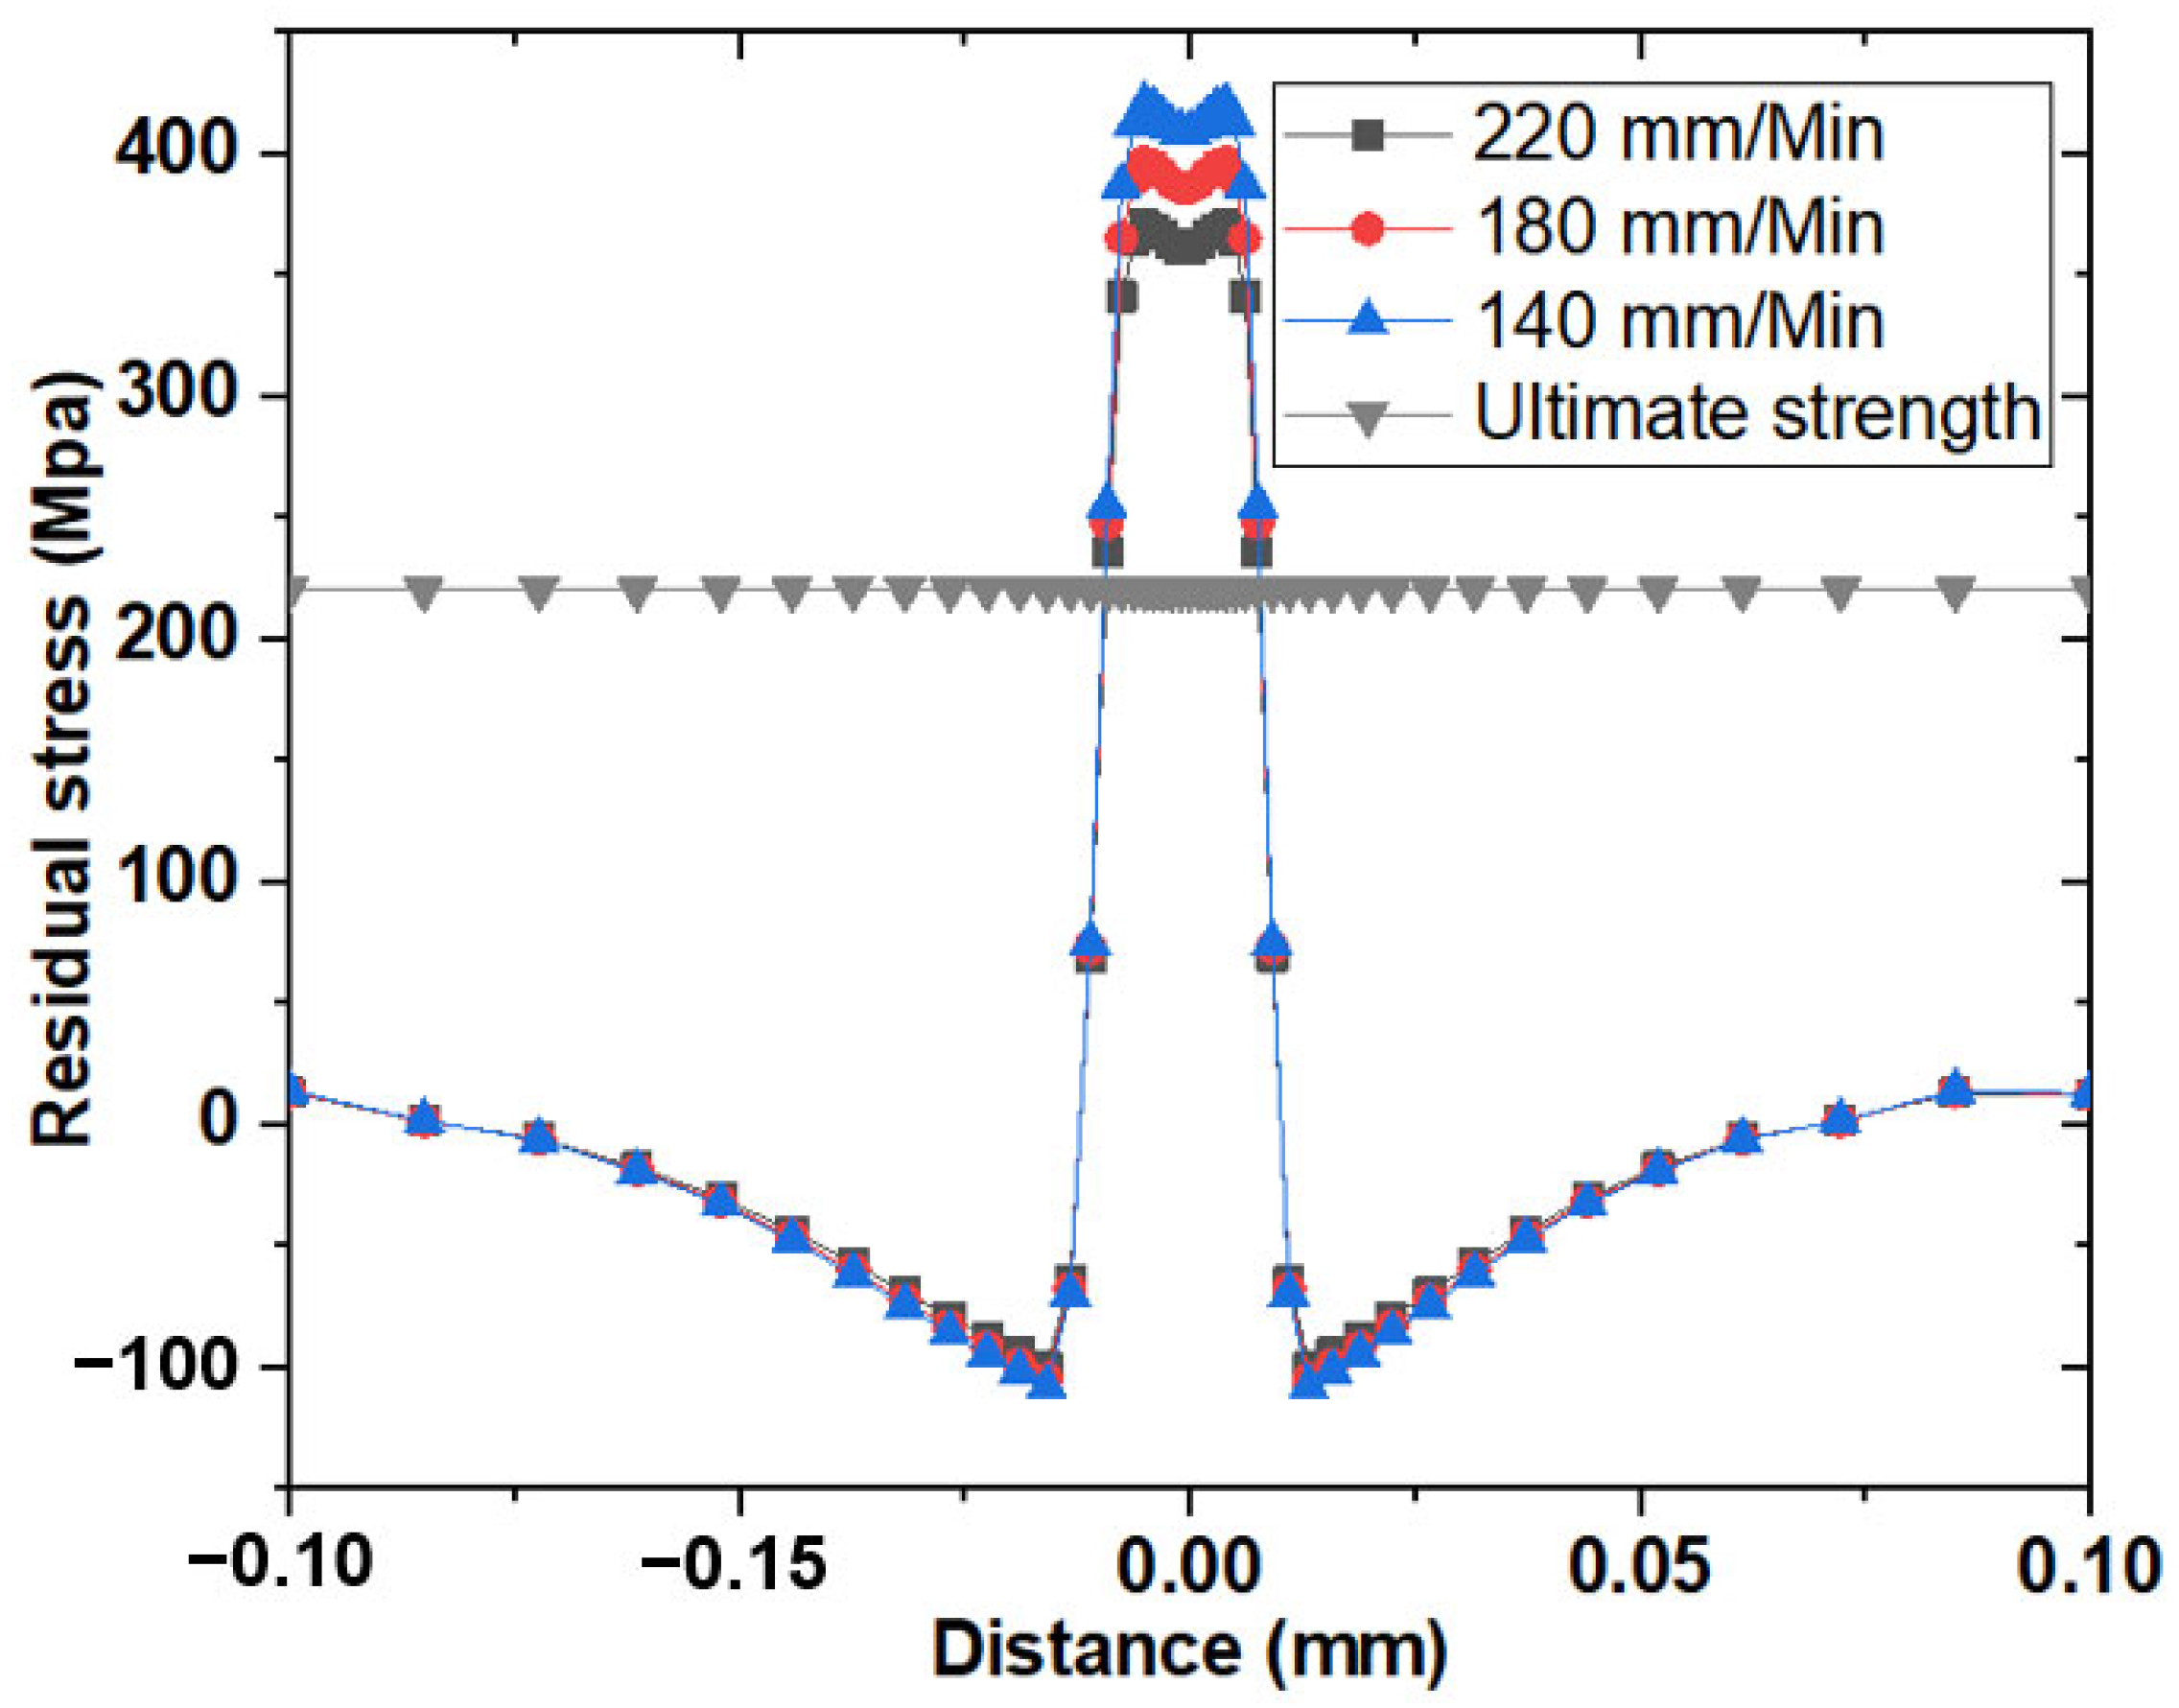
The welding RS peak values are located within the HAZ of the weld metal, which explains the appearance of a fracture in that zone when the mechanical parts are put into operation.
-
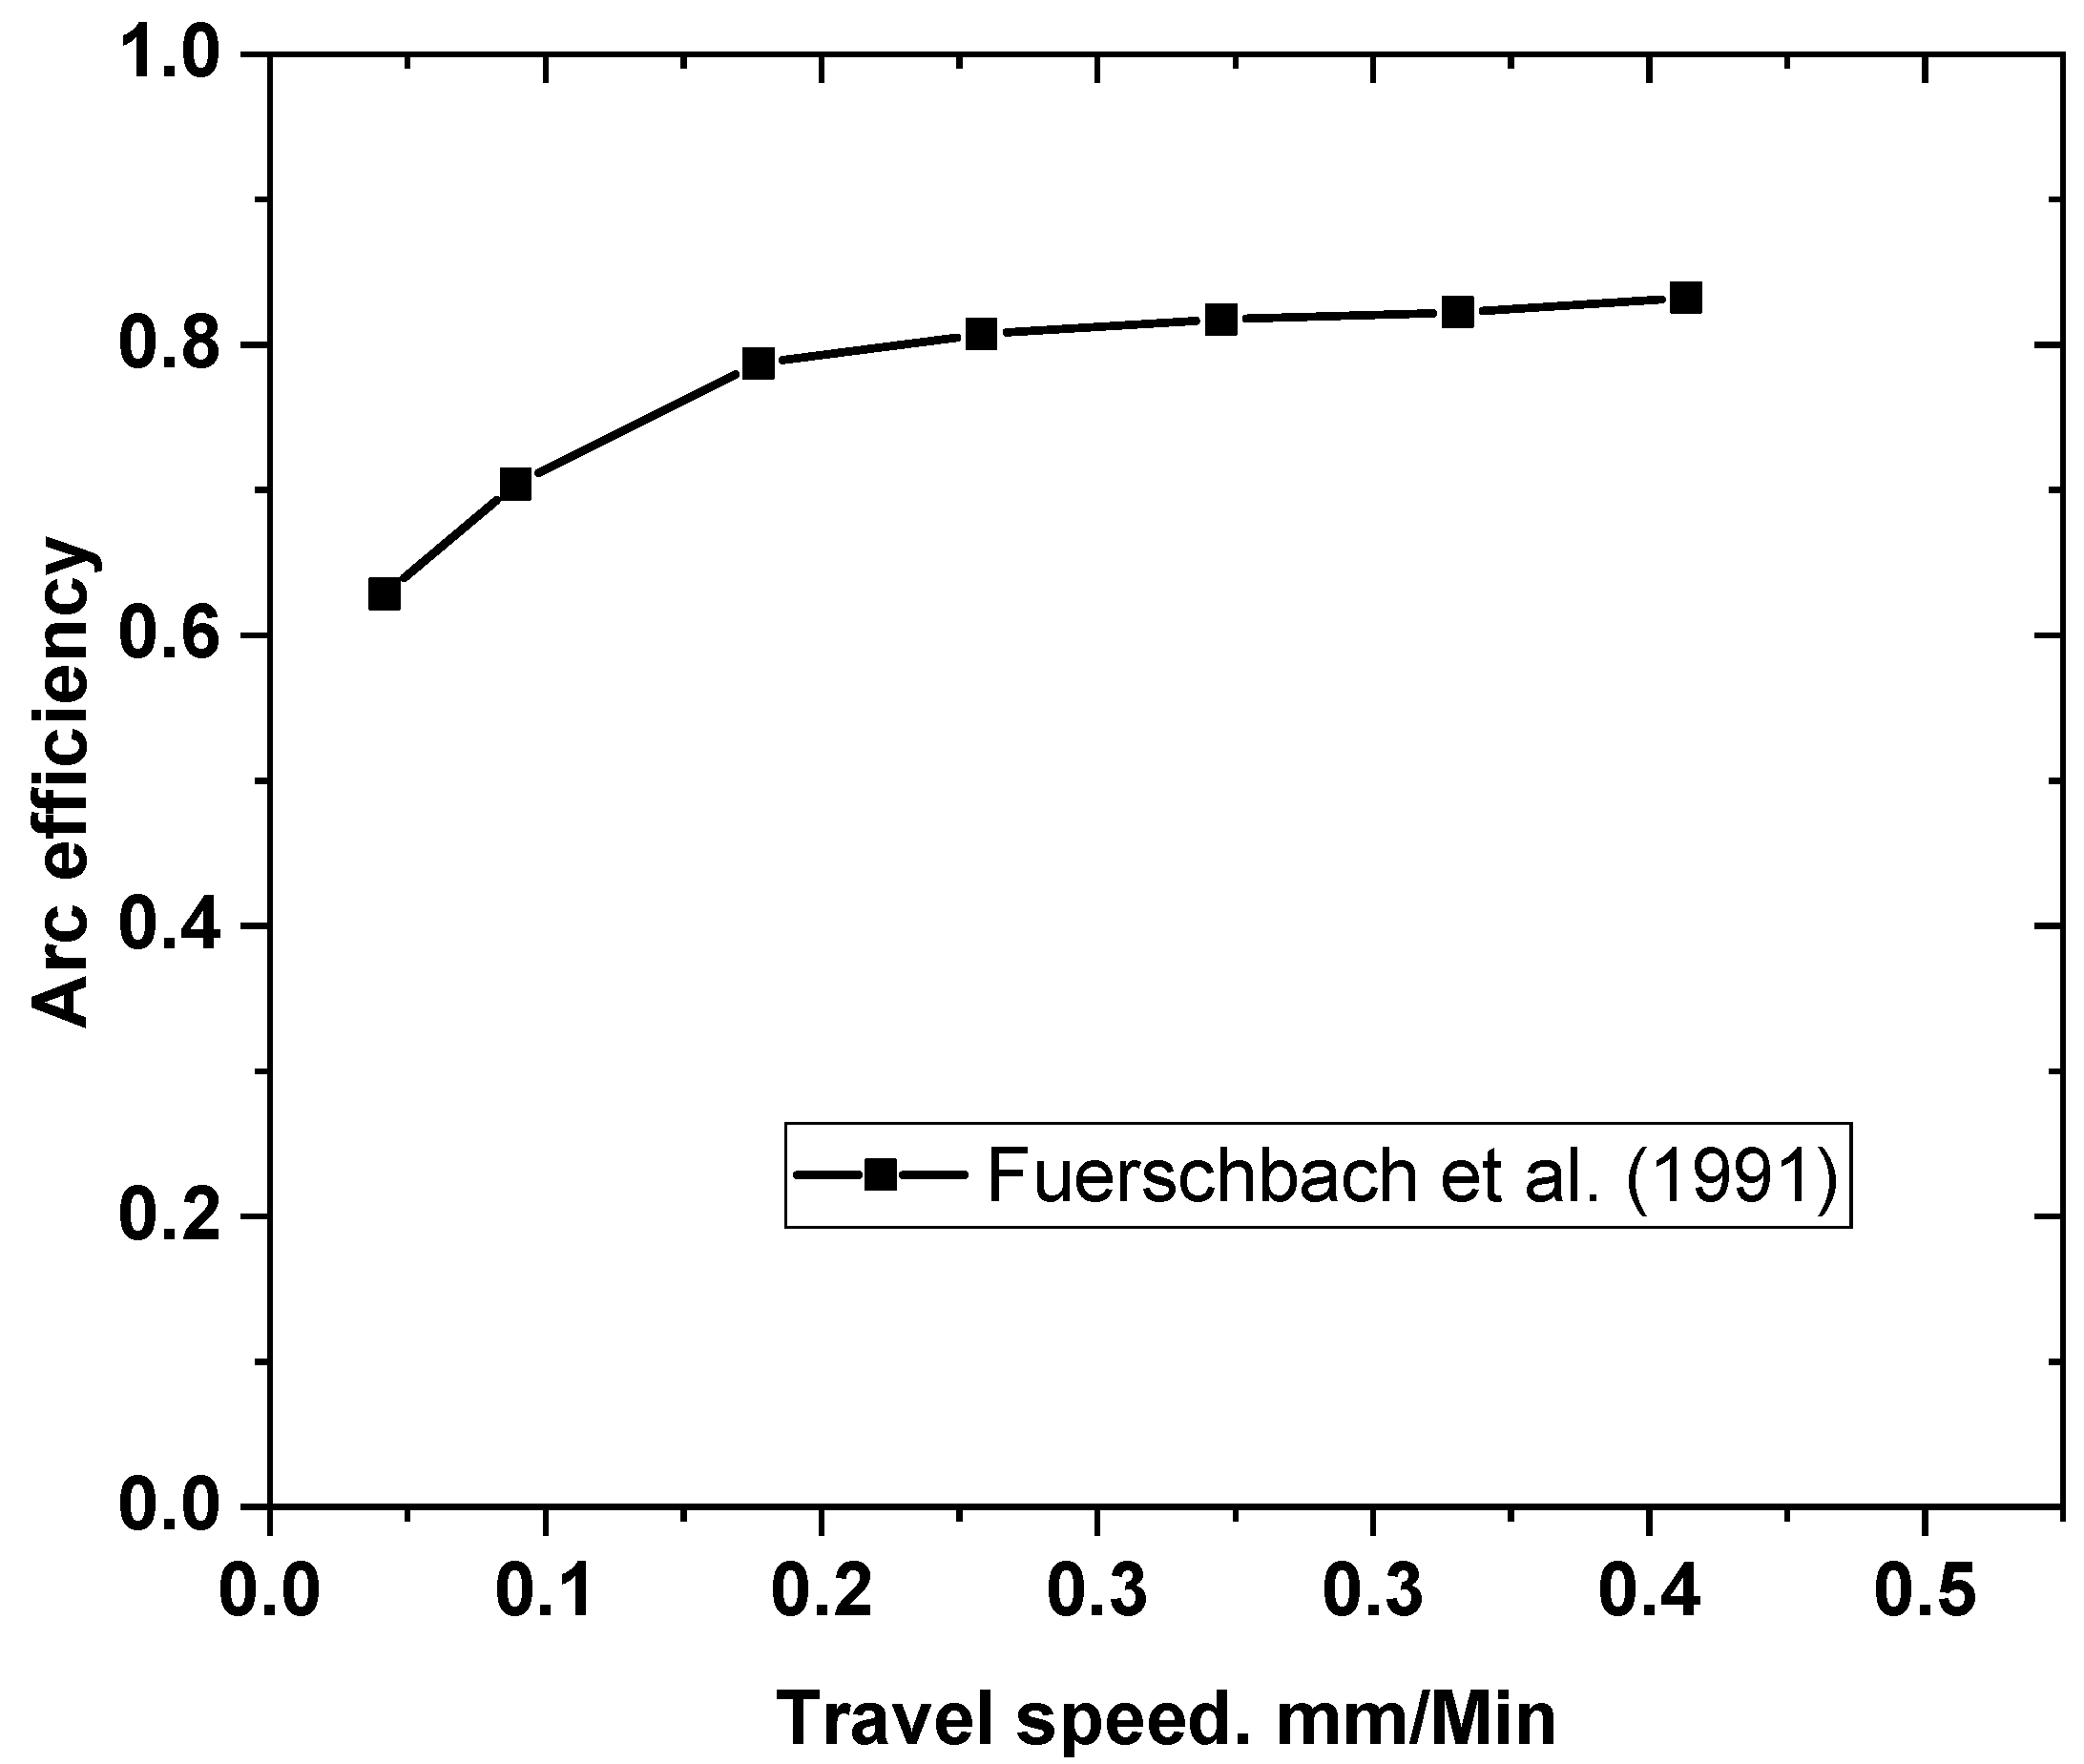
The increase in the welding speed reduces the intensity of the RS and its decrease leads to the growth of the latter. Perfect welding depends on an optimal speed, which ensures a good bond associated with moderate RS.
-
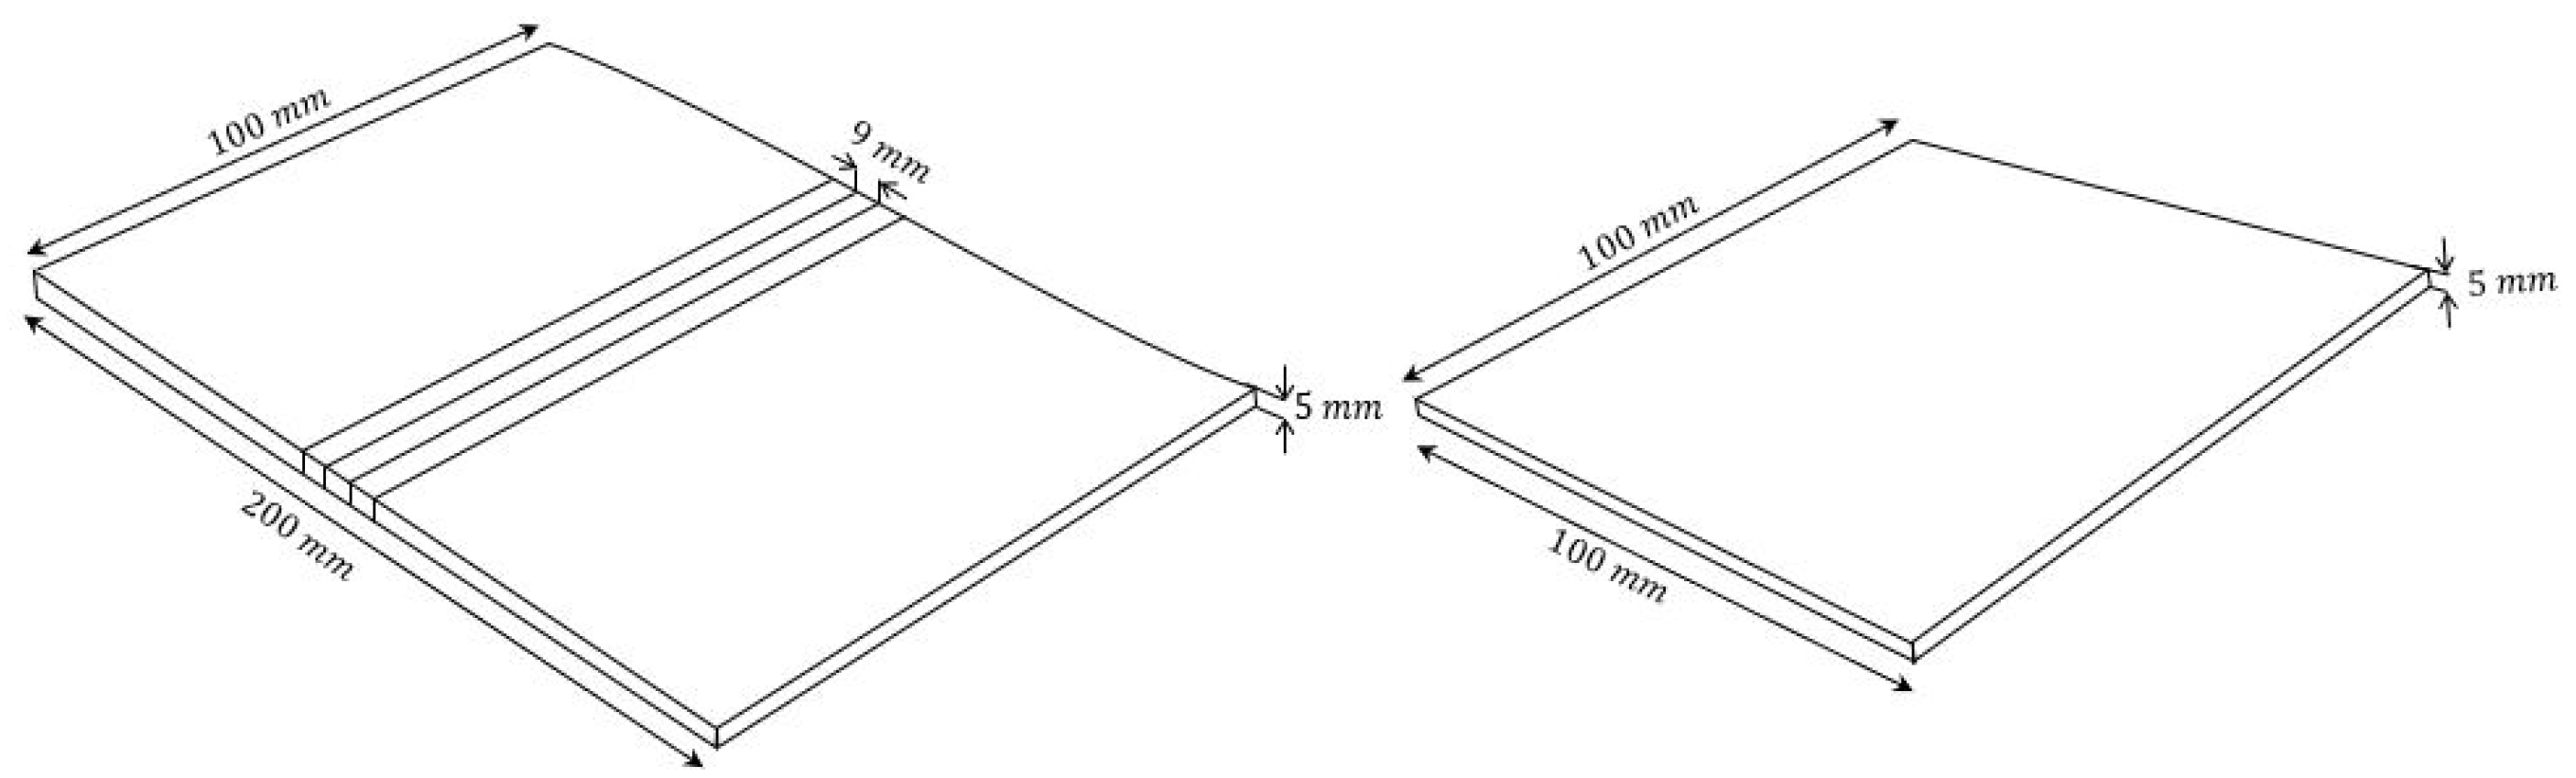
The effect of the thickness in the assembly by welding is important, and the increase in the amplitude of the RS increases with the thickness of the bead, according to the elastic limit of the material.
-
The heat input during the welding process decreases, which leads to a decrease in the size of delta ferrites, dendrite length, and inter-dendrite spacing content in the microstructure of the weld metal. This would consequently induce a decrease in the RS value.
-
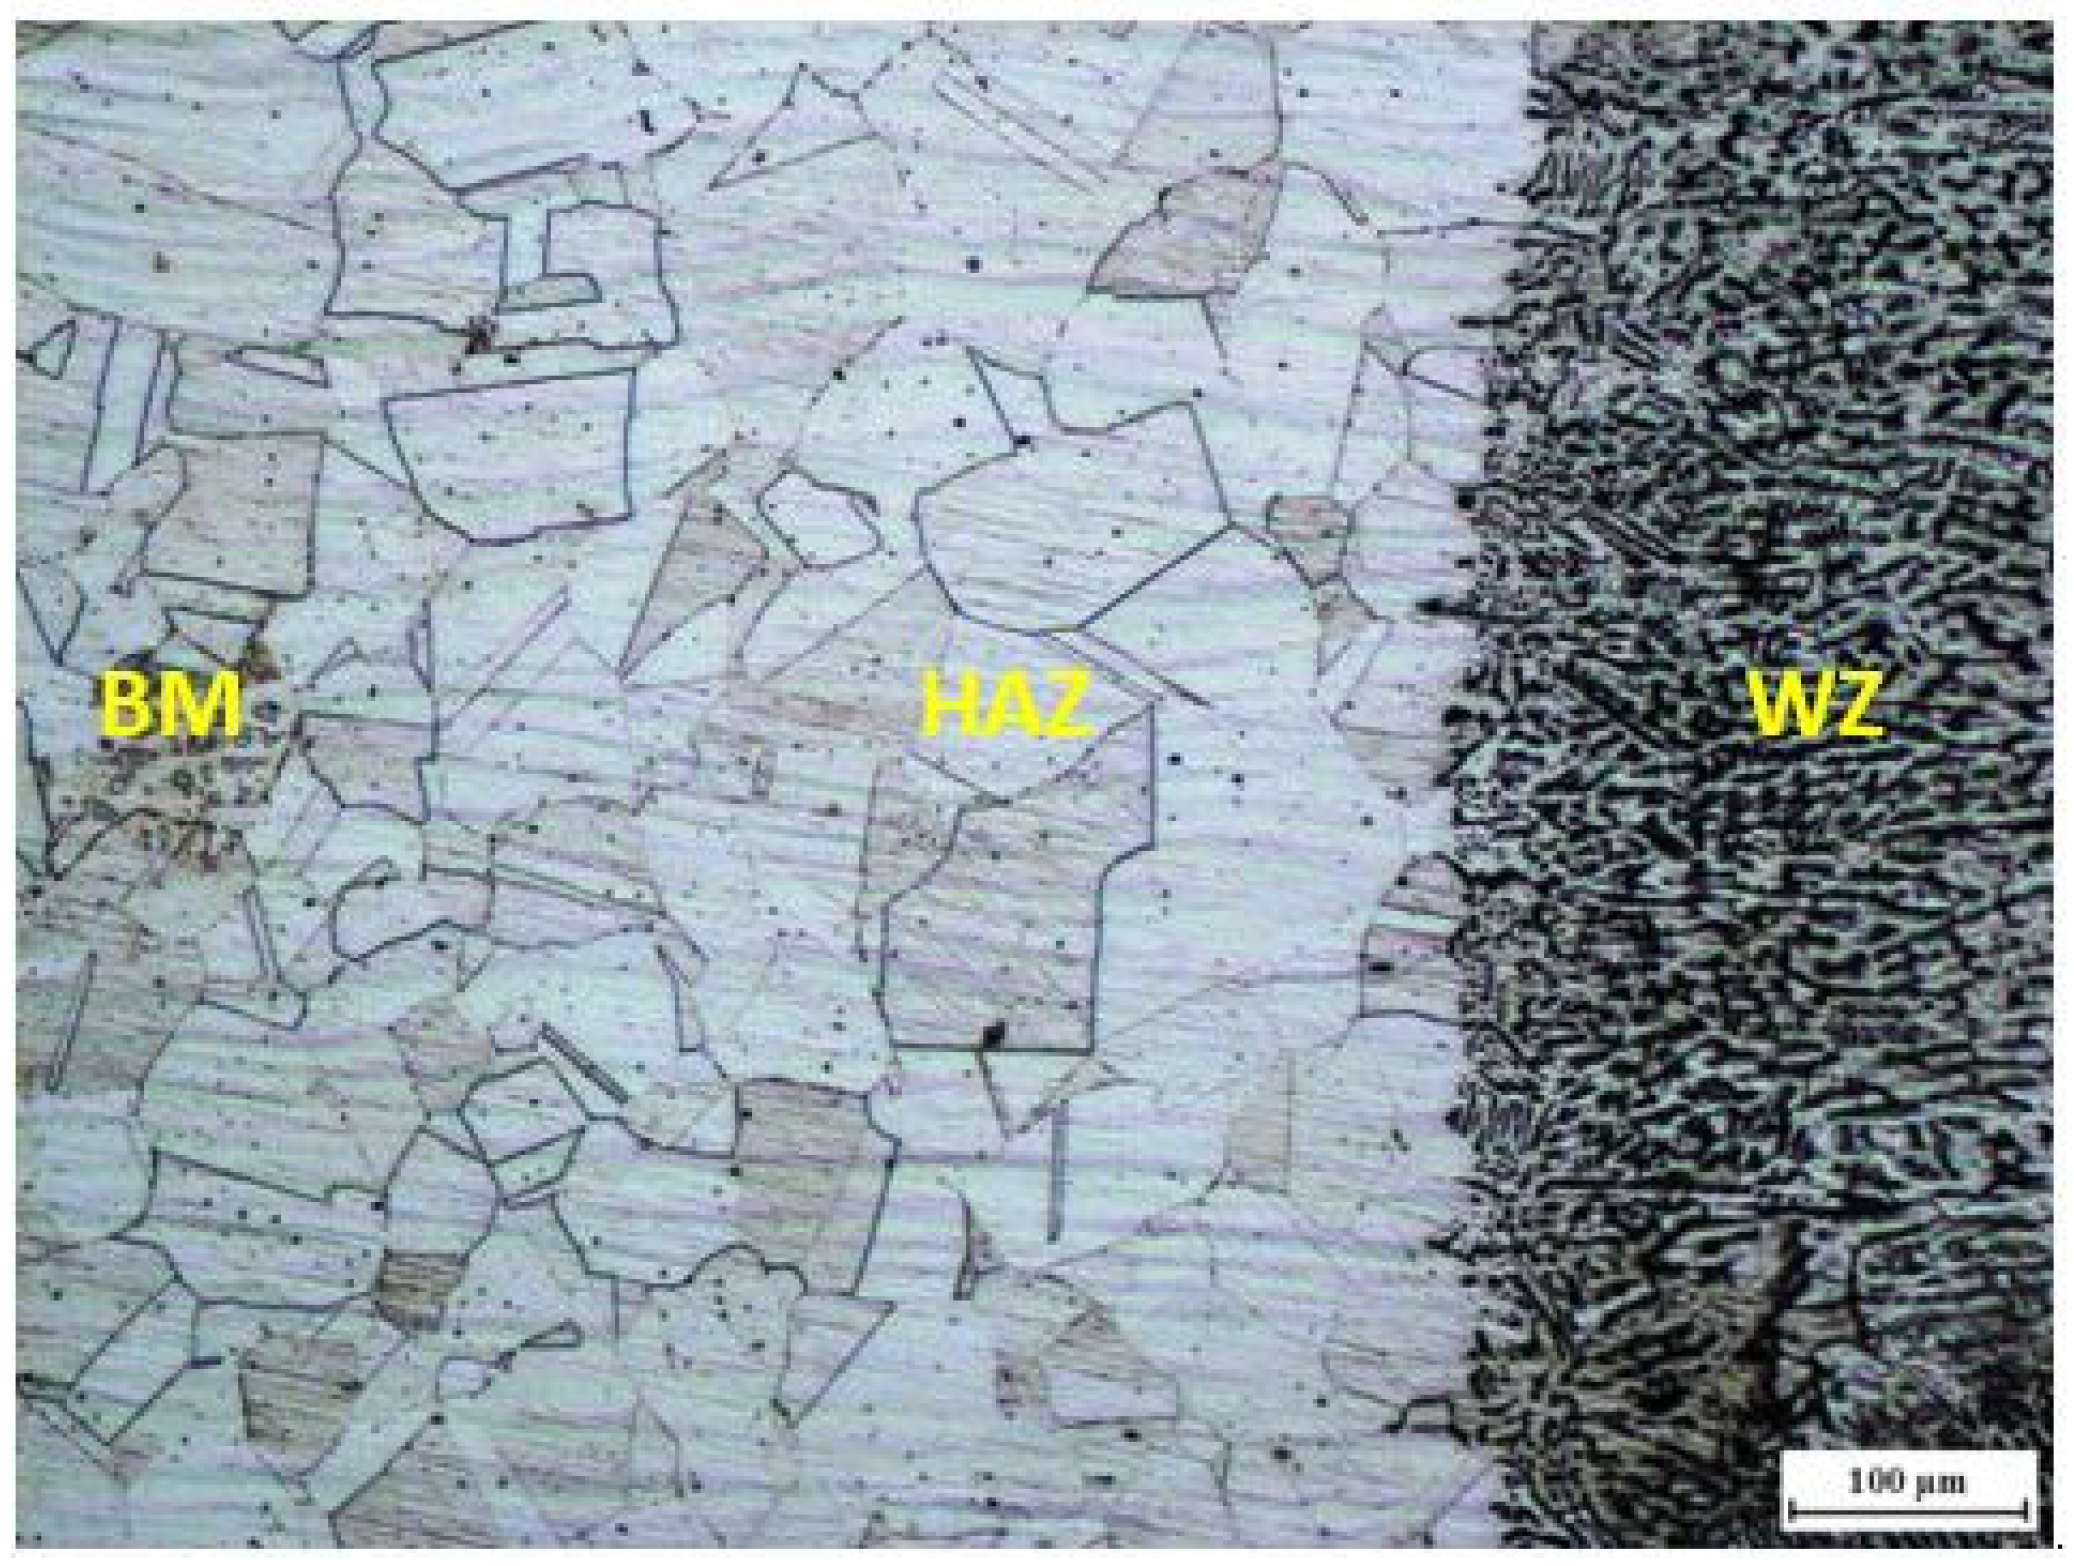
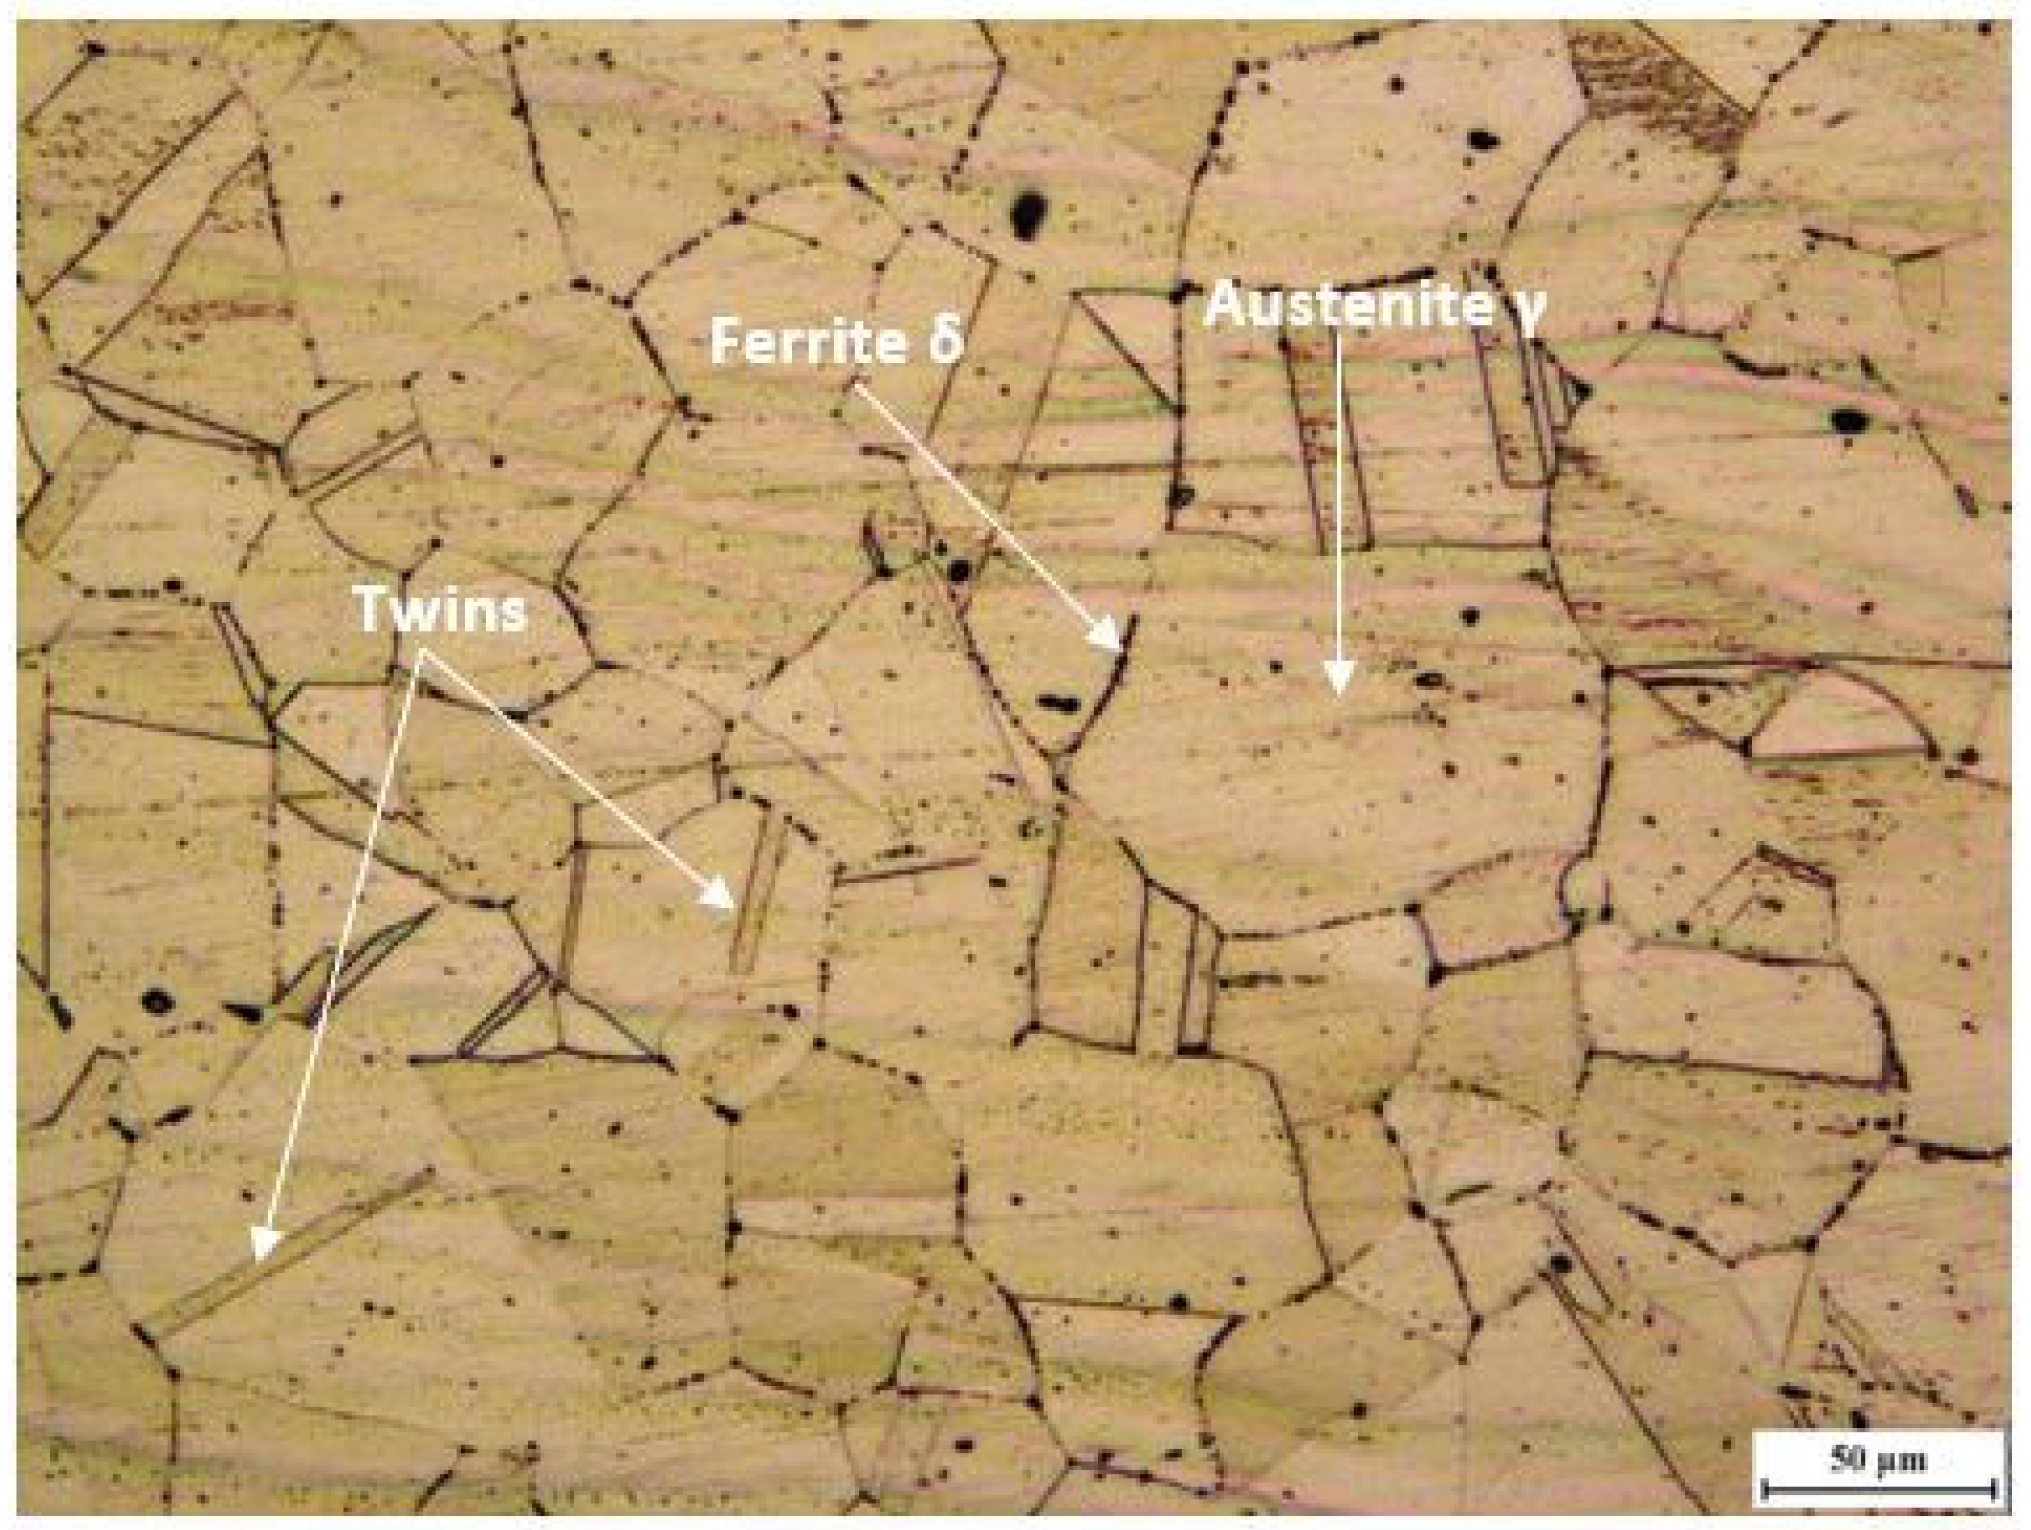
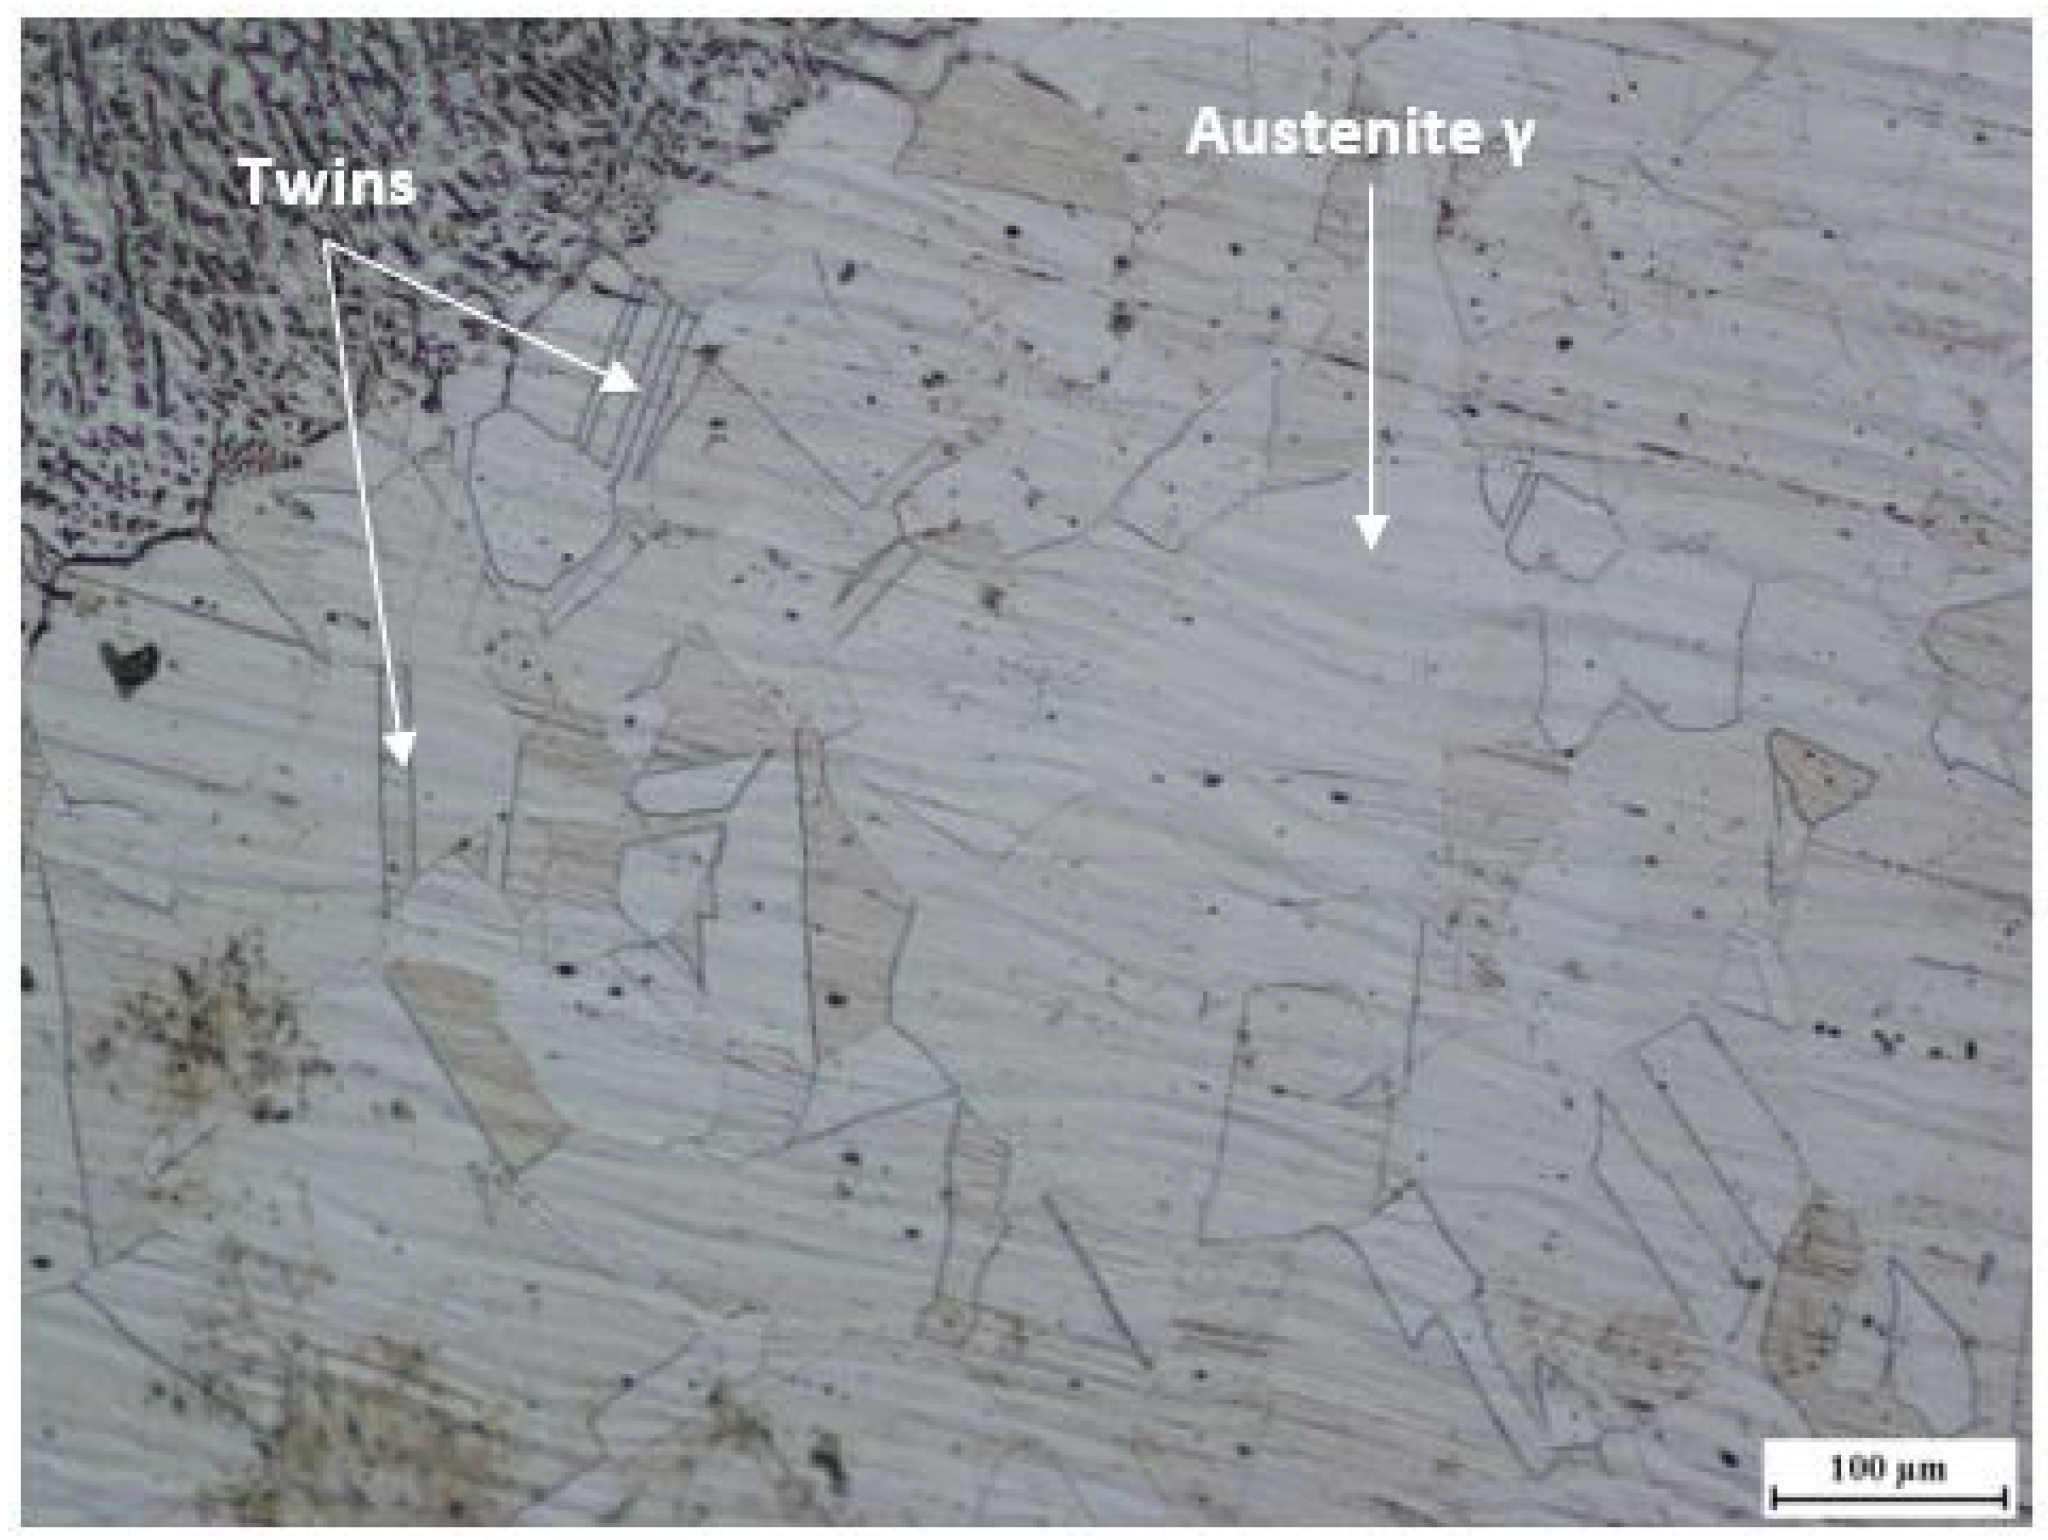
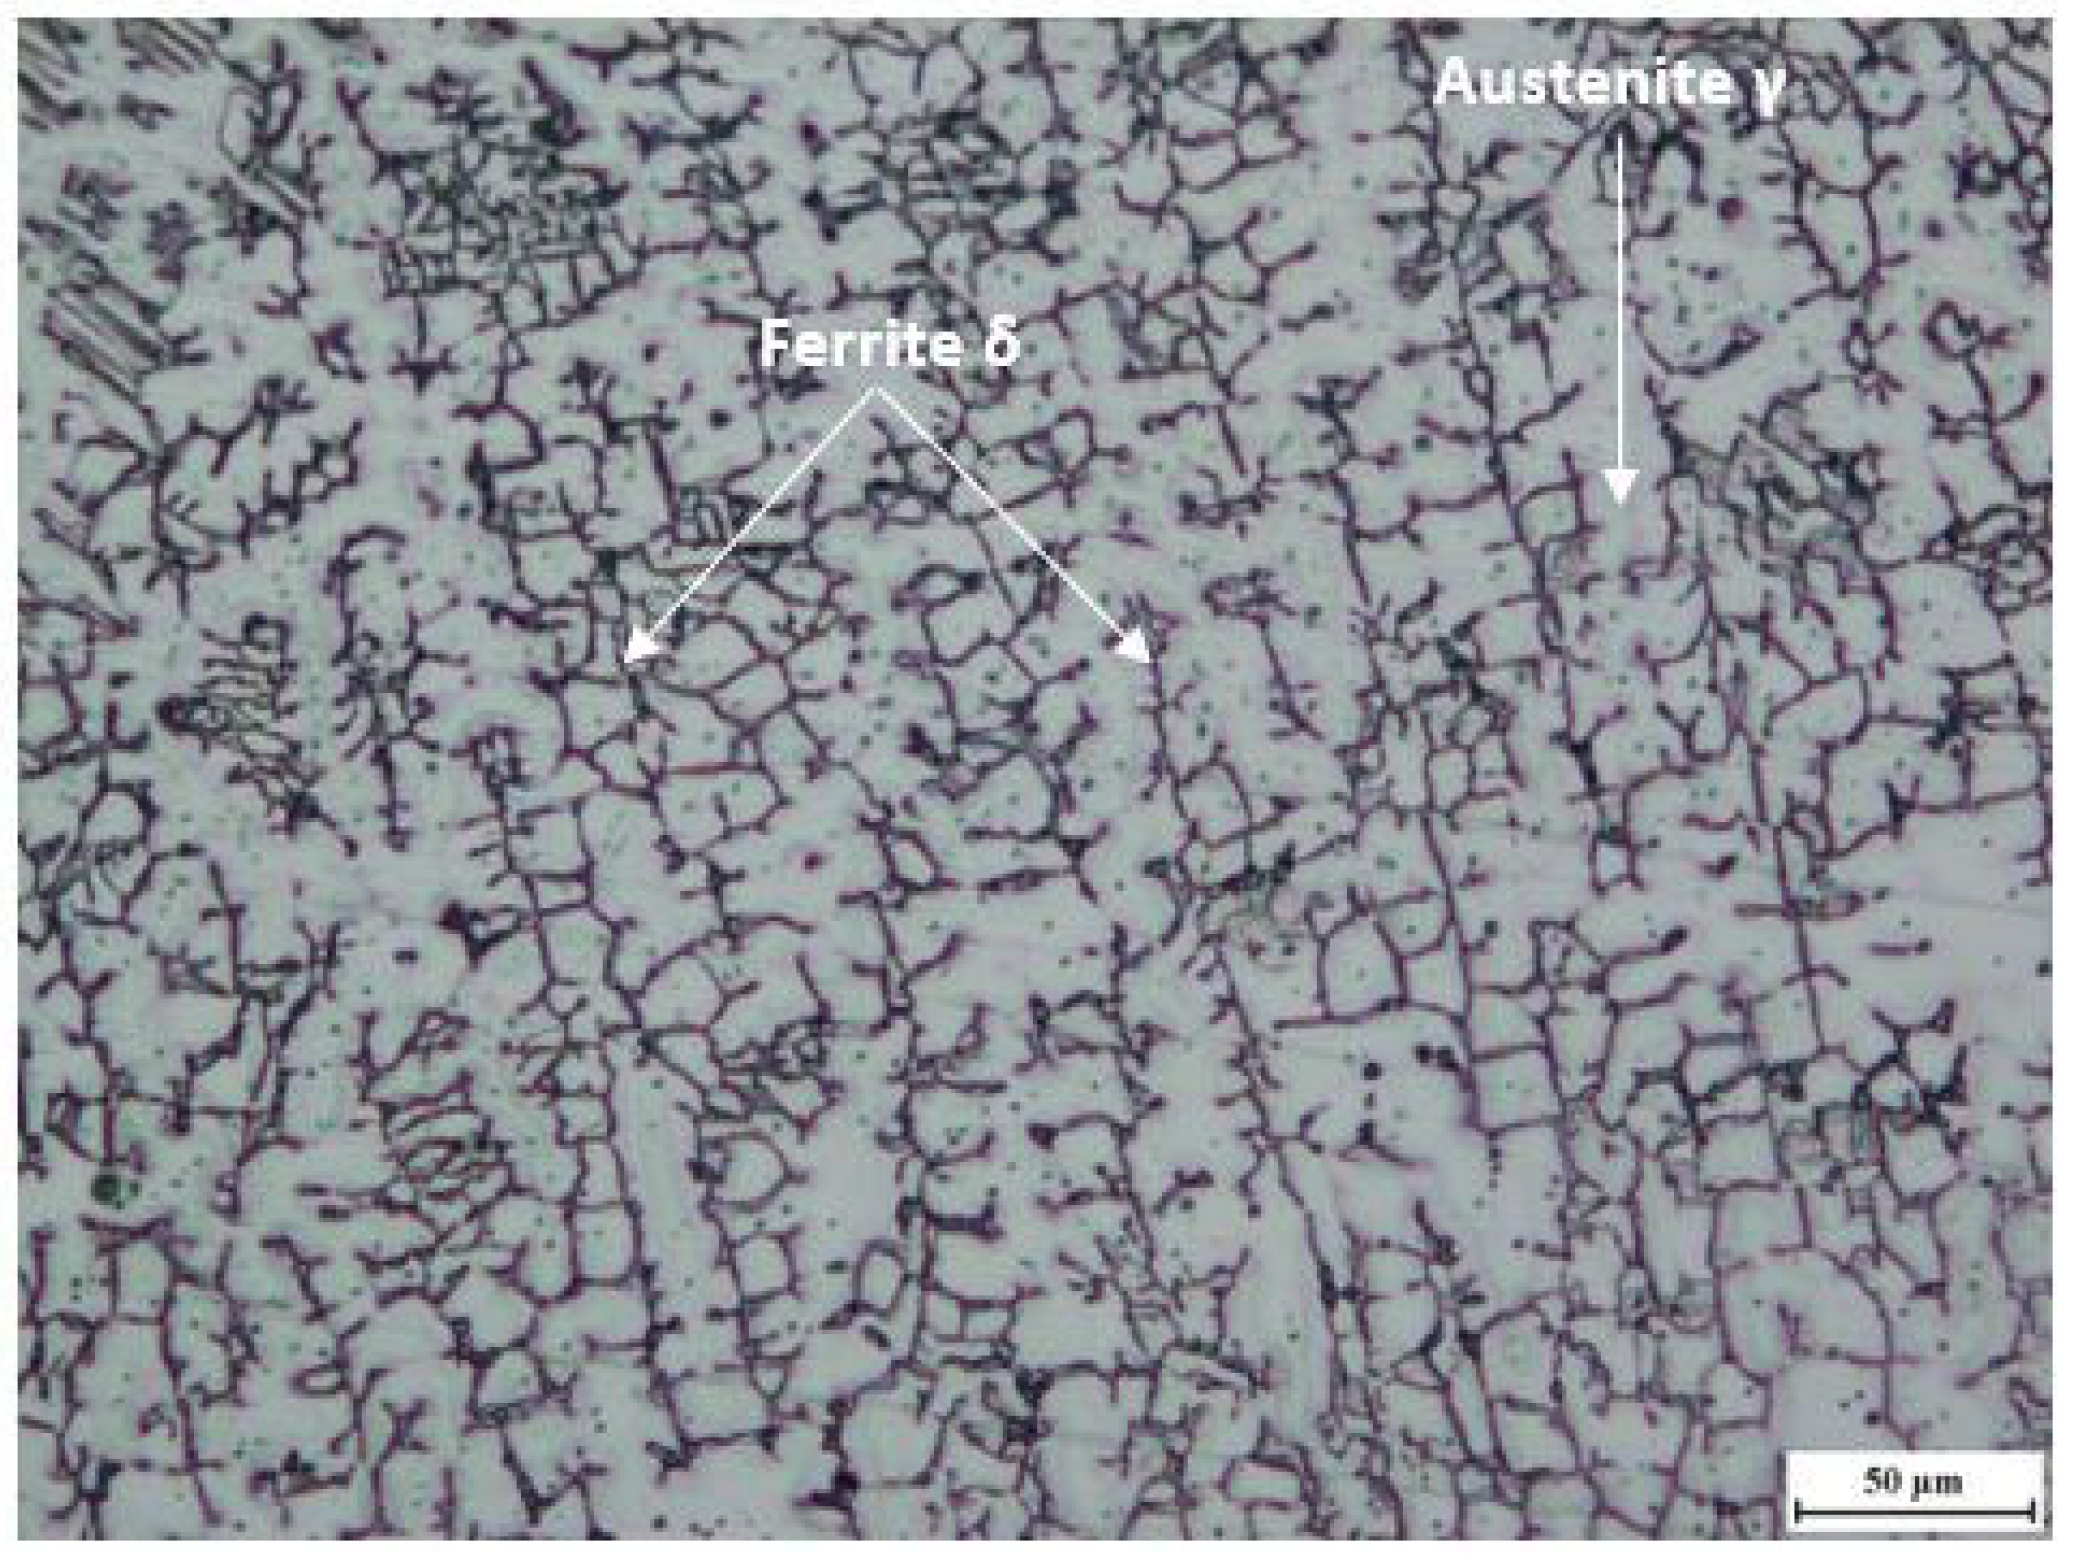
According to micrographic analysis, the BM microstructure of stainless-steel consists of equiaxed austenite grains of various sizes, limited by grain boundaries. Moreover, twin crystals can be observed in the austenitic matrix (γ) in addition to small amounts of delta ferrite (δ) in the grain boundaries with no carbide precipitate. In the zone HAZ, an increase in austenite grain size when getting closer to the FZ is noted—for the structure of the weld metal is very fine in comparison with the BM structure. In fact, it has a dendritic solidification aspect; it involves two phases: the austenitic γ-phase and the δ-ferrite phase. It is characterized by a vermicular morphology.

Author Contributions

Conceptualization, H.D., M.M., R.K., A.A.-K. and J.P.C.-A.; methodology, H.D., M.M. and R.K.; software, H.D. and M.M.; validation, H.D., M.M., R.K., A.A.-K. and J.P.C.-A.; formal analysis, M.M., R.K. and A.A.-K.; investigation, H.D., M.M., R.K., A.A.-K. and J.P.C.-A.; resources, H.D., M.M., R.K., A.A.-K. and J.P.C.-A.; data curation, H.D., M.M. and R.K.; writing—original draft preparation, H.D., M.M., R.K. and A.A.-K.; writing—review and editing, A.A.-K. and J.P.C.-A.; visualization, H.D., M.M., R.K., A.A.-K. and J.P.C.-A.; supervision, A.A.-K. and J.P.C.-A.; project administration, H.D., M.M., R.K., A.A.-K. and J.P.C.-A.; funding acquisition, H.D., M.M., R.K., A.A.-K. and J.P.C.-A. All authors have read and agreed to the published version of the manuscript.

Funding

This research received no external funding.

Data Availability Statement

The data presented in this study are available in this article.

Conflicts of Interest

The authors declare no conflict of interest.

References

  1. Yuan, X.; Zhang, J.; Lian, Y.; Du, C.; Xu, W.; Zhao, Y.; Mo, J. Research progress of residual stress determination in magnesium alloys. J. Magnes. Alloy. 2018, 6, 238–244. [Google Scholar] [CrossRef]
  2. Hu, D.; Grilli, N.; Wang, L.; Yang, M.; Yan, W. Microscale residual stresses in additively manufactured stainless steel: Computational simulation. J. Mech. Phys. Solids 2022, 161, 104822. [Google Scholar] [CrossRef]
  3. Chiocca, A.; Frendo, F.; Aiello, F.; Bertini, L. Influence of residual stresses on the fatigue life of welded joints. Numerical simulation and experimental tests. Int. J. Fatigue 2022, 162, 106901. [Google Scholar] [CrossRef]
  4. Hachi, B.K.; Belkacémi, Y.; Rechak, S.; Haboussi, M.; Taghite, M. Fatigue growth prediction of elliptical cracks in welded joint structure: Hybrid and energy density approach. Theor. Appl. Fract. Mech. 2010, 54, 11–18. [Google Scholar] [CrossRef]
  5. Djeloud, H.; Moussaoui, M.; Kellai, A.; Hachi, D.; Berto, F.; Bouchouicha, B.; Hachi, B.E. Investigation fatigue crack initiation and propagation cruciform welded joints by extended finite element method (XFEM) and implementation SED approach. Frat. Integrità Strutt. 2022, 16, 346–362. [Google Scholar] [CrossRef]
  6. Zhang, Z.; Jing, H.; Xu, L.; Han, Y.; Zhao, L.; Zhang, J. Influence of microstructure and elemental partitioning on pitting corrosion resistance of duplex stainless steel welding joints. Appl. Surf. Sci. 2017, 394, 297–314. [Google Scholar] [CrossRef]
  7. Maekawa, A.; Kawahara, A.; Serizawa, H.; Murakawa, H. Fast three-dimensional multipass welding simulation using an iterative substructure method. J. Mater. Process. Technol. 2015, 215, 30–41. [Google Scholar] [CrossRef]
  8. Prime, M.B.; Hill, M.R.; DeWald, A.T.; Sebring, R.J.; Dave, V.R.; Cola, M.J. Residual Stress Mapping in Welds Using the Contour Method. In Proceedings of the 6th International Conference Trends in Welding Research, Pine Mountain, GA, USA, 15–19 April 2002; pp. 891–896. [Google Scholar] [CrossRef]
  9. Shi, L.; Price, A.H.; Hung, W.N. Use of Contour Method for Welding Residual Stress Assessment. Procedia Manuf. 2018, 26, 276–285. [Google Scholar] [CrossRef]
  10. De Filippis, L.A.C.; Serio, L.M.; Facchini, F.; Mummolo, G.; Ludovico, A.D. Prediction of the Vickers Microhardness and Ultimate Tensile Strength of AA5754 H111 Friction Stir Welding Butt Joints Using Artificial Neural Network. Materials 2016, 9, 915. [Google Scholar] [CrossRef] [Green Version]
  11. Das, D.; Das, A.K.; Pratihar, D.K.; Roy, G.G. Prediction of residual stress in electron beam welding of stainless steel from process parameters and natural frequency of vibrations using machine-learning algorithms. Proc. Inst. Mech. Eng. Part C J. Mech. Eng. Sci. 2021, 235, 2008–2021. [Google Scholar] [CrossRef]
  12. Pal, S.; Pal, S.K.; Samantaray, A.K. Artificial neural network modeling of weld joint strength prediction of a pulsed metal inert gas welding process using arc signals. J. Mater. Process. Technol. 2008, 202, 464–474. [Google Scholar] [CrossRef]
  13. Wu, C.T.; Wu, Y.; Lyu, D.; Pan, X.; Hu, W. The momentum-consistent smoothed particle Galerkin (MC-SPG) method for simulating the extreme thread forming in the flow drill screw-driving process. Comput. Part. Mech. 2020, 7, 177–191. [Google Scholar] [CrossRef]
  14. Lee, Y.J.; Kim, S.H. Effect of residual stress on the mechanical properties of FSW joints with SUS409L. Adv. Mater. Sci. Eng. 2018, 2018, 9890234. [Google Scholar]
  15. Moattari, M.; Shokrieh, M.M.; Moshayedi, H. Effects of residual stresses induced by repair welding on the fracture toughness of Ni-based IN939 alloy. Theor. Appl. Fract. Mech. 2020, 108, 102614. [Google Scholar] [CrossRef]
  16. Rong, Y.; Zhang, G.; Huang, Y. Study of Welding Distortion and Residual Stress Considering Nonlinear Yield Stress Curves and Multi-constraint Equations. J. Mater. Eng. Perform. 2016, 25, 4484–4494. [Google Scholar] [CrossRef]
  17. Sidhu, S.S.; Batish, A.; Kumar, S. Neural network–based modeling to predict residual stresses during electric discharge machining of Al/SiC metal matrix composites. Proc. Inst. Mech. Eng. Part B J. Eng. Manuf. 2013, 227, 1679–1692. [Google Scholar] [CrossRef]
  18. Niu, X.; Shen, L.; Chen, C.; Zhou, J.; Chen, L. An Arrhenius-type constitutive model to predict the deformation behavior of Sn0.3Ag0.7Cu under different temperature. J. Mater. Sci. Mater. Electron. 2019, 30, 14611–14620. [Google Scholar] [CrossRef]
  19. Tomków, J.; Sobota, K.; Krajewski, S. Influence of tack welds distribution and welding sequence on the angular distortion of tig welded joint. Facta Univ. Ser. Mech. Eng. 2020, 18, 611–621. [Google Scholar] [CrossRef]
  20. Kellai, A.; Lounis, A.; Kahla, S.; Idir, B. Effect of root pass filler metal on microstructure and mechanical properties in the multi-pass welding of duplex stainless steels. Int. J. Adv. Manuf. Technol. 2018, 95, 3215–3225. [Google Scholar] [CrossRef]
  21. Szávaia, S.; Bézi, Z.; Rózsahegyi, P. Material Characterization and Numerical Simulation of a Dissimilar Metal Weld. Procedia Struct. Integr. 2016, 2, 1023–1030. [Google Scholar] [CrossRef] [Green Version]
  22. Ipekoğlu, G.; Küçükömero, T.; Aktarer, S.M.; Sekban, D.M.; Çam, G. Investigation of microstructure and mechanical properties of friction stir welded dissimilar St37/St52 joints. Mater. Res. Express 2019, 6, 046537. [Google Scholar] [CrossRef]
  23. Abid, M.; Siddique, M.; Mufti, R.A. Prediction of welding distortions and residual stresses in a pipe–flange joint using the finite element technique. Model. Simul. Mater. Sci. Eng. 2005, 13, 455–470. [Google Scholar] [CrossRef]
  24. Alhafadhi, M.H.; Krallics, G. The Effect of Heat Input Parameters on Residual Stress Distribution by Numerical Simulation. IOP Conf. Ser. Mater. Sci. Eng. 2019, 613, 012035. [Google Scholar] [CrossRef]
  25. Zhang, H.; Zhang, G.; Cai, C.; Gao, H.; Wu, L. Fundamental studies on in-process controlling angular distortion in asymmetrical double-sided double arc welding. J. Mater. Process. Technol. 2008, 205, 214–223. [Google Scholar] [CrossRef]
  26. Rosenthal, D. Mathematical Theory of Heat Distribution during Welding and Cutting. Weld. J. 1941, 20, 220–234. [Google Scholar]
  27. Pavelic, V.; Tanbakuchi, R.; Uyehara, O. Experimental and computed temperature histories in gas tungsten-arc welding of thin plates. Weld. J. Res. Suppl. 1969, 48, 296–305. [Google Scholar]
  28. Goldak, J.; Chakravarti, A.; Bibby, M. A new finite element model for welding heat sources. Metall. Trans. B 1984, 15, 299–305. [Google Scholar] [CrossRef]
  29. Hashemzadeh, M.; Chen, B.Q.; Soares, C.G. Comparison between different heat sources types in thin-plate welding simulation. In Developments in Maritime Transportation and Exploitation of Sea Resources; Taylor & Francis: Milton Park, UK, 2014; pp. 329–336. [Google Scholar] [CrossRef]
  30. Fachinotti, V.D.; Anca, A.A.; Cardona, A. Analytical solutions of the thermal field induced by moving double-ellipsoidal and double-elliptical heat sources in a semi-infinite body. Int. J. Numer. Methods Biomed. Eng. 2011, 27, 595–607. [Google Scholar] [CrossRef]
  31. Fachinotti, V.D.; Anca, A.A.; Cardona, A. Semi-Analytical Solution of the Thermal Field Induced by a Moving Double-Ellipsoidal Welding Heat Source in a Semi-Infinite Body. Mecán. Comput. 2008, 19, 1519–1530. Available online: https://amcaonline.org.ar/ojs/index.php/mc/article/view/1502 (accessed on 5 August 2022).
  32. Ravisankar, A.; Velaga, S.K.; Rajput, G.; Venugopal, S. Influence of welding speed and power on residual stress during gas tungsten arc welding (GTAW) of thin sections with constant heat input: A study using numerical simulation and experimental validation. J. Manuf. Process. 2014, 16, 200–211. [Google Scholar] [CrossRef]
  33. Mitra, S.; Arora, K.S.; Bhattacharya, B.; Singh, S.B. Effect of Welding Speed on the Prediction Accuracy of Residual Stress in Laser Welded 1.2 mm Thick Dual Phase Steel. Lasers Manuf. Mater. Process. 2019, 7, 74–87. [Google Scholar] [CrossRef]
  34. Teng, T.L.; Lin, C.C. Effect of welding conditions on residual stresses due to butt welds. Int. J. Press. Vessel. Pip. 1998, 75, 857–864. [Google Scholar] [CrossRef]
  35. Asadi, P.; Alimohammadi, S.; Kohantorabi, O.; Soleymani, A.; Fazli, A. Numerical investigation on the effect of welding speed and heat input on the residual stress of multi-pass TIG welded stainless steel pipe. Proc. Inst. Mech. Eng. Part B J. Eng. Manuf. 2021, 235, 1007–1021. [Google Scholar] [CrossRef]
  36. Gery, D.; Long, H.; Maropoulos, P. Effects of welding speed, energy input and heat source distribution on temperature variations in butt joint welding. J. Mater. Process. Technol. 2005, 167, 393–401. [Google Scholar] [CrossRef]
  37. Kou, S. Welding Metallurgy; Cambridge University Press: Cambridge, UK, 2003. [Google Scholar] [CrossRef]
  38. Kartal, M.E.; Kang, Y.H.; Korsunsky, A.M.; Cocks, A.C.F.; Bouchard, J.P. The influence of welding procedure and plate geometry on residual stresses in thick components. Int. J. Solids Struct. 2016, 80, 420–429. [Google Scholar] [CrossRef]
  39. Anis, M. Winarto Effect of Plate Thickness and Weld Position on Distortion and Residual Stress of Welded Structural Steel. Mater. Sci. Forum 2011, 689, 296–301. [Google Scholar] [CrossRef]
  40. Terada, M.; Saiki, M.; Costa, I.; Padilha, A.F. Microstructure and intergranular corrosion of the austenitic stainless steel 1.4970. J. Nucl. Mater. 2006, 358, 40–46. [Google Scholar] [CrossRef]
  41. Vashishtha, H.; Taiwade, R.V.; Sharma, S.; Patil, A.P. Effect of welding processes on microstructural and mechanical properties of dissimilar weldments between conventional austenitic and high nitrogen austenitic stainless steels. J. Manuf. Process. 2017, 25, 49–59. [Google Scholar] [CrossRef]
  42. Başyiğit, A.B.; Murat, M.G. The effects of tig welding rod compositions on microstructural and mechanical properties of dissimilar aisi 304l and 420 stainless steel welds. Metals 2018, 8, 972. [Google Scholar] [CrossRef] [Green Version]
  43. Gonçalves, R.B.; De Araújo, P.H.D.; Braga, F.J.V.; Terrones, L.A.H.; Paranhos, R.P.D.R. Effect of conventional and alternative solution and stabilizing heat treatment on the microstructure of a 347 stainless steel welded joint. Weld. Int. 2017, 31, 196–205. [Google Scholar] [CrossRef]
  44. Safari, M.; Mostaan, H.; Derakhshan, E. Microstructual and mechanical studies of the dissimilar tabular joints of Incoloy alloy 825 and AISI 316 stainless steel. J. Mar. Eng. Technol. 2020, 19, 176–185. [Google Scholar] [CrossRef]
  45. Deng, D.; Murakawa, H. Numerical simulation of temperature field and residual stress in multi-pass welds in stainless steel pipe and comparison with experimental measurements. Comput. Mater. Sci. 2006, 37, 269–277. [Google Scholar] [CrossRef]
Figure 1. Elementary effects of welding for (1) welded plates (2) welded cylinders.
Energies 16 03176 g001
Figure 2. Properties of stainless steel SUS304: (a) Thermal properties, (b) Mechanical properties.
Energies 16 03176 g002
Figure 3. Pipe geometry model.
Energies 16 03176 g003
Figure 4. Plate geometry model.
Energies 16 03176 g004
Figure 5. Heat exchanges between the weld material and the external environment.
Energies 16 03176 g005
Figure 6. Double-ellipsoidal heat source model.
Energies 16 03176 g006
Figure 7. Finite element simulation process.
Energies 16 03176 g007
Figure 8. Meshing model of a pipe.
Energies 16 03176 g008
Figure 9. (a) Axial stress distribution on the inside surface, (b) Hoop stress distribution on the inside surface.
Energies 16 03176 g009
Figure 10. Mesh model of the plate.
Energies 16 03176 g010
Figure 11. (a) RS along the transverse direction, (b) Temperature distribution.
Energies 16 03176 g011
Figure 12. Residual stress along the transverse direction with different torch speed.
Energies 16 03176 g012
Figure 13. Welding arc efficiency as a function of speed (GTAW TIG welding) [38].
Energies 16 03176 g013
Figure 14. Residual stress along the transverse direction with different plate thicknesses.
Energies 16 03176 g014
Figure 15. Optical micrograph of 304 austenitic stainless-steel weldment.
Energies 16 03176 g015
Figure 16. Optical micrograph of the base metal (BM) for the grade 304 austenitic stainless steel.
Energies 16 03176 g016
Figure 17. Optical micrograph of the HAZ for 304 austenitic stainless steel.
Energies 16 03176 g017
Figure 18. Optical micrograph of the weld zone (WZ) for 304 austenitic stainless steel.
Energies 16 03176 g018
Figure 19. Microhardness aspect of Vickers Hardness (HV).
Energies 16 03176 g019
Figure 20. (a) Average values of longitudinal residual stresses before and after treatment. (b) Average values of transversal residual stresses before and after treatment.
Energies 16 03176 g020aEnergies 16 03176 g020b
Table 1. Welding parameters and heat source parameters for the finite element model.
a Parameter   along   the   x   direction   m 0.03
c f Parameter   along   the   y   direction ,   front   m 0.03
c r Parameter   along   the   y   direction ,   rear   m 0.09
B Parameter   along   the   z   direction   m 0.03
f f Front fraction0.6
f r Rear fraction1.4
V Welding   speed   m / s 0.05
H Welding efficiency0.7
Q Heat   input   j / m 931
r 1 Radius   of   first   pass   m 0.056
r 2 Radius   of   sec ond   pass   m 0.06
W 1 Angular   velocity   in   the   first   pass   rad / s 0.089
W 2 Angular   velocity   in   the   sec ond   pass   rad / s 0.083
Disclaimer/Publisher’s Note: The statements, opinions and data contained in all publications are solely those of the individual author(s) and contributor(s) and not of MDPI and/or the editor(s). MDPI and/or the editor(s) disclaim responsibility for any injury to people or property resulting from any ideas, methods, instructions or products referred to in the content.

