
Sustainable Environmental Impact Assessment Using Indicators for Sustainable Energy-Intensive Industrial Production

 , , and
Abstract
:1. Introduction
2. Materials and Methods
Methodology of Criteria Formation
3. Results and Discussion
3.1. Theoretical Results
3.2. Practical Results
4. Conclusions
- It was shown that resource and energy efficiencies are the main factors in the sustainable socio-economic development of industrial production.
- A new methodology for the criteria formation for assessing the sustainability of energy-intensive industrial production was proposed based on an integrated combination of the economic, environmental (ecological), and social aspects of sustainable development.
- It was established that in order to ensure sustainable innovative development, any energy-intensive chemical, metallurgical, and energy production processes should maximize the values of material output and value addition in the products manufactured by the enterprise.
- The indicators were justified indicators that determined the levels of sustainability and their dynamics for the enterprise as a whole, as well as for the dynamics for the individual production technologies and individual technological processes.
Author Contributions
Funding
Data Availability Statement
Conflicts of Interest
References
- Meshalkin, V.P. Fundamentals of Intensification and Resource-Energy Efficiency of Chemical-Technological Systems; Print-Ekspress: Smolensk, Russia, 2021. [Google Scholar]
- Meshalkin, V.P.; Dovì, V.G.; Marsanich, A. Strategy of Chemical Supply Chain Management and Sustainable Development; Mendeleyev University of Chemical Technology of Russia: Moscow, Russia, 2003. [Google Scholar]
- Klemes, J.J.; Varbanov, P.S.; Alwi, S.R.W.; Manan, Z.A.; Fan, Y.V.; Chin, H.H. Sustainable Process Integration and Intensification; Degruyter: Berlin, Germany, 2018. [Google Scholar]
- Stankiewicz, A.L.; Moulijun, J.A. Process intensification: Transforming chemical engineering. Chem. Eng. Prog. 2000, 96, 22–34. [Google Scholar]
- Roberts, K.W.; Parris, T.M.; Leiserowitz, A.A. What is sustainable development? Goals, indicators, values, and practice. Environ. Sci. Policy Sustain. Dev. 2005, 47, 8–21. [Google Scholar] [CrossRef]
- Strange, T.; Bayley, A. Sustainable Development: Linking Economy, Society, Environment; OECD: Paris, France, 2007. [Google Scholar]
- Kuhlman, T.; Farrington, J. What is Sustainability? Sustainability 2010, 2, 3436–3448. [Google Scholar] [CrossRef] [Green Version]
- Ruiz-Mercado, G.; Cabezas, H. Sustainability in the Design, Synthesis and Analysis of Chemical Engineering Processes; Elsevier: Amsterdam, The Netherlands, 2016. [Google Scholar] [CrossRef]
- Ren, J.; Wang, Y.; He, C. Towards Sustainable Chemical Processes. Applications of Sustainability Assessment and Analysis, Design and Optimization, and Hybridization and Modularization; Elsevier: Amsterdam, The Netherlands, 2020. [Google Scholar] [CrossRef]
- Lee, S.M.; Trimi, S. Innovation for creating a smart future. J. Innov. Knowl. 2016, 3, 1–8. [Google Scholar] [CrossRef]
- Zhang, Y.; Khan, U.; Lee, S.; Sali, M. The influence of management innovation and technological innovation on organization performance. A mediating role of sustainability. Sustainability 2019, 11, 495. [Google Scholar]
- Schumpeter, J. Business Cycles: A Theoretical, Historical and Statistical Analysis of Capitalist Process; McGraw-Hill: New York, NY, USA, 1939. [Google Scholar]
- Romer, P. Increasing returns and long-run growth. J. Political Econ. 1986, 94, 1002–1037. [Google Scholar] [CrossRef] [Green Version]
- Aghion, P.; Howitt, P. A model of growth through creative destruction. Econometrica 1992, 60, 323–351. [Google Scholar] [CrossRef]
- Grossman, G.; Helpman, E. Innovation and Growth in the Global Economy; MIT Press: Cambridge, MA, USA, 1991. [Google Scholar]
- Foster, R. Innovation: The Attacker’s Advantage; Summit Books: Singapore, 1986. [Google Scholar]
- Sahal, D. Patterns of Technological Innovation; Addison-Wesley: Boston, MA, USA, 1981. [Google Scholar]
- Twiss, B. Management of Technological Innovation; Longman: London, UK, 1980. [Google Scholar]
- Dosi, G. Technical Change and Industrial Transformation: The Theory and an Application to the Semiconductor Industry; Macmillan: New York, NY, USA, 1984. [Google Scholar]
- Dziallas, M.; Blind, K. Innovation indicators throughout the innovation process: An extensive literature analysis. Technovation 2018, 80–81, 3–29. [Google Scholar] [CrossRef]
- Finkbeiner, M.; Schau, E.M.; Lehmann, A.; Traverso, M. Towards life cycle sustainability assessment. Sustainability 2010, 2, 3309–3322. [Google Scholar] [CrossRef] [Green Version]
- O’Brian, M.; Doig, A.; Clift, R. Social and environmental life cycle assessment (SELCA). Int. J. Life Cycle Assess. 1996, 1, 231–237. [Google Scholar] [CrossRef]
- Khan, F.I.; Raveender, V.; Husain, T. Effective environmental management through life cycle assessment. J. Loss Prev. Process Ind. 2002, 15, 455–466. [Google Scholar] [CrossRef]
- Kloepffer, W. Life cycle sustainability assessment of products. Int. J. Life Cycle Assess. 2008, 13, 89–95. [Google Scholar] [CrossRef]
- Khan, F.I.; Sadiq, R.; Husain, T. GreenPro-I: A risk-based life cycle assessment and decision-making methodology for process plant design. Environ. Model. Softw. 2002, 17, 669–691. [Google Scholar] [CrossRef]
- Khan, F.I.; Sadiq, R.; Veitch, B. Life cycle index (LInX): A new indexing procedure for process, and product design and decision-making. J. Clean. Prod. 2004, 12, 59–76. [Google Scholar] [CrossRef]
- Becker, R.H.; Speltz, L.M. Putting the S-Curve concept to work. Res. Manag. 1983, 5, 31–33. [Google Scholar] [CrossRef]
- Christensen, C.M. The Innovator’s Challenge: Understanding the Influence of Market Environment on Processes of Technology Development in the Rigid Disk Drive Industry. Ph.D. Thesis, Harvard University, Cambridge, MA, USA, 1992. [Google Scholar]
- Christensen, C.M. Exploring the limits of the technology S-Curve. Part 2: Architectural technologies. Prod. Oper. Manag. 1992, 1, 358–366. [Google Scholar] [CrossRef]
- Kondratyev, N.D.; Yakovets, Y.B.; Abalkin, L.I. Large Conjecture Cycles and Theory of Prediction—Selective Works; Economika Publishers: Moscow, Russia, 2002. [Google Scholar]
- Romer, P. Endogenous technical change. J. Political Econ. 1990, 98, 71–102. [Google Scholar] [CrossRef] [Green Version]
- Müller, J.M.; Kiel, D.; Voigt, K.I. What Drives the implementation of industry 4.0? The role of opportunities and challenges in the context of sustainability. Sustainability 2018, 10, 247. [Google Scholar] [CrossRef] [Green Version]
- Machado, C.G.; Winroth, M.P. daSilva, EHDR Sustainable manufacturing in Industry 4.0: An emerging research agenda. Int. J. Prod. Res. 2020, 58, 1462–1484. [Google Scholar] [CrossRef]
- Beattie, V.; Smith, S.J. Value creation and business models: Refocusing the intellectual capital debate. Br. Account. Rev. 2013, 45, 243–254. [Google Scholar] [CrossRef]
- Teece, D. Business models, business strategy and innovation. Long Range Plan. 2010, 43, 172–194. [Google Scholar] [CrossRef]
- Stock, T.; Obenaus, M.; Kunz, S.; Kohl, H. Industry 4.0 as enabler for a sustainable development: A qualitative assessment of its ecological and social potential. Process Saf. Environ. Prot. 2018, 118, 254–267. [Google Scholar] [CrossRef]
- Bocken, N.M.P.; Short, S.W.; Rana, P.; Evans, S. A literature and practice review to develop sustainable business model archetypes. J. Clean. Prod. 2014, 65, 42–56. [Google Scholar] [CrossRef] [Green Version]
- Von Weizsacker, E.U.; Hargroves, C.; Smith, M.; Desha, C.; Stasinopoulos, P. Factor Five: Transforming the Global Economy through 80% Improvements in Resource Productivity; Routledge: London, UK, 2009. [Google Scholar]
- Rajput, S.; Singh, S.P. Connecting circular economy and Industry 4.0. Int. J. Inf. Manag. 2019, 49, 98–113. [Google Scholar] [CrossRef]
- Bocken, N.; Short, S.; Rana, P.; Evans, S. A value mapping tool for sustainable business modelling. Corp. Gov. 2013, 13, 482–497. [Google Scholar] [CrossRef]
- Stubbs, W.; Cocklin, C. Conceptualizing a “sustainability business model”. Organ. Environ. 2008, 21, 103–127. [Google Scholar] [CrossRef]
- Von Weizsacker, E.U. Factor Four: Doubling Wealth, Halving Resource Use: The New Report to the Club of Rome; Routledge: London, UK, 1997. [Google Scholar]
- Zharov, V.; Evstafeva, O.; Saveleva, O. The criterion for managing the sustainable use of natural resources. In Proceedings of the International Scientific-Practical Conference on Business Cooperation (ISPCBS 2019), Pskov, Russia, 21–23 May 2019; Advances in Economics, Business and Management Research. Atlantis Press: Dordrecht, The Netherlands, 2019; Volume 90, pp. 425–428. [Google Scholar] [CrossRef]
- Zharov, V.S.; Kozlov, A.V. Predictive analytical support to business process management improvement of production technology. In Proceedings of the 33rd International Business Information Management Association Conference, IBIMA 2019, Granada, Spain, 10–11 April 2019; Education Excellence and Innovation Management through Vision 2020. Volume 2019, pp. 8768–8773. [Google Scholar]
- Zharov, V.S.; Kozlov, A.V. Management of technological development of enterprises on the basis of a life cycle model. In Proceedings of the 2018 IEEE International Conference “Quality Management, Transport and Information Security, Information Technologies” (IT&QM&IS), St. Petersburg, Russia, 24–28 September 2018; pp. 181–184. [Google Scholar] [CrossRef]
- Figge, F.; Hahn, T. Sustainable Value Added–Measuring corporate contributions to sustainability beyond eco-efficiency. Ecol. Econ. 2004, 48, 173–187. [Google Scholar] [CrossRef]
- Chesbrough, H. Open Innovation: The New Imperative for Creating and Profiting from Technology; Harvard Business Press: Boston, MA, USA, 2003. [Google Scholar]
- Zharov, V.; Tsukerman, V. Investment-innovation analysis of interactions between technological and economic aspects of industrial development of mineral resources in the Arctic. IOP Conf. Ser. Earth Environ. Sci. 2019, 302, 012130. [Google Scholar] [CrossRef]
- Zharov, V.S. Formation of a system of indicators for evaluating the effectiveness of using various types of technological innovations. In Proceeding of the International Science and Technology Conference “FarEastCon 2021”; Smart Innovation, Systems and Technologies; Solovev, D.B., Savaley, V.V., Bekker, A.T., Petukhov, V.I., Eds.; Springer: Singapore; Volume 275. [CrossRef]
- PJSC “Norilsk Nickel”. PJSC Financial Disclosures. Available online: https://www.nornickel.ru/investors/disclosure/financials/ (accessed on 27 February 2023).
- PJSC “Severstal”. PJSC “Severstal” Financial Disclosures Based on Russian Accounting Standards. Available online: https://severstal.com/rus/ir/indicators-reporting/finreps-rsbu/?PAGEN_1=2 (accessed on 27 February 2023).
- Boliden, A.B. Annual Reports. Available online: https://www.boliden.com/investor-relations/reports-and-presentations/annual-reports (accessed on 27 February 2023).
- Freeport-McMoRan Inc. Annual Reports & Proxy. Available online: https://investors.fcx.com/investors/financial-information/annual-reports-and-proxy/default.aspx (accessed on 27 February 2023).


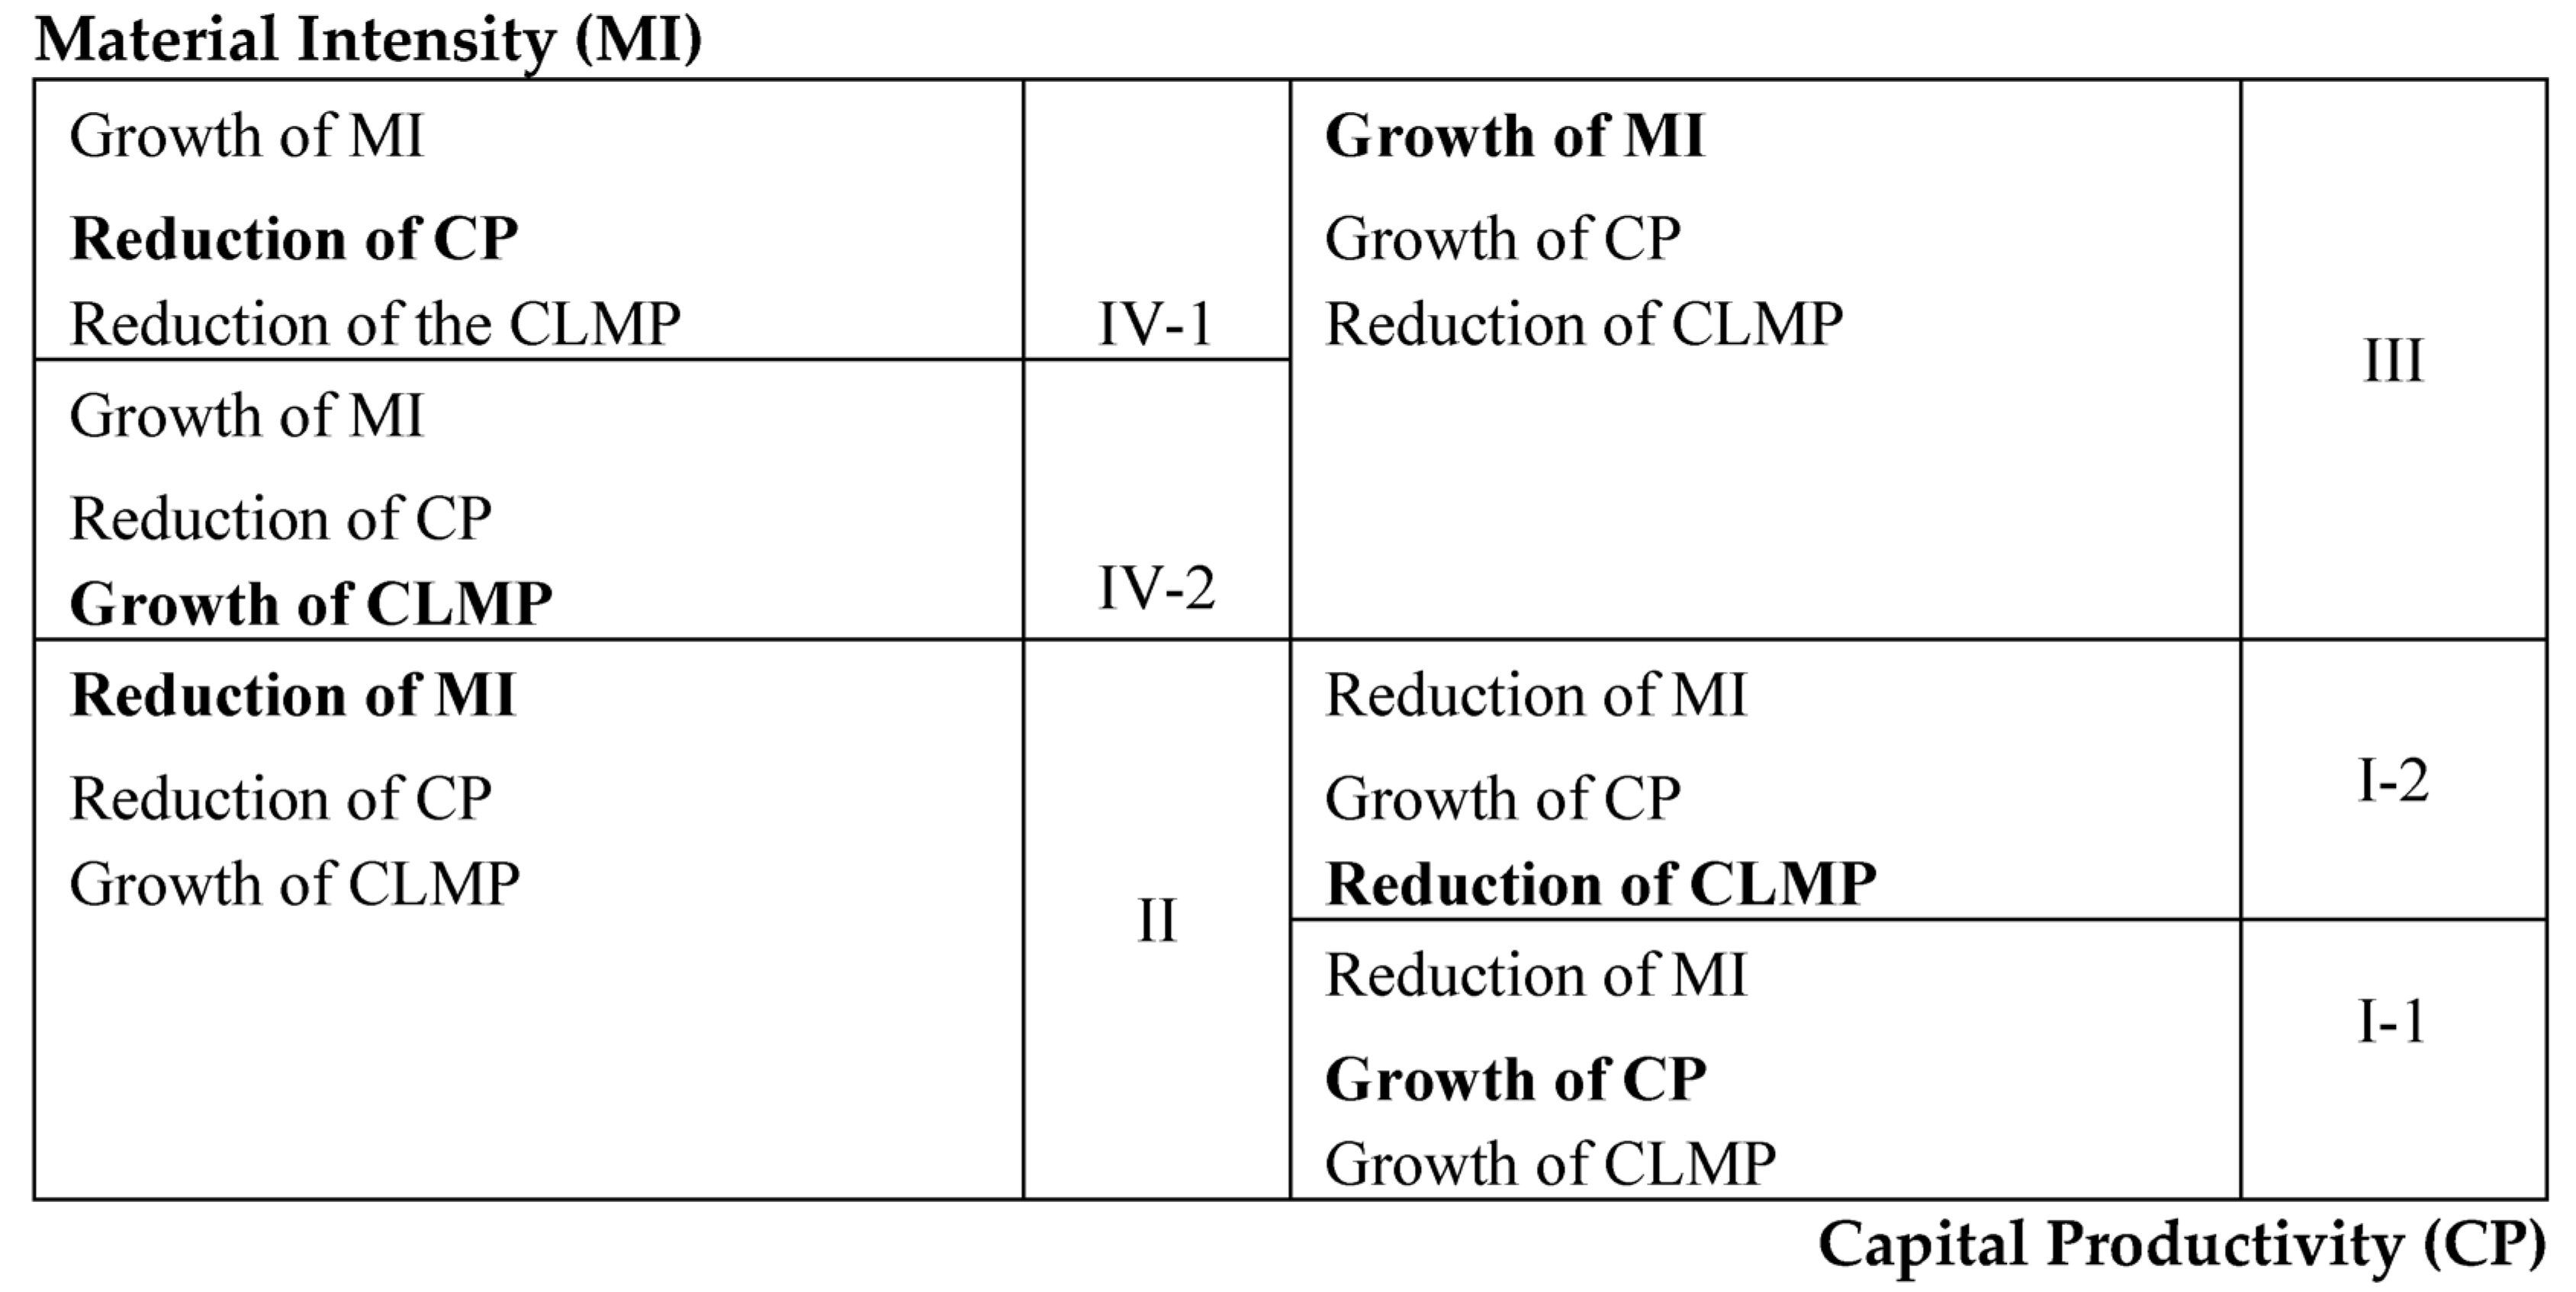
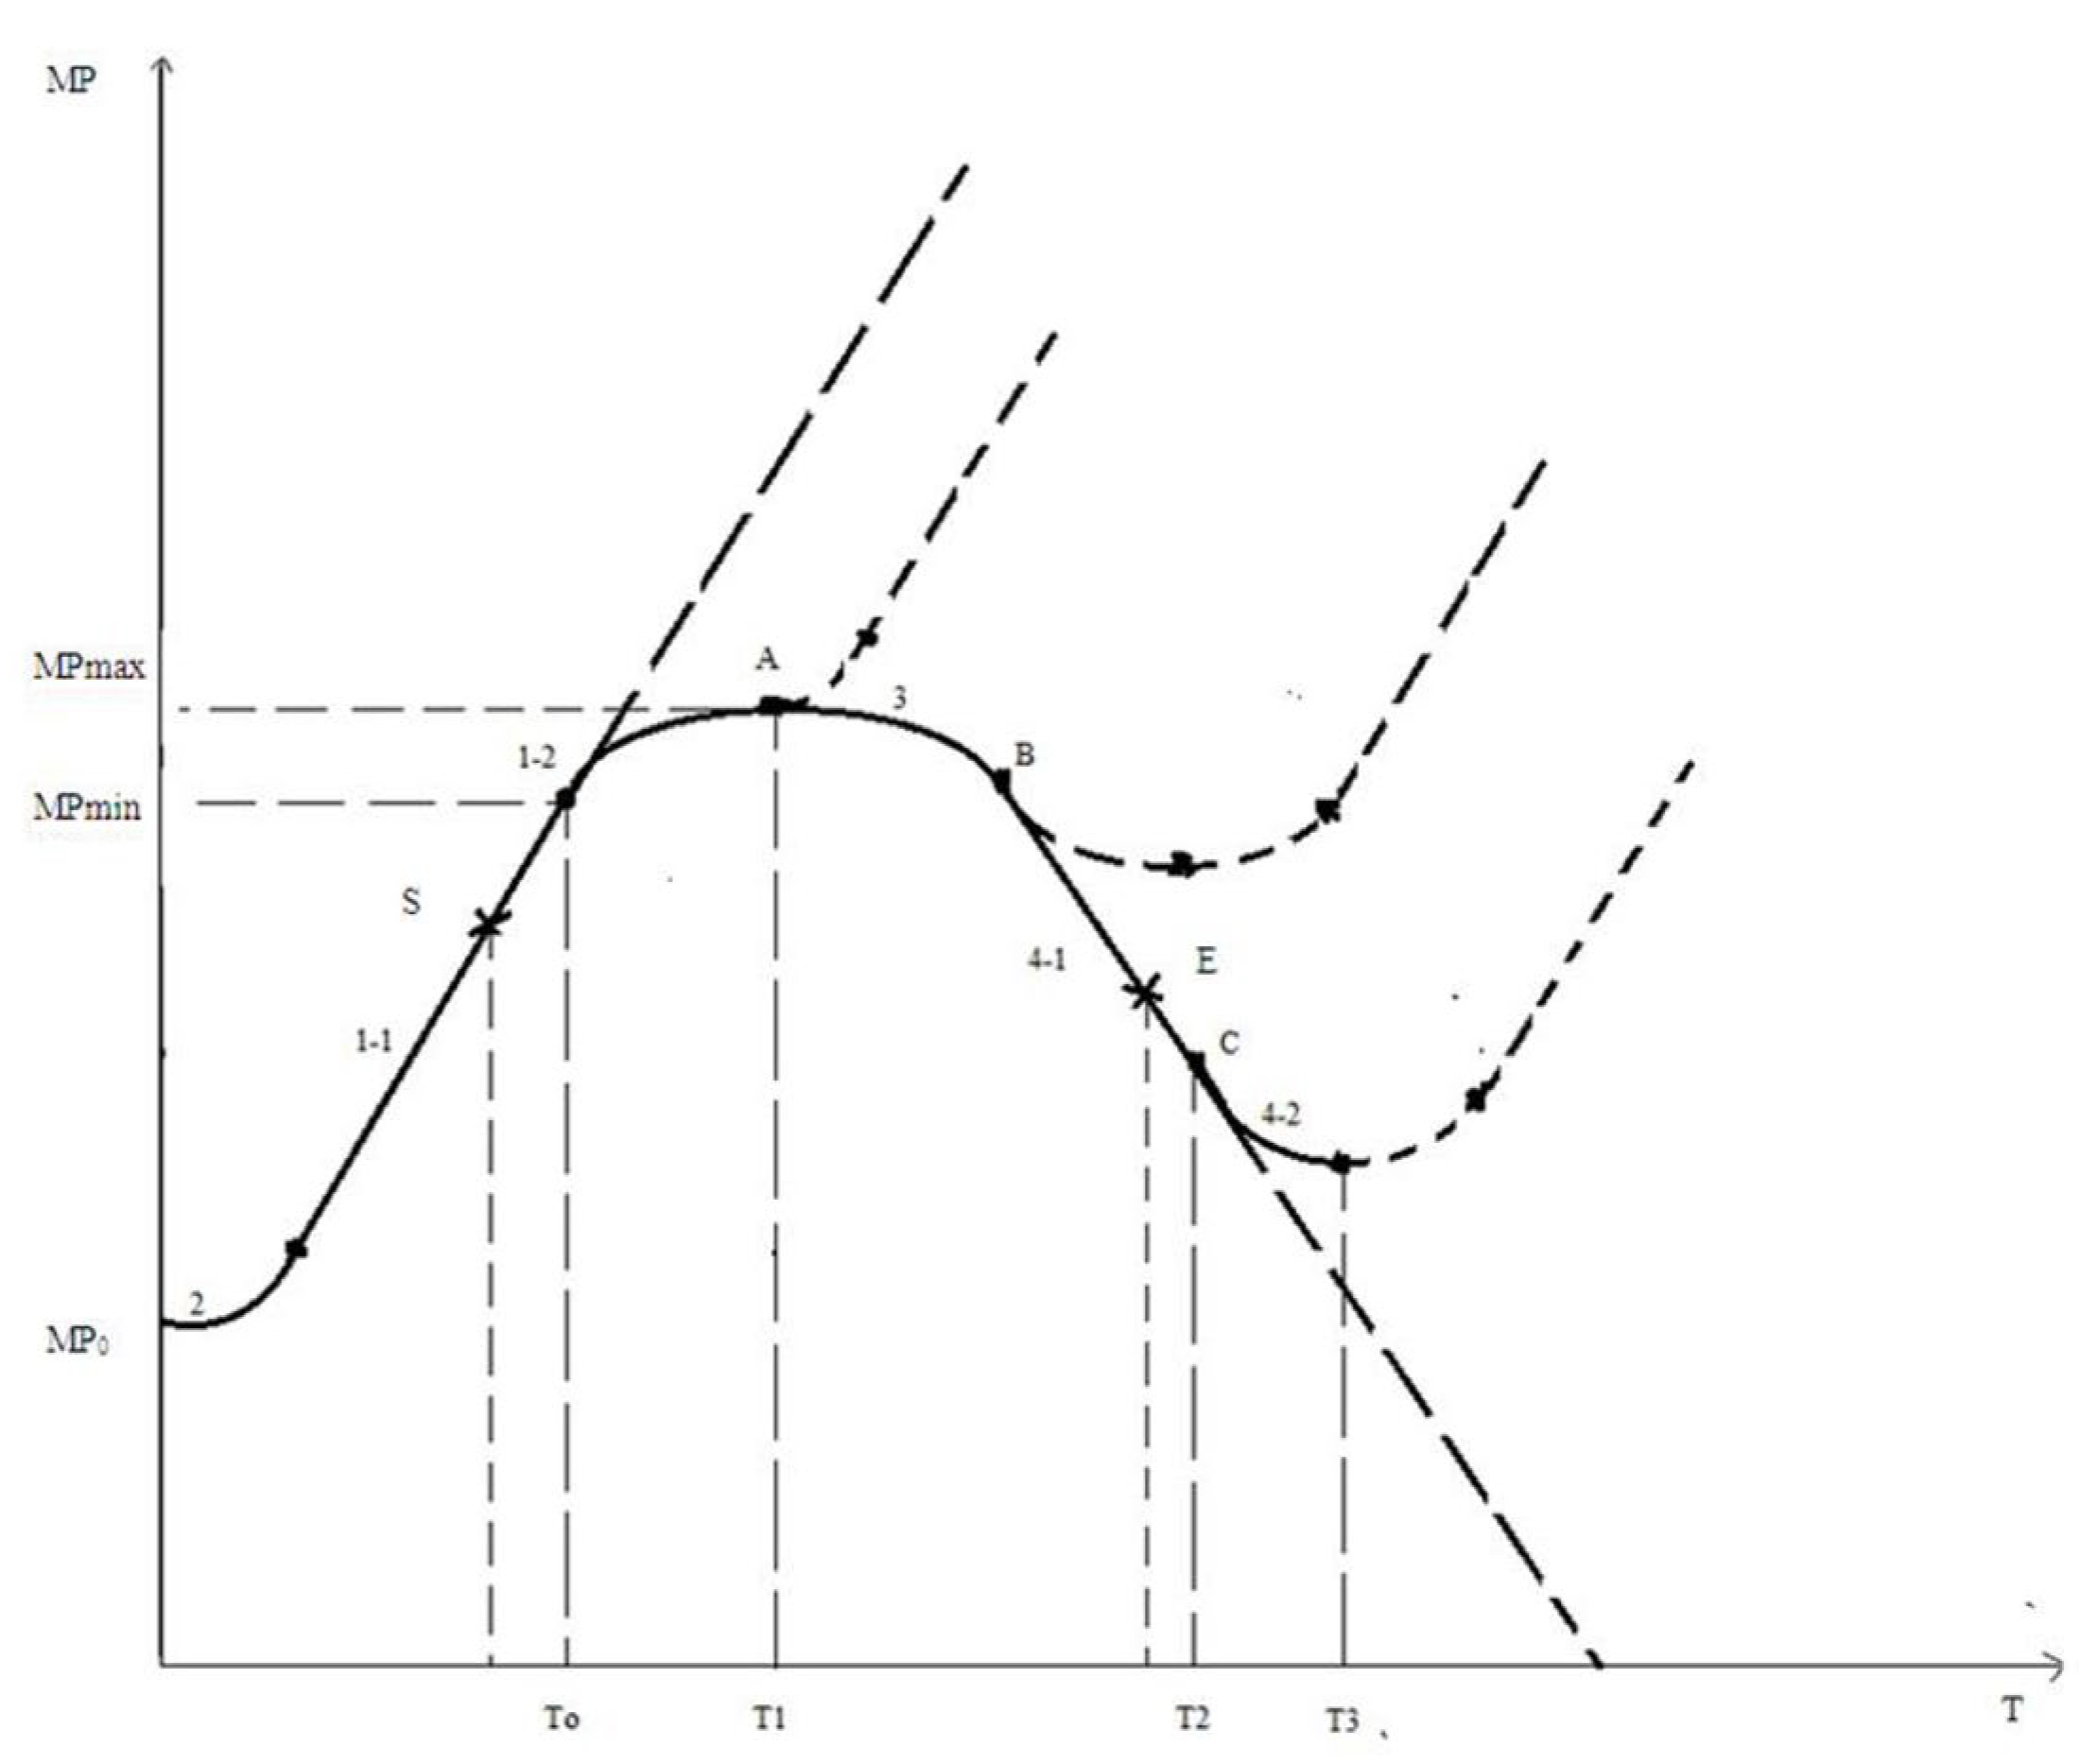
| The Number of the Stage of Technological Development | Indicators of the Level of Sustainability | The Level and Dynamics of Sustainability |
|---|---|---|
| 2 | MP increases CP decreases CLMP increases | The increase in the level of stability |
| 1-1 | MP increases CP increases CLMP increases | Maximum level of stability |
| 1-2 | MP increases CP increases CLMP decreases | Reducing the level of stability |
| 3 | MP decreases CP increases CLMP decreases | Increasing the level of instability |
| 4-1 | MP decreases CP decreases CLMP decreases | Maximum instability level |
| 4-2 | MP decreases CP decreases CLMP increases | Reducing the level of instability |
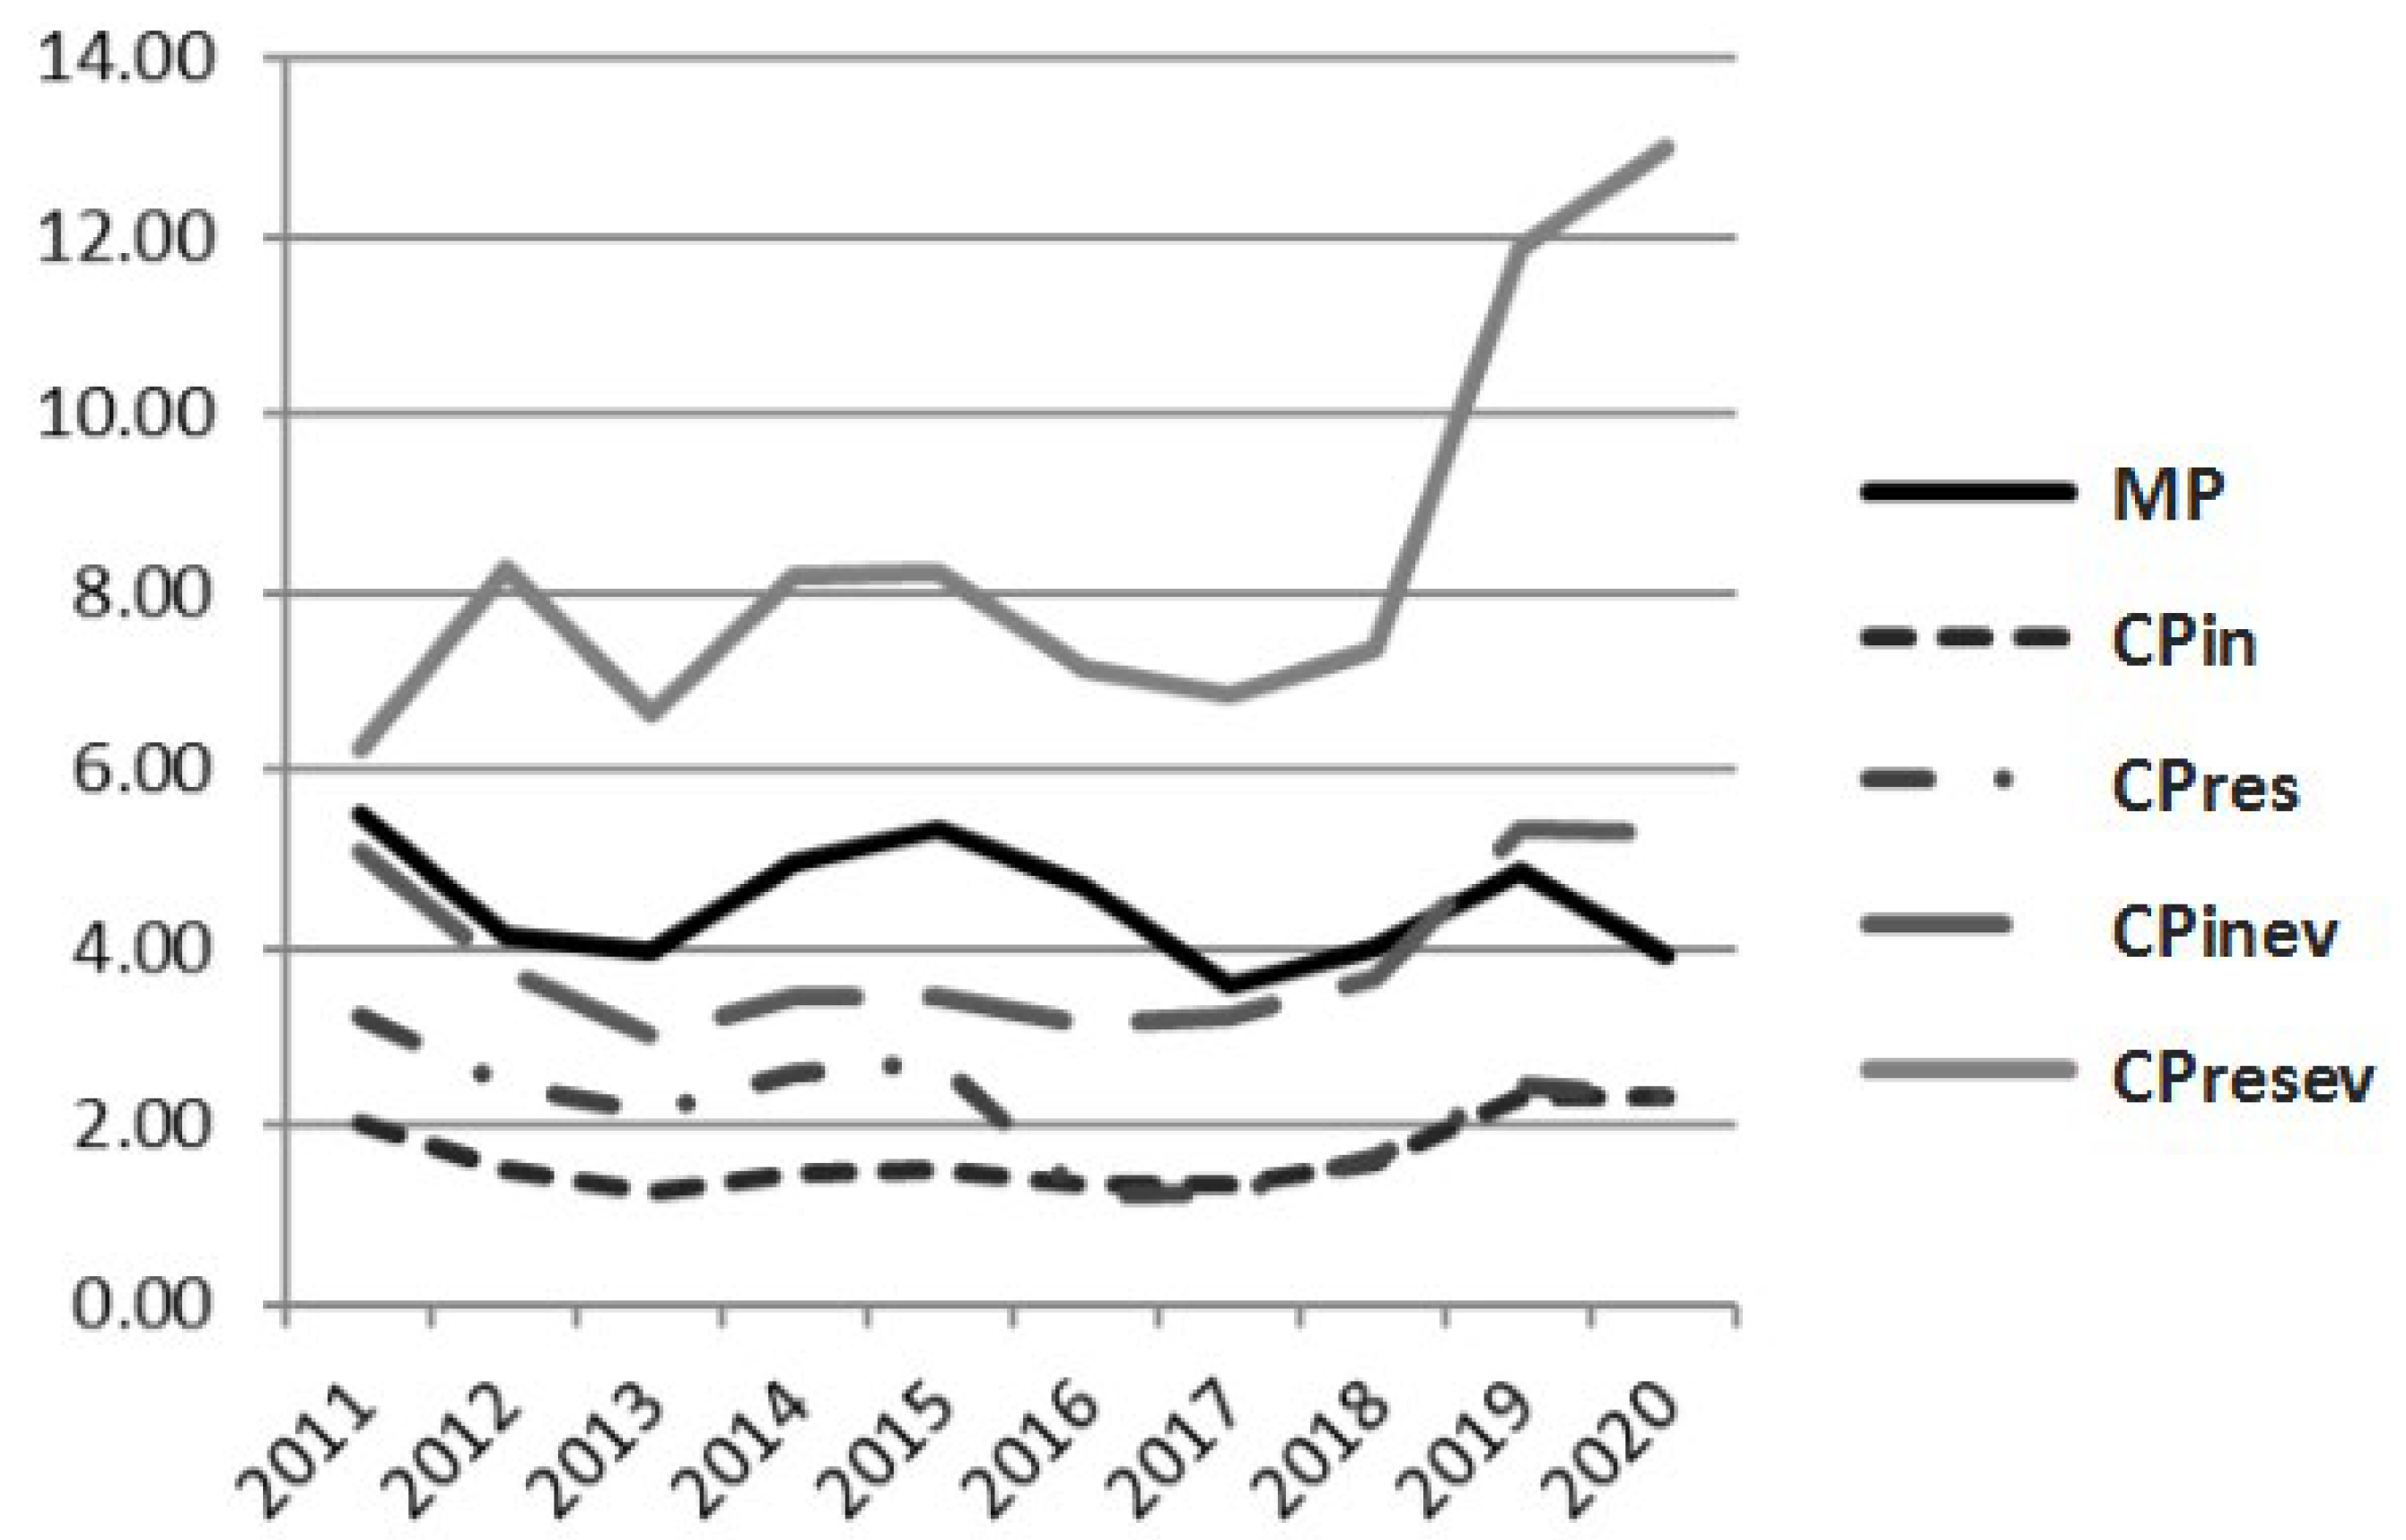
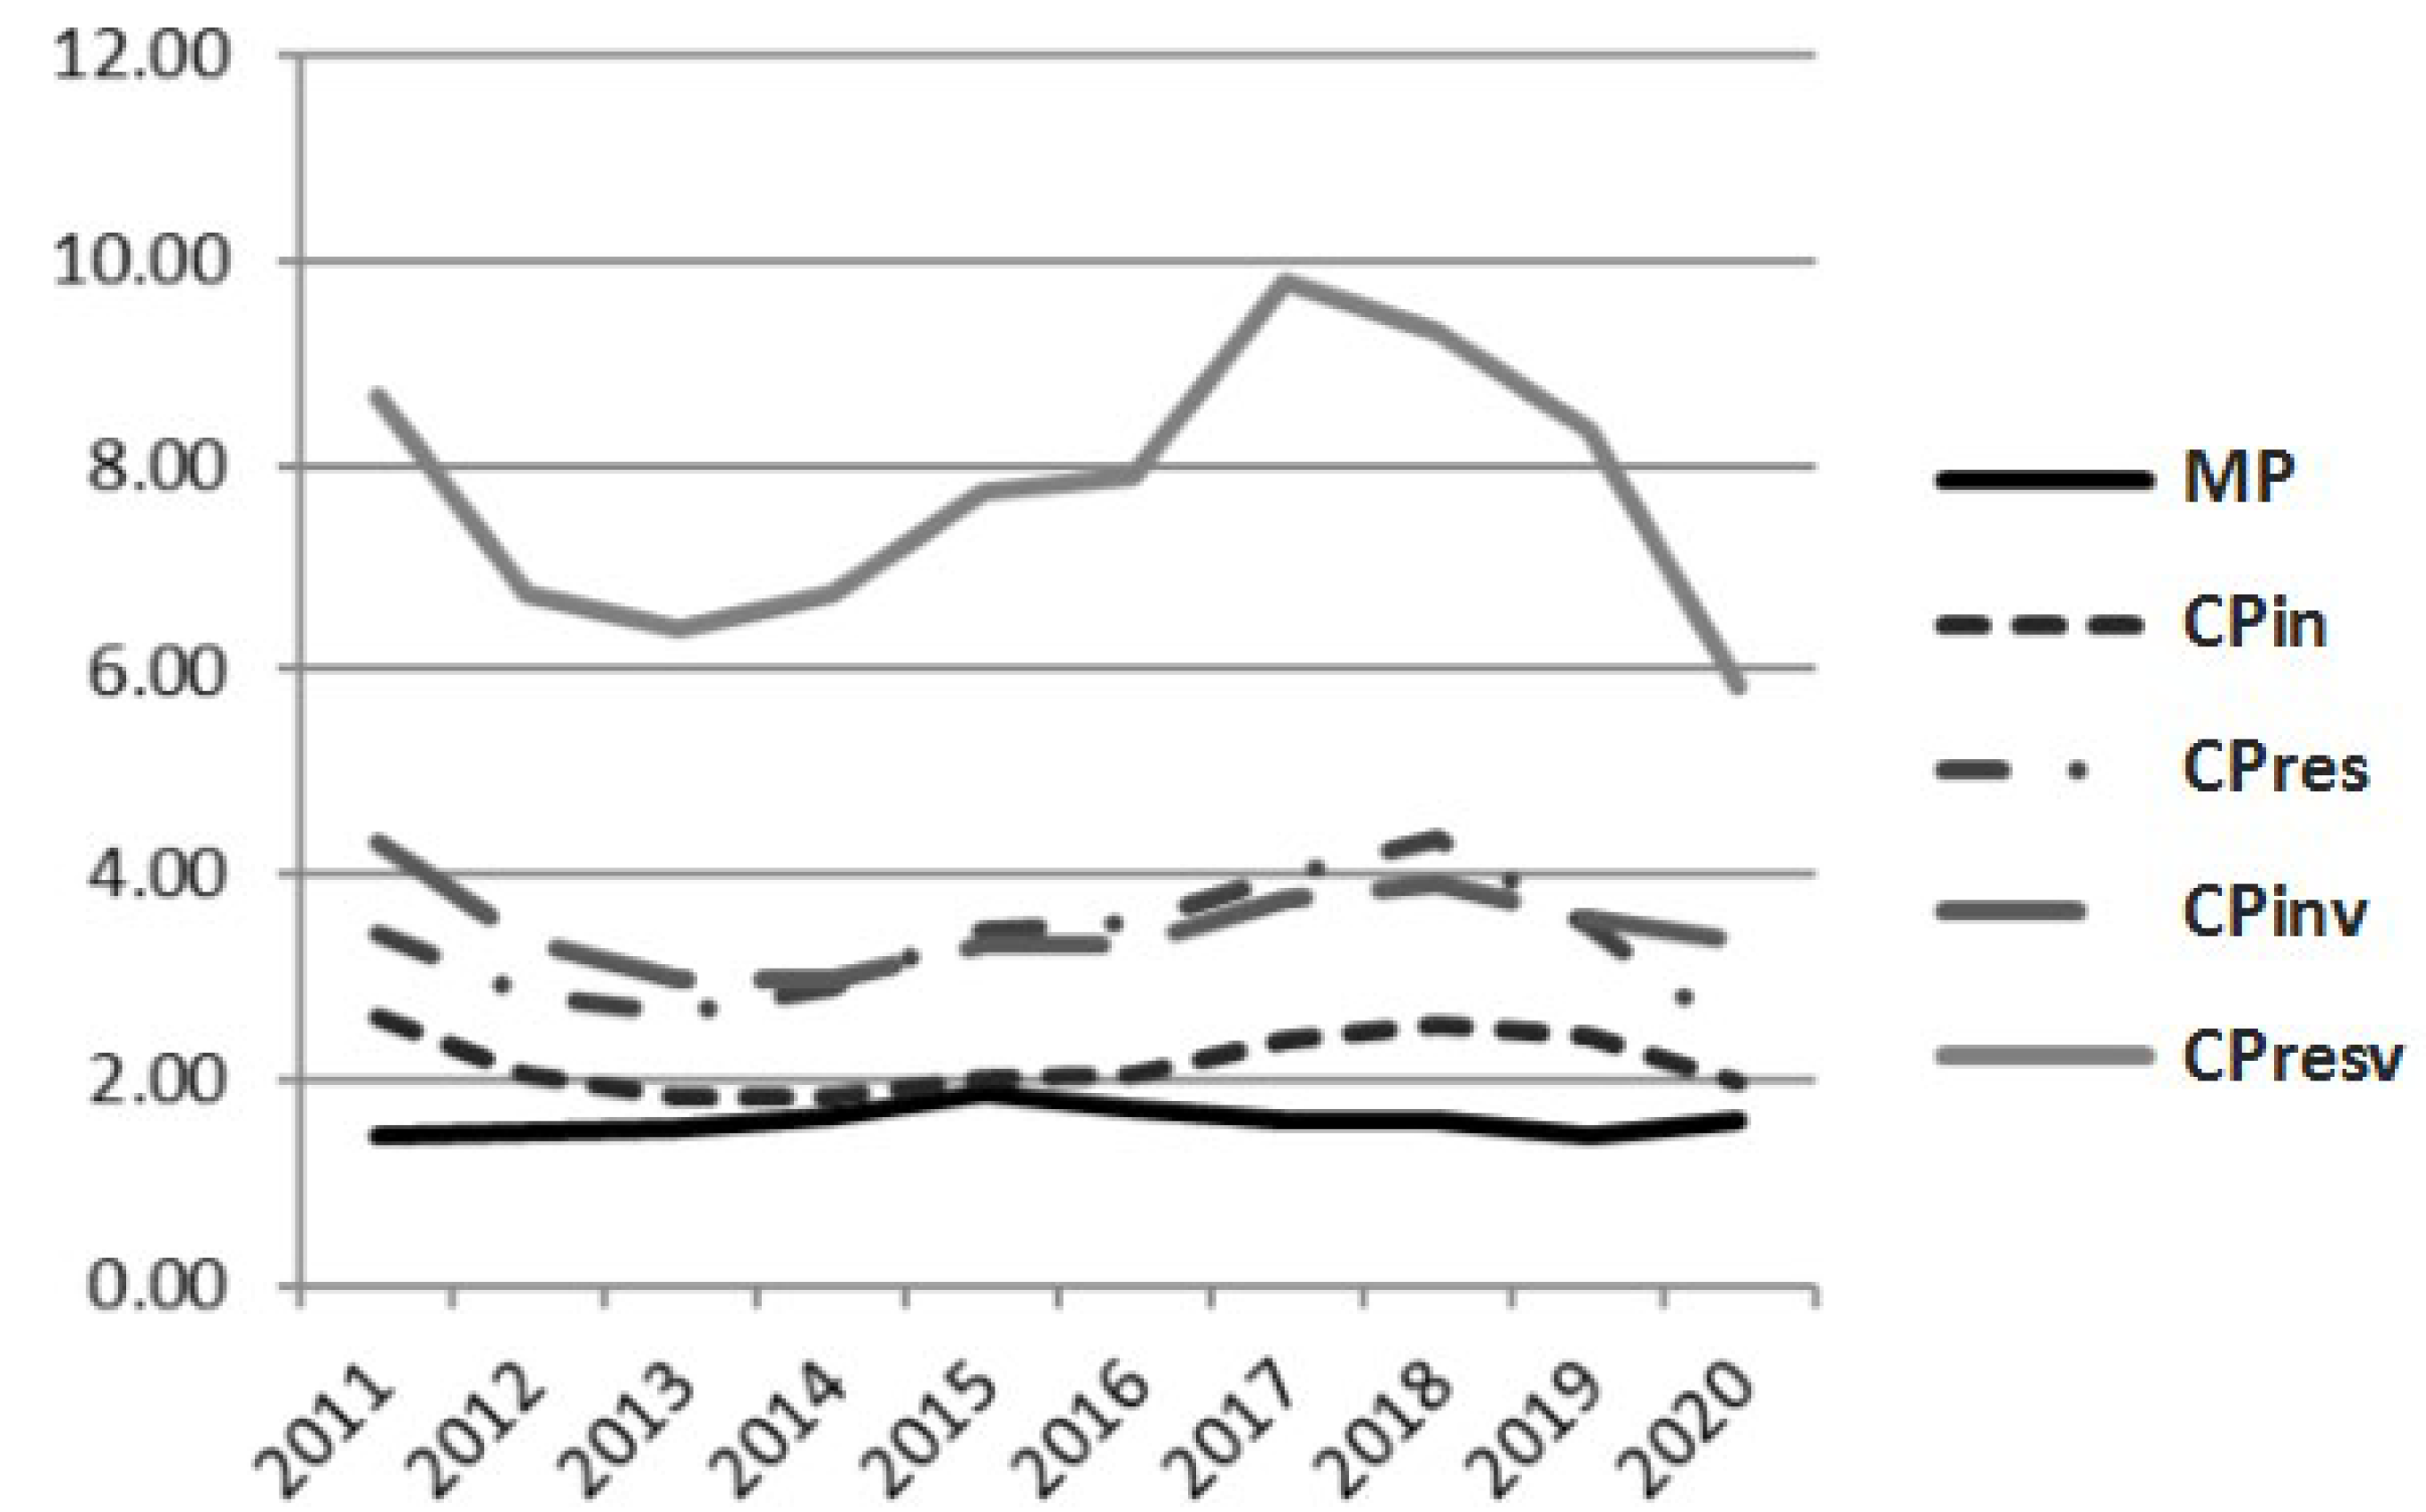
| Indicator | 2011 | 2012 | 2013 | 2014 | 2015 | 2016 | 2017 | 2018 | 2019 | 2020 |
|---|---|---|---|---|---|---|---|---|---|---|
| PJSC “Norilsk Nickel” | ||||||||||
| MP | 5.51 | 4.16 | 3.95 | 4.96 | 5.35 | 4.68 | 3.59 | 3.99 | 4.86 | 3.94 |
| CPin | 2.02 | 1.54 | 1.28 | 1.47 | 1.50 | 1.34 | 1.35 | 1.59 | 2.35 | 2.34 |
| CLMP(in) | 2.73 | 2.71 | 3.10 | 3.38 | 3.56 | 3.50 | 2.66 | 2.51 | 2.07 | 1.68 |
| Life cycle stage | - | IV-1 | IV-2 | I-1 | I-1 | IV-2 | III | I-2 | I-2 | IV-1 |
| PJSC “Severstal” | ||||||||||
| MP | 1.44 | 1.51 | 1.53 | 1.65 | 1.85 | 1.73 | 1.62 | 1.62 | 1.45 | 1.60 |
| CPin | 2.62 | 2.05 | 1.84 | 1.83 | 2.02 | 2.07 | 2.37 | 2.53 | 2.42 | 1.97 |
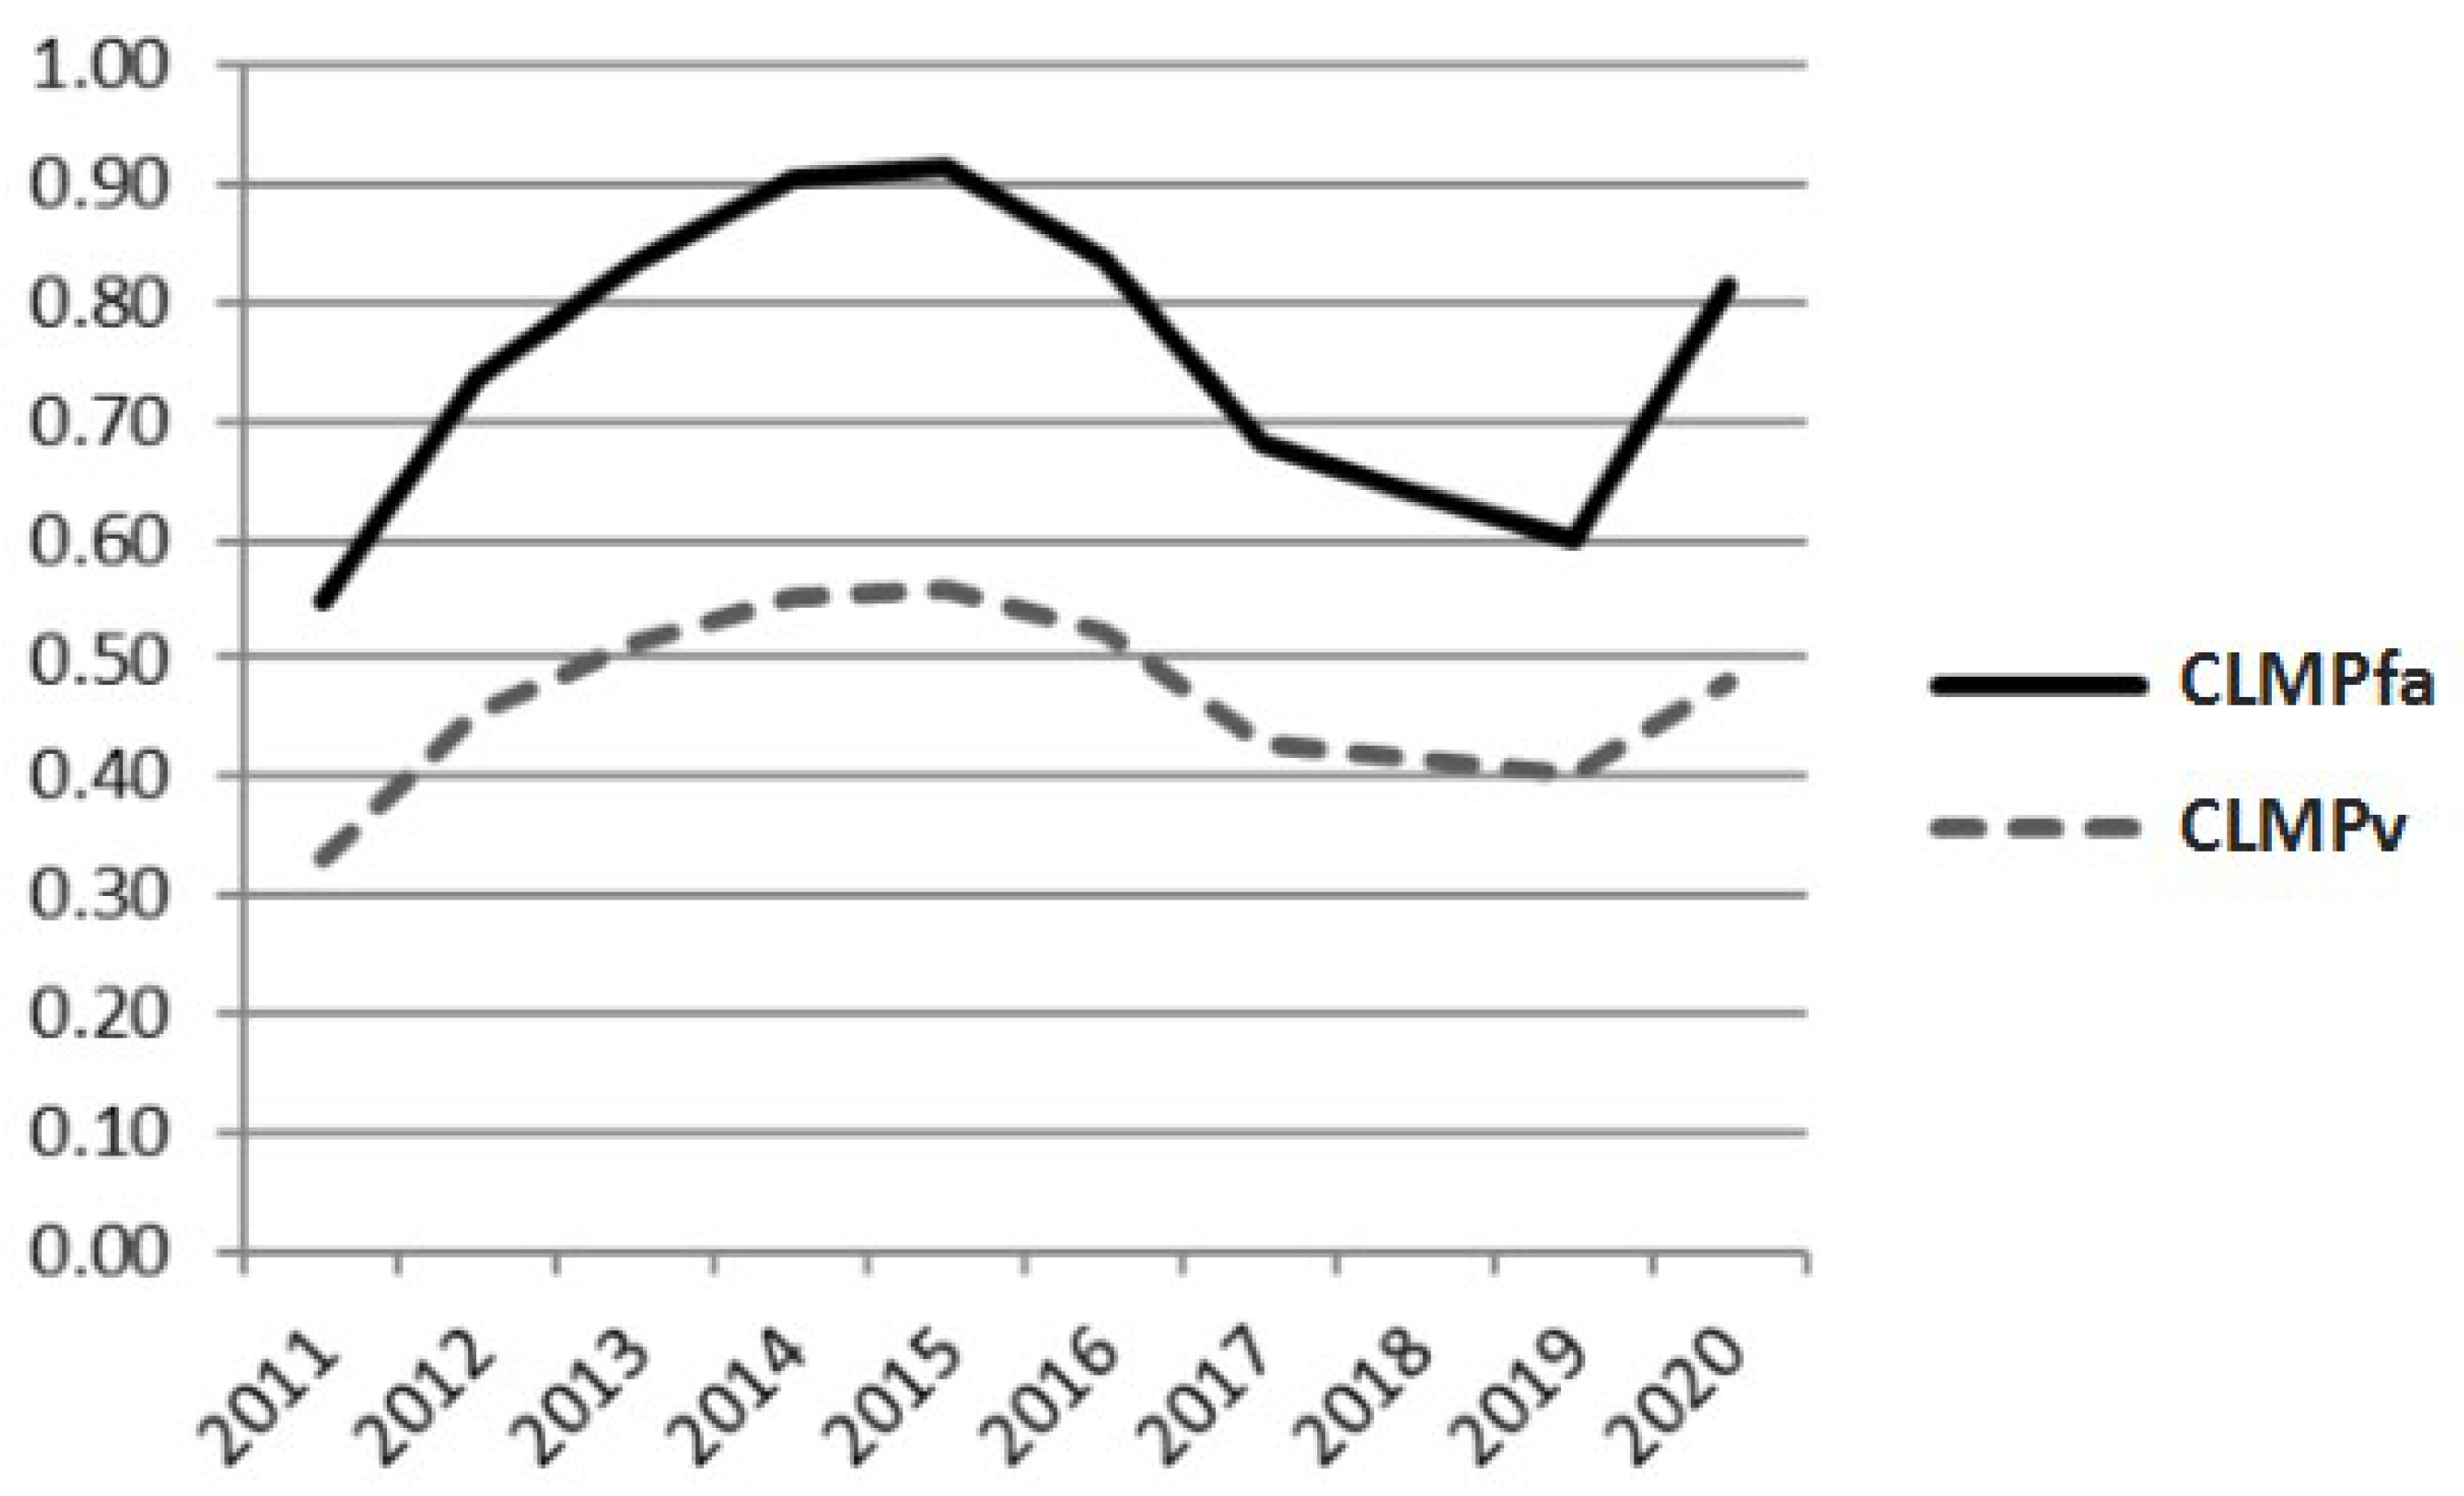
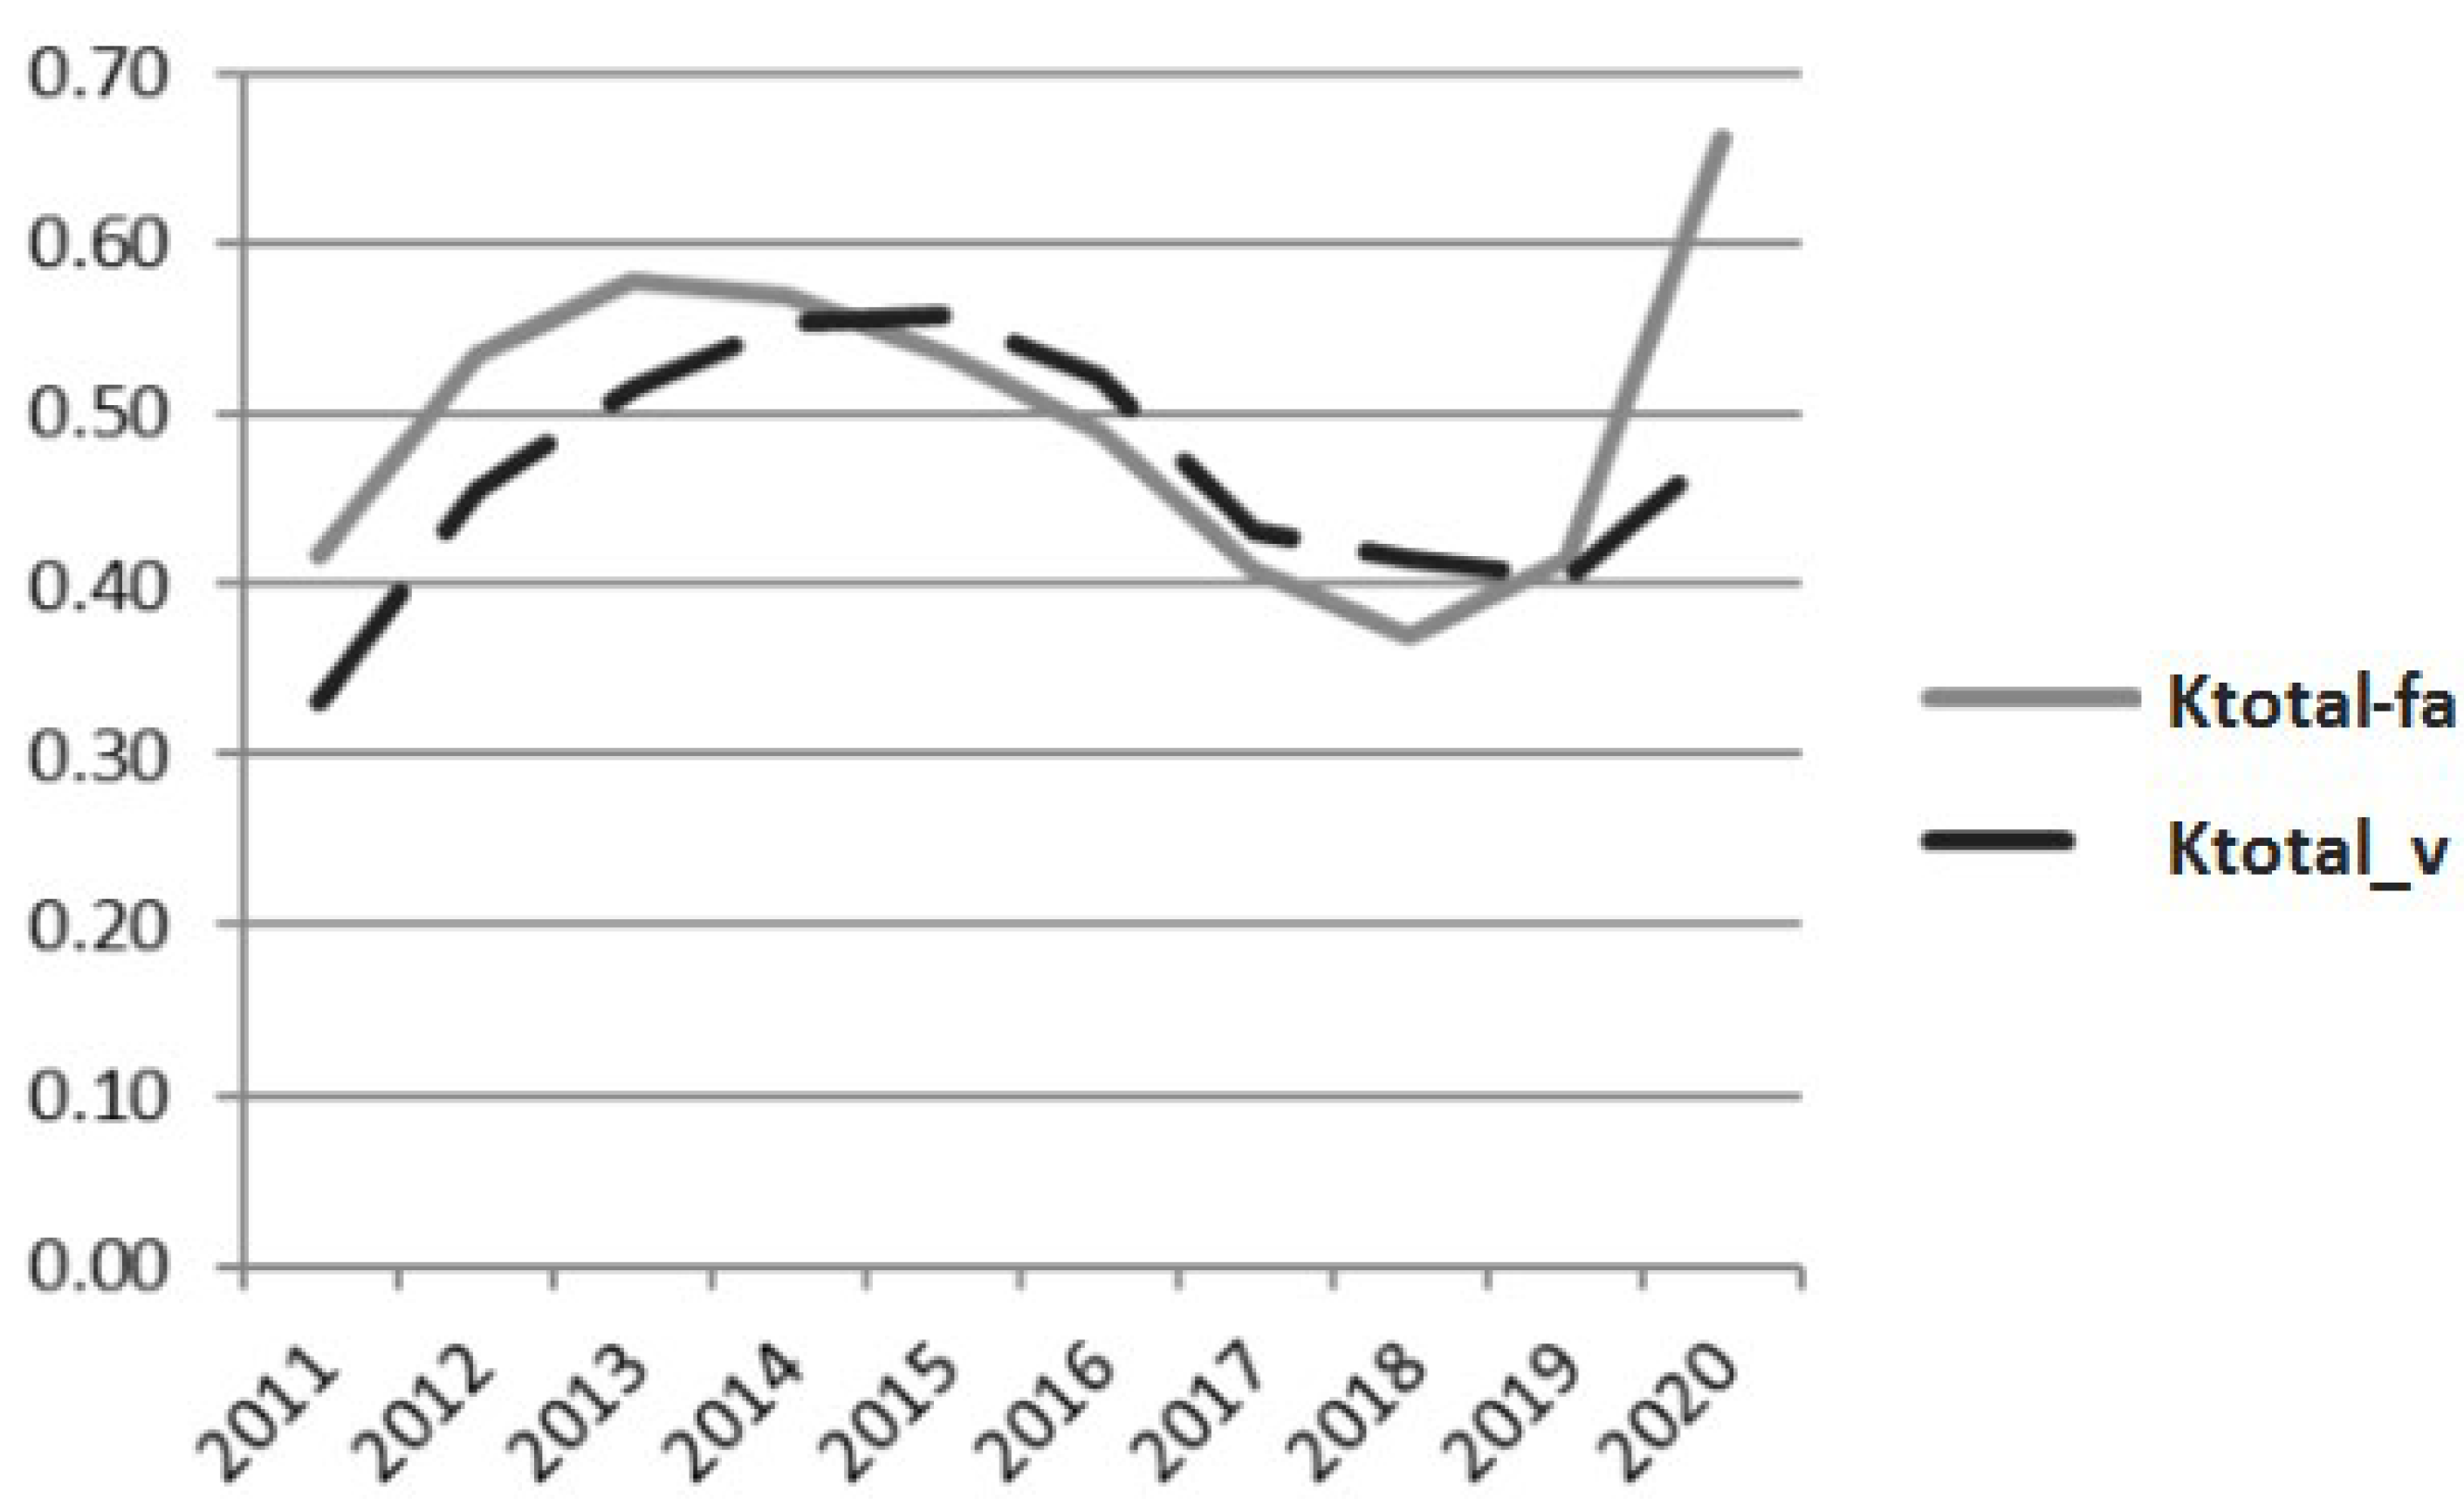
| CLMP(in) | 0.55 | 0.74 | 0.83 | 0.90 | 0.92 | 0.84 | 0.68 | 0.64 | 0.60 | 0.81 |
| Life cycle stage | - | II | II | II | I-1 | III | III | III | IV-1 | II |
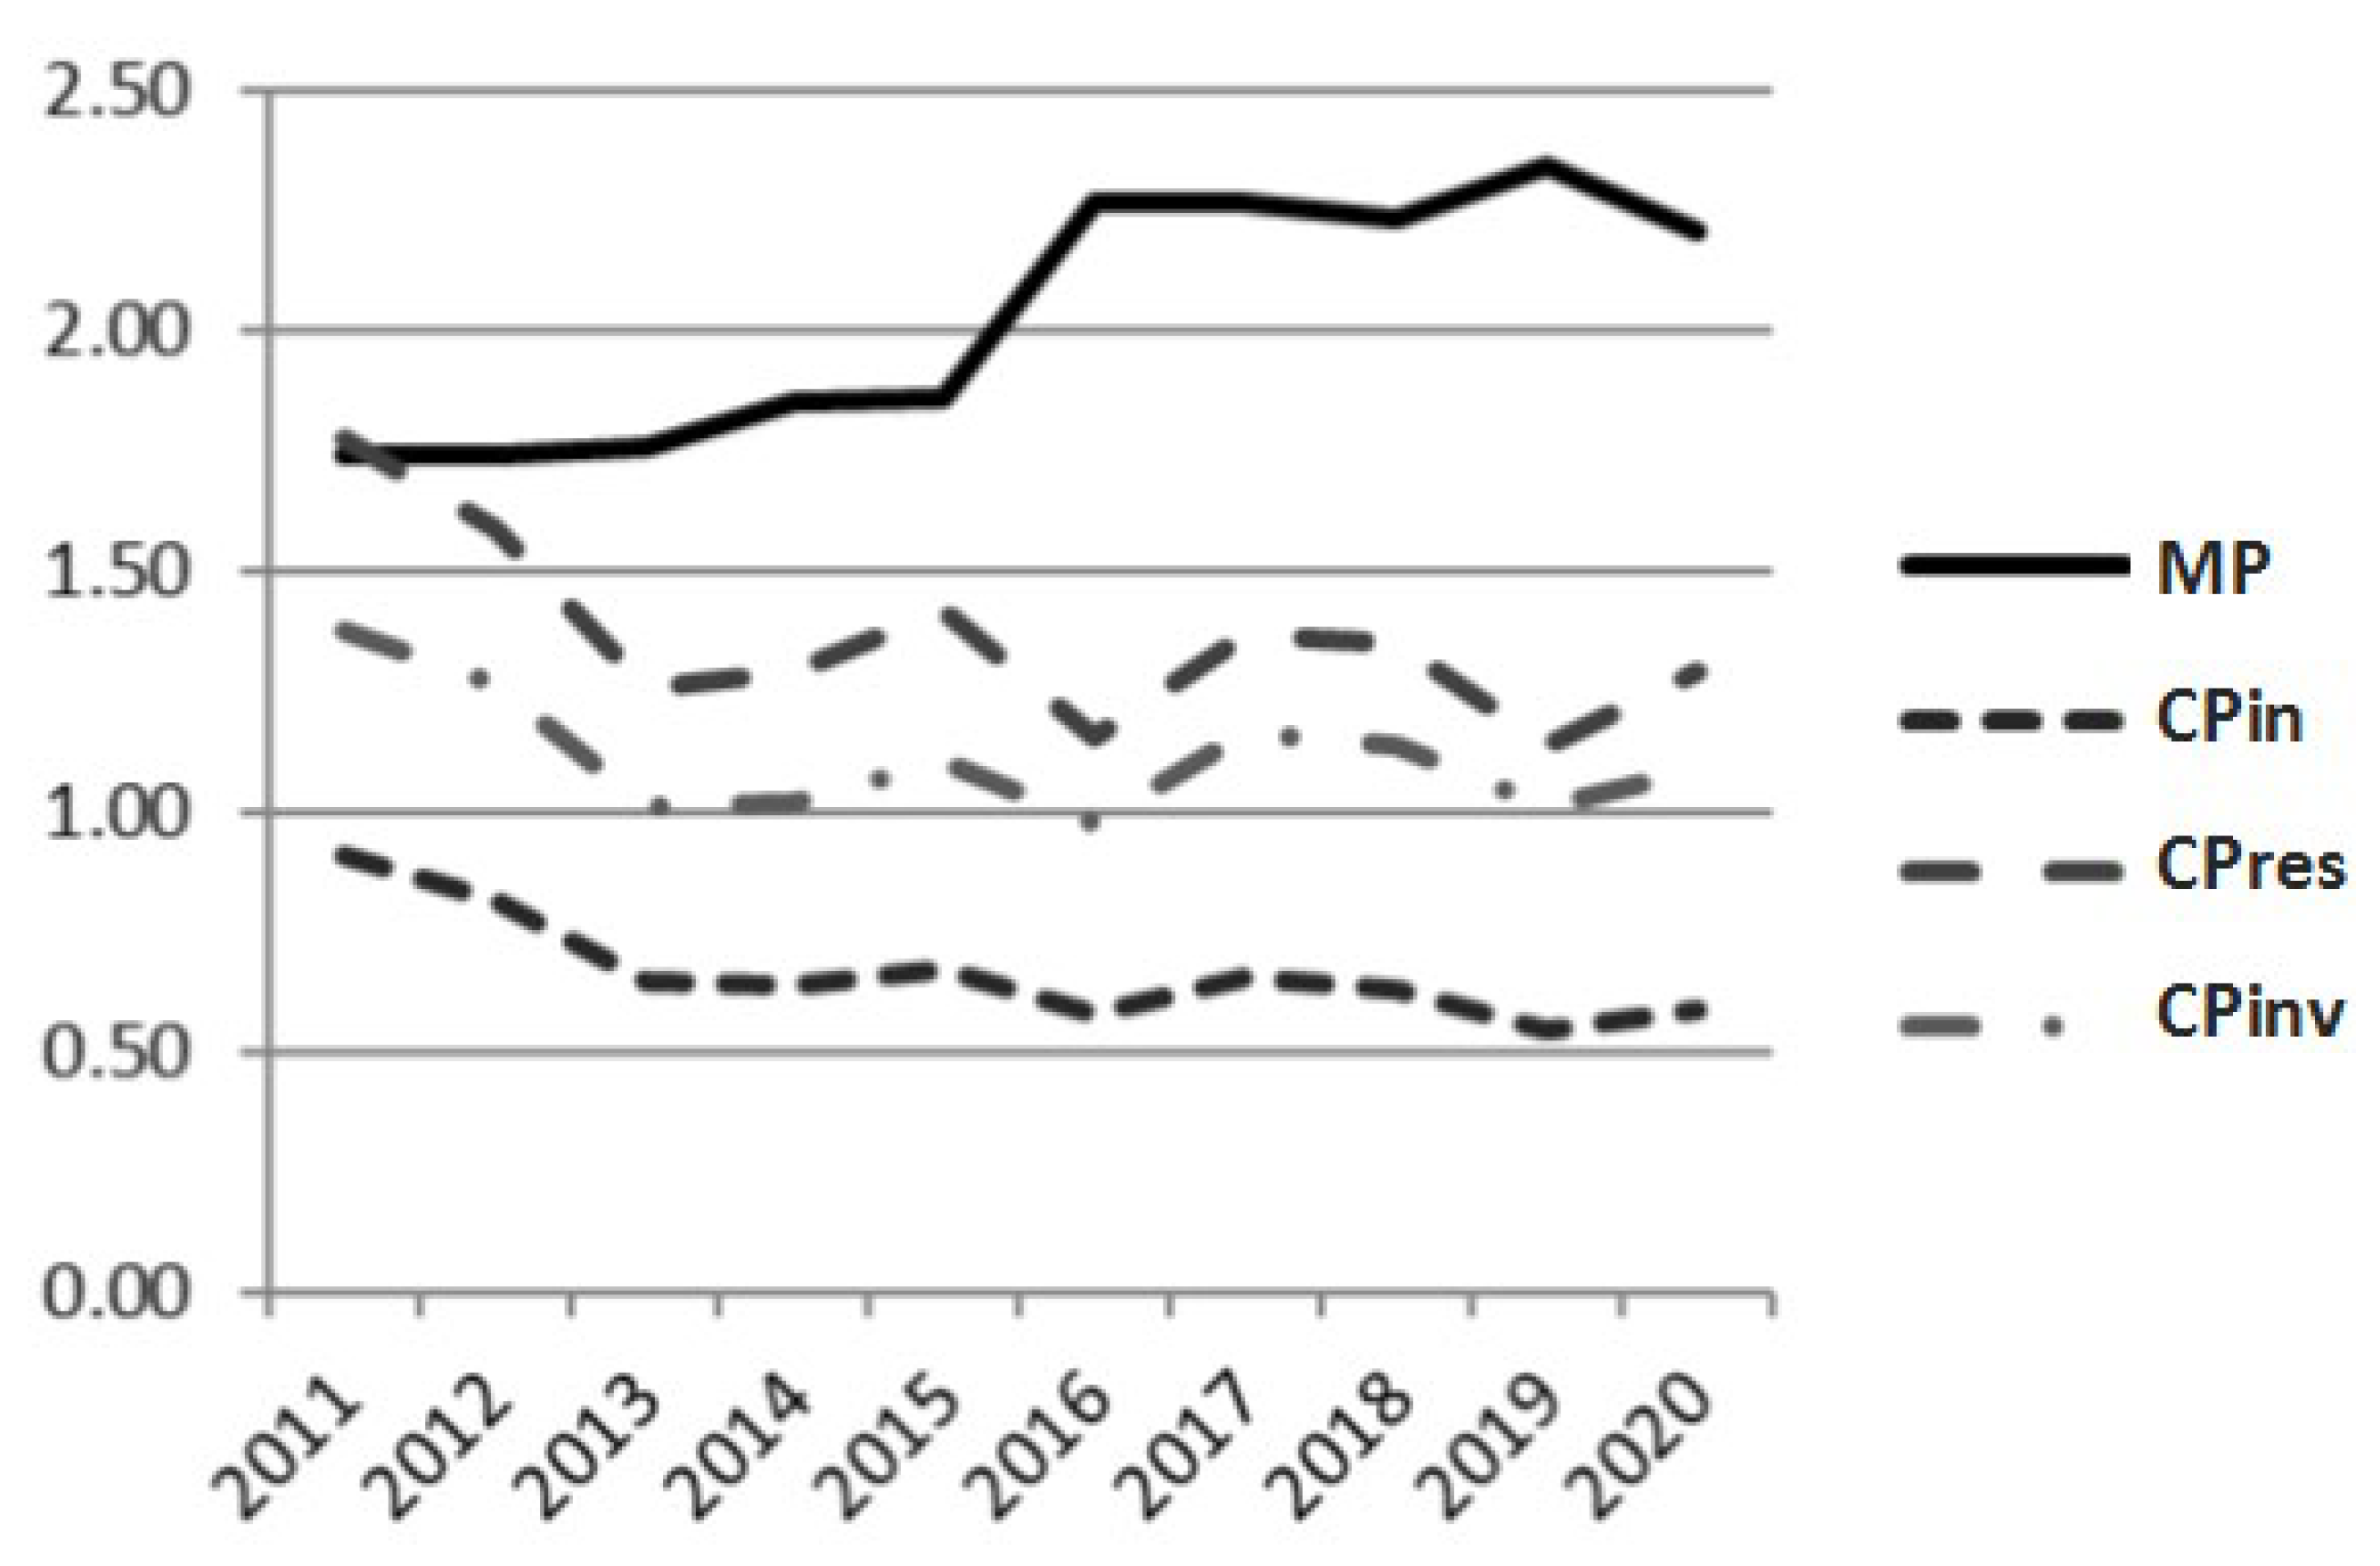
| Boliden AB | ||||||||||
| MP | 1.74 | 1.74 | 1.76 | 1.85 | 1.86 | 2.27 | 2.27 | 2.23 | 2.35 | 2.20 |
| CPin | 0.91 | 0.81 | 0.64 | 0.64 | 0.68 | 0.57 | 0.66 | 0.63 | 0.54 | 0.59 |
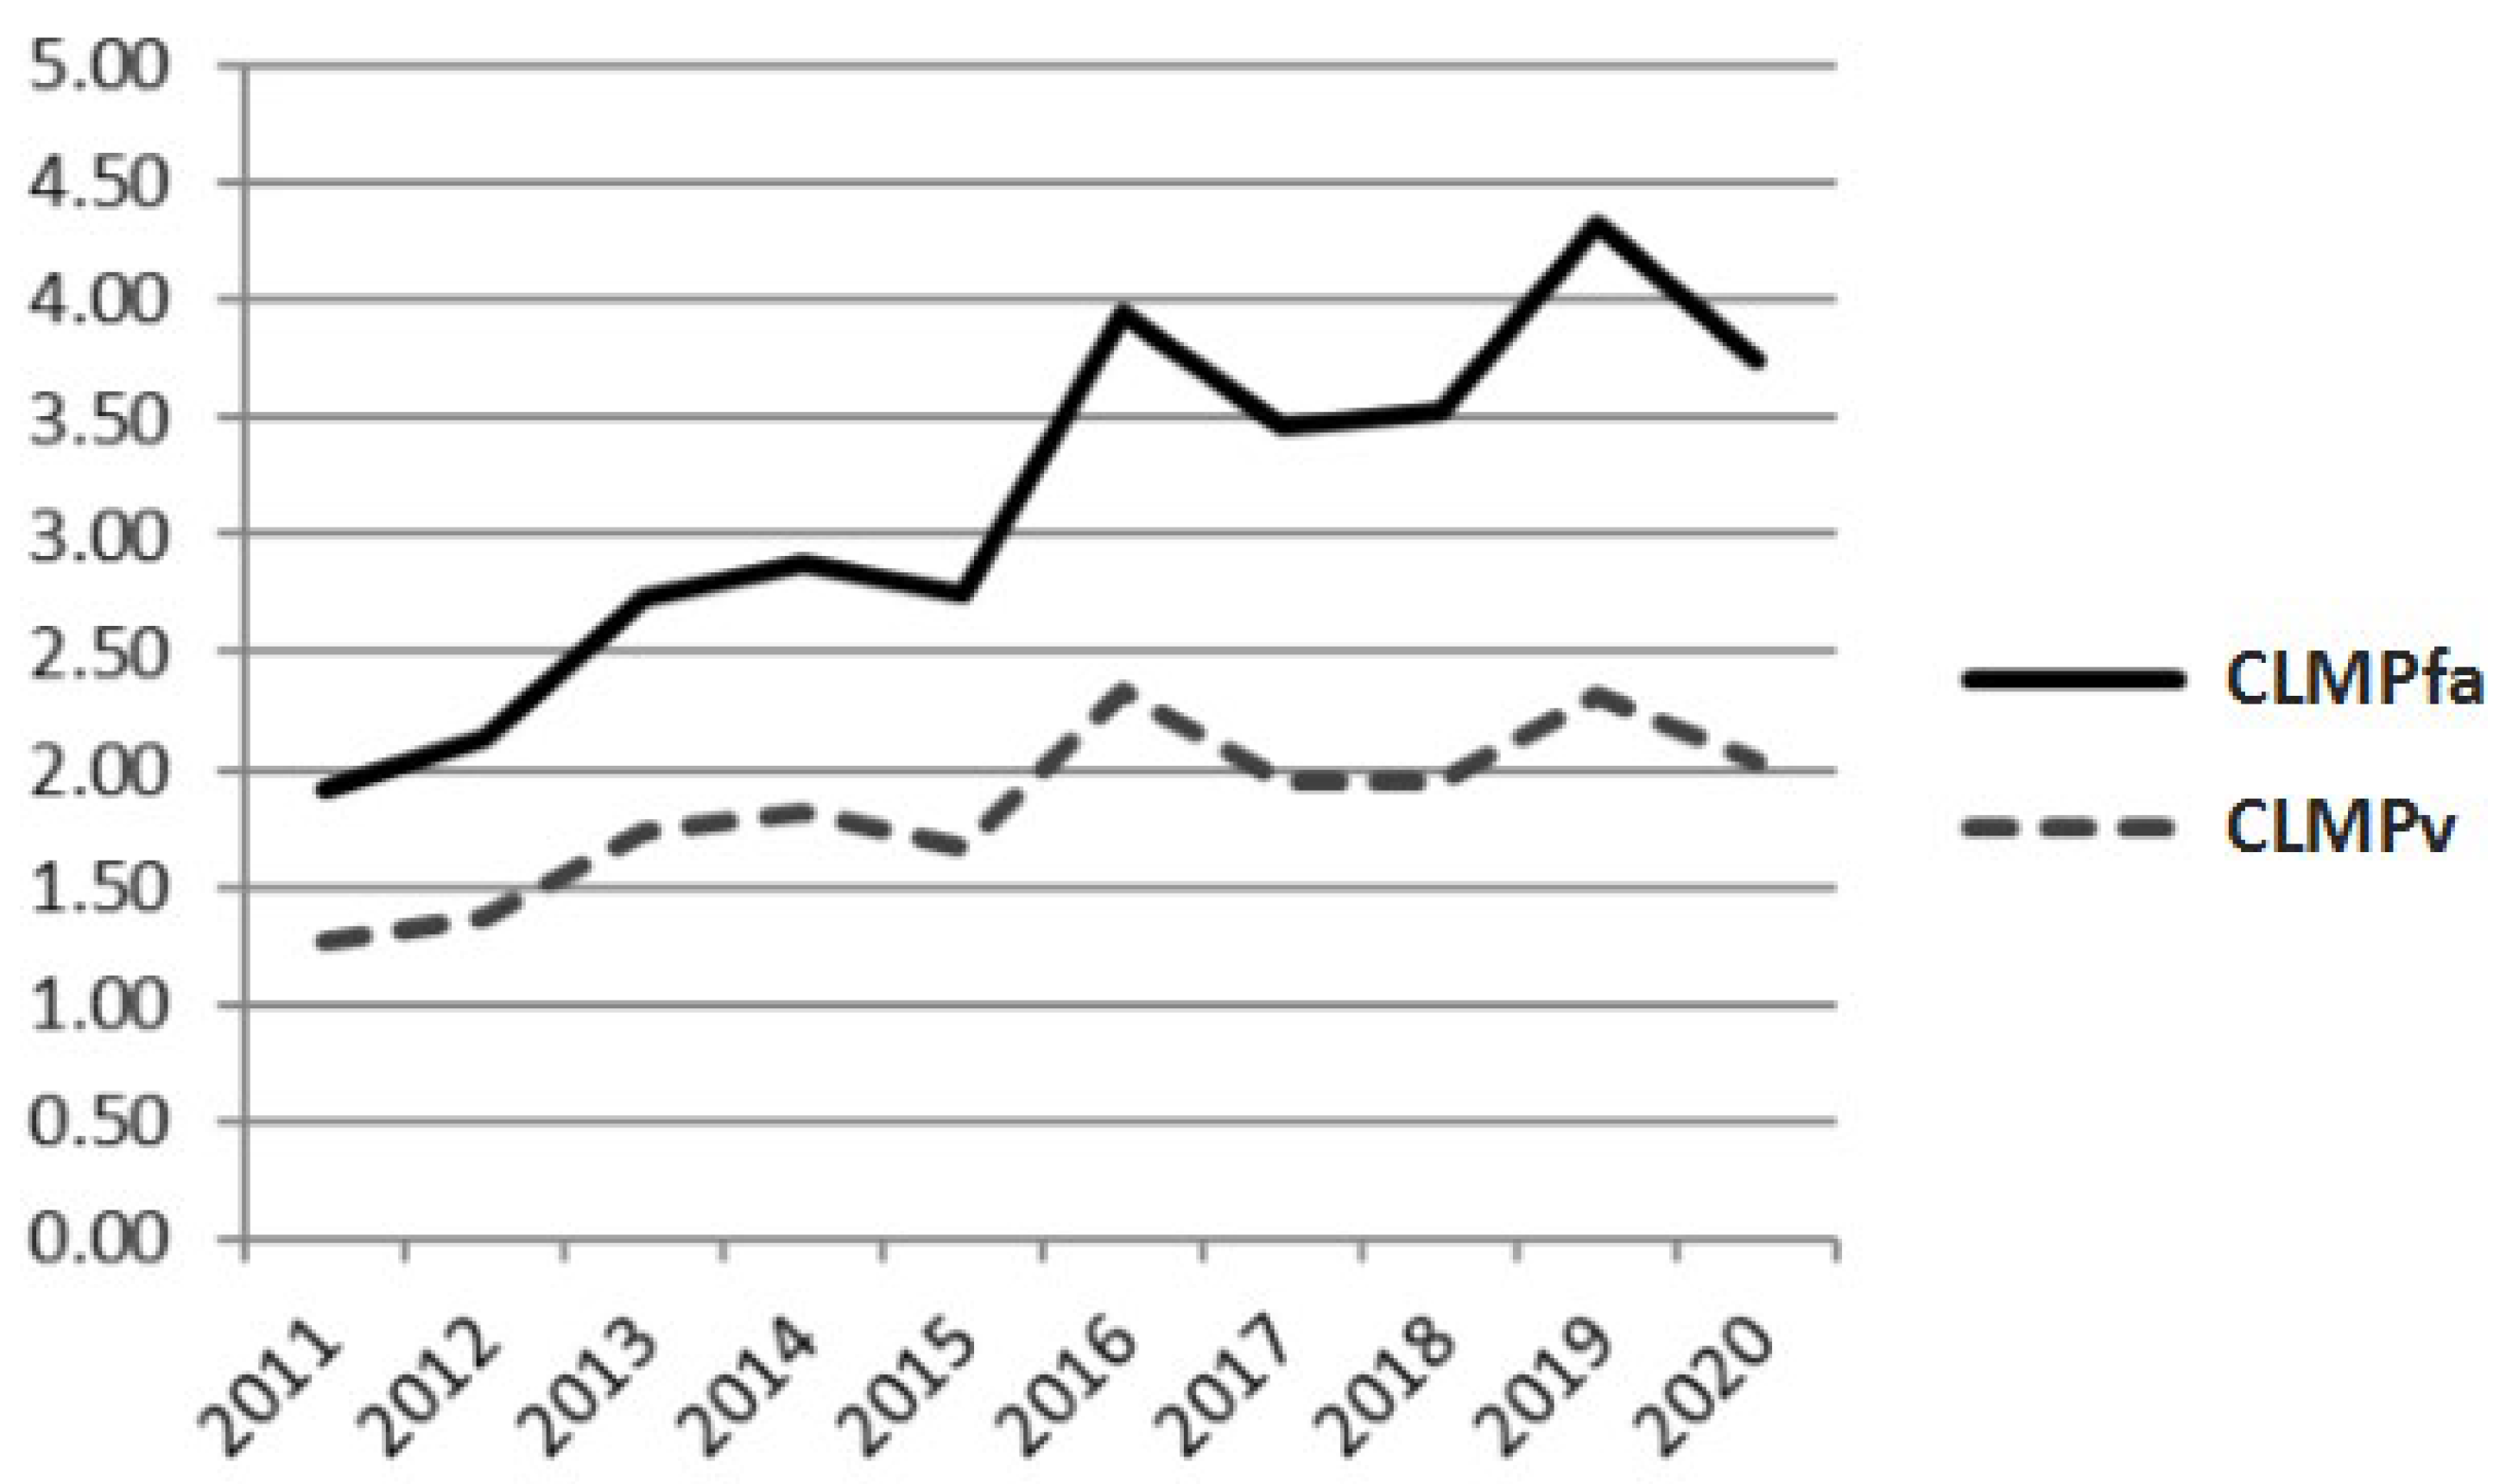
| CLMP(in) | 1.92 | 2.14 | 2.73 | 2.88 | 2.75 | 3.95 | 3.46 | 3.53 | 4.33 | 3.74 |
| Life cycle stage | - | II | II | II | I-1 | IV-1 | I-1 | IV-1 | II | II |
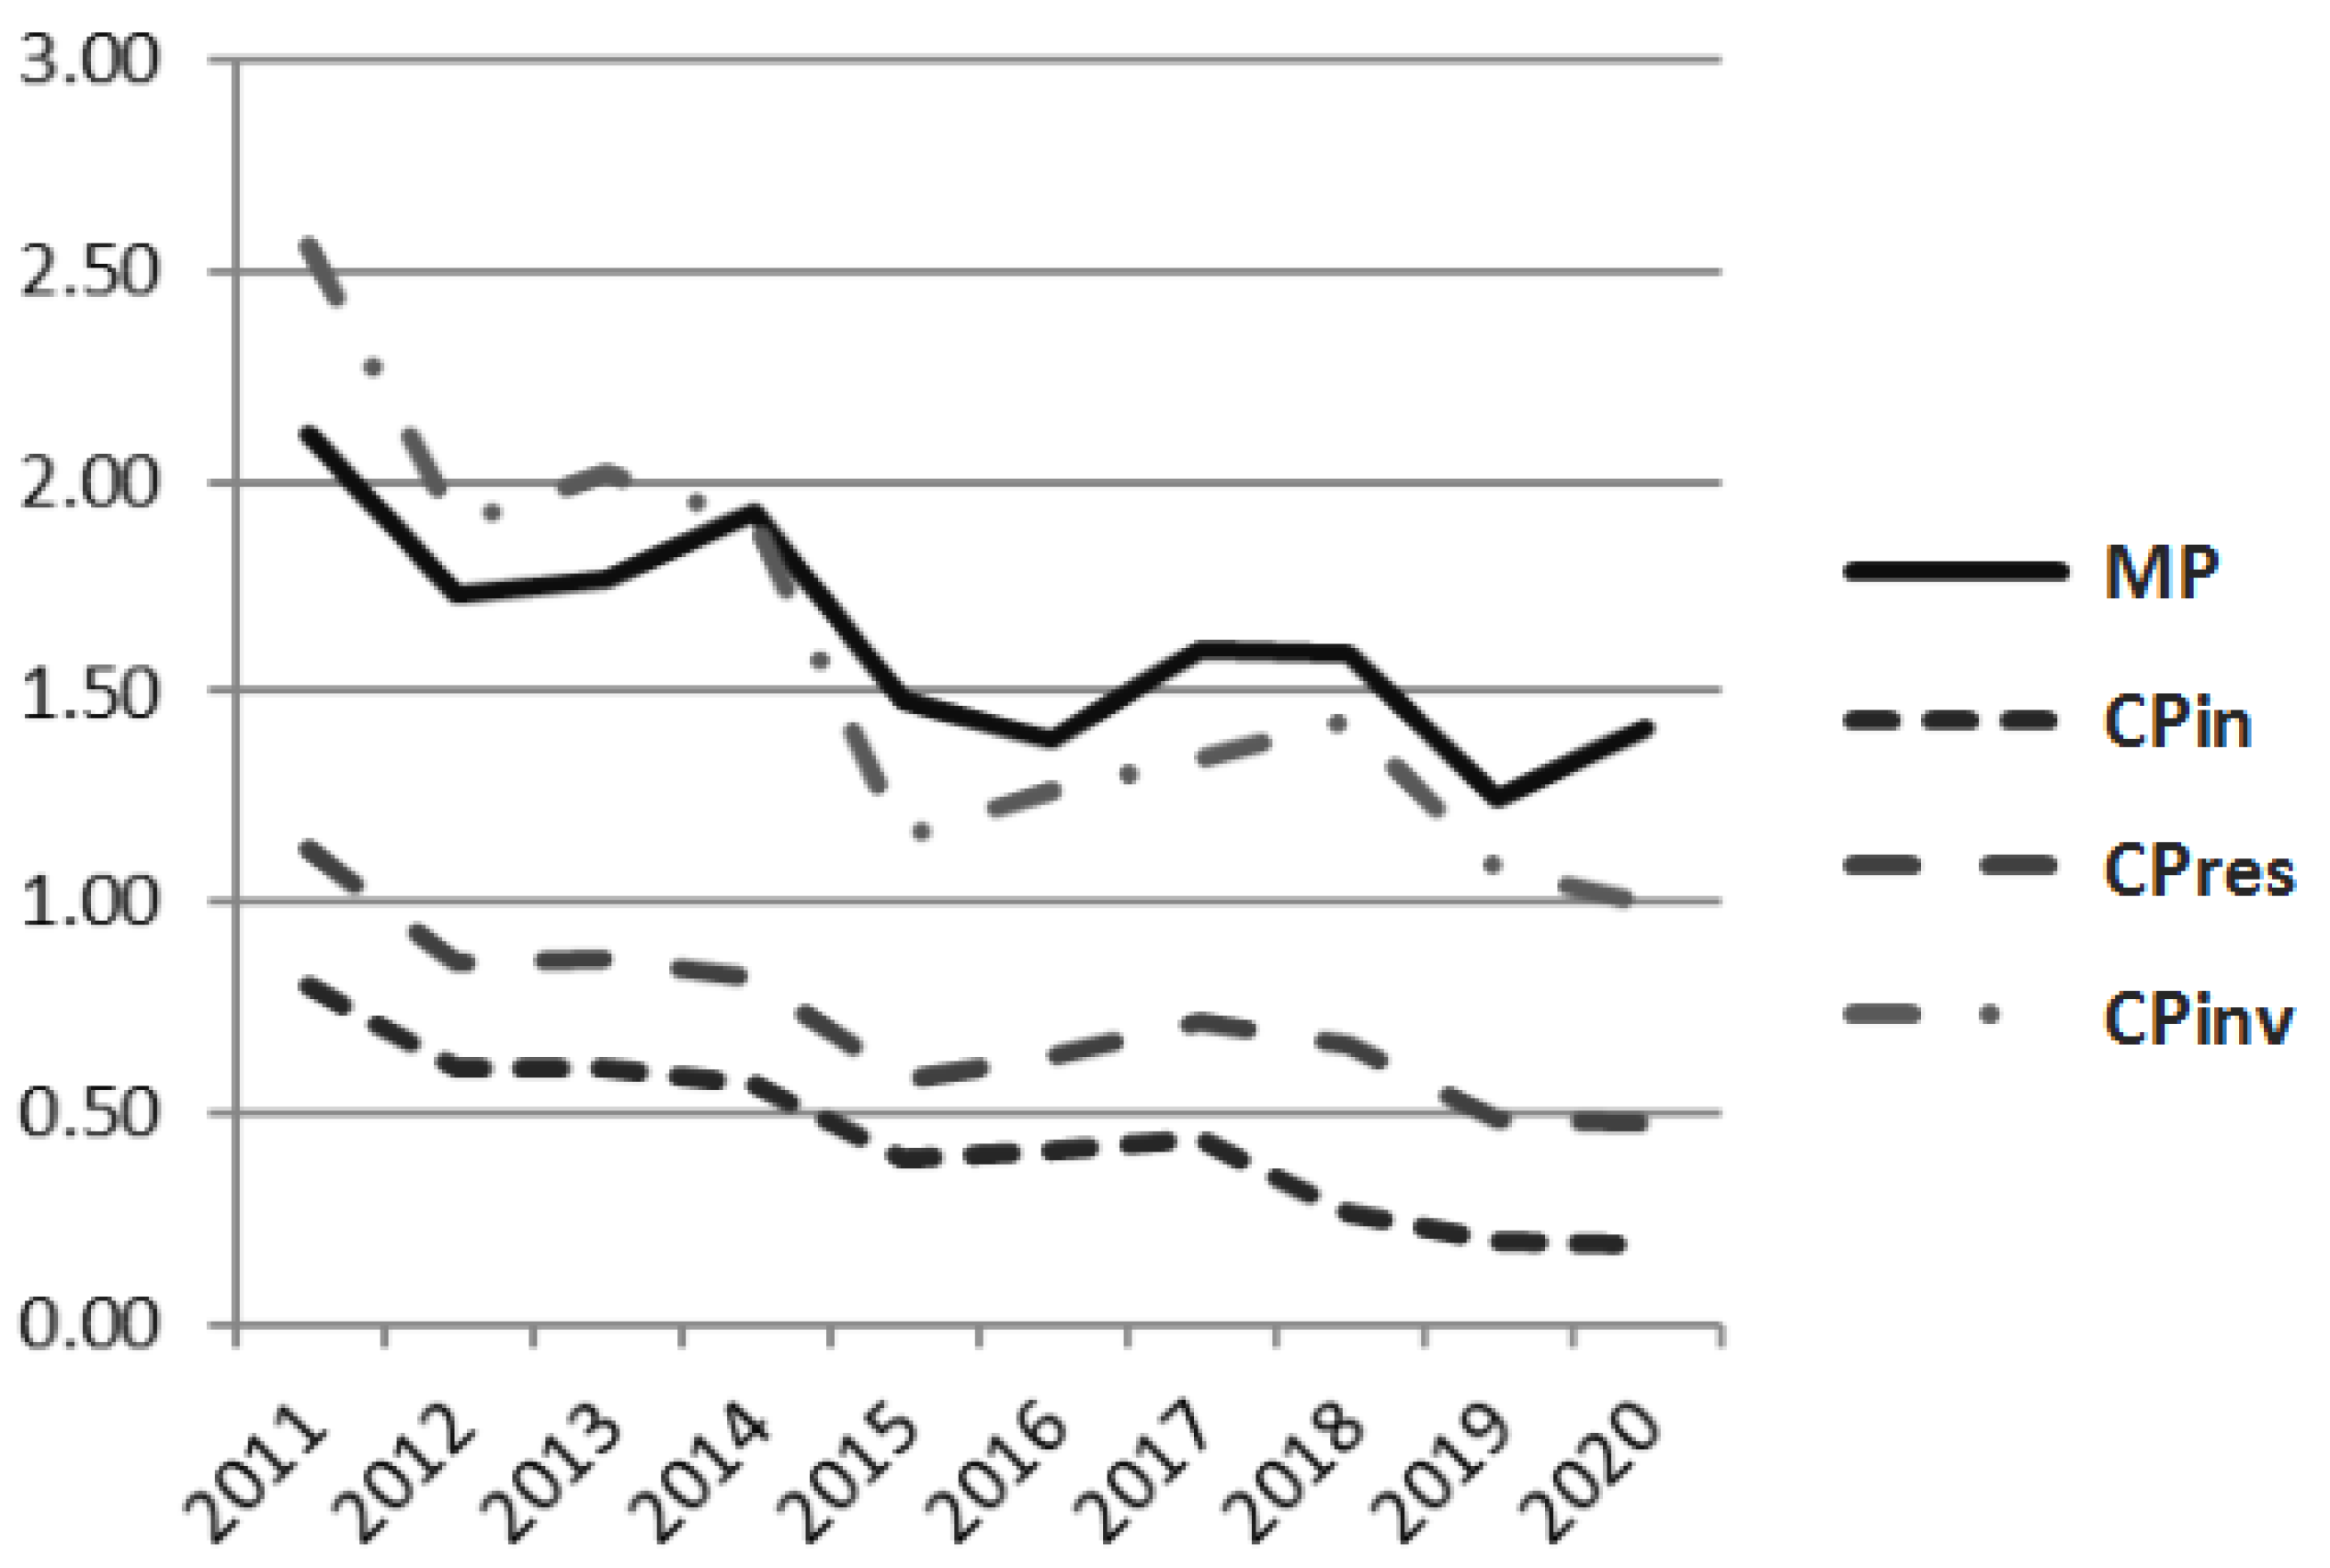
| McMoRan Inc | ||||||||||
| MP | 2.11 | 1.73 | 1.77 | 1.93 | 1.48 | 1.39 | 1.60 | 1.59 | 1.25 | 1.42 |
| CPin | 0.80 | 0.61 | 0.61 | 0.57 | 0.39 | 0.41 | 0.44 | 0.26 | 0.20 | 0.19 |
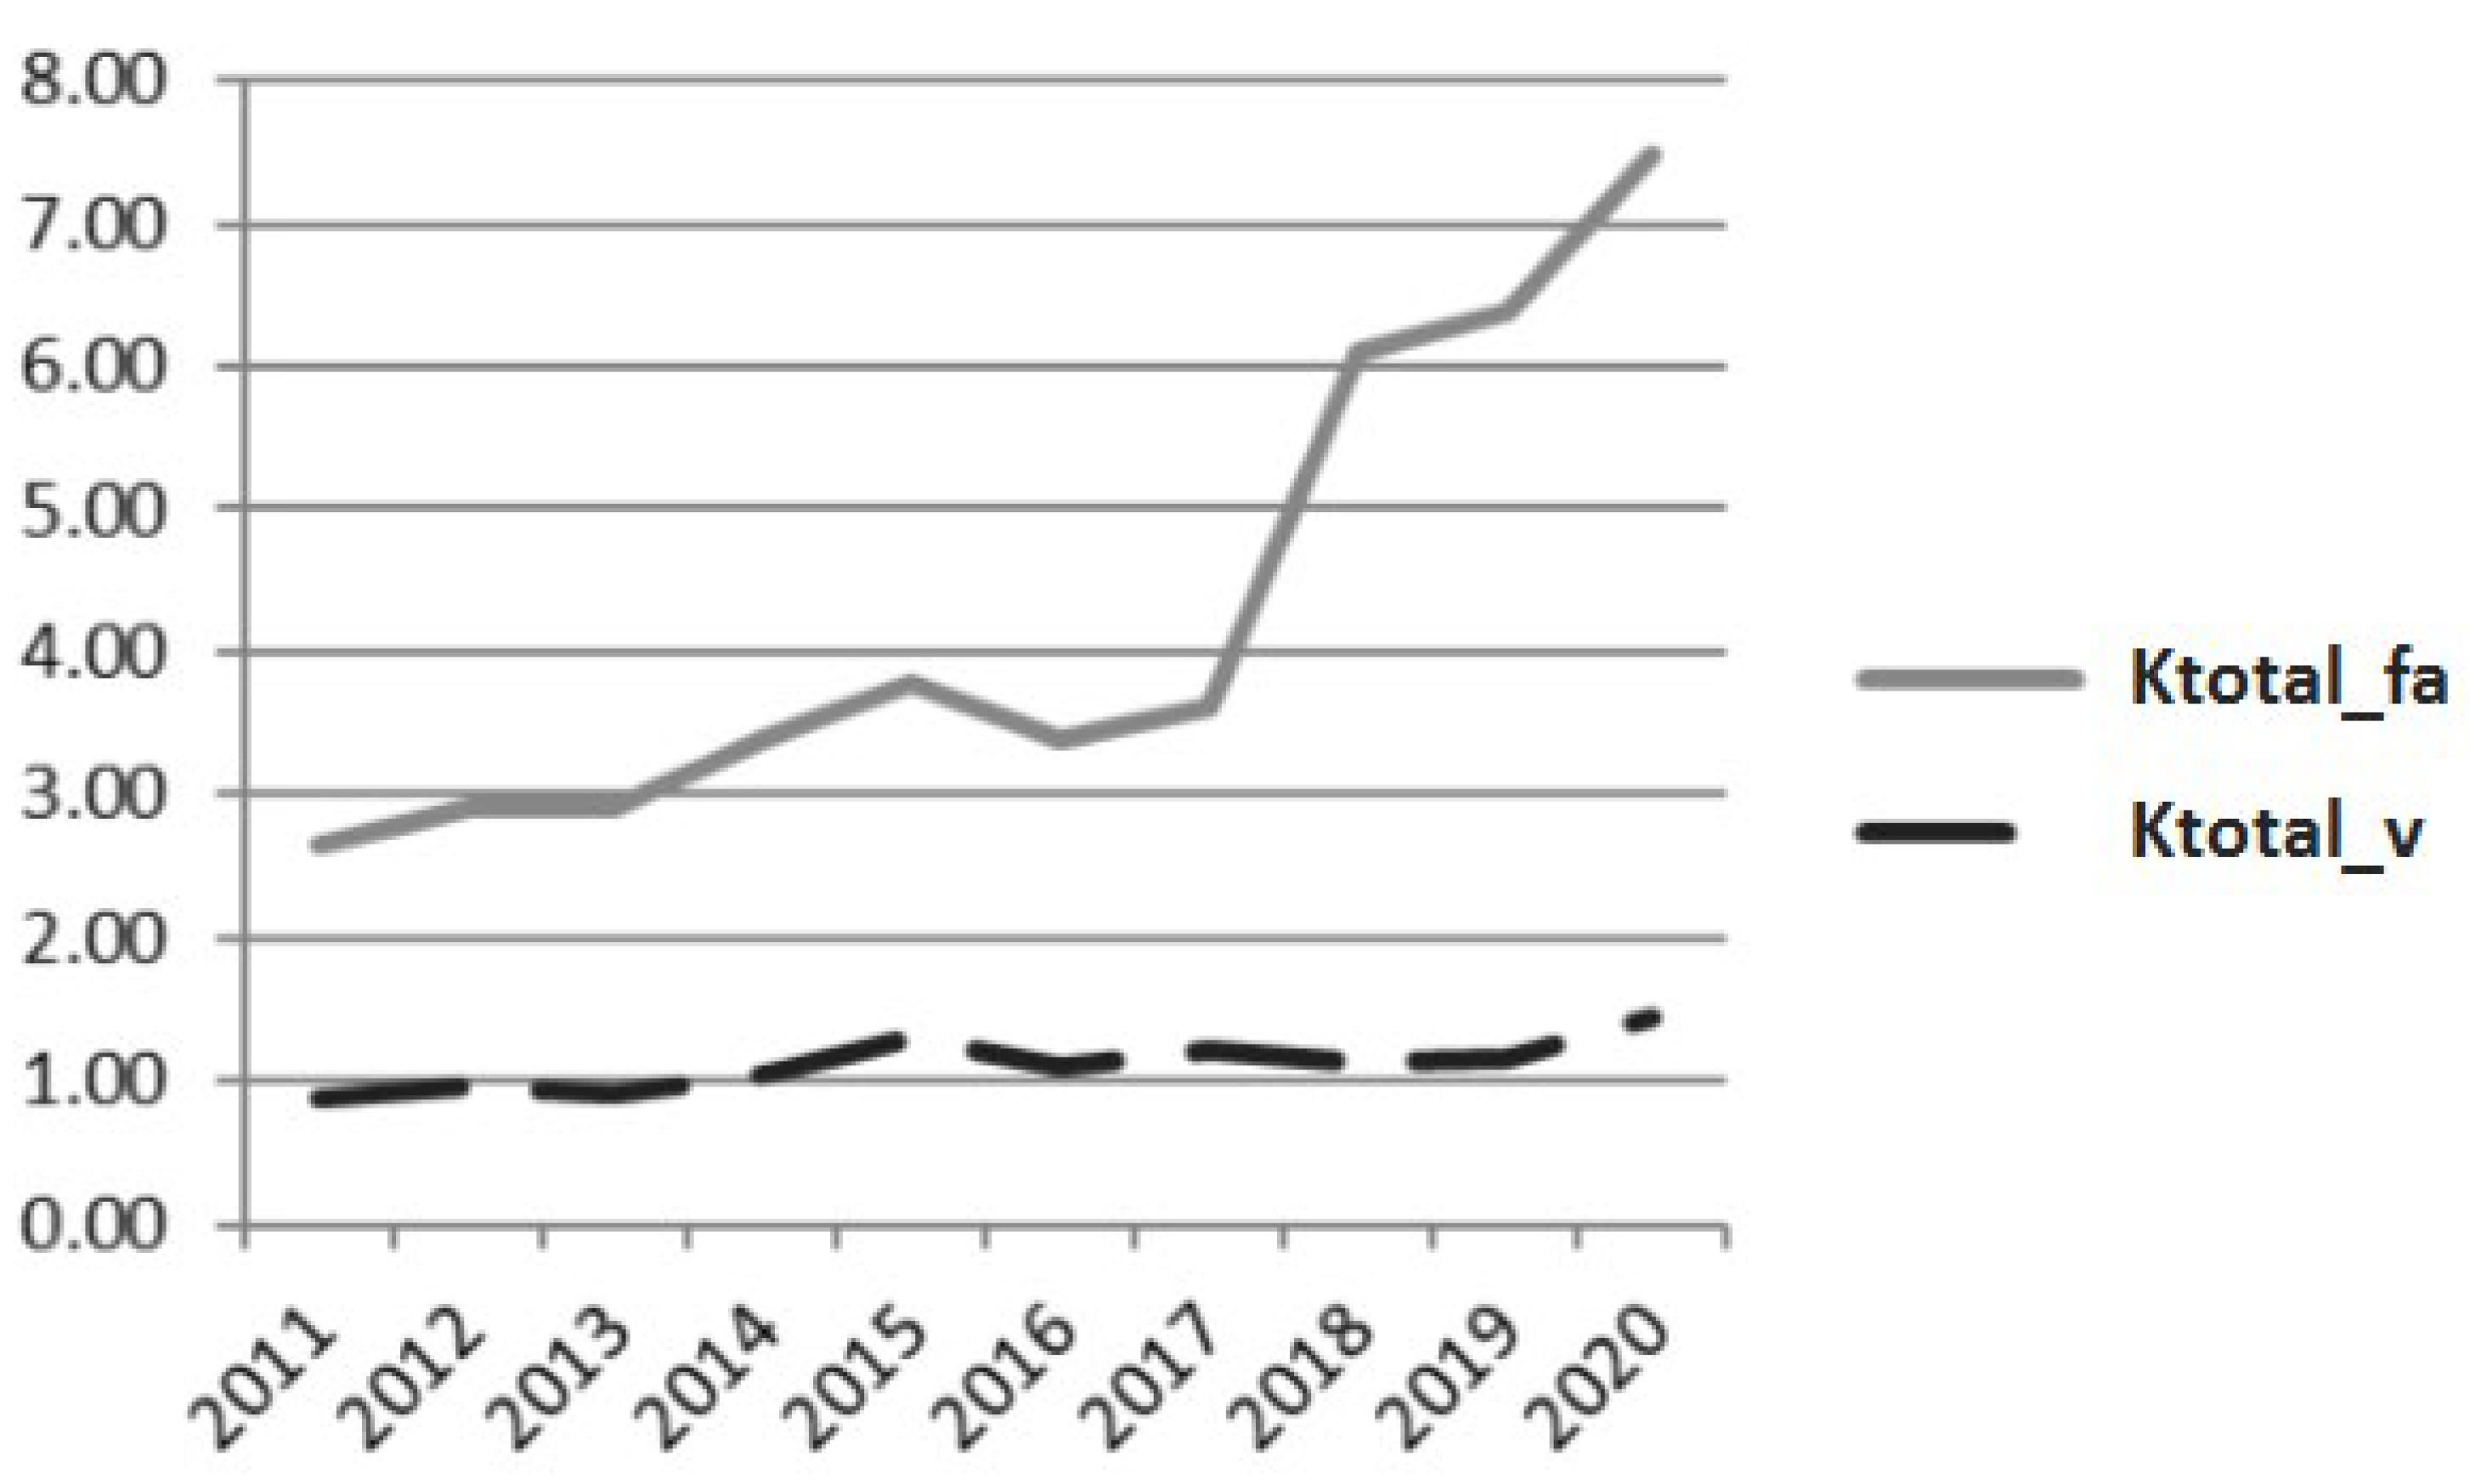
| CLMP(in) | 2.62 | 2.86 | 2.89 | 3.37 | 3.76 | 3.36 | 3.61 | 6.07 | 6.36 | 7.47 |
| Life cycle stage | - | IV-2 | I-1 | II | IV-2 | III | I-1 | IV-2 | IV-2 | II |
Disclaimer/Publisher’s Note: The statements, opinions and data contained in all publications are solely those of the individual author(s) and contributor(s) and not of MDPI and/or the editor(s). MDPI and/or the editor(s) disclaim responsibility for any injury to people or property resulting from any ideas, methods, instructions or products referred to in the content. |
© 2023 by the authors. Licensee MDPI, Basel, Switzerland. This article is an open access article distributed under the terms and conditions of the Creative Commons Attribution (CC BY) license (https://creativecommons.org/licenses/by/4.0/).
Share and Cite
Meshalkin, V.P.; Zharov, V.S.; Leontiev, L.I.; Nzioka, A.M.; Belozersky, A.Y. Sustainable Environmental Impact Assessment Using Indicators for Sustainable Energy-Intensive Industrial Production. Energies 2023, 16, 3172. https://doi.org/10.3390/en16073172
Meshalkin VP, Zharov VS, Leontiev LI, Nzioka AM, Belozersky AY. Sustainable Environmental Impact Assessment Using Indicators for Sustainable Energy-Intensive Industrial Production. Energies. 2023; 16(7):3172. https://doi.org/10.3390/en16073172
Chicago/Turabian StyleMeshalkin, Valery P., Vladimir S. Zharov, Leopold I. Leontiev, Antony M. Nzioka, and Andrey Y. Belozersky. 2023. "Sustainable Environmental Impact Assessment Using Indicators for Sustainable Energy-Intensive Industrial Production" Energies 16, no. 7: 3172. https://doi.org/10.3390/en16073172