Article

Different Prevention Effects of Ventilation Dilution on Methane Accumulation at High Temperature Zone in Coal Mine Goafs

1
Collaborative Innovation Center of Coal Work Safety and Clean High Efficiency Utilization, Henan Polytechnic University, Jiaozuo 454003, China
2
MOE Engineering Center of Mine Disaster Prevention and Rescue, Henan Polytechnic University, Jiaozuo 454003, China
3
Collaborative Innovation Center of Coalbed Methane and Shale Gas for Central Plains Economic Region, Henan Polytechnic University, Jiaozuo 454003, China
4
Henan Provincial Key Lab of Gas Geology and Control-Cultivation Base of Provincial and Ministry Joint State Key, Henan Polytechnic University, Jiaozuo 454003, China
5
State Key Laboratory Cultivation Base for Gas Geology and Gas Control (Henan Polytechnic University), Henan Polytechnic University, Jiaozuo 454003, China
*
Author to whom correspondence should be addressed.
Energies 2023, 16(7), 3168; https://doi.org/10.3390/en16073168
Submission received: 20 February 2023 / Revised: 21 March 2023 / Accepted: 25 March 2023 / Published: 31 March 2023
(This article belongs to the Special Issue Coal Mining)

Abstract

:
In coal mine goafs, spontaneous combustion of coal can result in methane accumulation, which raises the danger of methane explosion disasters. As an atmospheric control tool, ventilation is applied to ensure air quality for avoiding disasters in underground mines. However, during the process of the spontaneous combustion of coal in coal mine goafs, the impact of ventilation dilution on the possible methane explosions induced by coal combustion has not been well investigated. In this study, a validated gas flow model for the spontaneous coal combustion environment in goafs of coal mines is adopted to investigate the influence of ventilation dilution at the three stages of the spontaneous combustion of coal. The research conclusions suggest that (1) ventilation dilution is a quick measure to dilute methane concentration and intensify heat transfer in the vertical direction in coal mine goafs; (2) ventilation dilution can lessen the danger of methane explosions by diluting methane concentration to the lower explosive limit for methane when coal combustion takes place on the air-inlet side; (3) however, ventilation dilution increases the methane explosion risk by decreasing methane concentration, resulting in explosive methane limits, if coal combustion occurs on the air-return side. This provides a reference for the management of ventilation during a spontaneous coal combustion disaster in the goafs of coal mines with methane.

1. Introduction

Coal is a main source of energy in China. The complex geological conditions in coal mining areas and mining-induced changes in the geological environment have led to mining disasters and endangered coal mining in China. One such disaster caused by mining activities in coal mines is spontaneous coal combustion. Air leakage in goafs is caused by ventilation in coal mines, which provides necessary oxygen for coal oxidation, resulting in the spontaneous combustion of coal in coal mine goafs and the generation of heat [1,2]. With the improvement in mining mechanization and mining speed, more coal is left in coal mine goafs, with increasing ground temperature. This leads to a higher risk of disaster caused by spontaneous coal combustion in underground goafs, which may cause serious methane explosions as methane is released from coal [3,4].
Spontaneous combustion of coal influences gas movements and gas concentration distribution in coal mine goafs. As coal is exploited, coal mine goafs are created as a result of the overlying strata of coalbed collapse and the space left by mining filling [2,5,6]. During this mining process, some of the coal is not transferred out and is buried in coal mine goafs. This coal is called the residual coal. Air leakage from a mining face to a coal mine goaf occurs due to the porosity formed by the collapsed rock and broken coal in the goaf of a coal mine [2,5]. Oxygen from the air leakage spontaneously adsorbs on the residual coal, resulting in a coal oxidation reaction and a temperature increase [7,8]. Along the arc-shape pathway of air leakage, due to coal oxidation, oxygen is consumed continuously from the air-inlet side to the air-return side of the goaf. Consequently, oxygen concentration in coal mine goafs declines in both the strike direction and the dip direction [3,4,9]. With the continuous oxygen consumption in a coal oxidation reaction, the residual coal temperature rises in the goafs of coal mines. The air-inlet and air-return sides of a coal mine goaf are typical areas that are prone to spontaneous coal combustion due to air leakage and the porosity distribution [3,4]. With a continuous increase in temperature caused by the spontaneous combustion of coal, the density of the air nearby falls to produce a buoyant force and changes gas movements in coal mine goafs [5,10,11]. Under the superimposed action of air leakage and the buoyancy effect caused by coal combustion, methane accumulation appears near the coal combustion space in the goafs of coal mines [3,5,12]. This increases the risk of a methane explosion caused by combustion in the goafs of coal mines.
Many preventive measures can be adopted for avoiding possible coal combustion-induced methane explosions after the detection of the change in atmospheric environment in the goafs of coal mines. Owing to the oxygen consumption in a spontaneous coal combustion process, an area expected to experience spontaneous coal combustion is used to determine the oxygen concentration distribution in the goafs of coal mines [4,9,13,14,15]. Ethylene and acetylene are used as the characteristic gases at 400 K and 500 K to determine the occurrence and development of spontaneous coal combustion [16]. Therefore, with a tube bundle monitoring system that contains gas sensors and temperature sensors, the atmospheric data in coal mine goafs can be collected and analyzed for determining the area and development of spontaneous coal combustion [17]. However, a tube bundle monitoring system provides limited static data for analysis; this is especially true when this system is destroyed by the collapsing rock in coal mine goafs. With the suspicious area of spontaneous coal combustion determined using a tube bundle monitoring system, many measures, such as slurry irrigation and inert gas injection, are applied in a coal mine goaf to reduce coal–oxygen contact and improve explosive methane limits for the purpose of minimizing spontaneous coal combustion and methane explosions [18,19,20,21,22,23]. However, these measures sometimes cannot effectively extinguish these disasters without an accurate location of spontaneous coal combustion. In addition, these measures usually require more time to prepare materials and devices before application, which may lead to missed opportunities to prevent disasters. Ventilation is an empirical engineering technique proposed to decrease air contaminants, such as methane, below the threshold limits in coal mines [24,25,26,27,28]. The ventilation volume can be quickly increased by adjusting the vane angle of a ventilation fan. Using a spare ventilation fan in coal mine, the underground ventilation volume can be significantly increased for a better ventilation dilution effect. A larger ventilation volume could accelerate heat dissipation and dilute gas concentration to prevention spontaneous coal combustion and explosions caused by methane from coal combustion.
Spontaneous coal combustion is a process of continuous increase in temperature; this makes it harder to prevent methane explosions in coal mine goafs [29,30,31]. Due to the inaccessibility of coal mine goafs and the methane explosion risk, ventilation dilution is considered a high priority measure to prevent coal combustion-induced methane explosions. However, the disaster prevention effect of ventilation dilution is not well known. Under some conditions, ventilation dilution cannot decrease the risk of coal combustion-induced methane explosion in coal mine goafs. In this study, a gas flow model is adopted to simulate the methane accumulation caused by spontaneous coal combustion in a coal mine goaf, which is validated by the experiment results. Further, under ventilation dilution, this gas flow model is used to obtain the distributions of methane concentration and temperature at the location of spontaneous coal combustion at the early, middle and late stages of spontaneous coal combustion occurring on both the air-inlet side and air-return side. The risk of methane explosion at the location of spontaneous coal combustion is analyzed to reveal the disaster prevention effect of ventilation dilution on coal combustion-induced methane explosion in coal mine goafs.

2. Numerical Model

In this study, a gas flow model for the spontaneous coal combustion environment in coal mine goafs is adopted in Comsol Multiphysics software [5]. As shown in Table 1, this model is made up of governing equations and coupling equations, and it is applied to a 3D coal mine goaf to realize the buoyancy effect by introducing the ideal gas law related to temperature [32,33]. The three conservation equations include the mass conservation equation (Equation (1)), momentum conservation equation (Equation (2)) and energy conservation equation (Equation (3)). These three conservation equations in the governing equations are necessary to provide basic principles for obtaining fluid flow results. To obtain the specific fluid flow in a special environment, the coupling equations are essential to realize the influence of the environmental factors. The coupling equations include the ideal gas state equation (Equation (4)), the species transport equation (Equation (5)) and equations for porosity distribution in 3D coal mine goafs (Equations (6a)–(6d)).
The high temperature of spontaneous coal combustion in a coal mine goaf can change air density to produce buoyancy force and change airflow. In accordance with the ideal gas state equation, the gas density inversely changes with temperature. Temperature changes, such as temperature decrease and temperature increase, can lead to dense air and thin air [10,11]. Therefore, the ideal gas state equation is introduced in the coupling equations. The 3D porosity distribution equations are introduced to realize the vertical buoyancy effect and study the horizontal gas concentration distribution. The 3D porosity distribution characteristics are associated with the position in the goaf of a coal mine [6,26,34]. In the vertical direction, the porosity distribution of the ‘vertical three zones’ can be determined by the mining height and subsidence height with the gradual change of crushing expansion coefficient of rock. In the horizontal direction, the porosity distribution of the ‘horizontal three areas’ can be determined by its location with the caving characteristics of ‘O’ type for overlying strata.
According to this gas flow model, the temperature-induced change in air density further changes airflow velocity and temperature distribution. If the mass conversation equation is analyzed with the ideal gas state equation, as shown in the first equation combination in Table 2, coal combustion’s high temperature leads to an increase in airflow speed at the coal combustion area [5]. If the mass conservation equation is analyzed with the ideal gas state equation in the 3D coal mine goaf, as the second equation combination shown in Table 2, coal combustion’s high temperature results in upward airflow by producing vertical buoyancy force at the coal combustion area [12]. Airflow velocity is an important variable in the energy conservation equation; the equation for gas species, temperature and gas species distributions can be affected by variation in airflow velocity derived from the ideal gas state equation. These two changes are listed as the third and fourth equation combinations in Table 2.

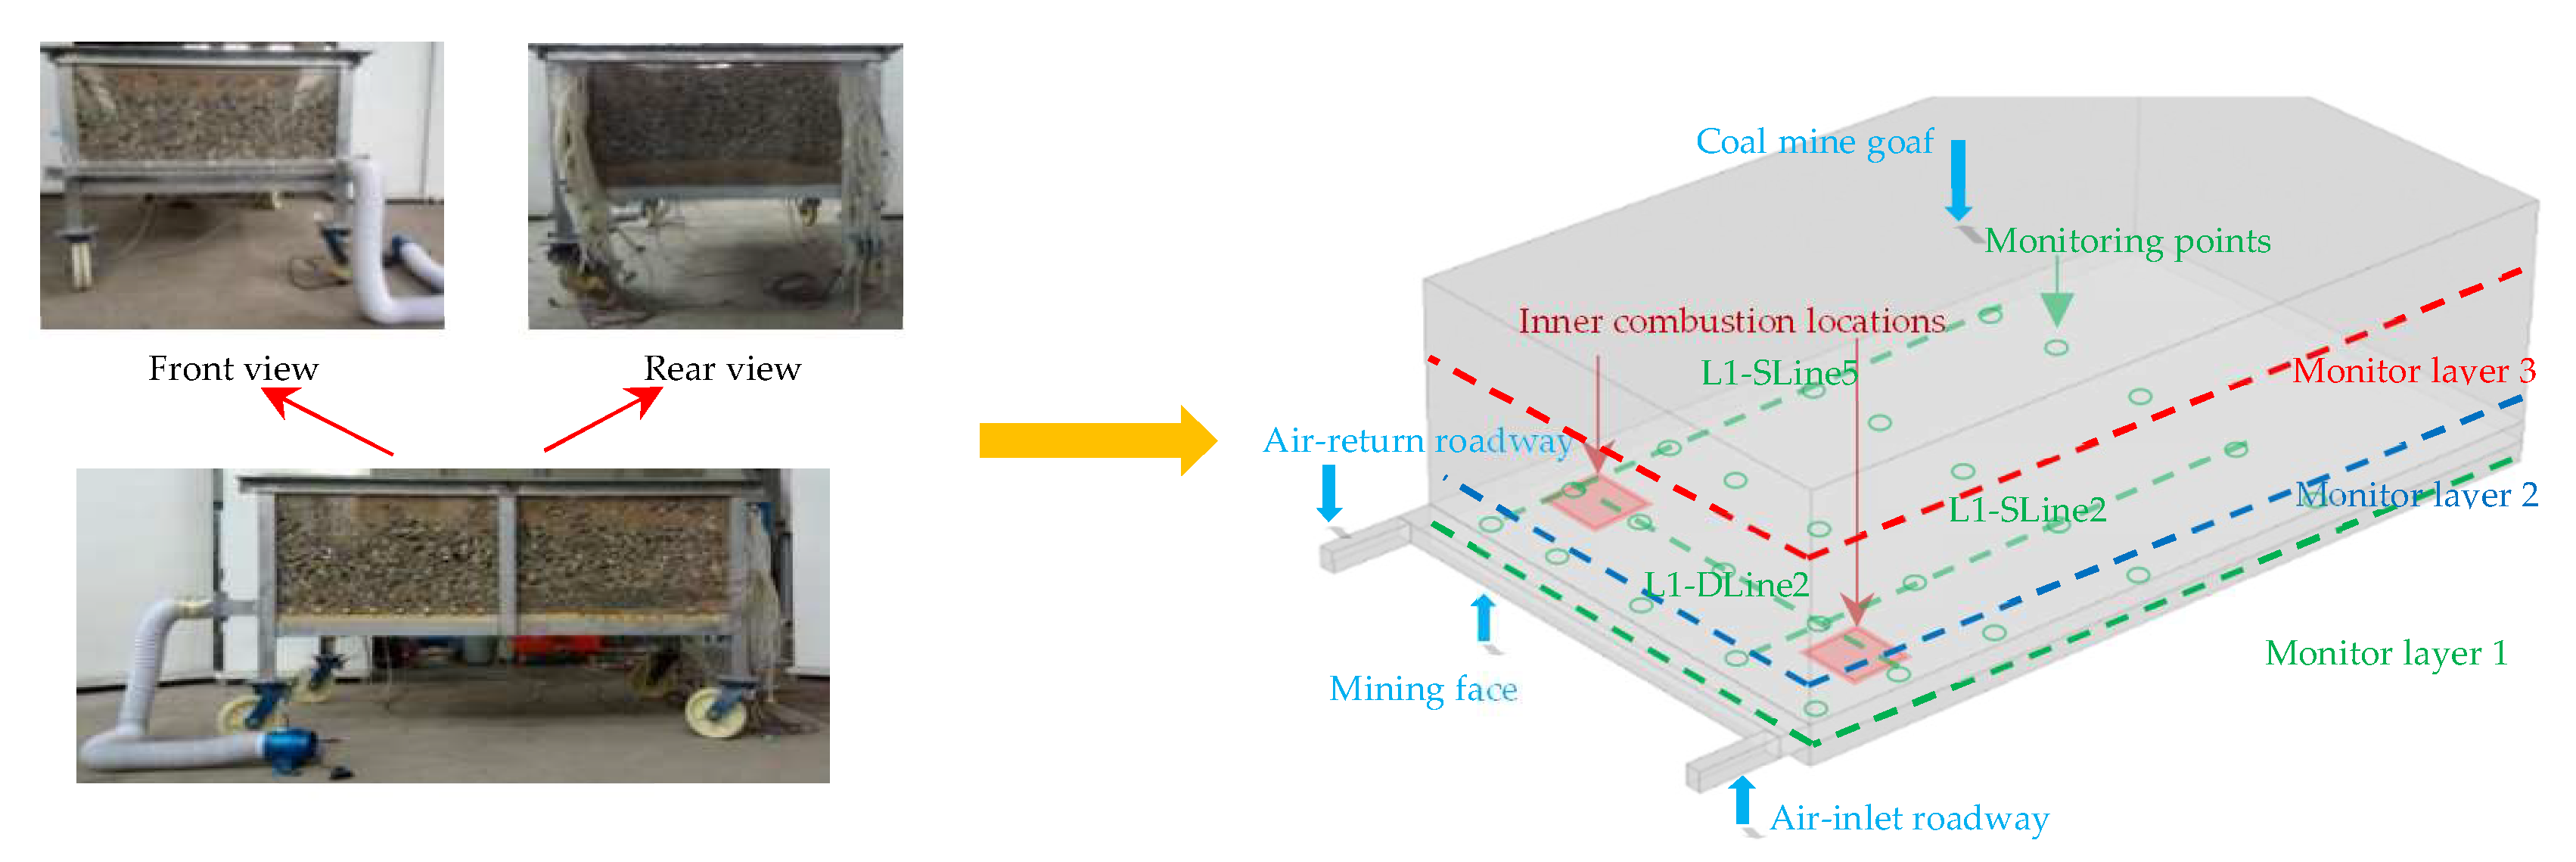
3. Experimental and Numerical Simulation Methods

In the experimental platform, the goaf of a coal mine is connected with a mining face, an air-inlet roadway and an air-return roadway. The ventilation is realized by adjusting a ventilation fan. In the goaf of a coal mine, the porosity distribution is consistent with the caving characteristic of the overlying strata. The locations of spontaneous coal combustion are respectively placed at the air-inlet and air-return sides of the coal mine goaf. Two heating modules create the high temperature of spontaneous coal combustion. By opening a gas cylinder, the gas source, which is set on the bottom of the goaf of the coal mine, is realized. To reduce the possible experimental risk, helium is released instead of methane because its properties are similar to methane. The monitoring data are collected during the experiment. Table 3 provides a summary of the fundamental parameters for the numerical and experimental simulations. The geometry model for numerical simulation is built based on the experimental platform in Figure 1.
When fresh air flows from the air-inlet roadway into the mining face, some of it continues to flow into the goaf of the coal mine and returns back to the air-return roadway after experiencing a flow path of an arc shape. During this period, spontaneous combustion of the coal may occur on both sides of the air-inlet and air-return in the goaf of the coal mine. As methane is desorbed from coal and migrates into the goaf, methane explosions caused by coal combustion are possible. The methane migration into the goaf is complex under the effects of the airflow leakage and the high temperature of spontaneous coal combustion. As a result, it is challenging to research the risk of a methane explosion caused by coal combustion. This study’s numerical simulation is a continuation of a previous study; the validation of the numerical simulation will be introduced briefly in the next section. More specific analysis can be found in our previous research [3,5,12].
As spontaneous coal combustion is a dynamic process, the temperature continues to rise. Based on the temperature of ethylene produced during coal combustion and the ignition temperatures of coal and methane, 400 K, 700 K and 900 K are adopted to represent the early stage, middle stage and late stage of the spontaneous combustion of coal, respectively [16,35,36]. According to the coal mine safety regulations in China, the ventilation efficiency should be greater than 60%, and a spare ventilation fan is necessary [37]. Additionally, some local auxiliary devices can be used to enhance the ventilation. Consequently, airflow velocities of 0.2 m/s and 1.2 m/s are selected as the normal ventilation condition and enhanced ventilation (ventilation dilution) condition, respectively. According to engineering research, methane concentration in the goaf of a coal mine can reach 40% and even higher [38]. Therefore, a methane concentration of 40% is adopted as one condition in the simulation research. The new conditions in this numerical simulation research based on engineering conditions can be found in Table 4. Under these new conditions, the effect of ventilation dilution on disaster prevention during the dynamic process of spontaneous coal combustion is studied.
The validation of the gas flow model is introduced first in this paper. Then, the effect of ventilation dilution on disaster prevention is investigated by analyzing the change in methane concentration under the temperatures of 400 K, 700 K and 900 K. For convenient description and discussion, three monitoring layers are set, 1 cm (z = 1 cm), 8 cm (z = 8 cm) and 20 cm (z = 20 cm) to the bottom of a coal mine goaf, for observation and analysis, where ‘z’ represents the vertical direction. As monitoring lines L1-SLine2, L1-SLine5 and L1-DLine2 are close to the high temperature, the data on these monitoring lines will be used for additional analysis. In the mining plane, the mining direction is defined as the strike direction, and its orthogonal direction is defined as the dip direction. Around the coal combustion area, the windward side is the area closest to the mining face, and the leeward side is the symmetrical area.

4. Results and Discussion

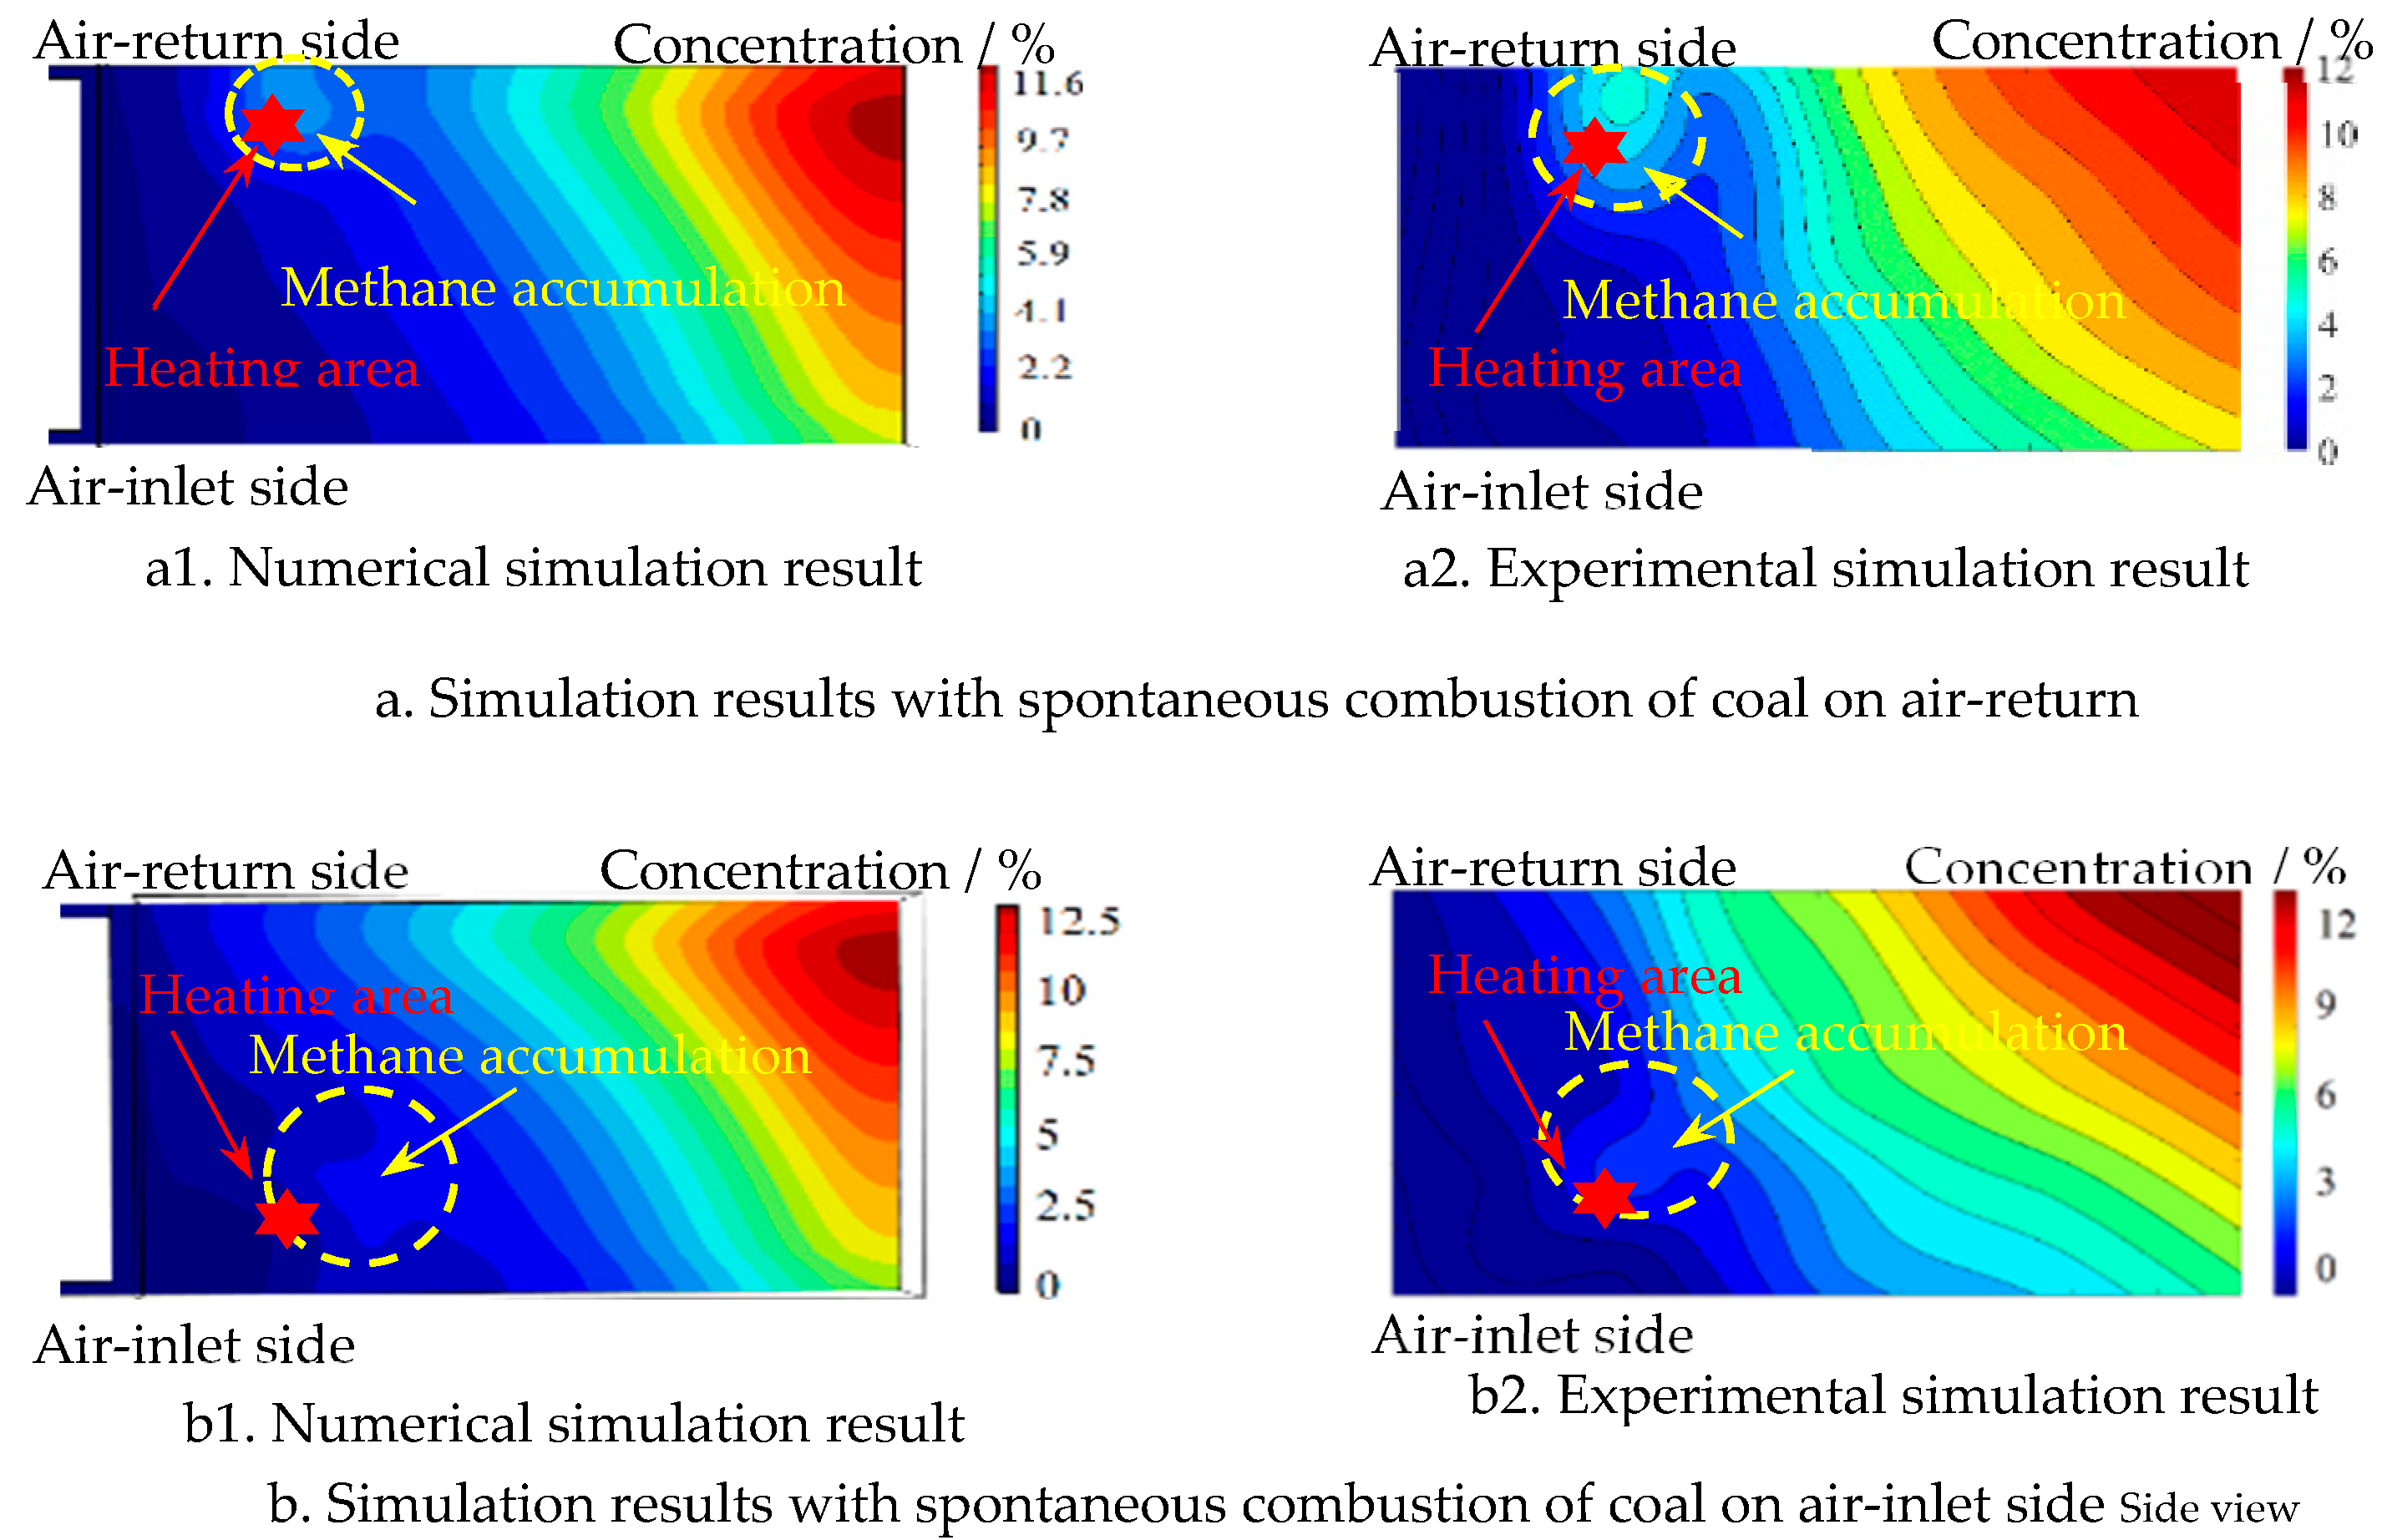
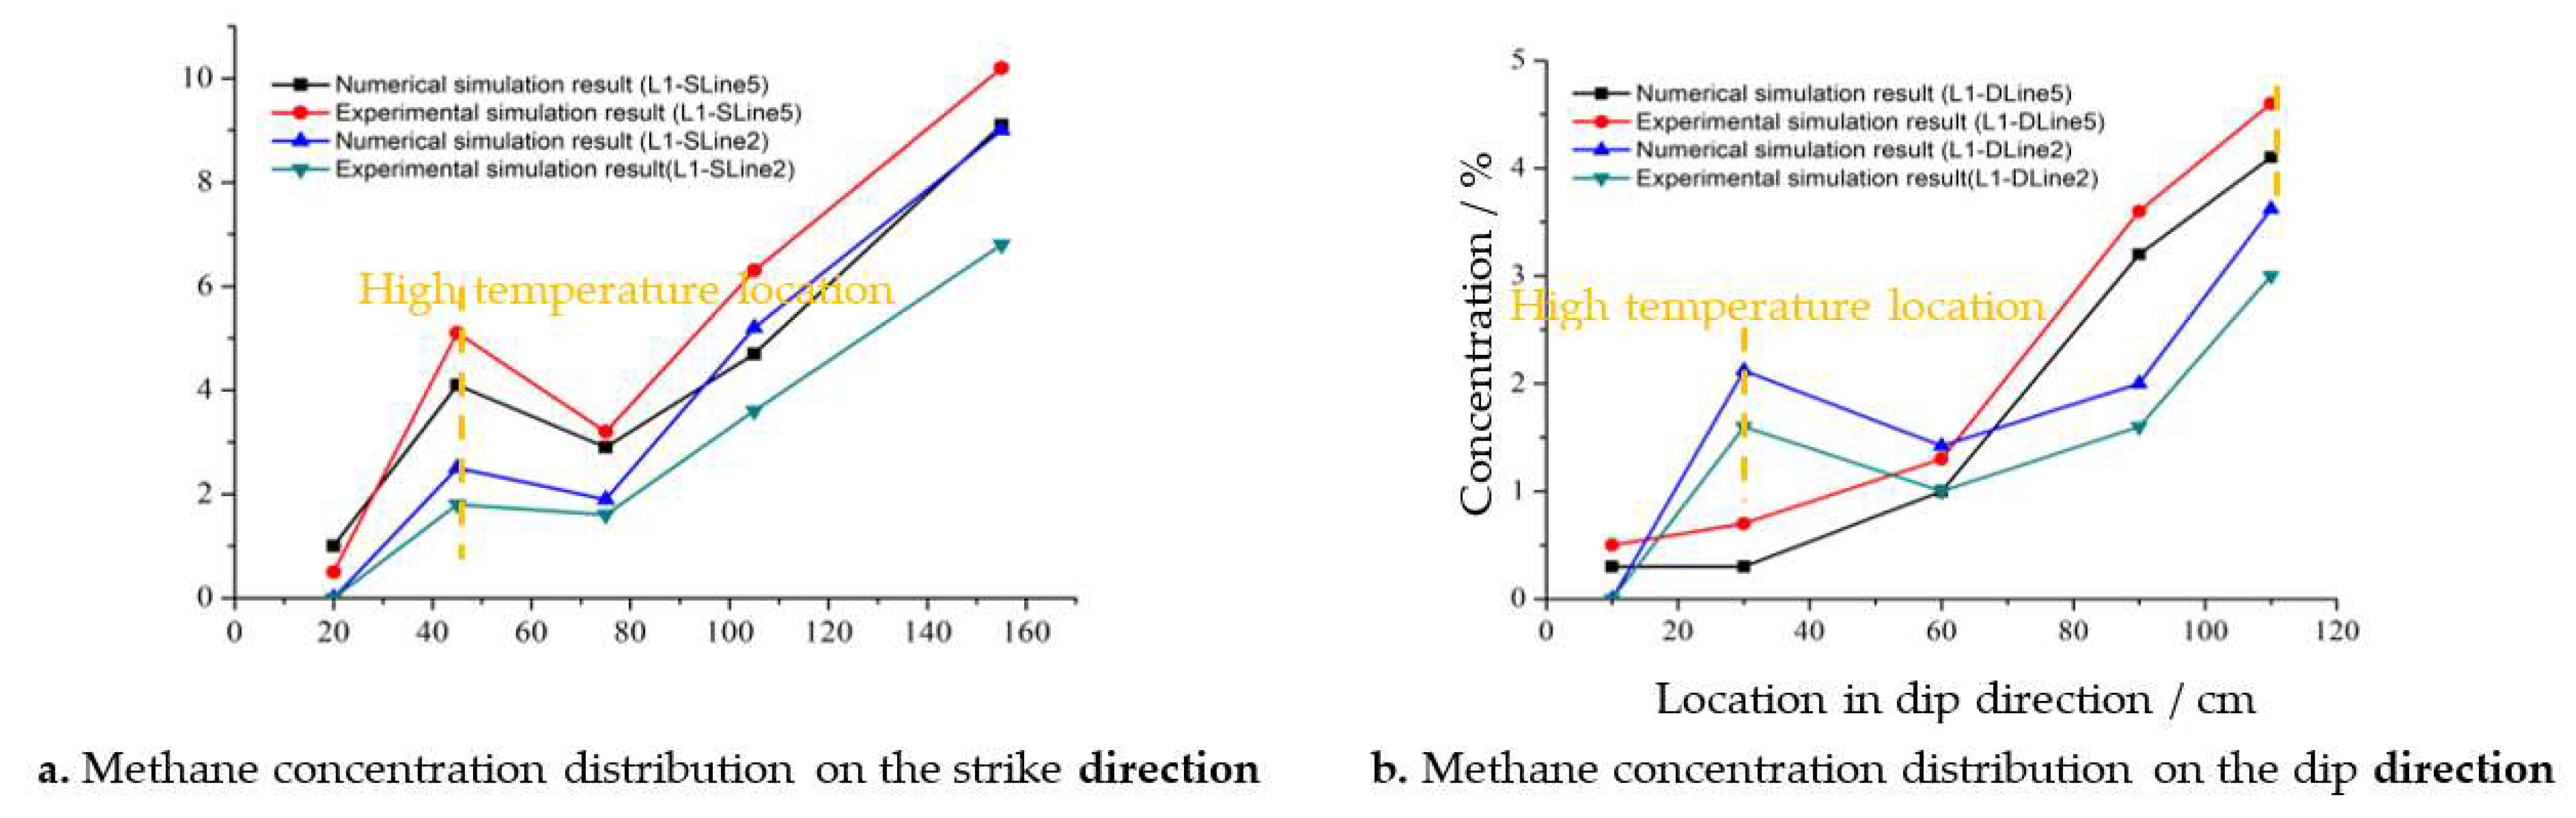
4.1. Validation of Methane Accumulation in Coal Combustion Area in Coal Mine Goaf

Figure 2 depicts the methane distributions in coal mine goafs with areas of spontaneous coal combustion. It is obvious that methane accumulates in these two spontaneous coal combustion areas. The concentration of methane increases gradually in both the strike and dip directions, as a result of the dilution impact of the air leakage from the mining face. The locations of the methane accumulation move to the upper right corner of the heating modules for the same reason. Under the same simulation conditions, the accumulative concentration of methane on the air-return side is 4.1%, higher than that of the air-inlet side, at 2.5%. The minimum methane concentration is 0% at the air-inlet corner of the coal mine, while the maximum methane concentration of 12.5% is at the deepest corner of the air-return side.
As shown in Figure 3, the representative change occurred in the methane concentration along the monitoring lines. The local peak of methane concentration at the location of spontaneous coal combustion is evident based on the methane distribution along the monitoring lines, which demonstrates methane accumulation on both the air-inlet side and the air-return side in the area of spontaneous coal combustion. For the spontaneous combustion of coal at the air-inlet side, when the temperature reaches 400 K, methane concentration in the area of coal combustion jumps to 4.1%, which is significantly higher than the surrounding methane concentration. A similar accumulation of methane can be observed on the air-return side of the coal combustion area, with an accumulative methane concentration of 2.5%.
In accordance with the ideal gas law in the gas flow model, when the temperature in the location of spontaneous coal combustion rises to 400 K, the air density decreases by 28%. The difference in air density produces a buoyancy force in the vertical direction at the same gravitational acceleration. Therefore, the local air starts to flow upward, displaying the famous chimney effect. As a result, the negative pressure is formed at the starting of the updraft, and the positive pressure is formed in the updraft path. The methane emitted from the goaf bottom is drawn into the area of high temperature by the local negative pressure, leading to the phenomenon of methane accumulation, which may cause methane explosions. The distribution of methane concentration is mainly determined by the airflow movements surrounding the spontaneous combustion of coal, which is related to the horizontal air leakage intensity and vertical buoyancy force caused by the high temperature of spontaneous coal combustion. Gas accumulation similar to that produced by burning coal in a coal mine goaf can be reproduced experimentally [39].
Because the temperature control of spontaneous coal combustion in the goaf of a deep porous coal mine is relatively difficult, ventilation caused by air leakage is a practical strategy to avoid potential methane explosions caused by coal combustion [40]. However, due to the change of chimney effect, ventilation dilution may affect methane accumulation differently depending on the spontaneous combustion temperatures. After validation of the model, it is adopted to examine the impact of ventilation on methane explosions under engineering conditions.

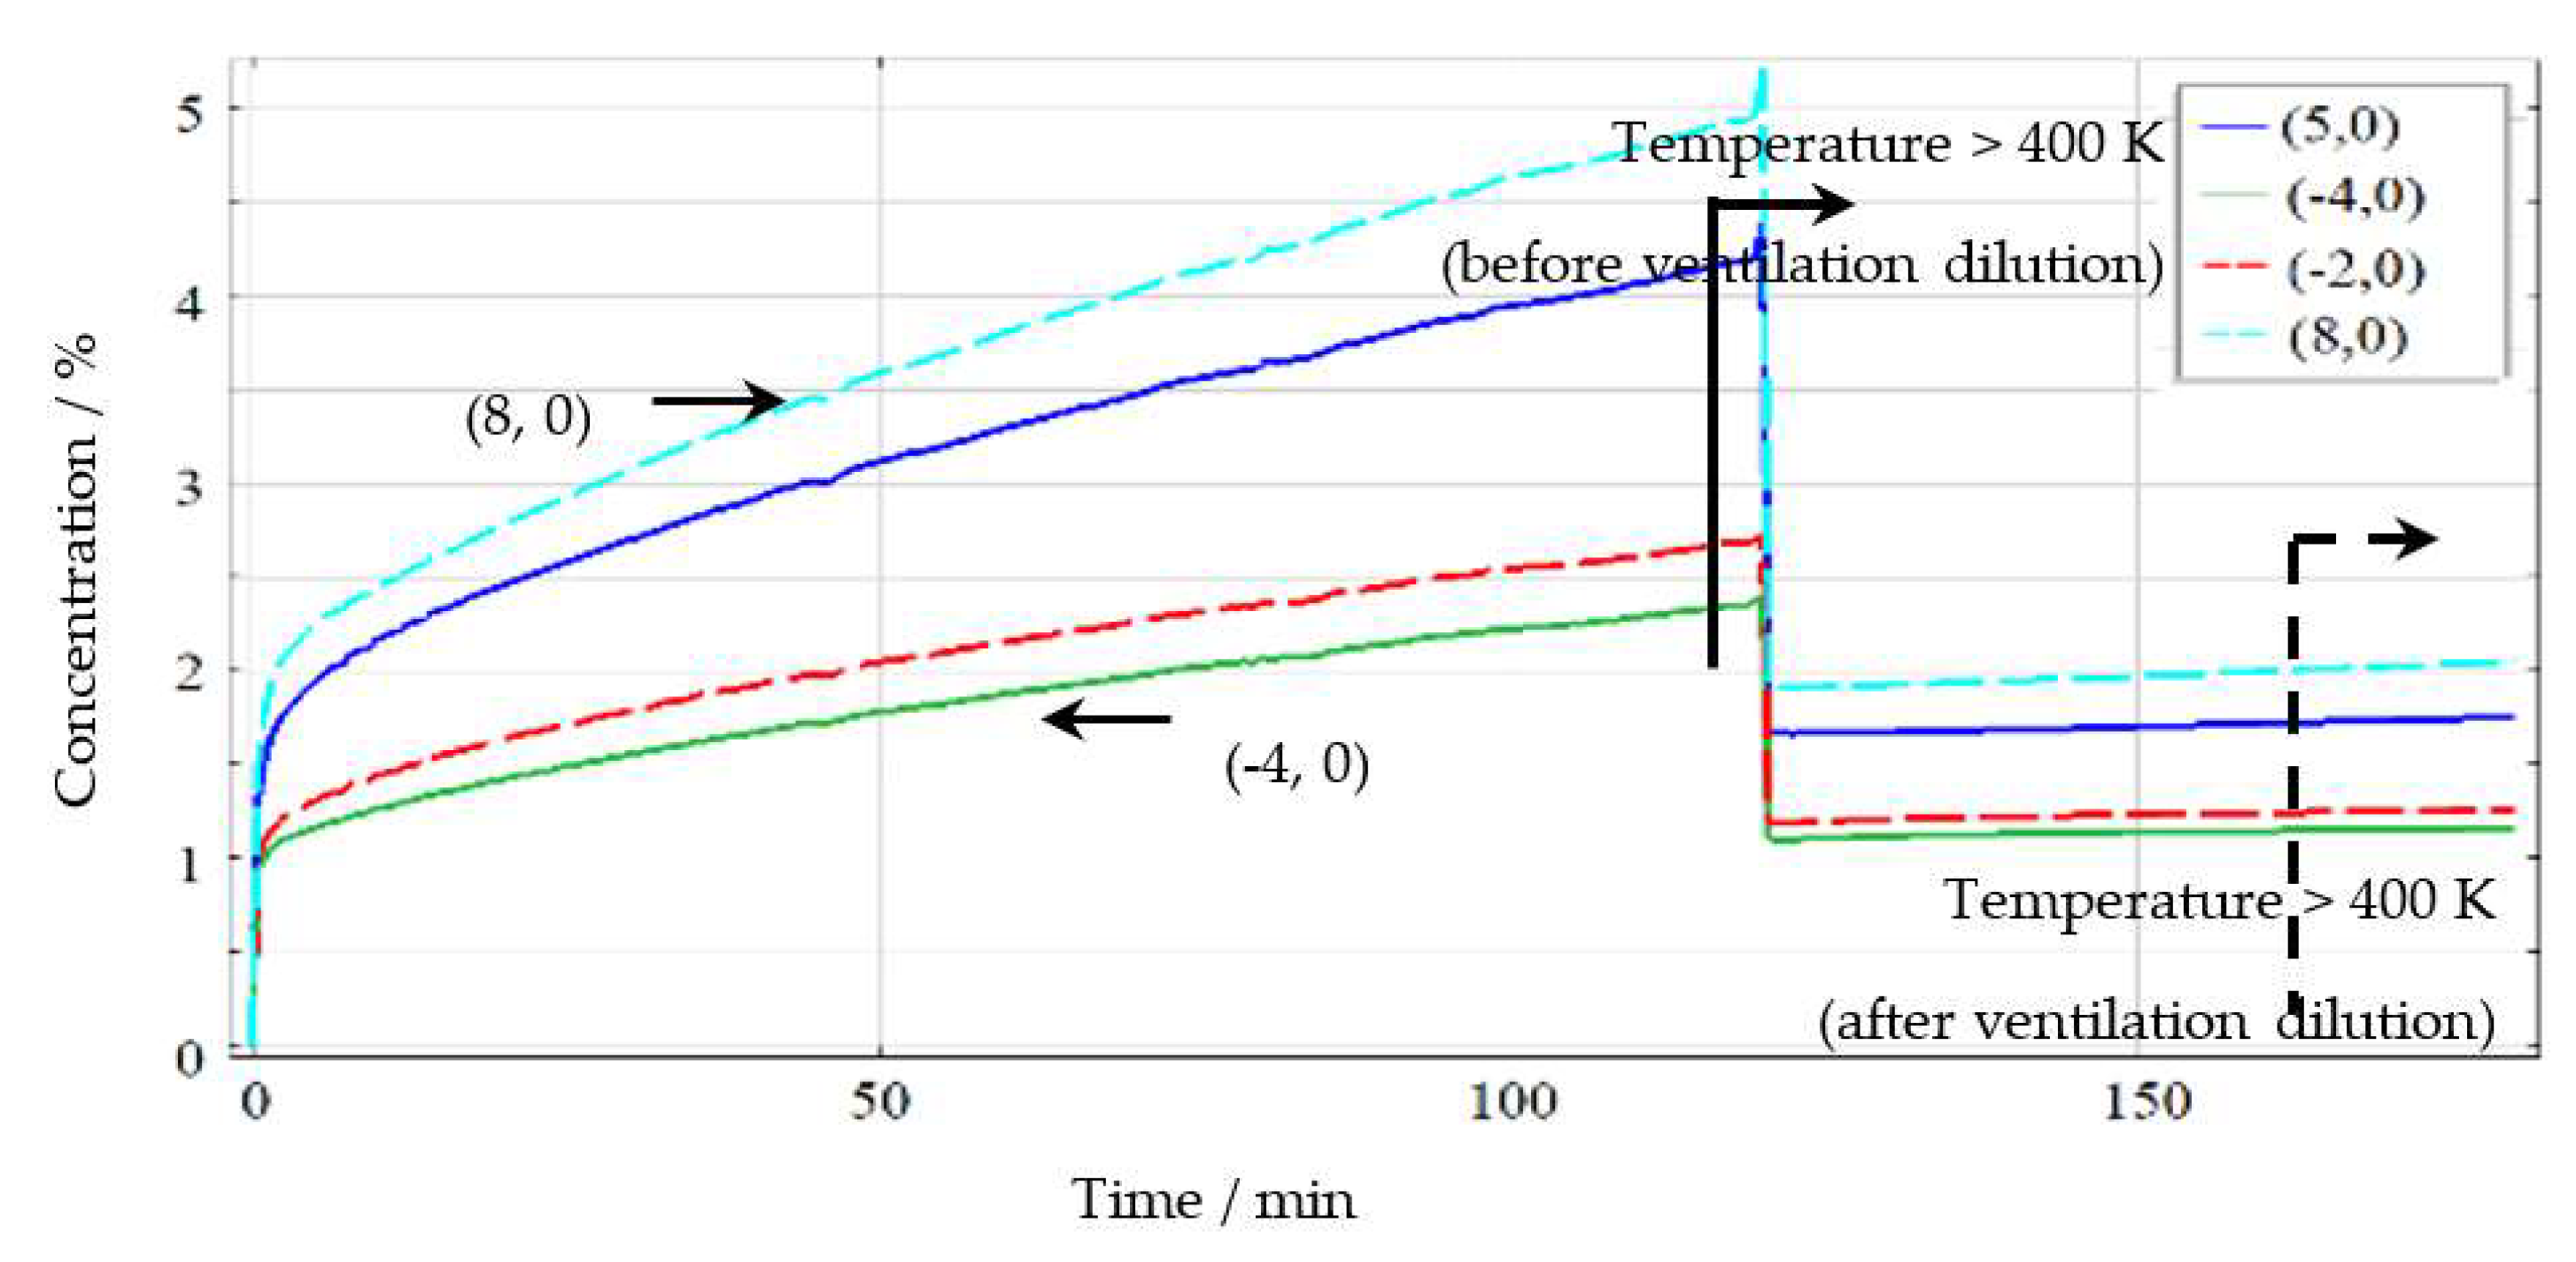
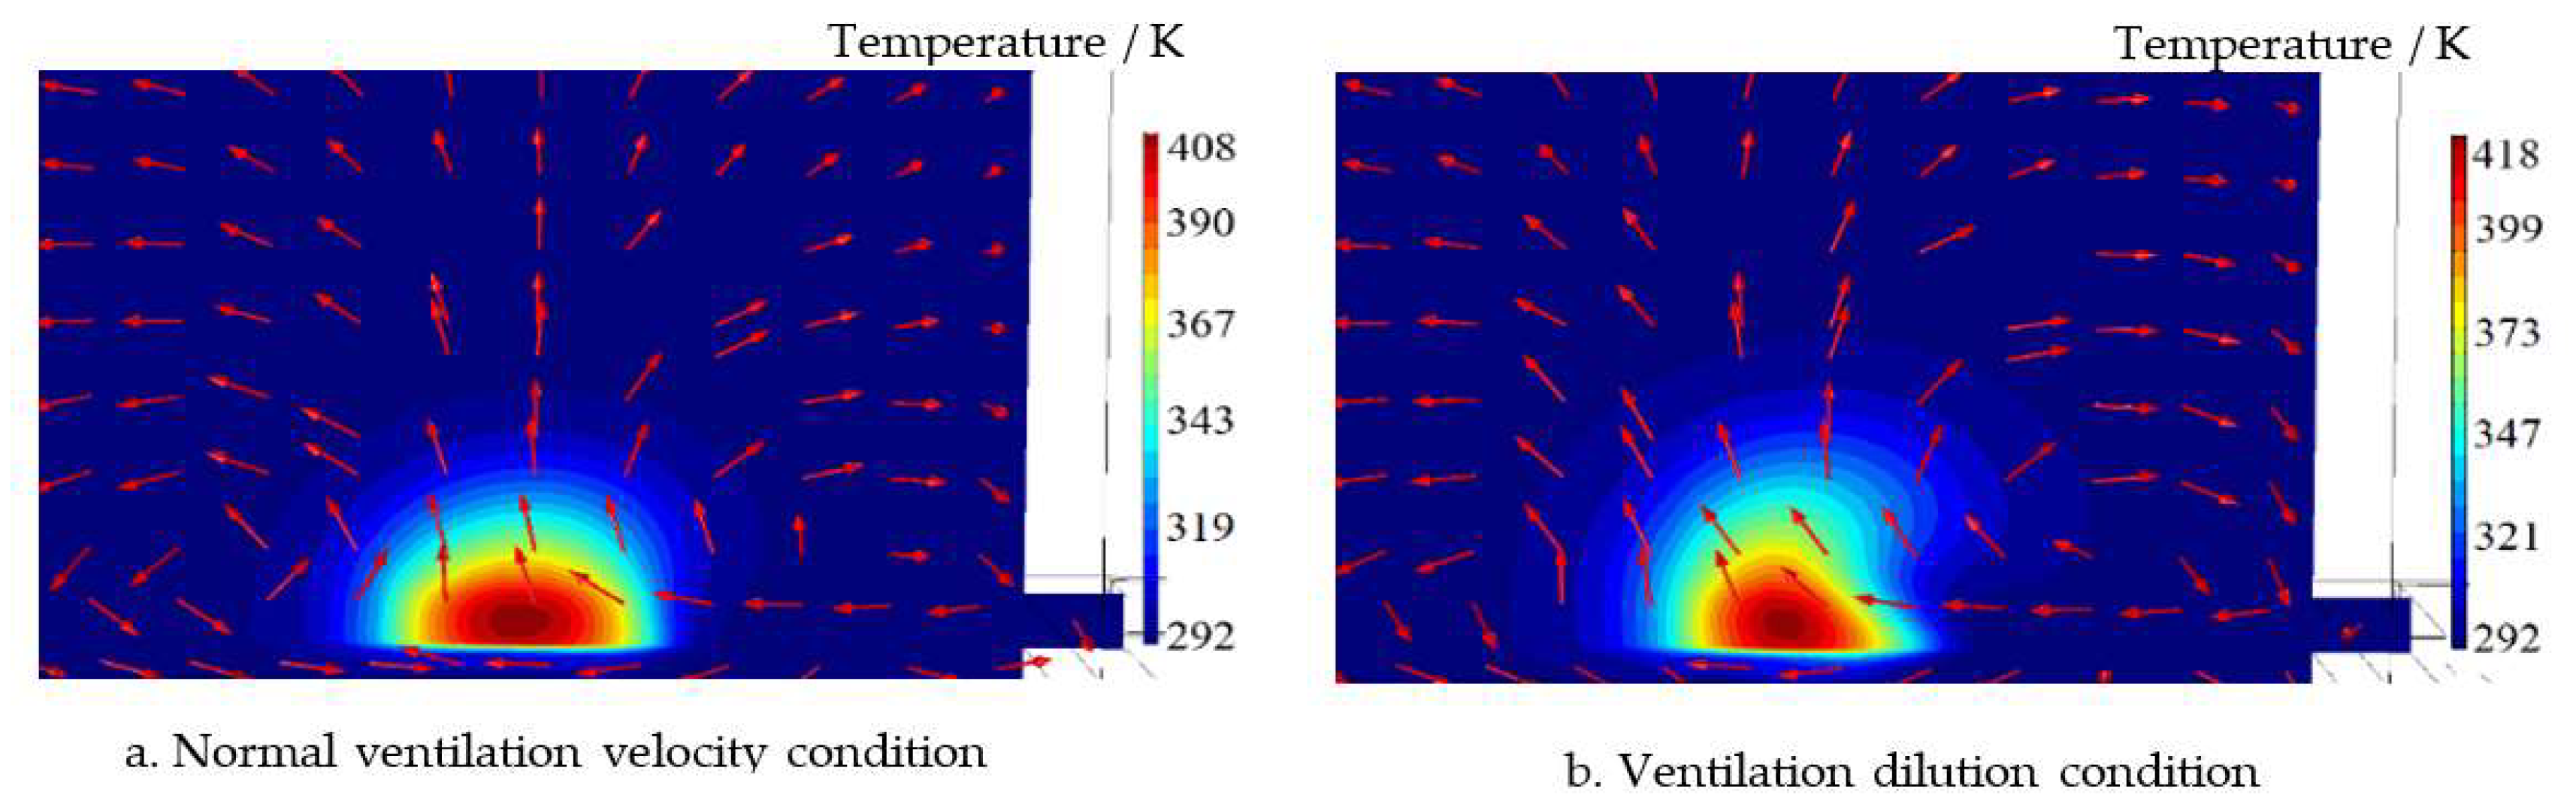
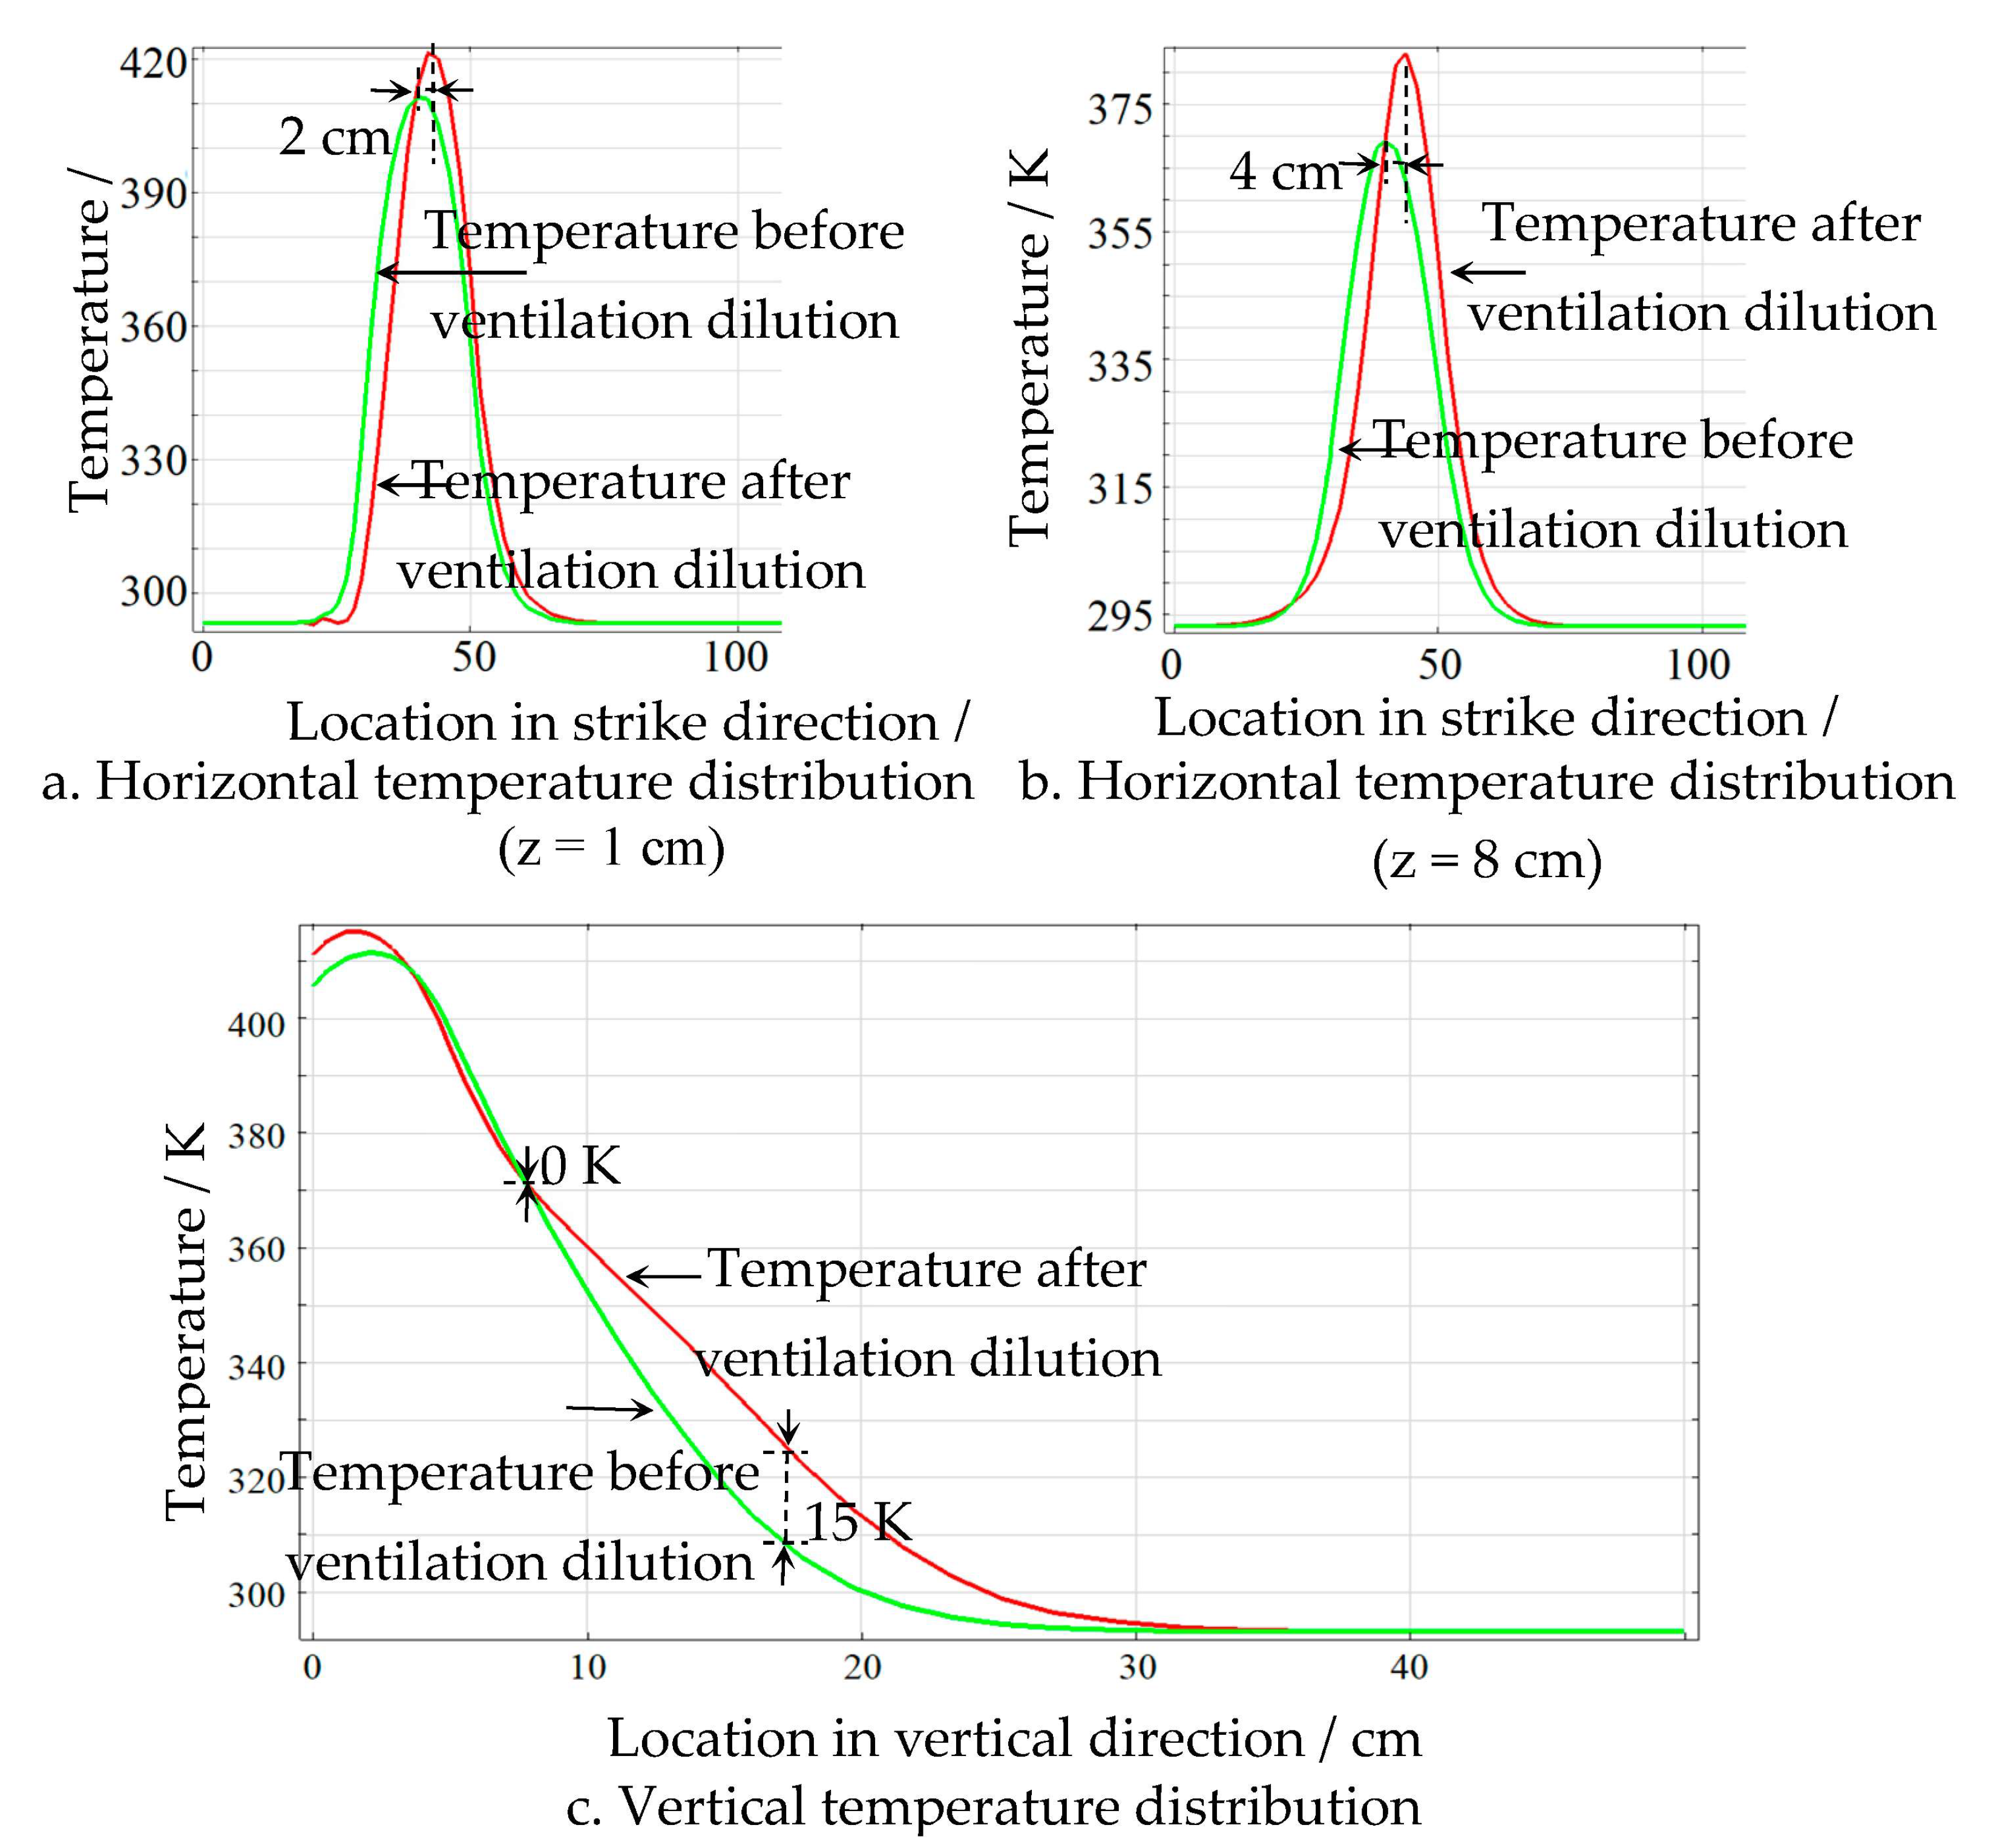
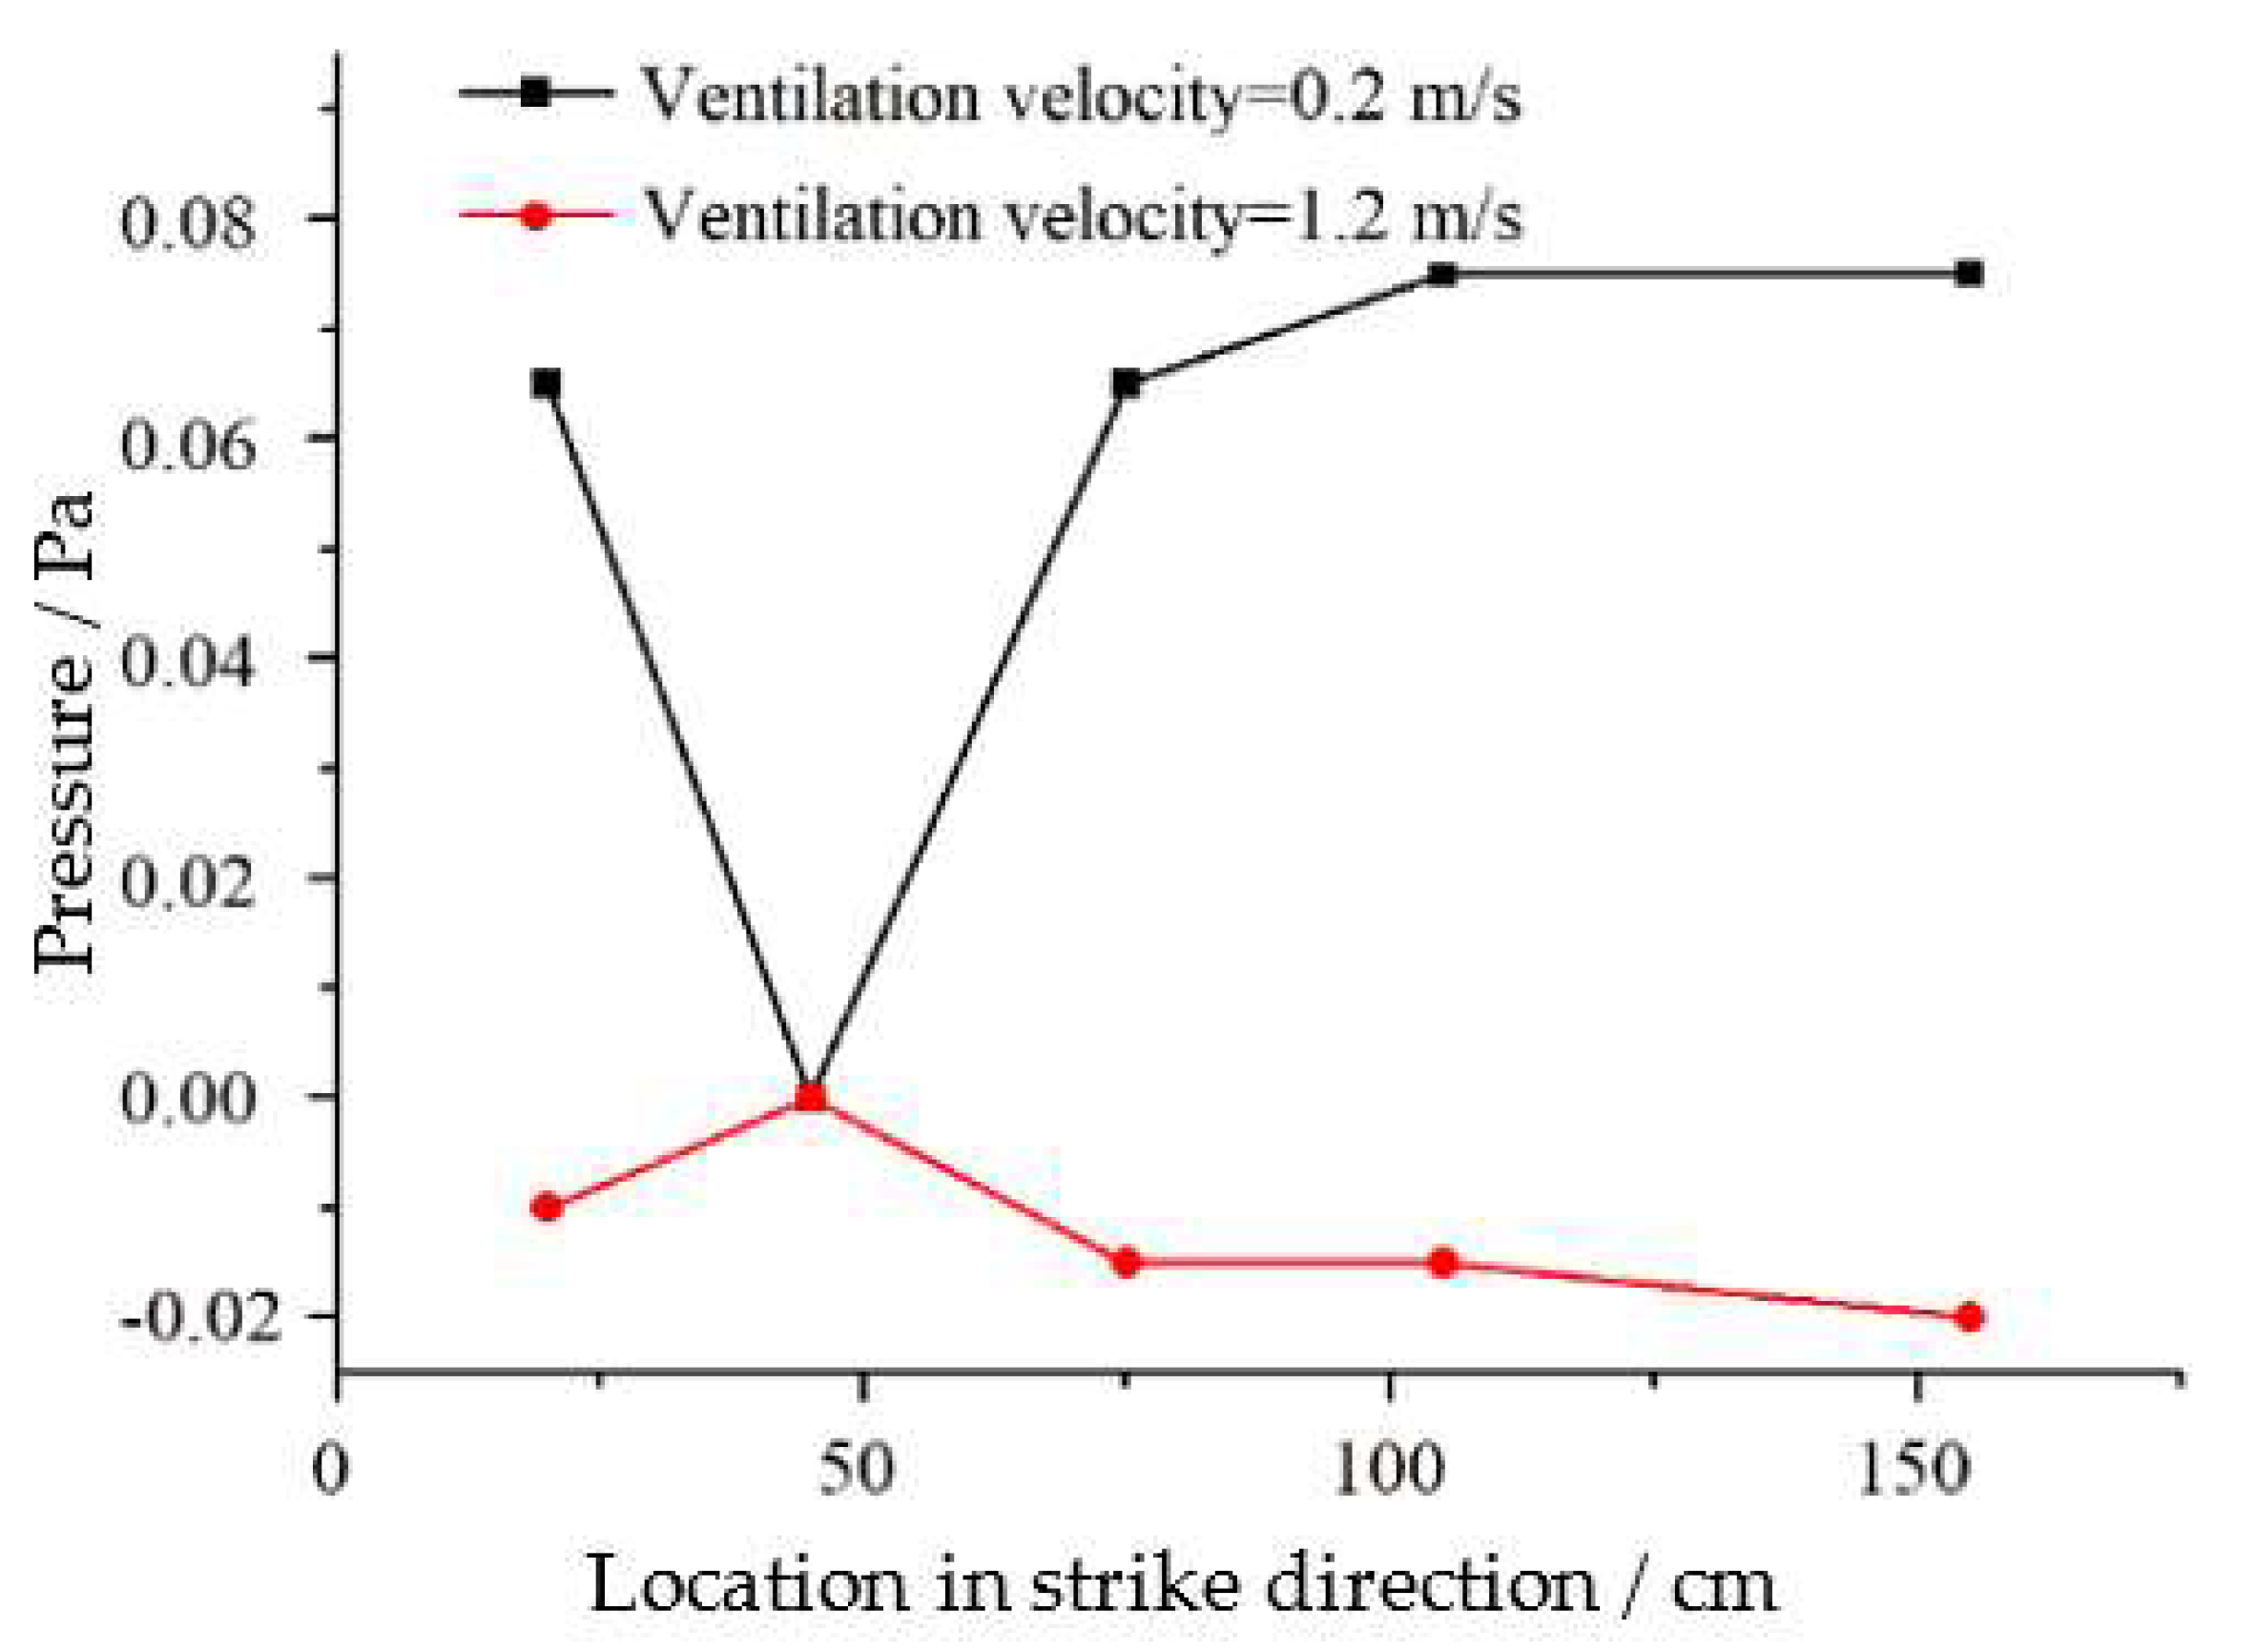
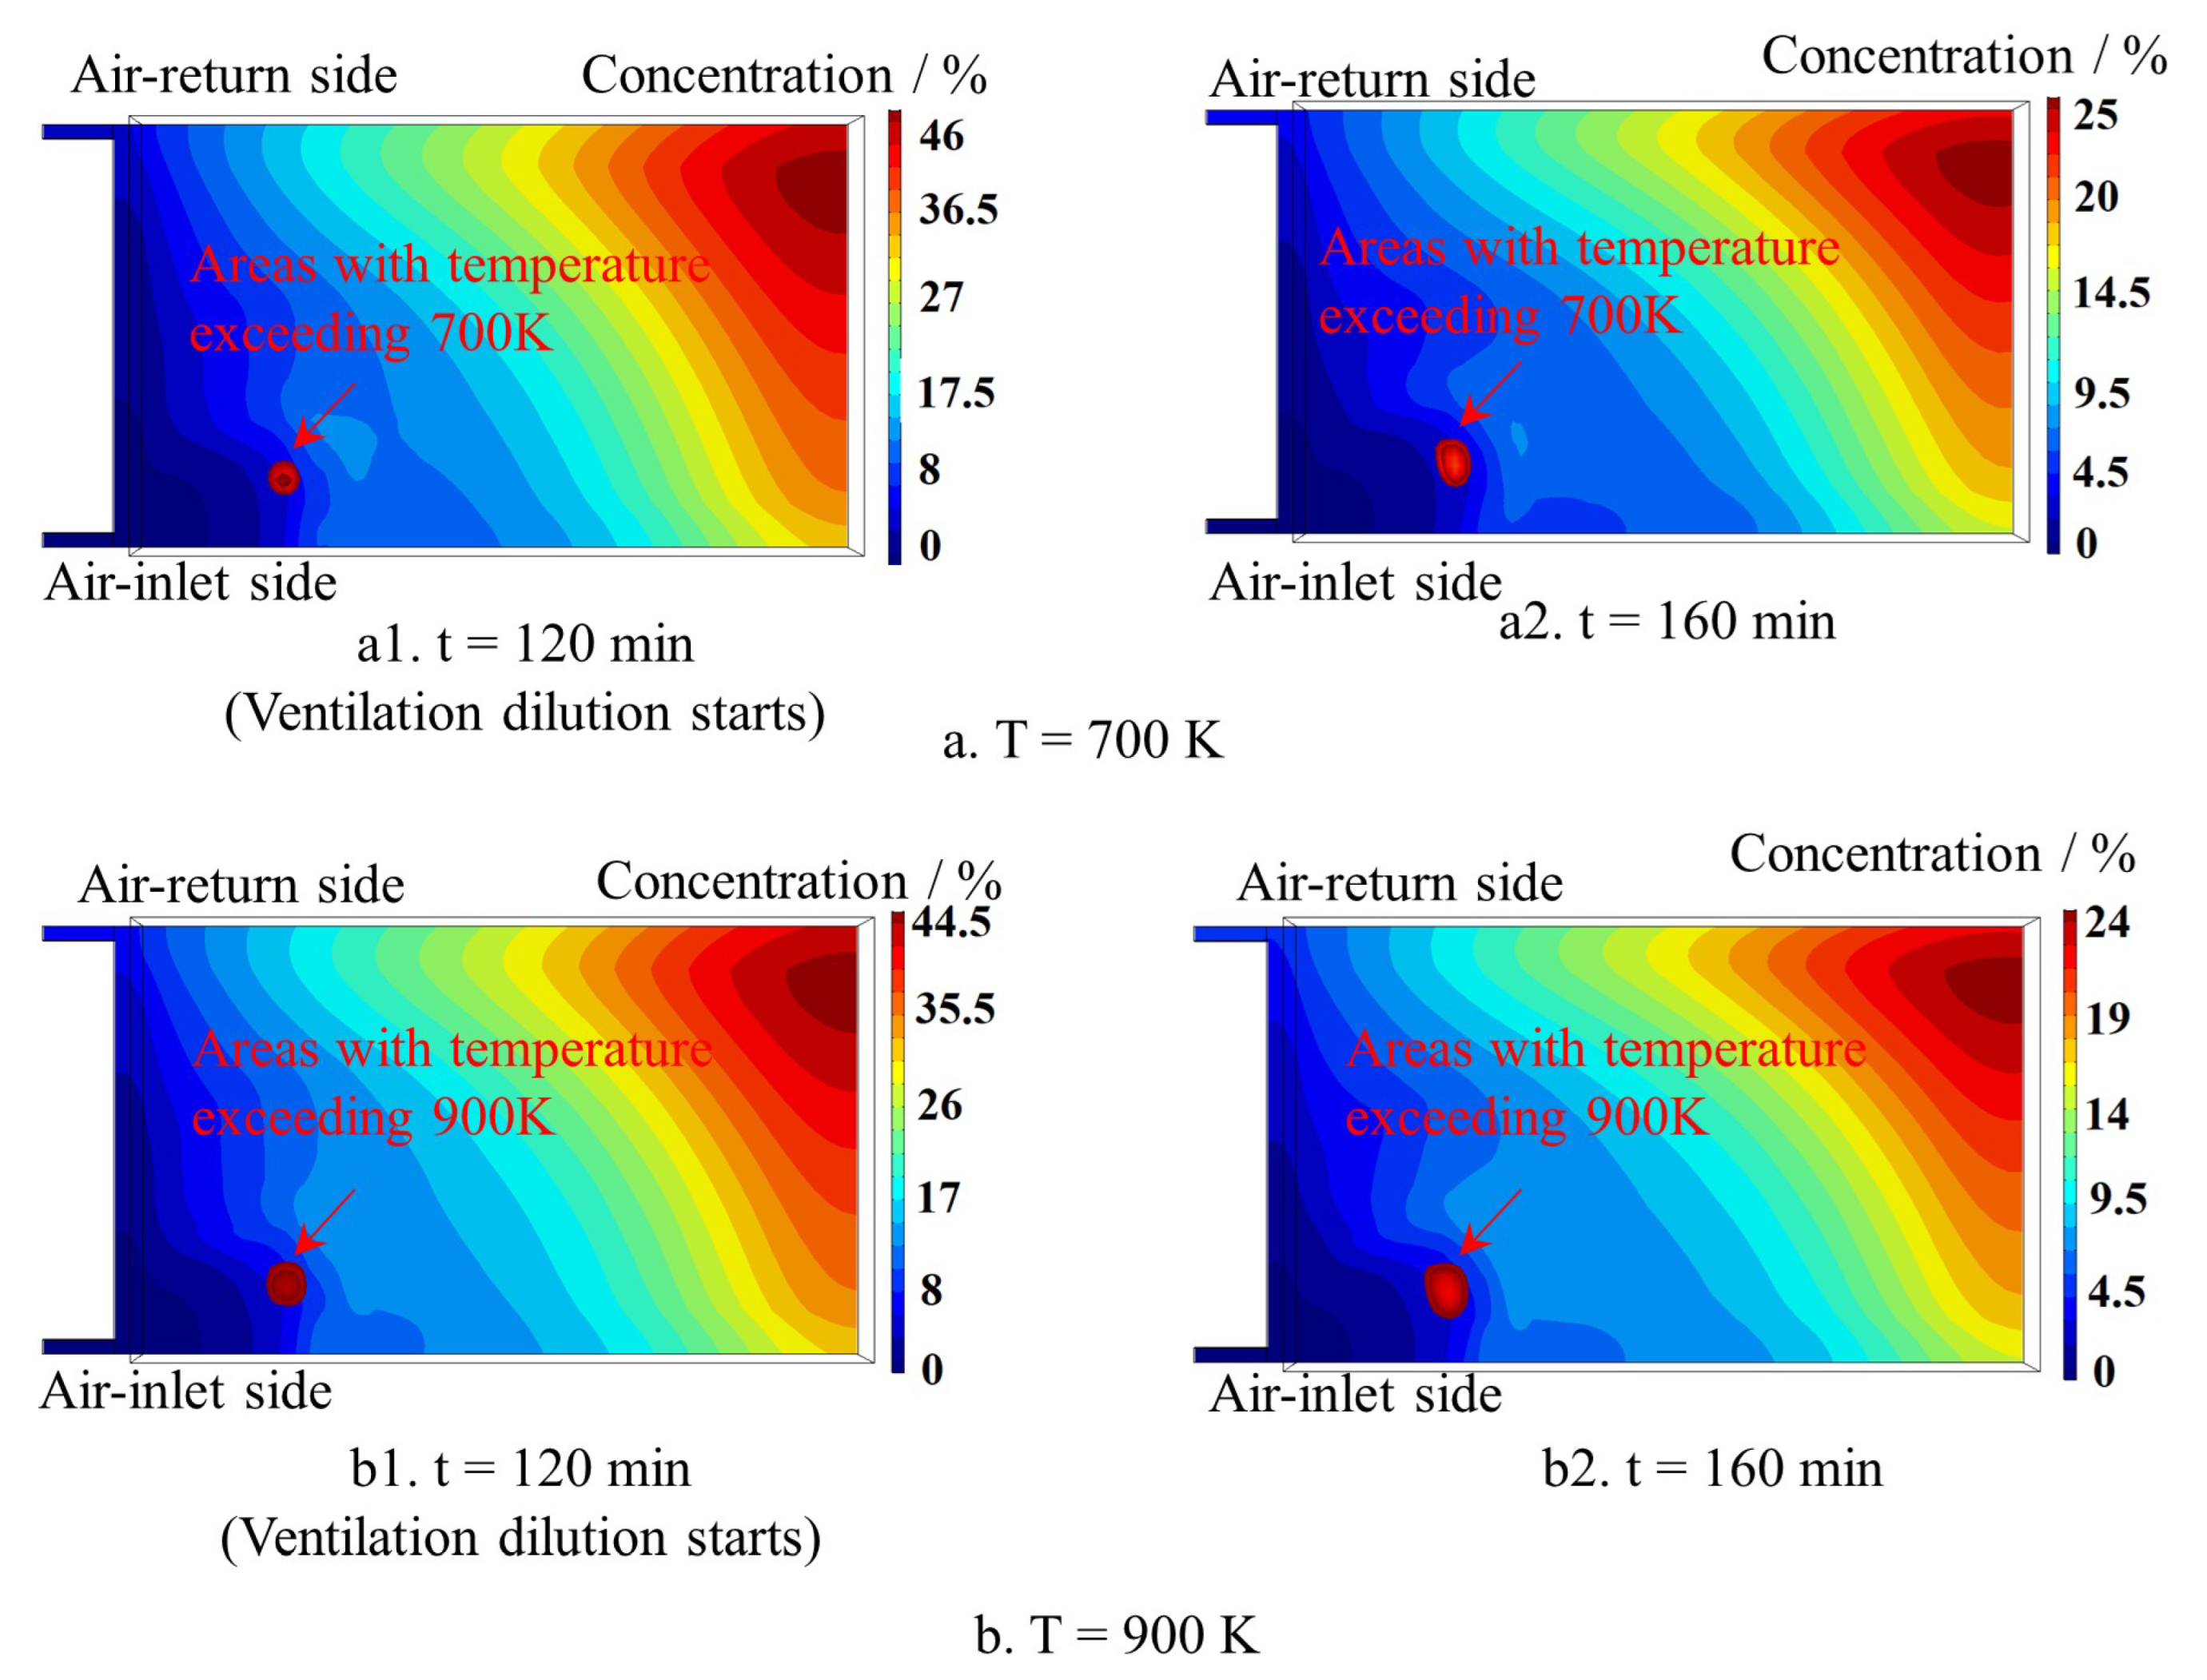
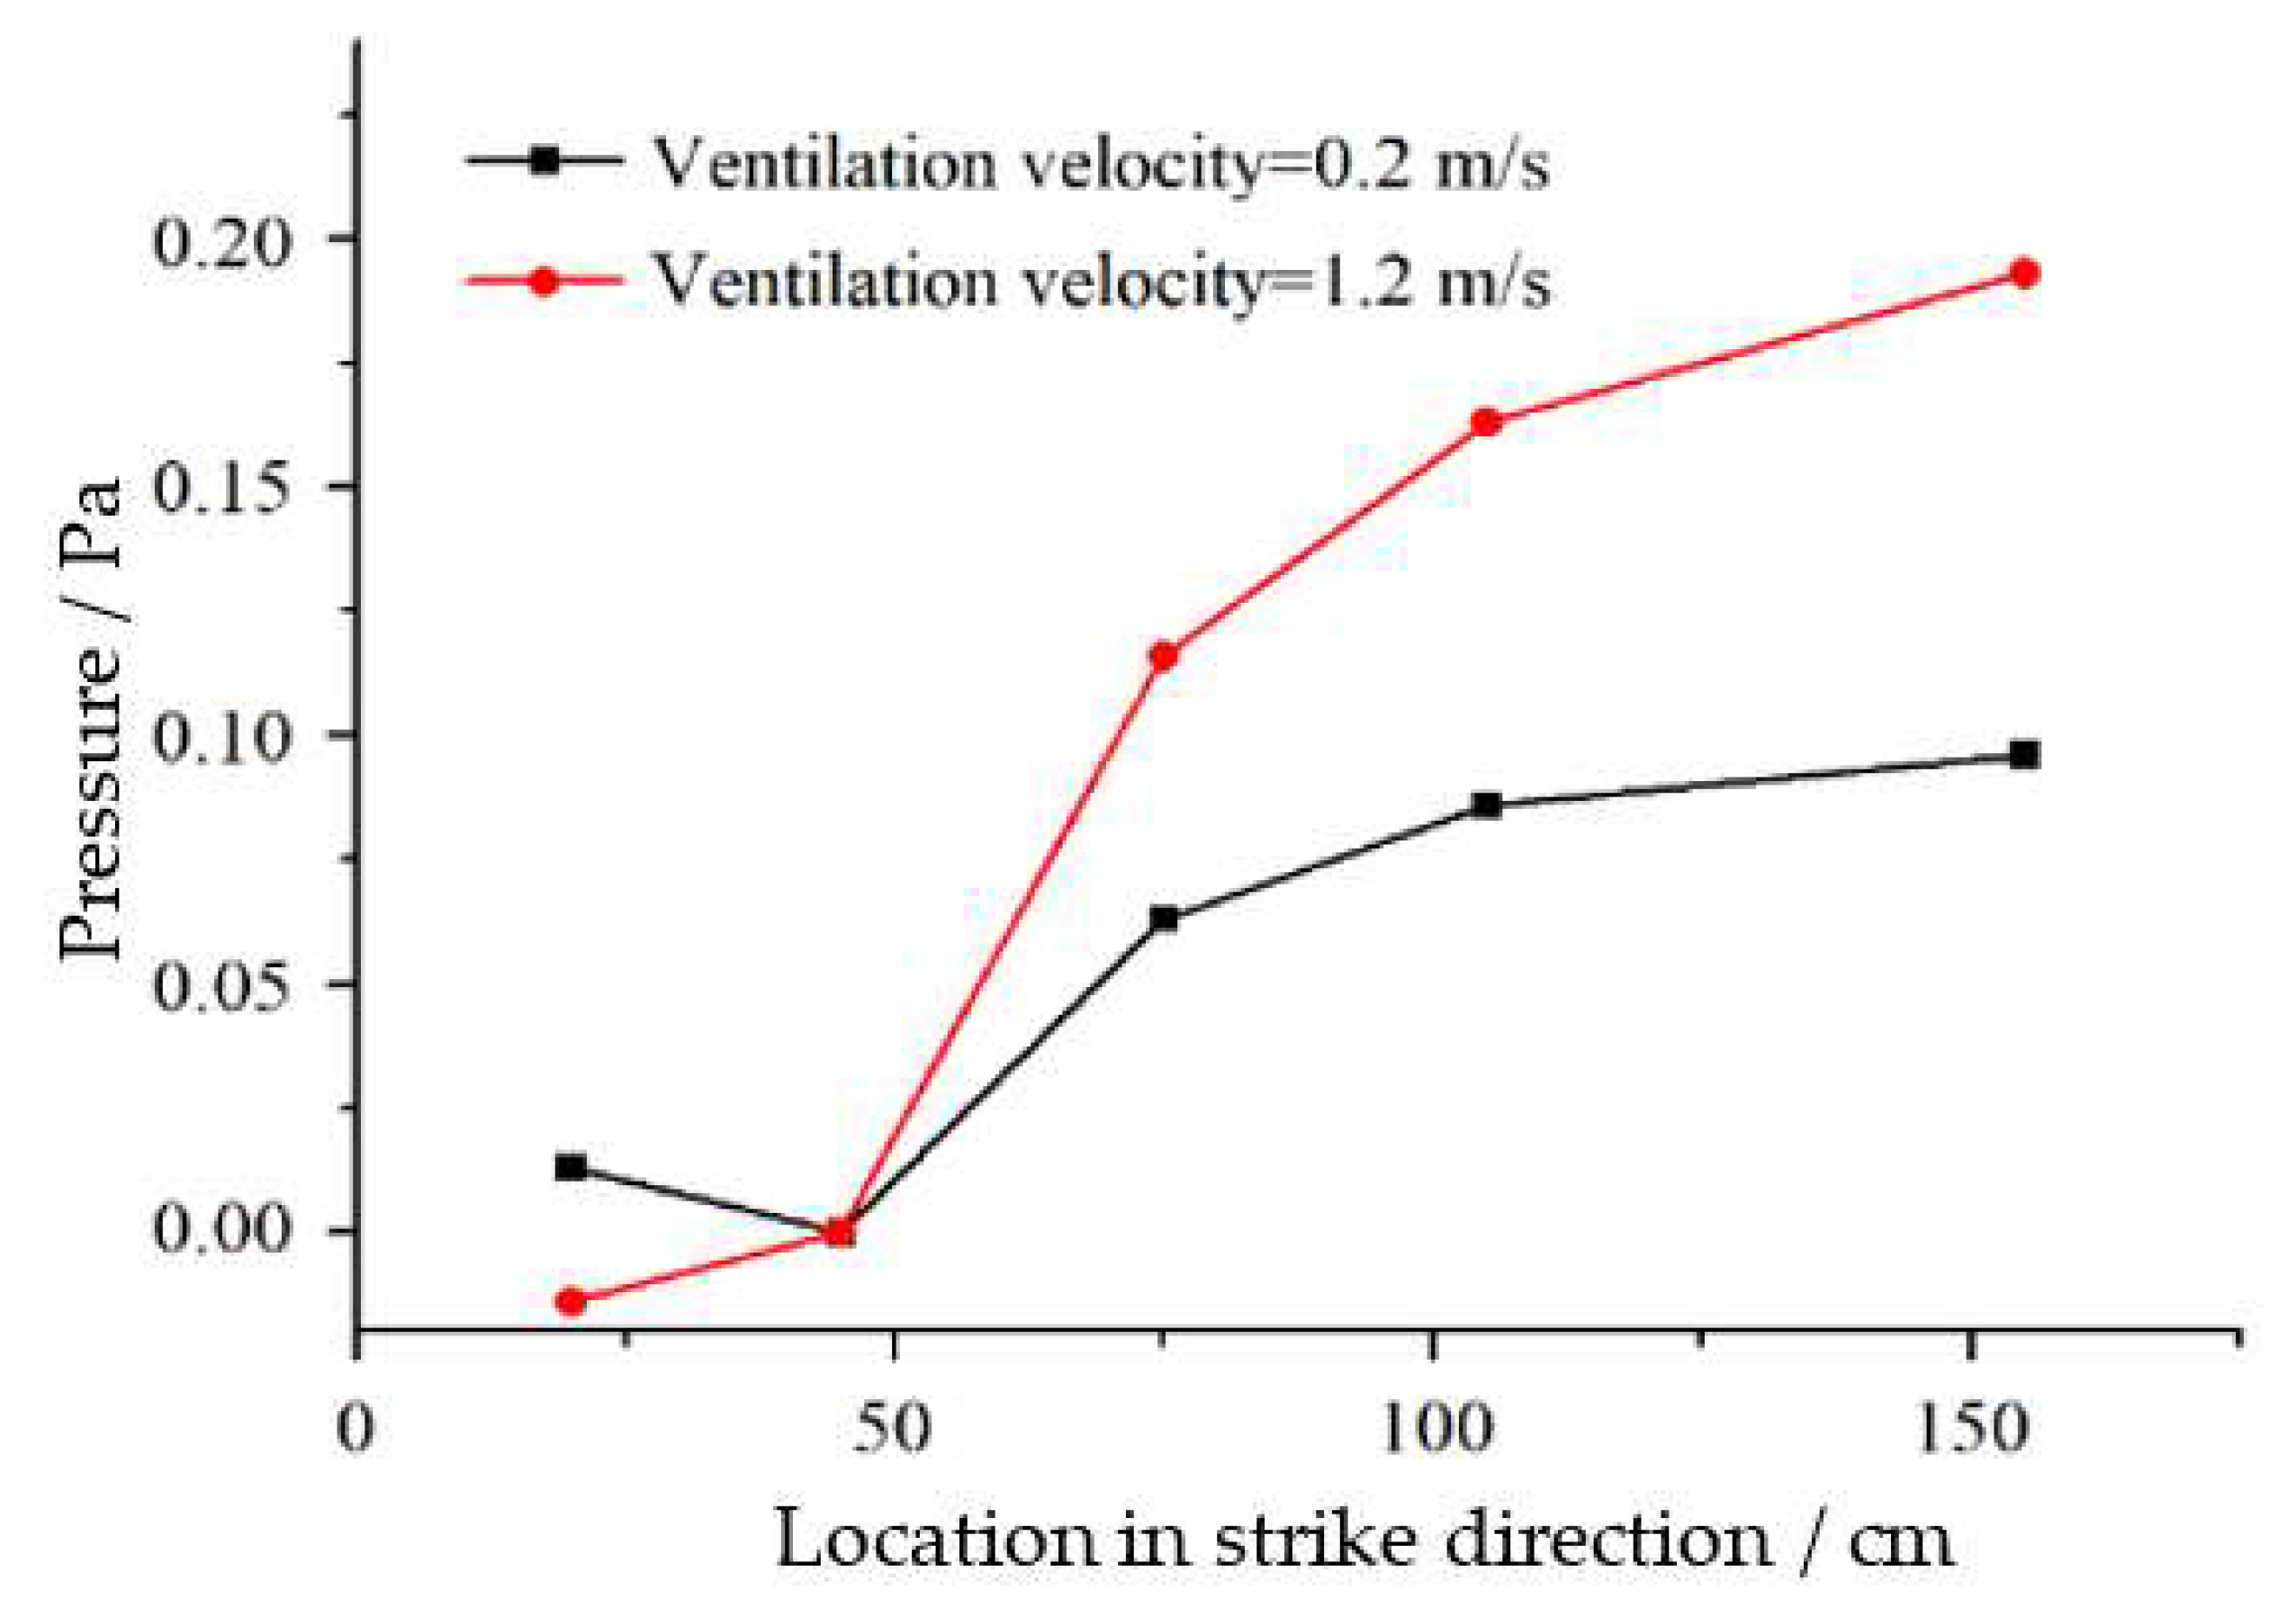
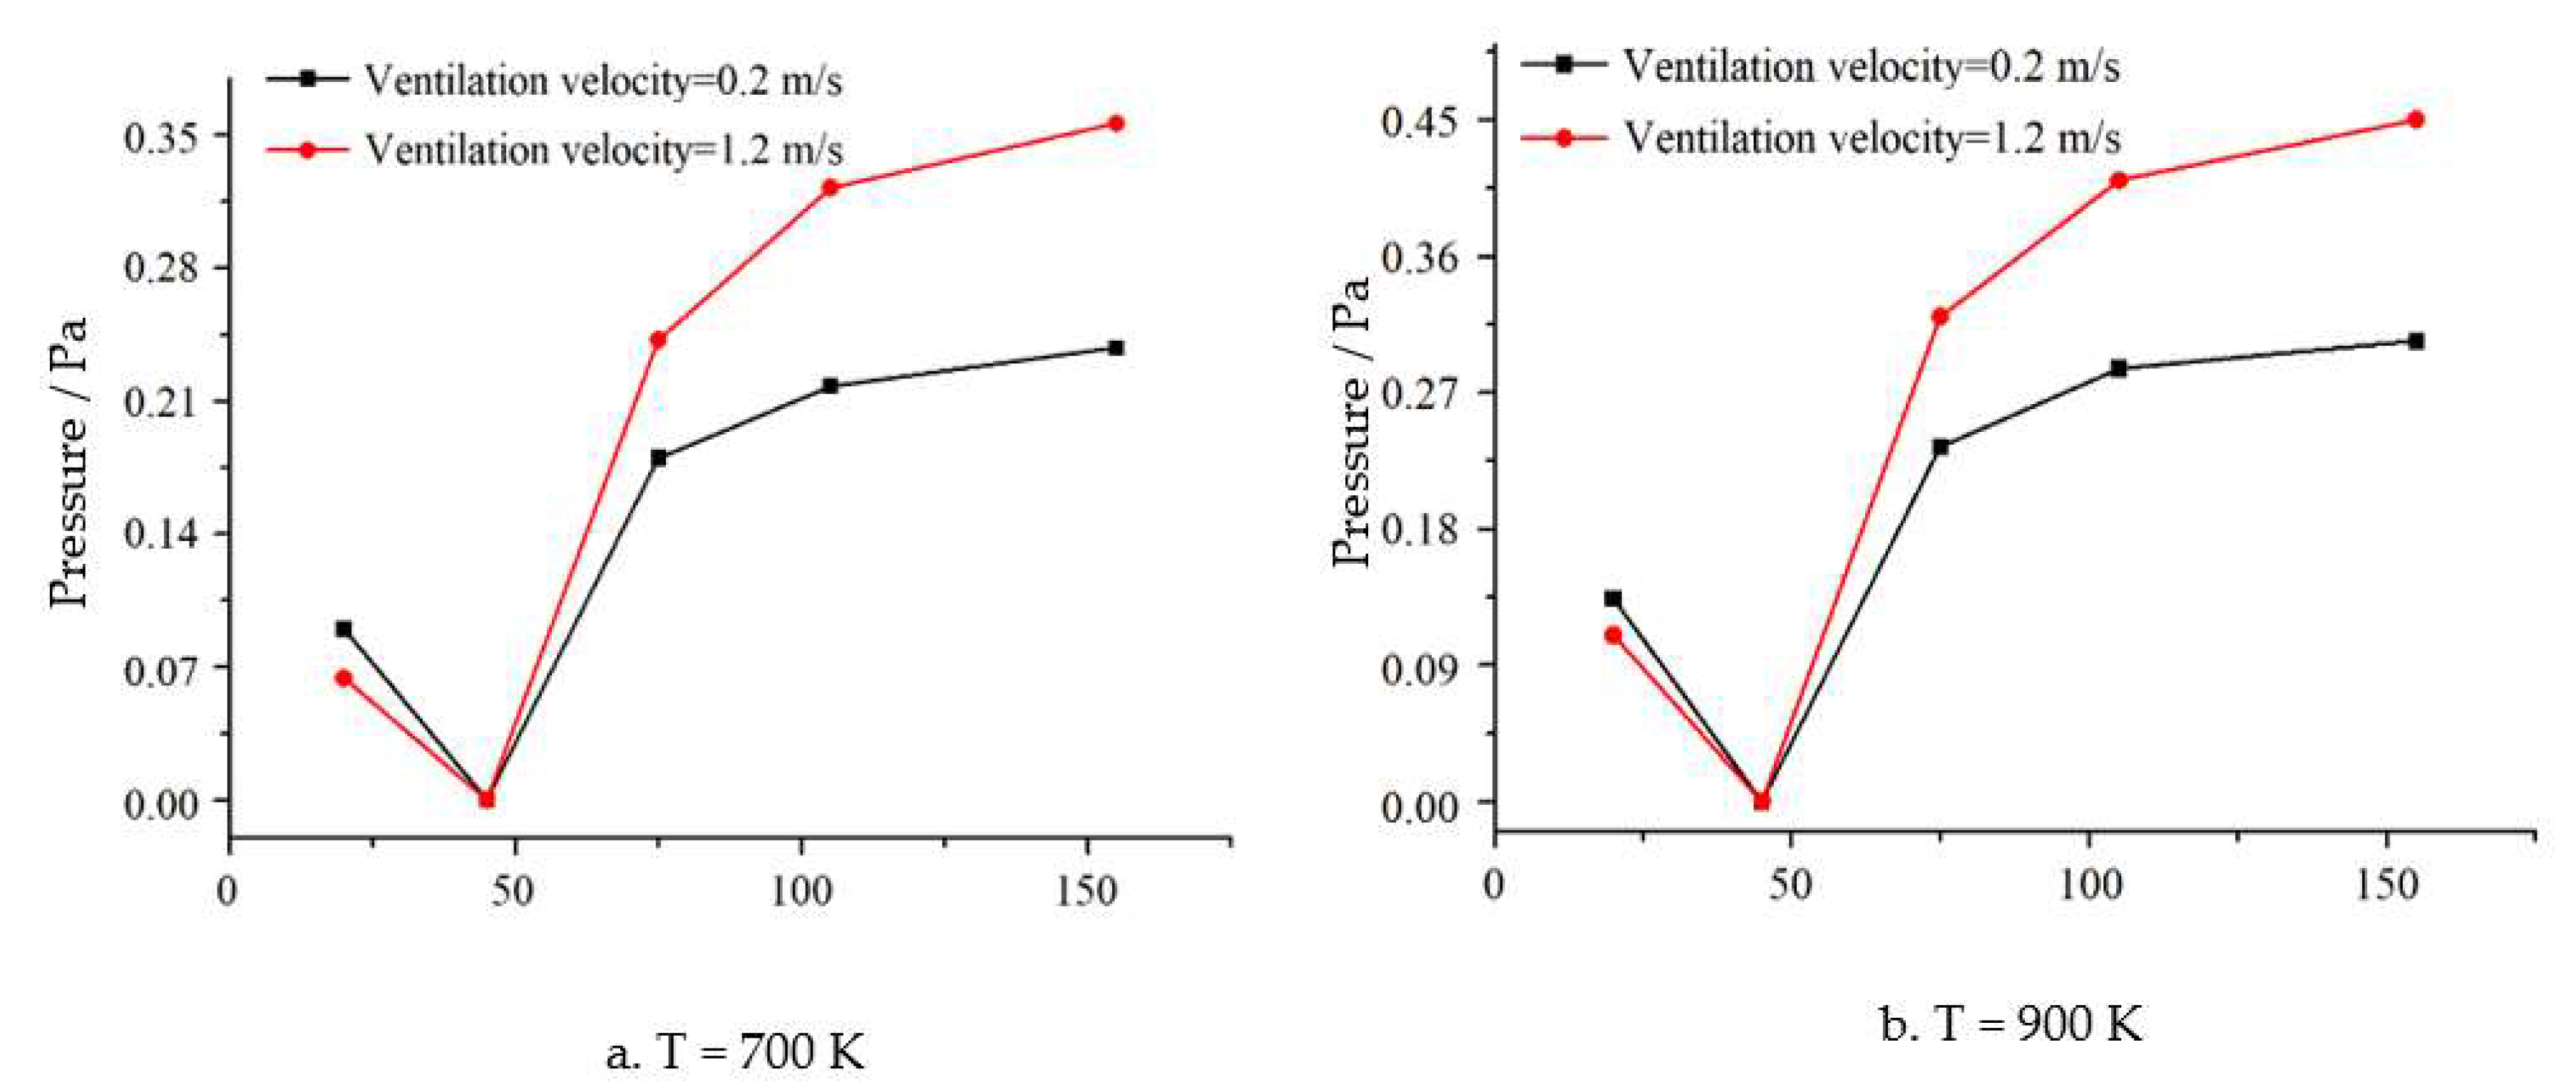
4.2. Effect of Ventilation Dilution on Airflow Field with Coal Combustion on Air-Inlet Side

The evolution of methane concentration and temperature in coal mine goafs is shown in Figure 4, where the spontaneous coal combustion temperature increases to 400 K on the air-inlet side. The areas marked by the red dot in Figure 4c,d represent the temperatures exceeding 400 K. At 40 min, the coal combustion area has a 1% methane concentration, and the coal combustion temperature does not reach 400 K. At 80 min, a methane accumulation can be seen in the coal combustion area’s upper right corner. The accumulated methane concentration is 2.5%, and the temperature increases to 385 K. The buoyancy effect brought on by coal combustion is the primary cause of this methane accumulation [5,12]. At 120 min, the coal combustion temperature reaches 400 K, and the accumulated methane accumulation reaches 7.5%. The middle line of the combustion area’s points, where its temperature is 400 K, are selected as the representative points to show the change in the methane concentration in the strike direction. Taking the coal combustion center location as the origin, the variation in methane concentration at the representative points is shown in Figure 5. Before ventilation dilution, the coal combustion area’s leeward side has a maximum methane concentration of 4.8% at point (5, 0), while its windward side has a minimum methane concentration of 2.4% at point (−4, 0). After ventilation dilution starts at 120 min, the accumulated methane concentration reduces quickly. At 160 min, the methane concentration at the above two points decreases to 1.8% and 1.1%, respectively. The accumulated methane concentration decreases to 3.8% at the upper right corner of the coal combustion area. Meanwhile, points (8, 0) and (−2, 0) become the new locations, with the temperature at 400 K, as the temperature of coal combustion increases. On the coal combustion area’s leeward side, the maximum methane concentration falls to 2% at point (8, 0), whereas on the windward side, the minimum methane concentration falls to 1.2% at point (−2, 0).
The temperature distributions before and after the ventilation dilution are shown in Figure 6. The red arrow represents the airflow direction in the figure. Before ventilation dilution, the temperature distribution around the area of coal combustion is shaped like a semicircle, with a slight shrinkage on the windward side. After ventilation dilution, the temperature distribution changes to be a half ellipse, with an obvious shrinkage on the windward side. Meanwhile, the coal combustion area’s upward airflow inclines to the leeward side. The increase in air leakage flux enhances the vertical heat dissipation at the location of coal combustion, leading to a smaller temperature gradient in the vertical direction [24]. A detailed change in the temperature distribution can be found in Figure 7. In the horizontal direction, the ventilation dilution leads to a drift of the center of the high temperature area. In monitor layer 1 (z = 1 cm), the center of the high temperature area moves to the leeward side by 2 cm after ventilation dilution, while it moves to the leeward side by 4 cm in monitor layer 2 (z = 8 cm). In the vertical direction, the temperature difference caused by ventilation dilution is almost zero in monitor layers 1 and 2. However, close to monitor layer 3 (z = 20 cm), the temperature difference reaches 15 K. Thereafter, the temperature difference gradually decreases to zero as the height increases. The change in the pressure difference in the area of coal combustion in Figure 8 can be used to analyze the effect of ventilation dilution. After ventilation dilution, the porous chimney effect’s negative pressure of −0.065 Pa turns into a positive pressure of 0.015 Pa.
As shown in Figure 9, when the temperature of spontaneous coal combustion continuously increases from 700 K to 900 K, the coal combustion area’s methane concentration rises from 5.9% to 6.5%. The accumulated concentration of methane rises from 11.8% to 12.7% in the coal combustion area’s upper right corner. The area of high temperature enlarges to change the representative points as the coal combustion temperature rises. Before ventilation dilution at 700 K, the maximum methane concentration at point (5, 0) reaches 7.8% on the coal combustion area’s leeward side, whereas on the windward side, the minimum methane concentration reaches 4.6% at point (−5, 0). At 900 K, the maximum methane concentration reaches 8.8% at point (6, 0) on the coal combustion area’s leeward side, while the minimum methane concentration reaches 5.3% at point (−6, 0) on the windward side.
After ventilation dilution at 120 min under 700 K, the methane concentration at the above two locations quickly decreases to 2.8% and 1.8%, respectively. At 160 min, the cumulative methane concentration decreases to 5.9% at the coal combustion area’s upper right corner, as shown in Figure 9. The points (6, 0) and (−4, 0) become the new representative points after ventilation dilution. The maximum methane concentration decreases to 3% at point (6, 0) on the coal combustion area’s leeward side, while the minimum methane concentration decreases to 1.8% at point (−4, 0) on the windward side. At 900 K, the methane concentrations at the above two locations decrease to 3.7% and 2.2%, respectively. At 160 min, the accumulated methane concentration decreases to 6.4% at the coal combustion area’s upper right corner. Meanwhile, point (7, 0) and point (−5, 0) become the new representative points. The maximum methane concentration decreases to 3.8% at point (7, 0) on the coal combustion area’s leeward side, while the minimum methane concentration decreases to 2.4% at point (−5, 0) on the windward side.
The temperature distribution around the area of coal combustion has the shape of a half ellipse, with some shrinkage on the windward side before ventilation dilution, as the temperature of spontaneous coal combustion rises from 700 K to 900 K. The upward airflow within the area of coal combustion and the vortex airflow surrounding it are obvious. The area of high temperature expands in the vertical direction after ventilation dilution, while the shrinkage area on the windward side weakens. Meanwhile, the airflow movement direction at the location of coal combustion hardly changes. Due to the enhanced air leakage, the vortex airflow on the windward side grows in size. Therefore, the upward airflow and the vertical heat dissipation at the location of coal combustion are strengthened by the increased air leakage flux. As the temperature of coal combustion rises, there is a weakening of the horizontal drift of the high temperature area center. In monitor layer 1 (z = 1 cm), the drift distance of the high temperature center to the leeward side decreases from 1.5 cm to 1 cm when the temperature of coal combustion rises from 700 K to 900 K. In monitor layer 2 (z = 8 cm), the drift distance decreases from 2 cm to 1.5 cm when the temperature of coal combustion rises from 700 K to 900 K. As the temperature of coal combustion rises, the coal combustion-induced buoyancy effect becomes stronger. After ventilation dilution, the porous chimney effect’s negative pressure rises from −0.2 Pa at 700 K to −0.15 Pa at 900 K, as shown in Figure 10. The changes in main indexes are listed in Table 5 when the coal combustion temperature increases on the air-return side.
The distribution of methane concentration and temperature in the goaf of a coal mine at 400 K, 700 K and 900 K changed, indicating that methane explosion risk can be significantly decreased by ventilation dilution. In the goaf of a coal mine, when a spontaneous coal combustion area of 400 K appears on the air-inlet side, the combustion area’s methane concentration is close to the explosive methane concentration limits. Under this condition, the ventilation dilution can reduce the accumulated methane concentration to a safer range quickly. At 700 K and 900 K, the accumulated concentration of methane reaches explosive levels under a high combustion temperature, resulting in significant danger of a methane explosion. By enlarging air leakage in the goaf of a coal mine, ventilation dilution can decrease the methane concentration to below explosive methane limits, reducing the risk of a methane explosion. However, the strong porous chimney effect at the location of coal combustion is unaffected by air leakage, and the methane accumulation is present there.

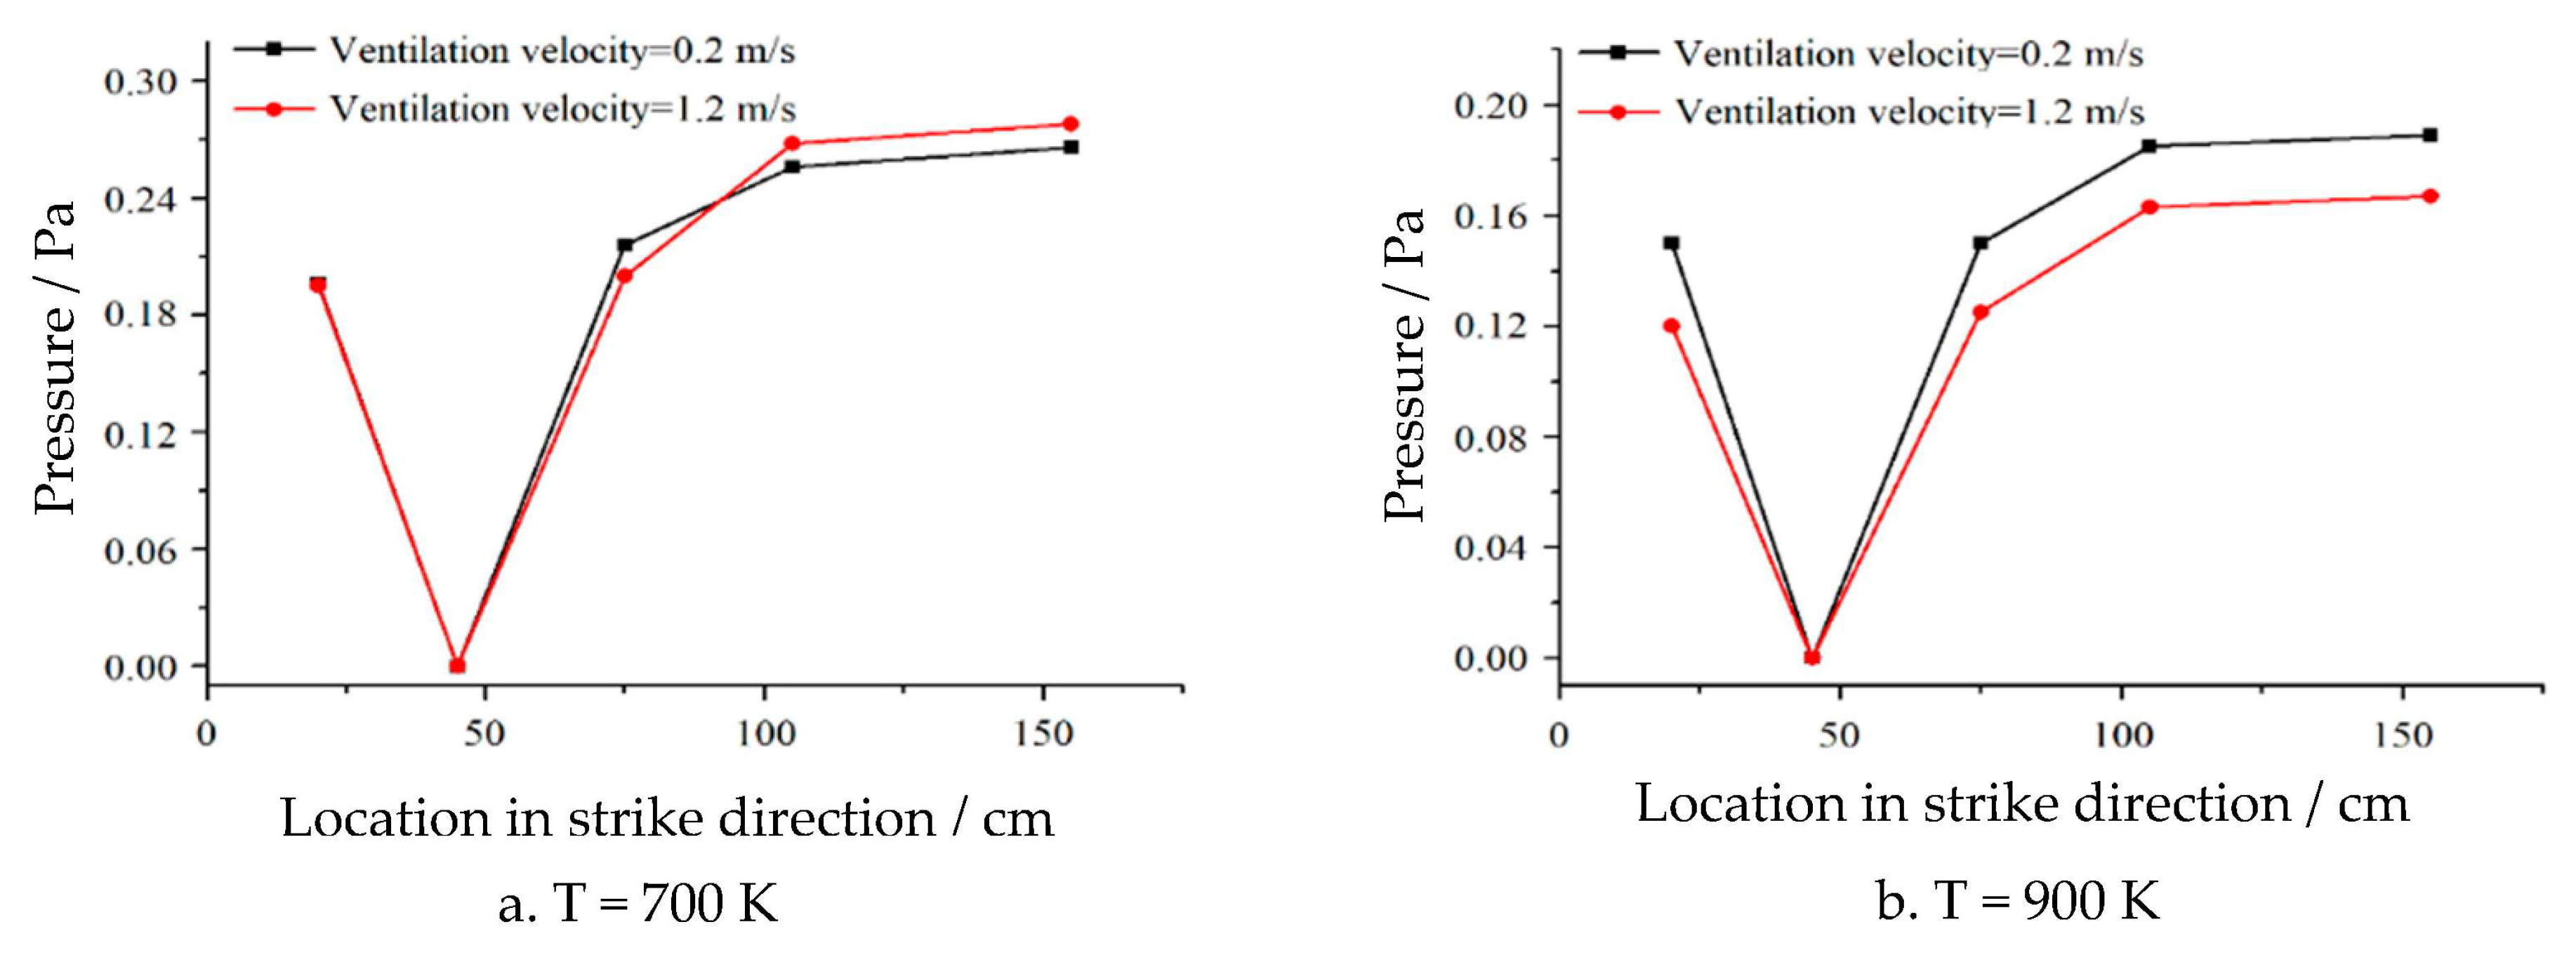
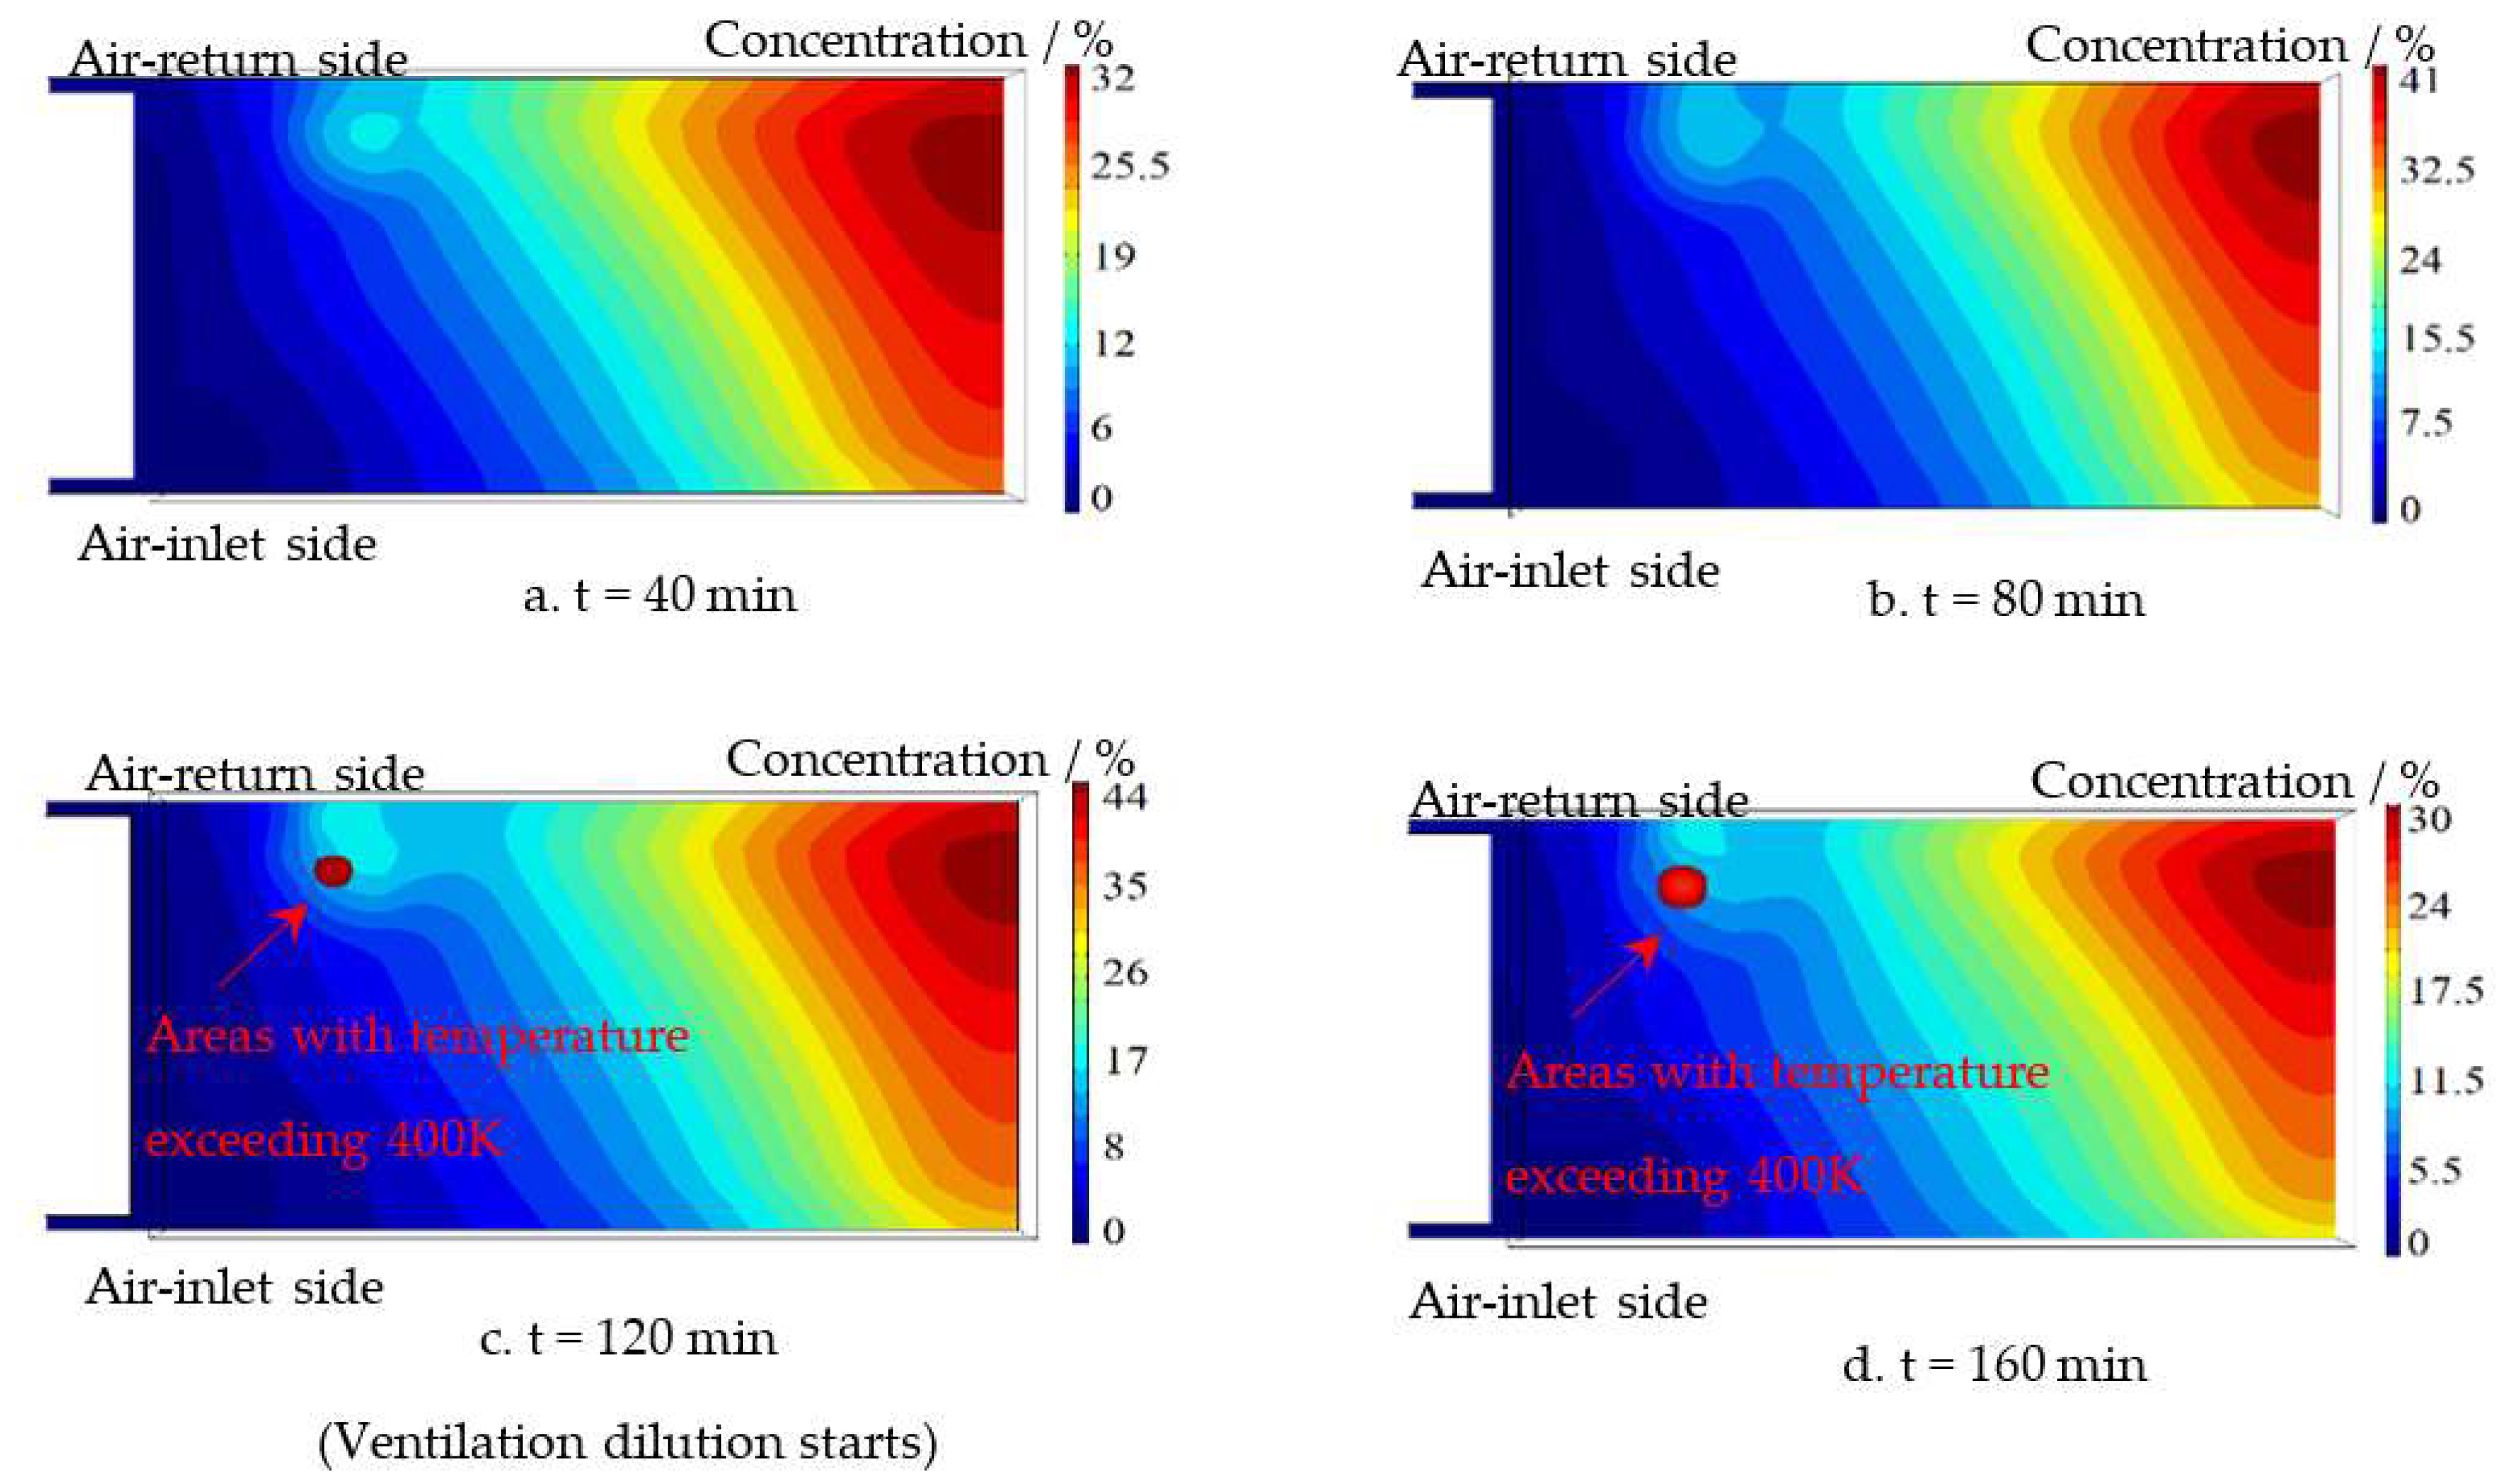
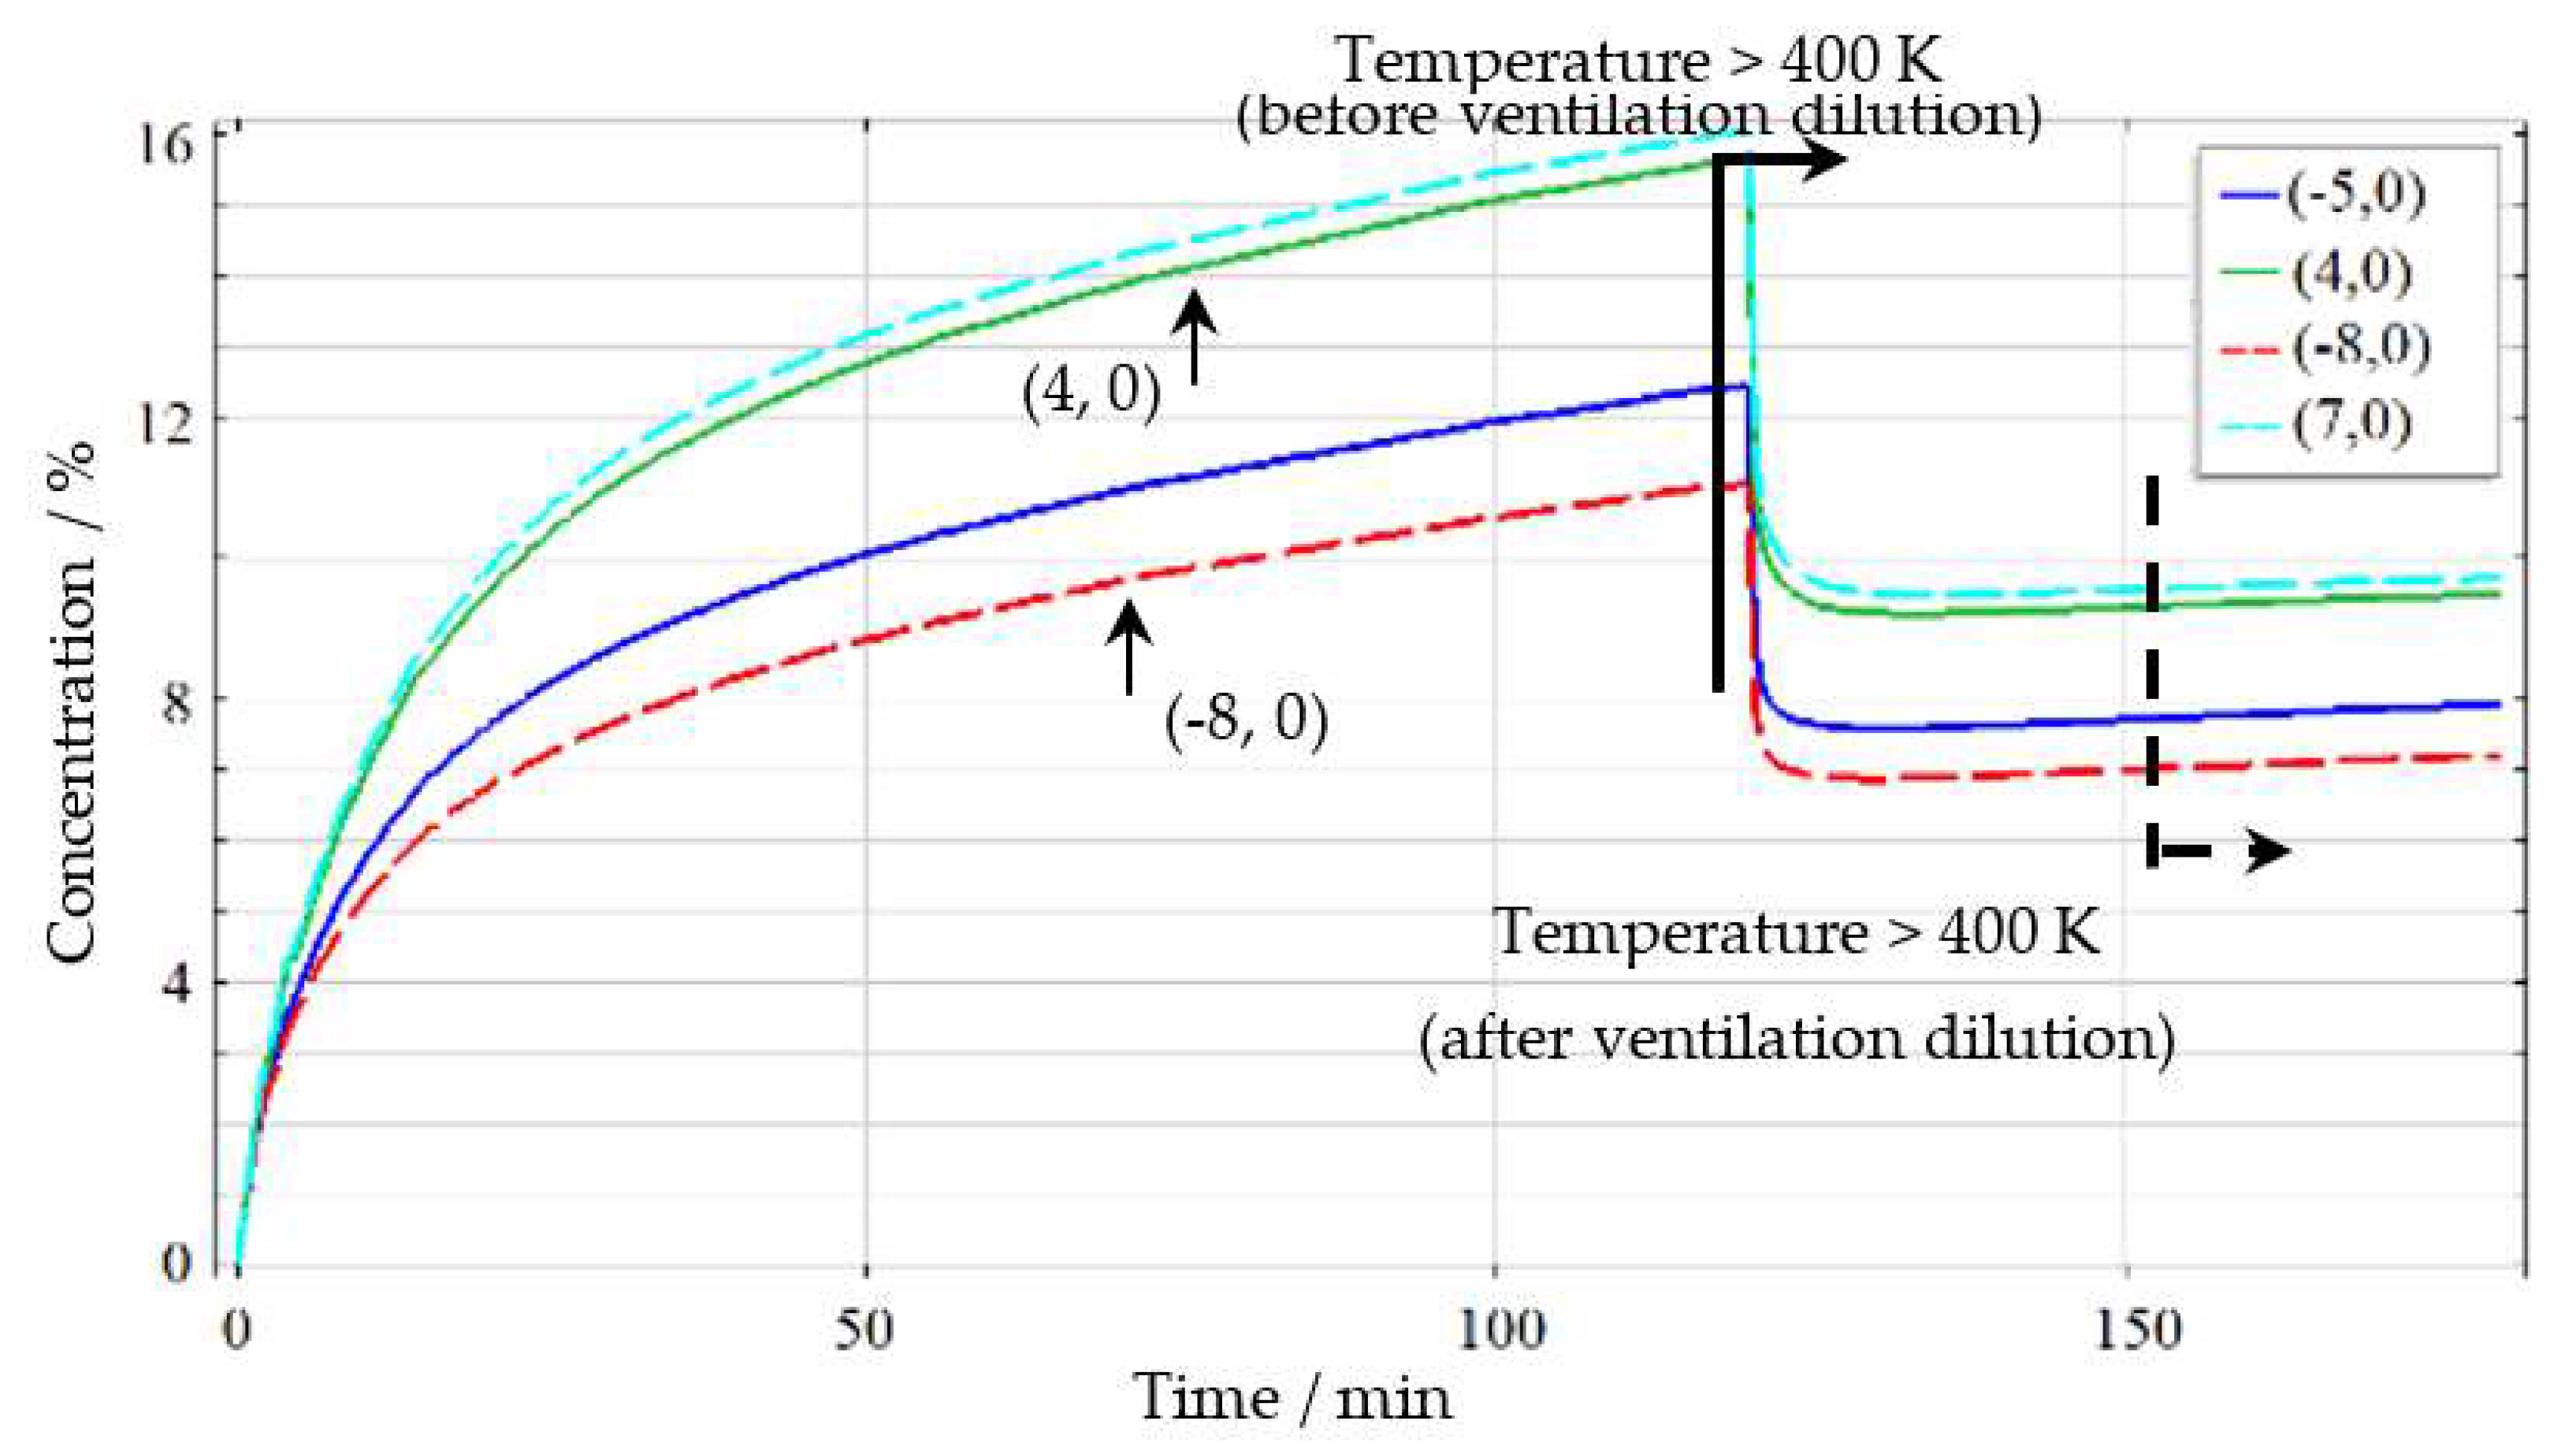
4.3. Effect of Ventilation Dilution on Airflow Field with Coal Combustion on Air-Return Side

When spontaneous coal combustion of the air-return side of the goaf reaches 400 K, a change in the methane concentration distribution occurs, as shown in Figure 11. The red dot represents the area where the temperature is above 400 K. Before ventilation dilution, the accumulated concentration of methane in the area of coal combustion increases from 12.5% at 345 K at 40 min to 14% at 375 K at 80 min, and finally to 15.5% at 400 K at 120 min. Taking the coal combustion center’s location as the origin, the change in methane concentration at the representative points is shown in Figure 12. The maximum methane concentration reaches 15.5% at point (4, 0) on the coal combustion area’s leeward side, whereas the minimum methane concentration reaches 12.5% at point (−5, 0) on the windward side. After ventilation dilution begins at 120 min, the concentration of methane in the accumulation area reduces quickly. At 160 min, the methane concentration at the above two points decreases to 9.2% and 7.8%, respectively. Although methane accumulation is still obvious in the area of coal combustion, the accumulated concentration of methane drops to 8.8%. Point (7, 0) and point (−8, 0) become the new location where the temperature is 400 K. The maximum methane concentration decreases to 9.5% at point (7, 0) on the coal combustion area’s leeward side, whereas the minimum methane concentration decreases to 7% at point (−8, 0) on the windward side.
In the case of spontaneous combustion of coal on the air-return side, according to the temperature distribution before and after ventilation dilution in the goaf, before ventilation dilution, the temperature distribution around the area of coal combustion has the shape of a symmetrical semicircle. An upward movement and vortex airflow around the combustion area are the predominant airflows in the area of coal combustion. After ventilation dilution, the temperature distribution changes little. In the meantime, the coal combustion area’s main airflow slightly inclines to the windward side. Outside of the combustion area, the vortex airflow becomes weaker. However, the center of the high temperature area remains stationary. Additionally, the temperature disparities between the horizontal and vertical planes also remain stable. Therefore, on the air-return side of a coal mine goaf, the temperature distribution near the area of coal combustion is not significantly affected by ventilation dilution. The pressure difference caused by coal combustion changes little after ventilation dilution, as shown in Figure 13.
If the spontaneous coal combustion temperature increases from 700 K to 900 K on the air-return side in the goaf of a coal mine, an obvious methane accumulation constantly appears in the area of coal combustion, as is shown in Figure 14. Before ventilation dilution, the accumulated methane concentration increases to 23% at both 700 K and 900 K. At 700 K, the maximum methane concentration, before ventilation dilution, reaches 22% at point (4, 0) on the coal combustion area’s leeward side, whereas the minimum methane concentration reaches 17.8% at point (−5, 0) on the windward side. At 900 K, the maximum methane concentration reaches 21.5% at point (6, 0) on the coal combustion area’s leeward side, whereas the minimum methane concentration reaches 16% at point (−7, 0) on the windward side.
After the ventilation dilution at 700 K, the accumulated methane concentration at the representative two points decreases to 12.2% and 10.2%, respectively. Meanwhile, points (6, 0) and (−7, 0) become the new points where the temperature is 700 K as the temperature of coal combustion rises. On the coal combustion area’s leeward side, the maximum methane concentration drops to 12.1% at point (6, 0), while on the windward side, the minimum methane concentration drops to 9.8% at point (−7, 0). At 900 K, the ventilation dilution lowers the methane concentration at the above two locations to 12% and 9.8%, respectively. Meanwhile, point (7, 0) and point (−8, 0) become the new points where the temperature is 900 K. The maximum methane concentration decreases to 12% at point (7, 0) on the coal combustion area’s leeward side, whereas the minimum methane concentration decreases to 9.7% at point (−8, 0) on the windward side.
After ventilation dilution at both 700 K and 900 K, the temperature distribution around the coal combustion changes little. The temperature distribution is symmetrically shaped like a semicircle. The upward airflow inside the area of coal combustion becomes stronger as the temperature of the coal combustion rises, and the vortex outside the combustion area becomes more noticeable. After ventilation dilution, the distribution of temperature, upward airflow and vortex change little. In the area of coal combustion, the strong upward airflow inclines slightly to the windward side. On the horizontal plane, the center of the high temperature area does not move. On the air-return side in the goaf of a coal mine, the ventilation dilution exerts little impact on the temperature distribution near the area of coal combustion. The negative pressure caused by coal combustion increases from around −0.16 Pa at 700 K to −0.21 Pa at 900 K, as shown in Figure 15. The changes in main indexes are listed in Table 6, when the coal combustion temperature increases on the air-return side.
Although ventilation dilution can effectively decrease the accumulated methane concentration, methane accumulation occurs easily and stably in the combustion area if spontaneous combustion of coal appears on the air-return side. Before and after ventilation dilution, the accumulated concentration of methane at 400 K is consistently within the explosive methane limits. Because of the large amount of energy consumed along the air leakage flow path, ventilation dilution exerts limited impact on the porous chimney effect in the area of coal combustion on the air-return side [41]. The porous chimney effect on the air-return side cannot be defeated by ventilation dilution when the temperature increases to 700 K and 900 K. The negative pressure in the combustion area changes little before and after ventilation dilution. Before ventilation dilution, the accumulated methane concentration is above the explosive methane limits. After ventilation dilution, the accumulated methane concentration decreases to within the explosive methane limits with a high coal combustion temperature. Therefore, at these two stages, ventilation dilution raises the possibility of a methane explosion in the goaf of a coal mine caused by coal combustion.

5. Conclusions

Methane accumulation in goafs of coal mines is a result of the chimney effect of spontaneous coal combustion. In the numerical simulation, applying the validated gas flow model for the environment of spontaneous coal combustion in goafs of coal mines, the effect of ventilation dilution on disaster prevention is studied at early, middle and late stages of spontaneous coal combustion by analyzing the changes in methane concentration and temperature distributions. The main conclusions are as follows.
(1) Ventilation dilution can quickly dilute methane concentration and influence the porous chimney effect by enlarging air leakage in a coal mine goaf. The accumulated concentration of methane quickly declines by around 49% and 57% on the air-inlet side and air-return side, respectively, once ventilation velocity increases from 0.2 m/s to 1.2 m/s at the mining face. Only at the early stage (400 K) of spontaneous coal combustion can ventilation dilution have a limited impact on the combustion-induced negative pressure.
(2) With spontaneous combustion of coal on the air-inlet side, ventilation dilution exhibits a tendency to reduce the risk of methane explosions. After ventilation dilution, the accumulated concentration of methane drops from explosive values to the non-explosive concentrations of 3.8%, 5.9% and 6.4% at early, middle and late stages, respectively.
(3) If spontaneous combustion of coal occurs on the air-return side, ventilation dilution could increase the risk of methane explosions. In this study, the accumulated methane concentration, after ventilation dilution, decreases to around the explosive values of 8.8%, 9.8% and 9.7% at the early, middle and late stage of spontaneous coal combustion, respectively. The ventilation exerts little impact on the combustion-induced porous chimney effect in goafs of coal mines.

6. Further Research

Based on the numerical simulation as verified by experimental results, this study is conducted on an experimental platform in accordance with the actual situation of the engineering site. However, the experiment cannot replicate the actual engineering. The next step is to conduct numerical simulations and field tests at the engineering size, so that the numerical simulation results can provide better on-site guidance.

Author Contributions

Conceptualization, L.L., Z.L. and X.C.; methodology, L.L., Z.L. and L.W.; software, L.L. and Z.L.; validation, L.L., T.L. and S.F.; formal analysis, L.L., Z.L. and X.C.; investigation, L.L., T.L. and S.F.; resources, L.L., Z.L. and X.C.; data curation, L.L., T.L. and S.F.; writing—original draft preparation, L.L. and T.L.; writing—review and editing, L.L., Z.L. and X.C.; visualization, L.L., T.L. and S.F.; supervision, L.L. and X.C.; project administration, L.L., Z.L. and X.C.; funding acquisition, L.L., Z.L. and X.C. All authors have read and agreed to the published version of the manuscript.

Funding

This research was funded by the National Natural Science Foundation of China [No. 52074105; No. 51874122], the Program for Innovative Research Team of Henan Polytechnic University [No. T2019-4], the Fundamental Research Funds for the Universities of Henan Province [No. NSFRF180305], the Open Subject of State Key Laboratory of Coal Mine Disaster Dynamics Control [No. 2011DA105287-KF201313], the Program for Changjiang Scholars and Innovative Research Team [No. PCSIRT1235], the Key Scientific Research Projects of Colleges and Universities in Henan Province [No. 22B620002], the Doctoral Foundation of Henan Polytechnic University [B2021-7], the Key Science and Technology Project of Henan Province [No. 222102320017], the State Key Laboratory Cultivation Base for Gas Geology and Gas Control (Henan Polytechnic University) [No. WS2021A06], and the China Scholarship Council [No. 201706420010; No. 201808410203].

Data Availability Statement

The data that support the findings of this study are available from the corresponding author upon reasonable request.

Conflicts of Interest

The authors declare no conflict of interest.

Nomenclature

a 0 , a 1 Attenuation rate of the distance to the boundary/ mining face R Ideal gas constant J/(mol·K)
c 1 Adjustment coefficient t Time (s)
C i Concentration of species i (mol/m3) T Temperature (K)
C p f , C p s Fluid/solid heat capacity at constant pressure (J/(kg·K)) u Velocity vector (m/s)
d 0 , d 1 Distance to the boundary/mining face (m) β Forchheimer coefficient
D p Coal diameter (m) λ v f , λ v s Vertical bulking factor in fracture/ sinking zone
D d Mechanical dispersion (cm2/s) λ v b , λ h b Vertical/horizontal bulking factor in broken zone
F Volume force (N/m3) λ h b , m i n , λ h b , m a x Minimum/maximum of the horizontal bulking factor in broken zone
H f Height of fracture zone (m) λ Bulking factor
k Boltzman constant (J/K) μ Fluid viscosity (kg/(m·s))
k Permeability (m2) ξ f , ξ s Thermal conductivity of fluid/solid (W/(m·K))
M Relative molecular mass of gas (g/mol) ρ f , ρ s Fluid/solid density (kg/m3)
p Pressure (Pa) ρ Gas density (kg/m3)
q Fluid source/sink term (kg/(m3·s)) τ Tortuosity
Q Heat source or heat sink (W/m3) φ Porosity
r Radius of sphere (m)

References

  1. Boleslav, T.; Zdeněk, M. Effect of longwall face advance rate on spontaneous heating process in the goaf area-CFD modelling. Fuel 2011, 90, 2790–2797. [Google Scholar]
  2. Brune, J.F.; Saki, S.A. Prevention of gob ignitions and explosions in longwall mining using dynamic seals. Int. J. Min. Sci. Technol. 2017, 27, 999–1003. [Google Scholar] [CrossRef]
  3. Li, L.; Qin, B.T.; Ma, D.; Zhuo, H.; Liang, H.; Gao, A. Unique spatial methane distribution caused by spontaneous coal combustion in coal mine goafs: An experimental study. Process Saf. Environ. Prot. 2018, 116, 199–207. [Google Scholar] [CrossRef]
  4. Xia, T.Q.; Zhou, F.B.; Wang, X.X.; Kang, J.; Pan, Z. Safety evaluation of combustion-prone longwall mining gobs induced by gas extraction: A simulation study. Process Saf. Environ. Prot. 2017, 109, 677–687. [Google Scholar] [CrossRef]
  5. Li, L.; Qin, B.T.; Liu, J.S.; Leong, Y.K. Integrated experimentation and modeling of the formation processes underlying coal combustion-triggered methane explosions in a mined-out area. Energy 2020, 203, 11785. [Google Scholar] [CrossRef]
  6. Guo, P.Y.; Zheng, L.G.; Sun, X.M.; He, M.; Wang, Y.; Shang, J. Sustainability evaluation model of geothermal resources in abandoned coal mine. Appl. Therm. Eng. 2018, 144, 804–811. [Google Scholar] [CrossRef]
  7. Ahmet, A.; Basil, B. Reaction kinetics of coal oxidation at low temperatures. Fuel 2015, 159, 412–417. [Google Scholar]
  8. Deng, J.; Li, W.Q.; Xiao, Y.; Shu, C. Experimental study on the thermal properties of coal during pyrolysis, oxidation, and re-oxidation. Appl. Therm. Eng. 2017, 110, 1137–1152. [Google Scholar] [CrossRef]
  9. Yuan, L.M.; Smith, A.C. Numerical study on effects of coal properties on spontaneous heating in longwall gob areas. Fuel 2008, 87, 3409–3419. [Google Scholar] [CrossRef]
  10. Das, D.; Roy, M.; Basak, T. Studies on natural convection within enclosures of various (non-square) shapes—A review. Int. J. Heat Mass Tran. 2017, 106, 356–406. [Google Scholar] [CrossRef]
  11. Cammelli, S.; Mijorski, S. Stack effect in high-rise buildings: A review. Int. J. High-Rise Build. 2016, 5, 327–338. [Google Scholar]
  12. Li, L.; Qin, B.T.; Liu, J.; Leong, Y.; Li, W.; Zeng, J.; Ma, D.; Zhuo, H. Influence of airflow movement on methane migration in coal mine goafs with spontaneous coal combustion. Process Saf. Environ. Prot. 2021, 156, 405–416. [Google Scholar] [CrossRef]
  13. Ren, T.; Rao, B. Proactive goaf inertisation for controlling longwall goaf heatings. Procedia Earth Planet. Sci. 2009, 1, 309–315. [Google Scholar] [CrossRef] [Green Version]
  14. Zhang, J.; An, J.Y.; Wang, Y.G.; Nahid, A.; Pan, R. Philosophy of longwall goaf inertisation for coal self-heating control, proactive or reactive? Int. J. Heat Mass Tran. 2019, 141, 542–553. [Google Scholar] [CrossRef]
  15. Liang, Y.T.; Wang, S.G. Prediction of coal mine goaf self-heating with fluid dynamics in porous media. Fire Safety J. 2017, 87, 49–56. [Google Scholar] [CrossRef]
  16. Karolina, W.; Adam, S. Study of the hazard of endogenous fires in coal mines-a chemometric approach. Energies 2018, 11, 3047. [Google Scholar]
  17. Zipf, R.; Marchewka, W.; Mohamed, K.; Addis, J.; Karnack, F. Tube bundle system: For monitoring of coal mine atmosphere. Min. Eng. 2013, 65, 57–63. [Google Scholar]
  18. Greuer, R. Study of Mine Fire Fighting Using Inert Gases; Final Contract Report; Michigan Technological University: Houghton, MI, USA, 1974. [Google Scholar]
  19. Ma, L.; Xiao, Y.; Deng, J.; Wang, W.H. Effect of CO2 on explosion limits of flammable gases in goafs. Min. Sci. Technol. 2010, 20, 193–197. [Google Scholar] [CrossRef]
  20. Deng, J.; Yang, Y.; Zhang, Y.N.; Liu, B.; Shu, C. Inhibiting effects of three commercial inhibitors in spontaneous coal combustion. Energy 2018, 160, 1174–1185. [Google Scholar] [CrossRef]
  21. Lu, W.; Cao, Y.J.Z.; Tien, J.C. Method for prevention and control of spontaneous combustion of coal seam and its application in mining field. Int. J. Min. Sci. Technol. 2017, 27, 839–846. [Google Scholar] [CrossRef]
  22. Qin, B.; Li, L.; Ma, D.; Lu, Y.; Zhong, X.; Jia, Y. Control technology for the avoidance of the simultaneous occurance of a methane explosion and spontaneous coal combustion in a coal mine: A case study. Process Saf. Environ. Prot. 2016, 103, 203–211. [Google Scholar] [CrossRef]
  23. Zhu, H.Q.; Liu, P.F.; Liu, X.K. The study of spontaneous combustion region partition and nitrogen injection effect forecast based on CFD method. Proc. Eng. 2011, 26, 281–288. [Google Scholar]
  24. Hartman, H.L.; Mutmansky, J.M.; Ramani, R.V.; Wang, Y.J. Mine Ventilation and Air Conditioning, 3rd ed.; John Wiley & Sons, Inc.: Hoboken, NJ, USA, 1997. [Google Scholar]
  25. Tutak, M.; Brodny, J. Analysis of the impact of auxiliary ventilation equipment on the distribution and concentration of methane in the tailgate. Energies 2018, 11, 3076. [Google Scholar] [CrossRef] [Green Version]
  26. Xie, Y.; Hou, M.Z.; Li, C. Anisotropic characteristics of acoustic emission and the corresponding multifractal spectrum during progressive failure of shale under cyclic loading. In. J. Rock Mech. Min. 2023, 165, 105364. [Google Scholar] [CrossRef]
  27. Kissell, F.N. Handbook for Methane Control in Mining; U.S. Department of Health and Human Service; CDC/NIOSH Office of Mine Safety and Health Research: Pittsburgh, PA, USA, 2006.
  28. Svensson, S. Fire Ventilation; Swedish Rescue Services Agency: Karlstad, Sweden, 2000. [Google Scholar]
  29. Brune, J.S. Methane-air explosion hazard within coal mine gobs. In Transactions of the Society for Mining, Metallurgy, and Exploration; Society for Mining, Metallurgy, and Exploration (SME): Englewood, CO, USA, 2013; Volume 334, pp. 376–390. [Google Scholar]
  30. Kessler, D.A.; Gamezo, V.N.; Oran, E. Simulations of flame acceleration and deflagration-to-detonation transitions in methane-air systems. Combust. Flame 2010, 157, 2063–2077. [Google Scholar] [CrossRef]
  31. Ma, D.; Qin, B.T.; Li, L.; Gao, A.; Gao, Y. Study on the methane explosion regions induced by spontaneous combustion of coal in longwall gobs using a scaled-down experiment set-up. Fuel 2019, 254, 115547. [Google Scholar] [CrossRef]
  32. Xia, T.Q.; Zhou, F.B.; Wang, X.X.; Zhang, Y.; Li, Y.; Kang, J.; Liu, J. Controlling factors of symbiotic disaster between coal gas and spontaneous combustion in longwall mining gobs. Fuel 2016, 182, 886–896. [Google Scholar] [CrossRef]
  33. Yuan, L.M.; Smith, A.C. CFD modeling of spontaneous heating in large-scale coal chamber. J. Loss Prevent Proc. 2009, 22, 426–433. [Google Scholar] [CrossRef]
  34. Ergun, S. Fluid Flow through Packed Columns. Chem. Eng. Prog. 1952, 48, 89–94. [Google Scholar]
  35. Robinson, C.; Smith, D.B. The auto-ignition temperature of methane. J. Hazard. Mater. 1984, 8, 199–203. [Google Scholar] [CrossRef]
  36. Kundu, S.; Zanganeh, J.; Moghtaderi, B. A review on understanding explosions from methaneeair mixture. J. Loss Prevent. Proc. 2016, 40, 507–523. [Google Scholar] [CrossRef]
  37. Zhang, G.S. Ventilation Safety; China University of Mining and Technology Press: Xuzhou, China, 2007. (In Chinese) [Google Scholar]
  38. Yu, T. Control Methanism and Technology for Integrated Disaster of Gas and Coal Spontaneous Combustion in Gob. Ph.D. Thesis, University of Science and Technology of China, Hefei, China, 2014. (In Chinese). [Google Scholar]
  39. Ma, D.; Qin, B.T.; Gao, Y.; Jiang, J.A.; Feng, B.C. An experimental study on the methane migration induced by spontaneous combustion of coal in longwall gobs. Process Saf. Environ. Prot. 2021, 147, 292–299. [Google Scholar] [CrossRef]
  40. Liang, Y.T.; Zhang, J.; Ren, T.; Wang, Z.W.; Song, S.L. Application of ventilation simulation to spontaneous combustion control in underground coal mine: A case study from Bulianta colliery. Int. J. Min. Sci. Technol. 2018, 28, 231–242. [Google Scholar] [CrossRef]
  41. Liu, Q.; Lin, B.Q.; Zhou, Y.; Li, Y.J. Permeability and inertial resistance coefficient correction model of broken rocks in coal mine goaf. Powder Technol. 2021, 384, 247–257. [Google Scholar] [CrossRef]
Figure 1. Experimental platform of a coal mine goaf for numerical simulation.
Energies 16 03168 g001
Figure 2. Methane concentration distribution with spontaneous coal combustion in a coal mine goaf.
Energies 16 03168 g002
Figure 3. Representative curves for methane concentration distribution in the coal combustion area.
Energies 16 03168 g003
Figure 4. Change of methane concentration distribution with coal combustion on air-inlet side in the goaf of a coal mine (T = 400 K).
Energies 16 03168 g004
Figure 5. Evolution of the accumulated methane concentration on air-inlet side in the goaf of a coal mine (T = 400 K).
Energies 16 03168 g005
Figure 6. Changes of temperature distribution at coal combustion location on air-inlet side.
Energies 16 03168 g006
Figure 7. Temperature distribution curves around the area of coal combustion on air-inlet side.
Energies 16 03168 g007
Figure 8. Changes in pressure difference in coal combustion area on air-inlet side (T = 400 K).
Energies 16 03168 g008
Figure 9. Effect of ventilation dilution on methane accumulation formed on air-inlet side.
Energies 16 03168 g009
Figure 10. Changes in pressure difference in the area of coal combustion on air-inlet side.
Energies 16 03168 g010
Figure 11. Change of methane concentration distribution with coal combustion on air-return side in the goaf of a coal mine (T = 400 K).
Energies 16 03168 g011
Figure 12. Evolution of the accumulated methane concentration on air-return side in the goaf of a coal mine (T = 400 K).
Energies 16 03168 g012
Figure 13. Changes in pressure difference in coal combustion area on air-return side (T = 400 K).
Energies 16 03168 g013
Figure 14. Effect of ventilation dilution on methane accumulation formed on air-return side.
Energies 16 03168 g014
Figure 15. Changes in pressure difference in the area of coal combustion on air-return side.
Energies 16 03168 g015
Table 1. Gas flow model for spontaneous coal combustion environment in coal mine goafs [5].
Governing Equations
φ ( ρ f t + · ρ f u = q (1)
ρ f φ u t + u · u φ = p + · 1 φ μ u + u T k 1 μ + β u + q φ 2 u + F (2)
φ ρ f C p f + 1 φ ρ s C p s T t + · φ ξ f + 1 φ ξ s T = Q ρ f C p f u · T (3)
Coupling Equations
ρ f = p M R T (4)
t C i + 𝛻 · ( φ τ k T 6 π μ r + D d ) 𝛻 C i + 𝛻 · u C i = 0 (5)
φ = 1 1 λ
λ v b = λ h b = λ h b , m i n + λ h b , m a x λ h b , m i n e ( a 1 d 1 ( 1 e c 1 a 0 d 0 ) )
λ v f = 1 λ v b 1 H f + λ v b 1 ln H f + 1
λ v s = 1
(6a)
(6b)
(6c)
(6d)
Table 2. Gas flow field changes caused by spontaneous coal combustion.
Equation CombinationsNew Phenomena
Combination 1: Equation (1) + Equation (4)Changes in gas flow rate
Combination 2: Equation (1) + Equation (4) + Equations (6a)–(6d)Changes in gas flow direction
Combination 3: Equation (3) + Equation (4)Changes in temperature distribution
Combination 4: Equation (5) + Equation (4)Changes in gas concentration distribution
Table 3. Initial conditions and boundary conditions in numerical simulations.
Geometric SizesDescription
Coal mine goaf2 m × 1.2 m × 0.8 m (length × width × height)
Roadways0.2 m × 0.04 m × 0.03 m (length × width × height)
Mining face1.2 m × 0.5 m × 0.3 m (length × width × height)
Distance to mining faceDistance to side boundary
Location 1 of high temperature0.45 m0.15 m
Location 2 of high temperature0.45 m0.15 m
Initial conditionsDescription
Pressure in coal mine goaf0 Pa
Coal mine goaf porositySee Equations (6a)–(6d)
Volume forceSee Equation (4)
Temperature293 K
Gas concentration in atmosphereO2: 9.5 mol/m3, N2: 34.5 mol/m3
Boundary conditionsDescription
Air-inlet boundaryInlet; O2: 9.5 mol/m3, N2: 34.5 mol/m3
Air-return boundaryOutflow
Other face boundaryWall
Heating temperature404 K
Gas release volume150 mL/min
Airflow velocity in mining face0.2 m/s
Table 4. Setup for study of ventilation dilution effect.
Methane ConcentrationTemperatureVentilation Velocity
40%400 K (Early stage)0.2 m/s
(Normal ventilation)
1.2 m/s
(Enhanced Ventilation)
700 K (Middle stage)
900 K (Late stage)
Table 5. Ventilation dilution-induced changes in airflow field in high temperature area on air-inlet side.
TemperatureMaximum ConcentrationPressure DifferenceVentilation Velocity
400 K7.5%−0.065 Pa0.2 m/s
3.8%0.015 Pa1.2 m/s
700 K11.8%−0.21 Pa0.2 m/s
5.9%−0.2 Pa1.2 m/s
900 K12.7%−0.15 Pa0.2 m/s
6.4%−0.12 Pa1.2 m/s
Table 6. Ventilation dilution-induced changes in airflow field at high temperature area on air-return side.
TemperatureMaximum ConcentrationPressure DifferenceVentilation Velocity
400 K15.5%−0.04 Pa0.2 m/s
8.8%−0.05 Pa1.2 m/s
700 K23%−0.13 Pa0.2 m/s
9.8%−0.16 Pa1.2 m/s
900 K23%−0.18 Pa0.2 m/s
9.7%−0.21 Pa1.2 m/s
Disclaimer/Publisher’s Note: The statements, opinions and data contained in all publications are solely those of the individual author(s) and contributor(s) and not of MDPI and/or the editor(s). MDPI and/or the editor(s) disclaim responsibility for any injury to people or property resulting from any ideas, methods, instructions or products referred to in the content.

