Article

Preliminary Study for the Commercialization of a Electrochemical Hydrogen Compressor

1
Department of Mechanical Engineering, Chungbuk National University, Cheongju 28644, Republic of Korea
2
Physics and Engineering Department, North Park University, Chicago, IL 60625, USA
*
Author to whom correspondence should be addressed.
Energies 2023, 16(7), 3128; https://doi.org/10.3390/en16073128
Submission received: 16 March 2023 / Revised: 27 March 2023 / Accepted: 28 March 2023 / Published: 29 March 2023
(This article belongs to the Section B3: Carbon Emission and Utilization)

Abstract

:
A global energy shift to a carbon-neutral society requires clean energy. Hydrogen can accelerate the process of expanding clean and renewable energy sources. However, conventional hydrogen compression and storage technology still suffers from inefficiencies, high costs, and safety concerns. An electrochemical hydrogen compressor (EHC) is a device similar in structure to a water electrolyzer. Its most significant advantage is that it can accomplish hydrogen separation and compression at the same time. With no mechanical motion and low energy consumption, the EHC is the key to future hydrogen compression and purification technology breakthroughs. In this study, the compression performance, efficiency, and other related parameters of EHC are investigated through experiments and simulation calculations. The experimental results show that under the same experimental conditions, increasing the supply voltage and the pressure in the anode chamber can improve the reaction rate of EHC and balance the pressure difference between the cathode and anode. The presence of residual air in the anode can impede the interaction between hydrogen and the catalyst, as well as the proton exchange membrane (PEM), resulting in a decrease in performance. In addition, it was found that a single EHC has a better compression ratio and reaction rate than a double EHC. The experimental results were compatible with the theoretical calculations within less than a 7% deviation. Finally, the conditions required to reach commercialization were evaluated using the theoretical model.

1. Introduction

Hydrogen energy has received significant global attention because of the increasing environmental problems and unstable crude oil supply [1,2,3]. Since hydrogen energy has well-known advantages, it has become necessary to increase its use and preparation technology by developing a new hydrogen compression and storage technology with high efficiency and low energy consumption [4,5]. Currently, mechanical hydrogen compression is the primary method available in the industry, but it has many disadvantages. For example, hydrogen is contaminated during compression due to insufficient purity. Friction and the wear of mechanically moving parts reduce the energy efficiency of the compressor [6,7]. Mechanical compressors have been reported to have an average efficiency of about 45% [8].
The electrochemical hydrogen compressor (EHC) offers a new method of compression. Its structure is identical to that of a proton exchange membrane (PEM) fuel cell, but the EHC can be used to compress hydrogen gas. The maximum compressible pressure can reach 1000 atm [9]. Compared with the traditional mechanical compression method, although EHC technology offers numerous benefits, including its straightforward design, excellent compression efficiency, minimal energy usage, absence of mechanical wear and noise, high purity of compressed hydrogen, lack of lubricant contamination [4,10], and compatibility with renewable energy sources, it still has some limitations due to being in its early developmental stages. Certain challenges and knowledge gaps need to be addressed, such as scalability, durability, corrosion, cost-effectiveness, integration with renewable energy sources, and safety concerns. Further research is necessary to overcome these challenges and optimize the efficiency, safety, and reliability of EHC systems. Previous reports have indicated that EHCs can have many applications, including recirculating hydrogen from fuel cell exhaust [11] and separating hydrogen from a mixture of hydrogen, nitrogen (N2), and carbon dioxide (CO2) [12]. It has been mentioned that the purity and energy efficiency of hydrogen can be increased by increasing the operating temperature [13]. Although increasing the inlet pressure increases the performance of EHCs, it decreases the purity because high pressures increase the crossover of impurities. A two-stage separation process can separate hydrogen from a source gas containing 30% hydrogen, with a purity of 99.72% [14]. Nguyen et al. [15] described the performance of an EHC under different operating conditions, highlighting its limitations at low inlet hydrogen concentrations. Gardner et al. [16] separated hydrogen from a mixture of gases. The results revealed that hydrogen could be more effectively separated from a mixture of gases comprising only CO2, but the EHC performance decreased significantly when the mixture contained carbon monoxide (CO). Applying a periodic pulsed voltage to the anode of EHCs could oxidize a portion of carbon monoxide adsorbed on the catalyst surface, reducing the toxic effect on the catalyst and voltage loss while improving the separation efficiency. Dale et al. [6] compared an EHC with a conventional compressor at different compression ratios to evaluate its suitability for hydrogen storage. Doucet et al. [17] separated a mixture of ethylene (C2H4) and hydrogen and developed a zero-dimensional model for the EHC separation and C2H4 reduction processes in the anode chamber. The results revealed that C2H4 and hydrogen would chemically react in the anode chamber to produce ethane (C2H6) during the separation process, but a large portion of hydrogen would still be separated. Kazuo et al. [18] used EHCs to recover hydrogen from the exhaust gas of a fuel cell anode, and they investigated the recovery of hydrogen from a mixture of hydrogen and nitrogen or hydrogen and CO2 with a hydrogen content of 1–99.99% at different voltages and currents. The experimental results demonstrated that EHCs could recover hydrogen from low hydrogen concentration mixtures. Sedlak et al. [19] studied the feasibility of electrolytic hydrogen separation using PEM cells and successfully separated hydrogen from hydrogen–nitrogen (H2-N2) mixtures. Their results revealed that hydrogen separation could be performed at very low voltages with high separation efficiency. They also mentioned that the same device could be used for hydrogen compression. The electrochemical hydrogen compression process offers advantages over conventional membrane separation processes because it requires only one external voltage and no pressure or concentration gradient. This is because the potential difference in electrochemical separation only affects the discharge part, not the non-discharge parts.
Recent research has focused on improving the performance and efficiency of EHC systems. For example, Zou et al. [9] reviewed various approaches to enhance the compression efficiency of EHC, including optimizing the design and operation parameters, utilizing advanced materials, and coupling with other technologies such as solar, wind, or biomass energy. Durmus et al. [20] provided a comprehensive review of various hydrogen compression technologies, including EHC, and compared their performance and potential for commercialization. Despite these advancements, some limitations and gaps still exist in the field of EHC. A major challenge is the literature gap in detailed mathematical models that describe EHC operation due to the complexity of the electrochemical process [21]. Another challenge is to address the cost-effectiveness and scalability of EHC, as the technology is still in the early stages of development and requires further research and development [9]. In conclusion, EHC is a promising technology for hydrogen compression and storage, but further research and development are needed to overcome the current limitations and gaps in knowledge.
The study investigated the feasibility and performance of using an electrochemical hydrogen compressor (EHC) for hydrogen compression, which is a potential solution to address the challenges of storing and transporting hydrogen as a clean energy carrier. The study conducted experiments under low-pressure conditions and used both C language and MATLAB/Simulink modeling to simulate the performance of the EHC. The accuracy of the model was verified, and the impact of different parameters on the performance of the EHC was examined. The study also monitored the temperature changes inside the EHC during the experiment and simulated it using the EHC model. The findings of the study could provide guidance for the future commercial application of EHCs in hydrogen compression. Overall, the study highlights the importance of developing innovative technologies to facilitate the transition to clean energy sources and address the challenges of climate change.

2. Experimental Details

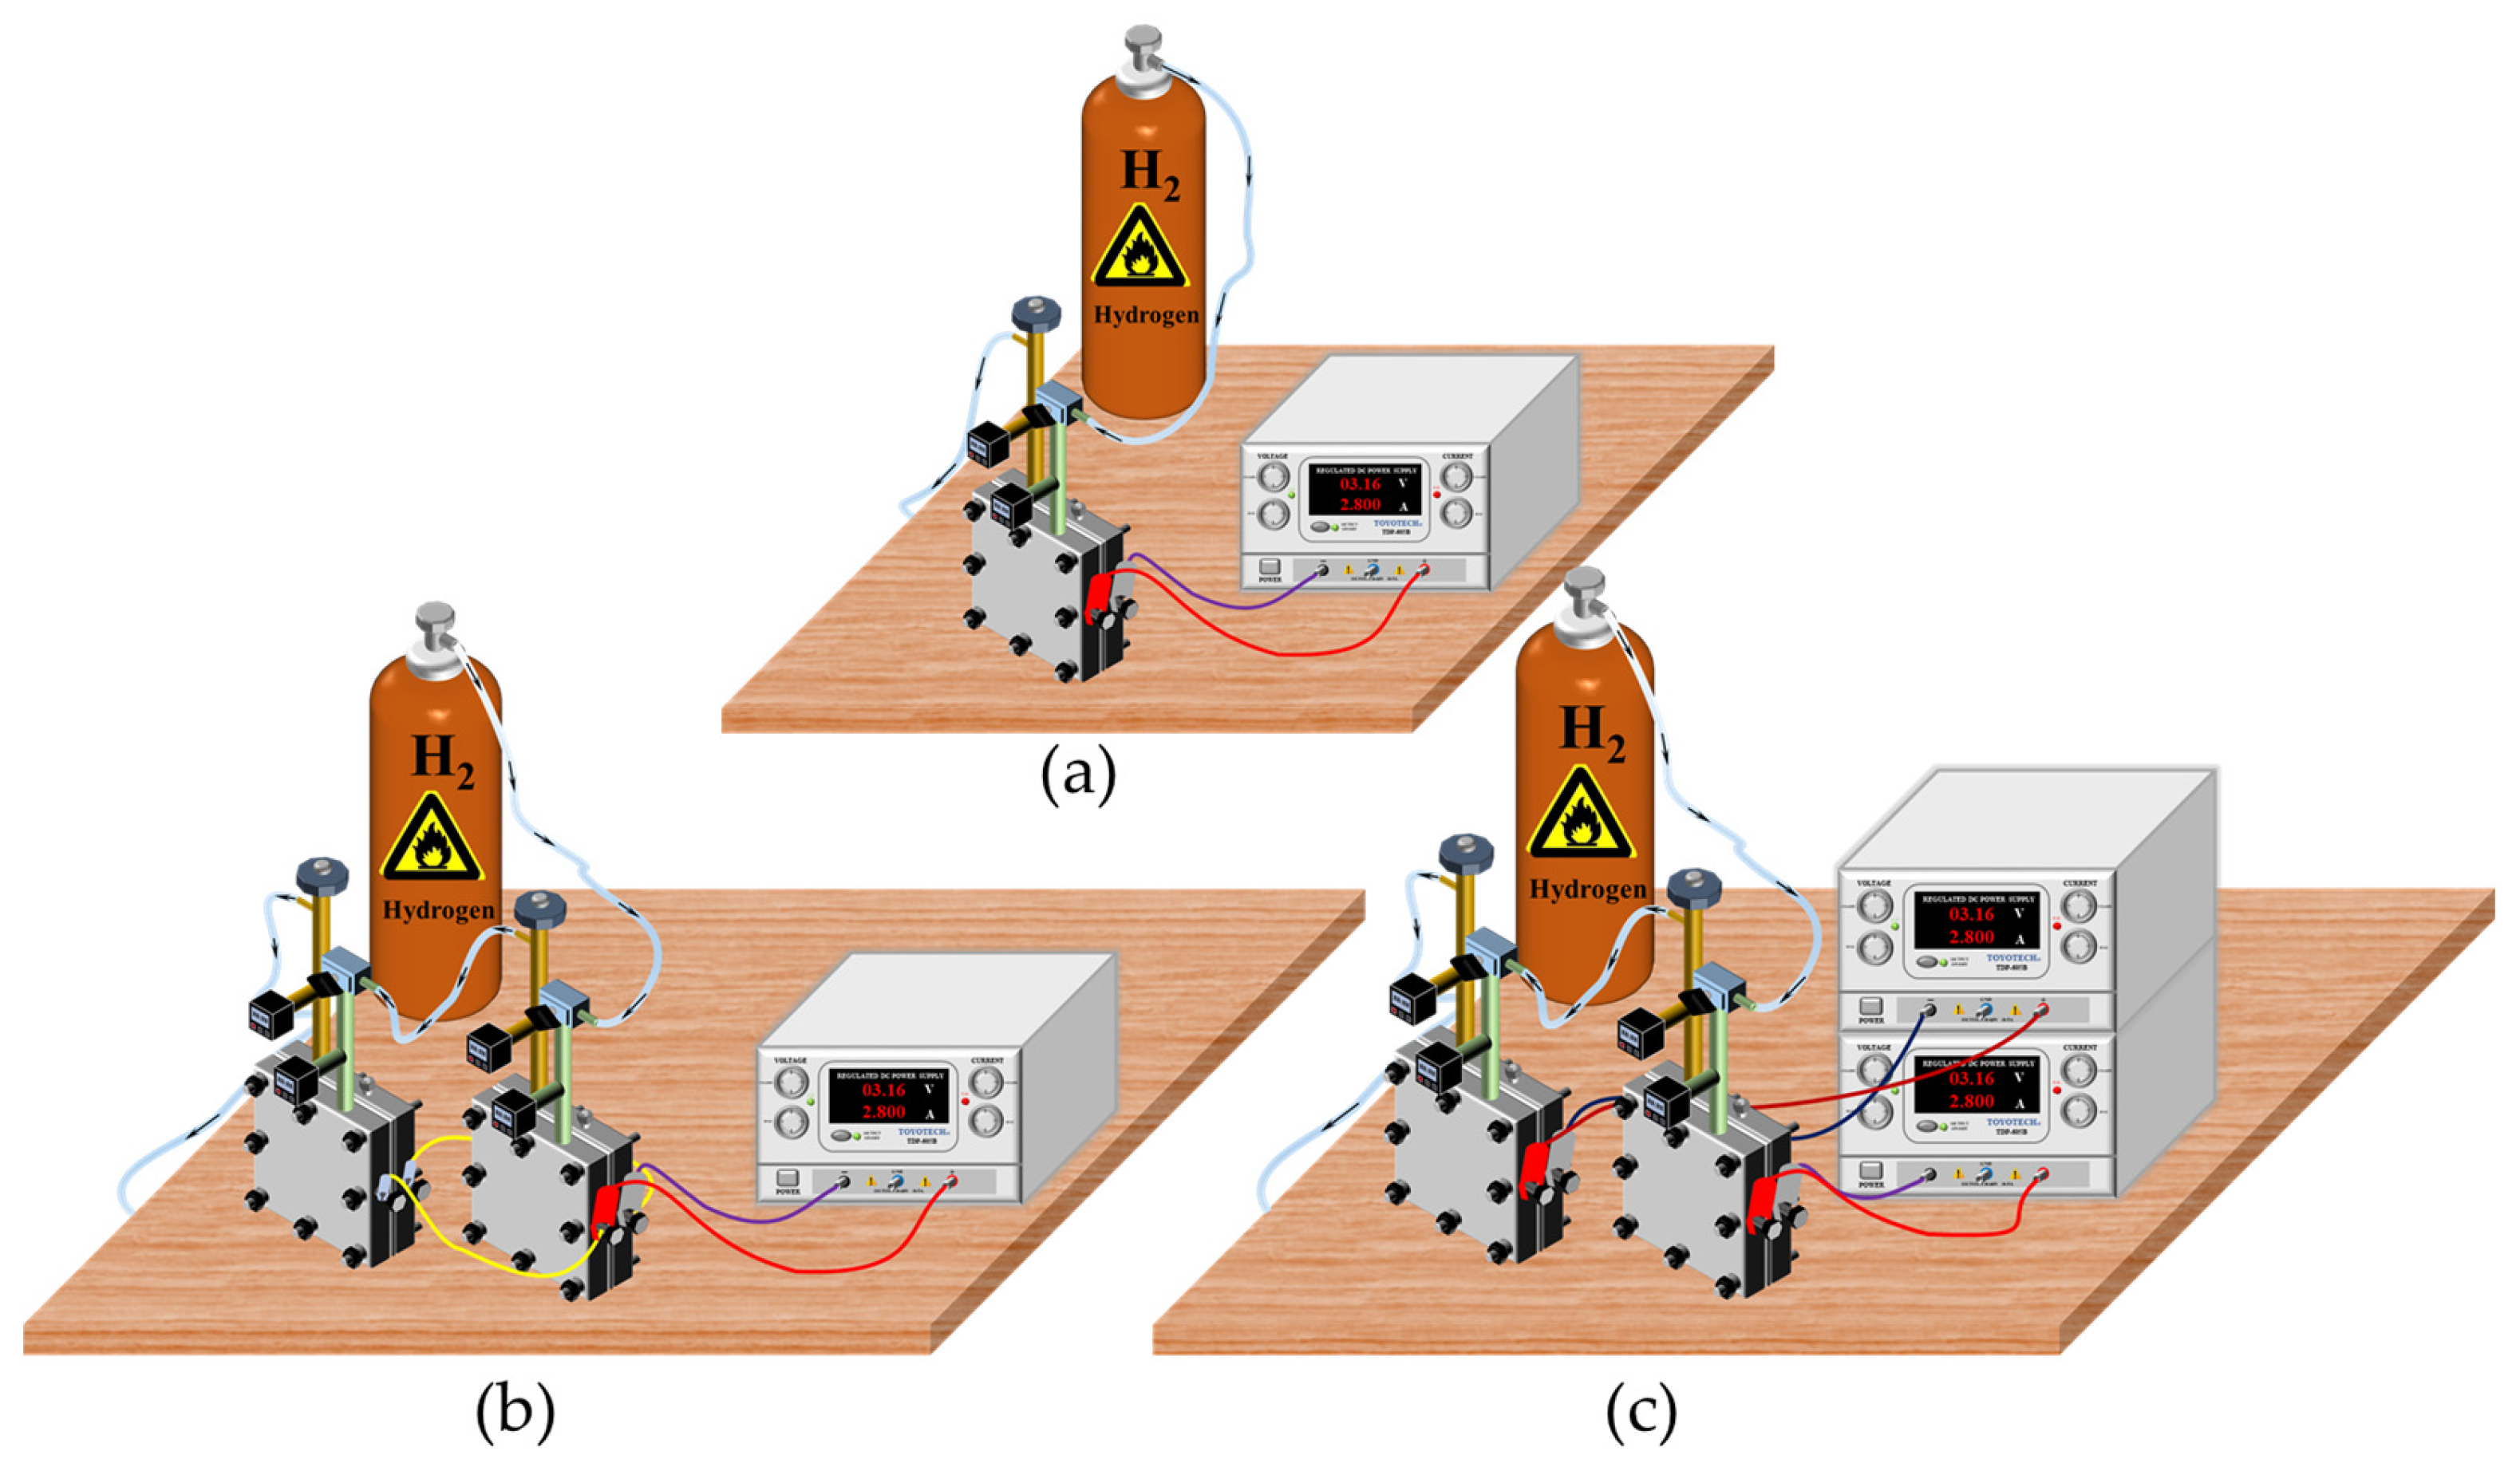
2.1. Experimental Setup

Figure 1 depicts the experimental setup for this study. The EHC was a custom-made electrochemical cell with an internal reactive area of 25 cm2 (5 × 5 cm). Pure hydrogen was supplied from a hydrogen tank (DAE DEOK GAS CO., LTD. 99.999%) to the anode compartment of the electrochemical cell. Pressure sensors (Autonics, PSA-1) and temperature sensors were mounted to the anode and cathode compartments to monitor the pressure (standard atmospheric pressure was used as the zero-point pressure in this experiment) and temperature, respectively. Both sensors were linked to a computer and an intelligent embedded controller (NATIONAL INSTRUMENTS, NI Crio-9022). The power supply system (Toyo tech corporation, TDP-605B) supplied DC power to the EHC fixed on the test bench (DAEIL SYSTEMS, DVIO-B-0505M-200t). The power supply’s voltage can be adjusted using the voltage knob, and the current can be monitored from the power supply’s display. Figure 1a–c show three different configurations, namely the single compressor-single power supply system (SC-SP), dual compressors-single power supply system (DC-SP), and dual compressors-dual powers supply systems (DC-DP) configurations. The multi-stage compression process is more effective in compressing hydrogen. These three experimental configurations were constructed to compare the experimental results of a single compressor with those of multiple compressors or power sources. The evacuation and filling method was utilized in this experiment to eliminate air from the anode chamber. The procedure involved connecting a line from a hydrogen gas source to the air inlet of the anode chamber. Next, the sealing screw adjacent to the air inlet was opened, and a line connected to the exterior was attached to the original sealing screw location (as shown on the left side of Figure 2). Hydrogen gas was gradually introduced into the chamber, which is less dense than air; it displaced the air and pushed it out gradually through the serpentine flow field inside the EHC. To ensure effective air removal, hydrogen gas was typically introduced and left flowing for approximately 15 min before the actual experiment began. The same method was employed to eliminate air for the dual compressor.

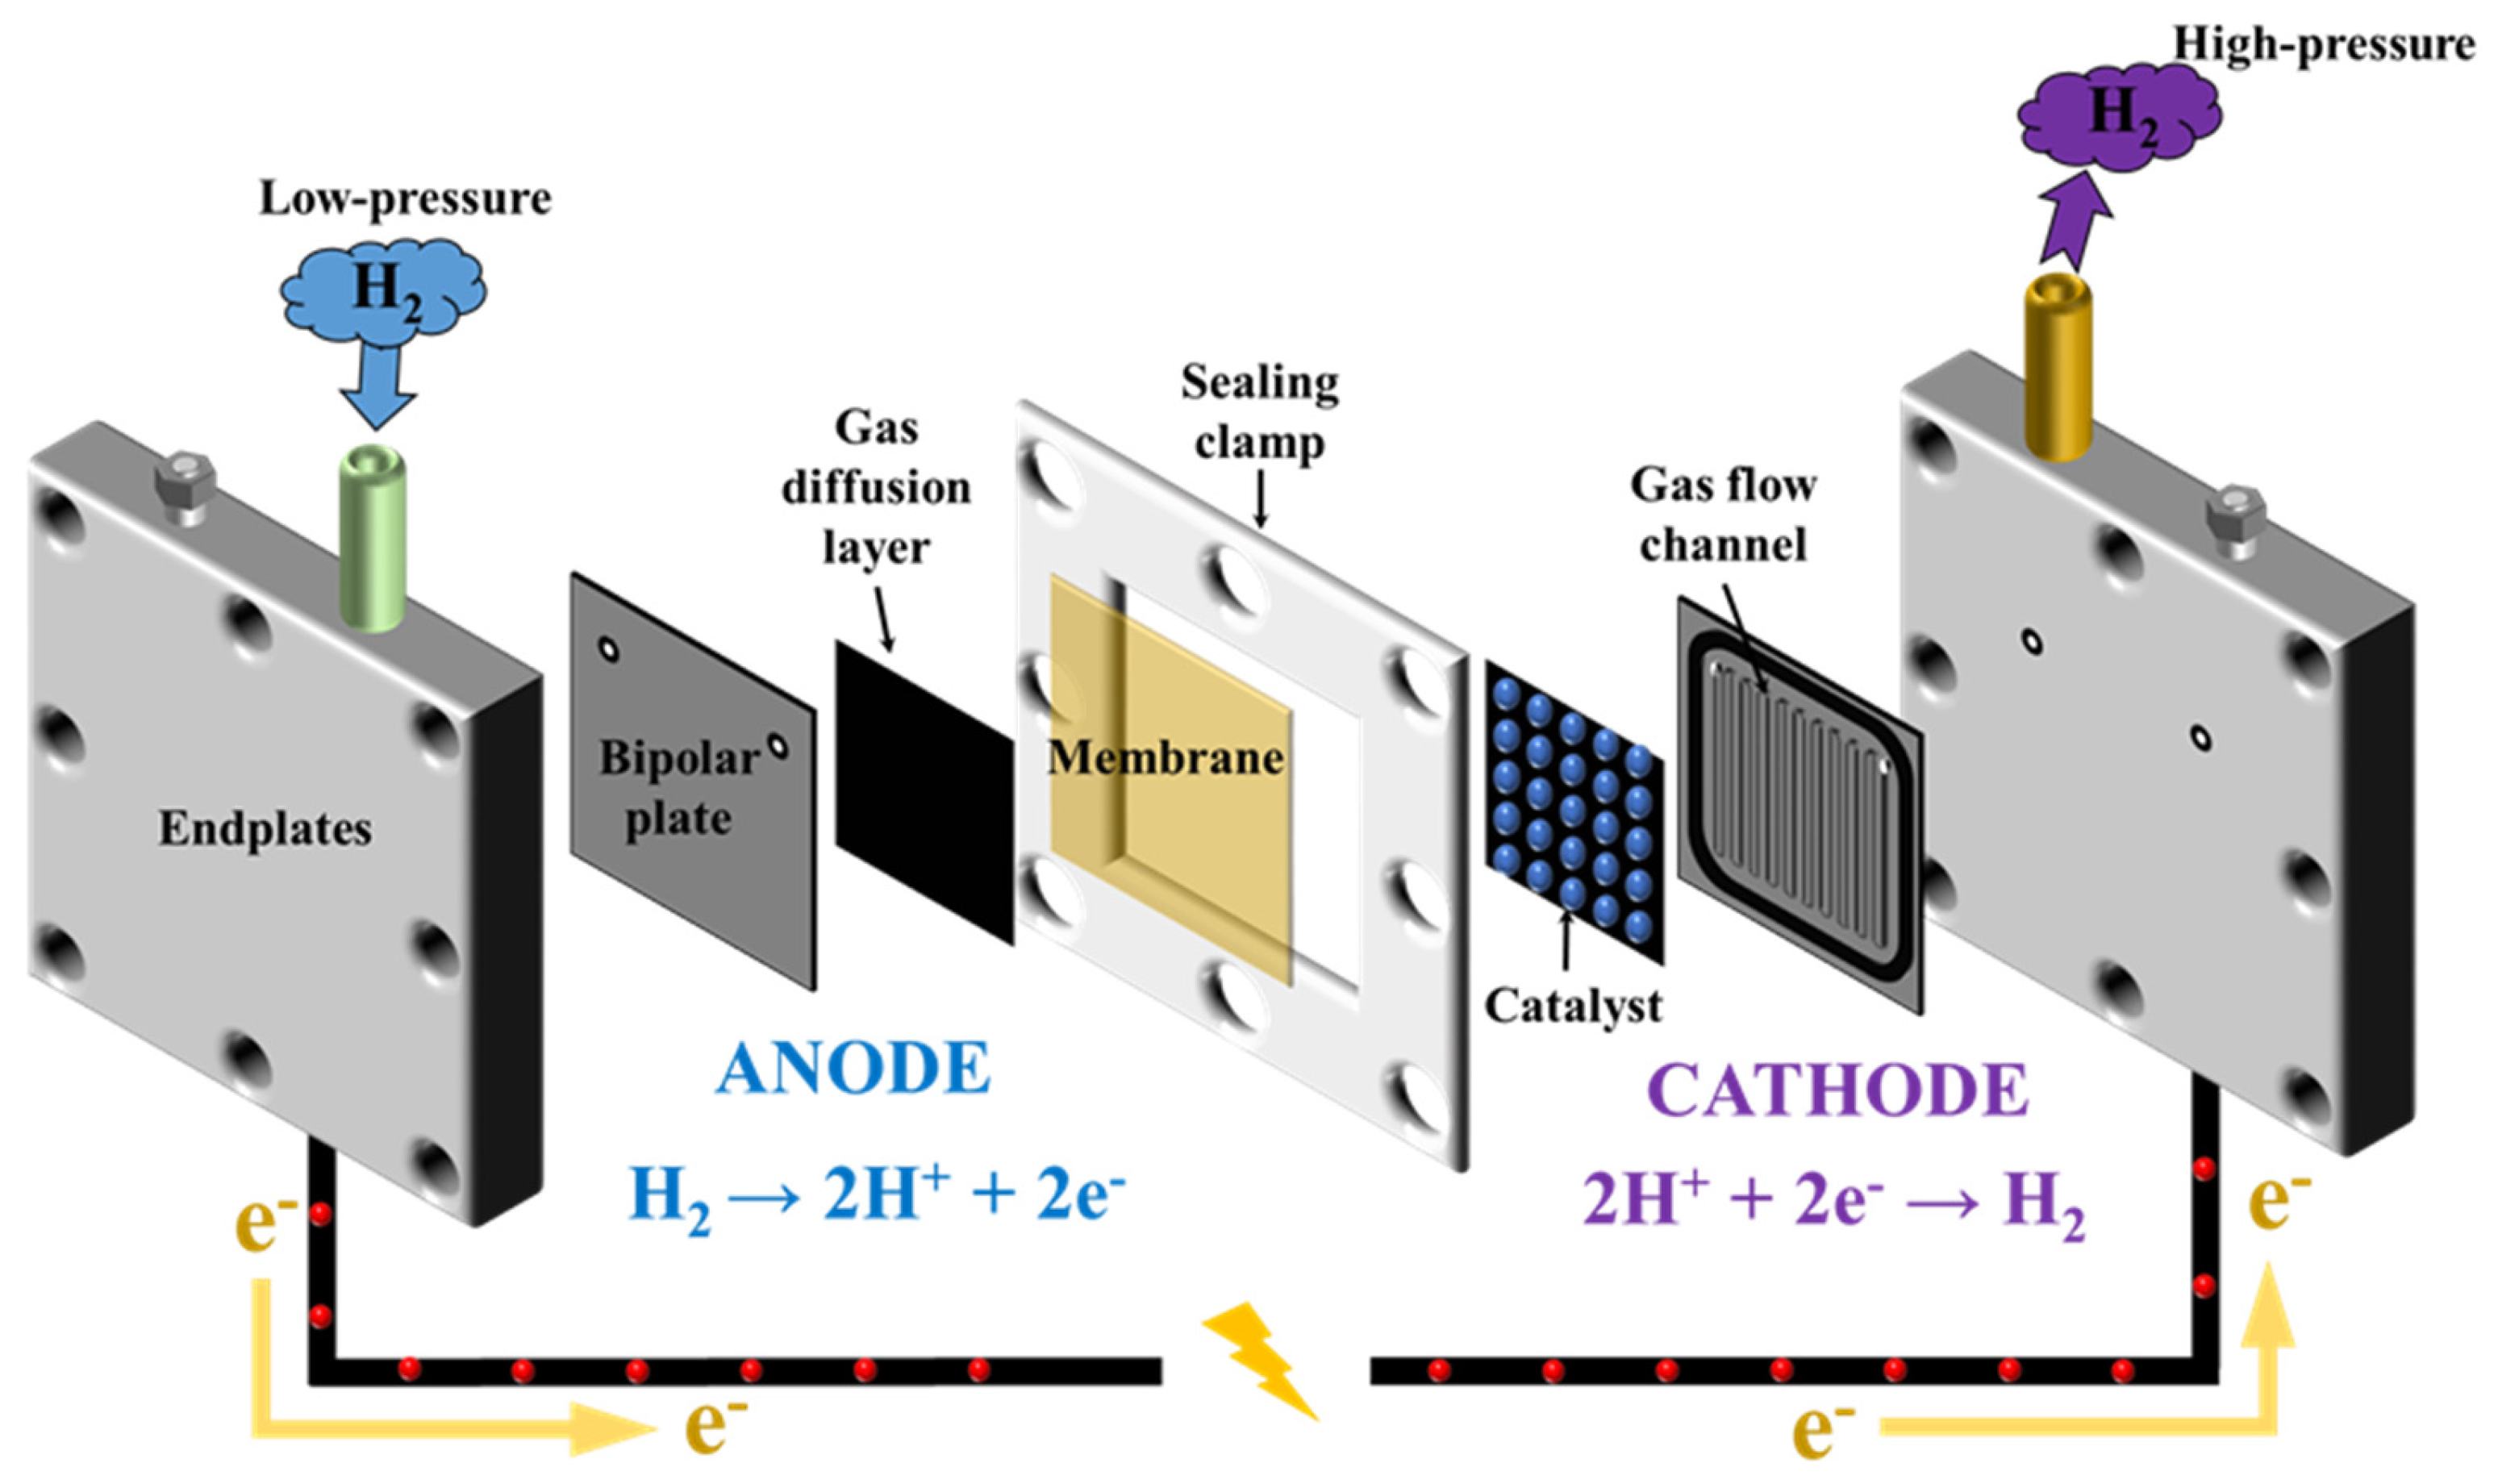
2.2. Electrochemical Cell

Figure 2 depicts the decomposition diagram of the electrochemical cell. The cell consists of two end plates (stainless steel 316L) used to assemble the cell, two stainless steel plates with airflow channels, a porous activated titanium foam electrode, a porous activated graphite electrode, a proton conduction membrane, and appropriate silicon spacers. The proton exchange membrane (commercial Nafion 115) was treated before use. The anode catalyst was sprayed on a porous titanium substrate (Ir 2.0 mg/cm2) using Ir Black, 10% Nafion–Ir Black, and a 5% Nafion solution. The electrode had a total thickness of 0.36 mm. The cathode was sprayed on carbon paper (20% Pt/C) using platinum (0.4 mg/cm2) as a catalyst, 33% Nafion–Pt/C, and a 5% Nafion solution. This electrode had a total thickness of 0.20 mm. Finally, the Membrane Electrode Assembly (MEA) was formed by hot pressing at 130 °C and 100 atm for 2 min.
Hydrogen gas enters the anode chamber of the EHC and passes through the gas diffusion electrode to the catalyst layer, where the hydrogen molecules are ionized on the catalyst, which is known as hydrogen oxidation (i.e., separating the hydrogen molecules into protons and electrons). The protons pass through the membrane to the cathode, and the electrons flow to the negative electrode plate through an external circuit. The protons from the anode to the cathode combine with the electrons conducted through the external circuit and recombine to form hydrogen molecules. The overall reaction of the electrochemical hydrogen compression is as follows [20]:
H 2 A n o d e ,   l o w   p r e s s u r e H 2 C a t h o d e ,   h i g h   p r e s s u r e .

3. Theoretical Calculation

Polarization is the deviation of an electrode potential from its equilibrium state as the current flows through the electrode. Polarization is usually divided into three categories: concentration polarization, activation (or electrochemical) polarization, and ohmic resistance polarization.
The supply voltage of an EHC can be expressed using the following Equation (2):
V t = V o c + V c o n + V a c t + V o h m
where  V o c  is the open circuit voltage,  V c o n  is the concentration diffusion overpotential due to the concentration difference,  V a c t  is the polarization loss due to the electrochemical activity, and  V o h m  is the ohm voltage loss due to resistance [19].
Therefore, it is clear that polarization increases the operating voltage of an electrolyzer; a decrease in polarization (loss) decreases the amount of energy consumed and improves the electrochemical performance.
Concentration polarization occurs when the diffusion rate of the reactants is less than the electrochemical reaction rate. When electrochemical reactions occur in EHCs, the reactants and products are continuously consumed and generated at the anode and cathode. When the reaction gas supply is suppressed (i.e., when the gas channel is blocked or diluted), the concentration of the reactants varies near the electrode surface, disrupting uniform concentration distribution before the electrode reaction occurs. In other words, the concentration polarization phenomenon occurs. Concentration polarization usually occurs in the high current density range. The high current is beneficial for the electrochemical reaction rate, causing reactant shortage. The molecular diffusion process of concentration polarization can be calculated using the Nernst equation [22]:
V c o n = E 1 E 0 = E 0 + R T z F l n P H 2 o u t E 0 + R T z F l n P H 2 i n = R T z F l n P H 2 o u t P H 2 i n
where E is the reversible cell potential, R is the universal gas constant, T is the temperature, F is the Faraday constant, and P is the pressure.
Activation polarization occurs when the electrochemical reaction rate at the electrode does not follow the speed of electron flow. The electrochemical reaction becomes slower than the electron flow in the presence of an external electric field, which alters the existing electric layer and changes the potential of the electrode. The internal cause of charge accumulation at the interface (i.e., polarization) is the difference between the electron motion speed and the chemical reaction kinetics at electrodes. There is no polarization only in the following two cases:
1.
When the current density is infinitely large, the electrons flowing into the electrode from the external circuit are immediately consumed, or the electrons lost to the external circuit are replenished at once. The charge on the electrode surface remains nearly constant;
2.
The external current density is very small, almost equal to zero. Since there is sufficient time for the reactants to combine with or release electrons, there is no excess charge on the electrode, and the electrode remains at an equilibrium potential.
When a precious metal such as platinum or palladium is used as the catalyst, the electrode exchange current density is about 1 A/cm2, and the electrochemical reaction rate is extremely high. EHCs are almost unaffected by activation polarization during the reaction [23]. The Butler–Volmer equation indicates that the reaction of an EHC is almost unaffected by activation polarization (Equation (4)) [3,17,24]:
i = i 0 e x p α a n F V a c t R T e x p α c a t F V a c t R T
where  i 0  is the exchange current density,  α a n  is the transfer coefficient of positive charge, and  α c a t  is the transfer coefficient of negative charge. When  i 0  is 0, i is also 0 (Equation (5)) [25]:
V c a t = R T α F a r c s i n h i 2 i 0
The ohmic polarization of an EHC refers to the resistances of the electrolyte membrane, electrode, collector, and plate. The contact resistance between those components also causes ohmic polarization, but the electrolyte membrane has the most significant influence. Zawodzinski et al. [26] stated that the conductivity of PEM is linearly related to the water content in the membrane. The higher water content increases the proton conductivity. The water content in the PEM is associated with the temperature, pressure, and flow rate of the reaction gas in the electrolyzer. In particular, the water content in the membrane is affected by the relative humidity of the gas [27]. The membrane used in this experiment was kept in DI water, and the experiment time was short enough to ignore the change in the water content in the membrane.
The resistance of a PEM to electrons is almost infinite because only hydrogen ions can pass through it, and electrons cannot transfer through it. The experimental setup allows the measurement of the external circuit resistance to obtain the total resistance loss when connected to a fixed voltage without a hydrogen supply and when the current is stable. Thus, the ohmic polarization due to resistance in the experimental setup is expressed as:
V o h m = I c e l l × r .
Initially, the voltage, current, supply pressure, two outlet pressures, and temperature are constants. The equilibrium potential is demonstrated by the Nernst equation [23]:
v = U c e l l + R T 0 2 F l n P H 2 o u t P H 2 i n + I c e l l × r .
The molarity of electrons in the cathode supplied by the power source per unit time can be obtained using the following equation:
n e c a t = I F .
Since hydrogen provides two electrons, its molar flow rate per unit time is equal to half the molar mass of electrons, and its final mass flow rate is as follows:
m H 2 c a t ˙ = I c e l l 2 F × M H 2 .
Therefore, the mass of hydrogen at the outlet side is as follows:
m H 2 i = m H 2 c a t ˙ × Δ t + m 0 .
Assuming that hydrogen is an ideal gas in the compression process, the pressure on the outlet side varies as follows:
P V = n R T ,
P o u t i = R T o u t i m H 2 i V × M H 2 .
The voltage efficiency is obtained by dividing the open voltage by the actual voltage
η v = V o c V t .
Hydrogen gas moves from the anode to the cathode and is compressed in the cathode chamber with a fixed volume. The theoretical amount of hydrogen is expressed in Equation (14), where  F  and  i  are Faraday constant and current density, respectively. In practice, the amount of compressed hydrogen is smaller than the theoretical value owing to polarization. The Faraday efficiency defined in Equation (15) is used to assess the extent of this phenomenon [28]:
J H 2 , T h e o r e t i c a l = i 2 F ,
η i = J H 2 , M e a s u r e d J H 2 , T h e o r e t i c a l .
Total efficiency is defined as the product of voltage and Faraday efficiency:
η T = η v × η i .
The electrical power loss in this experiment was converted to internal energy according to the energy conservation law:
Q i n = U l o s s × I l o s s × Δ t ,
U l o s s = v U c e l l ,
I l o s s = 2 F × ( J H 2 , T h e o r e t i c a l J H 2 ,   M e a s u r e d .
Heat transfer at the outlet is mainly natural convective heat transfer to the atmosphere:
Q o u t ˙ = h × A × Δ T
where h is the convective heat transfer coefficient, A is the heat transfer area, and  Δ T  is the temperature difference.
The following unknown convective heat transfer coefficient, Nusselt number, Prantl number, and Grashof number can be obtained as follows [29]:
h = N u × k d ,
N u = 0.53 G r P r 1 4 ,
P r = μ × c p k ,
β = 1 T ,
G r = g × β × Δ T × L 3 μ ρ 2 .
Density  ρ  can be obtained using the ideal gas equation and outlet volume:
P V = n R T = m M R T ,
ρ = m V = P M R T .
The physical properties of the air used (i.e., the thermal conductivity and dynamic viscosity) changed with the temperature, and this phenomenon is defined using Equations (28) and (29) derived from the data trend line [29]:
K = 0.01 ( 8 × 10 10 T a i r 5 + 2 × 10 7 T a i r 4 3 × 10 5 T a i r 3 + 1.2 × 10 3 T a i r 2 0.0192 T a i r + 2.645 ) ,
μ = 1.77 × 10 6 T a i r 3 + 2.5 × 10 4 T a i r 2 + 0.0393434343 T a i r + 17.233333 × 10 6
The formula for calculating the calorific value is as follows:
Δ T = Q C × m .
where  Q  is heat, m is the mass of a substance,  C  is specific heat, and  Δ T  is the temperature change. The temperature at the outlet side can be calculated using Equation (31), which is based on Equations (17), (20) and (30):
T o u t i = T 0 + Q i n Q o u t m H 2 i × C v , H 2 + C v , c u × m c u ,
where  C v , H 2  is the constant volume specific heat of hydrogen and  C v , c u  is the constant volume specific heat of copper.
The C programming language in Visual Studio 2017 was utilized to create the hydrogen compressor analysis model. The model was constructed based on the set of equations mentioned earlier, which were utilized to simulate the behavior of the compressor. The results obtained from the analytical model were then compared with the results obtained from experimental tests conducted on the actual compressor. This was done to evaluate the accuracy and effectiveness of the analytical model in predicting the compressor’s performance under varying operating conditions. To aid in the development of the analytical model, a flow chart was created to outline the different steps involved in the simulation process. Figure 3 illustrates this flow chart, visually representing the steps involved in the analysis. By following this flow chart, the simulation model was implemented, and results were obtained for further analysis and comparison with experimental results.
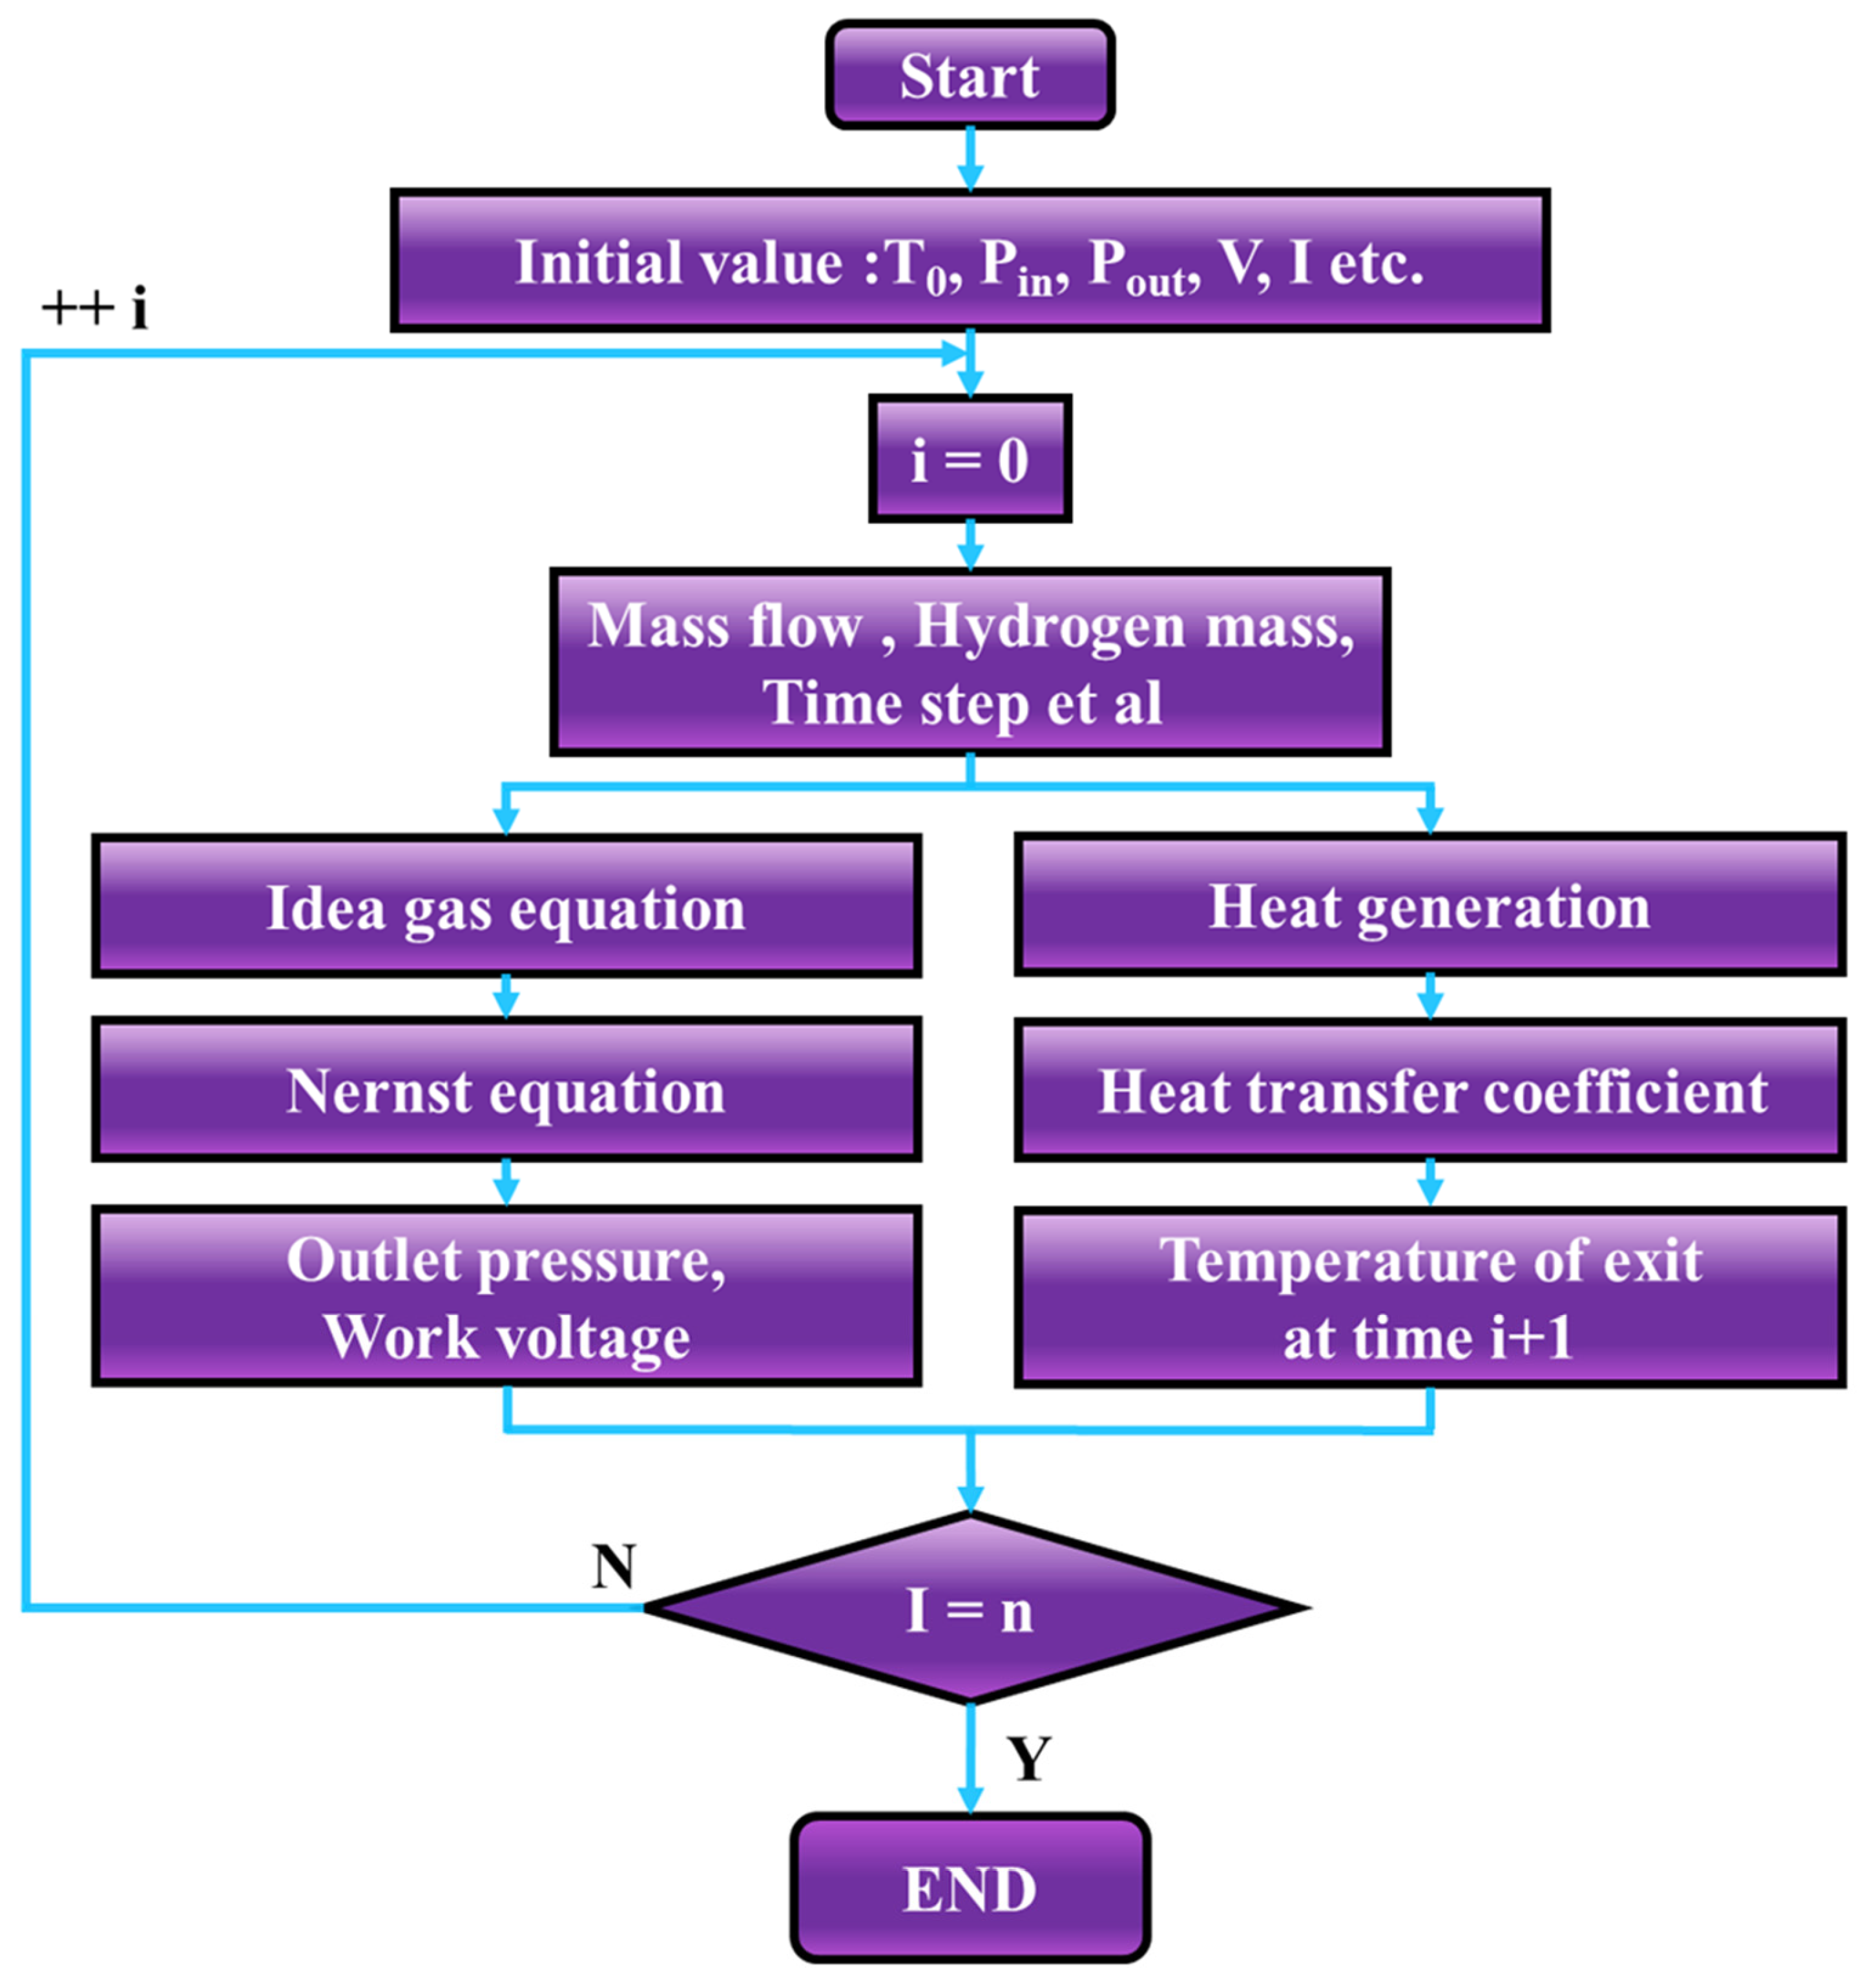
  • Constants such as the temperature, initial inlet and outlet pressure, current, and voltage are set;
  • The hydrogen supply pressure is selected, and an external voltage is applied.
  • The time step, time interval, etc., are set;
  • The theoretical voltage is calculated using the Nernst and ideal gas equations;
  • The hydrogen mass flow rate is determined using the number of electrons calculated as the theoretical voltage;
  • The calorific value and thermal conductivity are calculated using the voltage and current;
  • The outlet temperature and pressure are determined using the convective heat transfer coefficient, viscosity coefficient, etc.;
  • Thereafter, we return to step 4 and perform the calculation;
  • After reaching the set time, the calculation results are output according to the calculated time. The calculation results are the actual working voltage, outlet pressure, outlet temperature, mass flow rate, and other changes in each time period.

4. Results and Discussion

4.1. Effect of Residual Air in the Anode Chamber on the System Performance

Figure 4a shows the effect of the residual air in the anode on the cathode pressure at an inlet pressure of 1 bar and a supply voltage of 3–7 V in the SC–SP system. The power supply was paused when the outlet pressure reached 6 bar for safety reasons. The experimental results reveal that the outlet pressure increases positively as the voltage increases. For example, before the residual air in the anode compartment was discharged, the cathode pressure reaches 6 bar in 21.717, 9.88, and 8.483 min at 3, 5, and 7 V, respectively. After the air was discharged, the cathode pressure reaches 6 bar in 11, 7.5, and 6.583 min, respectively. In other words, the compression time is reduced by factors of 1.974, 1.373, and 1.289, respectively. It is attributed that other molecules such as N2, O2, and CO2 reduced the contact area between the hydrogen molecules and the catalytic layer by blocking the voids inside the gas diffusion layer, resulting in low compression efficiency, as shown in Figure 4b,c. Additionally, CO2 damaged the catalyst of the EHCs, causing inhibition in the presence of the H2–CO2 mixture [16]. According to Nordio et al. [30], the formation of carbon monoxide, which is adsorbed on catalyst sites, hinders hydrogen decomposition and subsequent membrane permeation. Therefore, the primary error in the experiments originated from the degree of air removal from the anode, significantly impacting the experimental results. Insufficient air removal during the experiment can have adverse effects on the reaction, resulting in a decrease or cessation in reaction rate and potentially impacting the experimental outcomes. Various gases present in the air can hinder the reaction, and impurities can undergo oxidation or reduction, leading to undesired reactions or uncertain results. By eliminating air, the amount of air in the anode is reduced, minimizing interference with the anode reaction and producing more reliable and accurate experimental results. In commercial applications, removing air from the anode chamber can significantly improve the efficiency of EHC, thereby reducing costs. Therefore, all subsequent experiments were conducted after the air was discharged.

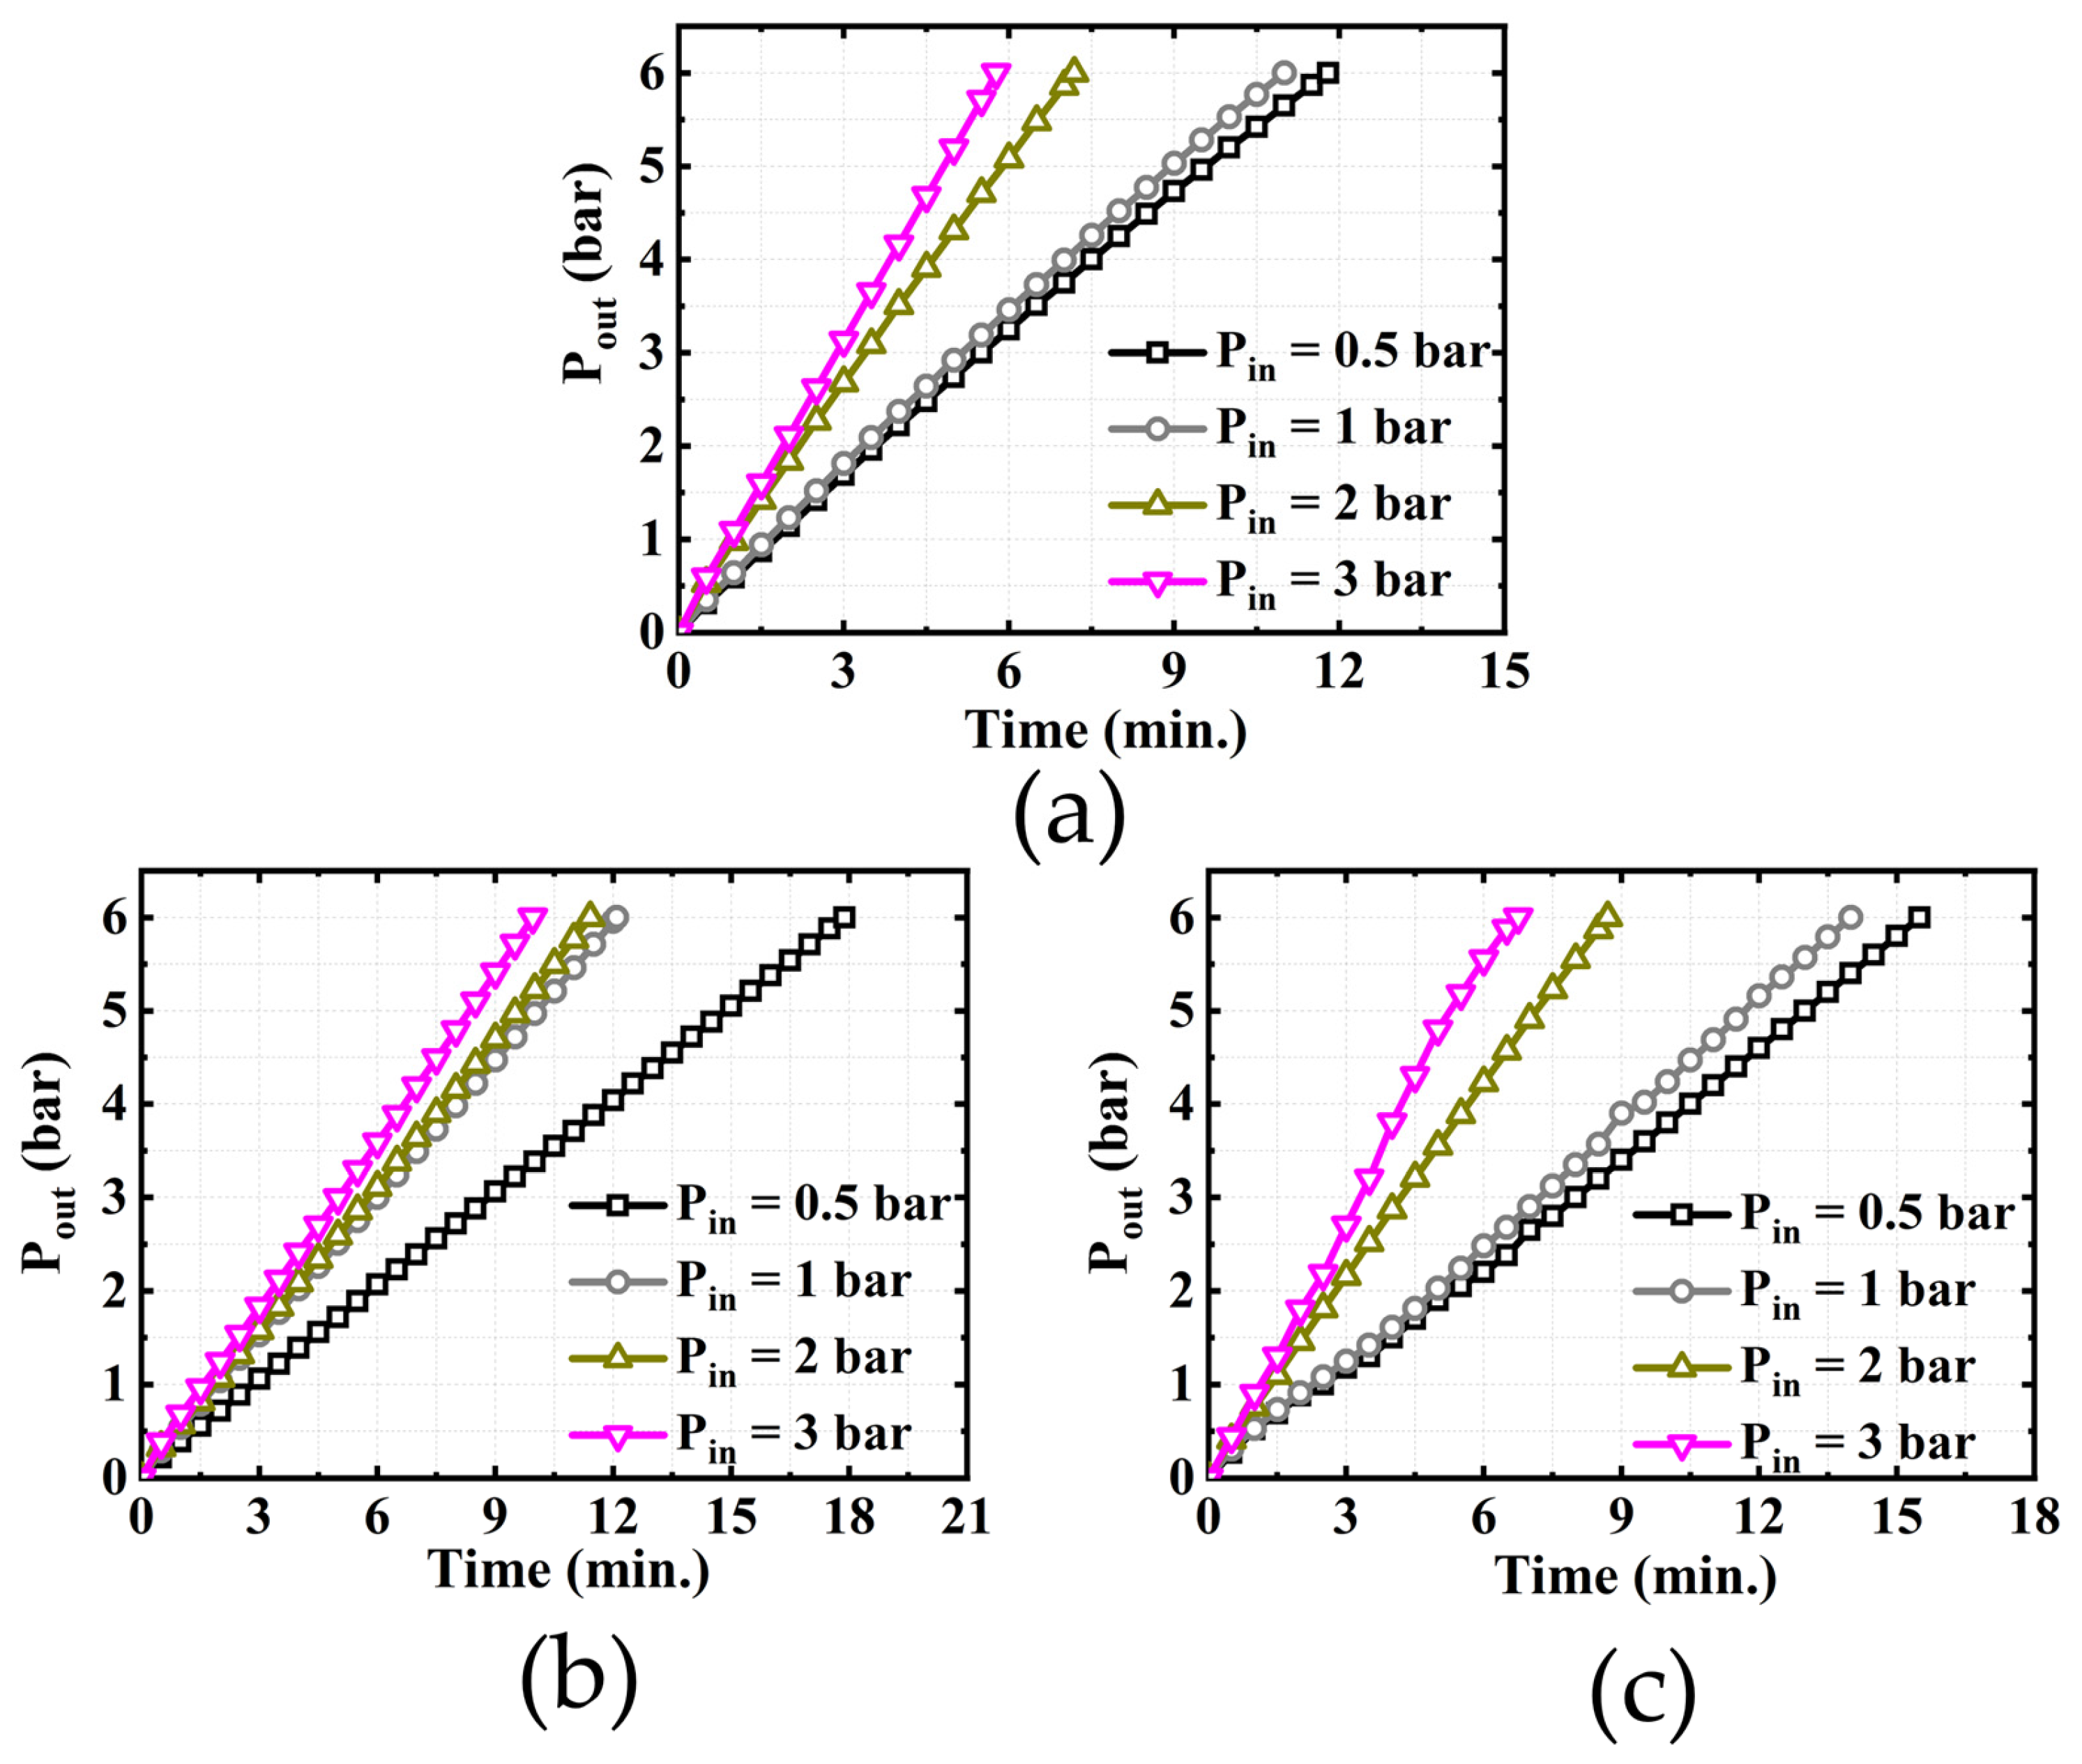
4.2. Effect of Hydrogen Pressure in Anode Chamber on System Performance

Figure 5 shows the results of the cathode pressure versus time for the three experimental systems at 3 V and inlet pressures of 0.5–3 bar. The cathode of the SC–SP system (Figure 5a) reaches 6 bar in 11.8, 11, 7.183, and 5.767 min. However, it takes 17.883, 12.083, 11.416, and 9.95 min with the DC–SP system (Figure 5b) while taking 15.5, 14, 8.7, and 6.75 min with the DC–DP system (Figure 5c). The above experimental results demonstrate that the time required to reach the target pressure decreases as the inlet pressure of the anode side increases. In other words, increasing the anode side pressure positively affects the overall efficiency. Additionally, increasing the anode chamber pressure balances the cathode and anode pressures, preventing MEA damage and back diffusion of hydrogen due to excessive pressure differences between the two compartments. According to Chouhan et al. [31], the compressor efficiency is high when operating the compressor at low voltages because the associated compression ratio is small, reducing back-diffusion losses. Their research result also supports our conclusion. The findings presented in the study have significant implications for optimizing the efficiency and performance of EHC systems. By identifying the factors that can impact the performance of EHC systems, such as the presence of air in the anode chamber, the study highlights the importance of effective air removal and purity control in achieving optimal EHC performance. The results of this study can inform the design and operation of EHC systems to maximize efficiency and minimize costs. Furthermore, the study provides a framework for further research in this area, including the development of improved air removal techniques and the exploration of new materials for EHC systems.
We also evaluated the performance of the DC–DP system at a constant applied voltage and current. Figure 6a shows the compression rate of hydrogen in the cathode chamber for two different conditions (e.g., at a constant voltage of 7 V and a constant current of 1.2 A) while the anode pressure is 1 bar. It can be observed that the compression rate of the cathode chamber pressure is the same at both given conditions. However, the operating voltage required for the reaction increases gradually as the cathode chamber pressure rises when the constant current of 1.2 A is applied (see Figure 6b). This is due to the increase in resistance of the mass transfer with increasing pressure in the cathode chamber [31]. In contrast, when the constant voltage is applied, the current decreases as the cathode pressure increases. Therefore, applying a constant current is better for low target compression pressure in the cathode chamber. Since it can lead to a dangerous increase in operating voltage at high pressure in the cathode chamber, it would not be recommended to employ it in commercial applications.

4.3. Comparison between the Three Experimental Setups

Figure 7 shows the time required for the cathode pressure of the compressor to reach 6 bar when the anode pressure is 0.5 bar and the supply voltage is 5 V. The time needed for the cathode pressure to reach 6 bars is 7.83, 15.967, and 12 min for SC–SP, DC–SP, and DC–DP configurations, respectively. In the DC-SP configuration, a single power supply supplies the power required for two compressors. The same voltage can be applied to each compressor, but they share the current supplied by the power supplies, deteriorating the overall compression performance. The DC-DP configuration is expected to achieve the best compression performance among the three configurations, but the compression time is slower than the SC-SP configuration due to the extra volume between the two compressors. However, the DC-DP configuration (e.g., stack configuration) is recommended for commercialization since the SC-SP configuration is more vulnerable to issues such as back-diffusion of gas and the lack of membrane strength at the target compression pressure of 700 bar.

4.4. Calculation Results and Analysis

Figure 8 shows the experimental and simulation results for the single compressor at an applied voltage of 3–7 V and a supply pressure of 0.5 bar. When the applied voltage is 3 V, 5 V, and 7 V, the outlet pressure of the cathode chamber reaches 6 bar in 11, 7.96, and 6.6 min in the simulation model, while it takes 11.8, 7.83, and 7.96 min during the experiment. The experimental results and the theoretical analysis calculations agree well with the maximum error of less than 7%.
Figure 9 shows the experimentally and theoretically calculated temperatures of the cathode chamber. First, the anode pressure was fixed at 1 bar, and the applied voltage was set to 3 V, 5 V, and 7 V to measure the temperature of the compressor. The hydrogen temperature of the cathode increases from room temperature (23.88 °C, 23.48 °C, and 23.58 °C) to about 24.39 °C, 25.15 °C, and 25.7 °C, respectively. At the beginning of the experiment, protons reduce to hydrogen gas in the cathode chamber, and hydrogen gas is then compressed, resulting in a rapid increase in the internal temperature of the compressor. When the temperature increases to a certain level, the heat generated due to gas compression and the heat dissipated by the system are equal, and the cathode temperature of the hydrogen compressor remains constant. The calculated temperatures at which the heat generated and dissipated into the air reach equilibrium are 24.87 °C, 26.05 °C, and 27.04 °C, respectively (Equations (17)–(31)). The maximum error between the two results does not exceed 5% (1.34 °C).

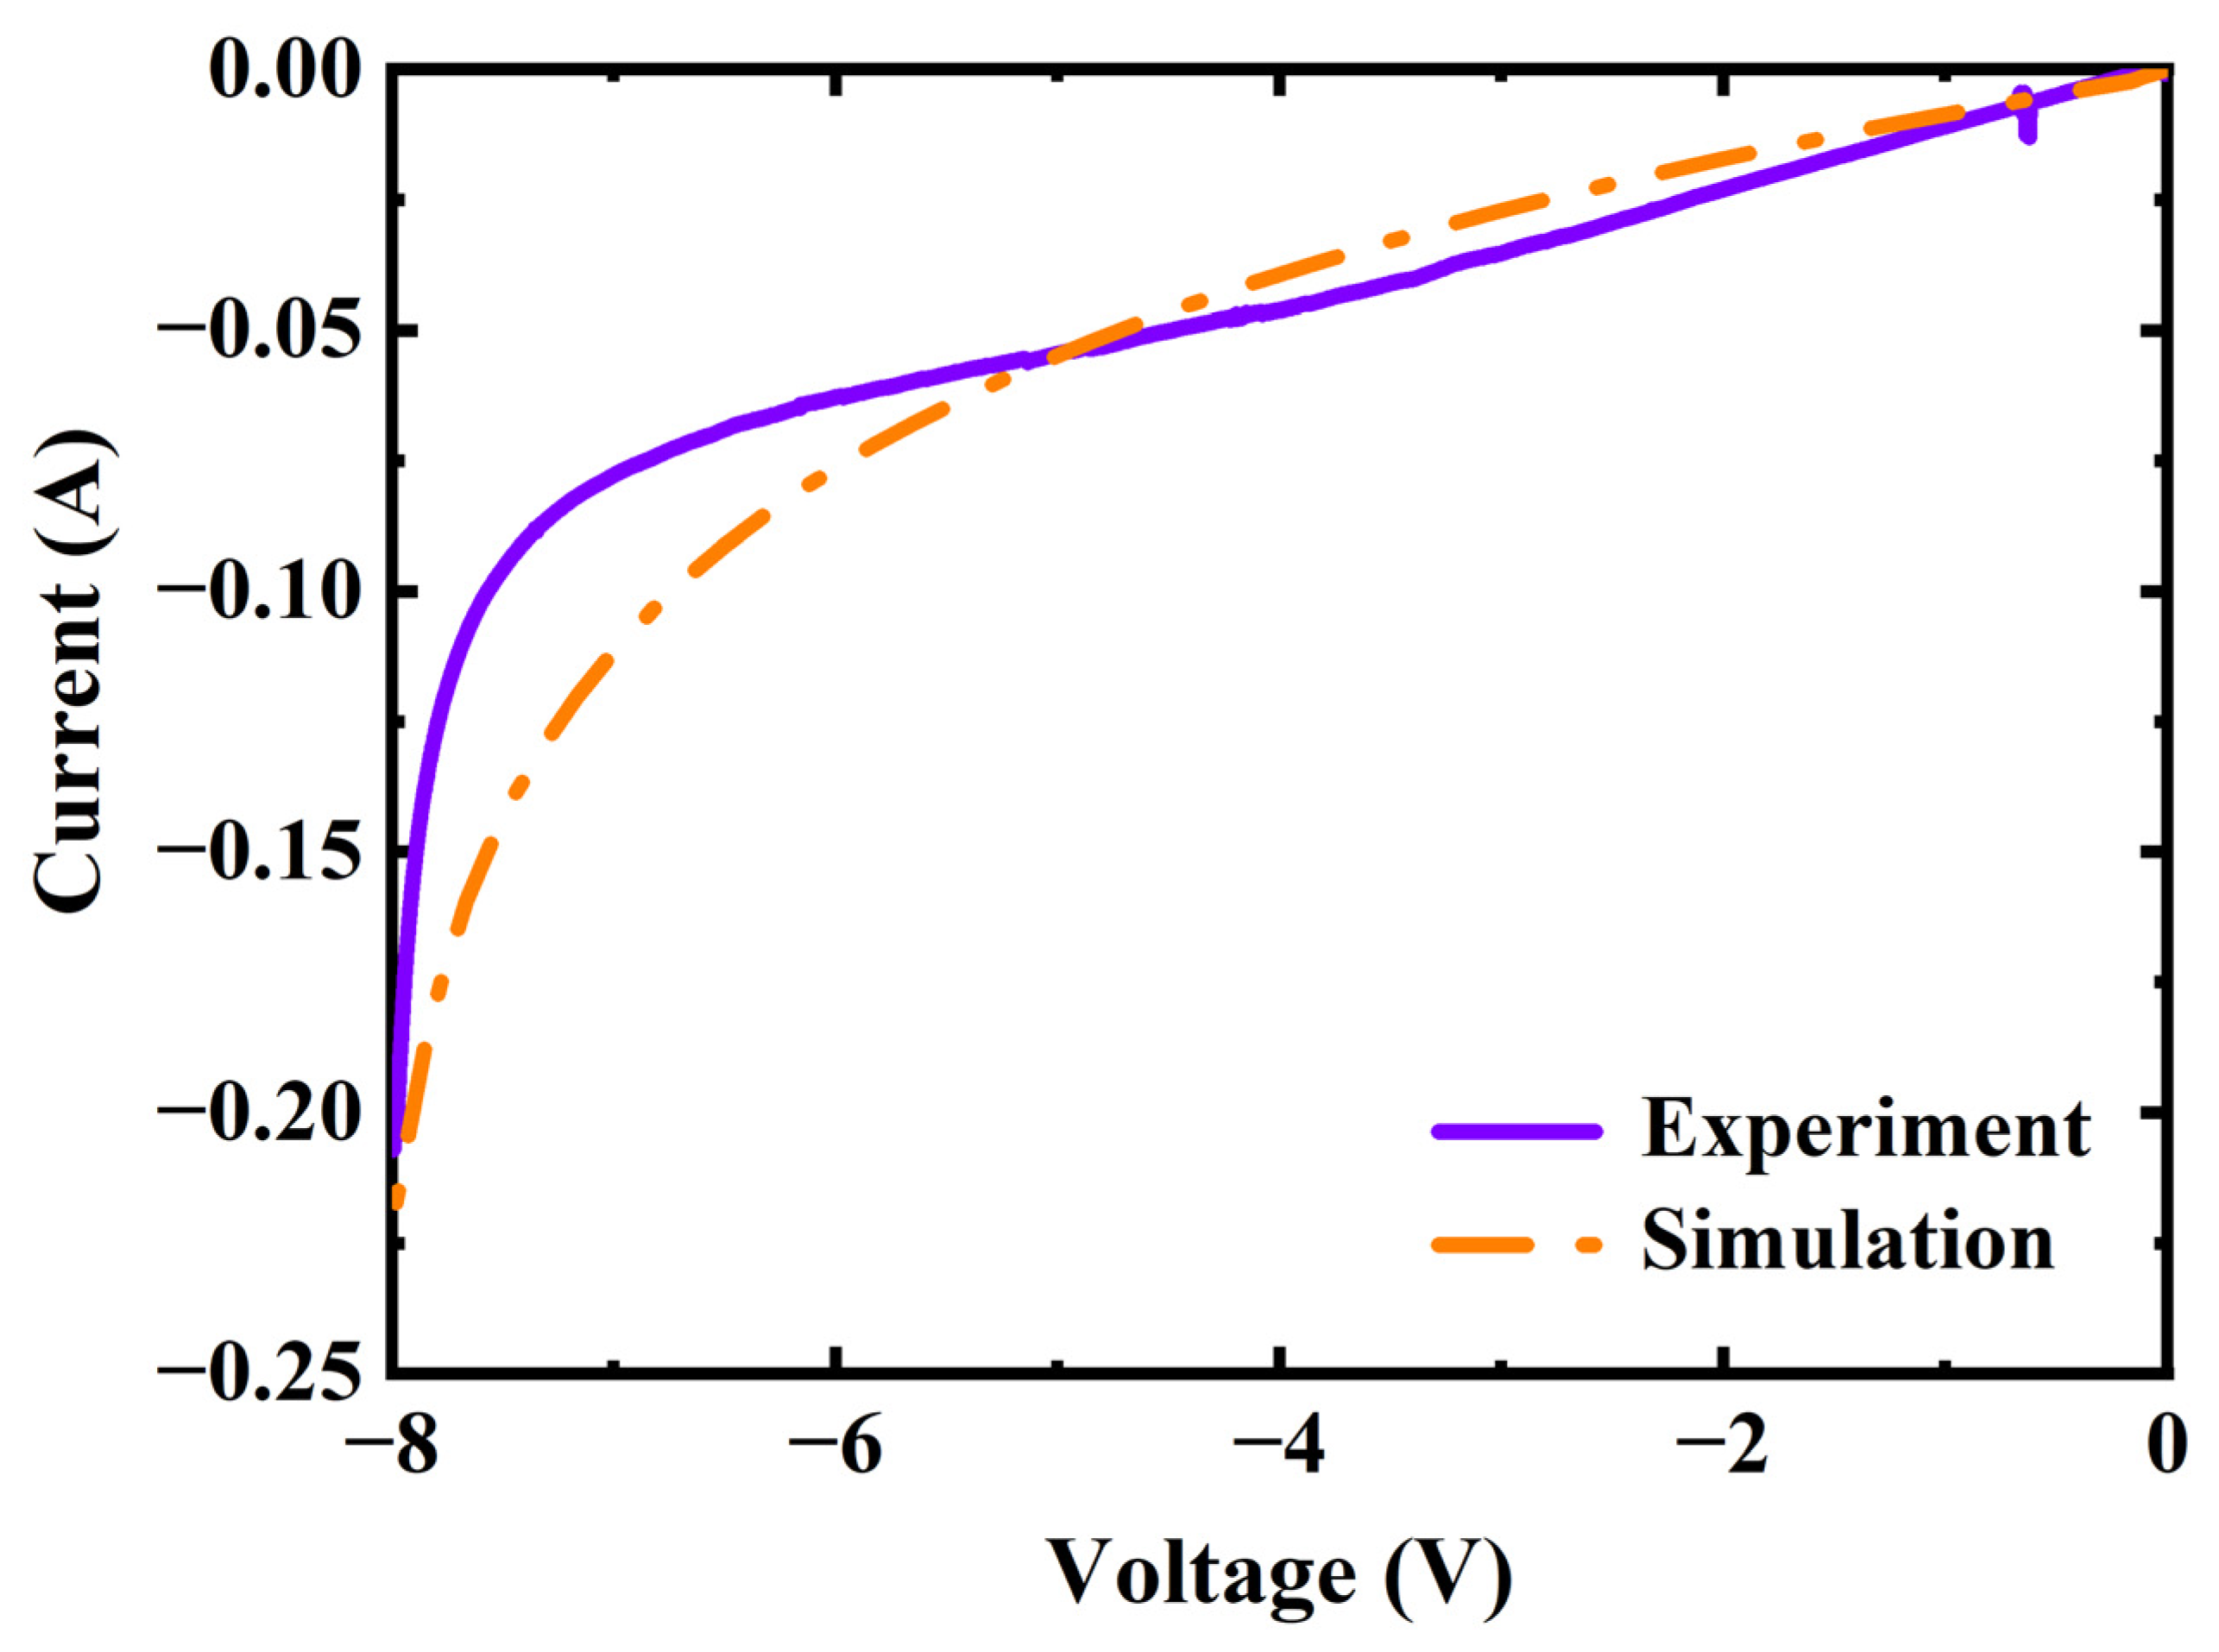
4.5. Variation of Current with Voltage

Figure 10 shows the linear sweep voltammetry (LSV) curve from 0 to 8 V. The curve (solid line) represents the experimental result, while the curve (dotted line) represents the calculated result. The simulation model was built using Simulink in MATLAB [23]. As explained above, the activation polarization of an EHC is small, and the current only fluctuates slightly before smoothing out. The voltage and current are linearly proportional as the applied voltage increases. This is mainly influenced by ohmic polarization. When the applied voltage reaches about 7 V, the current increases rapidly, which enhances the electrochemical reaction. However, if the reaction rate is extremely high and the cathode lacks hydrogen protons (i.e., if the number of hydrogen protons on the electrode surface decreases), the current decreases rapidly, mainly because of the concentration polarization. In this experiment, the concentration polarization could not be observed. This confirms that the experimental and computational results obtained through modeling agree with each other.

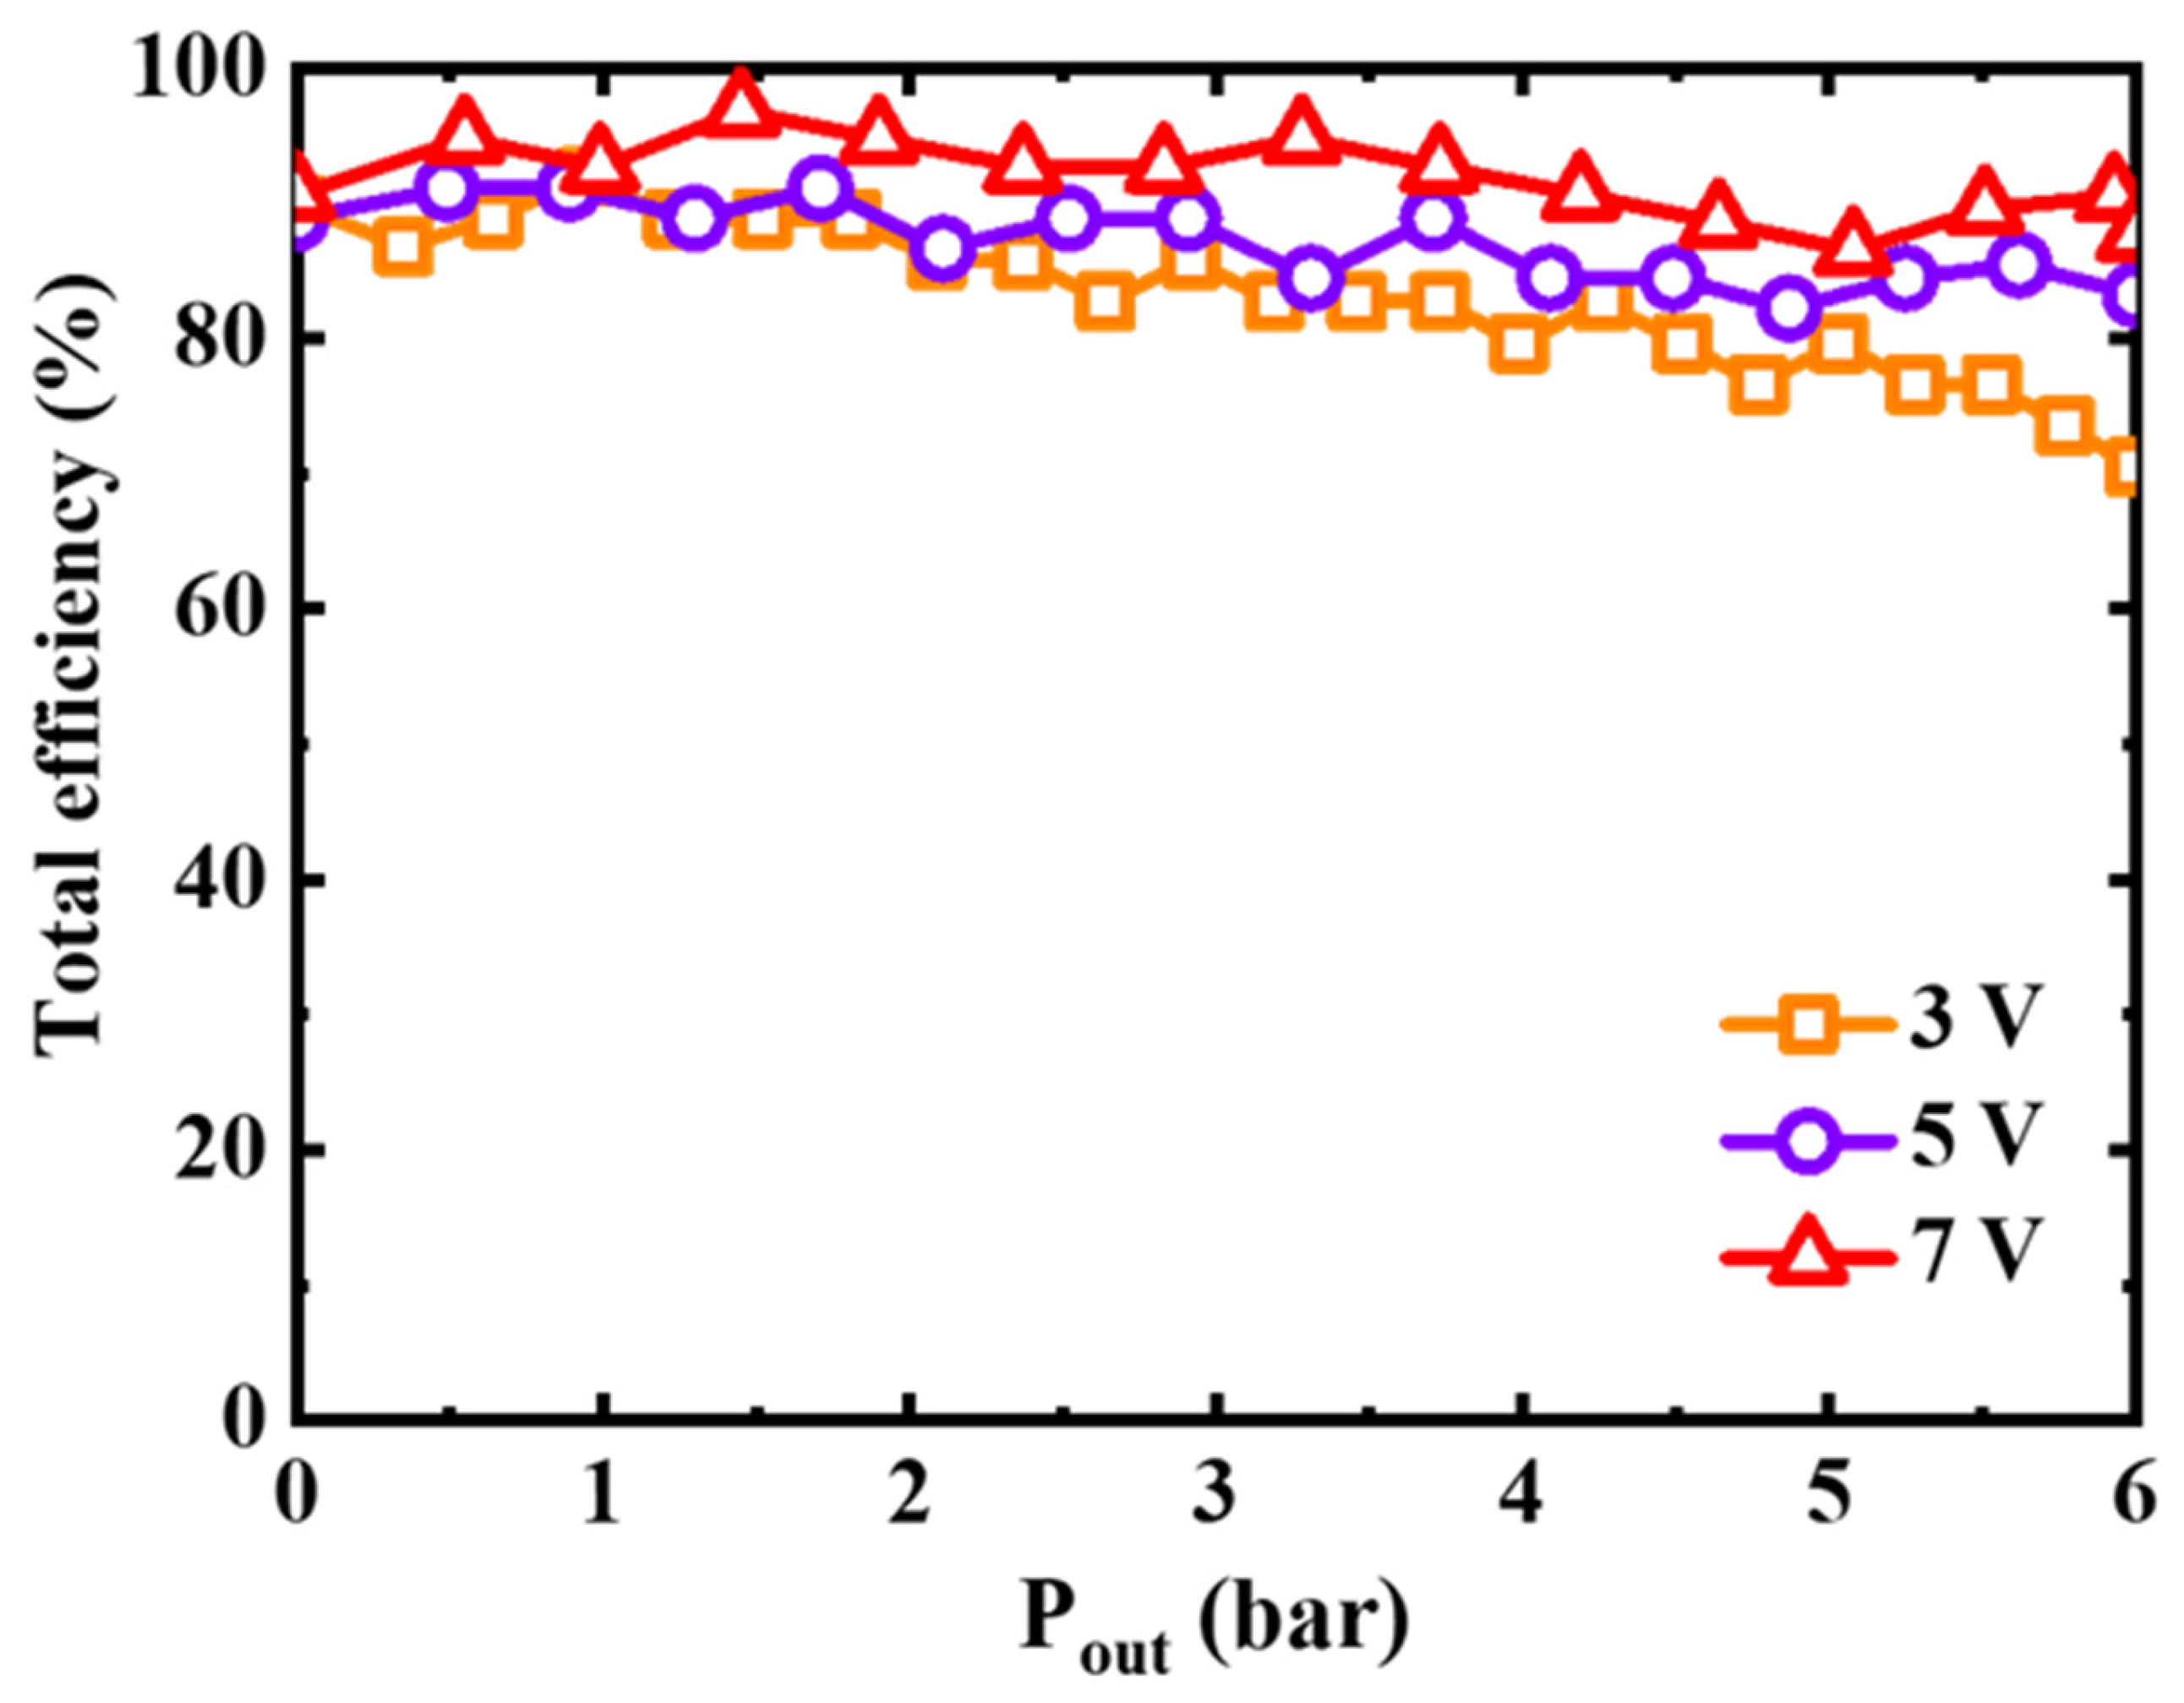
4.6. Theoretical Efficiency

Figure 11 shows the compression efficiency when the anode pressure was 1 bar, and the applied voltage was 3 V, 5 V, or 7 V. The compression efficiency of an EHC decreases as the reaction proceeds, and it can be expressed by multiplying the voltage efficiency and the Faraday efficiency (see Equations (13)–(16)). The compression efficiency is 70.48%, 83.22%, and 87.57% at the cathode pressure of 6 bar for the applied voltages of 3, 5, and 7 V. The main reason for the decrease in compression efficiency is increased pressure in the cathode chamber, which increases mass transfer resistance. In addition, the compression efficiency decreases proportionally as the pressure increases because the back-diffusion effect becomes more intense as the hydrogen pressure in the cathode increases. As the applied voltage increases from 3 V to 5 V and 7 V, the compression efficiency increases by 1.743%, 1.441%, and 1.022%, respectively. Therefore, it is clear that a high supply voltage will result in high compression efficiency and rapid hydrogen compression. Commercial hydrogen compression is generally accomplished with a compression efficiency of about 70% to 80% [32]. When a voltage of 7 V is applied using an electrochemical compressor, it is expected to compress the hydrogen quickly up to 700 bar, which is a commercial target compression pressure with high compression efficiency.
The voltage applied to the EHC is a crucial factor in determining its efficiency. The applied voltage directly affects the rate of the electrochemical reaction, which is responsible for the compression of hydrogen gas. If the voltage is too low, the electrochemical reaction kinetics will be poor, resulting in low EHC efficiency. On the other hand, if the voltage is too high, it can cause issues such as excessive heat generation and poor selectivity of the electrochemical reaction. These factors can negatively impact EHC efficiency. Therefore, it is important to operate the EHC within a specific voltage range that can vary depending on the type of EHC, the membrane material, and specific operating conditions. By operating the EHC within this voltage range, it is possible to achieve the desired compression efficiency while avoiding any adverse effects on EHC operation.

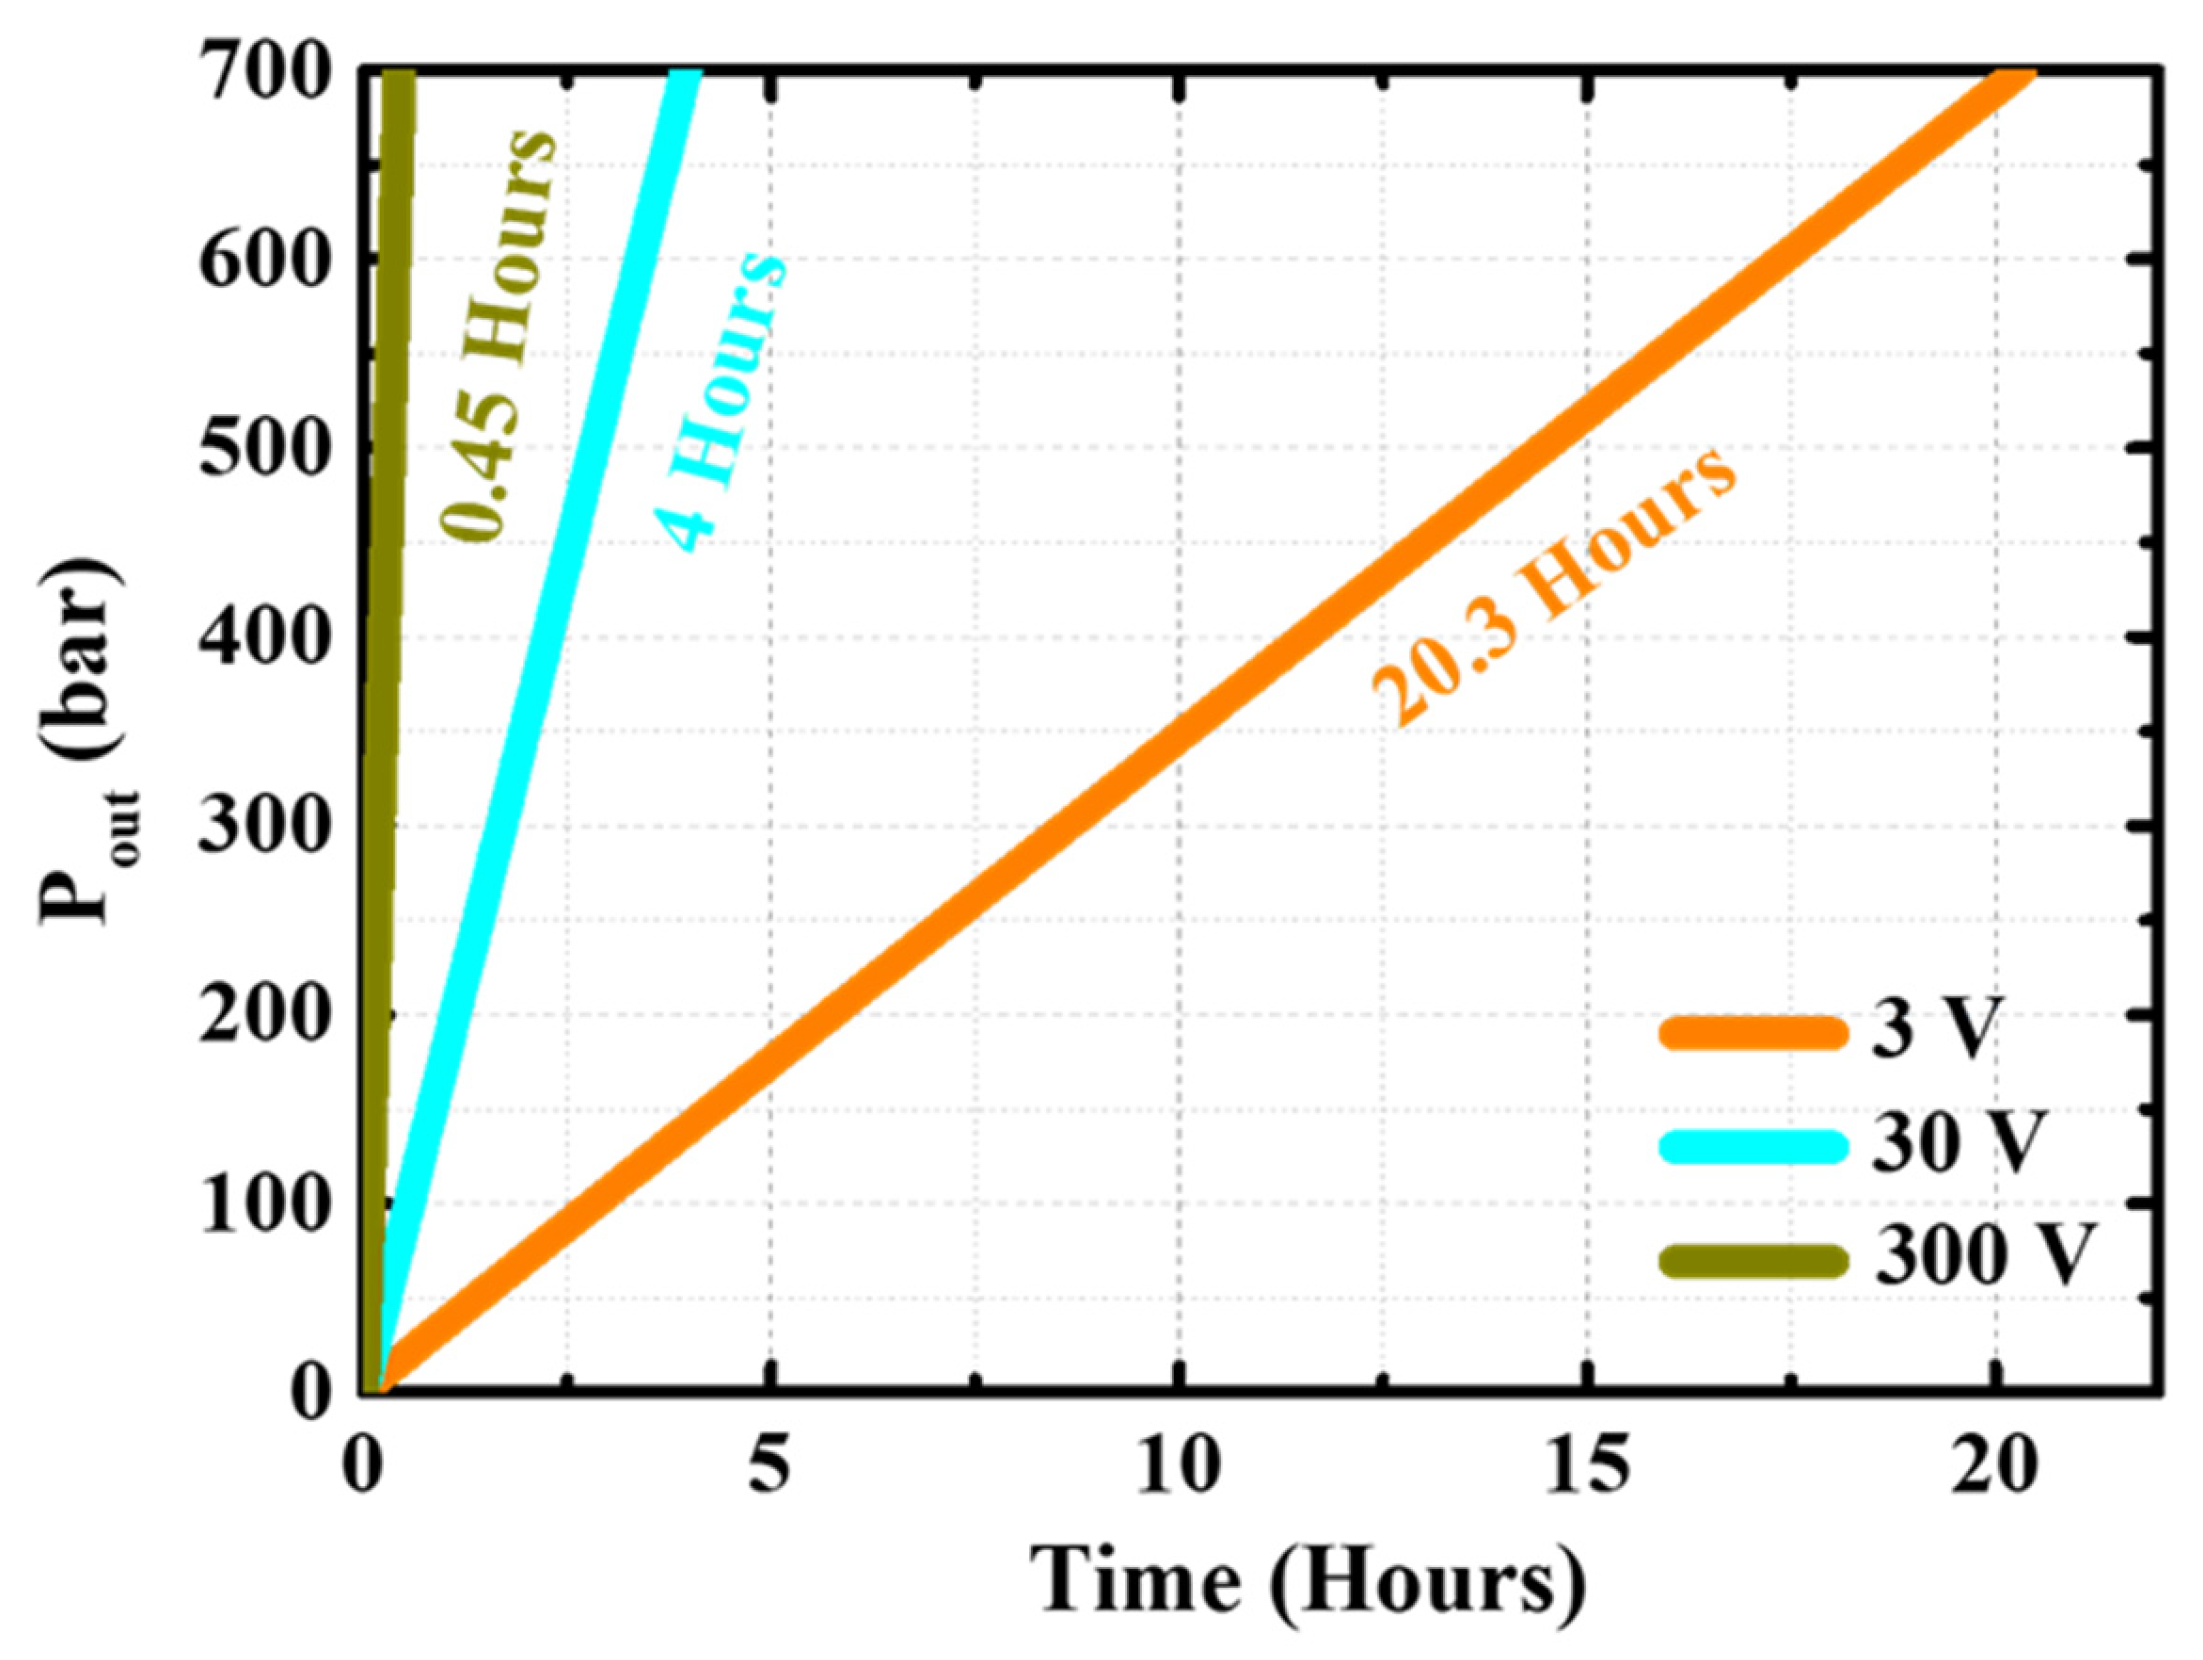
4.7. Commercial Pressure Standard Calculation

For safety reasons, the experiments in this study were stopped when the outlet pressure reached 6 bar. However, the reliability of this model is confirmed by the abovementioned cathode pressure, temperature, and LSV curve calculation results (Figure 8, Figure 9 and Figure 10), which indicate that the errors of this simulation fell within the acceptable range. Therefore, the model can be used to evaluate the parameters (e.g., pressure, temperature, voltage) of this experimental system for commercial use. Figure 12 shows the results of the theoretical calculations for the time the cathode chamber pressure requires to reach 700 bar when the anode chamber pressure is 1 bar, and the applied voltages are 3 V (1.12 A), 30 V (5.44 A), and 300 V (48.17 A). The target pressure can be reached in 20 h, 4 h, and 24 min when 3 V, 30 V, and 300 V are applied to the compressor.
In electrochemical compressors (EHCs), there may be discrepancies between theoretical predictions and actual performance at high voltages and pressures. These discrepancies can occur due to various reasons, such as the non-linear behavior of electrochemical reactions, limitations in membrane transport properties, and the formation of unwanted by-products. At high voltages, non-linearities in the electrochemical reactions can lead to unexpected changes in the compressor’s performance. For example, the overpotential required for the electrochemical reaction may increase at higher voltages, affecting the compressor’s efficiency. Likewise, at high pressures, the transport of protons through the membrane can become more challenging, resulting in a decrease in compressor efficiency.
To mitigate these possible discrepancies, optimizing the design of membranes and other equipment may be necessary. For example, the membrane material and structure can be customized to enhance proton transport and minimize undesirable by-products. Additionally, it may be necessary to optimize the compressor’s operational parameters, such as voltage and pressure, to attain the intended efficiency and minimize deviations from theory. Consequently, it is crucial to meticulously evaluate the impact of high voltages and pressures when developing an electrochemical hydrogen compressor that can function effectively and consistently. This will be the primary focus of our future research.

5. Conclusions

In summary, we explored the performance of an EHC for commercialization purposes and performed experimental and theoretical calculations for parameters such as anode chamber pressure and system voltage. The principal conclusions can be summarized as follows:
  • The residual air within the EHC hinders contact between electrodes and hydrogen, thereby deteriorating a reaction kinetic;
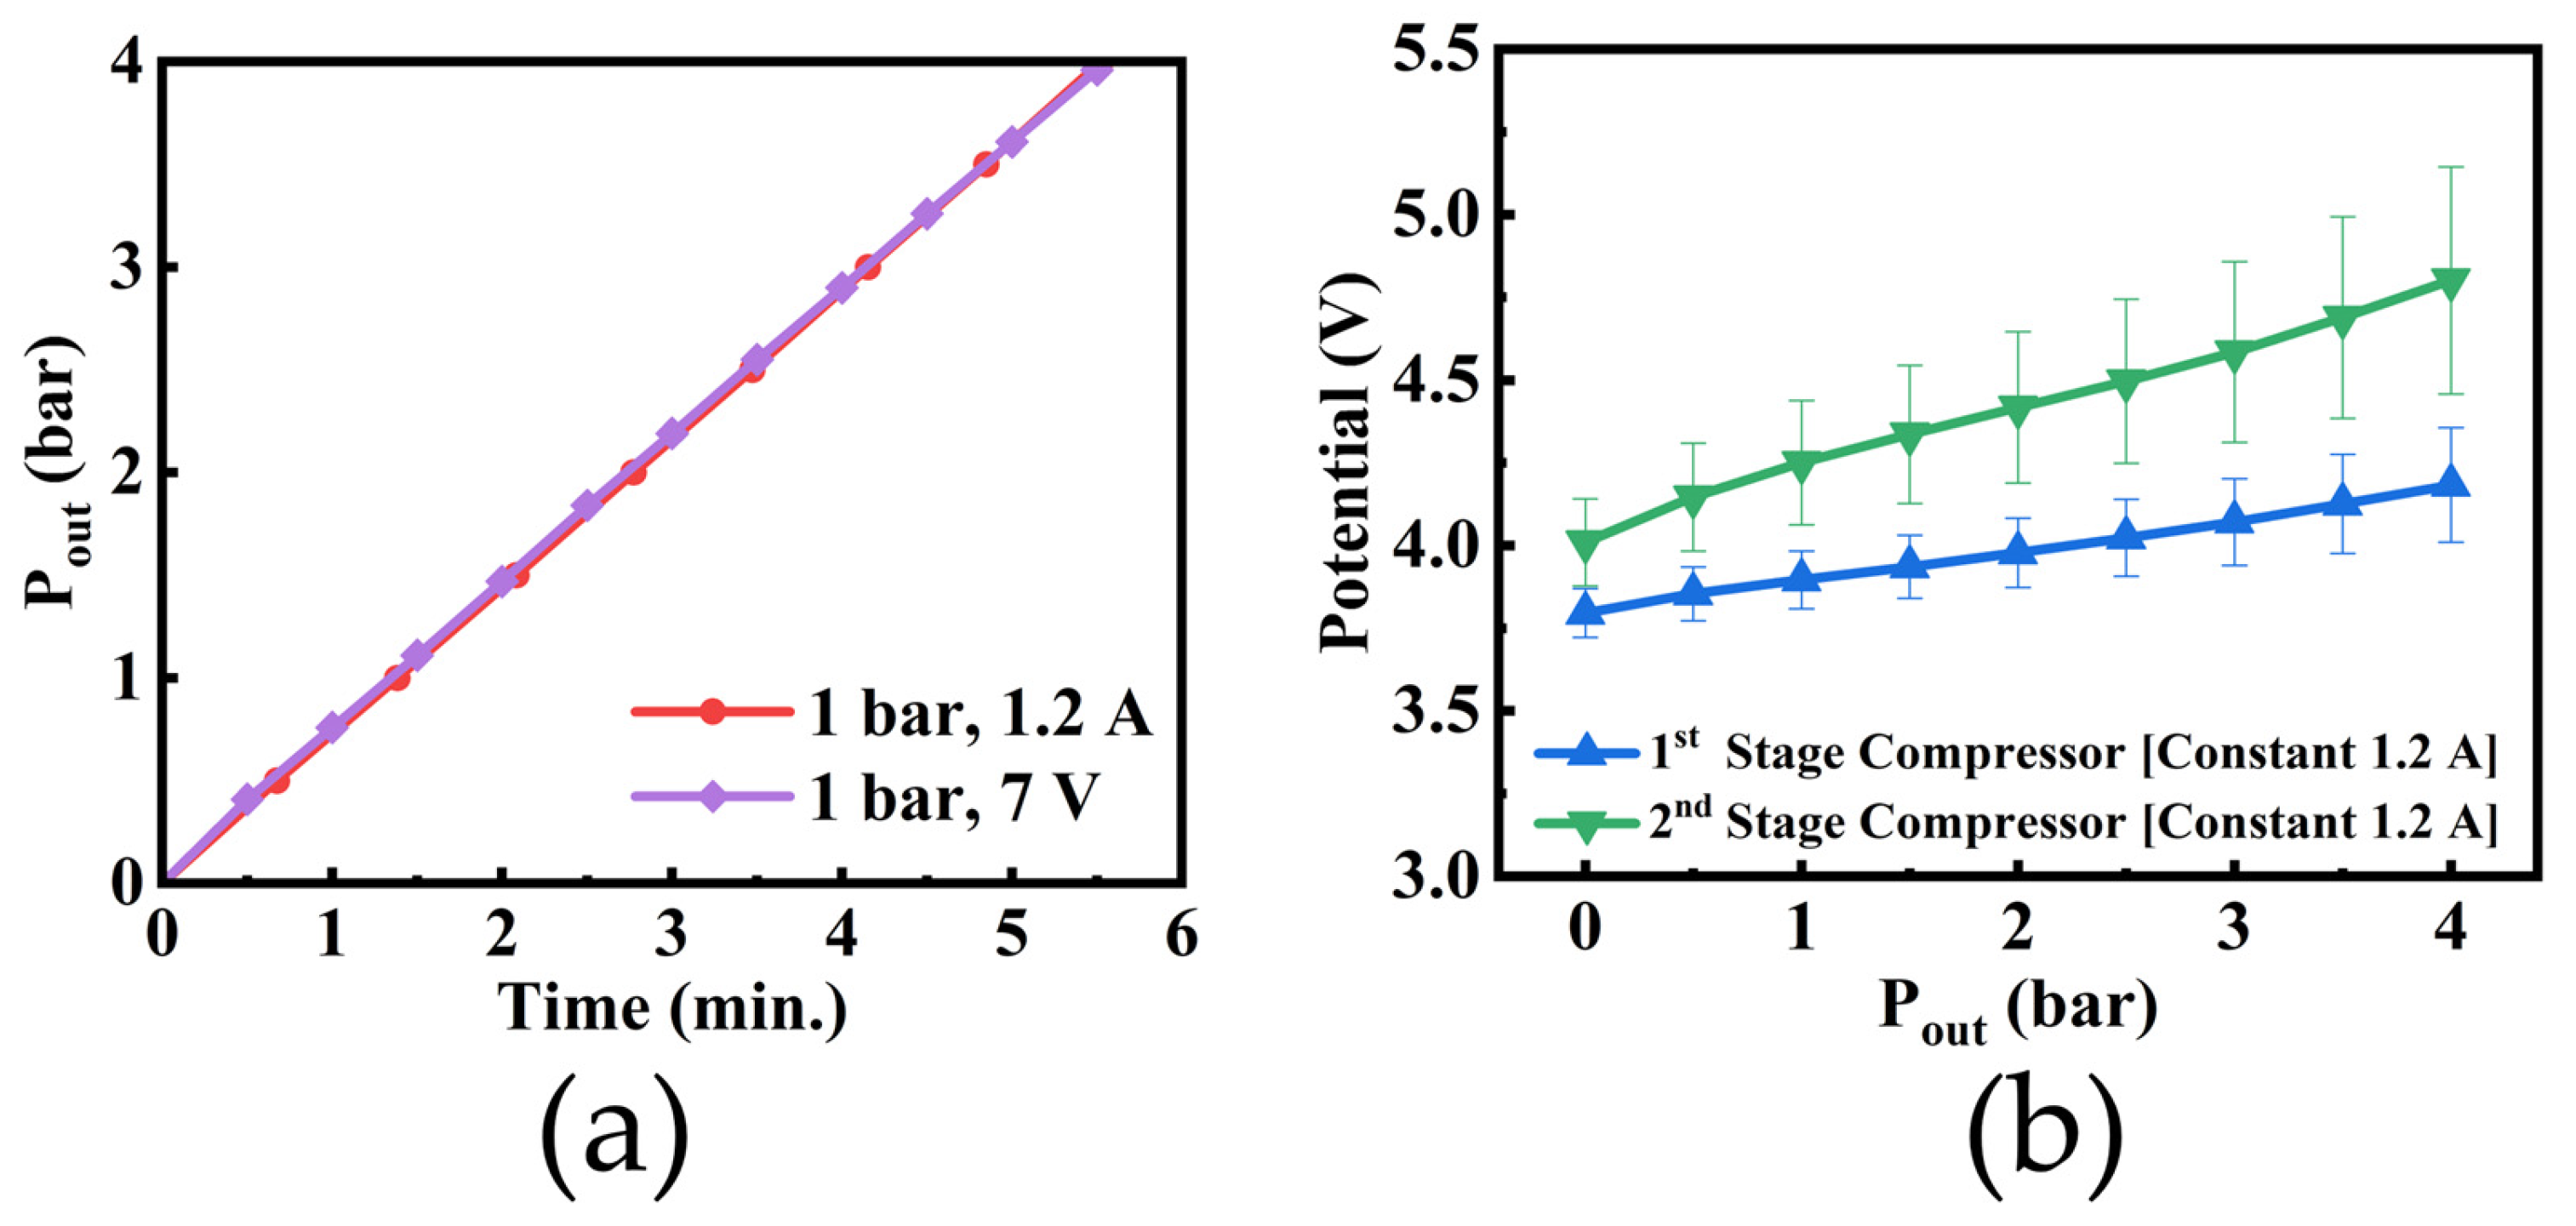
  • As the current increases, the molar flow rate of hydrogen increases, which increases the hydrogen production rate and reduces the time required to reach the desired compression pressure;
  • When the applied voltage is constant, the final compression pressure is proportional to the supply pressure at the anode of the EHC. In addition, increasing the supply pressure shortens the time required to reach the final target compression pressure. It also effectively prevents the reverse penetration of hydrogen gas;
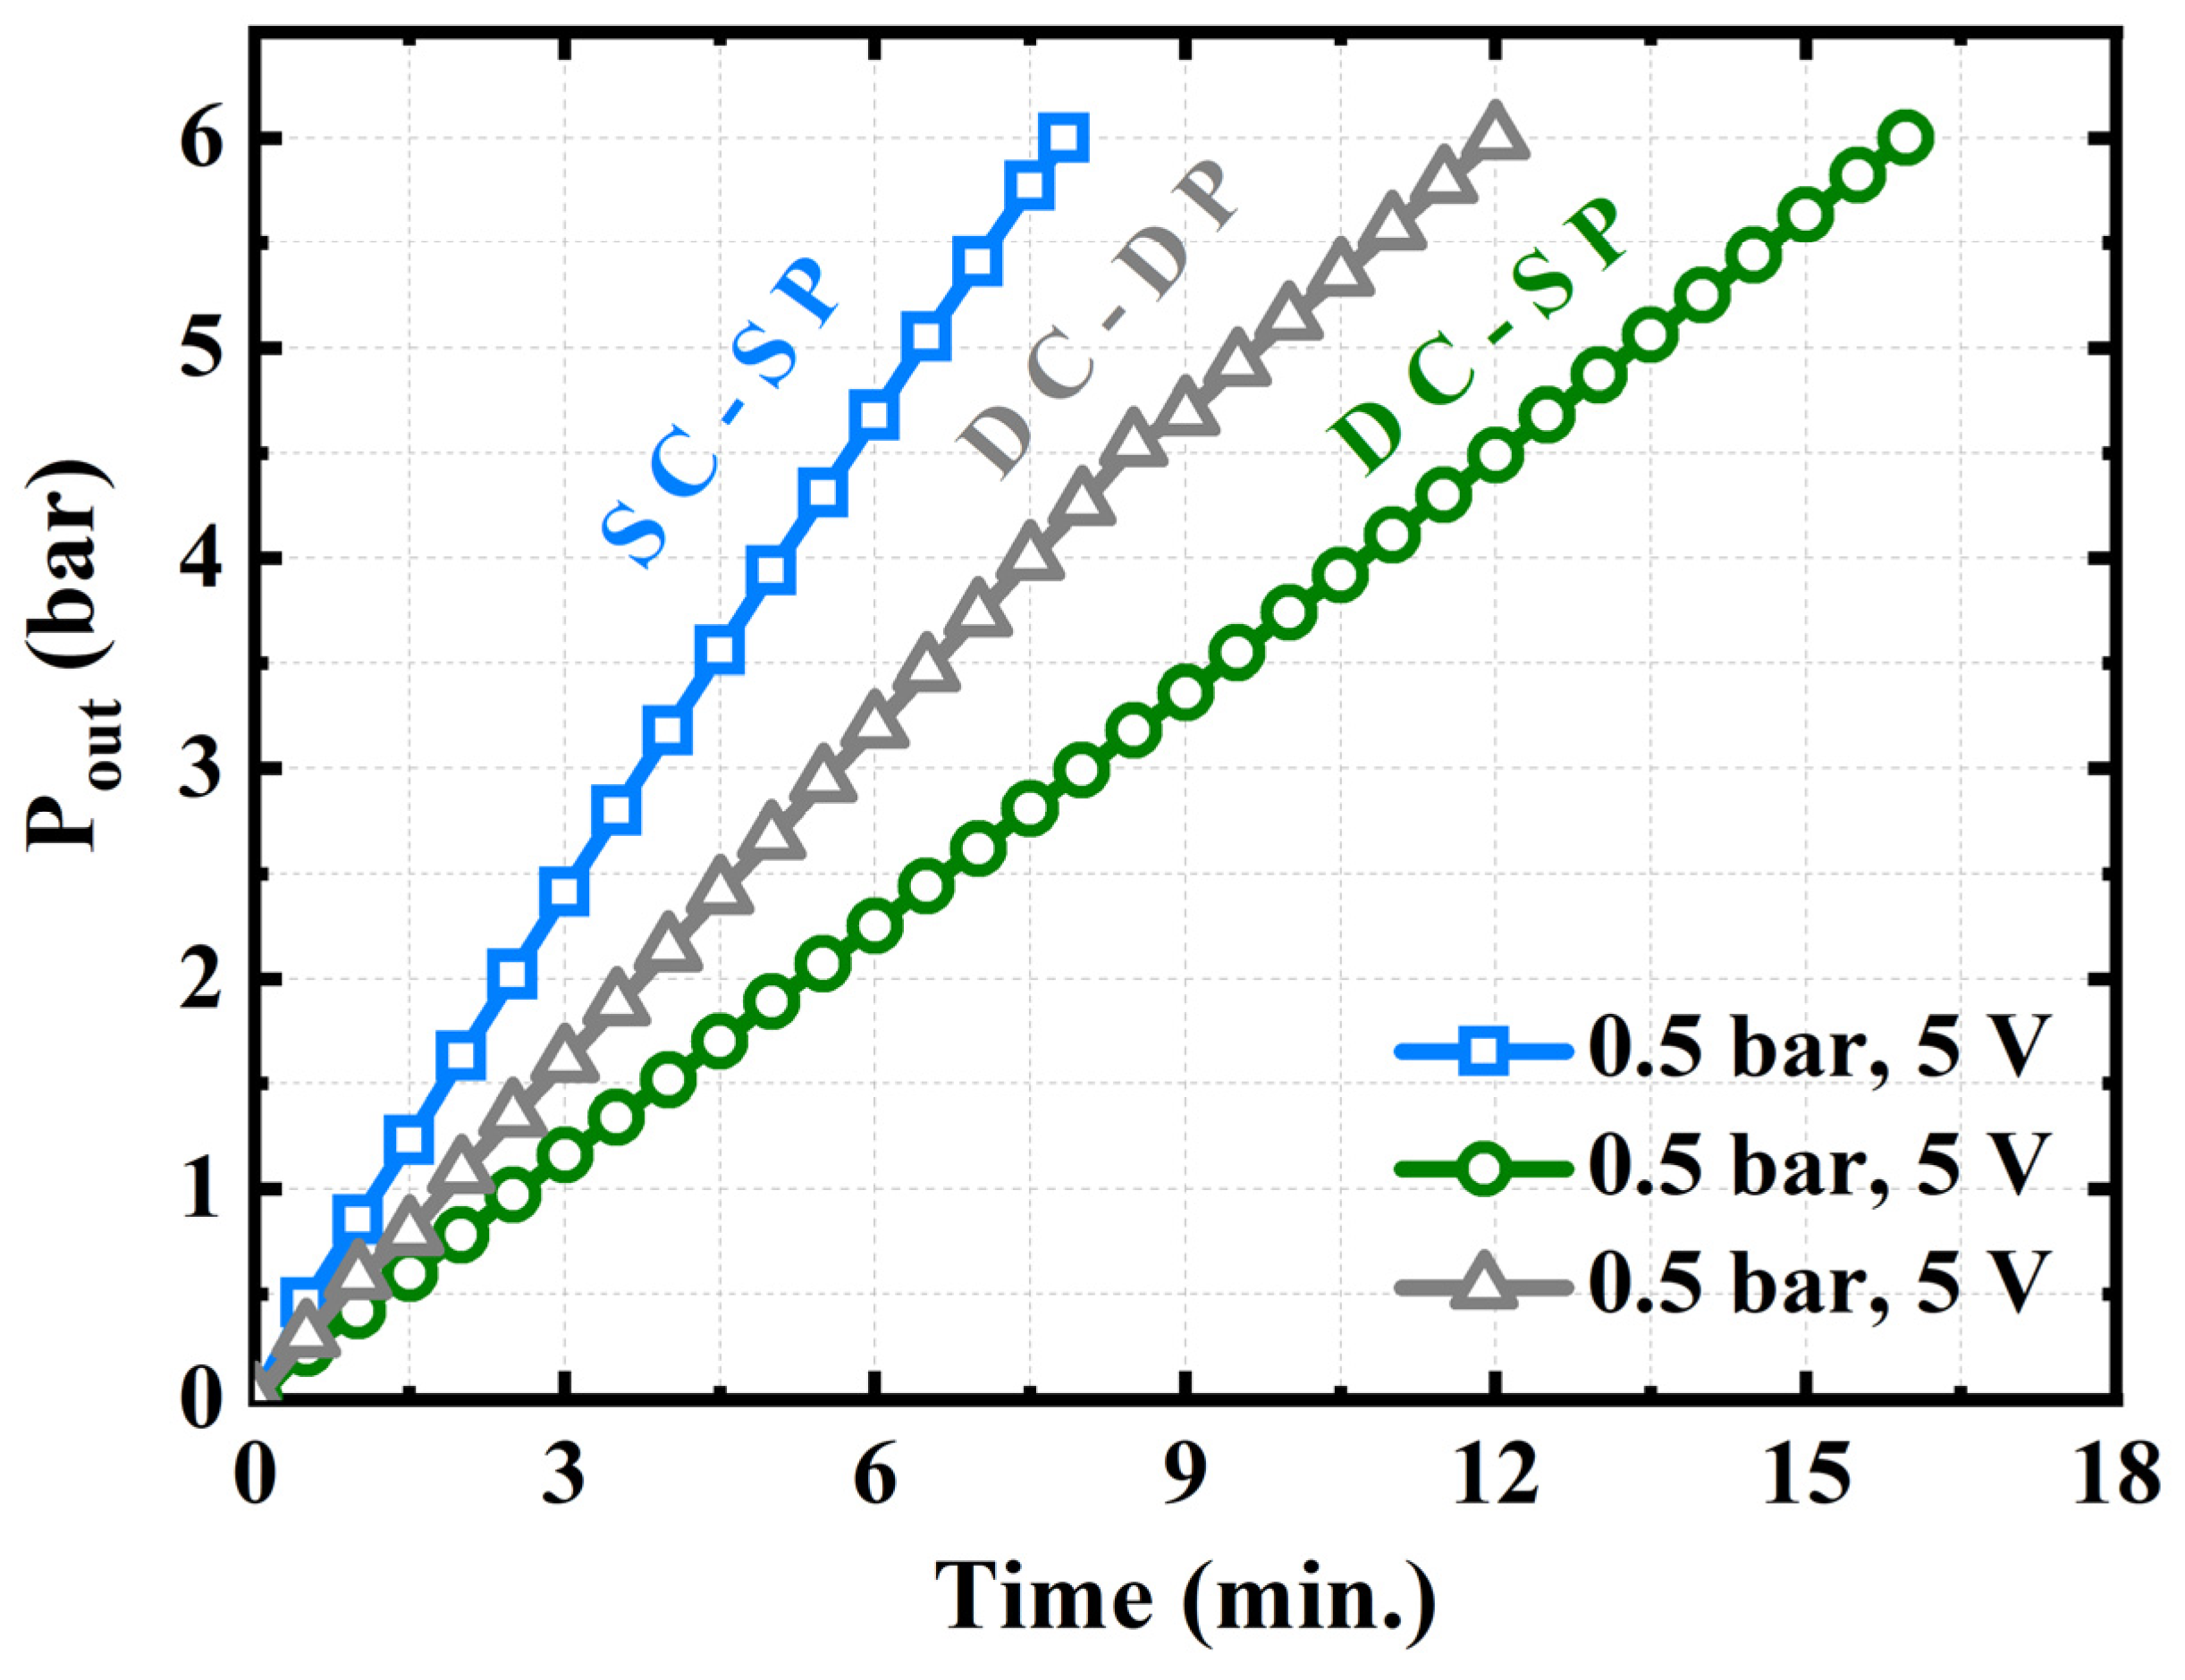
  • The SC–SP, DC–SP, and DC–DP configurations were analyzed experimentally and compared at the same applied voltage and supply pressure. The SC–SP device exhibited the best performance and efficiency in this study;
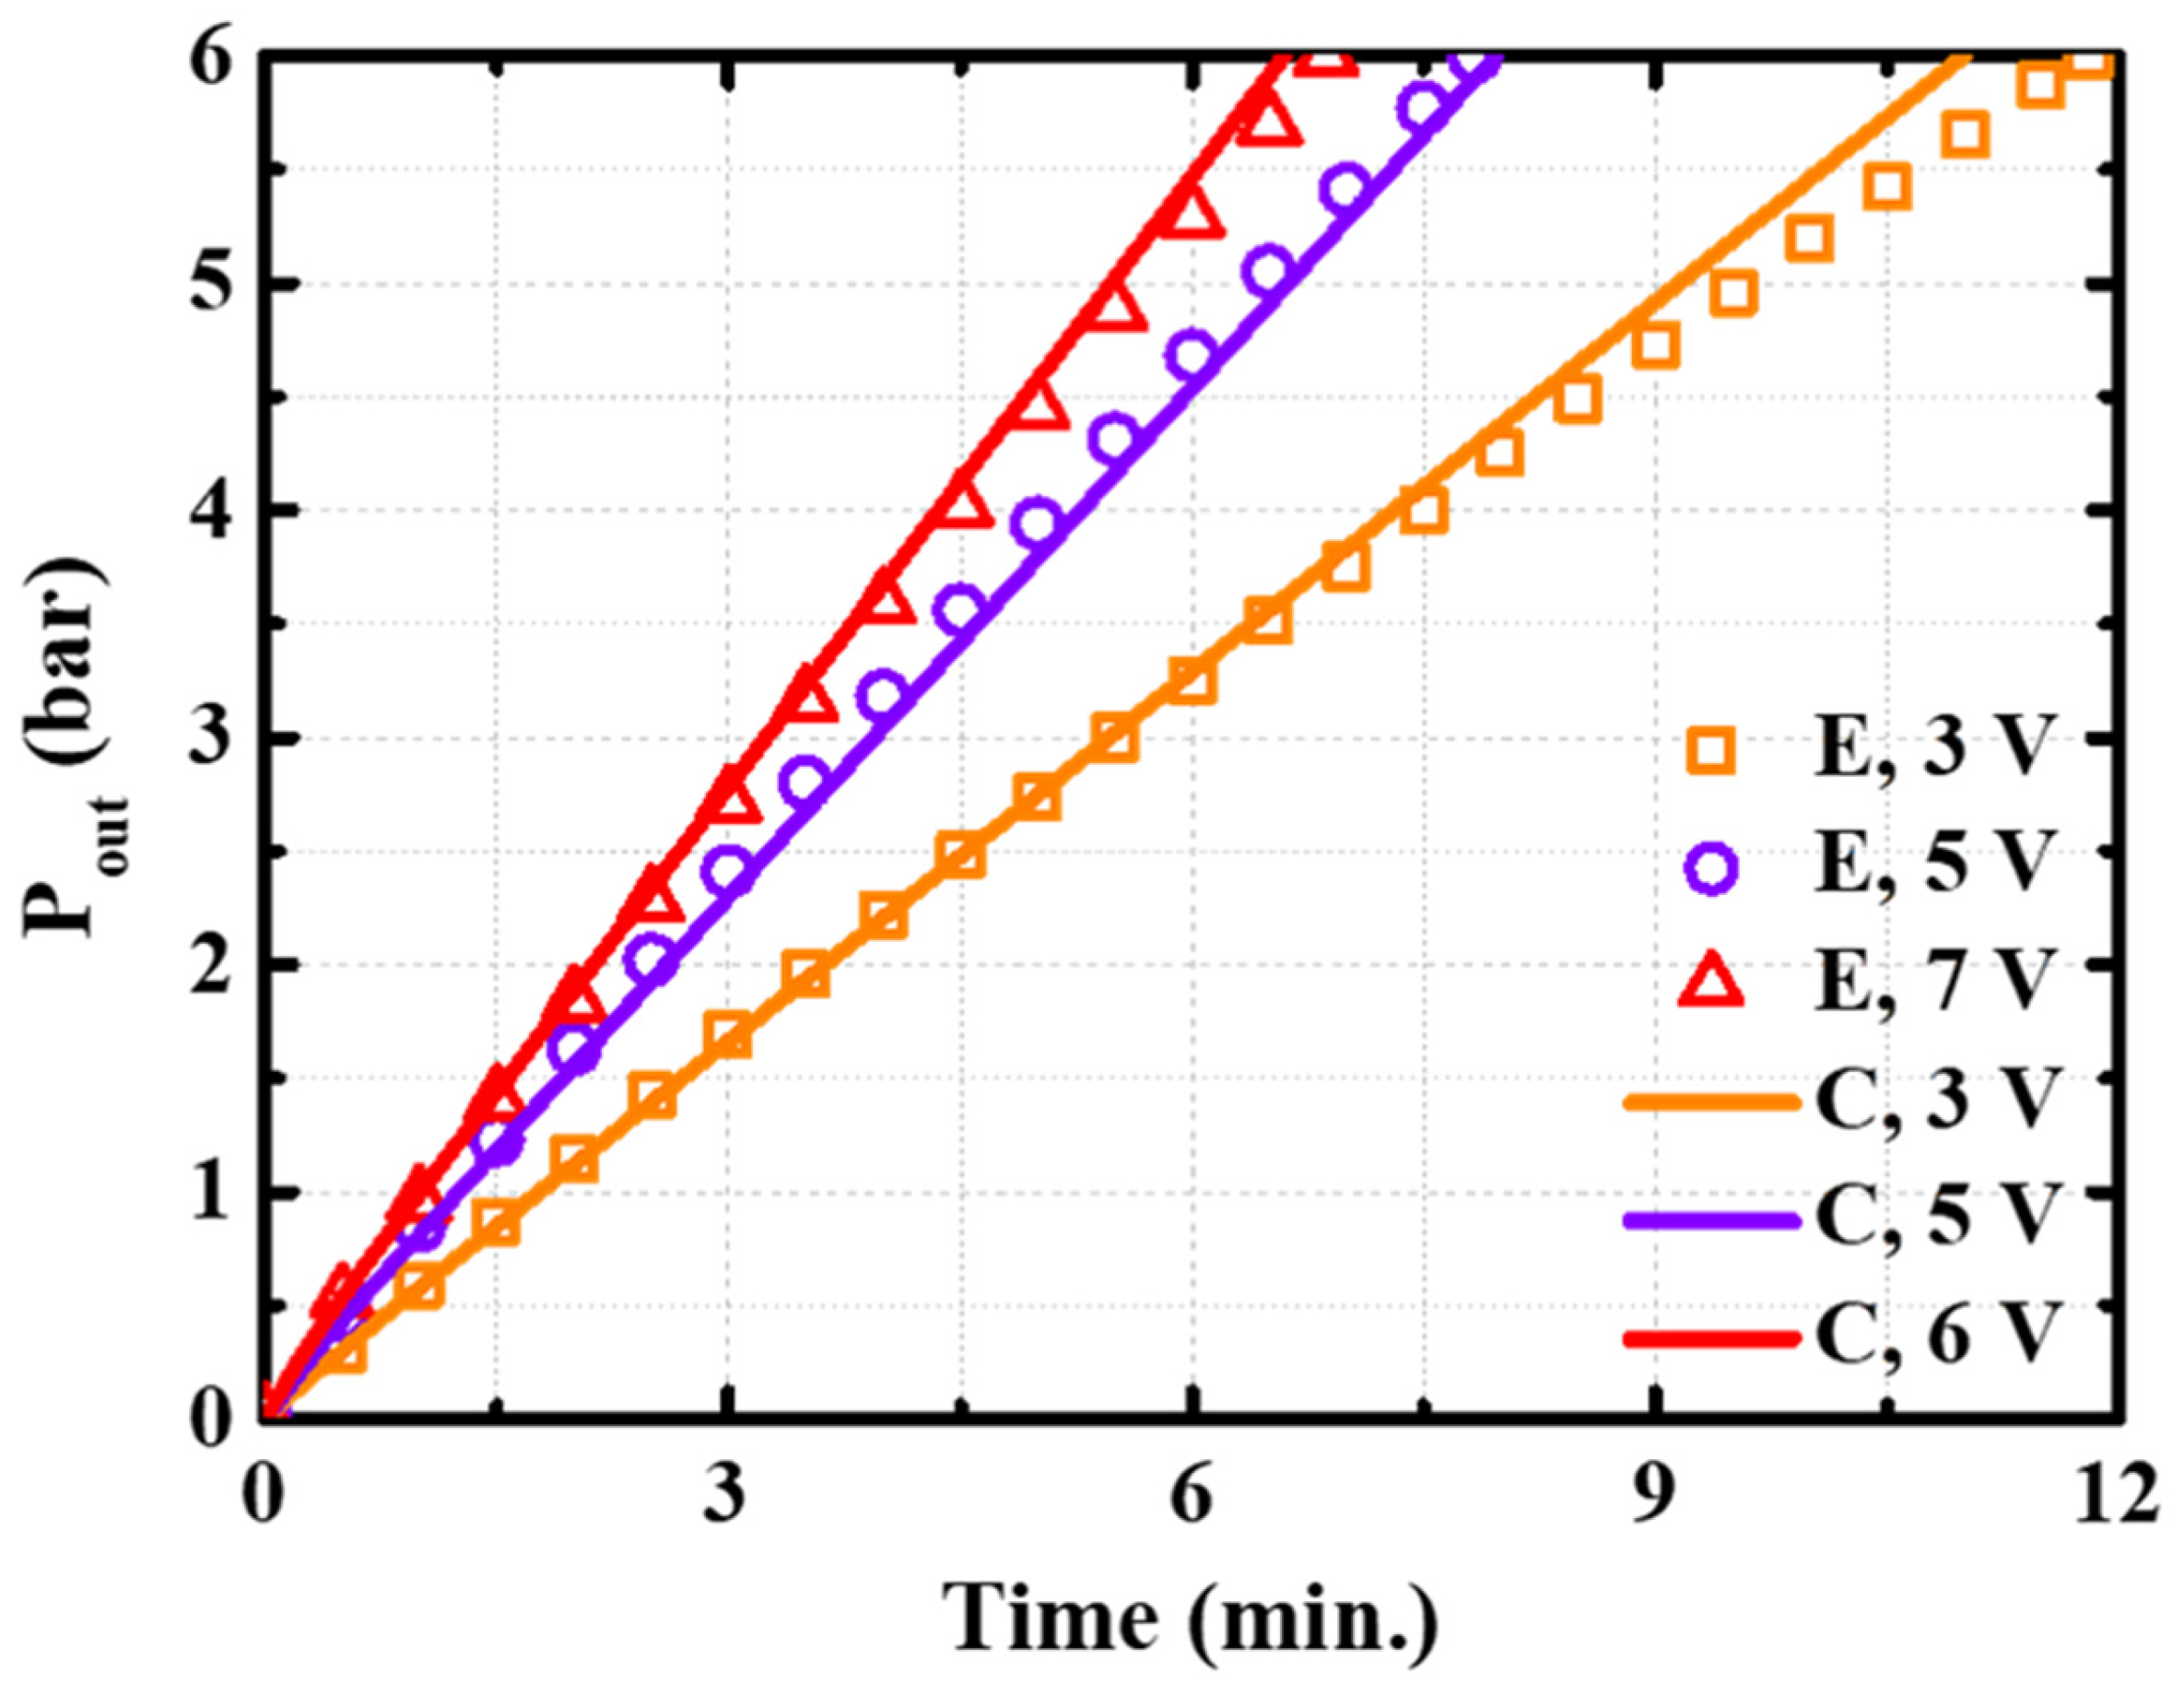
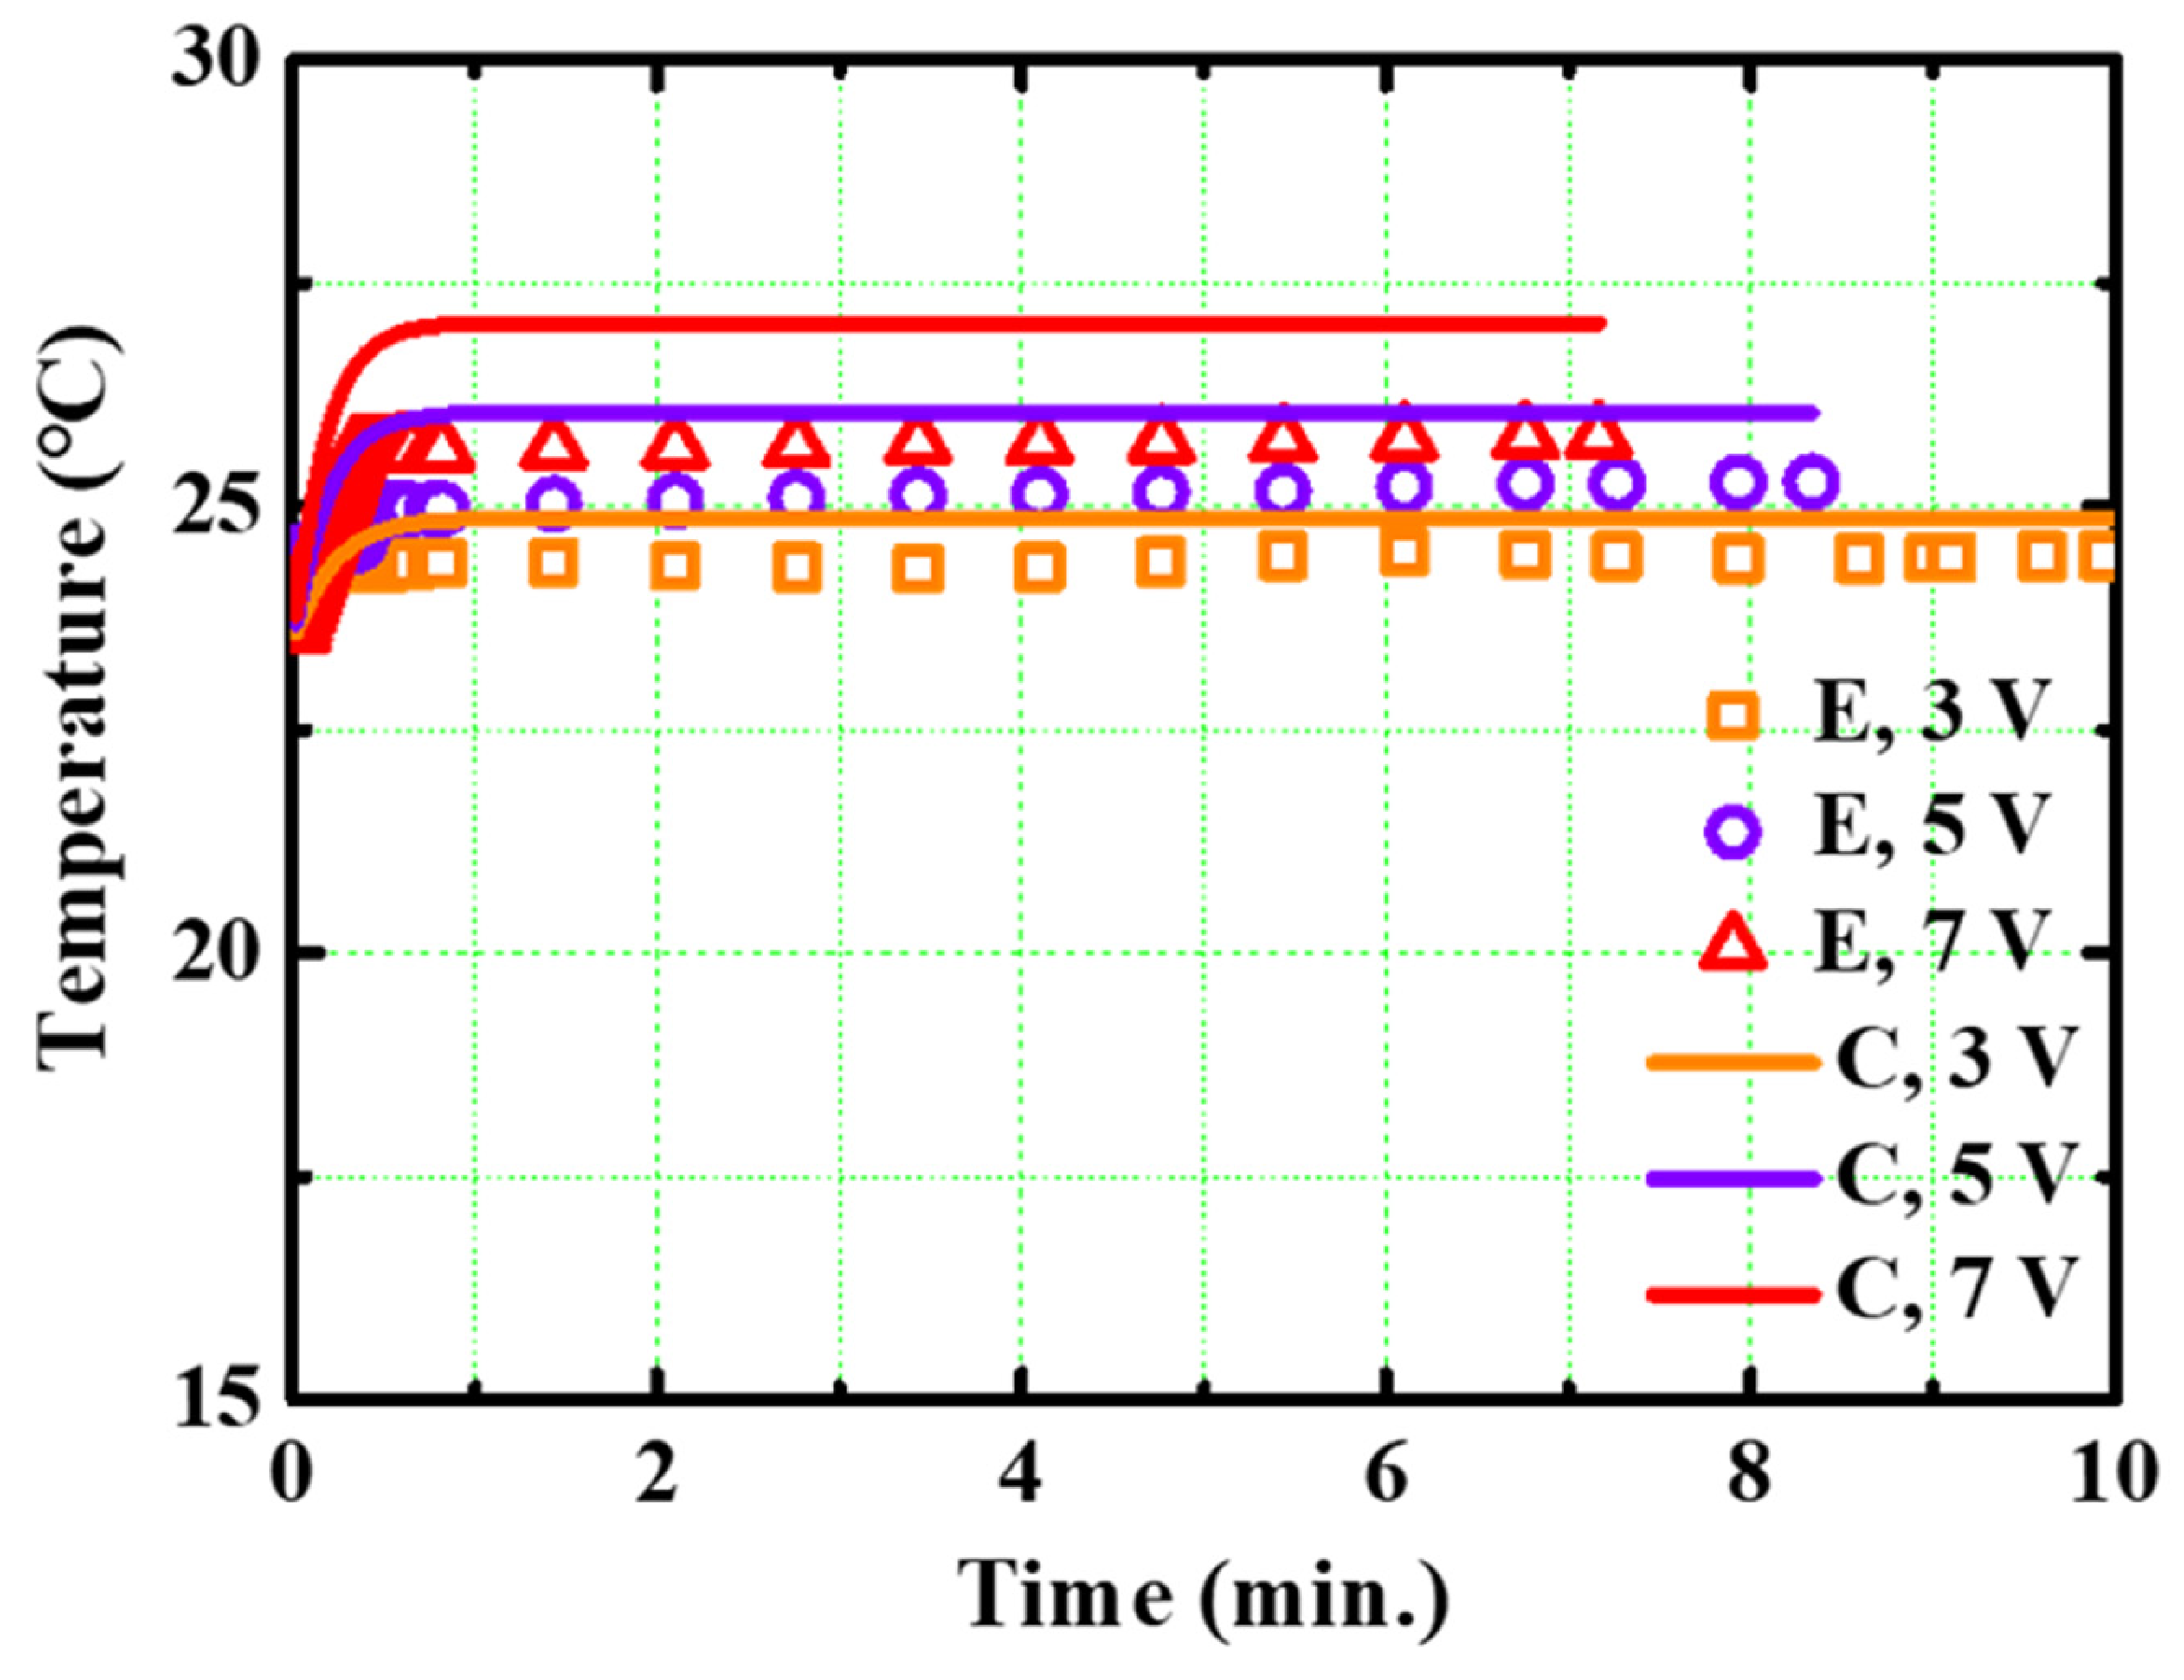
  • The cathode pressure, temperature, and polarization curves of the SC–SP device were theoretically calculated, and the results were in good agreement with the experimental results;
  • The simulation results revealed that industrial hydrogen tanks require at least 20 h, 4 h, and 24 min to reach commercial pressures of 700–800 bar at applied voltages of 3 V, 30 V, and 300 V, respectively, and that commercial EHCs require at least 30 V to reduce the time needed;
  • EHCs have a high compression efficiency of 86% or more.
The findings of this study are expected to be helpful in the commercialization of EHCs.

Author Contributions

Conceptualization, R.Y. and K.K.; methodology, R.Y.; software, R.Y.; validation, R.Y.; formal analysis, R.Y. and K.K.; investigation, R.Y.; resources, K.K.; data curation, R.Y.; experimental work, R.Y. and H.K. writing—original draft preparation, R.Y.; writing—review and editing, K.K.; visualization, R.Y.; supervision, K.K.; project administration, K.K.; funding acquisition, K.K. All authors have read and agreed to the published version of the manuscript.

Funding

This work was supported by the National Research Foundation of Korea (NRF) grant funded by the Korean government (2019R1D1A3A03103616). This work was conducted during the research year of Chungbuk National University in 2022.

Data Availability Statement

The data used in this research is collected by the authors themselves.

Conflicts of Interest

The authors declare no competing financial interest.

Nomenclatures

AArea,  m 2 P H 2 o u t Pressure at hydrogen outlet,  N / m 2
c p Specific heat,  J / kg · k QHeat rate, W
dDiameter, m Q i n Heat generated rate, W
eElectrons Q o u t Heat released rate, W
FFaraday constant, 96,500 C/molqHeat flux rate, W/ m 2
gAcceleration of gravityRUniversal gas constant, J/mol  ·  K
hHeat transfer coefficient, W/ m 2 · K rResistance, Ω
iCurrent density, A/ cm 2 TStatic temperature, K
ICurrent T 0 Ambient temperature, K
J H 2 , T h e o r e t i c a l Theoretical amount of compressed hydrogen gas T o u t Outlet temperature, K
J H 2 , M e a s u r e d Measured amount of compressed hydrogen gastTime, sec
KThermal conductivity, W/m·K U c e l l Power supply voltage,  V
LPipe length, m U 0 Initial voltage,  V
mMass, kgVVolume
MRelative molecular mass V t Operating voltage,  V
nAmount of matter V o c Open-circuit Volume,  V
NAAvogadro constant V a c t Activation overpotential,  V
PStatic pressure,  N / m 2 V c o n Concentration overpotential,  V
P H 2 i n Pressure at the hydrogen inlet,   N / m 2 V o h m Ohmic overpotential,   V

References

  1. Xu, X.; Zhou, Q.; Yu, D. The Future of Hydrogen Energy: Bio-Hydrogen Production Technology. Int. J. Hydrogen Energy 2022, 47, 33677–33698. [Google Scholar] [CrossRef]
  2. Arsad, A.Z.; Hannan, M.A.; Al-Shetwi, A.Q.; Mansur, M.; Muttaqi, K.M.; Dong, Z.Y.; Blaabjerg, F. Hydrogen Energy Storage Integrated Hybrid Renewable Energy Systems: A Review Analysis for Future Research Directions. Int. J. Hydrogen Energy 2022, 47, 17285–17312. [Google Scholar] [CrossRef]
  3. Dutta, S. A Review on Production, Storage of Hydrogen and Its Utilization as an Energy Resource. J. Ind. Eng. Chem. 2014, 20, 1148–1156. [Google Scholar] [CrossRef]
  4. Nordio, M.; Rizzi, F.; Manzolini, G.; Mulder, M.; Raymakers, L.; Van Sint Annaland, M.; Gallucci, F. Experimental and Modelling Study of an Electrochemical Hydrogen Compressor. Chem. Eng. J. 2019, 369, 432–442. [Google Scholar] [CrossRef]
  5. Zhou, L. Progress and Problems in Hydrogen Storage Methods. Renew. Sustain. Energy Rev. 2005, 9, 395–408. [Google Scholar] [CrossRef]
  6. Dale, N.V.; Mann, M.D.; Salehfar, H.; Dhirde, A.M.; Han, T. Modeling and Analysis of Electrochemical Hydrogen Compression. In Proceedings of the NHA Annual Hydrogen Conference, San Antonio, TX, USA, 19–22 March 2007; p. 30. [Google Scholar]
  7. Tzimas, E.; Filiou, C.; Peteves, S.D.; Veyret, J. Hydrogen Storage: State-of-the-Art and Future Perspective; Office for Official Publications of the European Communities: Luxembourg, 2003; ISBN 9289469501. [Google Scholar]
  8. Abdin, Z.; Webb, C.J.; Gray, E.M. Modelling and Simulation of a Proton Exchange Membrane (PEM) Electrolyser Cell. Int. J. Hydrogen Energy 2015, 40, 13243–13257. [Google Scholar] [CrossRef]
  9. Zou, J.; Han, N.; Yan, J.; Feng, Q.; Wang, Y.; Zhao, Z.; Fan, J.; Zeng, L.; Li, H.; Wang, H. Electrochemical Compression Technologies for High-Pressure Hydrogen: Current Status, Challenges and Perspective. Electrochem. Energy Rev. 2020, 3, 690–729. [Google Scholar] [CrossRef]
  10. Ströbel, R.; Oszcipok, M.; Fasil, M.; Rohland, B.; Jörissen, L.; Garche, J. The Compression of Hydrogen in an Electrochemical Cell Based on a PE Fuel Cell Design. J. Power Sources 2002, 105, 208–215. [Google Scholar] [CrossRef]
  11. Barbir, F.; Görgün, H. Electrochemical Hydrogen Pump for Recirculation of Hydrogen in a Fuel Cell Stack. J. Appl. Electrochem. 2007, 37, 359–365. [Google Scholar] [CrossRef]
  12. Lee, H.K.; Choi, H.Y.; Choi, K.H.; Park, J.H.; Lee, T.H. Hydrogen Separation Using Electrochemical Method. J. Power Sources 2004, 132, 92–98. [Google Scholar] [CrossRef]
  13. Jakobsen, M.T.D.; Jensen, J.O.; Cleemann, L.N.; Li, Q. Durability Issues and Status of PBI-Based Fuel Cells; Springer: Berlin/Heidelberg, Germany, 2016; ISBN 9783319170824. [Google Scholar]
  14. Yáñez, M.; Relvas, F.; Ortiz, A.; Gorri, D.; Mendes, A.; Ortiz, I. PSA Purification of Waste Hydrogen from Ammonia Plants to Fuel Cell Grade. Sep. Purif. Technol. 2020, 240, 116334. [Google Scholar] [CrossRef]
  15. Nguyen, M.T.; Grigoriev, S.A.; Kalinnikov, A.A.; Filippov, A.A.; Millet, P.; Fateev, V.N. Characterisation of a Electrochemical Hydrogen Pump Using Electrochemical Impedance Spectroscopy. J. Appl. Electrochem. 2011, 41, 1033–1042. [Google Scholar] [CrossRef]
  16. Gardner, C.L.; Ternan, M. Electrochemical Separation of Hydrogen from Reformate Using PEM Fuel Cell Technology. J. Power Sources 2007, 171, 835–841. [Google Scholar] [CrossRef]
  17. Doucet, R.; Gardner, C.L.; Ternan, M. Separation of Hydrogen from Hydrogen/Ethylene Mixtures Using PEM Fuel Cell Technology. Int. J. Hydrogen Energy 2009, 34, 998–1007. [Google Scholar] [CrossRef]
  18. Onda, K.; Araki, T.; Ichihara, K.; Nagahama, M. Treatment of Low Concentration Hydrogen by Electrochemical Pump or Proton Exchange Membrane Fuel Cell. J. Power Sources 2009, 188, 1–7. [Google Scholar] [CrossRef]
  19. Sedlak, J.M.; Austin, J.F.; LaConti, A.B. Hydrogen recovery and purification using the solid polymer electrolyte electrolysis cell. Int. J. Hydrogen Energy 1981, 6, 45–51. [Google Scholar] [CrossRef]
  20. Durmus, G.N.B.; Colpan, C.O.; Devrim, Y. A Review on the Development of the Electrochemical Hydrogen Compressors. J. Power Sources 2021, 494, 229743. [Google Scholar] [CrossRef]
  21. Marciuš, D.; Kovač, A.; Firak, M. Electrochemical Hydrogen Compressor: Recent Progress and Challenges. Int. J. Hydrogen Energy 2022, 47, 24179–24193. [Google Scholar] [CrossRef]
  22. Marangio, F.; Santarelli, M.; Calì, M. Theoretical Model and Experimental Analysis of a High Pressure PEM Water Electrolyser for Hydrogen Production. Int. J. Hydrogen Energy 2009, 34, 1143–1158. [Google Scholar] [CrossRef]
  23. Rohland, B.; Eberle, K.; Ströbel, R.; Scholta, J.; Garche, J. Electrochemical Hydrogen Compressor. Electrochim. Acta 1998, 43, 3841–3846. [Google Scholar] [CrossRef]
  24. Mantell, C.L. Electrochemical Engineering; McGraw Hill: New York, NY, USA, 1960. [Google Scholar]
  25. Ball, S.C. 10th Ulm Electrochemical Talks: PGMS Feature in Reliability and Durability Gains and Cost Reduction for Electrochemical Energy Storage and Conversion. Platin. Met. Rev. 2006, 50, 202–204. [Google Scholar] [CrossRef]
  26. Zawodzinski, T.A.; Derouin, C.; Radzinski, S.; Sherman, R.J.; Smith, V.T.; Springer, T.E.; Gottesfeld, S. Water Uptake by and Transport through Nafion® 117 Membranes. J. Electrochem. Soc. 1993, 140, 1041–1047. [Google Scholar] [CrossRef]
  27. Marković, N.M.; Grgur, B.N.; Ross, P.N. Temperature-Dependent Hydrogen Electrochemistry on Platinum Low-Index Single-Crystal Surfaces in Acid Solutions. J. Phys. Chem. B 1997, 101, 5405–5413. [Google Scholar] [CrossRef]
  28. Hao, Y.M.; Nakajima, H.; Yoshizumi, H.; Inada, A.; Sasaki, K.; Ito, K. Characterization of an Electrochemical Hydrogen Pump with Internal Humidifier and Dead-End Anode Channel. Int. J. Hydrogen Energy 2016, 41, 13879–13887. [Google Scholar] [CrossRef]
  29. Pitts, D.R.; Sissom, L.E. Schaum’s Outline of Theory and Problems of Heat Transfer; McGraw-Hill Companies, Inc.: New York, NY, USA, 1998. [Google Scholar]
  30. Nordio, M.; Eguaras Barain, M.; Raymakers, L.; Van Sint Annaland, M.; Mulder, M.; Gallucci, F. Effect of CO2 on the Performance of an Electrochemical Hydrogen Compressor. Chem. Eng. J. 2020, 392, 123647. [Google Scholar] [CrossRef]
  31. Chouhan, A.; Bahar, B.; Prasad, A.K. Effect of Back-Diffusion on the Performance of an Electrochemical Hydrogen Compressor. Int. J. Hydrogen Energy 2020, 45, 10991–10999. [Google Scholar] [CrossRef]
  32. Dornheim, M.; Baetcke, L.; Akiba, E.; Ares, J.R.; Autrey, T.; Barale, J.; Baricco, M.; Brooks, K.; Chalkiadakis, N.; Charbonnier, V.; et al. Research and Development of Hydrogen Carrier Based Solutions for Hydrogen Compression and Storage. Prog. Energy 2022, 4, 042005. [Google Scholar] [CrossRef]
Figure 1. Experimental equipment: (a) SC–SP, (b) DC–SP, and (c) DC–DP systems.
Energies 16 03128 g001
Figure 2. EHC design and principle.
Energies 16 03128 g002
Figure 3. Flow chart of the analytical model.
Energies 16 03128 g003
Figure 4. (a) Effect of the presence or absence of air in the anode on the cathode pressure at an inlet pressure of 1 bar. (b) Anode chamber without air removed. (c) Anode chamber with air removed.
Energies 16 03128 g004
Figure 5. Variation of cathode pressure at 3 V for three experimental setups (a) SC-SP, (b) DC-SP, and (c) DC-DP.
Energies 16 03128 g005
Figure 6. The DC–DP system, applying a constant current and voltage at an anode pressure of 1 bar. (a) Compression rate when a constant current or constant voltage is applied. (b) Voltage changes as a function of the cathode pressure when a constant current is applied.
Energies 16 03128 g006
Figure 7. Comparison between the three experimental setups.
Energies 16 03128 g007
Figure 8. Comparison of the experimental and simulation results on cathode pressure.
Energies 16 03128 g008
Figure 9. Comparison of the experimental and simulation results on the cathode temperature.
Energies 16 03128 g009
Figure 10. Polarization curves obtained through experiment and simulation.
Energies 16 03128 g010
Figure 11. Compression efficiency when the anode pressure was 1 bar and the applied voltage was 3, 5, and 7 V.
Energies 16 03128 g011
Figure 12. Time required to reach a pressure of 700 bar at different voltages.
Energies 16 03128 g012
Disclaimer/Publisher’s Note: The statements, opinions and data contained in all publications are solely those of the individual author(s) and contributor(s) and not of MDPI and/or the editor(s). MDPI and/or the editor(s) disclaim responsibility for any injury to people or property resulting from any ideas, methods, instructions or products referred to in the content.

