

Experimental Study of the Shear Characteristics of Fault Filled with Different Types of Gouge in Underground Gas Storage
 , ,
, ,
Abstract
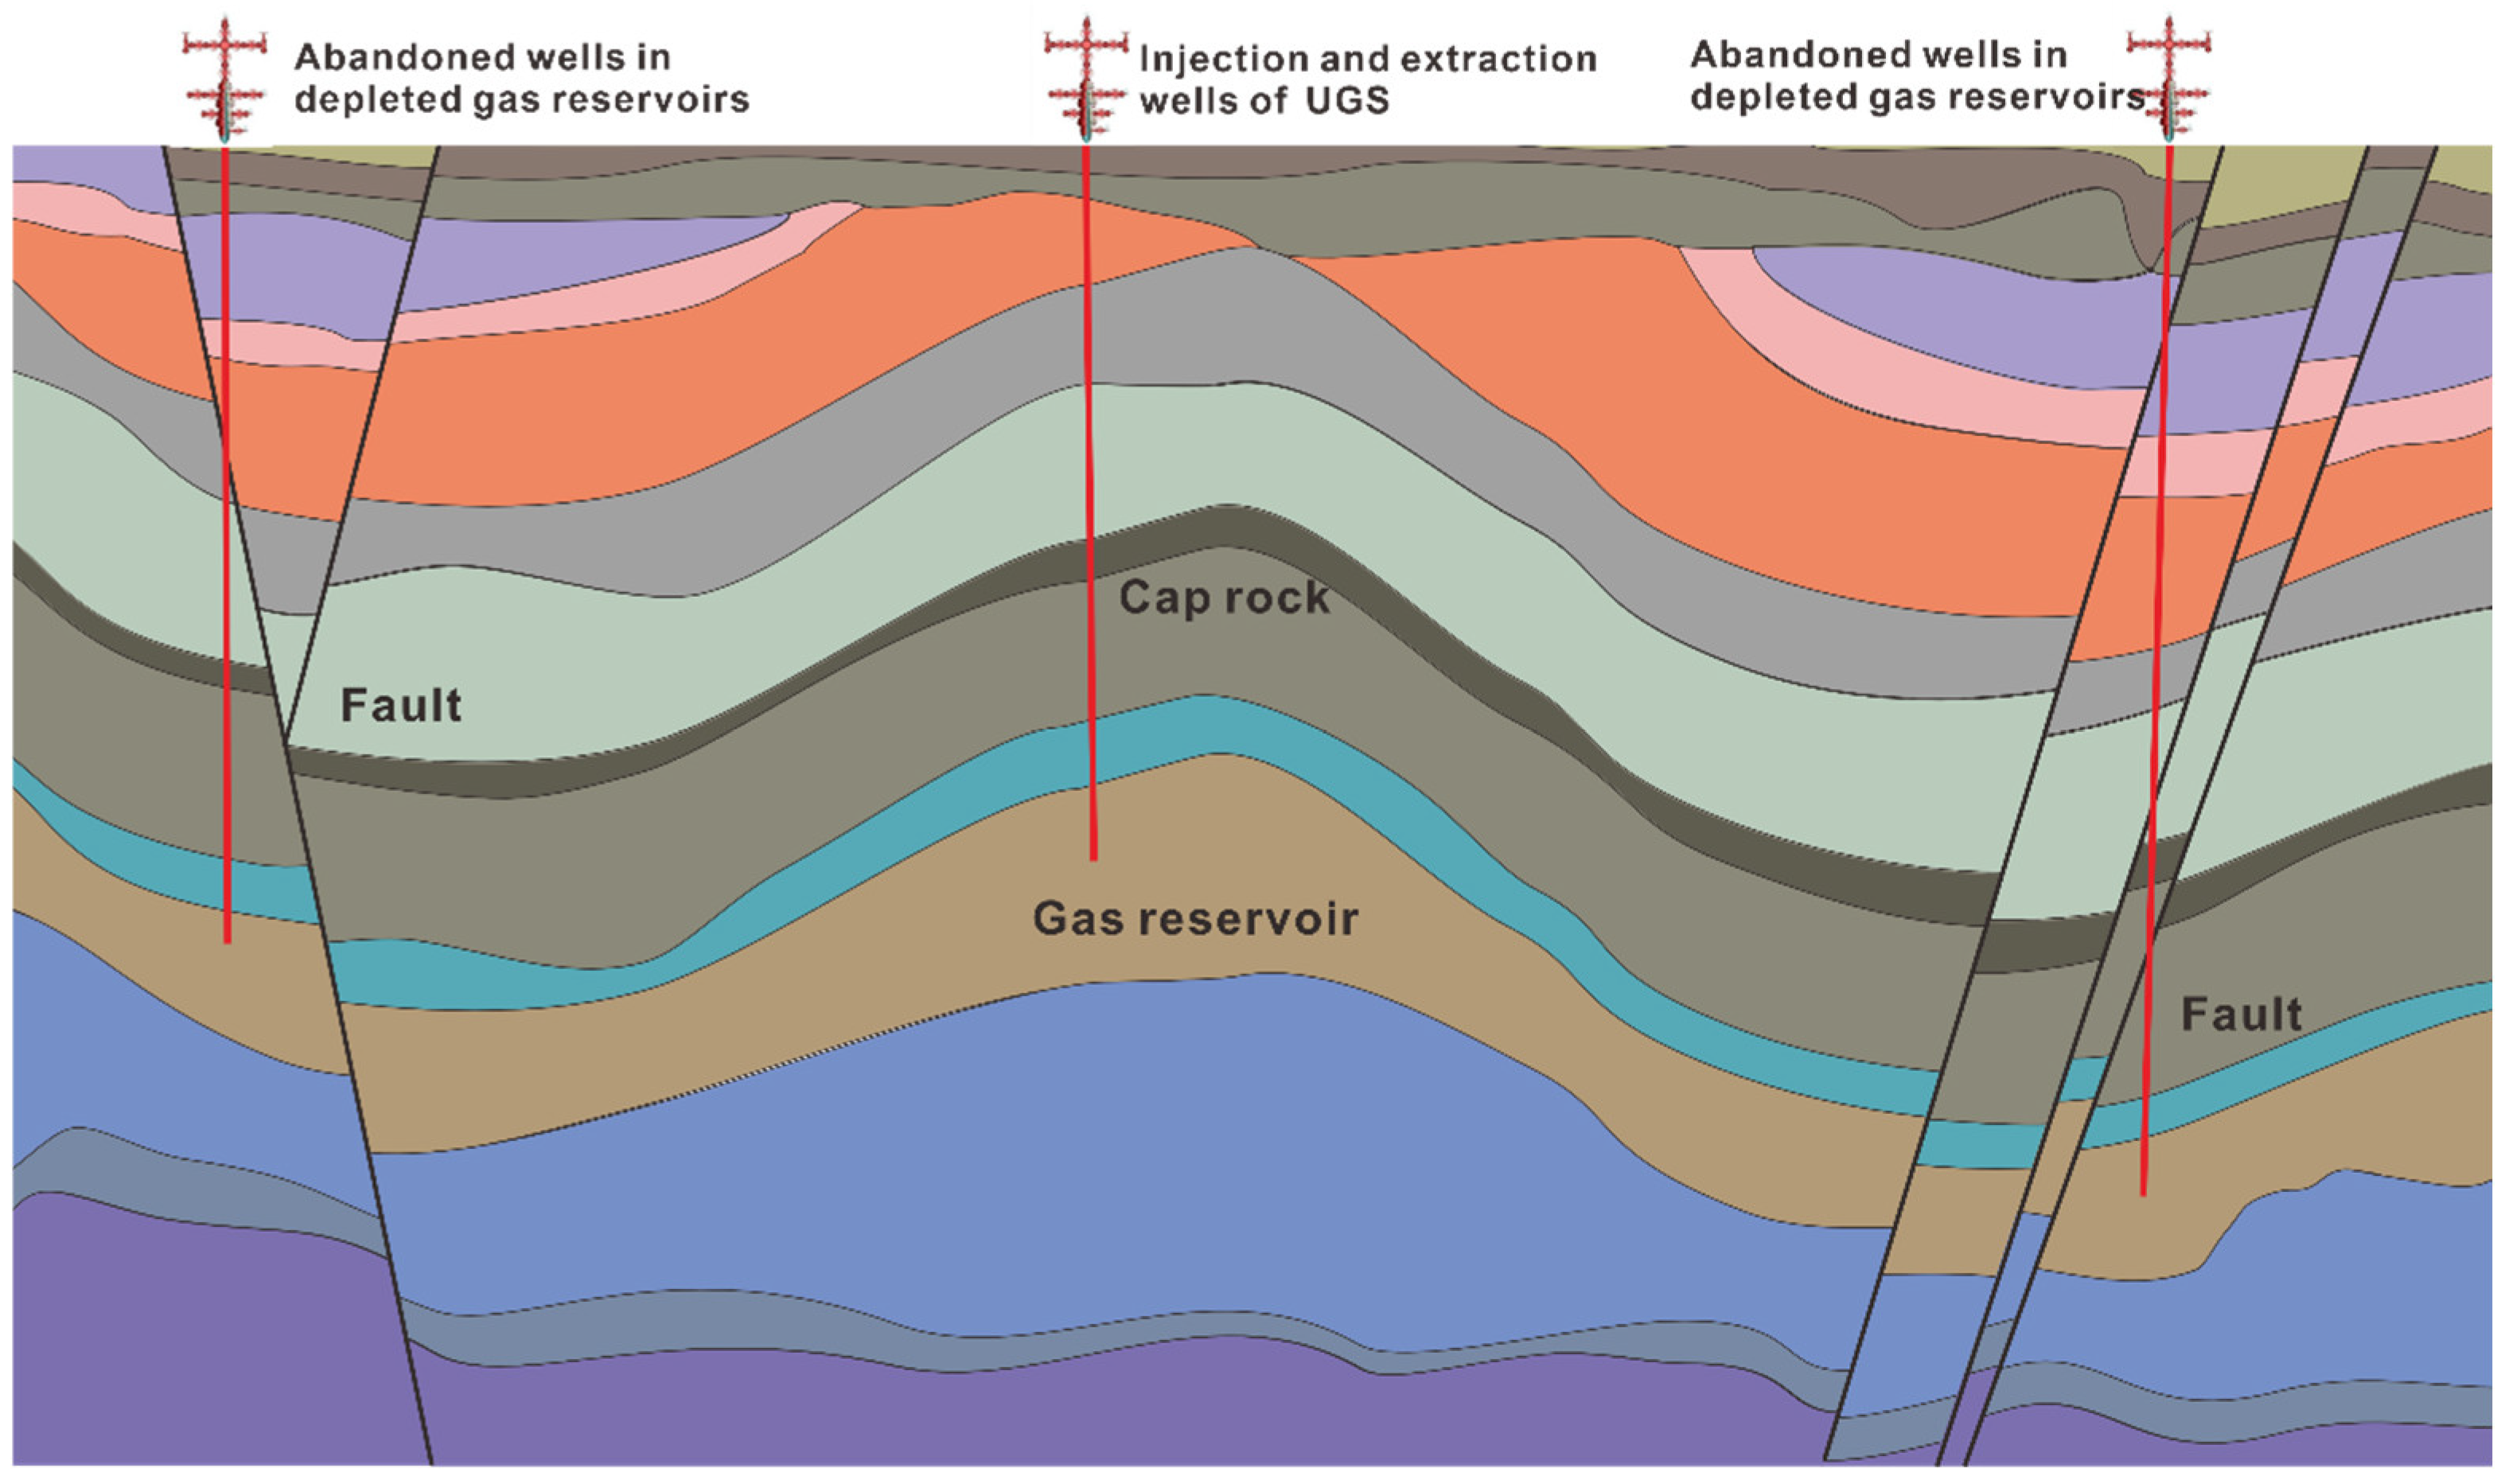
:1. Introduction
2. Fault Rock Shear Experiment
2.1. Experimental Scheme Design
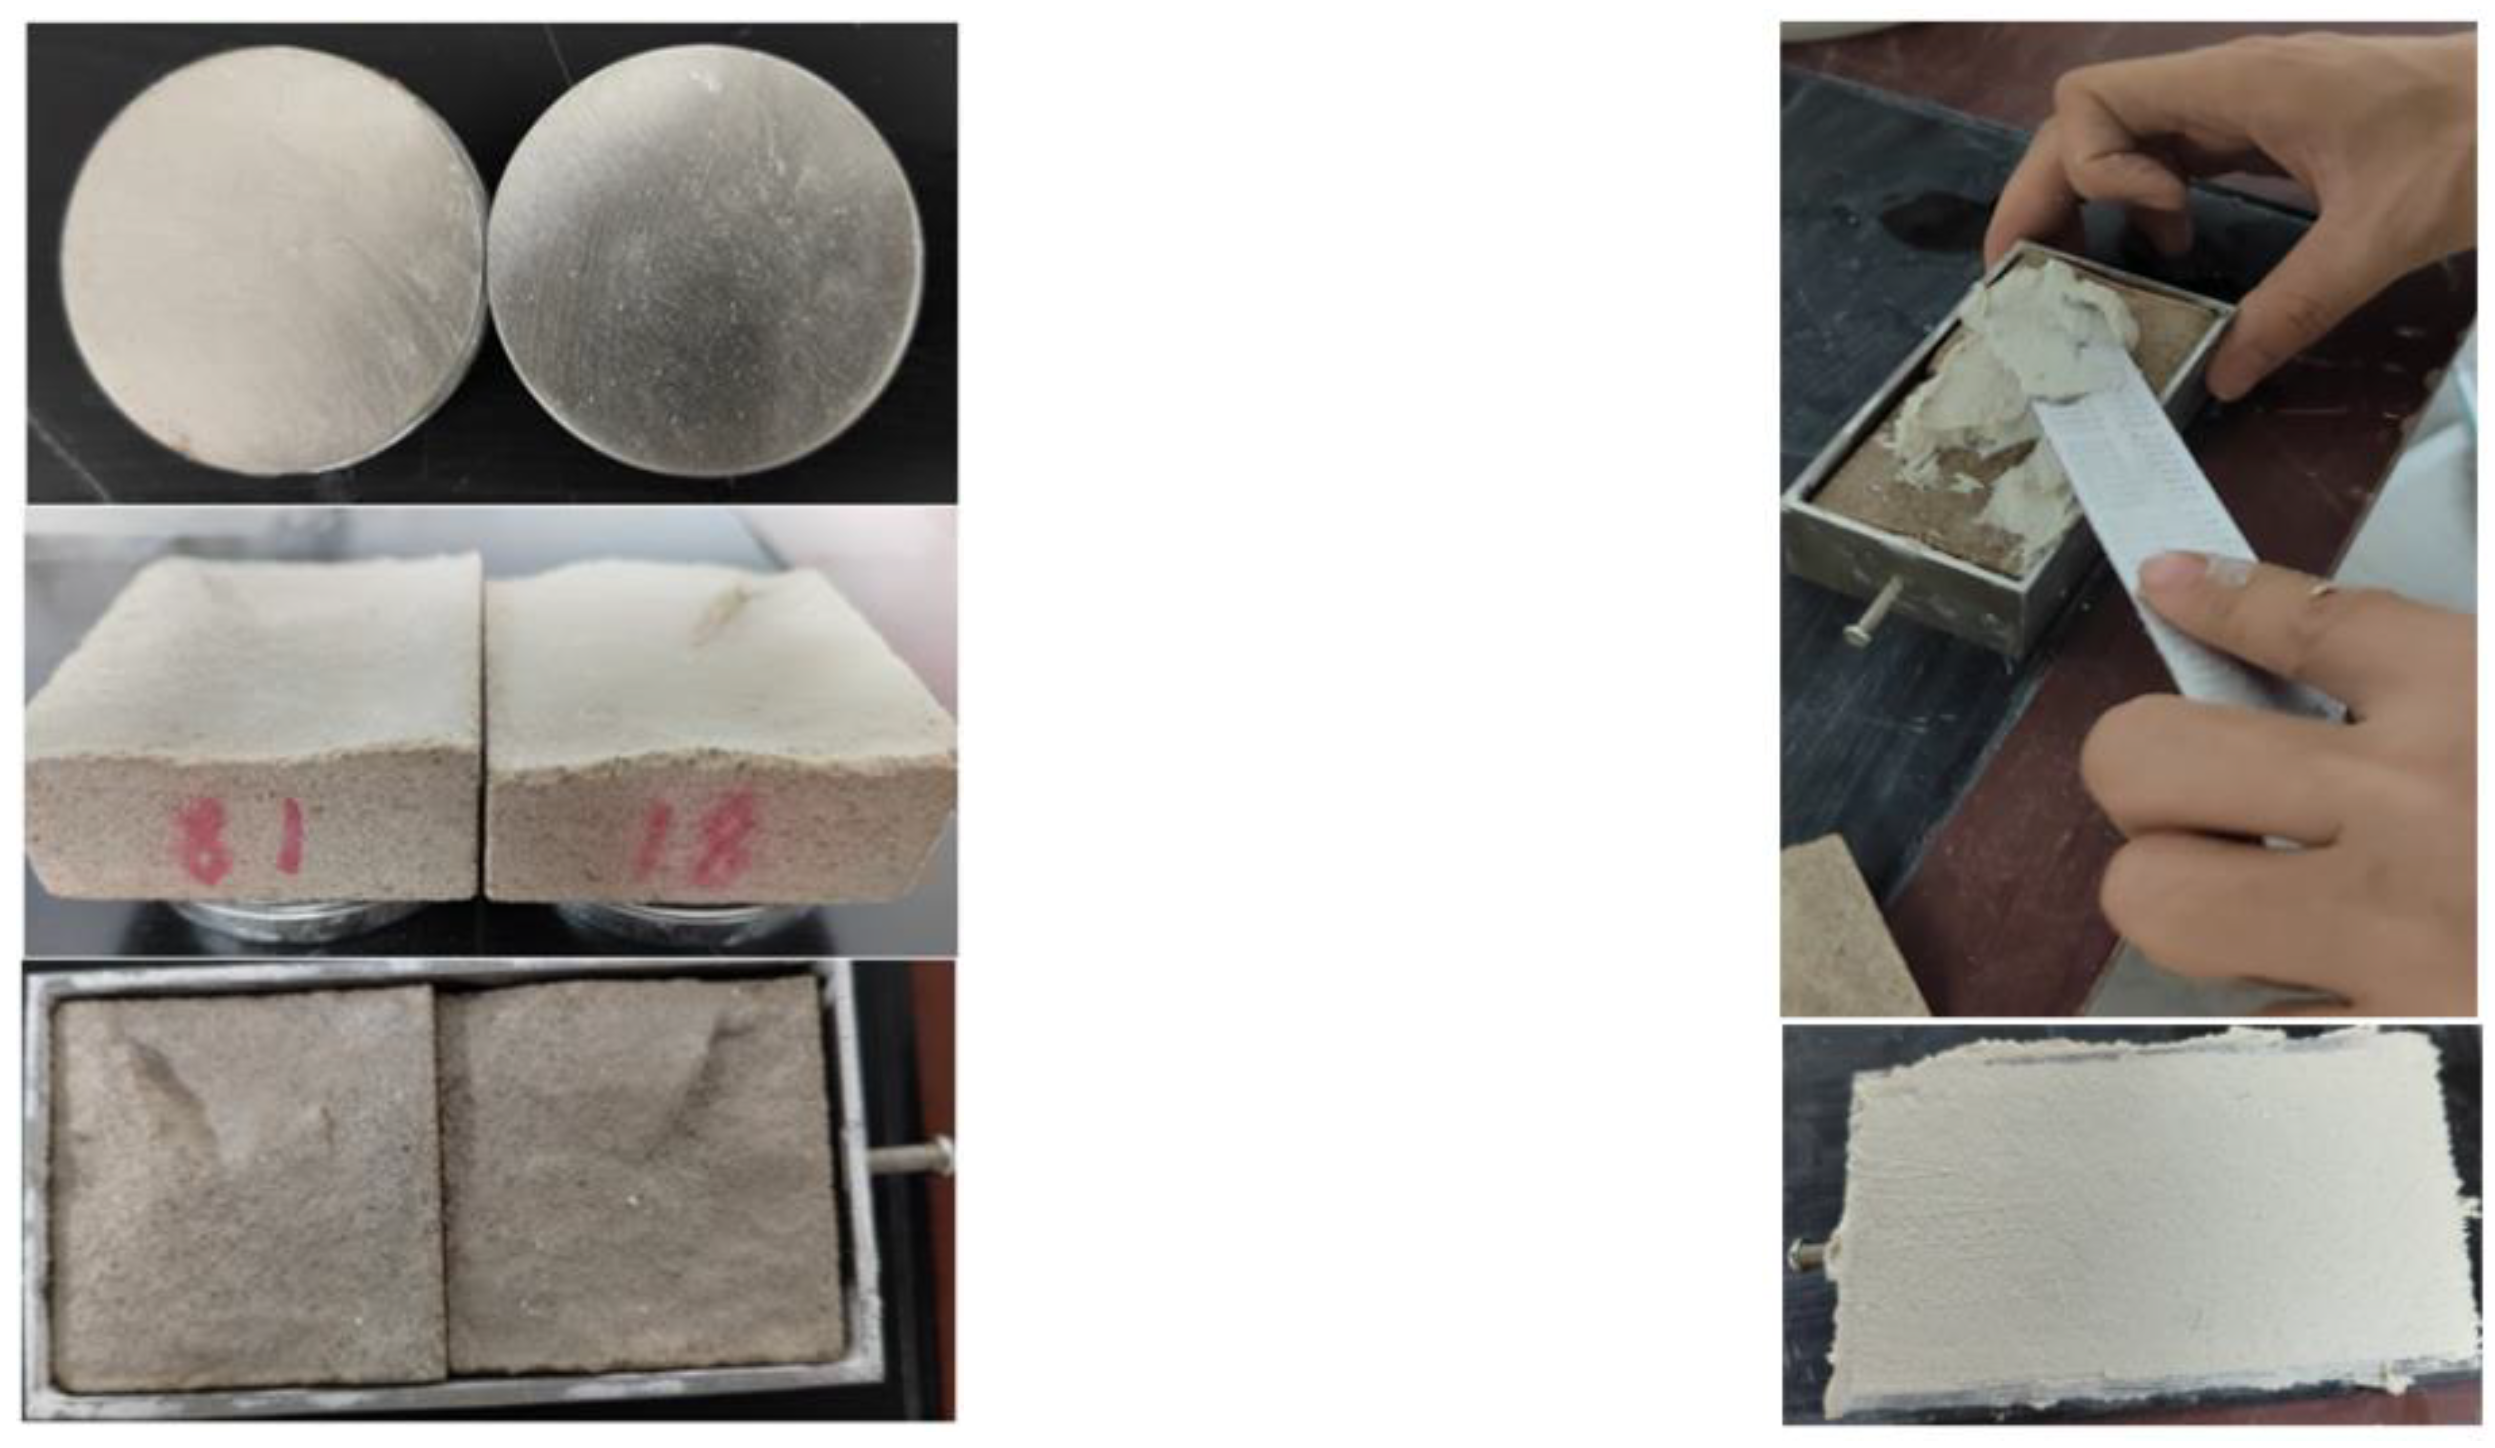
2.2. Experimental Sample Preparation
2.2.1. Preparation of Fault Plane
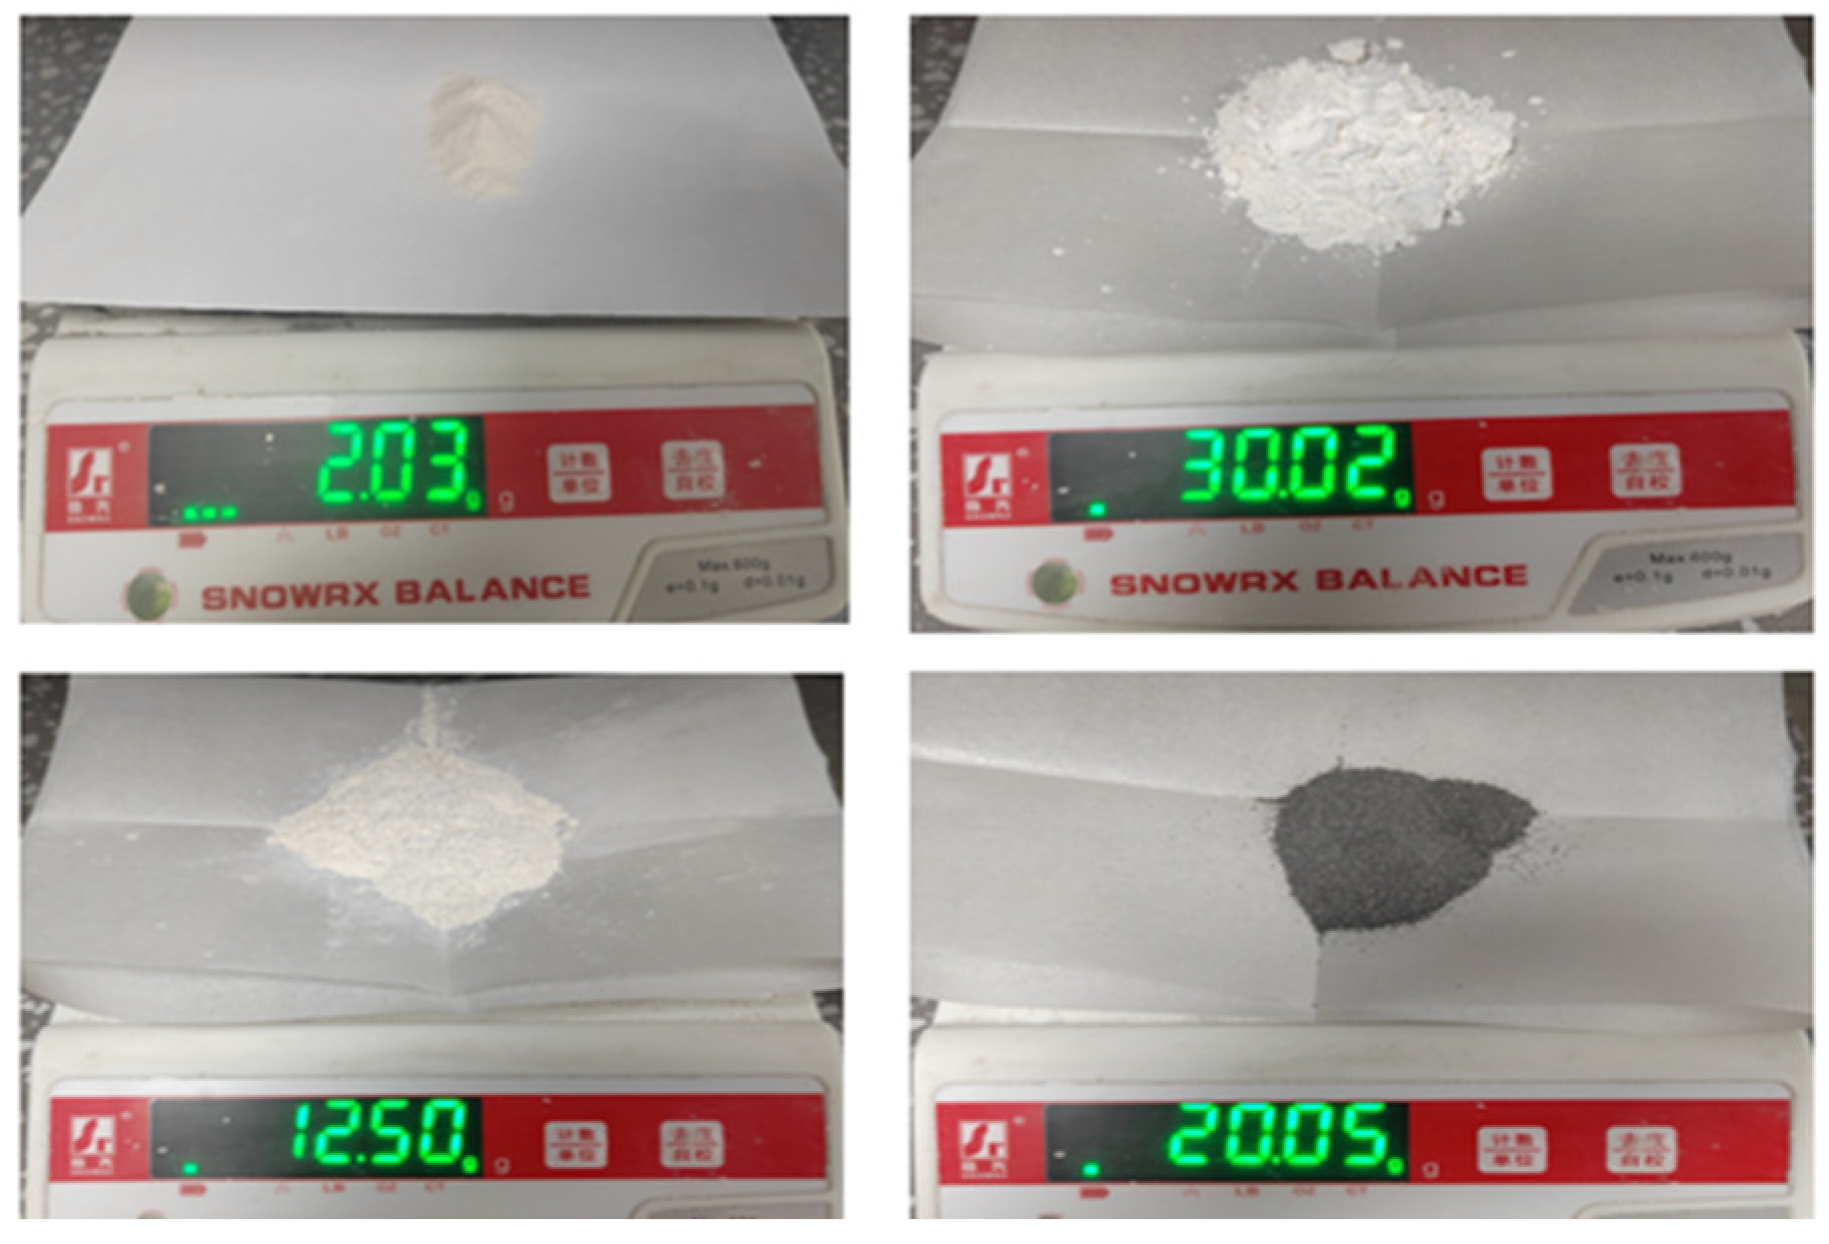
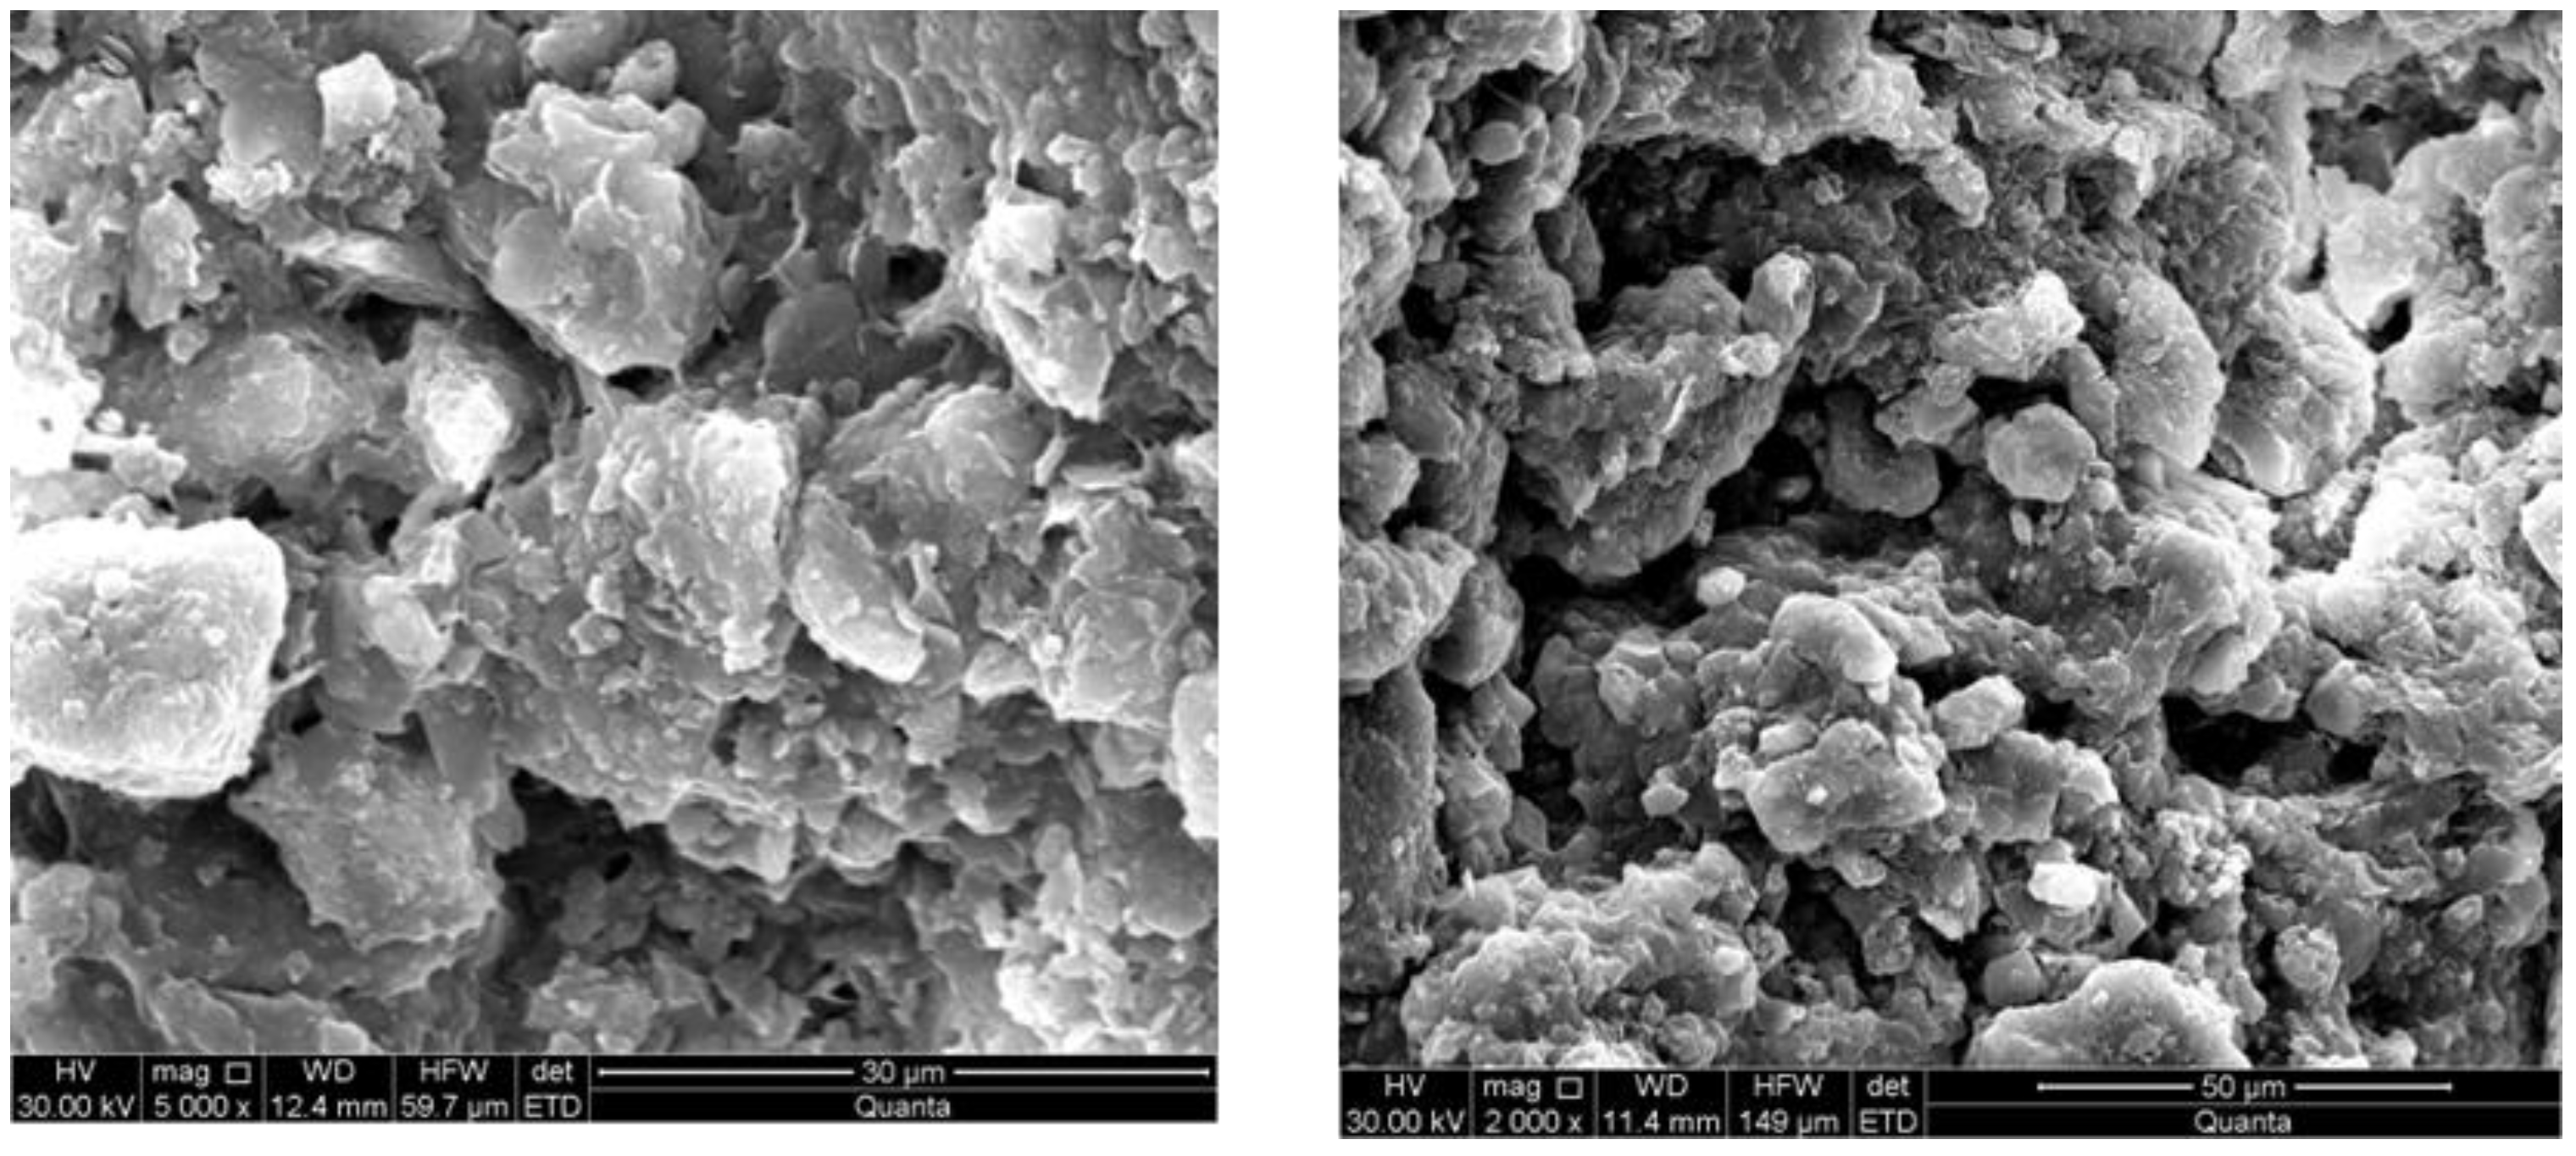
2.2.2. Fault Gouge Configuration
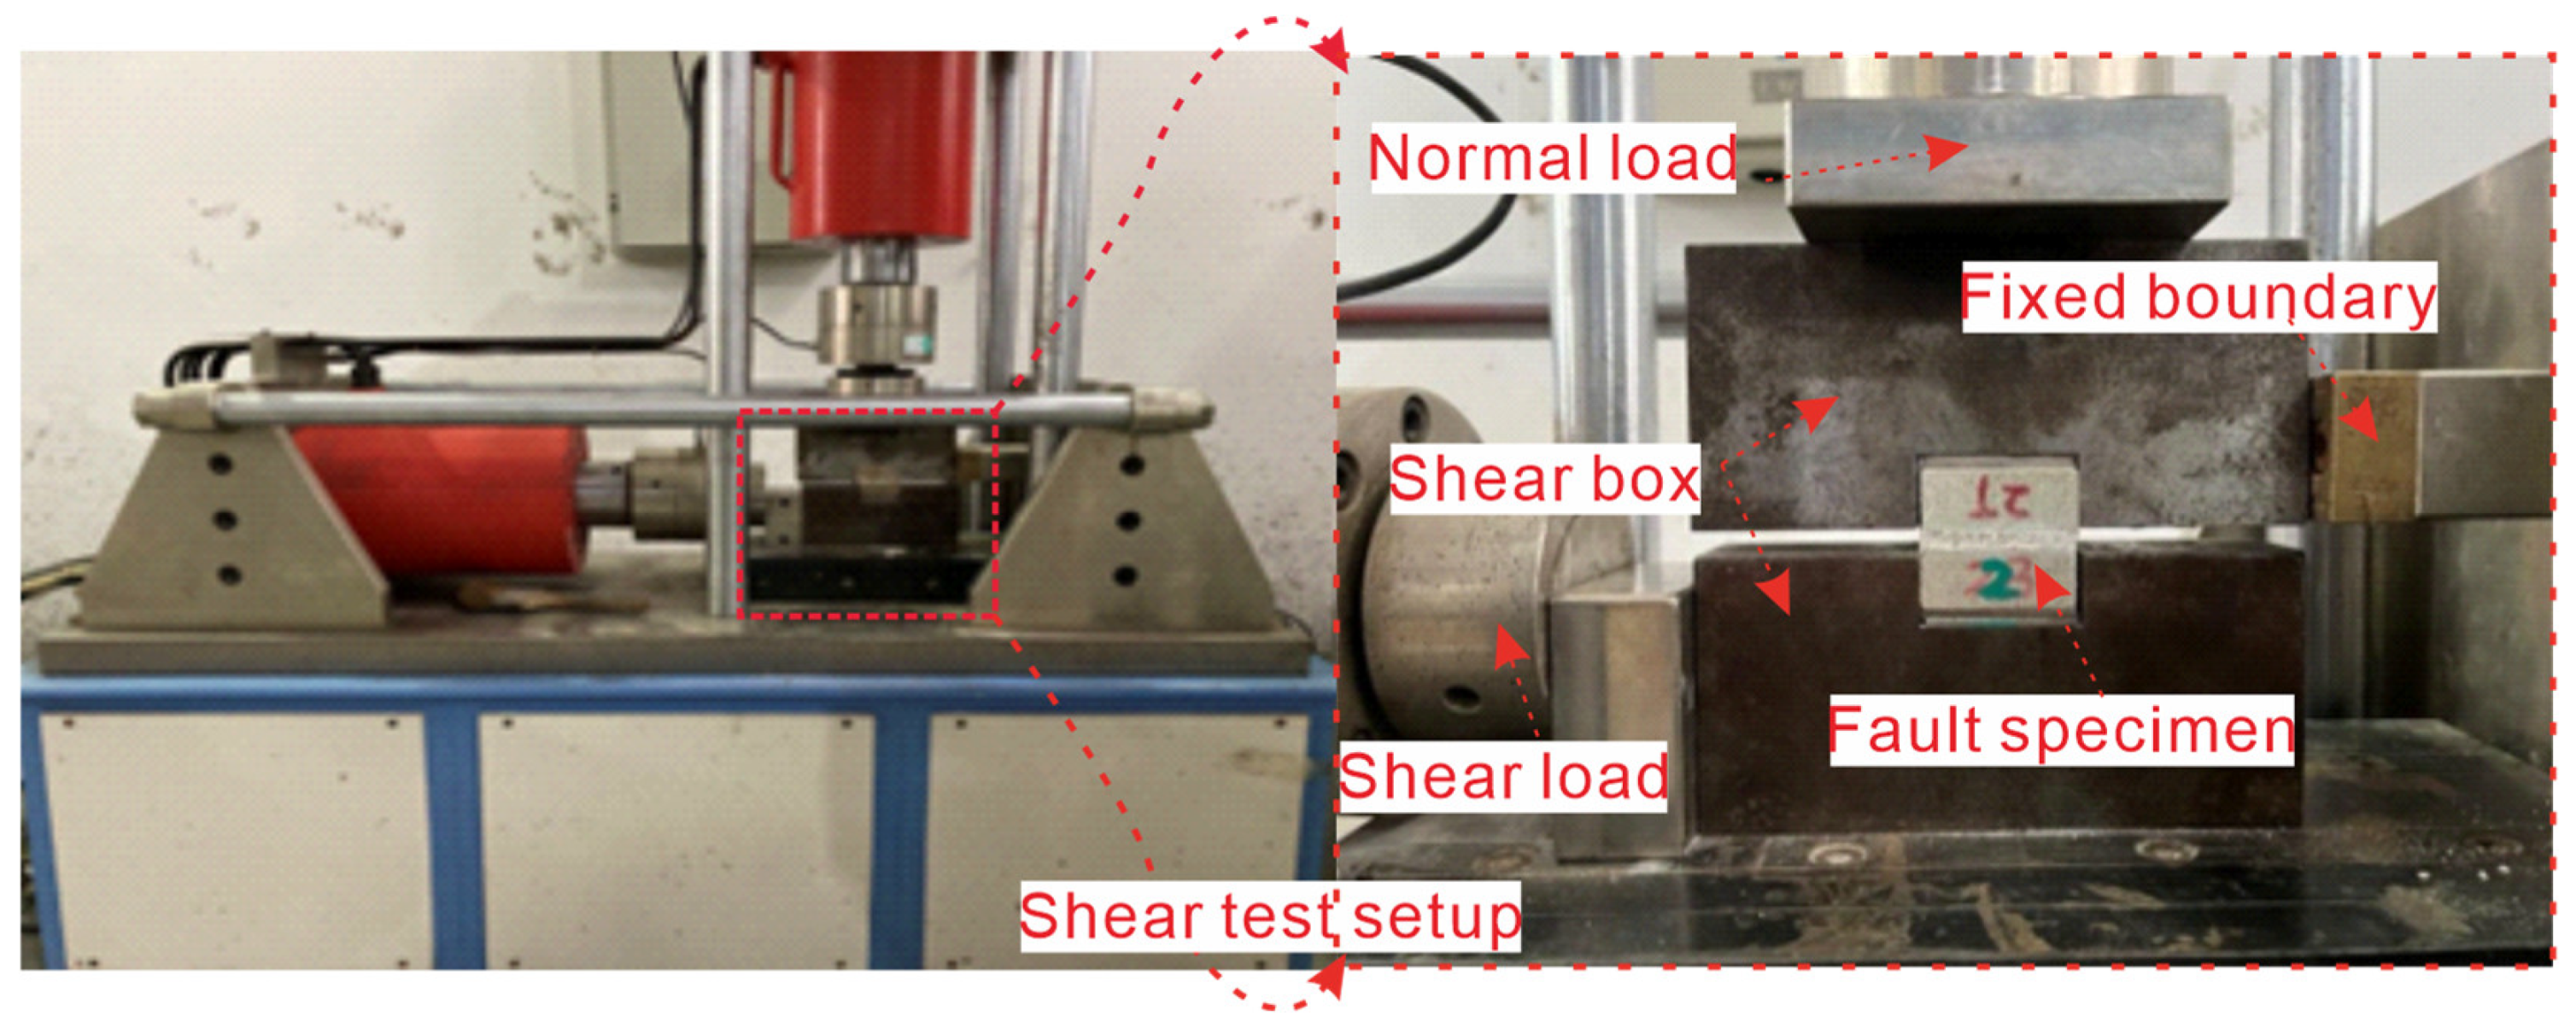
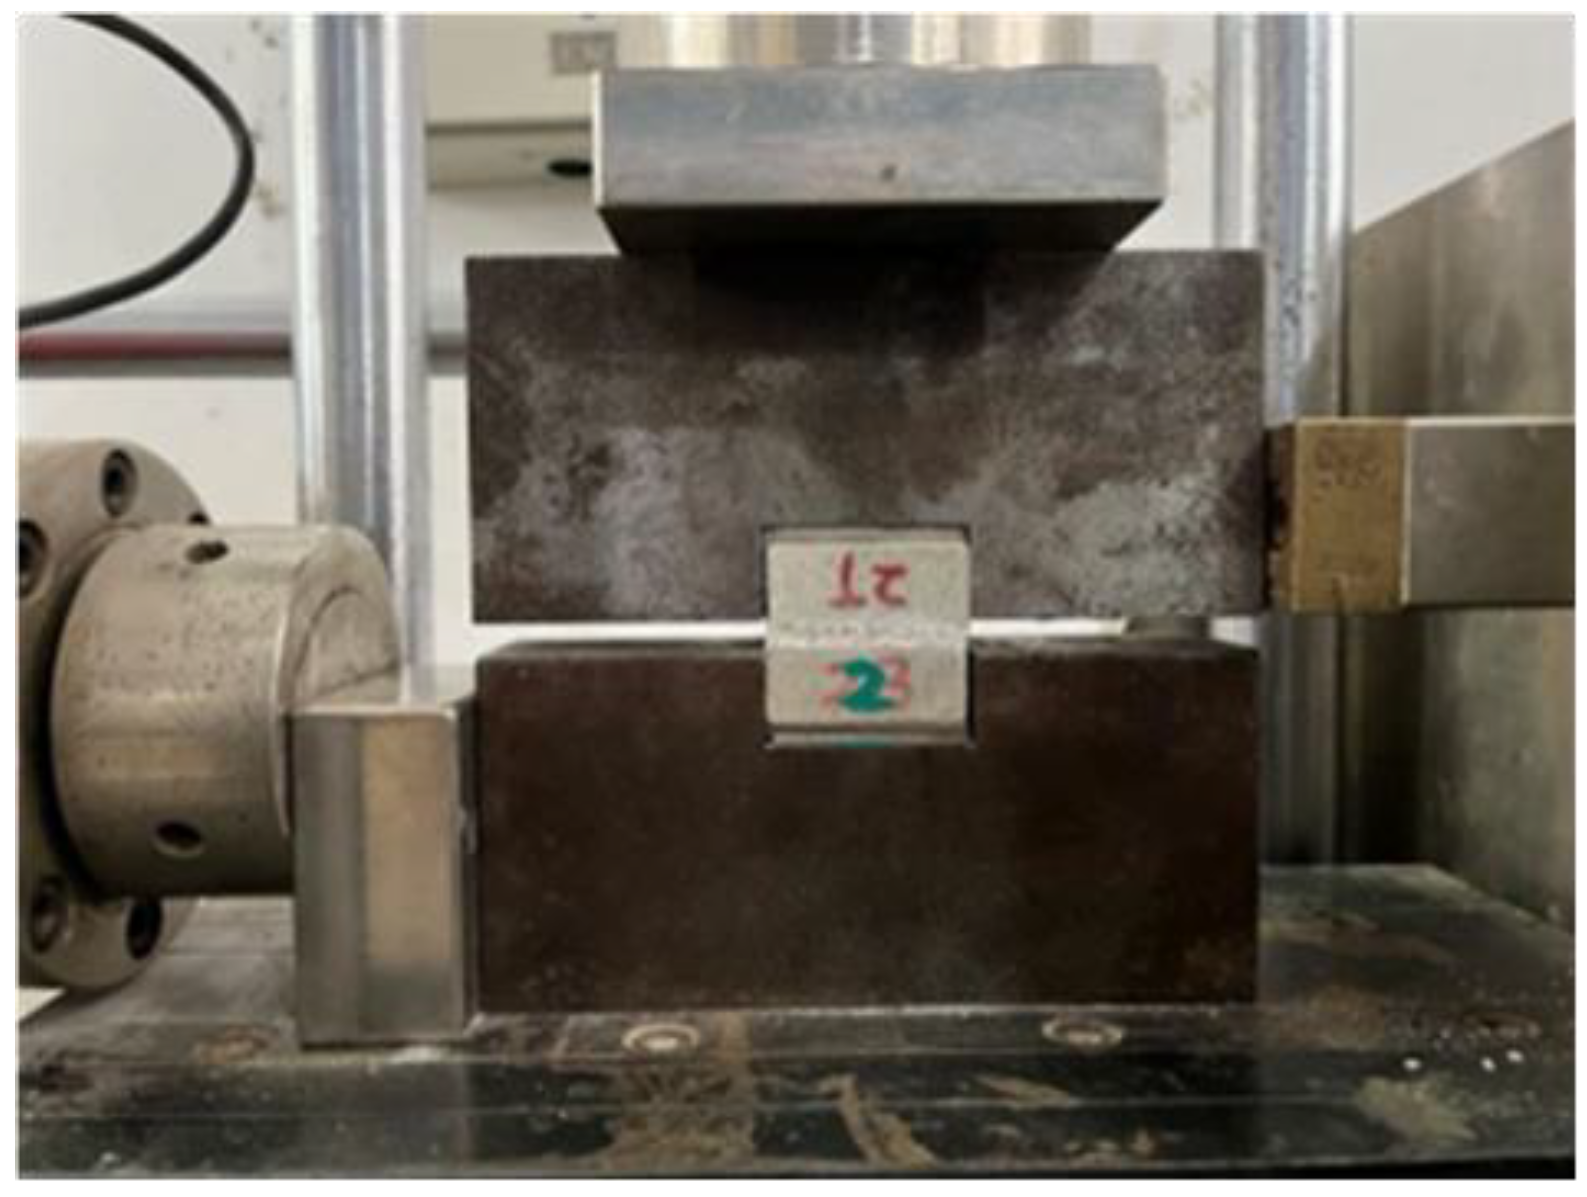
2.3. Experimental Steps
3. Analysis of Experimental Results
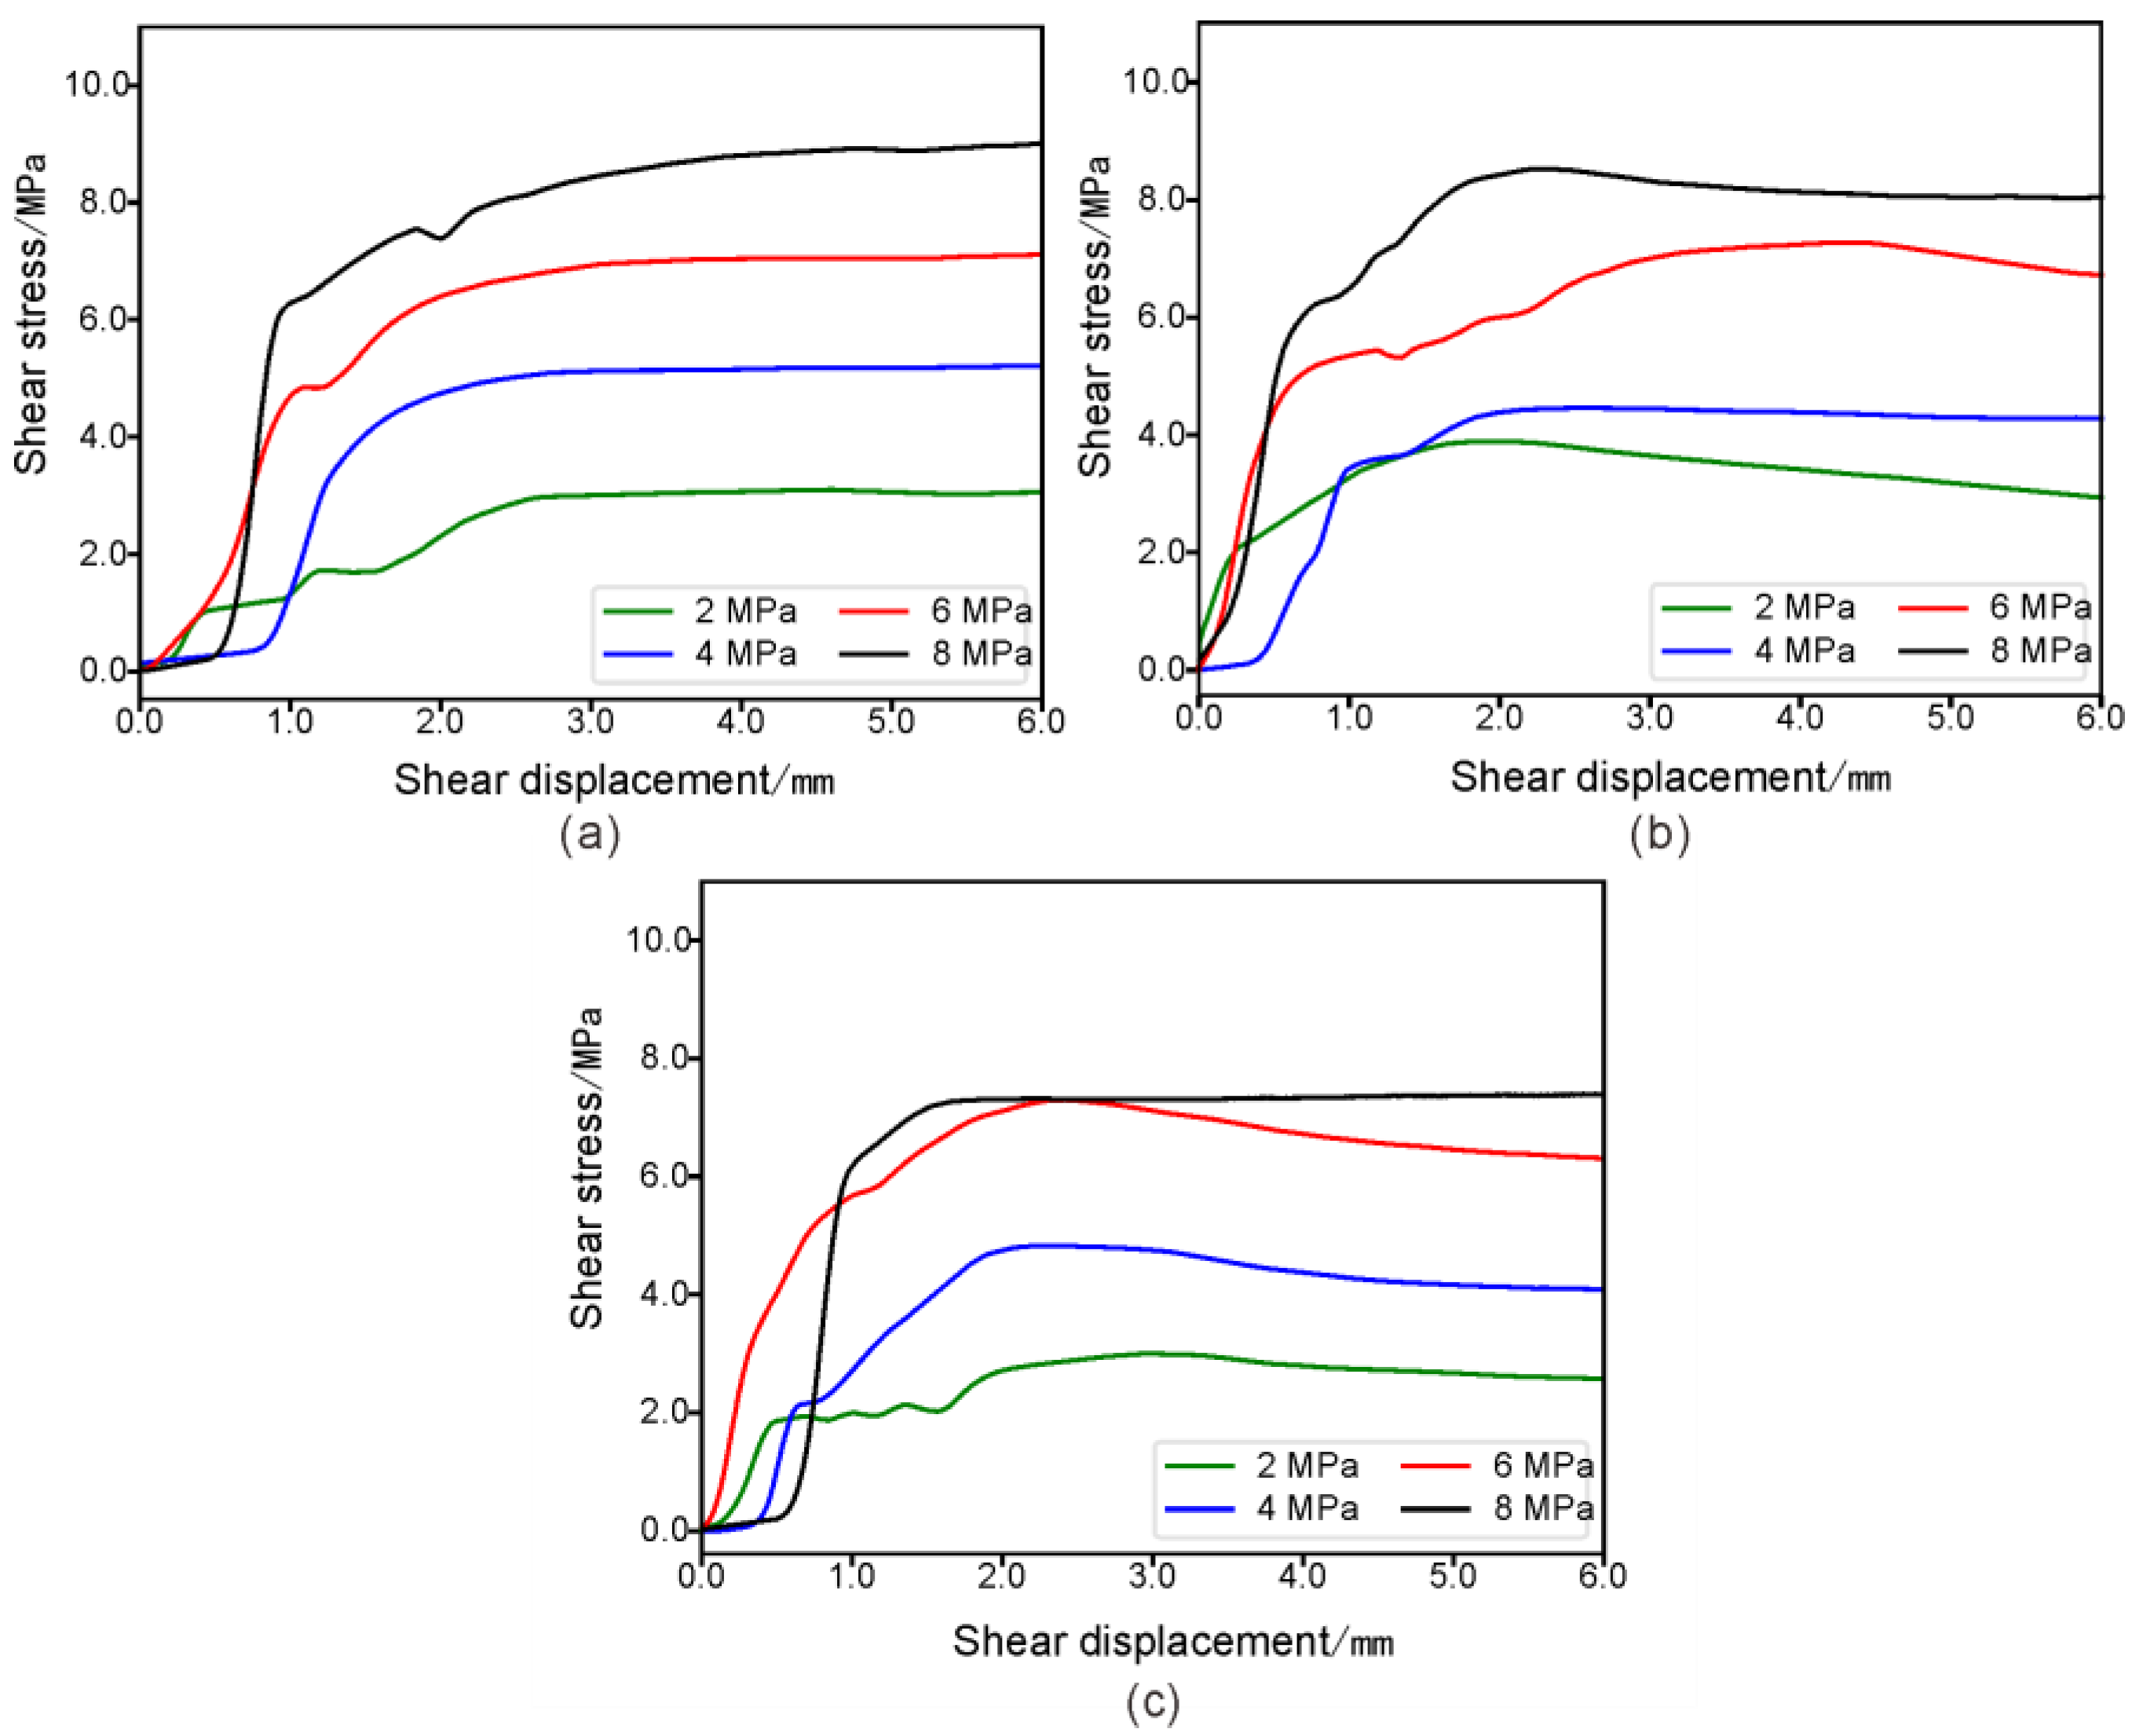
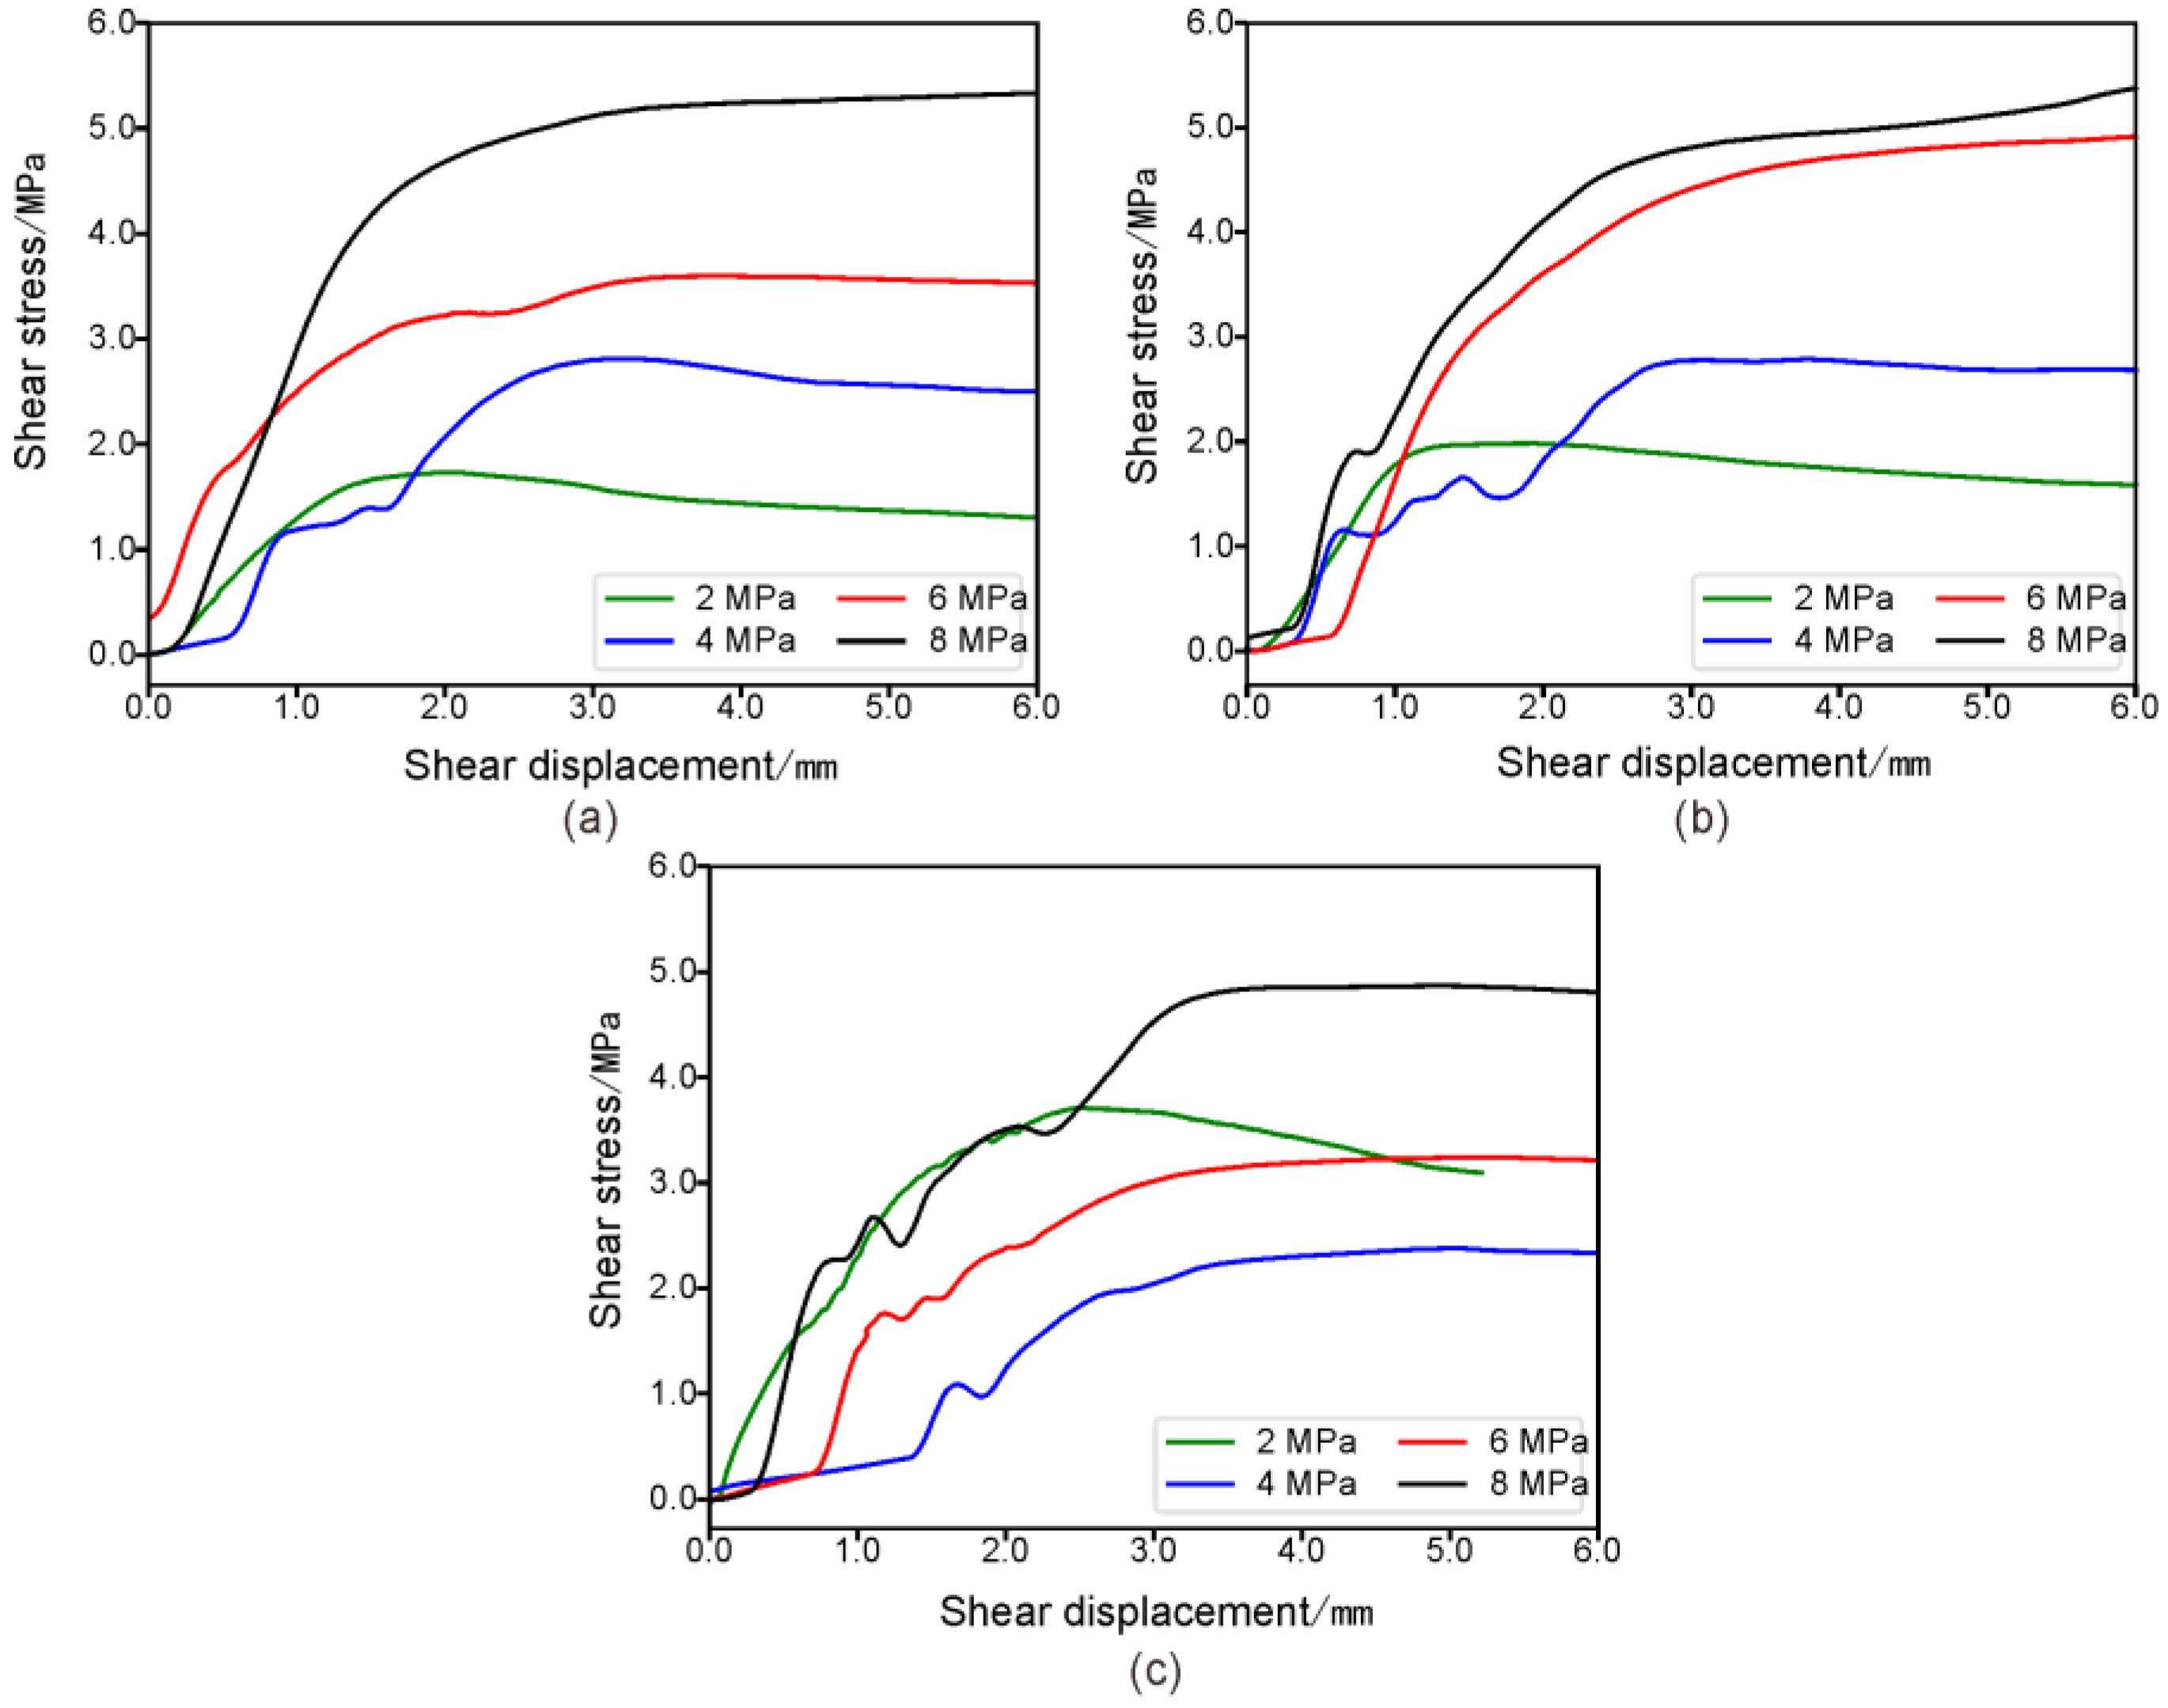
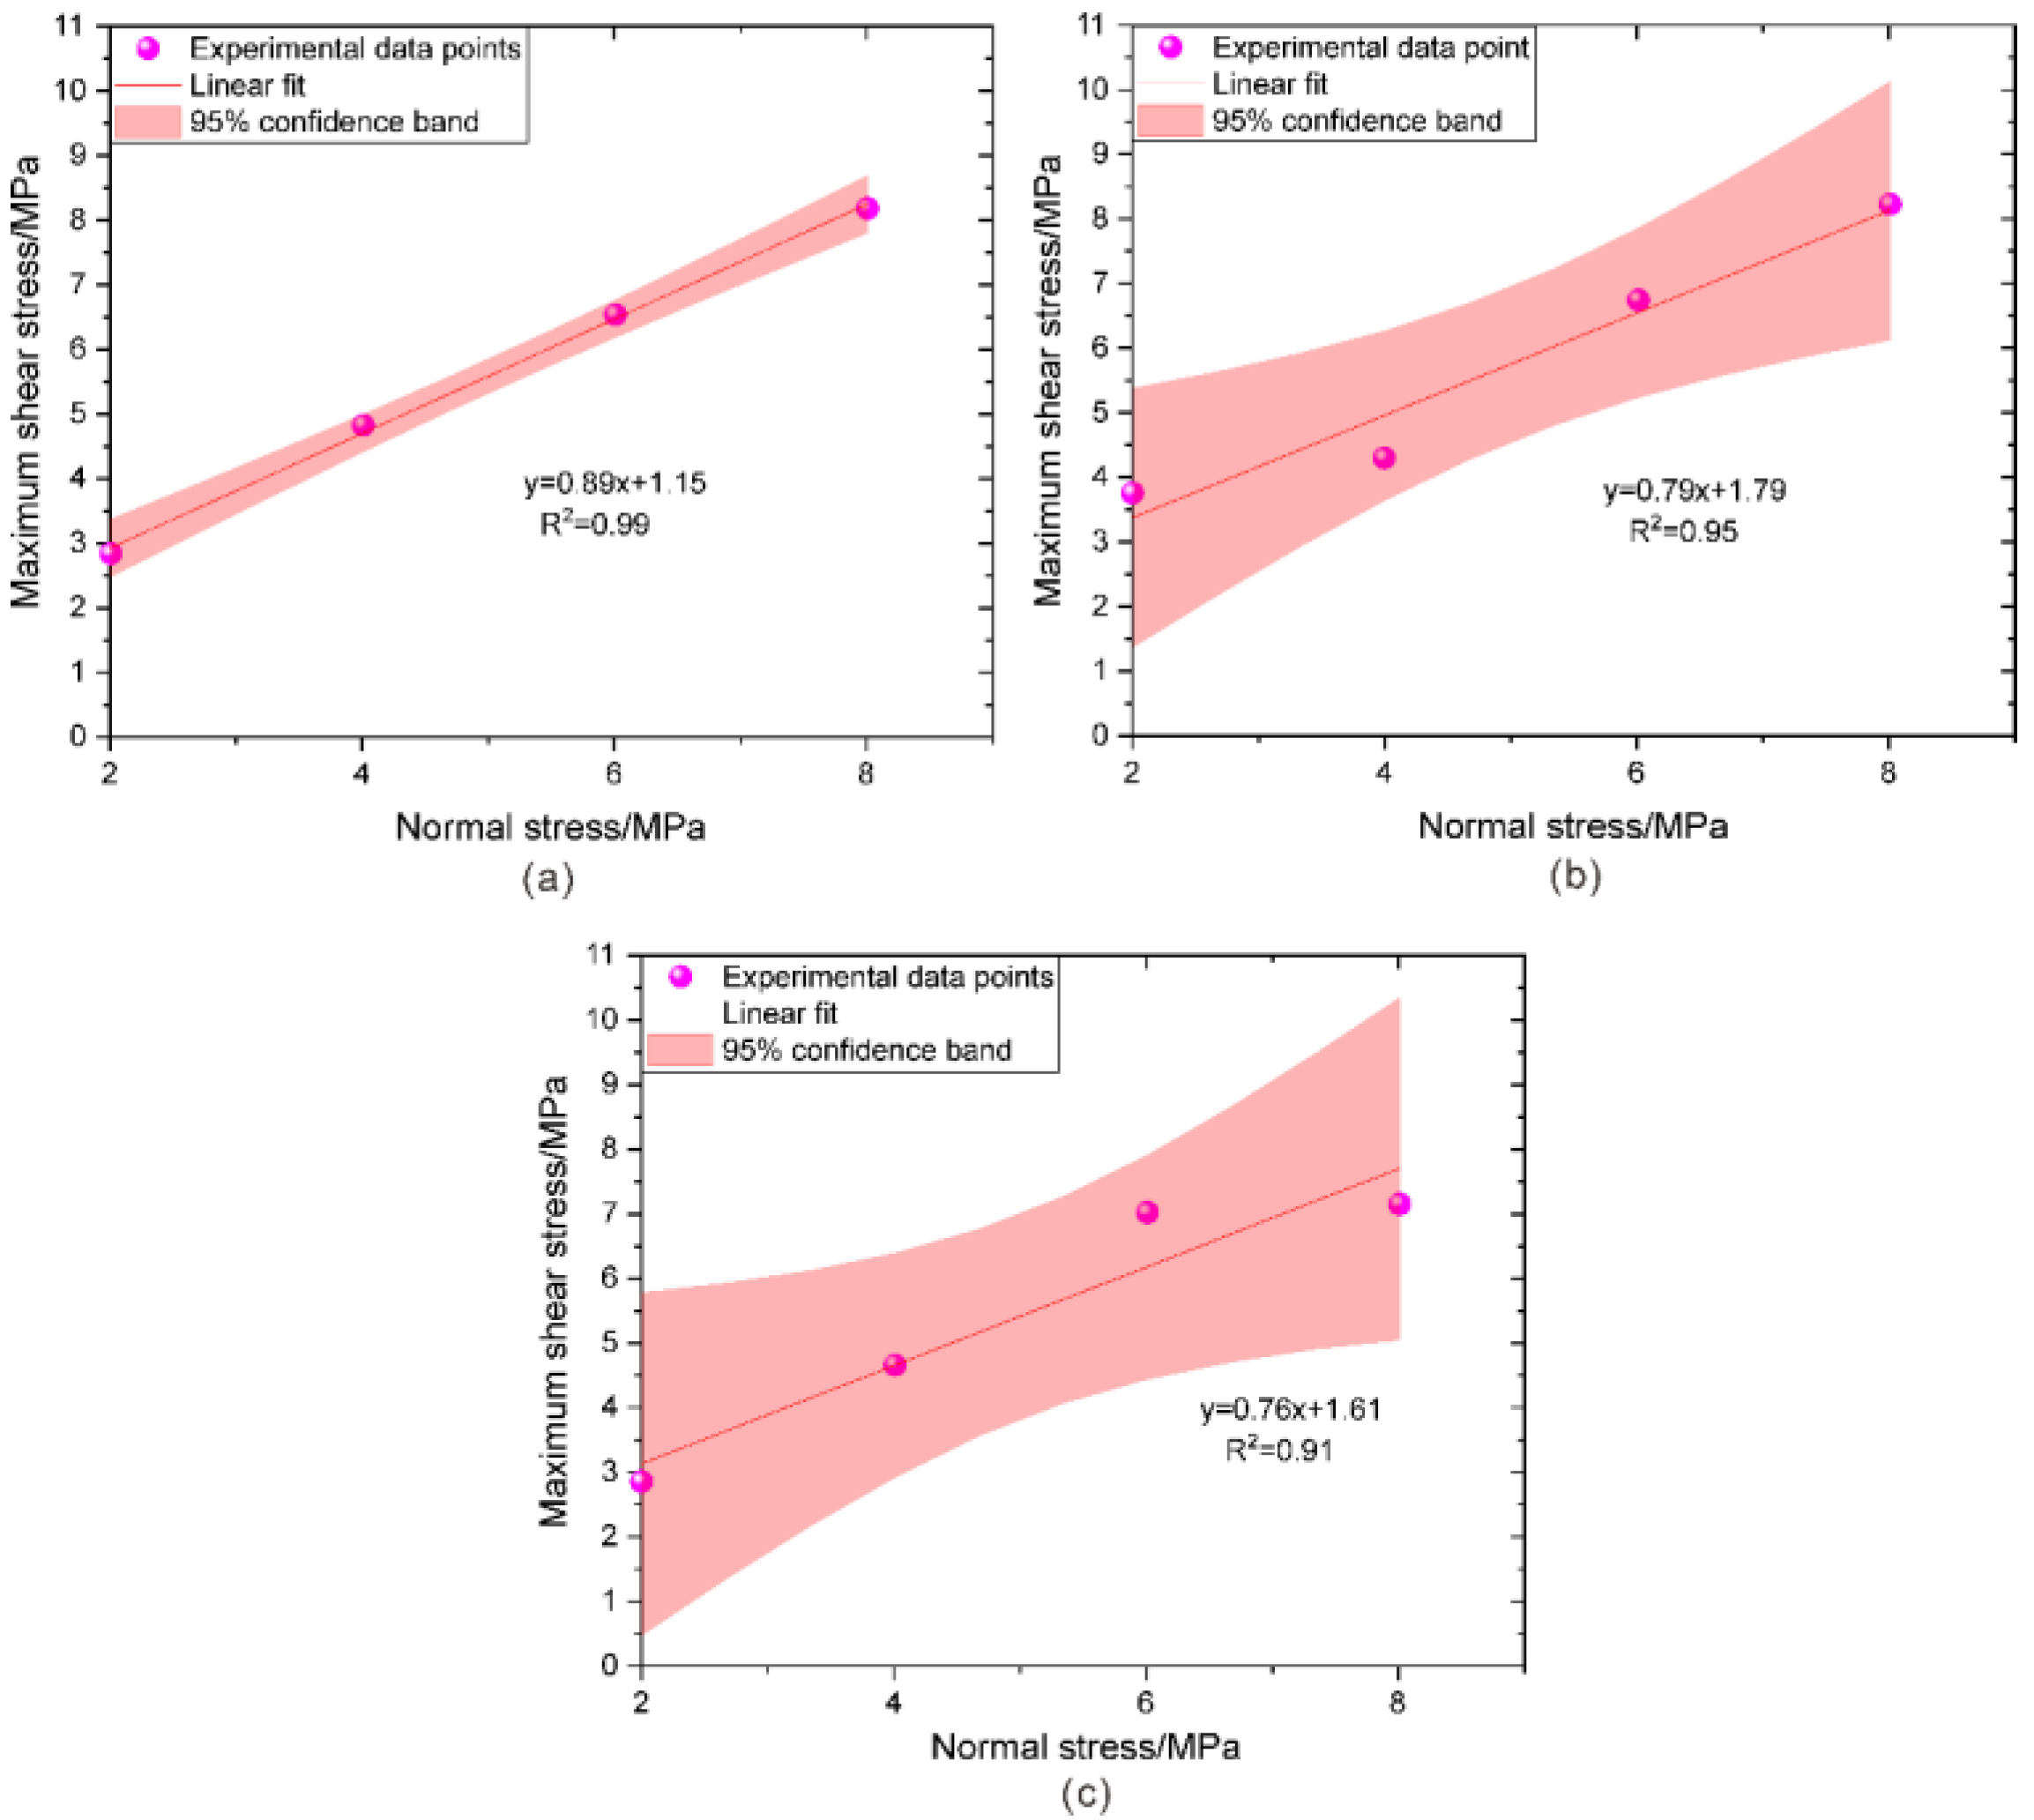
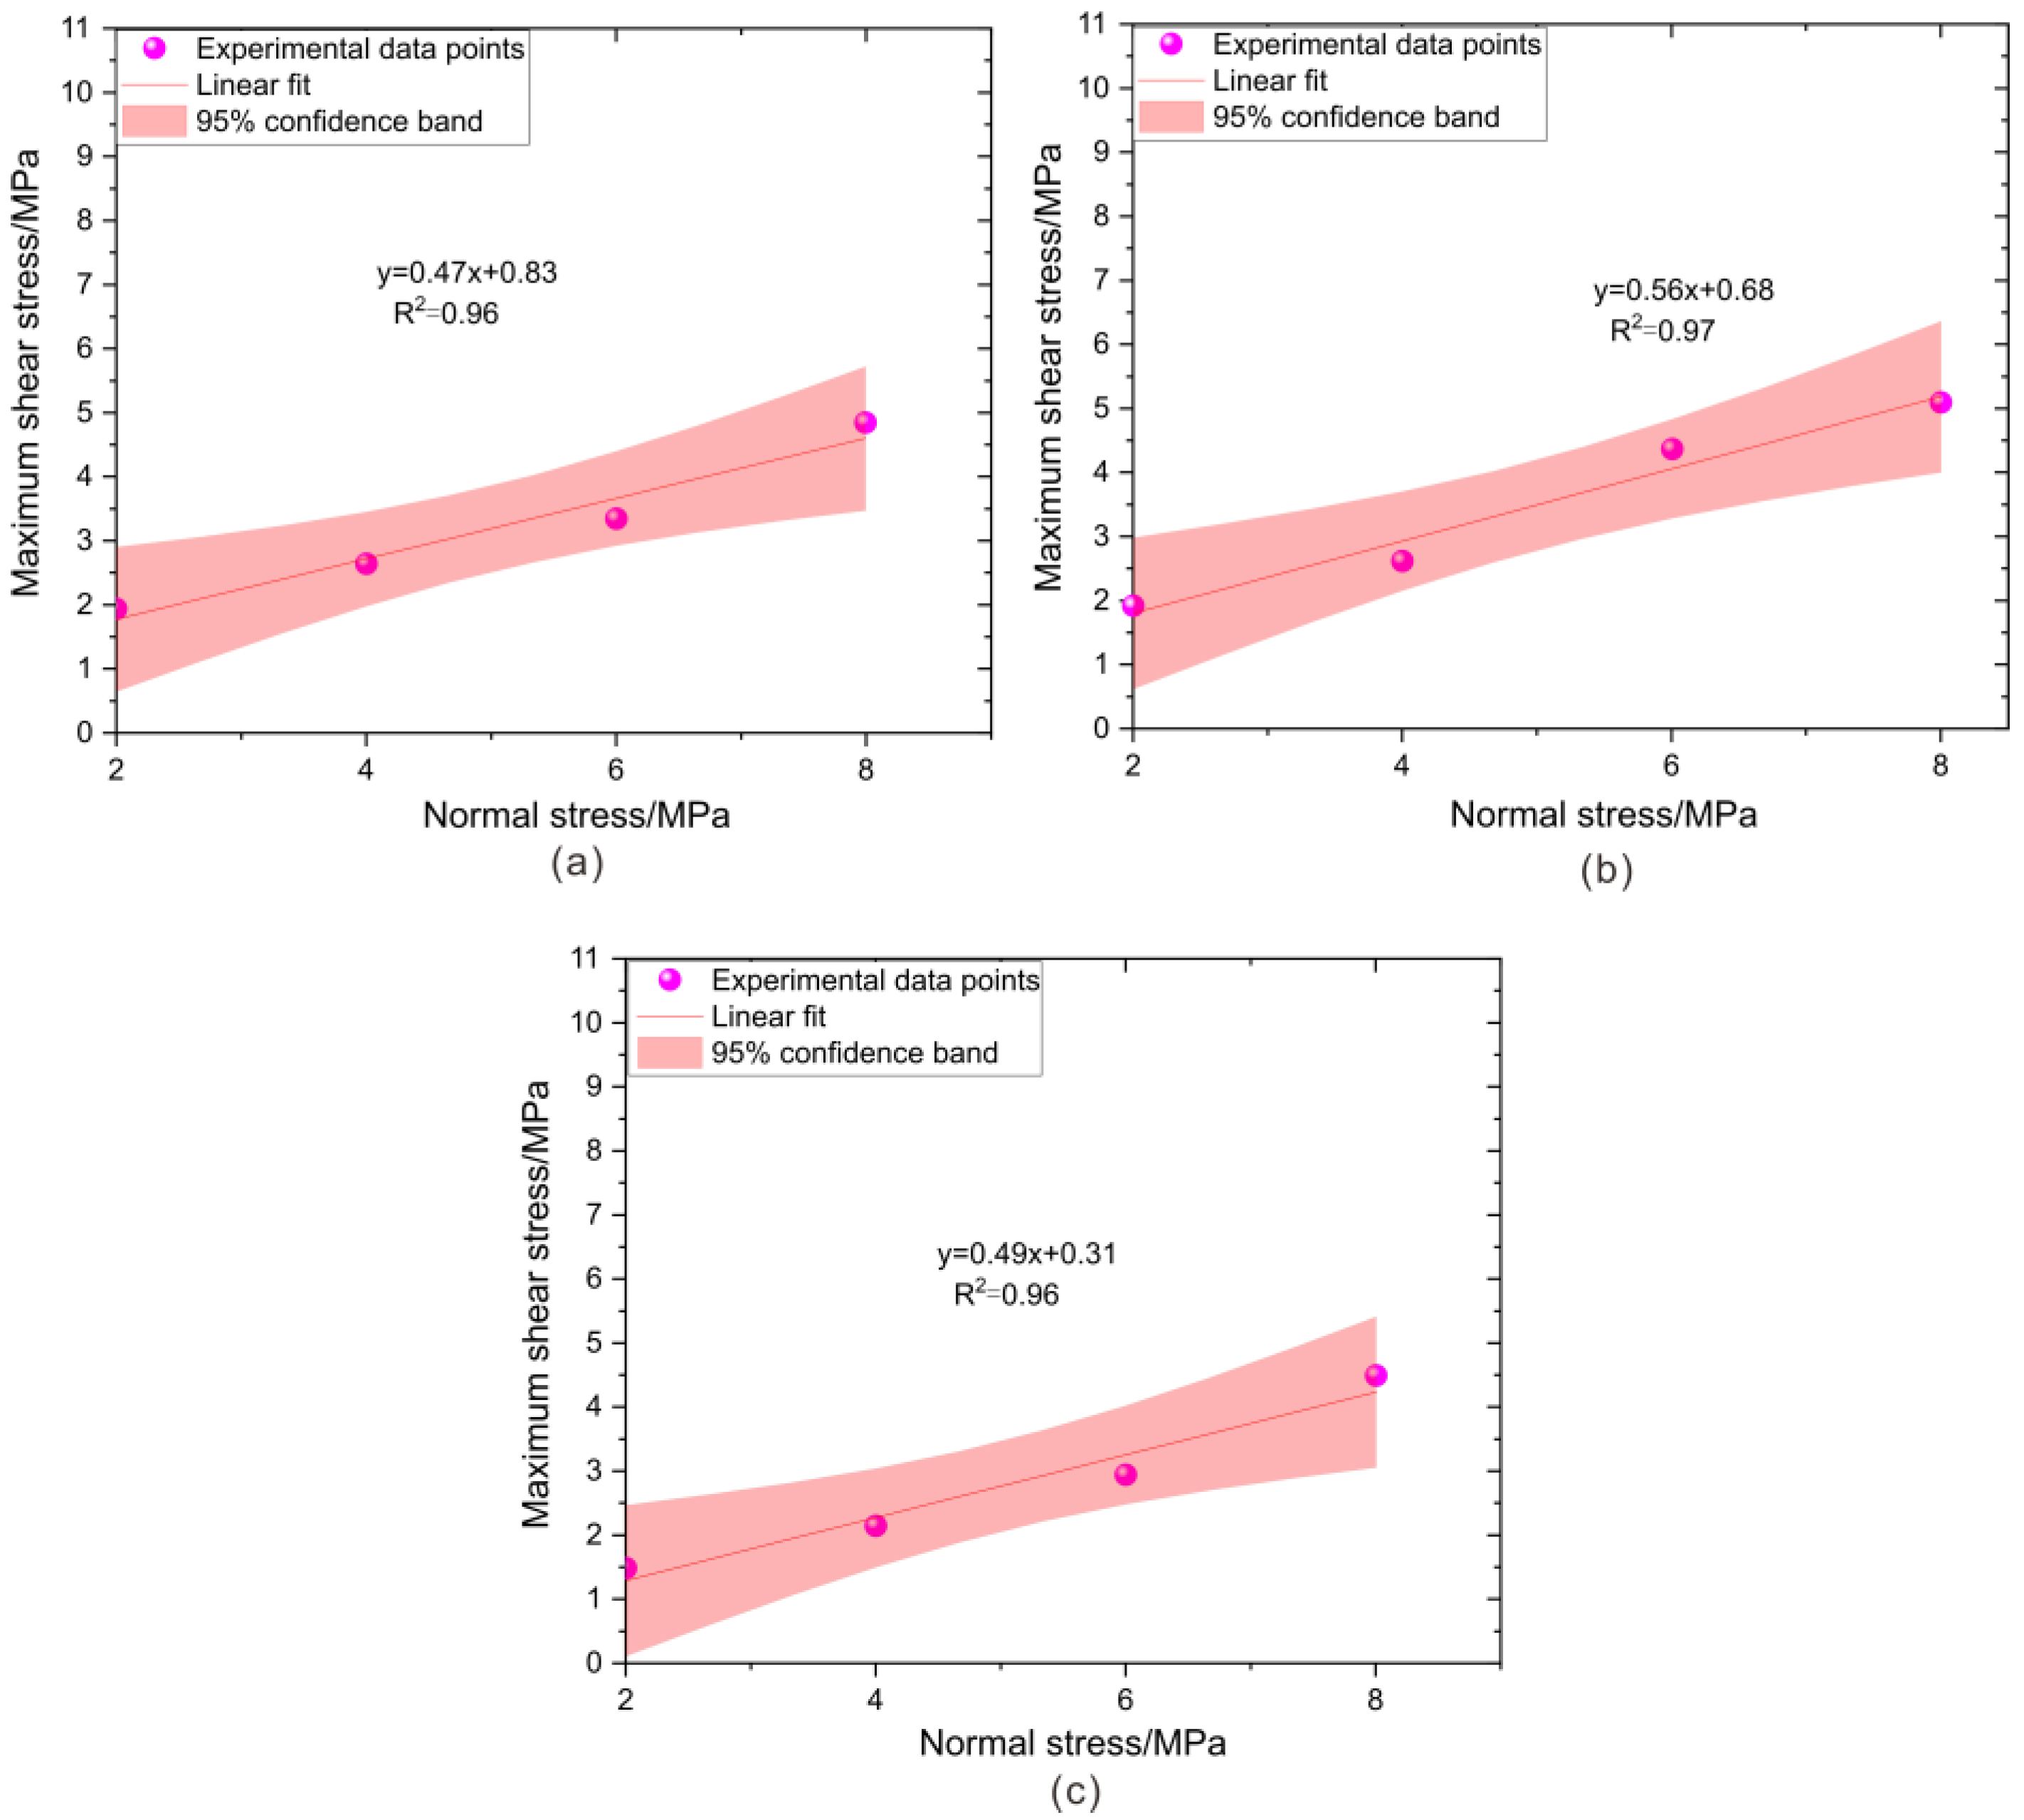
3.1. Effect of Different Normal Stresses on Shear Properties
3.2. Effects of Different Clay Mineral Contents on the Shear Properties of Fault Rocks
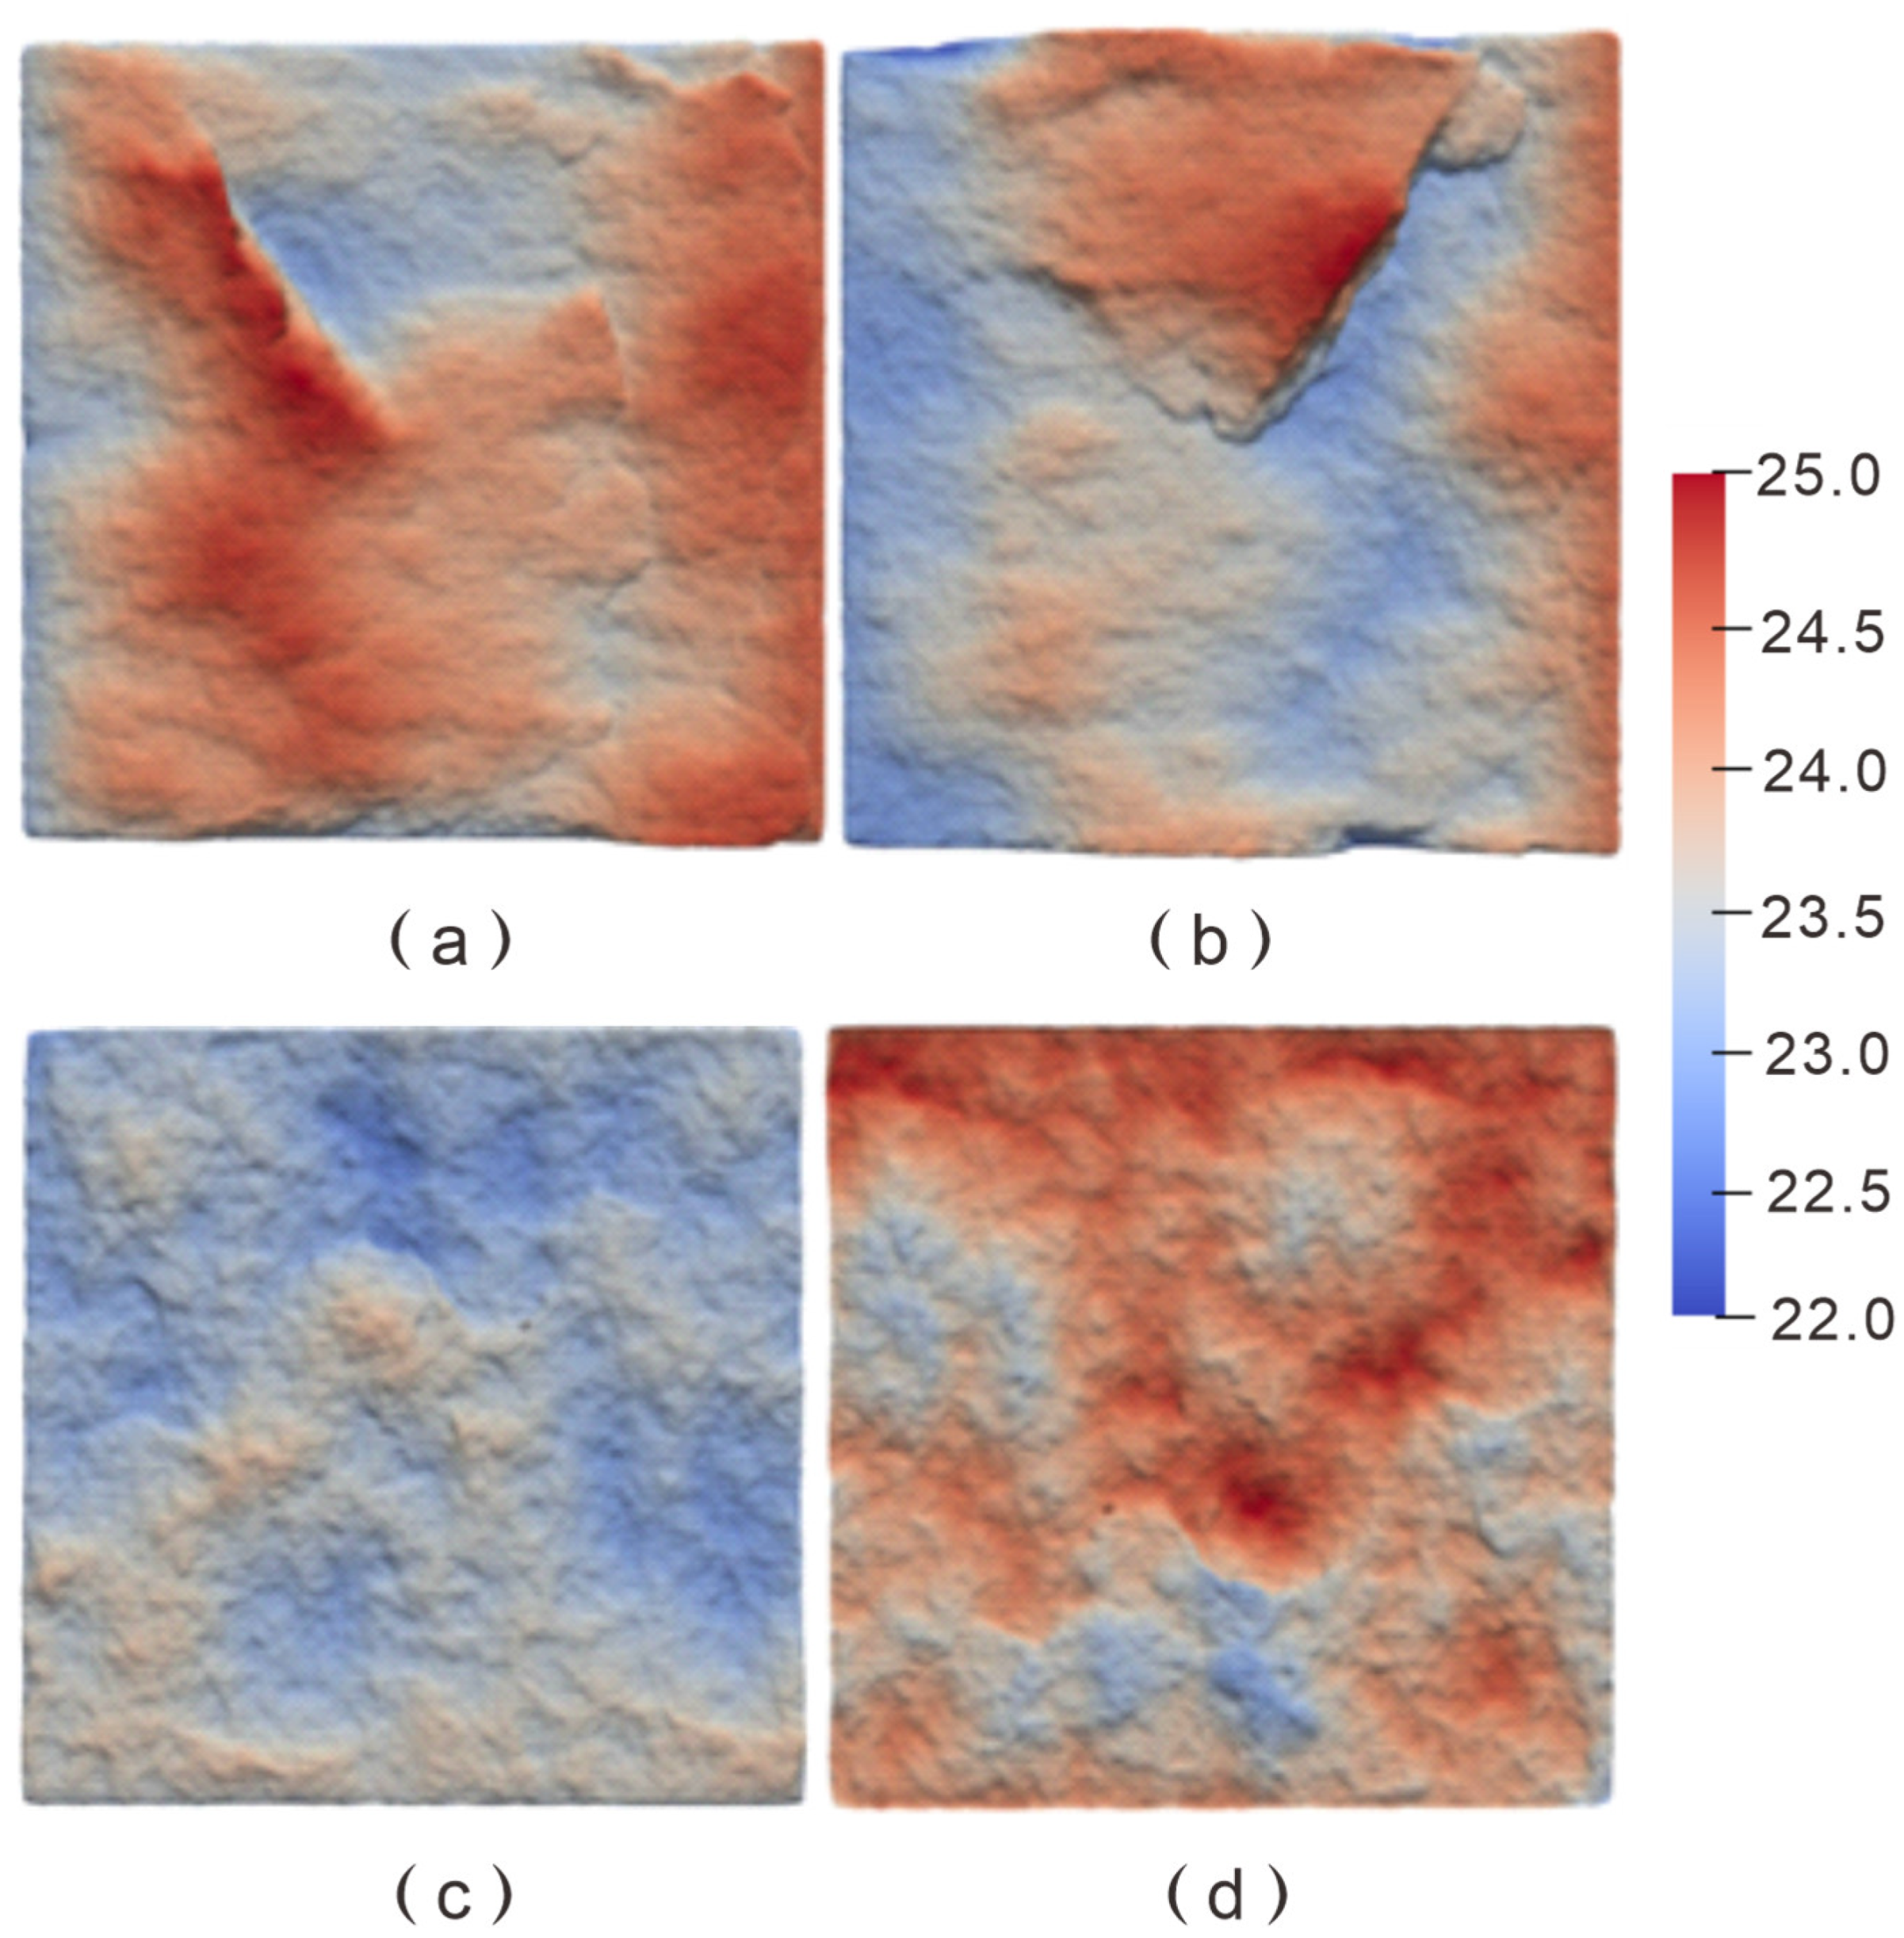
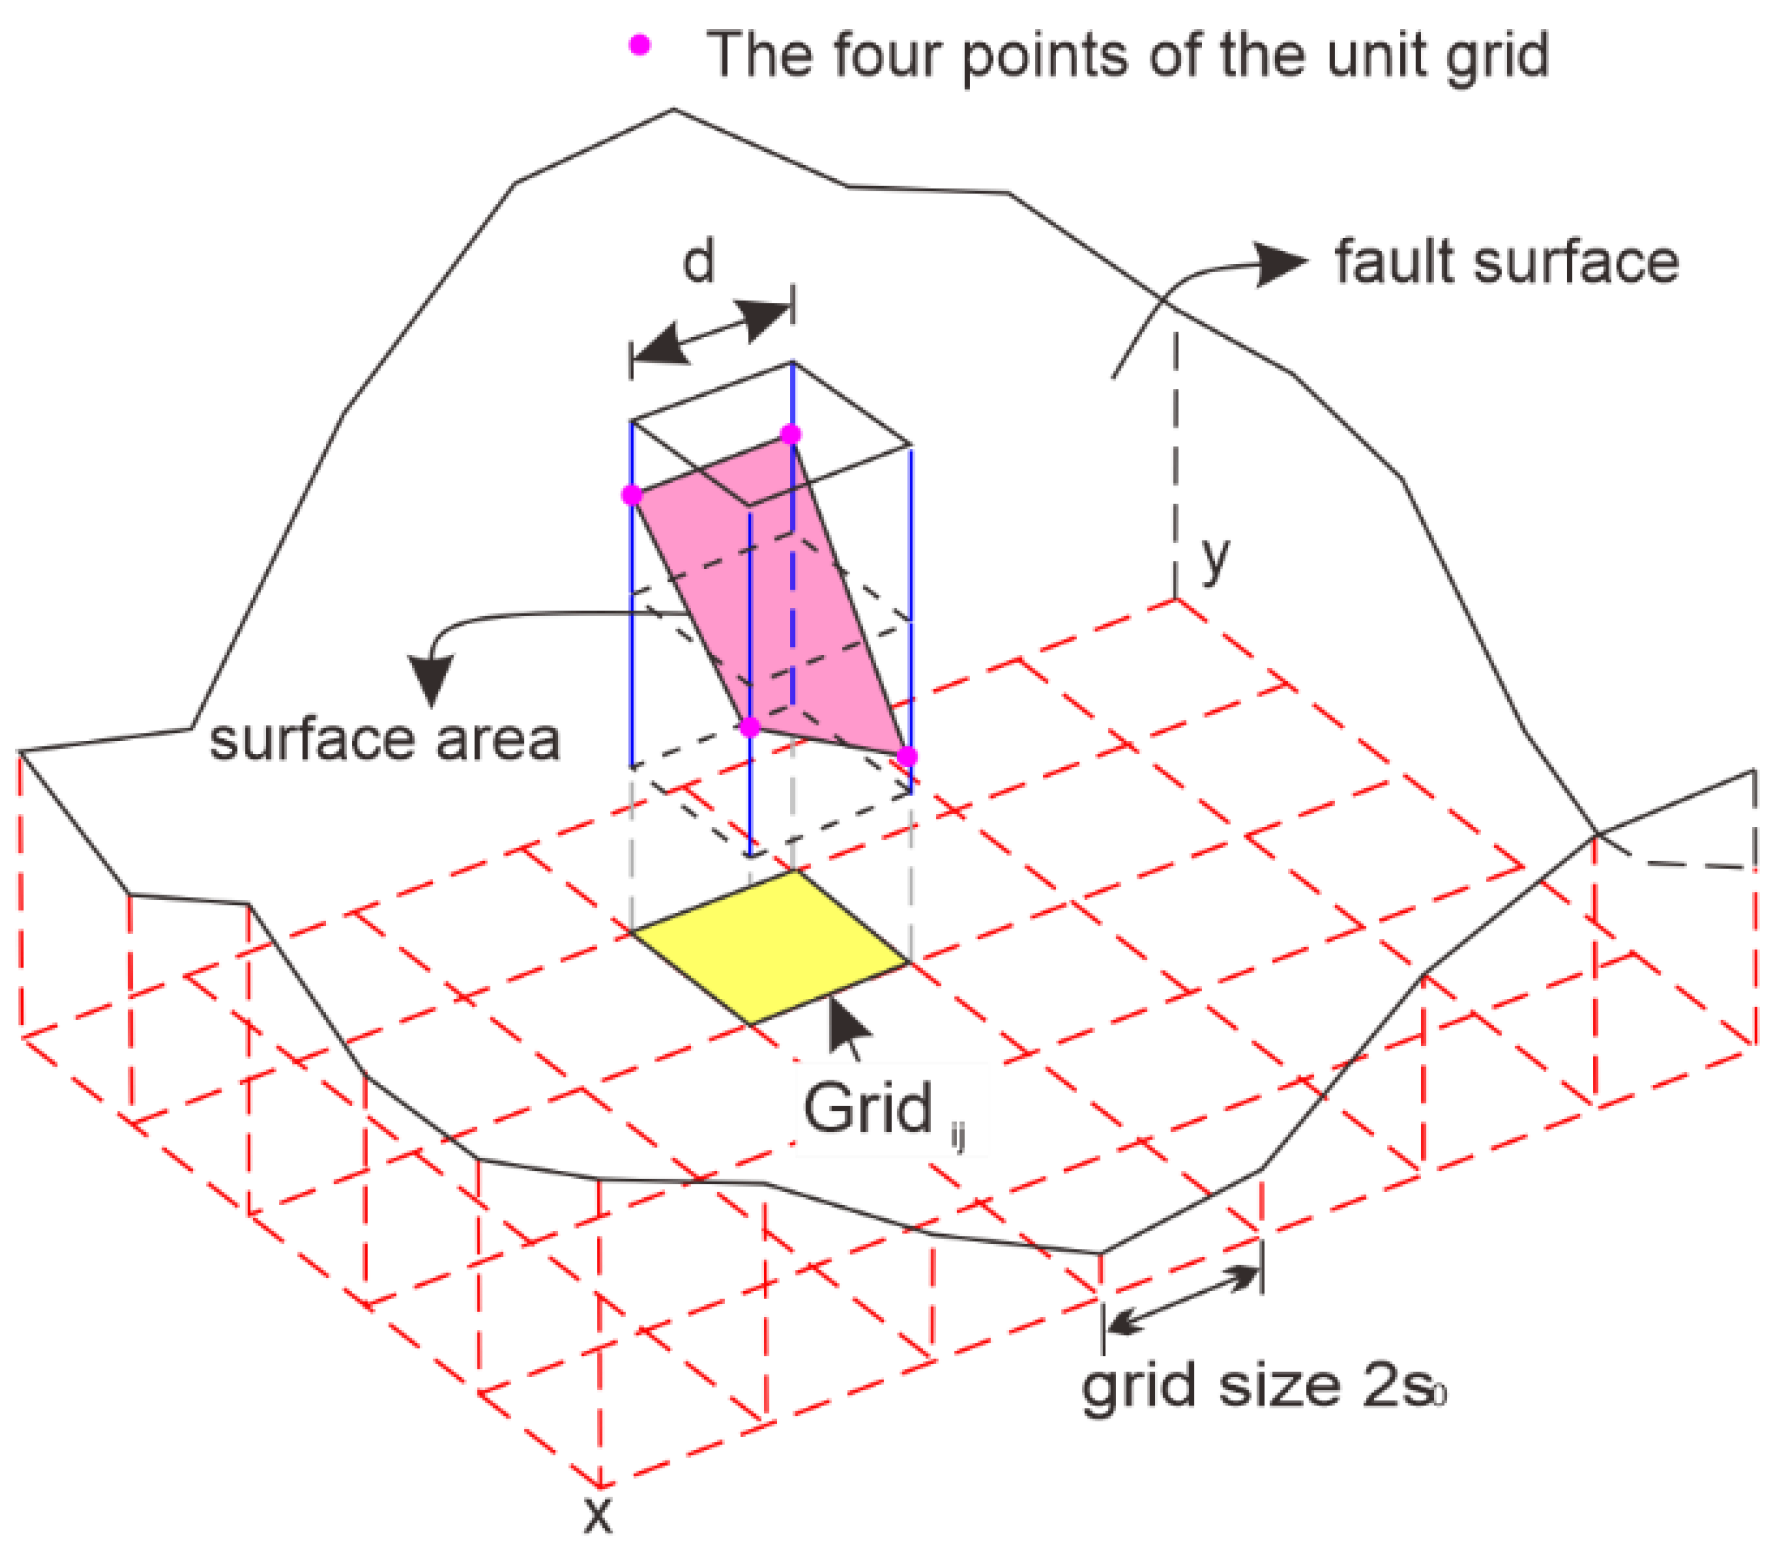
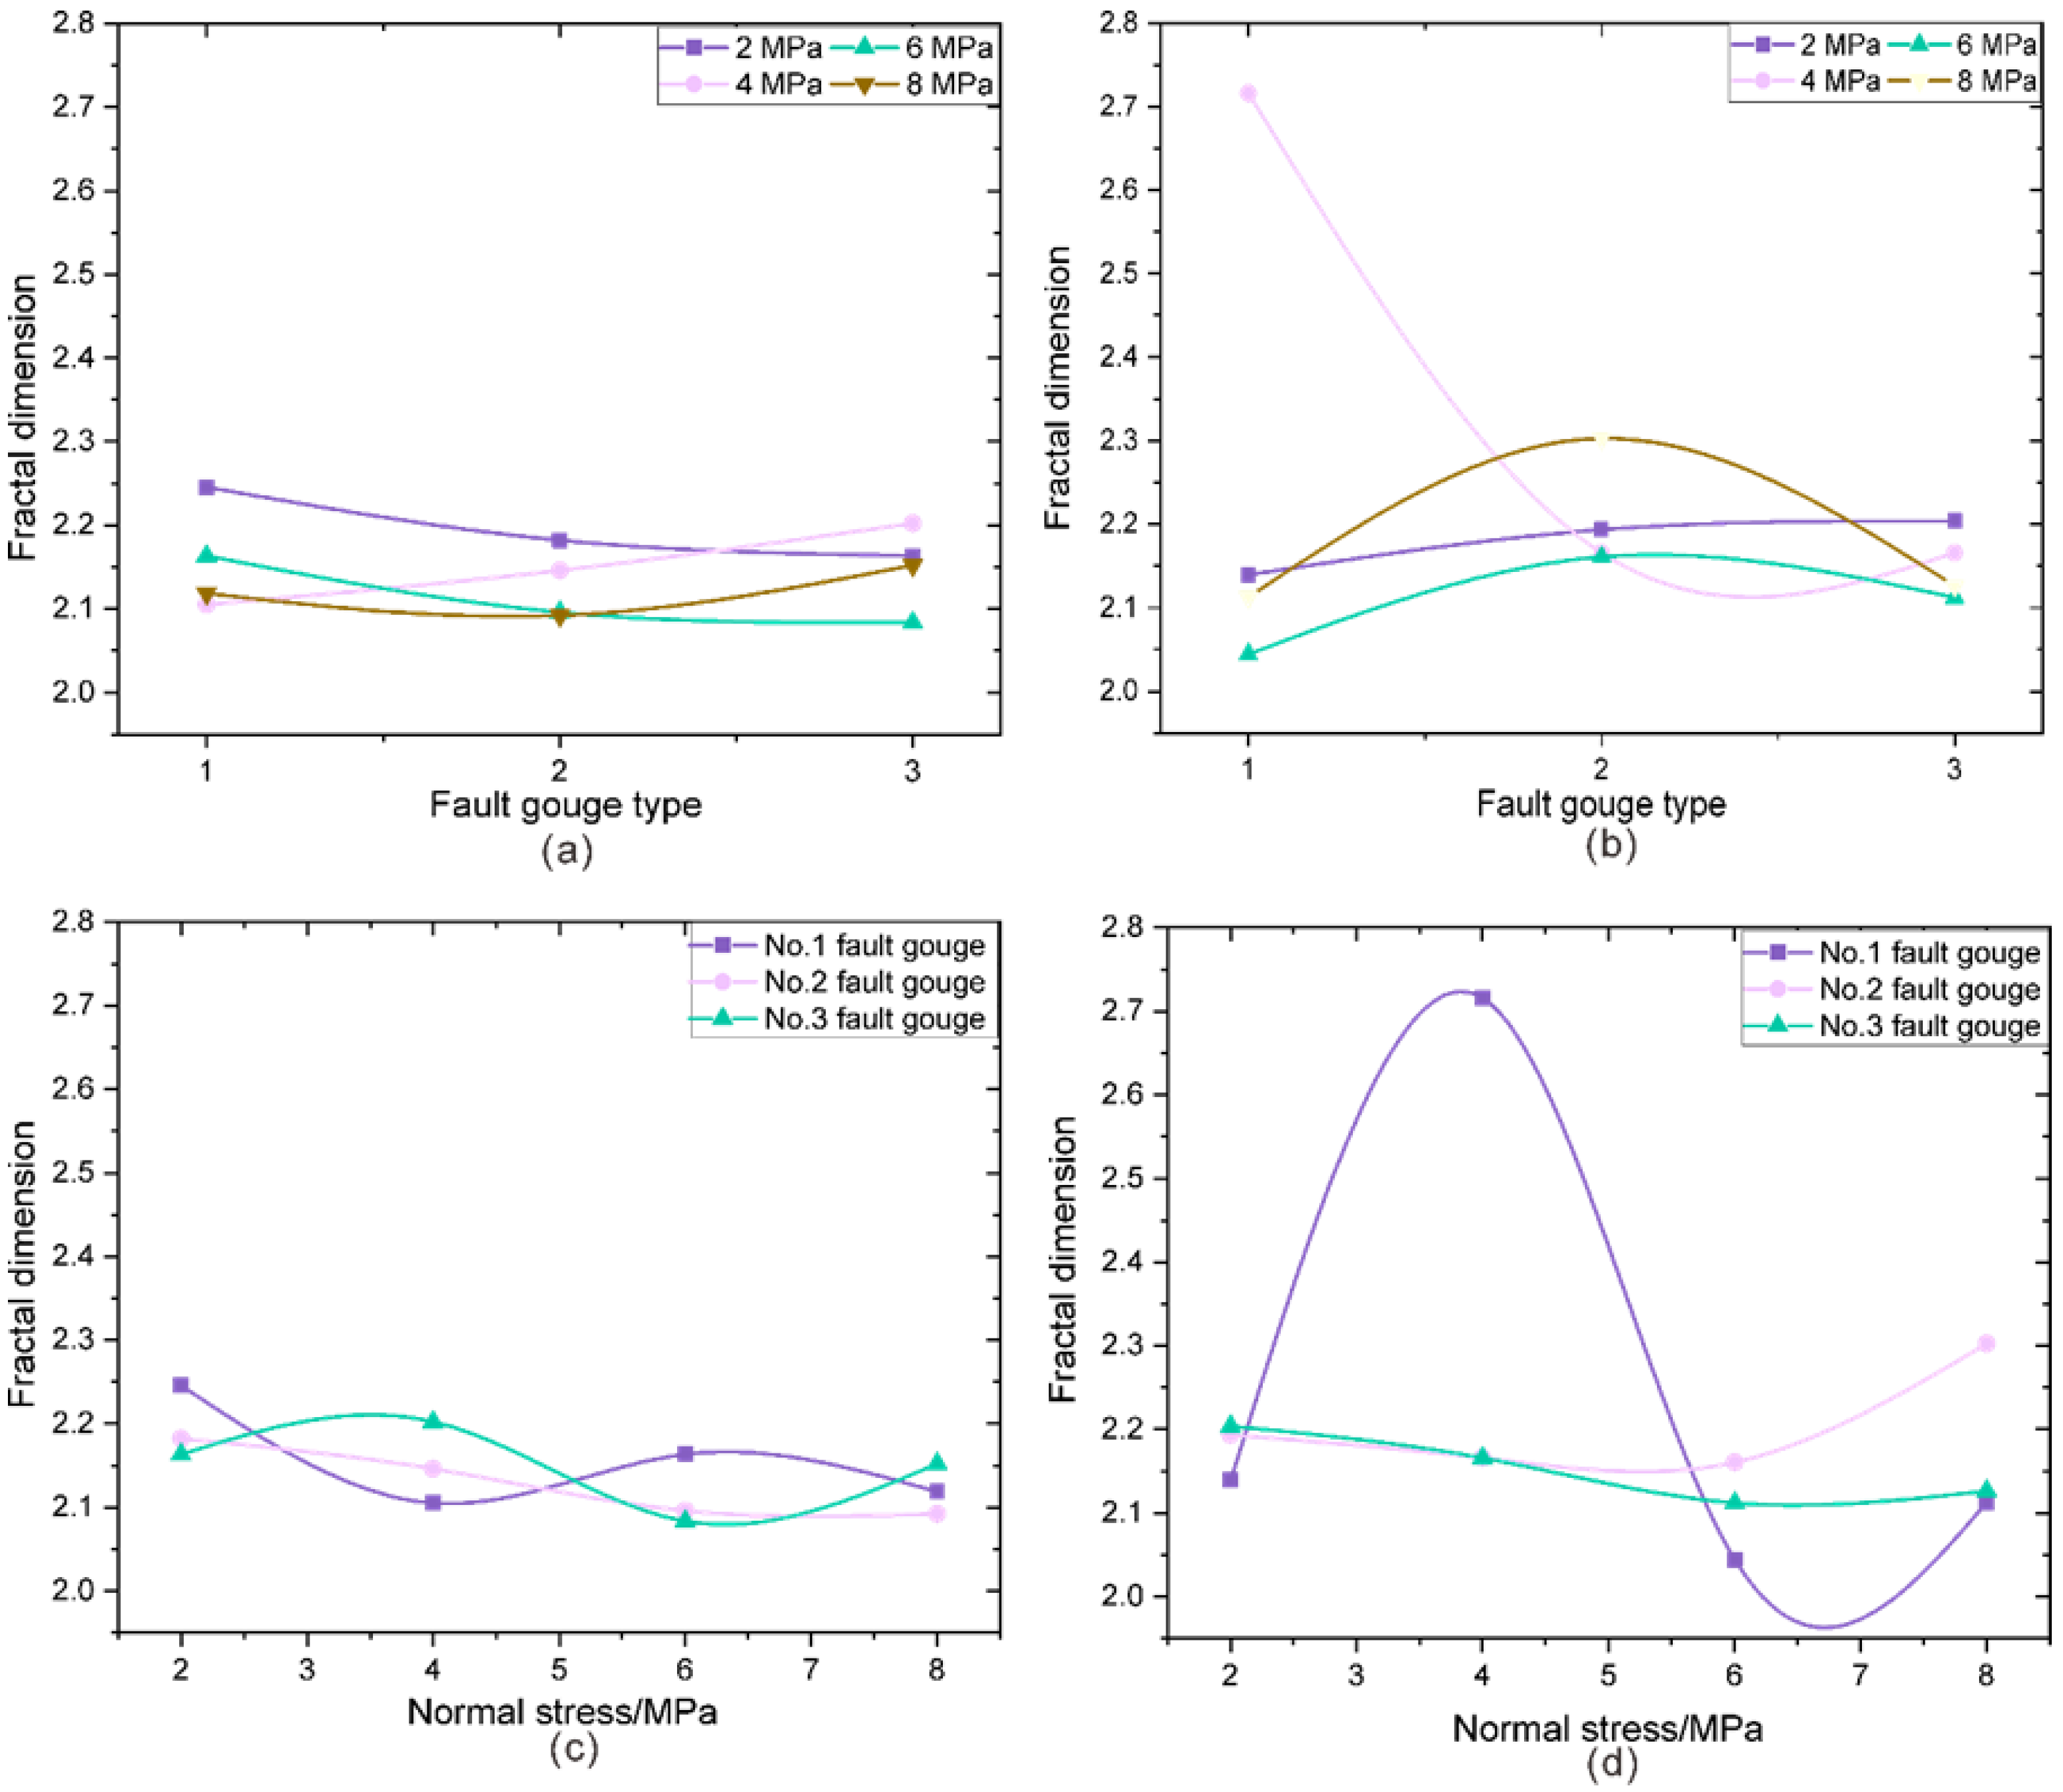
3.3. Analysis of Fractal Dimension of Fault Surface Roughness
4. Conclusions
- (1)
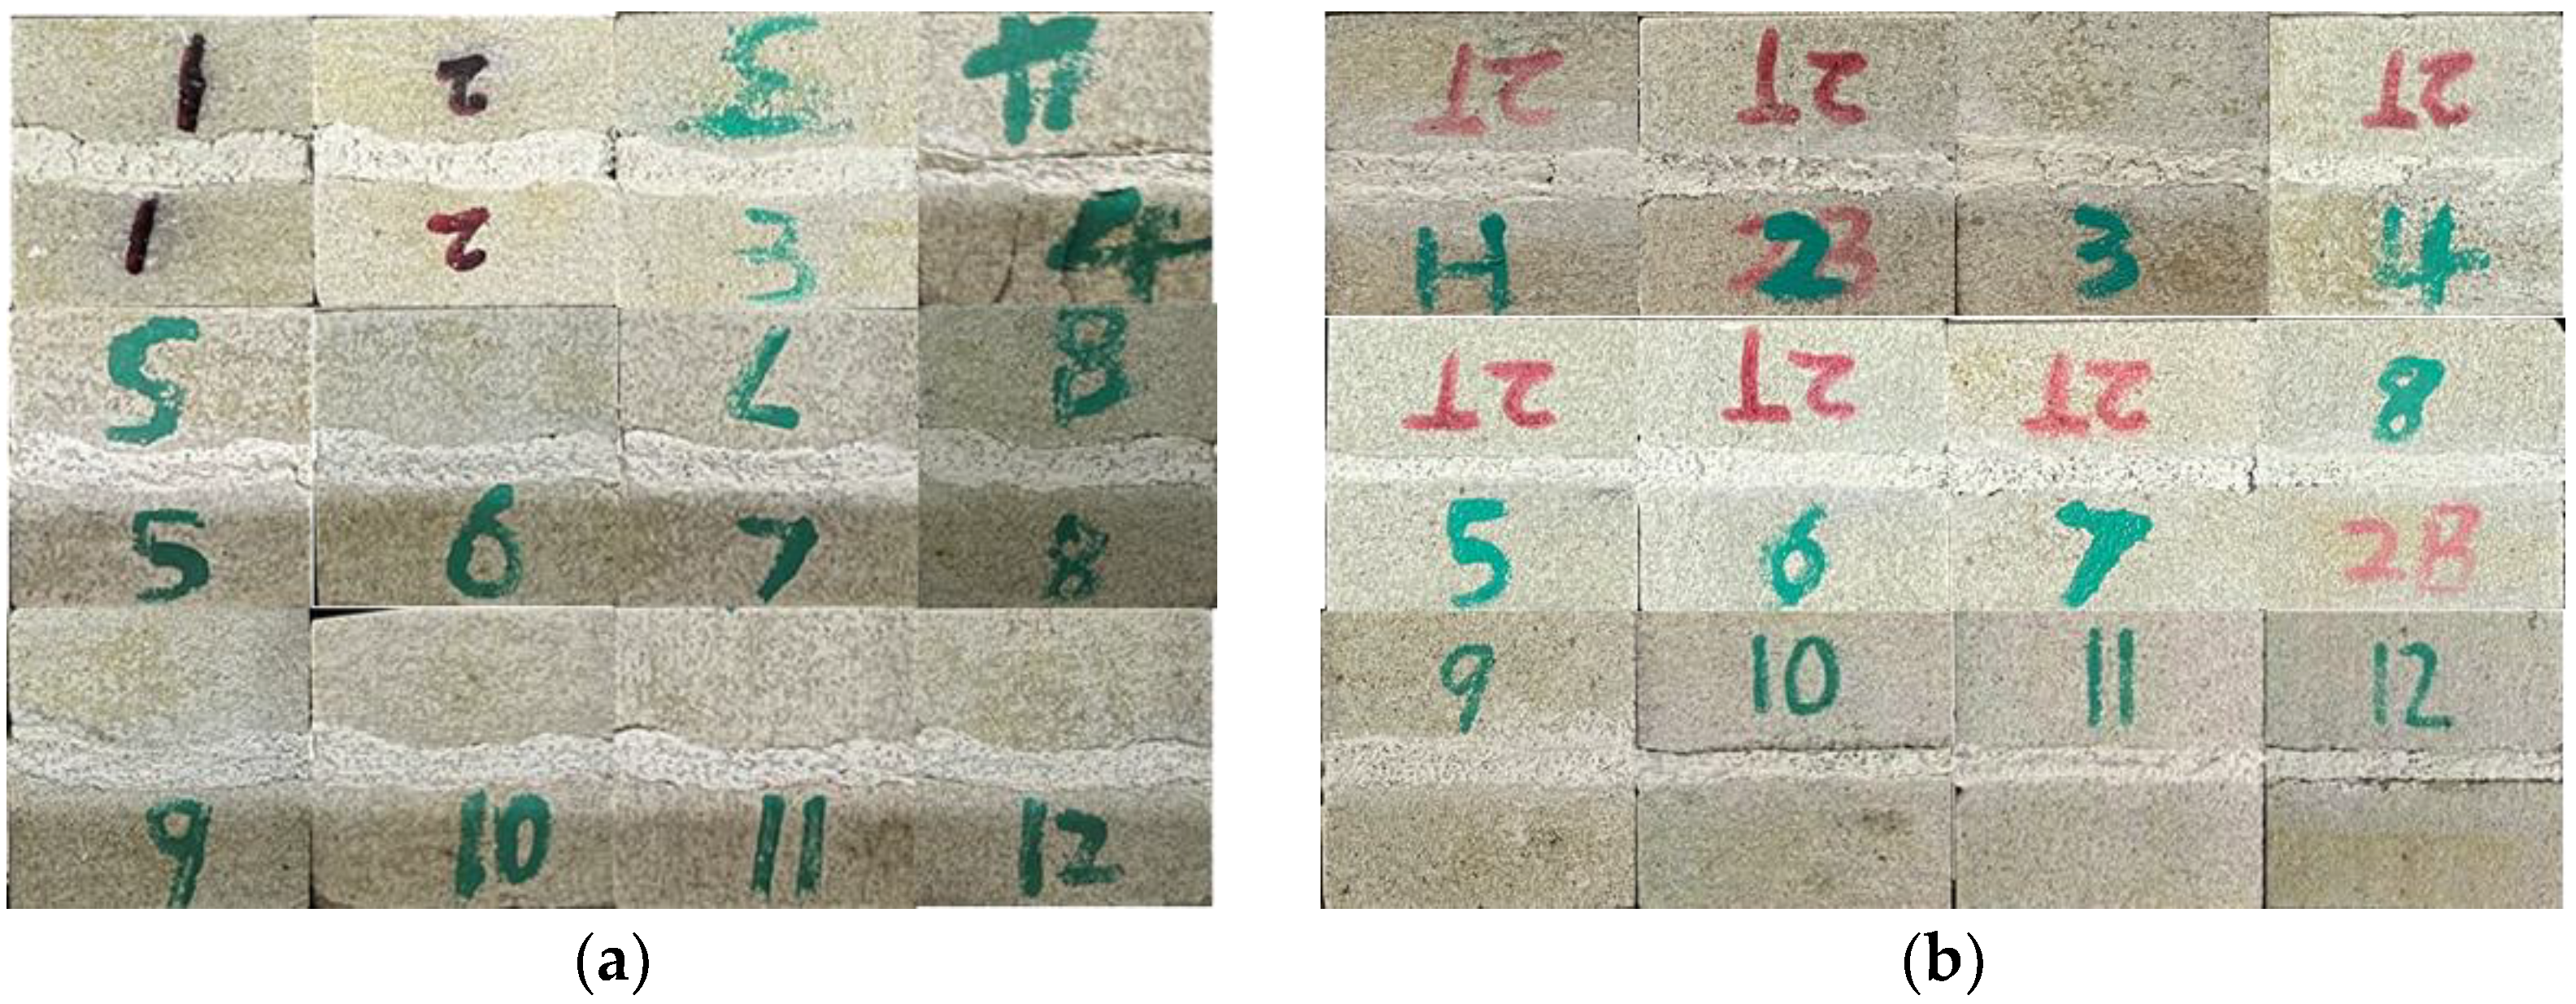
- High-precision engraving machines and high-precision 3D scanners are used to reproduce shear and tension faults, ensuring the comparability of faults. Fault rocks with different properties of fault gouge are closer to the properties of real fault zones.
- (2)
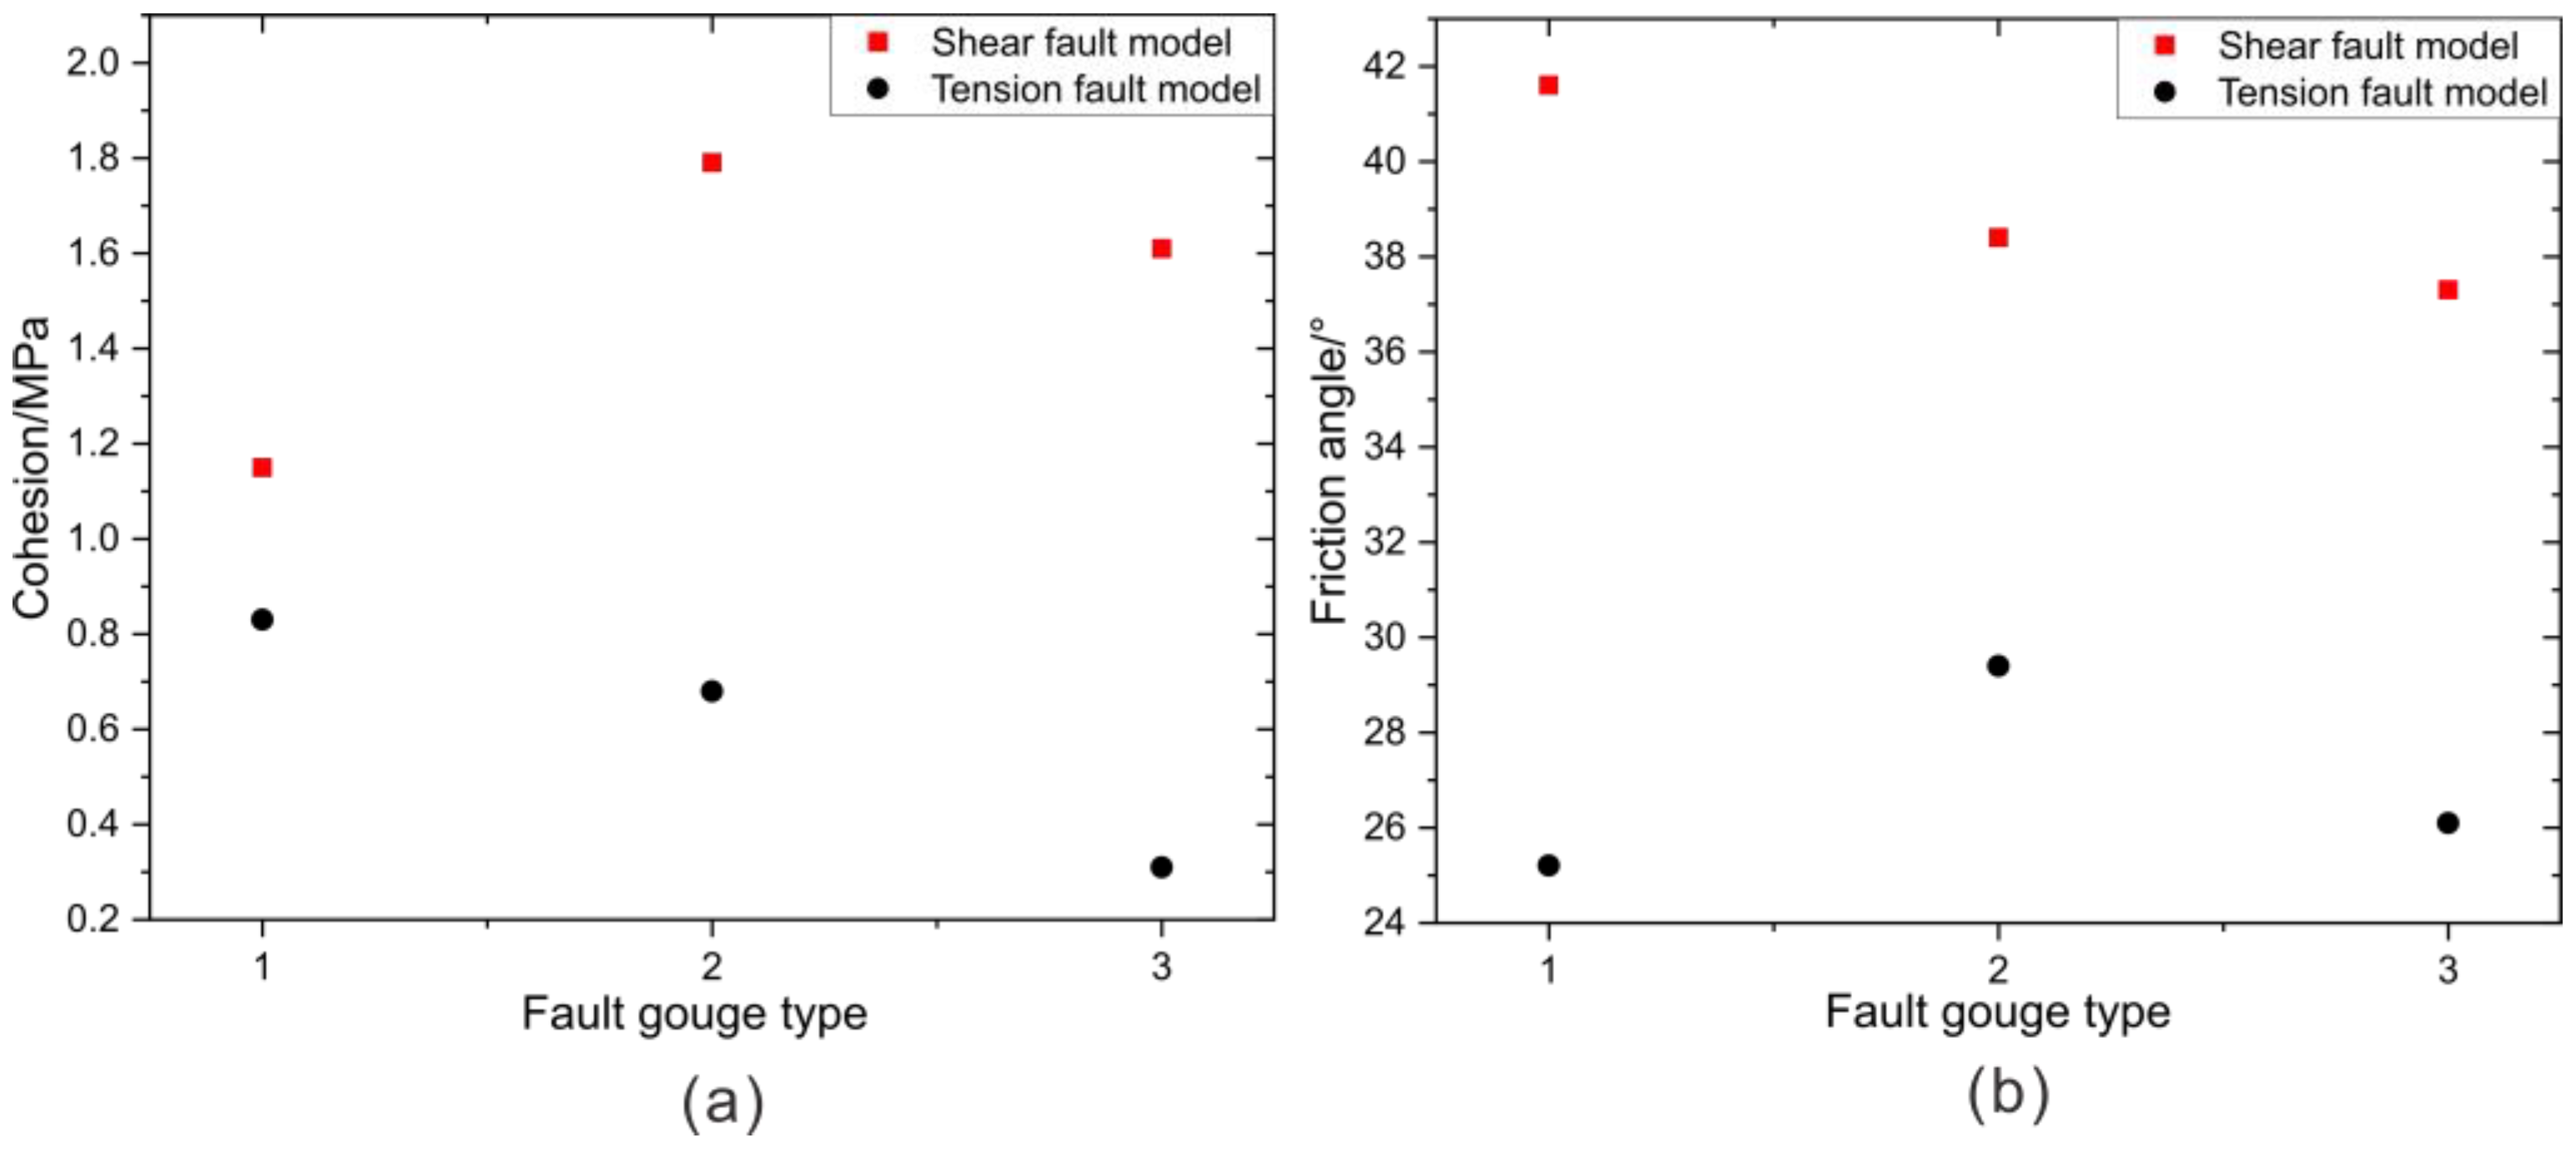
- Under the same experimental conditions, the shear strength of the shear-type fault surface model is higher than that of the tensile-type fault surface model, which means that the tensile-type fault zone is more likely to slip and activate during the injection and production process of the gas reservoir. Compared with the influence of clay mineral content in fault gouges, the roughness of the fault plane has a greater influence on the shear strength of fault rocks.
- (3)
- Within the same type of fault surface, the higher the clay mineral content in the fault gouge, the greater the shear strength of the fault rock.
- (4)
- Under the same fault model and normal stress conditions, fault gouge has no obvious influence rule on the roughness of the shear fault surface; under the same fault model and fault gouge conditions, the greater the normal stress, the smaller the roughness of the shear fault surface.
- (5)
- Due to the limitations of the experimental equipment, the fault plane was set to a horizontal state, which differs somewhat from the actual fault plane. However, by converting the stress state and dip angle of the actual fault plane, a similar method can be used. When the fault dip angle is small and the stress on the ground is the same, the roughness of the contact surface after activation is relatively small. Therefore, in the construction and operation stages of gas storage tanks, it is necessary to focus on faults with small dip angles and tensile-type faults as much as possible.
Author Contributions
Funding
Conflicts of Interest
References
- Zhang, N.; Liu, W.; Zhang, Y.; Shan, P.; Shi, X. Microscopic pore structure of surrounding rock for underground strategic petroleum reserve (SPR) caverns in bedded rock salt. Energies 2020, 13, 1565. [Google Scholar] [CrossRef] [Green Version]
- Liu, W.; Zhang, X.; Fan, J.; Li, Y.; Wang, L. Evaluation of potential for salt cavern gas storage and integration of brine extraction: Cavern utilization, Yangtze River Delta region. Nat. Resour. Res. 2020, 29, 3275–3290. [Google Scholar] [CrossRef]
- Liu, W.; Zhang, Z.; Chen, J.; Jiang, D.; Wu, F.; Fan, J.; Li, Y. Feasibility evaluation of large-scale underground hydrogen storage in bedded salt rocks of China: A case study in Jiangsu province. Energy 2020, 198, 117348. [Google Scholar] [CrossRef]
- Guo, Y.; Ying, Q.; Wang, D.; Zhang, H.; Huang, F.; Guo, H.; Xia, D. Experimental Study on Shear Characteristics of Structural Plane with Different Fluctuation Characteristics. Energies 2022, 15, 7563. [Google Scholar] [CrossRef]
- Ding, G.; Wei, H. Review on 20 years’ UGS construction in China and the prospect. Oil Gas Storage Transp. 2020, 39, 25–31. [Google Scholar]
- Zhang, T.; Li, Y.; Sun, S.; Bai, H. Accelerating flash calculations in unconventional reservoirs considering capillary pressure using an optimized deep learning algorithm. J. Pet. Sci. Eng. 2020, 195, 107886. [Google Scholar] [CrossRef]
- Wu, M.; Zhang, D.; Wang, W.; Li, M.; Liu, S.; Lu, J.; Gao, H. Numerical simulation of hydraulic fracturing based on two-dimensional surface fracture morphology reconstruction and combined finite-discrete element method. J. Nat. Gas Sci. Eng. 2020, 82, 103479. [Google Scholar] [CrossRef]
- Wu, M.; Wang, W.; Song, Z.; Liu, B.; Feng, C. Exploring the influence of heterogeneity on hydraulic fracturing based on the combined finite–discrete method. Eng. Fract. Mech. 2021, 252, 107835. [Google Scholar] [CrossRef]
- Xia, D.; Yang, Z.; Li, D.; Zhang, Y.; He, Y.; Luo, Y.; Zhao, X. Evaluation Method of the Vertical Well Hydraulic Fracturing Effect Based on Production Data. Geofluids 2021, 21, 1–12. [Google Scholar] [CrossRef]
- Xia, D.; Yang, Z.; Gao, T.; Li, H.; Lin, W. Characteristics of micro-and nano-pores in shale oil reservoirs. J. Pet. Explor. Prod. 2021, 11, 157–169. [Google Scholar] [CrossRef]
- Zhang, T.; Sun, S. A coupled Lattice Boltzmann approach to simulate gas flow and transport in shale reservoirs with dynamic sorption. Fuel 2019, 246, 196–203. [Google Scholar] [CrossRef]
- Zheng, Y.; Sun, J.; Qiu, X.; Lai, X.; Liu, J.; Guo, Z.; Min, Z. Connotation and evaluation technique of geological integrity of UGSs in oil/gas fields. Nat. Gas Ind. B 2020, 7, 594–603. [Google Scholar] [CrossRef]
- Liu, H.; Tong, R.; Hou, Z.; Dou, B.; Mao, H.; Huang, G. Review of Induced Seismicity Caused by Subsurface Fluid Injection and Production and Impacts on the Geothermal Energy Production from Deep High Temperature Rock. Adv. Eng. Sci. 2022, 54, 83–96. [Google Scholar]
- Wang, W.; Sun, S.; Le, H.; Shu, Y.; Zhu, F.; Fan, H.; Liu, Y. Experimental and numerical study on failure modes and shear strength parameters of rock-like specimens containing two infilled flaws. Int. J. Civ. Eng. 2019, 17, 1895–1908. [Google Scholar] [CrossRef]
- Barton, N.R. A model study of rock-joint deformation. Int. J. Rock Mech. Min. Sci. Geomech. Abstr. 1972, 9, 579–582. [Google Scholar] [CrossRef]
- Zhou, H.; Meng, F.; Zhang, C.; Hu, D.; Lu, J.; Xu, R. Investigation of the acoustic emission characteristics of artificial saw-tooth joints under shearing condition. Acta Geotech. 2016, 11, 925–939. [Google Scholar] [CrossRef]
- Jafari, M.; Hosseini, K.; Pellet, F.; Boulon, M.; Buzzi, O. Evaluation of shear strength of rock joints subjected to cyclic loading. Soil Dyn. Earthq. Eng. 2003, 23, 619–630. [Google Scholar] [CrossRef]
- Mirzaghorbanali, A.; Nemcik, J.; Aziz, N. Effects of Shear Rate on Cyclic Loading Shear Behaviour of Rock Joints Under Constant Normal Stiffness Conditions. Rock Mech. Rock Eng. 2014, 47, 1931–1938. [Google Scholar] [CrossRef]
- Xu, J.; Lei, J.; Liu, Y.; Wu, J. Experimental study on shear behavior of joints filled with different materials. Rock Soil Mech. 2019, 40, 4129–4137. [Google Scholar]
- Indraratna, B.; Oliveira, D.; Brown, E. A Shear-Displacement Criterion for Soil-Infilled Rock Discontinuities. Geotechnique 2010, 60, 623–633. [Google Scholar] [CrossRef]
- Indraratna, B.; Oliveira, D.; Brown, E.; De Assis, A. Effect of soil–infilled joints on the stability of rock wedges formed in a tunnel roof. Int. J. Rock Mech. Min. Sci. 2010, 47, 739–751. [Google Scholar] [CrossRef]
- Papaliangas, T.; Hencher, S.; Lumsden, A.; Manolopoulou, S. The effect of frictional fill thickness on the shear strength of rock discontinuities. Int. J. Rock Mech. Min. Sci. Geomech. Abstr. 1993, 30, 81–91. [Google Scholar] [CrossRef]
- As’Habi, F.; Lakirouhani, A. Numerical modeling of jointed rock samples under unconfined and confined conditions to study peak strength and failure mode. Arab. J. Geosci. 2021, 14, 3. [Google Scholar] [CrossRef]
- Liu, C.; Jiang, Q.; Xin, J.; Wu, S.; Liu, J.; Gong, F. Shearing damage evolution of natural rock joints with different wall strengths. Rock Mech. Rock Eng. 2022, 55, 1599–1617. [Google Scholar] [CrossRef]
- Wu, M.; Wang, W.; Shi, D.; Song, Z.; Li, M.; Luo, Y. Improved box-counting methods to directly estimate the fractal dimension of a rough surface. Measurement 2021, 177, 109303. [Google Scholar] [CrossRef]
- Zhou, H.; Xie, H. Direct estimation of the fractal dimensions of a fracture surface of rock. Surf. Rev. Lett. 2003, 10, 751–762. [Google Scholar] [CrossRef]
- Zhang, Y.; Zhou, H.; Xie, H. Improved cubic covering method for fractal dimensions of a fracture surface of rock. Chin. J. Rock Mech. Eng. 2005, 24, 3192–3196. [Google Scholar]
- Ai, T.; Zhang, R.; Zhou, H.; Pei, J. Box-counting methods to directly estimate the fractal dimension of a rock surface. Appl. Surf. Sci. 2014, 314, 610–621. [Google Scholar] [CrossRef]


| Fault Gouge Type | Mass Ratio | Clay Mineral Content (%) |
|---|---|---|
| NO. 1 | Kaolin/Coarse particles/Montmorillonite/illite/Water/Hydroxypropyl Methyl Cellulose = 30:20:37.5:12.5:60:2 | 49.4 |
| NO. 2 | Kaolin/Coarse particles/Montmorillonite/illite/Water/Hydroxypropyl Methyl Cellulose = 30:30:30:10:60:2 | 43.2 |
| NO. 3 | Kaolin/Coarse particles/Montmorillonite/illite/Water/Hydroxypropyl Methyl Cellulose = 30:40:22.5:7.5:60:2 | 37 |
| Fault Model | Experiment Number | Fault Gouge Type | Normal Stress (MPa) |
|---|---|---|---|
| Shear fault model | JQ-1 | NO. 1 | 2 |
| JQ-2 | 4 | ||
| JQ-3 | 6 | ||
| JQ-4 | 8 | ||
| JQ-5 | NO. 2 | 2 | |
| JQ-6 | 4 | ||
| JQ-7 | 6 | ||
| JQ-8 | 8 | ||
| JQ-9 | NO. 3 | 2 | |
| JQ-10 | 4 | ||
| JQ-11 | 6 | ||
| JQ-12 | 8 |
| Fault Model | Parameter | Normal | Tangential |
|---|---|---|---|
| Shear fault model | Displacement velocity | 0.1 KN/s | 1 mm/min |
| Force/Displacement Target | 15 KN | 10 mm | |
| Tension fault model | Displacement velocity | 1 mm/min | \ |
| displacement target | 10 mm | \ |
| Fault Model | Group Number | Cohesion (MPa) | Friction Angle (°) | Clay Mineral Content (%) |
|---|---|---|---|---|
| Shear fault model | Group 1 | 1.15 | 41.6 | 49.4 |
| Group 2 | 1.79 | 38.4 | 43.2 | |
| Group 3 | 1.61 | 37.3 | 37.0 | |
| Tension fault model | Group 4 | 0.83 | 25.2 | 49.4 |
| Group 5 | 0.68 | 29.4 | 43.2 | |
| Group 6 | 0.31 | 26.1 | 37.0 |
Disclaimer/Publisher’s Note: The statements, opinions and data contained in all publications are solely those of the individual author(s) and contributor(s) and not of MDPI and/or the editor(s). MDPI and/or the editor(s) disclaim responsibility for any injury to people or property resulting from any ideas, methods, instructions or products referred to in the content. |
© 2023 by the authors. Licensee MDPI, Basel, Switzerland. This article is an open access article distributed under the terms and conditions of the Creative Commons Attribution (CC BY) license (https://creativecommons.org/licenses/by/4.0/).
Share and Cite
Ding, G.; Liu, H.; Xia, D.; Wang, D.; Huang, F.; Guo, H.; Xie, L.; Guo, Y.; Wu, M.; Mao, H. Experimental Study of the Shear Characteristics of Fault Filled with Different Types of Gouge in Underground Gas Storage. Energies 2023, 16, 3119. https://doi.org/10.3390/en16073119
Ding G, Liu H, Xia D, Wang D, Huang F, Guo H, Xie L, Guo Y, Wu M, Mao H. Experimental Study of the Shear Characteristics of Fault Filled with Different Types of Gouge in Underground Gas Storage. Energies. 2023; 16(7):3119. https://doi.org/10.3390/en16073119
Chicago/Turabian StyleDing, Guosheng, Hejuan Liu, Debin Xia, Duocai Wang, Famu Huang, Haitao Guo, Lihuan Xie, Yintong Guo, Mingyang Wu, and Haijun Mao. 2023. "Experimental Study of the Shear Characteristics of Fault Filled with Different Types of Gouge in Underground Gas Storage" Energies 16, no. 7: 3119. https://doi.org/10.3390/en16073119