
A Critical Review of Polymer Electrolyte Membrane Fuel Cell Systems for Automotive Applications: Components, Materials, and Comparative Assessment

Abstract
:1. Introduction
2. Comparison between Electric and Conventional Vehicles
- Maximum torque can be immediately reached; as a result, acceleration is smoother than that obtained with a traditional ICE, especially those of large size or turbocharged;
- All parts included in a conventional car, such as the engine, radiator, pistons, spark plugs, fuel pumps, exhaust system, and timing belt, are instrumental in performing traction and prone to replacement over time; on the other hand, an electric-powered car presents fewer parts that are potentially replaceable, thus reducing maintenance costs by over 50%;
- All electric cars feature regenerative braking, which employs the electric motor to slow down the vehicle so that some of the power is returned to the battery; therefore, braking is more efficient and also reduces wear by developing less fine dust with consequent savings;
- Electric engines are based on a mature technology, so they allow traveling hundreds of thousands of kilometers without major maintenance [21].
3. Hydrogen Supply and Associated Costs
3.1. Production
3.2. Storage
3.3. Distribution
4. Fuel Cell Components
4.1. Proton Exchange Membranes
4.2. Electrodes
4.3. Electrocatalysts
- High activity in hydrogen oxidation, even at low catalyst loading (0.1–0.3 mg/cm2);
- Tolerance to carbon monoxide in a concentration ranging between 10 and 100 ppm;
- Stability in the selected operating conditions;
- Low cost.
4.4. Additional Components of the Membrane Electrode Assembly (MEA)
4.5. Bipolar Plates
4.6. Thermal and Water Management
5. Conclusions and Future Directions
Author Contributions
Funding
Data Availability Statement
Conflicts of Interest
References
- Bailey, D. How the Automobile Changed History; ABDO: North Mankato, MN, USA, 2016. [Google Scholar]
- Muratori, M.; Marano, V.; Rizzo, G.; Rizzoni, G. Electric mobility: From fossil fuels to renewable energy, opportunities and challenges. IFAC Proc. Vol. 2013, 46, 812–817. [Google Scholar]
- Andersen, L.G.; Larsen, J.K.; Fraser, E.S.; Schmidt, B.; Dyre, J.C. Rolling resistance measurement and model development. J. Transp. Eng. 2015, 141, 04014075. [Google Scholar]
- Babin, T.; Sangeetha, N.; Sudalaiyandi, D.P. Reducing the drag resistance of automotive cars by diminishing the wake separation zone. AIP Conf. Proc. 2018, 2039, 020078. [Google Scholar]
- Zhang, D.; Ivanco, A.; Filipi, Z. Model-based estimation of vehicle aerodynamic drag and rolling resistance. SAE Int. J. Commer. Veh. 2015, 8, 433–439. [Google Scholar]
- Andwari, A.M.; Pesiridis, A.; Rajoo, S.; Martinez-Botas, R.; Esfahanian, V. A review of Battery Electric Vehicle technology and readiness levels. Renew. Sustain. Energy Rev. 2017, 78, 414–430. [Google Scholar]
- Offer, G.J.; Howey, D.; Contestabile, M.; Clague, R.; Brandon, N.P. Comparative analysis of battery electric, hydrogen fuel cell and hybrid vehicles in a future sustainable road transport system. Energy Policy 2010, 38, 24–29. [Google Scholar]
- Ozsoysal, O.A. Effects of combustion efficiency on an Otto cycle. Int. J. Exergy 2010, 7, 232–242. [Google Scholar] [CrossRef]
- Gupta, H.N. Fundamentals of Internal Combustion Engines; PHI Learning: Delhi, India, 2009. [Google Scholar]
- Villante, C.; Genovese, A. Hydromethane: A bridge towards the hydrogen economy or an unsustainable promise? Int. J. Hydrog. Energy 2012, 37, 11541–11548. [Google Scholar]
- Stan, C. Alternative Propulsion for Automobiles; Springer: Cham, Switzerland, 2017. [Google Scholar]
- Jain, P.C. Climate change, greenhouse effect and climate change: Scientific basis and overview. Renew. Energy 1993, 4–5, 403–420. [Google Scholar]
- United States Environmental Protection Agency (EPA). EPA’s Report on the Environment (ROE). Available online: https://www.epa.gov/report-environment (accessed on 14 February 2023).
- United States Environmental Protection Agency (EPA). Air Toxics from Motor Vehicles; Fact sheet EPA 400-F-92-004; United States Environmental Protection Agency: Washington, DC, USA, 1995. [Google Scholar]
- Onofri, M.; Bernabeo, R.A.; Webster, K. Health and environmental impacts of NOx: An ultra-low level of NOx (oxides of nitrogen) achievable with a new technology. Glob. J. Eng. Sci. 2019, 2, GJES.MS.ID.000540. [Google Scholar]
- Kurt, O.K.; Zhang, J.; Pinkerton, K.E. Pulmonary health effects of air pollution. Curr. Opin. Pulm. Med. 2016, 22, 138–143. [Google Scholar] [CrossRef] [Green Version]
- Orellano, P.; Reynoso, J.; Quaranta, N. Short-term exposure to sulphur dioxide (SO2) and all-cause and respiratory mortality: A systematic review and meta-analysis. Environ. Int. 2021, 150, 106434. [Google Scholar] [CrossRef]
- Stone, R.; Ball, J.K. Automotive Engineering Fundamentals; SAE International: Warrendale, PA, USA, 2004. [Google Scholar]
- Zhang, H.; Sun, C.; Ge, M. Review of the research status of cost-effective zinc–iron redox flow batteries. Batteries 2022, 8, 202. [Google Scholar] [CrossRef]
- Abdin, A.; Zafaranloo, A.; Rafiee, A.; Mérida, W.; Lipiński, W.; Khalilpour, K.L. Hydrogen as an energy vector. Renew. Sustain. Energy Rev. 2020, 120, 109620. [Google Scholar] [CrossRef]
- Buekers, J.; Van Holderbeke, M.; Bierkens, J.; Int Panis, L. Health and environmental benefits related to electric vehicle introduction in EU countries. Transp. Res. D Transp. Environ. 2014, 33, 26–38. [Google Scholar] [CrossRef]
- Hermesmann, M.; Müller, T.E. Green, turquoise, blue, or grey? Environmentally friendly hydrogen production in transforming energy systems. Prog. Energy Combust. Sci. 2022, 90, 100996. [Google Scholar] [CrossRef]
- Megía, P.J.; Vizcaíno, A.J.; Calles, J.A.; Carrero, A. Hydrogen production technologies: From fossil fuels toward renewable sources. A mini review. Energy Fuels 2021, 35, 16403–16415. [Google Scholar] [CrossRef]
- Espegren, K.; Damman, S.; Pisciella, P.; Graabak, I.; Tomasgar, A. The role of hydrogen in the transition from a petroleum economy to a low-carbon society. Int. J. Hydrog. Energy 2021, 46, 23125–23138. [Google Scholar] [CrossRef]
- Taipabu, M.I.; Viswanathan, K.; Wu, W.; Hattu, N.; Atabani, A.E. A critical review of the hydrogen production from biomass-based feedstocks: Challenge, solution, and future prospect. Process Saf. Environ. Prot. 2022, 164, 384–407. [Google Scholar] [CrossRef]
- García, L. Hydrogen production by steam reforming of natural gas and other nonrenewable feedstocks. In Compendium of Hydrogen Energy—Hydrogen Production and Purification; Subramani, V., Basile, A., Nejat Veziroğlu, T., Eds.; Woodhead Publishing: Sawston, UK, 2015; Chapter 4; pp. 83–107. [Google Scholar]
- Sengodan, S.; Lan, R.; Humphreys, J.; Du, D.; Xu, W.; Wang, H.; Tao, S. Advances in reforming and partial oxidation of hydrocarbons for hydrogen production and fuel cell applications. Renew. Sustain. Energy Rev. 2018, 82, 761–780. [Google Scholar] [CrossRef]
- Agyekum, E.B.; Nutakor, C.; Agwa, A.M.; Kamel, S. A critical review of renewable hydrogen production methods: Factors affecting their scale-up and its role in future energy generation. Membranes 2022, 12, 173. [Google Scholar] [CrossRef]
- Shiva Kumar, S.; Himabindu, V. Hydrogen production by PEM water electrolysis—A review. Mater. Sci. Energy Technol. 2019, 2, 442–454. [Google Scholar] [CrossRef]
- Kalinci, Y.; Hepbasli, A.; Dincer, I. Biomass-based hydrogen production: A review and analysis. Int. J. Hydrog. Energy 2009, 34, 8799–8817. [Google Scholar] [CrossRef]
- Yalçin, S. A review of nuclear hydrogen production. Int. J. Hydrog. Energy 1989, 14, 551–561. [Google Scholar] [CrossRef]
- Ishaq, H.; Dincer, I.; Crawford, C. A review on hydrogen production and utilization: Challenges and opportunities. Int. J. Hydrog. Energy 2022, 47, 26238–26264. [Google Scholar] [CrossRef]
- Lee, J.E.; Shafiq, I.; Hussain, M.; Lam, S.S.; Rhee, G.H.; Park, Y.K. A review on integrated thermochemical hydrogen production from water. Int. J. Hydrog. Energy 2022, 47, 4346–4356. [Google Scholar] [CrossRef]
- Das, D.; Nejat Veziroǧlu, T. Hydrogen production by biological processes: A survey of literature. Int. J. Hydrog. Energy 2001, 26, 13–28. [Google Scholar] [CrossRef]
- Lopez, G.; Santamaria, L.; Lemonidou, A.; Zhang, S.; Wu, C.; Sipra, A.T.; Gao, N. Hydrogen generation from biomass by pyrolysis. Nat. Rev. Methods Prim. 2022, 2, 20. [Google Scholar] [CrossRef]
- Parthasarathy, P.; Sheeba Narayanan, K. Hydrogen production from steam gasification of biomass: Influence of process parameters on hydrogen yield—A review. Renew. Energy 2014, 66, 570–579. [Google Scholar] [CrossRef]
- Forruque Ahmed, S.; Rafa, N.; Mofijur, M.; Anjum Badruddin, I.; Inayat, A.; Sawkat Ali, M.; Farrok, O.; Yunus Khan, T.M. Biohydrogen production from biomass sources: Metabolic pathways and economic analysis. Front. Energy Res. 2021, 9, 753878. [Google Scholar] [CrossRef]
- Amirthan, T.; Perera, M.S.A. The role of storage systems in hydrogen economy: A review. J. Nat. Gas Sci. Eng. 2022, 108, 104843. [Google Scholar] [CrossRef]
- US DRIVE Partnership. Target Explanation Document: Onboard Hydrogen Storage for Light-Duty Fuel Cell Vehicles; US Department of Energy: Washington, DC, USA, 2017. [Google Scholar]
- Satyapal, S.; Petrovic, J.; Read, C.; Thomas, G.; Ordaz, G. The U.S. Department of Energy’s National Hydrogen Storage Project: Progress towards meeting hydrogen-powered vehicle requirements. Catal. Today 2007, 120, 246–256. [Google Scholar] [CrossRef] [Green Version]
- Nash, D.; Aklil, D.; Johnson, E.; Gazey, R.; Ortisi, V. Hydrogen storage: Compressed gas. In Comprehensive Renewable Energy; Sayigh, A., Ed.; Elsevier: Amsterdam, The Netherlands, 2012; Chapter 4.05; pp. 131–155. [Google Scholar]
- Chen, Y.; Zhao, S.; Ma, H.; Wang, H.; Hua, L.; Fu, S. Analysis of hydrogen embrittlement on aluminum alloys for vehicle-mounted hydrogen storage tanks: A review. Metals 2021, 11, 1303. [Google Scholar] [CrossRef]
- Alves, M.P.; Gul, W.; Cimini Junior, C.A.; Ha, S.K. A review on industrial perspectives and challenges on material, manufacturing, design and development of compressed hydrogen storage tanks for the transportation sector. Energies 2022, 15, 5152. [Google Scholar] [CrossRef]
- Nejat Veziroglu, T.; Barbir, F. Hydrogen: The wonder fuel. Int. J. Hydrog. Energy 1992, 17, 391–404. [Google Scholar] [CrossRef]
- Rico-Zavala, A.; Gurrola, M.P.; Arriaga, L.G.; Banuelos, J.A.; Álvarez-Contreras, L.; Carbone, A.; Saccà, A.; Matera, F.V.; Pedicini, R.; Álvarez, A.; et al. Synthesis and characterization of composite membranes modified with Halloysite nanotubes and phosphotungstic acid for electrochemical hydrogen pumps. Renew. Energy 2018, 122, 163–172. [Google Scholar] [CrossRef]
- Aziz, M. Liquid hydrogen: A review on liquefaction, storage, transportation, and safety. Energies 2021, 14, 5917. [Google Scholar] [CrossRef]
- Pedicini, R.; Gatto, I.; Gatto, M.F.; Passalacqua, E. Carbonaceous materials in hydrogen storage. In Hydrogen Storage Technologies; Sankir, M., Demirci Sankir, N., Eds.; Wiley: Hoboken, NJ, USA, 2018; Chapter 7; pp. 260–298. [Google Scholar]
- Chen, P.; Akiba, E.; Orimo, S.; Zuettel, A.; Schlapbach, L. Hydrogen storage by reversible metal hydride formation. In Hydrogen Science and Engineering: Materials, Processes, Systems and Technology; Stolten, D., Emonts, B., Eds.; Wiley: Hoboken, NJ, USA, 2016; Chapter 31; pp. 763–790. [Google Scholar]
- Pedicini, R.; Gatto, I.; Passalacqua, E. Solid-state materials for hydrogen storage. In Nanostructured Materials for Next-Generation Energy Storage and Conversion; Li, F., Bashir, S., Liu, J.L., Eds.; Springer: Heidelberg, Germany, 2018; Volume 2, Chapter 15; pp. 443–467. [Google Scholar]
- Friedlmeier, G.; Groll, M. Experimental analysis and modeling of the hydriding kinetics of Ni-doped and pure Mg. J. Alloy. Compd. 1997, 253–254, 550–555. [Google Scholar] [CrossRef]
- Kumar, S.; Miyaoka, H.; Ichikawa, T.; Dey, G.K.; Kojima, Y. Micro-alloyed Mg2Ni for better performance as negative electrode of Ni-MH battery and hydrogen storage. Int. J. Hydrog. Energy 2017, 42, 5220–5226. [Google Scholar] [CrossRef]
- Yang, J.; Sudik, A.; Wolverton, C.; Siegel, D.J. High capacity hydrogen storage materials: Attributes for automotive applications and techniques for materials discovery. Chem. Soc. Rev. 2010, 39, 656–675. [Google Scholar] [CrossRef] [Green Version]
- Liu, Y.; Yang, Y.; Zhou, Y.; Zhang, Y.; Gao, M.; Pan, H. Hydrogen storage properties and mechanisms of the Mg(BH4)2–NaAlH4 system. Int. J. Hydrog. Energy 2012, 37, 17137–17145. [Google Scholar] [CrossRef]
- Zittel, W.; Wurster, R. Hydrogen in the Energy Sector; Ludwig-Bölkow-Systemtechnik: Ottobrunn, Germany, 1996. [Google Scholar]
- Taylor, J.B.; Alderson, J.E.A.; Kalyanam, K.M.; Lyle, A.B.; Phillips, L.A. A technical and economic assessment of methods for the storage of large quantities of hydrogen. Int. J. Hydrog. Energy 1986, 11, 5–22. [Google Scholar] [CrossRef]
- Peters, M.S.; Timmerhaus, K.D.; West, R.E. Plant Design and Economics for Chemical Engineers; McGraw-Hill: New York City, NY, USA, 2003. [Google Scholar]
- Fan, L.; Tu, Z.; Chan, S.H. Recent development of hydrogen and fuel cell technologies: A review. Energy Rep. 2021, 7, 8421–8446. [Google Scholar] [CrossRef]
- Marin, G.D.; Naterer, G.F.; Gabriel, K. Rail transportation by hydrogen vs. electrification—Case study for Ontario, Canada, II: Energy supply and distribution. Int. J. Hydrog. Energy 2010, 35, 6097–6107. [Google Scholar] [CrossRef]
- Alkhaledi, A.N.F.N.R.; Sampath, S.; Pilidis, P. A hydrogen fuelled LH2 tanker ship design. Ships Offshore Struct. 2022, 17, 1555–1564. [Google Scholar] [CrossRef]
- Jankiewicz, S.P.; Siang, C.C.; Yao, X.; Santangelo, P.E.; Marshall, A.W.; Roby, R.J. Analyzing fire-induced dispersion and detector response in complex enclosures using salt-water modeling. Fire Saf. J. 2014, 65, 19–29. [Google Scholar] [CrossRef]
- Santangelo, P.E.; Jacobs, B.C.; Ren, N.; Sheffel, J.A.; Corn, M.L.; Marshall, A.W. Suppression effectiveness of water-mist sprays on accelerated wood-crib fires. Fire Saf. J. 2014, 70, 98–111. [Google Scholar] [CrossRef]
- Santangelo, P.E.; Tarozzi, L.; Tartarini, P. Full-scale experiments of fire control and suppression in enclosed car parks: A comparison between sprinkler and water-mist systems. Fire Technol. 2016, 52, 1369–1407. [Google Scholar] [CrossRef]
- Santangelo, P.E.; Tarozzi, L.; Tartarini, P. Full-scale experiments of water-mist systems for control and suppression of sauna fires. Fire 2022, 5, 214. [Google Scholar] [CrossRef]
- Li, H.; Niu, R.; Li, W.; Lu, H.; Cairney, J.; Chen, Y.S. Hydrogen in pipeline steels: Recent advances in characterization and embrittlement mitigation. J. Nat. Gas Sci. Eng. 2022, 105, 104709. [Google Scholar] [CrossRef]
- Strianese, M.; Torricelli, N.; Tarozzi, L.; Santangelo, P.E. Experimental assessment of the acoustic performance of nozzles designed for clean agent fire suppression. Appl. Sci. 2023, 13, 186. [Google Scholar] [CrossRef]
- Yee, R.S.L.; Rozendal, R.A.; Zhang, K.; Ladewig, B.P. Cost effective cation exchange membranes: A review. Chem. Eng. Res. Des. 2012, 90, 950–959. [Google Scholar] [CrossRef]
- Watanabe, M. Structure of Electrochemical Cell for Wetting Diaphragm of Solid Polymer Electrolyte. European Patent EP0499593A1, 2 May 2001. [Google Scholar]
- Vanderborgh, N.E.; Hadstrom, J.C. Fuel Cell Water Transport. US Patent US4973530A, 27 November 1990. [Google Scholar]
- Laribi, S.; Mammar, K.; Sahli, Y.; Koussa, K. Air supply temperature impact on the PEMFC impedance. J. Energy Storage 2018, 17, 327–335. [Google Scholar] [CrossRef]
- Murugesan, K.; Senniappan, V. Investigation of water management dynamics on the performance of a Ballard-Mark-V Proton Exchange Membrane Fuel Cell stack system. Int. J. Electrochem. Sci. 2013, 8, 7885–7904. [Google Scholar]
- Wehkamp, N.; Breitwieser, M.; Büchler, A.; Klingele, B.M.; Zengerle, R.; Thiele, S. Directly deposited Nafion/TiO2 composite membranes for high power medium temperature fuel cells. RSC Adv. 2016, 6, 24261–24266. [Google Scholar] [CrossRef] [Green Version]
- Chien, H.C.; Tsai, L.D.; Lai, C.M.; Lin, J.N.; Zhu, C.Y.; Chang, F.C. Characteristics of high-water-uptake activated carbon/Nafion hybrid membranes for proton exchange membrane fuel cells. J. Power Sources 2013, 226, 87–93. [Google Scholar] [CrossRef]
- Peron, J.; Mani, A.; Zhao, X.; Edwards, D.; Adachi, M.; Soboleva, T.; Shi, Z.; Xie, Z.; Navessin, T.; Holdcroft, S. Properties of Nafion® NR-211 membranes for PEMFCs. J. Membr. Sci. 2010, 356, 44–51. [Google Scholar]
- Shi, S.; Chen, G.; Wang, Z.; Chen, X. Mechanical properties of Nafion 212 proton exchange membrane subjected to hygrothermal aging. J. Power Sources 2013, 238, 318–323. [Google Scholar] [CrossRef]
- Kúš, P. Thin-Film Catalysts for Proton Exchange Membrane Water Electrolyzers and Unitized Regenerative Fuel Cells; Springer: Cham, Switzerland, 2019. [Google Scholar]
- Jeon, Y.; Hwang, H.; Park, J.; Hwang, H.; Shul, Y.G. Temperature-dependent performance of the polymer electrolyte membrane fuel cell using short-side-chain perfluorosulfonic acid ionomer. Int. J. Hydrog. Energy 2014, 39, 11690–11699. [Google Scholar] [CrossRef]
- Lin, H.L.; Yu, T.L.; Han, F.H. A method for improving ionic conductivity of Nafion membranes and its application to PEMFC. J. Polym. Res. 2006, 13, 379–385. [Google Scholar]
- Yu, T.L.; Lin, H.L.; Shen, K.S.; Huang, L.N.; Chang, Y.C.; Jung, G.B.; Huang, J.C. Nafion/PTFE composite membranes for fuel cell applications. J. Polym. Res. 2004, 11, 217–224. [Google Scholar] [CrossRef]
- Sone, Y.; Ekdunge, P.; Simonsson, D. Proton conductivity of Nafion 117 as measured by a four-electrode AC impedance method. J. Electrochem. Soc. 1996, 143, 1254–1259. [Google Scholar] [CrossRef]
- Bose, S.; Kuila, T.; Nguyen, T.X.H.; Kim, N.H.; Lau, K.; Lee, J.H. Polymer membranes for high temperature proton exchange membrane fuel cell: Recent advances and challenge. Prog. Polym. Sci. 2011, 36, 813–843. [Google Scholar] [CrossRef]
- James, B.D.; Huya-Kouadio, J.M.; Houcins, C.; DeSantis, D.A. Mass Production Cost Estimation of Direct H2 PEM Fuel Cell Systems for Transportation Applications: 2016 Update; Strategic Analysis: Arlington, VA, USA, 2016. [Google Scholar]
- Sun, X.; Simonsen, S.C.; Norby, T.; Chatzitakis, A. Composite membranes for High Temperature PEM Fuel Cells and electrolysers: A critical review. Membranes 2019, 9, 83. [Google Scholar] [CrossRef] [PubMed] [Green Version]
- Saccà, A.; Carbone, A.; Gatto, I.; Pedicini, R.; Passalacqua, E. Synthesized Yttria Stabilised Zirconia as filler in Proton Exchange Membranes (PEMs) with enhanced stability. Polym. Test. 2018, 65, 322–330. [Google Scholar] [CrossRef]
- Sun, C.; Negro, E.; Nale, A.; Pagot, G.; Vezzù, K.; Zawodzinski, T.A.; Meda, L.; Gambaro, C.; Di Noto, V. An efficient barrier toward vanadium crossover in redox flow batteries: The bilayer [Nafion/(WO3)x] hybrid inorganic-organic membrane. Electrochim. Acta 2021, 378, 138133. [Google Scholar] [CrossRef]
- Carbone, A.; Gaeta, M.; Romeo, A.; Portale, G.; Pedicini, R.; Gatto, I.; Castriciano, M.A. Porphyrin/sPEEK membranes with improved conductivity and durability for PEFC technology. ACS Appl. Energy Mater. 2018, 1, 1664–1673. [Google Scholar] [CrossRef]
- Carbone, A.; Pedicini, R.; Gatto, I.; Saccà, A.; Patti, A.; Bella, G.; Cordaro, M. Development of polymeric membranes based on quaternized polysulfones for AMFC applications. Polymers 2020, 12, 283. [Google Scholar] [CrossRef] [Green Version]
- Rajabi, Z.; Javanbakht, M.; Hooshyari, K.; Adibi, M.; Badiei, A. Phosphoric acid doped polybenzimidazole based polymer electrolyte membrane and functionalized SBA-15 mesoporous for elevated temperature fuel cell. Int. J. Hydrog. Energy 2021, 46, 33241–33259. [Google Scholar] [CrossRef]
- Atanasoski, R.; Dodelet, J.-P. Fuel cells—Proton-Exchange Membrane Fuel Cells Catalysts: Non-platinum. In Encyclopedia of Electrochemical Power Sources; Garche, J., Ed.; Elsevier: Amsterdam, The Netherlands, 2009; pp. 639–649. [Google Scholar]
- Gatto, I.; Saccà, A.; Carbone, A.; Pedicini, R.; Passalacqua, E. MEAs for Polymer Electrolyte Fuel Cell (PEFC) working at medium temperature. J. Fuel Cell Sci. Technol. 2006, 3, 361–365. [Google Scholar] [CrossRef]
- Tasic, G.S.; Miljanic, S.S.; Kaninski, M.P.M.; Saponjic, D.P.; Nikolic, V.M. Non-noble metal catalyst for a future Pt free PEMFC. Electrochem. Commun. 2009, 11, 2097–2100. [Google Scholar] [CrossRef]
- Wang, B. Recent development of non-platinum catalysts for oxygen reduction reaction. J. Power Sources 2005, 152, 1–15. [Google Scholar] [CrossRef]
- Harrison, K.W.; Martin, G.D.; Ramsden, T.G. The Wind-to-Hydrogen Project: Operational Experience, Performance Testing, and Systems Integration; Technical report NREL/TP-550-44082; National Renewable Energy Laboratory: Golden, CO, USA, 2009. [Google Scholar]
- Chong, L.; Wen, J.; Kubal, J.; Sen, F.G.; Zou, J.; Greeley, J.; Chan, M.; Barkholtz, H.; Ding, W.; Liu, D.-J. Ultralow-loading platinum-cobalt fuel cell catalysts derived from imidazolate frameworks. Science 2018, 362, 1276–1281. [Google Scholar] [CrossRef] [PubMed]
- Wang, C.; An, C.; Qin, C.; Gomaa, H.; Deng, Q.; Wu, S.; Hu, N. Noble metal-based catalysts with core-shell structure for oxygen reduction reaction: Progress and prospective. Nanomaterials 2022, 12, 2480. [Google Scholar] [CrossRef] [PubMed]
- Mu, Y.-T.; Weber, A.Z.; Gu, Z.-L.; Tao, W.-Q. Mesoscopic modeling of transport resistances in a polymer-electrolyte fuel-cell catalyst layer: Analysis of hydrogen limiting currents. Appl. Energy 2019, 255, 113895. [Google Scholar] [CrossRef]
- Ganesan, R.; Lee, J.S. Tungsten carbide microspheres as a noble-metal-economic electrocatalyst for methanol oxidation. Angew. Chem. Int. Ed. 2005, 44, 6557–6560. [Google Scholar] [CrossRef]
- Barnett, C.J.; Burstein, G.T.; Kucernak, A.R.; Williams, K.R. Electrocatalytic activity of some carburised nickel, tungsten and molybdenum compounds. Electrochim. Acta 1997, 42, 2381–2388. [Google Scholar] [CrossRef]
- Shi, Z.; Zhang, J. Density functional theory study of transitional metal macrocyclic complexes’ dioxygen-binding abilities and their catalytic activities toward oxygen reduction reaction. J. Phys. Chem. C 2007, 111, 7084–7090. [Google Scholar] [CrossRef] [Green Version]
- Iyuke, S.E.; Mohamad, A.B.; Kadhum, A.A.H.; Daud, W.R.W.; Rachid, C. Improved membrane and electrode assemblies for proton exchange membrane fuel cells. J. Power Sources 2003, 114, 195–202. [Google Scholar] [CrossRef]
- Dao, D.V.; Adilbish, G.; Lee, I.H.; Yu, Y.T. Enhanced electrocatalytic property of Pt/C electrode with double catalyst layers for PEMFC. Int. J. Hydrogen Energy 2019, 44, 24580–24590. [Google Scholar]
- Cannio, M.; Righi, S.; Santangelo, P.E.; Romagnoli, M.; Pedicini, R.; Carbone, A.; Gatto, I. Smart catalyst deposition by 3D printing for Polymer Electrolyte Membrane Fuel Cell manufacturing. Renew. Energy 2021, 163, 414–422. [Google Scholar] [CrossRef]
- Gould, B.D.; Rodgers, J.A.; Schuette, M.; Bethune, K.; Louis, S.; Rocheleau, R.; Swyder-Lyons, K. Performance and limitations of 3D-printed bipolar plates in fuel cells. ECS J. Solid State Sci. Technol. 2015, 4, P3063. [Google Scholar] [CrossRef]
- Huang, W.; Finnerty, C.; Sharp, R.; Wang, K.; Balili, B. High-performance 3D printed microtubular Solid Oxide Fuel Cells. Adv. Mater. Technol. 2017, 2, 1600258. [Google Scholar] [CrossRef]
- Wang, X.; Ma, H.; Peng, H.; Wang, Y.; Wang, G.; Xiao, L.; Lu, J.; Zhuang, L. Enhanced mass transport and water management of polymer electrolyte fuel cells via 3-D printed architectures. J. Power Sources 2021, 515, 230636. [Google Scholar] [CrossRef]
- Piri, H.; Bi, X.T.; Li, H.; Wang, H. 3D-printed fuel-cell bipolar plates for evaluating flow-field performance. Clean Energy 2020, 4, 142–157. [Google Scholar] [CrossRef]
- Pelaccia, R.; Santangelo, P.E. A Homogeneous Flow Model for nitrogen cooling in the aluminum-alloy extrusion process. Int. J. Heat Mass Transf. 2022, 195, 123202. [Google Scholar] [CrossRef]
- GASKATEL Gas Diffusion Electrodes. Available online: https://gaskatel.de/en/gas-diffusion-electrodes/ (accessed on 15 February 2023).
- Millington, B.; Whipple, V.; Pollet, B.G. A novel method for preparing proton exchange membrane fuel cell electrodes by the ultrasonic-spray technique. J. Power Sources 2011, 196, 8500–8508. [Google Scholar] [CrossRef]
- Santangelo, P.E.; Allesina, G.; Bolelli, G.; Lusvarghi, L.; Matikainen, V.; Vuoristo, P. Infrared thermography as a Non-Destructive Testing solution for thermal spray metal coatings. J. Therm. Spray Technol. 2017, 26, 1982–1993. [Google Scholar] [CrossRef]
- Santangelo, P.E.; Romagnoli, M.; Puglia, M. An experimental approach to evaluate drying kinetics and foam formation in inks for inkjet printing of fuel-cell layers. Exp. Therm. Fluid Sci. 2022, 135, 110631. [Google Scholar] [CrossRef]
- Willert, A.; Tabary, F.Z.; Zubkova, T.; Santangelo, P.E.; Romagnoli, M.; Baumann, R.R. Multilayer additive manufacturing of catalyst-coated membranes for polymer electrolyte membrane fuel cells by inkjet printing. Int. J. Hydrog. Energy 2022, 47, 20973–20986. [Google Scholar] [CrossRef]
- Heinzel, A.; Mahlendorf, F.; Niemzig, O.; Kreuz, C. Injection moulded low-cost bipolar plates for PEM fuel cells. J. Power Sources 2004, 131, 35–40. [Google Scholar] [CrossRef]
- de Bruijn, F.A.; Makkus, R.C.; Mallant, R.K.A.M.; Janssen, G.J.M. Materials for state-of-the-art PEM fuel cells, and their suitability for operation above 100 °C. In Advances in Fuel Cells; Elsevier: Amsterdam, The Netherlands, 2007; Volume 1, Chapter 5; pp. 235–336. [Google Scholar]
- Włodarczyk, R.K. Porous composite for bipolar plate in low emission hydrogen fuel cells. J. Ecol. Eng. 2018, 19, 225–232. [Google Scholar] [CrossRef]
- Busick, D.N.; Wilson, M.S. Low-Cost Composite Materials for PEFC Bipolar Plates; Report LA-UR-R-98-4129; Los Alamos National Laboratory: Los Alamos, NM, USA, 1999. [Google Scholar]
- Cho, E.A.; Jeon, U.S.; Hong, S.A.; Oh, I.H.; Kang, S.G. Performance of a 1-kW-class PEMFC stack using TiN-coated 316 stainless steel bipolar plates. J. Power Sources 2005, 142, 177–183. [Google Scholar] [CrossRef]
- Mepsted, G.O.; Moore, J.M. Performance and durability of bipolar plate materials. In Handbook of Fuel Cells; Wiley: Hoboken, NJ, USA, 2010. [Google Scholar]
- Kahraman, H.; Orhan, M.F. Flow field bipolar plates in a proton exchange membrane fuel cell: Analysis & modeling. Energy Convers. Manag. 2017, 133, 363–384. [Google Scholar]
- Baroutaji, A.; Arjunan, A.; Ramadan, M.; Robinson, J.; Alaswad, A.; Abdelkareem, M.A.; Olabi, A.G. Advancements and prospects of thermal management and waste heat recovery of PEMFC. Int. J. Thermofluids 2021, 9, 100064. [Google Scholar] [CrossRef]
- İnci, M.; Buyuk, M.; Demir, M.H.; Ilbey, G. A review and research on fuel cell electric vehicles: Topologies, power electronic converters, energy management methods, technical challenges, marketing and future aspects. Renew. Sustain. Energy Rev. 2021, 137, 110648. [Google Scholar] [CrossRef]
- Ramos-Alavarado, B.; Li, P.; Liu, H.; Hernandez-Guerrero, A. CFD study of liquid-cooled heat sinks with microchannel flow field configurations for electronics, fuel cells, and concentrated solar cells. Appl. Therm. Eng. 2011, 31, 2494–2507. [Google Scholar] [CrossRef]
- Santangelo, P.E.; Corticelli, M.A.; Tartarini, P. Spray cooling by gently-deposited droplets: Experiments and modeling of heat-transfer mechanisms. In Proceedings of the 15th International Heat Transfer Conference (IHTC-15), Kyoto, Japan, 10–15 August 2014. [Google Scholar]
- Fly, A.; Thring, R.H. A comparison of evaporative and liquid cooling methods for fuel cell vehicles. Int. J. Hydrog. Energy 2016, 41, 14217–14229. [Google Scholar] [CrossRef] [Green Version]
- Santangelo, P.E.; Corticelli, M.A.; Tartarini, P. Experimental and numerical analysis of thermal interaction between two droplets in spray cooling of heated surfaces. Heat Transf. Eng. 2018, 39, 217–228. [Google Scholar] [CrossRef]
- Ramezanizadeh, M.; Alhuyi Nazar, M.; Hossein Ahmadi, M.; Chen, L. A review on the approaches applied for cooling fuel cells. Int. J. Heat Mass Transf. 2019, 139, 517–525. [Google Scholar] [CrossRef]
- Berg, P.; Promislow, K.; St Pierre, J.; Stumper, J.; Wetton, B. Water management in PEM Fuel Cells. J. Electrochem. Soc. 2004, 151, A341. [Google Scholar] [CrossRef]
- Hassan, N.S.M.; Daud, W.R.W.; Sopian, K.; Sahari, J. Water management in a single cell proton exchange membrane fuel cells with a serpentine flow field. J. Power Sources 2009, 193, 249–257. [Google Scholar] [CrossRef]
- Andersson, M.; Beale, S.B.; Espinoza, M.; Wu, Z.; Lehnert, W. A review of cell-scale multiphase flow modeling, including water management, in polymer electrolyte fuel cells. Appl. Energy 2016, 180, 757–778. [Google Scholar] [CrossRef]
- Santangelo, P.E.; Tartarini, P. Effects of load variation and purge cycles on the efficiency of Polymer Electrolyte Membrane Fuel Cells for stationary applications. J. Renew. Sustain. Energy 2018, 10, 014301. [Google Scholar] [CrossRef] [Green Version]
- Gutru, R.; Turtayeva, Z.; Xu, F.; Maranzana, G.; Vigolo, B.; Desforges, A. A comprehensive review on water management strategies and developments in anion exchange membrane fuel cells. Int. J. Hydrog. Energy 2020, 45, 19642–19663. [Google Scholar] [CrossRef]
- Wang, X.R.; Ma, Y.; Gao, J.; Li, T.; Jiang, G.Z.; Sun, Z.Y. Review on water management methods for proton exchange membrane fuel cells. Int. J. Hydrog. Energy 2021, 46, 12206–12229. [Google Scholar] [CrossRef]
- Zhang, B.; Hua, Y.; Gao, Z. Strategies to optimize water management in anion exchange membrane fuel cells. J. Power Sources 2022, 525, 231141. [Google Scholar] [CrossRef]


| Chemical Species | Pollution Effect |
|---|---|
| CO2 | Greenhouse gas; according to the available scientific literature, its concentration in the atmosphere is causing climate change [12] |
| CO | Carbon monoxide; colorless, odorless, and tasteless, but highly toxic; at a concentration greater than 1000 ppm, it is considered immediately hazardous [13] |
| CmHn | For example, benzene (C6H6); it damages the bone marrow, depresses the immune system, causes leukemia, and is associated with other blood cancers and pre-cancers [14] |
| NOx (NO and NO2) | NOx reacts with ammonia, moisture, and other compounds to form HNO3; it can penetrate deeply into sensitive lung tissue, yielding lung cancer and causing (or worsening) respiratory diseases, which may result in premature death in the worst case [15] |
| Particulate matter | Better known as PM10 and PM2.5; their inhalation produces asthma, lung cancer, cardiovascular issues, and premature death [16] |
| SO2 | highly irritating and harmful to the eyes and the respiratory tract; by inhalation, it can cause acute pulmonary edema, with prolonged exposure leading to death [17] |
| H2O | Harmless to the environment and human health within a medium-term horizon |
| FCEV | BEV | ||
|---|---|---|---|
| Advantages | Drawbacks | Advantages | Drawbacks |
| Refuelling in 3–5 min | Poor network of distributors | Zero local emissions | Battery life uncertain (5–8 years) |
| Long distance with a full tank (400–800 km) | High purchase prices and few models available | No CO2 production | Shorter driving range than other kinds of cars |
| Higher energy input of Li batteries | Transformation, transport, and storage still not very efficient | Higher efficiency (reduced losses during transport, storage, and transformation) | Higher production costs |
| Suitable for heavy transport vehicles (e.g., buses, trucks) | Safety concerns (hydrogen flammability) | Reduced noise pollution | Charging times and car performance not constant |
| No harmful emissions | Non-environmentally friendly hydrogen production from fossil fuels | Less impactful engine maintenance | Additional costs of rental and ownership |
| Possible reductions in taxes | Larger availability of charging stations, | Inefficient battery recycling technologies | |
| Electric-motor charging sufficient for urban driving cycles | |||
| Propulsion | Model and Power (kW/CV) | Driving Range (km) | Cost (kEUR) | Cost per Unit of Power (EUR/kW) |
|---|---|---|---|---|
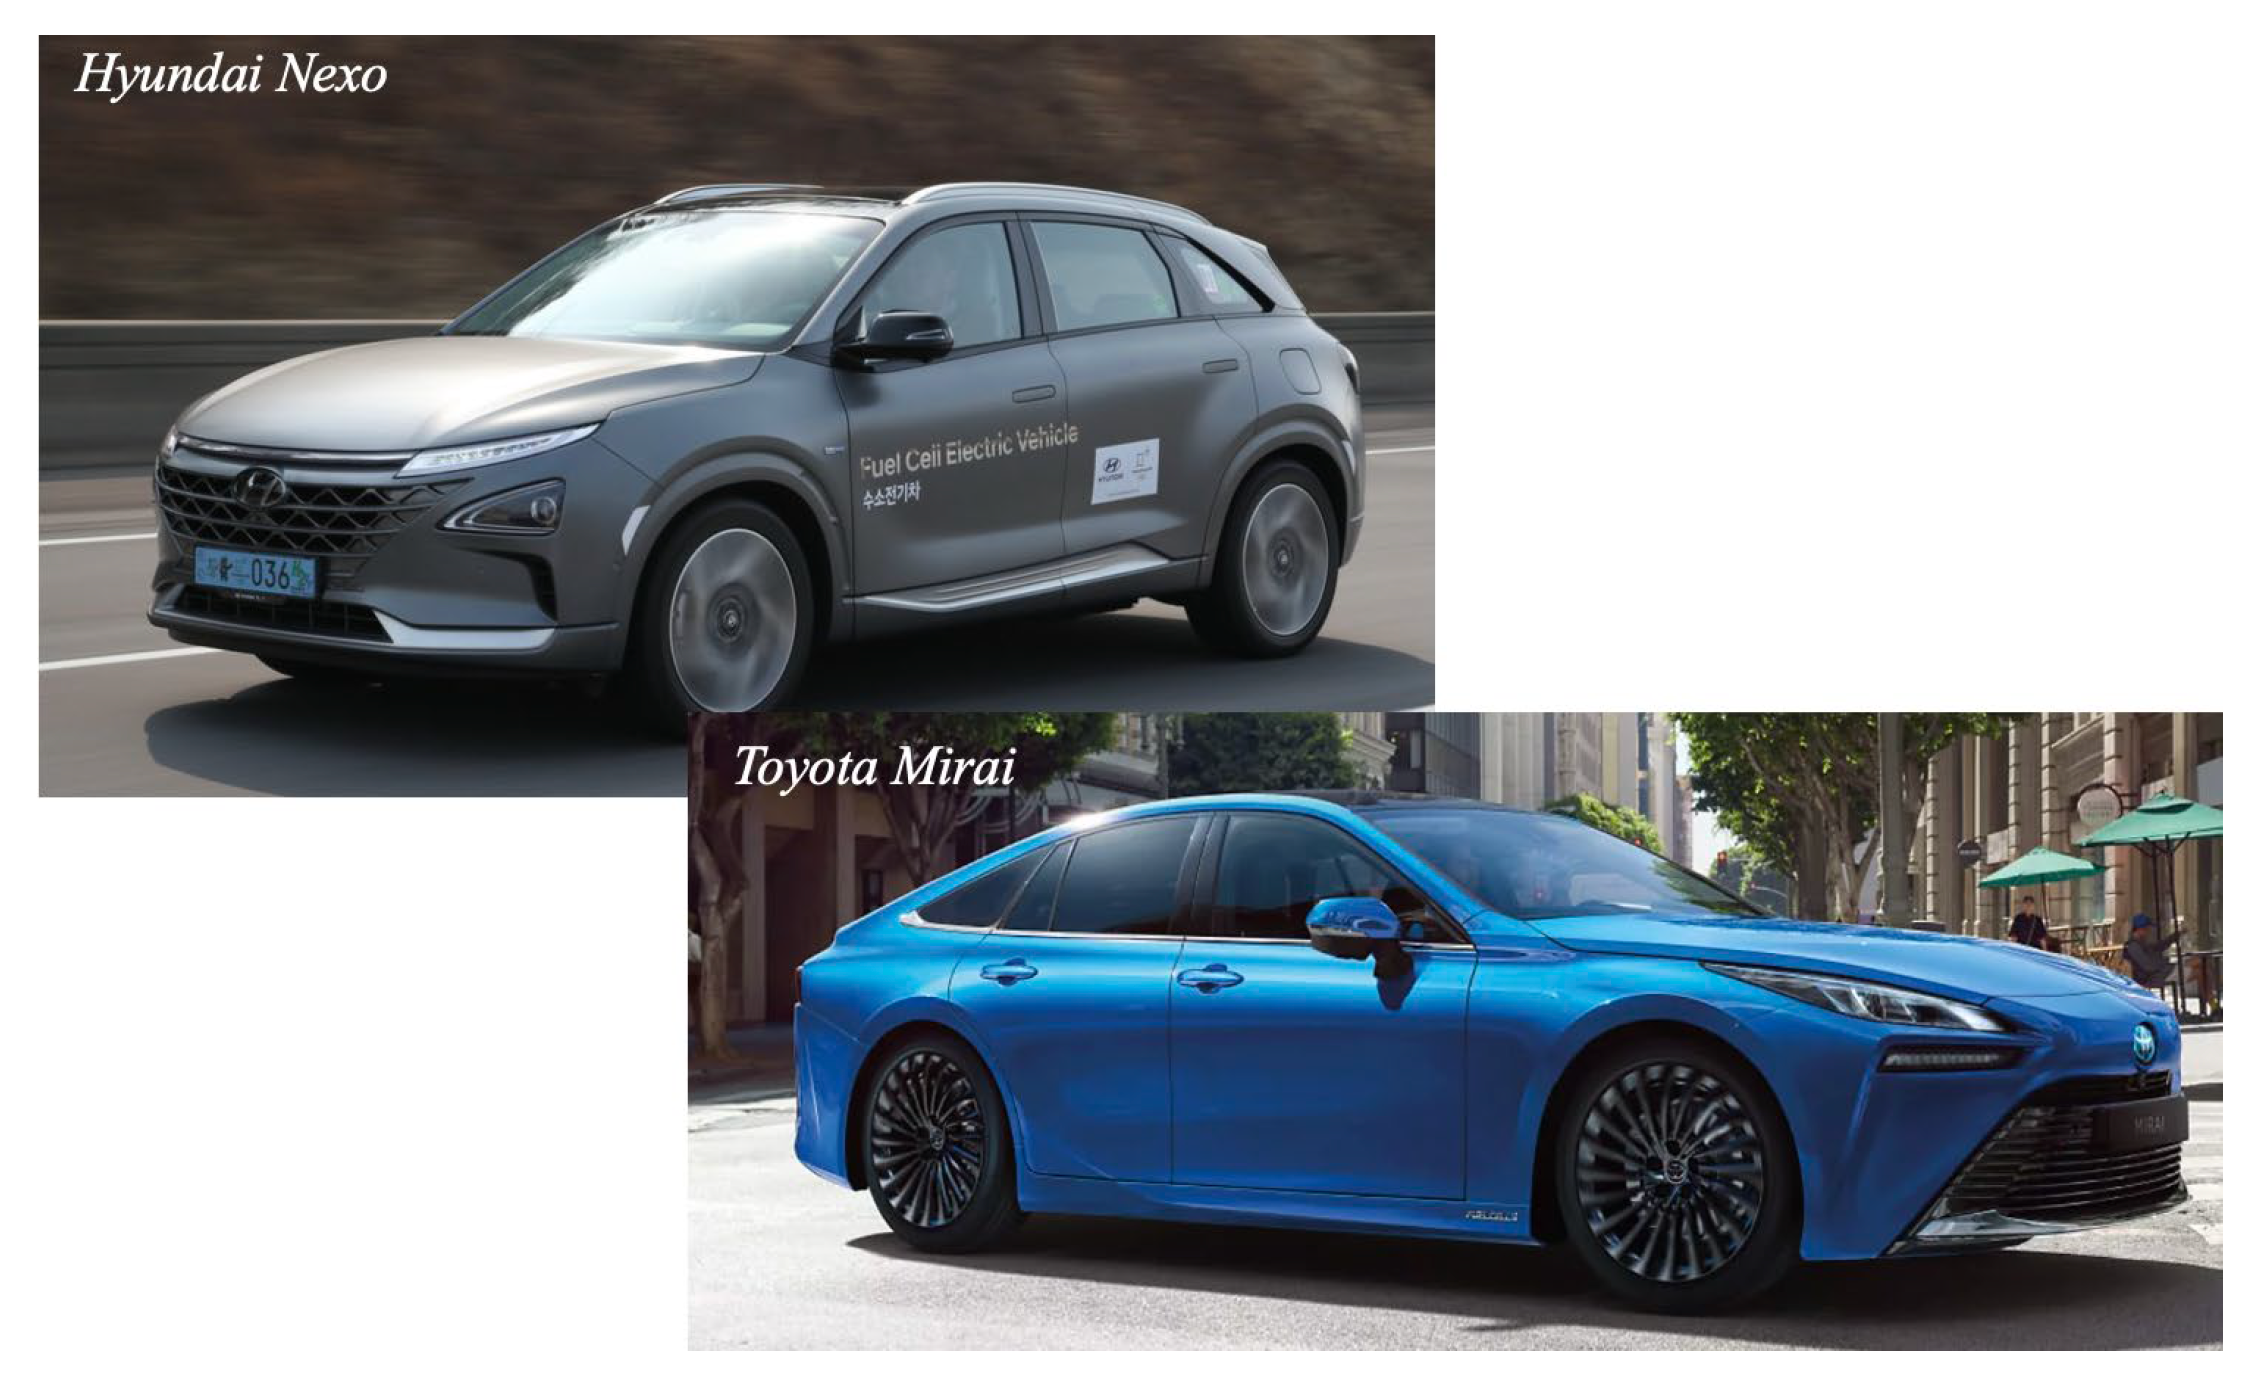
| FCEV | Hyundai Nexo, 120/163 | 800 | 70 | 583 |
| Toyota Mirai, 114/155 | 500 | 65 | 570 | |
| Honda Clarity FC, 130/177 | 500 | 60 | 461 | |
| BEV | Dacia Spring, 48/65 | 220 | 21 | 437 |
| Fiat 500e, 70/95 | 300 | 27 | 386 | |
| Tesla Model 3, 239/325 | 491 | 45 | 188 | |
| Volkswagen ID.3, 150/204 | 422 | 40 | 267 | |
| ICE | Hyundai i20 1.0, 88/120 | 800 | 24 | 273 |
| Toyota Land Cruiser, 150/204 | 800 | 57 | 380 | |
| Volkswagen Golf 2.0 TDI 110/150 | 1000 | 36 | 327 | |
| Dacia Sandero, 49/65 | 1000 | 13 | 265 |
| Source | Production Rate (kg/day) | Cost (EUR/kg) |
|---|---|---|
| Nuclear (electrolysis) | 1000 | 3.83 |
| Solar thermal | 1000 | 6.46 |
| Solar PV (electrolysis) | 1399 | 21.48 |
| Wind (electrolysis) | 1000 | 5.12 |
| Biomass (gasification) | 194,141 | 1.33 |
| Biomass (pyrolysis) | 72,893 | 1.36 |
| Coal gasification | 281,100 | 1.15 |
| Natural gas (steam methane reforming) | 236,239 | 2.29 |
| Metals | Type | Hydrides | H2 Capacity (wt%) | T (K) |
|---|---|---|---|---|
| Mg | A | MgH2 | 7.60 | 552 |
| MgTi | AB | FeTiH2 | 1.89 | 265 |
| ZrMn2 | AB2 | ZrMn2H2 | 1.77 | 713 |
| Mg2Ni | A2B | Mg2NiH4 | 3.59 | 528 |
| LaNi5 | AB5 | LaNi5H6 | 1.37 | 285 |
| Nafion Type | Maximum Power Density (W/cm2) | Current Density (mA/cm2) | Operative Conditions | References |
|---|---|---|---|---|
| Nafion HP | 2.28 | ~5000 | H2/O2; 90% RH; 100 °C | [71] |
| Nafion 211 | 0.6 | 1250 | H2/air; 96% RH; 70 °C | [72] |
| Nafion NR211 | 0.98 | 1500 | H2/O2; 100% RH; 80 °C | [73] |
| Nafion 212 | 0.9 | 2250 | H2/O2; 100% RH; 80 °C | [74] |
| Nafion NE1035 | 1 | 2000 | H2/O2; 100% RH; 70 °C | [75] |
| Aquivion E87-05S | 1.1 | 2500 | H2/O2; 60% RH; 120 °C | [76] |
| Nafion 117 | 0.4 | 784 | 75 °C/95% RH | [77] |
| Nafion 112 | 0.5 | 1041 | 90 °C/95% RH | [78] |
Disclaimer/Publisher’s Note: The statements, opinions and data contained in all publications are solely those of the individual author(s) and contributor(s) and not of MDPI and/or the editor(s). MDPI and/or the editor(s) disclaim responsibility for any injury to people or property resulting from any ideas, methods, instructions or products referred to in the content. |
© 2023 by the authors. Licensee MDPI, Basel, Switzerland. This article is an open access article distributed under the terms and conditions of the Creative Commons Attribution (CC BY) license (https://creativecommons.org/licenses/by/4.0/).
Share and Cite
Pedicini, R.; Romagnoli, M.; Santangelo, P.E. A Critical Review of Polymer Electrolyte Membrane Fuel Cell Systems for Automotive Applications: Components, Materials, and Comparative Assessment. Energies 2023, 16, 3111. https://doi.org/10.3390/en16073111
Pedicini R, Romagnoli M, Santangelo PE. A Critical Review of Polymer Electrolyte Membrane Fuel Cell Systems for Automotive Applications: Components, Materials, and Comparative Assessment. Energies. 2023; 16(7):3111. https://doi.org/10.3390/en16073111
Chicago/Turabian StylePedicini, Rolando, Marcello Romagnoli, and Paolo E. Santangelo. 2023. "A Critical Review of Polymer Electrolyte Membrane Fuel Cell Systems for Automotive Applications: Components, Materials, and Comparative Assessment" Energies 16, no. 7: 3111. https://doi.org/10.3390/en16073111