Review

Microseismic Monitoring Technology Developments and Prospects in CCUS Injection Engineering

1
School of Geosciences & Surveying Engineering, China University of Mining and Technology-Beijing, Beijing 100083, China
2
State Key Laboratory of Coal Resources and Safe Mining, China University of Mining and Technology-Beijing, Beijing 100083, China
3
School of Resources and Geosciences, China University of Mining and Technology, Xuzhou 221116, China
*
Authors to whom correspondence should be addressed.
Energies 2023, 16(7), 3101; https://doi.org/10.3390/en16073101
Submission received: 28 February 2023 / Revised: 16 March 2023 / Accepted: 27 March 2023 / Published: 29 March 2023

Abstract

:
CO2 geological storage projects are an essential tool for China to achieve the double carbon target of energy savings and emission reductions. In order to safely and effectively control the implementation of injection projects and monitor the dynamics of CO2 injection, multi-dimensional and multi-disciplinary monitoring tools are required. Among them, microseismic monitoring is a key technology for predicting reservoir dynamics and reflecting reservoir geomechanical behavior. Such monitoring has been carried out previously for reservoirs in other countries, but experimental projects are also gradually being developed in China. In this paper, we focus on the research and analysis results of microseismic monitoring of carbon storage projects in various work areas. For different reservoir conditions, we explore combinations of the monitoring implementation methods in China, comparing the differences in each work area. We propose a joint well and ground microseismic monitoring method and a multi-spatial and multi-physical field coupling research system for use in the implementation of domestic demo projects for the future research and development of microseismic monitoring of carbon storage projects. The monitoring program can meet the requirements for certain periodic repeated or continuous observations and can intelligently assess the risk and handle the alert behavior. The foundation is laid for the development of the future microseismic monitoring technology to achieve the goal of developing cost-controllable, permanent, and real-time monitoring equipment. The application of the monitoring system in China has been effective, and this experience can contribute to the development of injection engineering in the future.

1. Introduction

CO2 capture, utilization, and storage (CCUS) is an increasingly significant approach to achieving the carbon peak and carbon neutrality. According to statistics, there are 122 CCUS projects in the world, including 51 projects in Europe, 36 projects in South America, 27 projects in Asia and Oceania, and 8 projects in the Middle East and other regions [1,2]. Carbon capture and storage (CCS) is an economically viable approach to address greenhouse gas emissions and mitigate global warming. The process involves separating CO2 from industrial or related sources, transporting it to pre-selected storage sites, and injecting it into underground geological structures to achieve long-term CO2 isolation from the atmosphere [3,4]. In order to implement the process of carbon storage more efficiently and economically, and based on the advantages of the geological site selection for storage, there are domestic and international trends to adopt the process of carbon capture, utilization, and storage (CCUS) to reuse CO2 and generate potential economic benefits [5].
Currently, there are two main forms of CCUS geological storage projects: CO2 injection into tight sandstone reservoirs to enhance oil and gas recovery, and CO2 injection into tight coalbed methane (CBM) reservoirs to replace CBM (CO2-EOR and CO2-ECBM). CCUS projects require not only the preservation of CO2 in deeper formations, but also operational monitoring of the overall engineering system at the start of CO2 injection (the measurement, monitoring, and verification system, MMV), to ensure that CO2 is safely and efficiently stored in the reservoir storage [6].
From the perspective of geology and geophysics, recent CCUS engineering is mainly divided into geological utilization and geological storage, where geological utilization includes enhanced oil extraction, replacement of coalbed methane, enhanced natural gas extraction, enhanced shale gas extraction, enhanced geothermal systems, uranium leaching, and enhanced deep saline aquifer extraction; on the other hand, geological storage means mainly include onshore saline aquifer storage, submarine saline aquifer storage, and depleted reservoirs [7,8]. The global CO2 storage capacity of major oil and gas fields is about 310.8 billion tons [5]. The geological formations that have been applied successfully in domestic and international projects to store CO2 mainly include depleted or economically unproductive oil and gas reservoirs, coal seams, and deep saline aquifers. Among them, geophysical monitoring techniques play an important role in ensuring the long-term stability of the CO2 storage process and predicting the plume extent of CO2 transport.
The United States is the country with the largest number of CO2 drive projects, with the largest and earliest CO2 drive study starting in 1972 in the SACROC field (Figure 1) [5]. In the middle to late periods of the last century, pioneering experiments on CO2 storage and oil drive were conducted in developed countries, such as the CO2 geological storage experiments in the Weyburn field in Canada, the geological storage project in the Sleipner gas field in Norway, and the project in In Salah in Algeria. These projects are also three of the most successful CCUS projects recognized internationally.
Through compilation, research and analysis, we summarize the research results of microseismic monitoring in CCUS projects that have received significant attention around the world in the past 20 years. This paper analyzes the application and current situation of microseismic monitoring in CO2 injection and storage projects and expounds the important role of microseismic monitoring technology according to the corresponding data. This study is expected to provide a valuable reference and targeted guidance for the construction, implementation, and development of CCUS projects in the future, as well as considerations and prospects of the problems faced by future microseismic monitoring technology in its development.

2. Microseismic Monitoring Technology in CCUS Engineering

CCUS geophysical monitoring refers to a series of reliable geophysical monitoring tools developed for CCUS projects. Existing technology projects apply tools such as four-dimensional seismic surveys (time-lapse seismogram), logging and petrophysical analysis, and electromagnetic and gravity surveys. The principle of these technologies is to use the geophysical changes caused by the impact of injection on the subsurface strata as a direct basis for monitoring. The microseismic monitoring technology used in CCUS projects senses the changes occurring in the reservoir during the injection process (Figure 2) [9], which is both timely and accurate and can save significant costs.
In fact, geophysics is not the only monitoring tool. For the whole CCUS project, in order to monitor and accurately evaluate the reservoir and fluid behavior after CO2 injection, InSAR satellites can be used to observe the surface deformation rate and combined with geochemistry, environmental monitoring, hydrogeological difference analysis, isotope tracing, and other technical methods to sense CO2 dynamics. Together with geophysical monitoring tools, these methods can more comprehensively interpret the gas drive leading edge and reservoir dynamics, and even detect risk behaviors such as leakage.

2.1. Microseismic Event Triggering Mechanisms in Carbon Storage Engineering

There are several main triggering mechanisms that can induce (micro)seismic activity:
1.
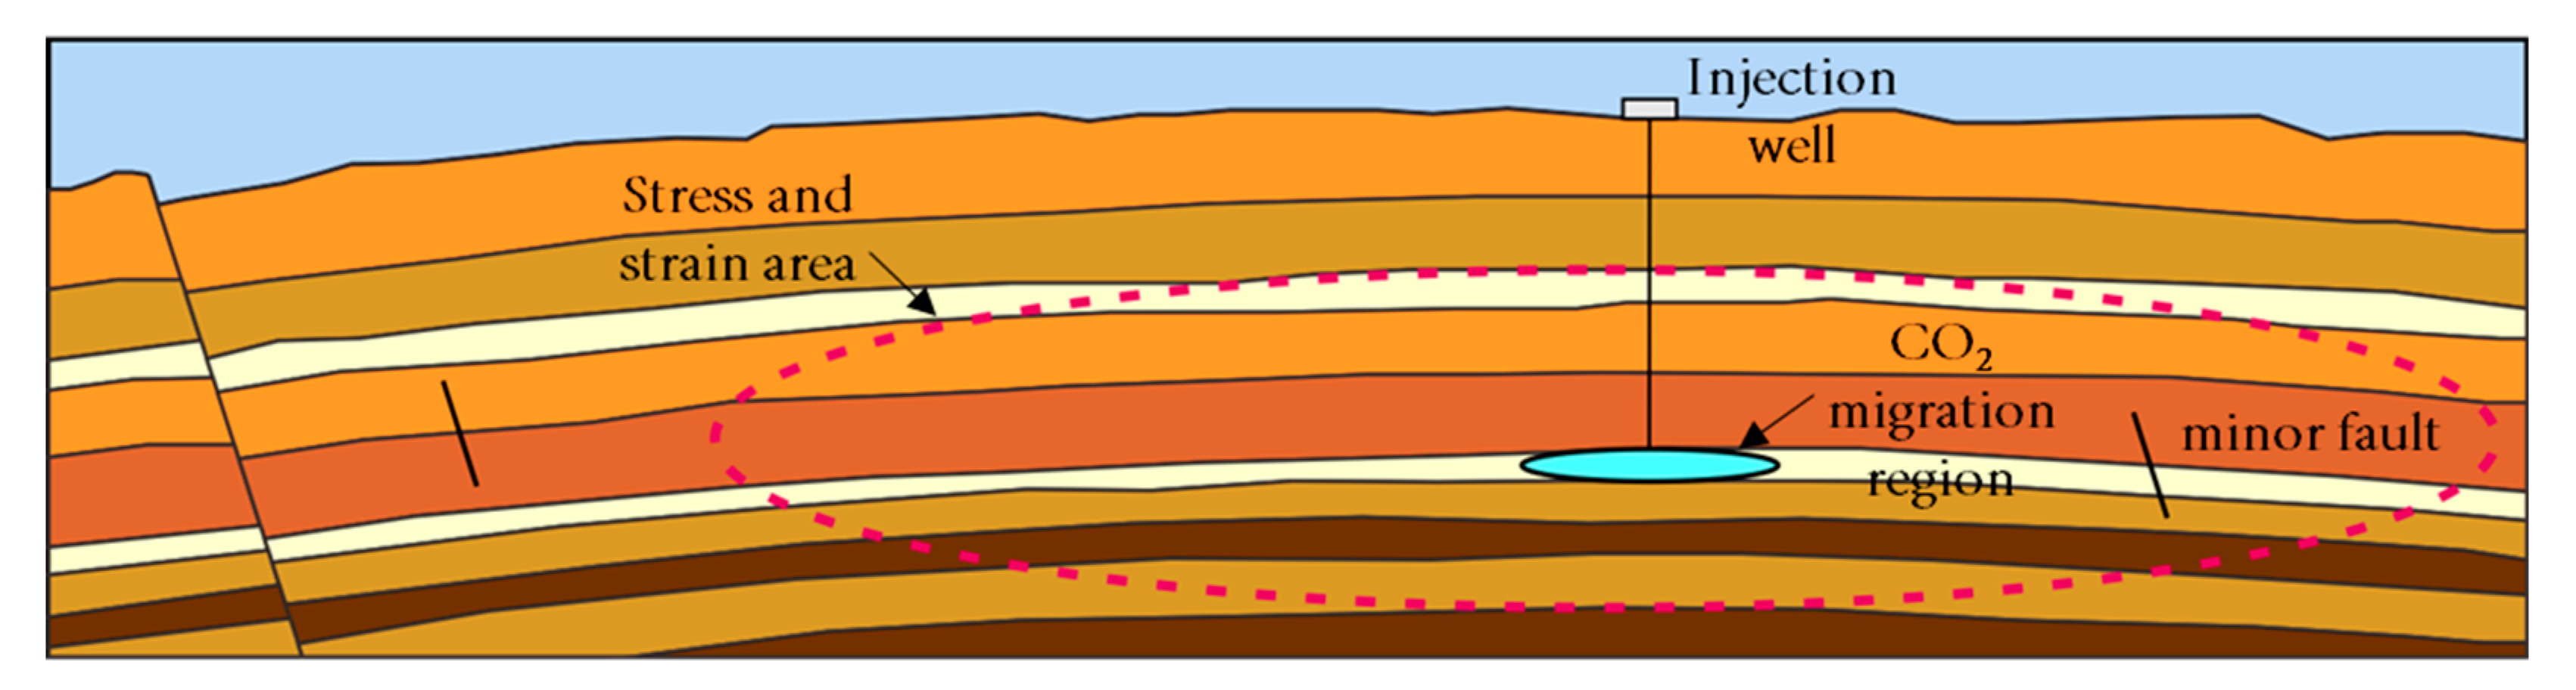
The evolution of the pore pressure or the effect of the nature of the injected fluid on the stability of fractures or faults: Once CO2 is injected into the target formation, whether during storage, replacement, or substitution, it will increase the pore pressure of the formation and change the original formation stability [10]. If the target formation is fractured or has small faults and fracture zones that are conducive to sequestration and replacement, the pore pressure of the target reservoir will be more susceptible to the influence of the injected fluids and disrupt the original stress equilibrium [11].
2.
Non-isothermal effect: This effect usually occurs when the injected fluid reaches the injected formation at a lower temperature than the rock temperature, resulting in rock contraction, thermal stress reduction, and stress redistribution around the cooling zone. The injected CO2 is usually at a lower temperature than the surrounding rock, due to the fact that the CO2 has not yet reached thermal equilibrium with the ground temperature gradient during injection [12]. Therefore, reservoir cooling around the injected wells and lower thermal stresses can cause the stress field to approach an unstable state [13,14].
3.
Presence of low-permeability faults: The presence of low-permeability faults in injected formations causes local stress distribution inequalities, reducing the stability of the injected formation and potentially leading to fault reactivation. Each (micro)seismic event induces stress redistribution around a fracture or fault that experiences shear slip [15,16].
4.
Earthquake slip due to stress transfer: Not all shear slips occurring in fractures or faults trigger (micro)seismic events, and shear slips may accompany the occurrence of seismic resistance [17]. Such a seismic slip may induce (micro)seismic events away from the slip surface [18].
5.
Geochemical effects (may be particularly relevant to carbonate formation): Geochemical reactions can change the frictional strength of faults, which can lead to local changes around faults when they are damaged [19], thus affecting the fault stability.

2.2. The Importance of Microseismic Monitoring Implementation

CCUS geological storage areas can trigger (micro)earthquakes due to the above factors. Undetected small faults exist in geological sequestration zones where they act as barriers to fluid injection and become sites of pressure build-up [20]. When shear stresses acting externally on a fracture or fault surface exceed its shear strength, fluid injection into the subsurface may result in activities such as shear tensioning of the rocks in direct contact, with the subsequent release of seismic energy, thereby triggering microseismic events [21]. Three major potential pathways for CO2 leakage from target geologic sequestration zones have been recognized: fluid injection through cap rupture, migration along an existing subvertical fault or fracture zone, or escape through a well with a poorly consolidated casing [22]. In principle, the increase in fluid pressure is the only mechanism by which a microseismic event can occur. At the start of the injection, a nearby injection well improves the stability; away from the position of the injection well, the fluid pressure continues to rise, and as a result of the injection pressure diffusion, (micro)seismic events can occur [23]. This phenomenon is often observed after EGS stimulation [24]. Although no high-magnitude seismic activity has been observed in geological carbon storage projects, the mechanism needs to be understood in order to avoid it. Therefore, full-space microseismic monitoring with a large coverage is particularly necessary in the whole system. Compared with environmental monitoring, surface deformation monitoring and time-shift seismic monitoring technologies, microseismic monitoring technology is less restricted by the surface environment (a small number of geophones can complete the task objectives), and the monitoring system has the ability to provide timely warnings in time and space. Mature and intelligent processing and interpretation algorithms can quickly obtain positioning results. Applying neural networks or deep learning methods, accurate positioning results can be obtained using the collected data. Furthermore, by analyzing the mechanism of microseismic events during fluid injection and evaluating the damage degree of the event to the reservoir, the project implementation is optimized to avoid the occurrence or expansion of leakage events.

3. Case Study of CCUS Microseismic Monitoring Engineering

The CCUS projects in Canada, Norway, Algeria, and the U.S. have constructed interdisciplinary and integrated monitoring systems that are valuable in the study of CO2 injection uncertainty determination, built confidence in carbon sequestration implementation, provided scientific guidance methods for China to achieve its dual carbon goals, and become successful models for many CCUS projects. The intersection of the expected modeling and monitoring of actual data analysis has led to continuous advancements and breakthroughs, resulting in less risky, more predictable, and increasing utilization and benefit rates of CO2 storage projects.

3.1. Long-Term CO2 Storage Monitoring in the Weyburn Field, Canada

The monitoring and storage project (Weyburn–Midale CO2-EOR) that operated from October 2000 until 2011 in the Weyburn field in Canada conducted CO2 monitoring activities and is the world’s largest CO2-EOR geological storage project with the objective of enhancing oil and gas recovery. The Weyburn reservoir is a thin (18–29 m total thickness) fractured carbonate rock at a depth of approximately 1450 m [25]. The average porosity and permeability are 15–26% and 10–20 mD [26]. The Weyburn oil field is adjacent to the Midale oil field, with similar geological reservoirs, and both are suitable for CO2-EOR engineering, with the Weyburn oil field starting CO2 injection 5 years earlier than the Midale oil field as an a priori implementation area. Both fields are expected to continue injecting for 30 years. The International Energy Agency (IEA) Greenhouse Gas Monitoring and Storage Program was established to evaluate and supervise the monitoring methods and processes associated with CO2 injection into subsurface geological reservoirs (Figure 3) [27].
A downhole monitoring array consisting of eight three-component geophones was first installed in 2003 [28]. At first, this monitoring array covered only a portion of the field in order to study the feasibility of microseismic monitoring in CCUS. At that time, time-lapse seismic (4D) monitoring was the primary geophysical monitoring tool in the CCUS project (2001–2007), with microseismic monitoring as a secondary tool. Injection activity was shut down in September 2010, and an additional 92 events were monitored in the month following the shutdown of the well. The event magnitudes ranged from −3 to −1 Mw, with the −2 magnitude events being detected 500 m from the reservoir (Figure 4) [29].
Verdon, J.P., et al. (2011) generated a numerical geomechanical model to simulate and predict the stress changes caused by CO2 injection [10]. Seismic activity within the reservoir suggests that no significant geomechanical deformation of the reservoir is occurring or that deformation is occurring in an extensional manner. Duxbury, A., et al. (2010) coupled fluid flow and geomechanical simulations based on the Weyburn model and concluded that seismic activity above the reservoir is likely due to stress arching effects rather than CO2 escape [30,31]. Khazaei, C., et al. (2016) simulated reservoir geomechanics using PFC3D to relate the energy consumed in the volume to the energy released by planar slips and found that microseismic events can occur at any stress destabilization surface, even when the injection pressure is lower than the pressure inside the reservoir, reaching the tolerance capacity of the cap [32]. Through geomechanical microseismic event mechanism studies, Verdon, J.P., et al. (2016) also confirmed that these events are not directly triggered by fluid injection, but are a response to stress transfer through the rock framework during production and injection [33].
Based on studies by related scholars and the perspective of overall project implementation monitoring, although no signs of CO2 leakage during construction and no impact on CO2 reservoir processes have been detected, continuous microseismic monitoring implementation is also quite necessary [21]. Simulation studies of reservoir geomechanics also need to be linked to actual observable deformation phenomena and (micro)seismic events and validated against each other in order to more accurately assess the risk of leakage occurring due to injection-induced rupture.

3.2. CO2 Geological Storage Project in the Sleipner Field, Norway

The injection project in the Sleipner field was started in 1996 and had injected 13 mt by the end of 2011.This project involves a water-bearing sandstone reservoir with a narrow fault distribution, an average porosity of 35–40% and a permeability above 1 D [34]. The sand body has a very large reservoir space. From the geomechanical point of view, the reservoir pressure changes are negligible, and no rock destruction due to the expansion of the injected gas transport will occur. The pressure is fairly stable and uniform at about 6.4 MPa during long-term continuous injection [29]. Therefore, instead of direct geomechanical deformation measurements, this project utilizes time-shifted seismic data to analyze the extent of the observed CO2 plume.

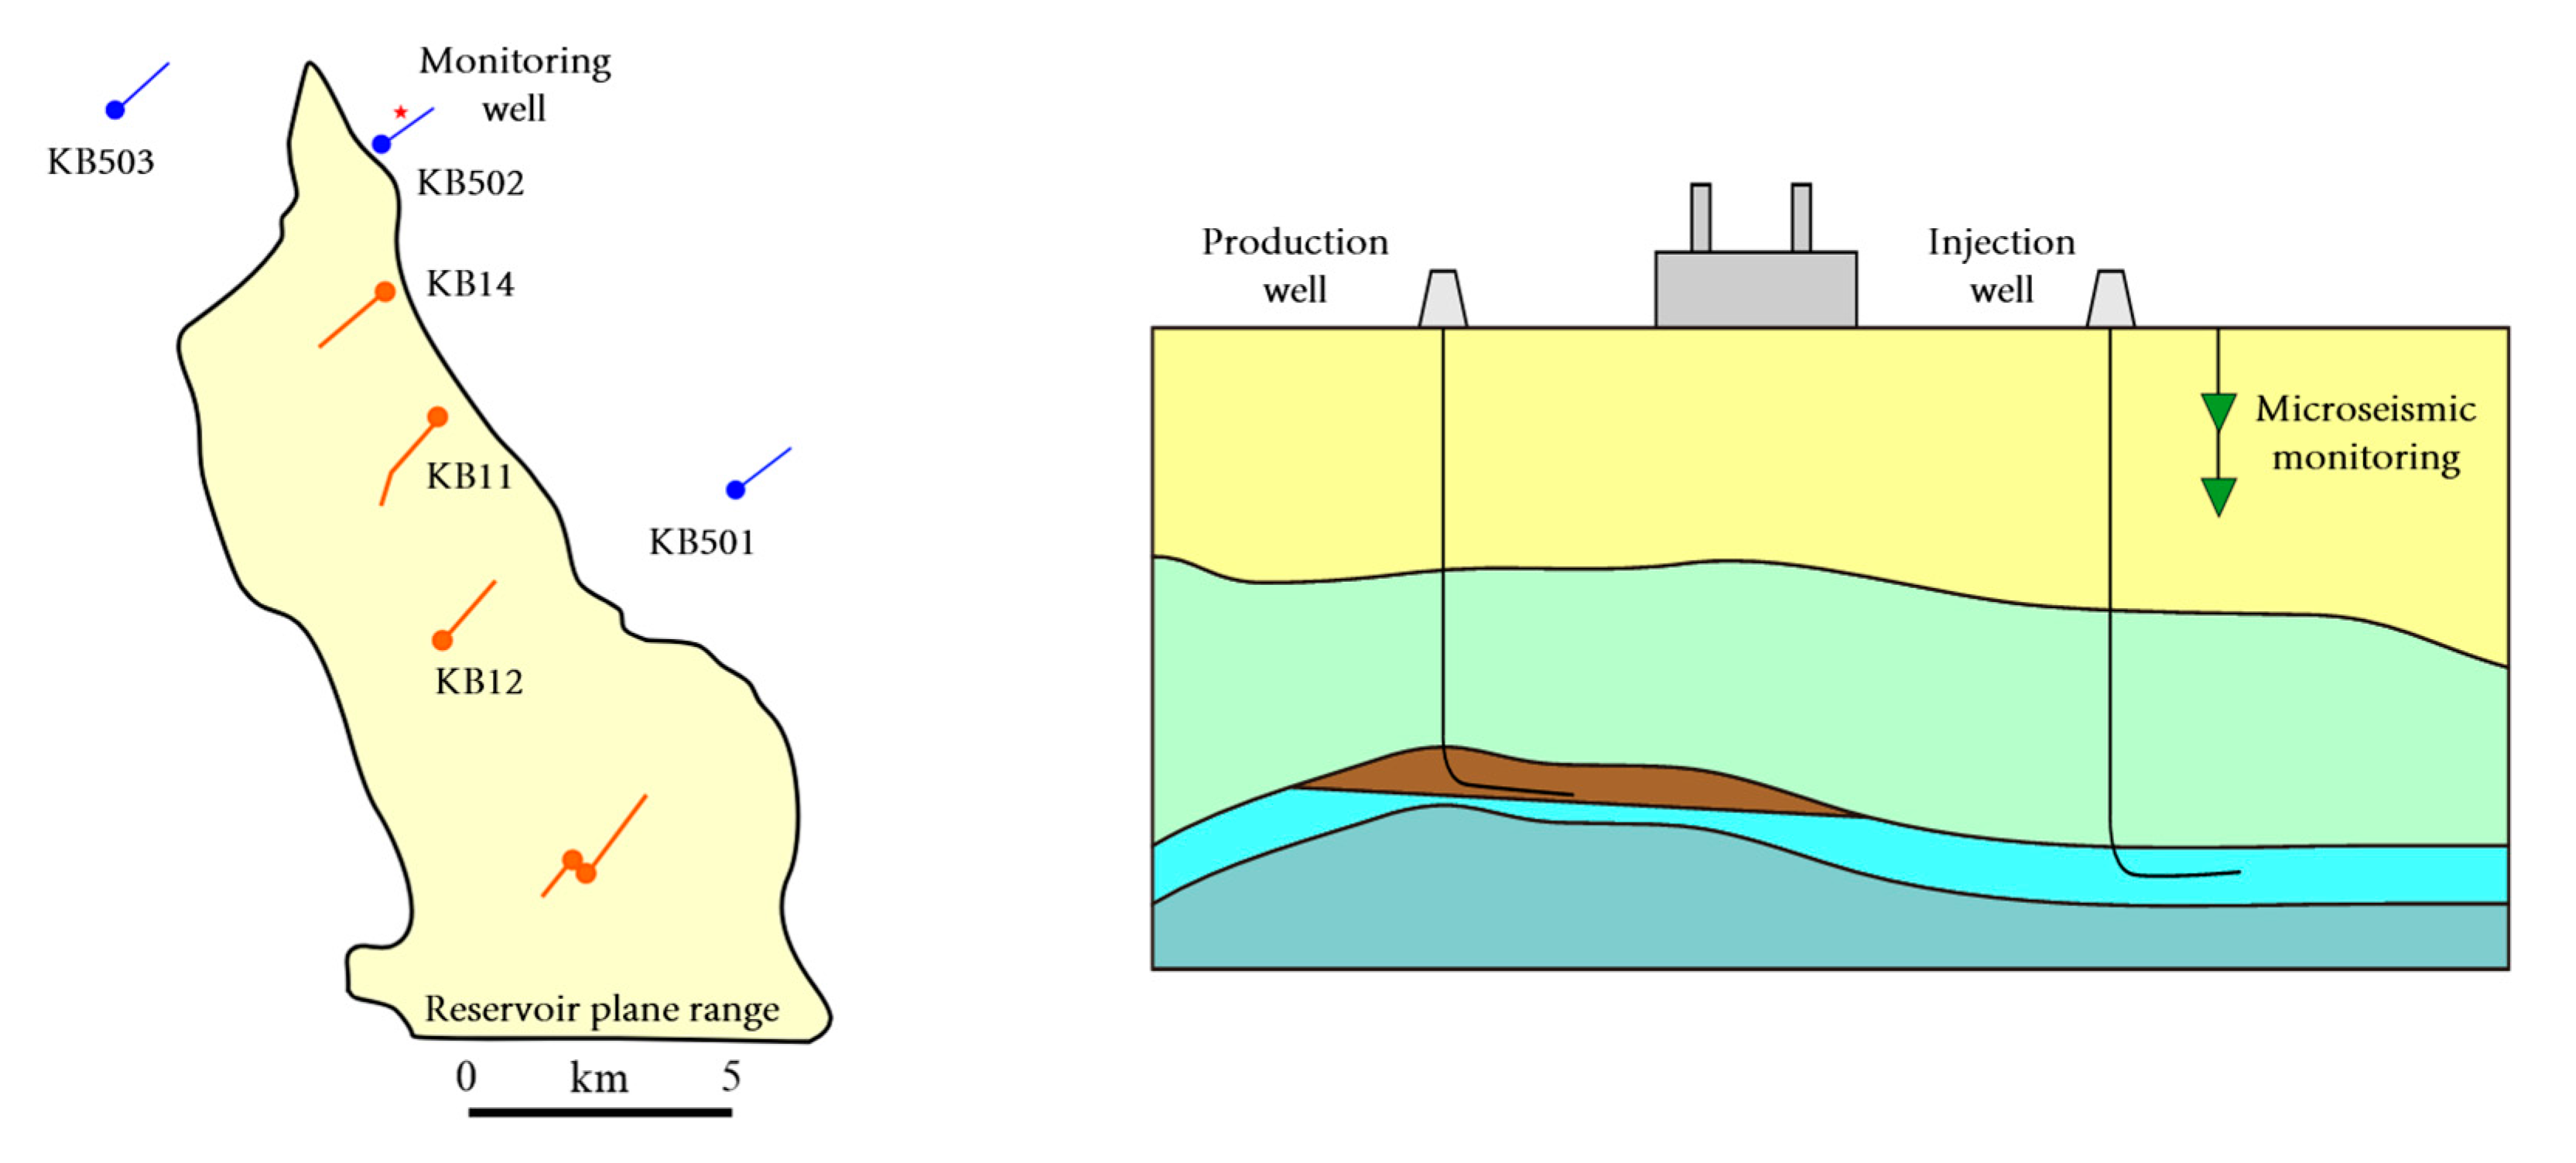
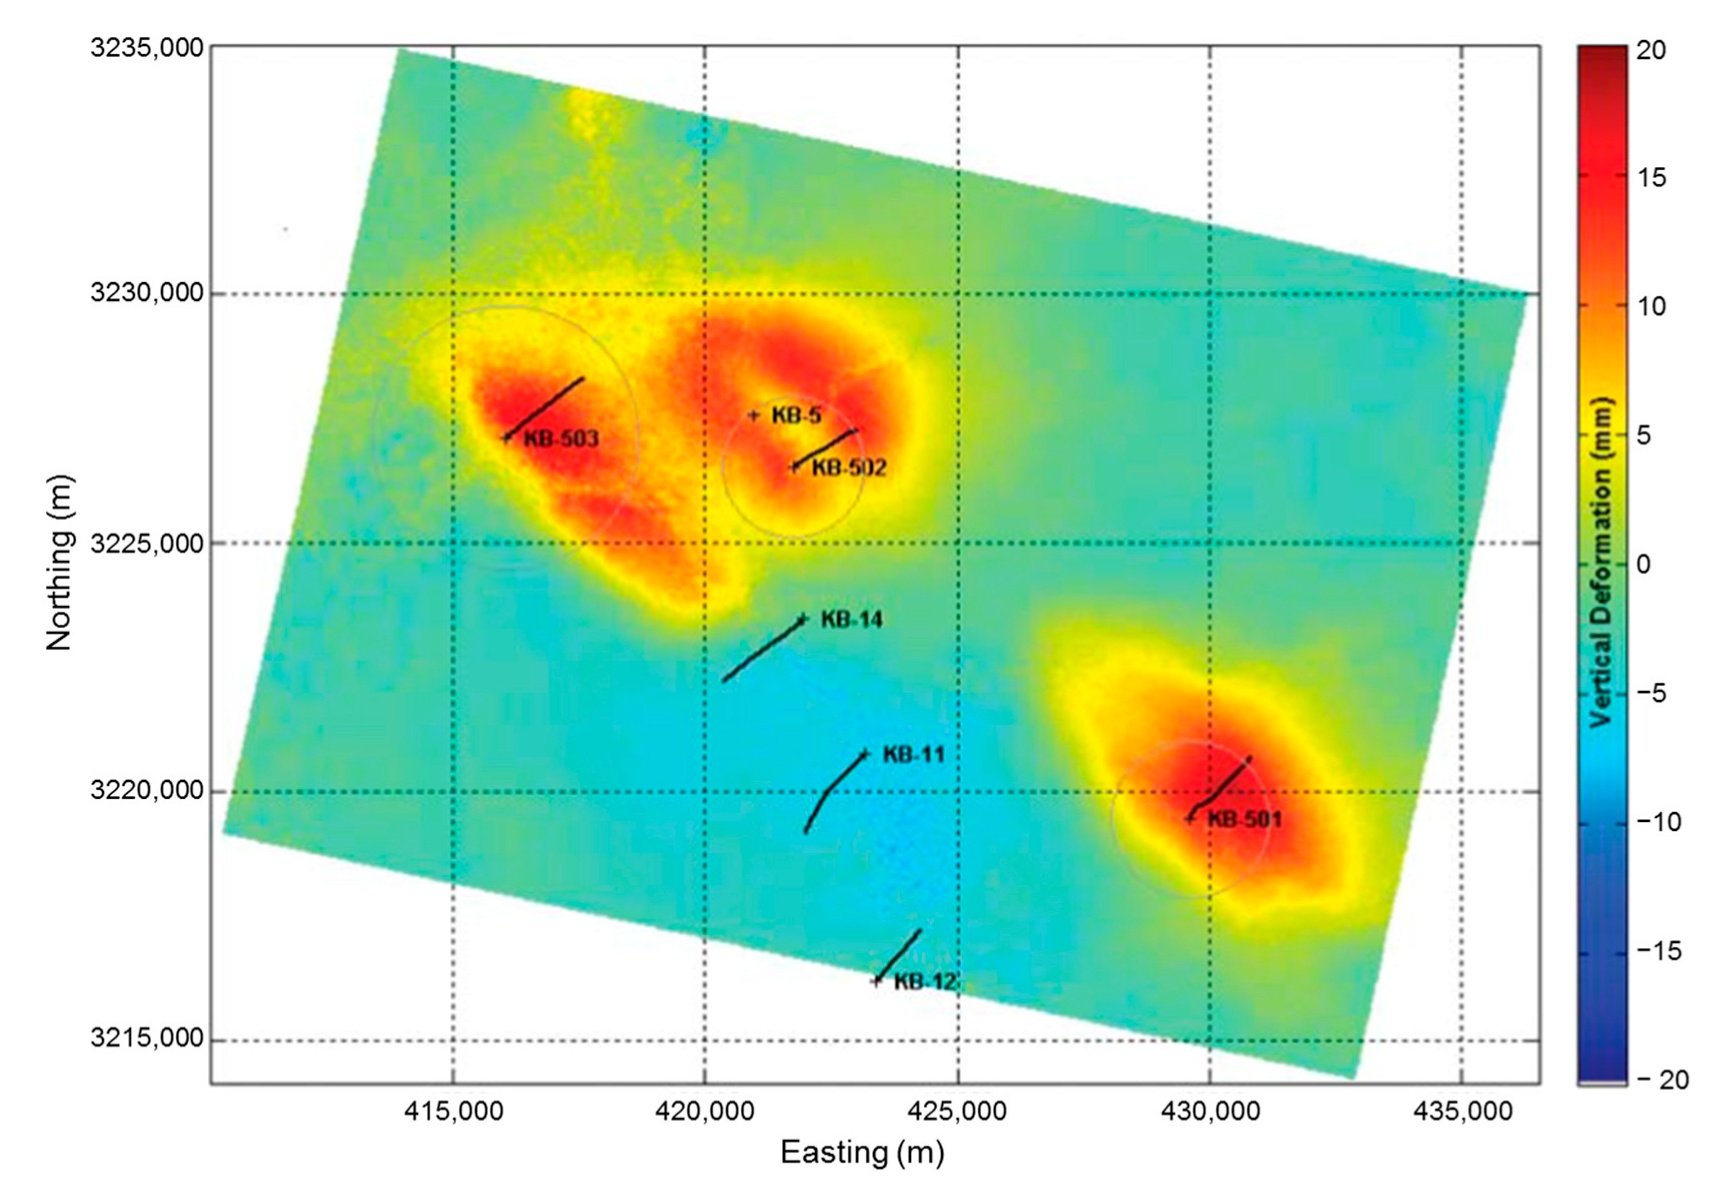
3.3. CO2 Storage Project in In Salah, Algeria

The CO2 capture and stratigraphic storage project in In Salah (Krechba site), located in the central region of Algeria, was launched in 2004 and was the first non-augmented recovery project to monitor microseismic activity. Between 2004 and 2011, more than 3.8 million tons of CO2 were stored in the subsurface [35]. Three wells, KB501, KB502, and KB503, inject into the Carboniferous saline formation along horizontal sections (Figure 5) [36] with a reservoir porosity of ~10–17% and a permeability of ~10 mD [37].
InSAR monitoring of surface deformation observations indicates that the CO2 injection process is accompanied by significant surface uplift. A wide elliptical NW uplift toward the surface can be clearly observed in the three injection wells, with slight subsidence in gas producing wells [38]. The size of the surface deformation is in the order of tens of millimeters (Figure 6). Of particular interest is the double-flap structure observed in the KB502 injection well that has caused widespread concern as it may be associated with tensile damage from stress-directed fractures [39].
To further explain the occurrence of surface deformation, the deployment of a microseismic monitoring system began in 2009 with six three-component geophones in wells near KB502, evenly distributed at 500 depth [36]. Although data from only one geophone are available, the frequency of events can be determined, with a total of 700 events manually identified in 2010, including up to 35 events in a single day. Verdon, J.P., et al. (2013) analyzed microseismic event waveforms and determined that event occurrence was associated with fluid injection activation of fracture zones [29]. Stress transfer from injection-induced fault activation plays an important role in inducing microseismic activity in the In Salah work zone, with shear slip stress transfer mechanisms being the main inducing factor.
Shi, J.Q., et al. (2019) also analytically studied the dynamic characteristics of fracture shear activation near the injection wells in wells KB501 and KB503 [40]. CO2 injection at well KB502 resulted in fracture reactivation in shear and tensile mode with extension in both the lateral and vertical directions. In the reservoir model of Cao et al. (2021), by modeling the simulated injection into the fault zone, the results of the study supported the reasonable explanation of shear slip and tensile tensioning of the fault during CO2 injection at well KB502 [41]. The analysis of the microseismic mechanism indicates that the microseismic activity potential of the area is greater than that of the non-fault reactivation area.
In other words, microseismic events are likely to occur in areas of fluid connectivity or in areas of unbalanced stress conduction, and if the reservoir contains potential fracture zones, the probability of microseismic events is greatly increased. Therefore, the previous experience of the project tells us that the injection pressure needs to be accurately controlled during the injection period to ensure the integrity of the reservoir unit and cap rock. Since the overburden in the In Salah work area is about 950 m thick, CO2 injection does not pose a leakage threat to the reservoir. From the implementation of the whole monitoring system and the experience of previous research results, microseismic monitoring technology can not only better monitor underground activities and assist in detecting valuable information from injection to storage, but also provide more sensitive early warnings than other monitoring methods.

3.4. CO2 Injection Monitoring Project in the Pembina Field, Alberta, Canada

Geophysical and geochemical monitoring techniques have been used in the Alberta region for subsurface gas storage and enhanced oil recovery. These techniques can be used to monitor changes in water chemistry due to CO2 injection, the phase distribution of the produced fluids, and gas drive leading edges. Geochemical monitoring is short-term, with a monitoring period of about 10 years, while microseismic monitoring for identifying shear deformation and reservoir pressure and temperature control is the most direct method [42].
In 2005, a multidisciplinary pilot study established by the Alberta government injected supercritical CO2 in the Pembina field to enhance recovery. In this area, CO2 was injected into sandstone reservoirs of the Cardium Formation at a depth of approximately 1650 m. Most of the Cardium Formation is contained within three sandstone layers with an average porosity ranging from 14.8% to 16.4% [43]. The permeability of the sandstones increases with porosity, with the lowest average permeability of 9.5 mD in the lower section and average permeability values of 21.4 mD and 19.8 mD in the middle and upper sections, respectively. The Cardium Formation at Pembina is located in the 650 m thick Colorado Formation shales with an effective and intact overlying shale sequence and a shale thickness of more than 300 m, which is conducive to the long-term storage of CO2 [44].
From 2005 to 2008, a monitoring well was set up at a horizontal distance of 300 m from the injection well, and passive seismic monitoring (PSM) was carried out using eight three-component borehole geophones. The signal-to-noise ratio of the borehole geophone was higher than that of the ground. The sensor could detect microseismic activity greater than −1.5 Mw.
Martínez-Garzón P et al. (2013) also searched for microseismic information on slow slip processes in monitoring data [45]. Microseismic signals generated by slow slip were investigated in the studies of Das and Zoback (2011) and Kumar et al. (2018), where similar seismic signals were monitored during hydraulic fracturing and CO2 injection in the Barnett and Wolfcamp shales in Texas, USA [46,47]. Long-period and long-duration (LPLD) events typically last tens of seconds and have signal frequencies in the range of 10–80 Hz. They resemble conventional tectonic shaking that occurs in subduction zones and slip margins [48]. Using data from a 15 Hz monitoring array, Caffagni, E., et al. (2015) determined that regional seismic and LPLD events have similar waveform characteristics and need to be distinguished to ensure the reliability of reservoir deformation interpretation [49].
The absence of microseismic signals in the CO2 project in the Pembina field in Alberta may be related to the hydraulic fracturing work carried out prior to injection, which was more thorough in transforming the reservoir to ensure smooth CO2 injection and enhanced recovery. On the other hand, it is also possible that the pore pressure and the state of the ground stress field in the reservoir were at a low and stable level when the monitoring was conducted due to the relative depletion of the reservoir.

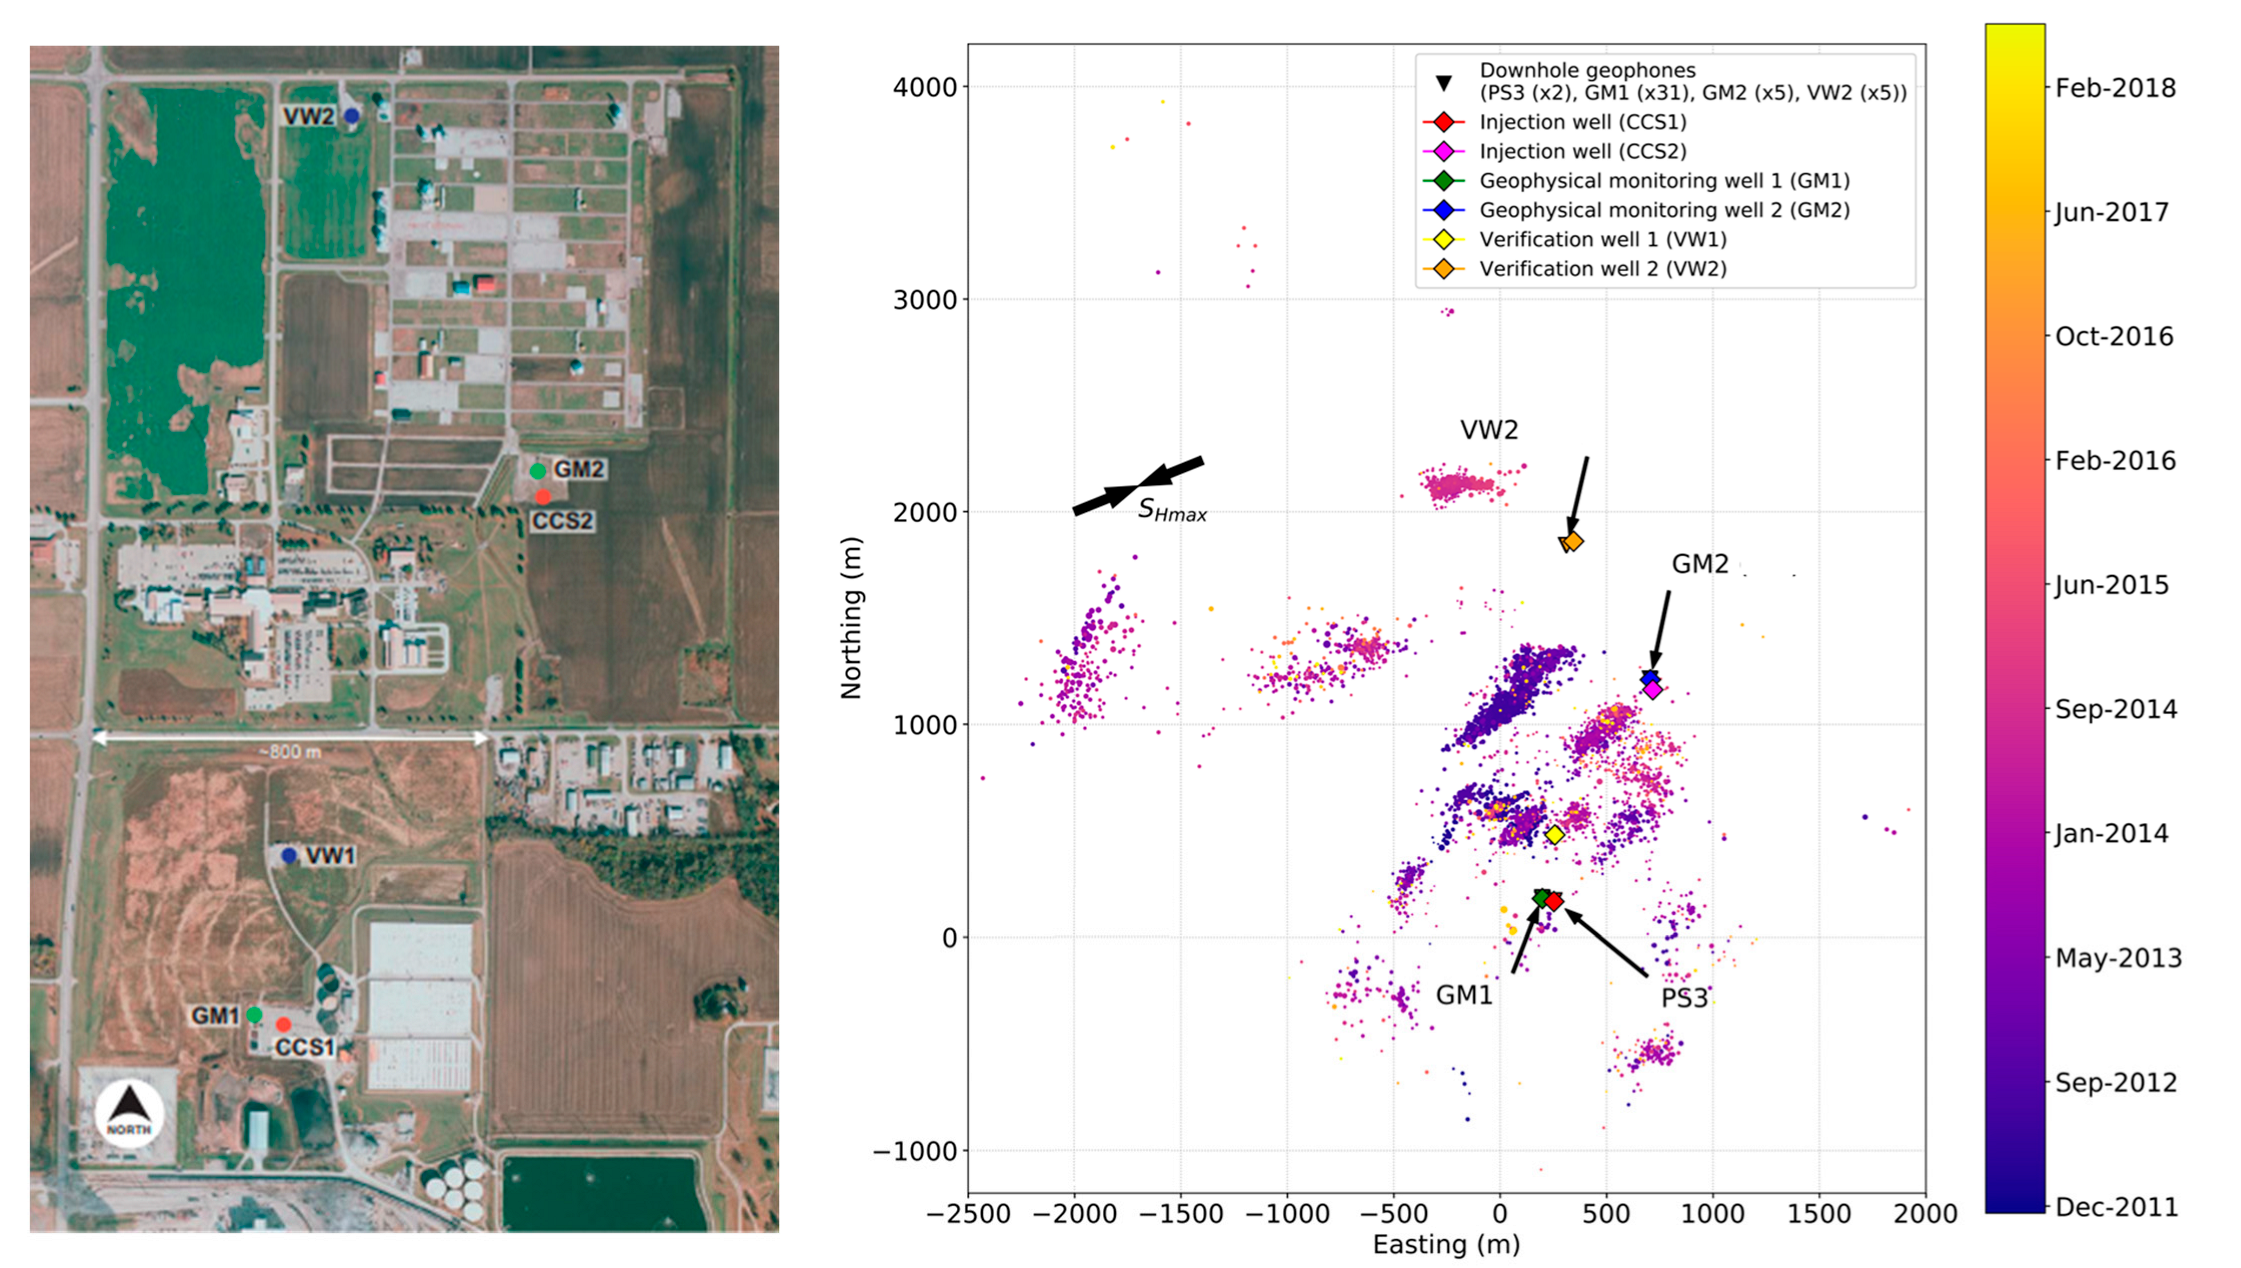
3.5. CO2 Injection Monitoring Project in the Illinois Basin, USA

The Illinois Basin-Decatur Project (IBDP) is the first demonstration-scale carbon capture and storage site established by the U.S. Department of Energy to explore the technical and economic feasibility of long-term CO2 storage using geologic formations. The first phase injected 1 mt of supercritical CO2 between November 2011 and November 2014 at an average injection rate of 1000 t per day into the Lower Simon Sandstone at 1920–1940 m below sea level. At a distance of 1100 m to the northeast of the original injection well, a second phase of injection began. This injection will continue until 2020 at a depth of 1810–1870 m in another high permeability and porosity profile in the Lower Mount Simon formation [50].
The IBDP base includes an injection well (CCS1), a deep monitoring well (VW1), a dedicated geophysical well (GM1), and various near-surface monitoring wells and equipment (Figure 7) [50,51]. In the CCS1 well, CO2 was injected into the lower part of the Simon Sandstone, which has the highest porosity, averaging 22%, and an average permeability of 200 mD to 1000 mD (Leetaru and Freiburg, 2014). The IL-ICCS base includes an injection well (CCS2), a deep monitoring well (VW2), a dedicated geophysical well (GM2), and various near-surface monitoring wells and equipment (Figure 7) [51].
The microseismic monitoring array consists of two independent geophone observation systems. The permanently buried monitoring wells each contain an observation array of 31 geophones at depths ranging from 624 to 943 m. Between December 2011 and July 2018, more than 19,000 signals were monitored in the wells [50], of which 5397 were microseismic events thought to have occurred within the reservoir. Of these, 4848 events occurred during the first injection phase, and the remaining 549 events occurred during the post-injection phase of CCS1 (from December 2014) and after the start of the second injection phase of CCS2 (from April 2017), with the two sets of microseismic events occurring in different spatial clusters. The source depths are distributed from the Lower Simon Reservoir toward the Upper Precambrian basement. Dando B D E et al. (2021) used an improved double difference algorithm to relocate microseismic events to the locations of microseismic events recorded by the IBDP and IL-ICCS projects. A total of 4293 events were relocated from the original catalog of 5397 events. The relocated microseismic event point clouds (microseismic event clusters) are more aggregated and exhibit new linear features oriented close to the NE–SW direction [51].
At the IBDP site, only low-magnitude seismic events (moment magnitude less than 1.2 Mw) were detected during the injection process, which started two months after the start of CO2 injection. Approximately 90% of the microseismic events occurred within 280 m below the injection layer, with the two highest magnitudes recorded being 1.07 and 1.17 Mw [50]. In a CO2 injection and storage project in Illinois lasting nearly 10 years, significant differences in the reservoir response to fluid pressure changes were obtained from microseismic monitoring in the same reservoir selected for injection at different locations.

3.6. Microseismic Monitoring of CO2 Injection Projects in Other Regions

Approximately 10,000 t of supercritical CO2 was injected at a depth of 1050 m in the Bass Island Dolomite (BILD) field in the Michigan Basin, which will be used for enhanced crude oil recovery (EOR), and over 200 microseismic events were monitored. By locating the source of these events, analyzing the frequency characteristics, and classifying the seismic mechanisms, it was found that most of the events were close to the borehole, and all of the event mechanisms were different from those of fault-slip injection-induced seismicity. It was found that these microseismic events were generated by the expansion of the CO2 gas mixture oscillating in fluid-filled fractures, which in turn indicates that the CO2 phase transition seems to trigger oscillations that are located very close to the borehole where the monitoring array is deployed; thus, many microseismic events were recorded [52,53].
At the Aquistore site in Saskatchewan, Canada, where CO2 is injected for enhanced recovery operations, more than 105 kt of CO2 was injected over a two-year period from 2015 to 2017 into a brine formation around 3.2 km below ground. The site has one injection well and one monitoring well and implements various monitoring techniques. Among them, time-lapse 3D seismic and passive seismic monitoring techniques are carried out [54].
Passive seismic tomography (PST) is a geophysical exploration technology that uses natural microseismic activity (microseismic activity with −1 to 2 Richter magnitude that occurs almost everywhere) as the source. In CO2 injection projects, passive seismic monitoring techniques mainly use environmental noise seismic imaging methods so they can accurately reflect subsurface structures at certain depths, and most studies aim at extracting surface wave properties from environmental noise [55,56,57]. There are also some studies that extract body wave reflection information from noise to invert deep subsurface structures [58,59,60].
In the Aquestore project, a permanent monitoring array consisting of 650 geophones is deployed on a 2.5 × 2.5 km grid at a depth of 20 m. The purpose of the array is to test “sparse array” seismic imaging and to provide continuous passive monitoring. As of 2018, analysis of passive seismic activity in this area has not detected any microseismic events associated with CO2 injection. This may be due to the small injection volume in this area, coupled with the low effective stress in this area, which is not susceptible to shear damage. However, with further injection in this work zone, the risk of fault reactivation (induced seismicity) occurring will be increased and continuous seismic monitoring is necessary to provide alerts of any fault reactivation [61].

4. Case Study of Carbon Sequestration Injection and Microseismic Monitoring Engineering in China

Among the many energy-saving and emission-reducing technologies, CCUS is the most suitable for China’s national conditions and can achieve low-carbon utilization of fossil fuels on a large scale. CCUS is the most mature technology but it is still in its infancy in industrial applications and is still in the demonstration stage in China.

4.1. CCUS-EOR Project in Jilin

The CNPC Jilin CCUS-EOR project is only 1 of the 21 large-scale CCUS projects in operation in China. It is also the largest and earliest CCUS-EOR project in Asia. In 2009, microseismic fracture monitoring was carried out only in the CO2 injection block. In order to detect possible microseismic events during CO2 injection, 12 three-component receiver arrays were placed on the ground near the well with a spacing of 5–10 m [62]. The CO2 scanning profile inverted by microseismic events and the density of microseismic events monitored at different locations can be used to describe the migration direction of CO2 in reservoirs. Microseismic technology can effectively monitor the CO2 flow and preferential sweep consistency in the reservoir [63]. The CO2 preferential flow drawn can predict the production of CO2 and even breakthrough (Figure 8), which provides a basis for guiding injection–production control strategies and optimizing reservoir injection–production plans.

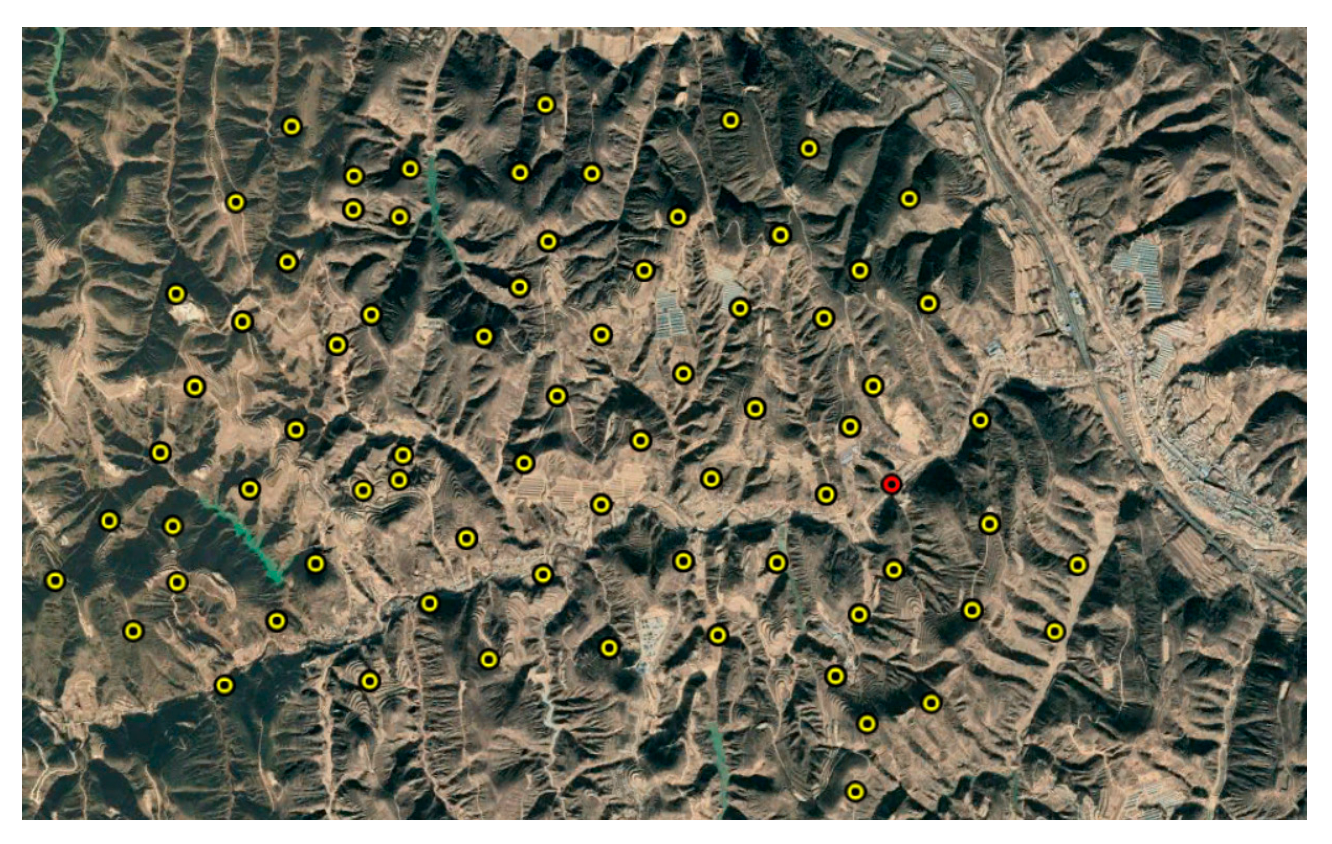
4.2. CCUS-ECBM Project in Shanxi, China

In recent years, China has established efficient clean coal utilization and new energy-saving projects led by the China Union Coalbed Methane Company in order to reach the double carbon target and reduce CO2 emissions in industrial production. In 2018, a 3-year project of CO2 injection was started to drive coalbed methane to improve the coalbed methane extraction rate while permanently sequestering CO2 in the target reservoir as much as possible. The project objectives are to effectively bury CO2 in coal seams and inject CO2 to effectively replace methane to improve the actual demand of the coalbed methane extraction rate. Further objectives are to investigate the pore permeability change law and main control factors in the process of CO2-driven coalbed methane, as well as promote the industrialization process of CO2-driven coalbed methane through field demonstration and application evaluation results.
In order to monitor the transport and storage of CO2 before, during, and after injection, the project designed and proposed a “space–sky–ground–well” monitoring system, which consists of four geophysical monitoring techniques at different scales and in two time dimensions for a small area with multiple production wells from a single injection. The four geophysical monitoring techniques are space satellite remote sensing, sky unmanned aerial vehicle (UAV) scanning imaging, near-surface microseismic monitoring, and deep-well VSP, along with other injection-sensitive parameter monitoring methods using fiber optic acquisition (Figure 9) [64].
The porosity of the injected target coal seam averages 4.96%, with small overall variation. The results of the single-phase injection and pressure drop test wells show that the overall permeability of the coal seam in this area is low. The permeability shows a gradually increasing trend from east to west, generally ranging from 0.01 to 1.10 mD, with an average of 0.47 mD and obvious non-homogeneity, all of which are features of low-permeability reservoirs. The coalbed methane test well pressure is 1.75–6.14 MPa.
Microseismic monitoring technology has been effectively applied in this project. This monitoring and observation system includes 30 5 Hz three-component geophones placed above the injection target, with three main monitoring periods: before, during, and after CO2 injection. This system was in the smooth injection stage up to November 2022, with the cumulative injection volume reaching 2000 t and the daily injection volume reaching about 13 t. A total of 38 events were monitored during the microseismic monitoring period. The magnitude of the event points was less than −0.6 Mw, distributed in the middle and lower parts of the reservoir and around the injection wells. Combined with other monitoring methods, the CO2 transport trend can be effectively identified (Figure 10). Since the replacement of CBM with CO2 is the first target, the CO2 transport direction is consistent with the pressure drop trend direction, and also coincides with the production-dominant orientation of the production wells.
The CO2-replaced CBM project in Shanxi, China, is one of the CBM reservoir applications. Coal is a dense rock with small-pore reservoirs, and there is low permeability and low rupture pressure in the target coal seam. These are important reasons for the induction of microseismic events within this reservoir. Since the pressure may be transmitted farther than the fluid, the microseismic event location does not necessarily represent the range reached by fluid transport, but the trend of the dense distribution of events can approximately depict the range of the fluid plume. The monitoring data of the work area are applied to the passive seismic processing process. Aiming at unobvious microseismic events, this technique describes the possible time-spatial locations of fractures by similar stacked waveforms. During the injection period, the gas production pressure trend of the production well is also consistent with the monitoring results.
To enhance gas replacement and repulsion, it is necessary to increase the CO2 injection rate, which in turn increases the bottomhole pressure. However, this changes the stress state of the reservoir, increasing the risk of seam fracture and the chance of microseismic events, and more CO2 will be produced later in the gas recovery. Therefore, the number of microseismic events monitored during injection can be more effectively evaluated in this process and assist in controlling the injection parameters to achieve a better CBM recovery while avoiding a risky implementation mode.

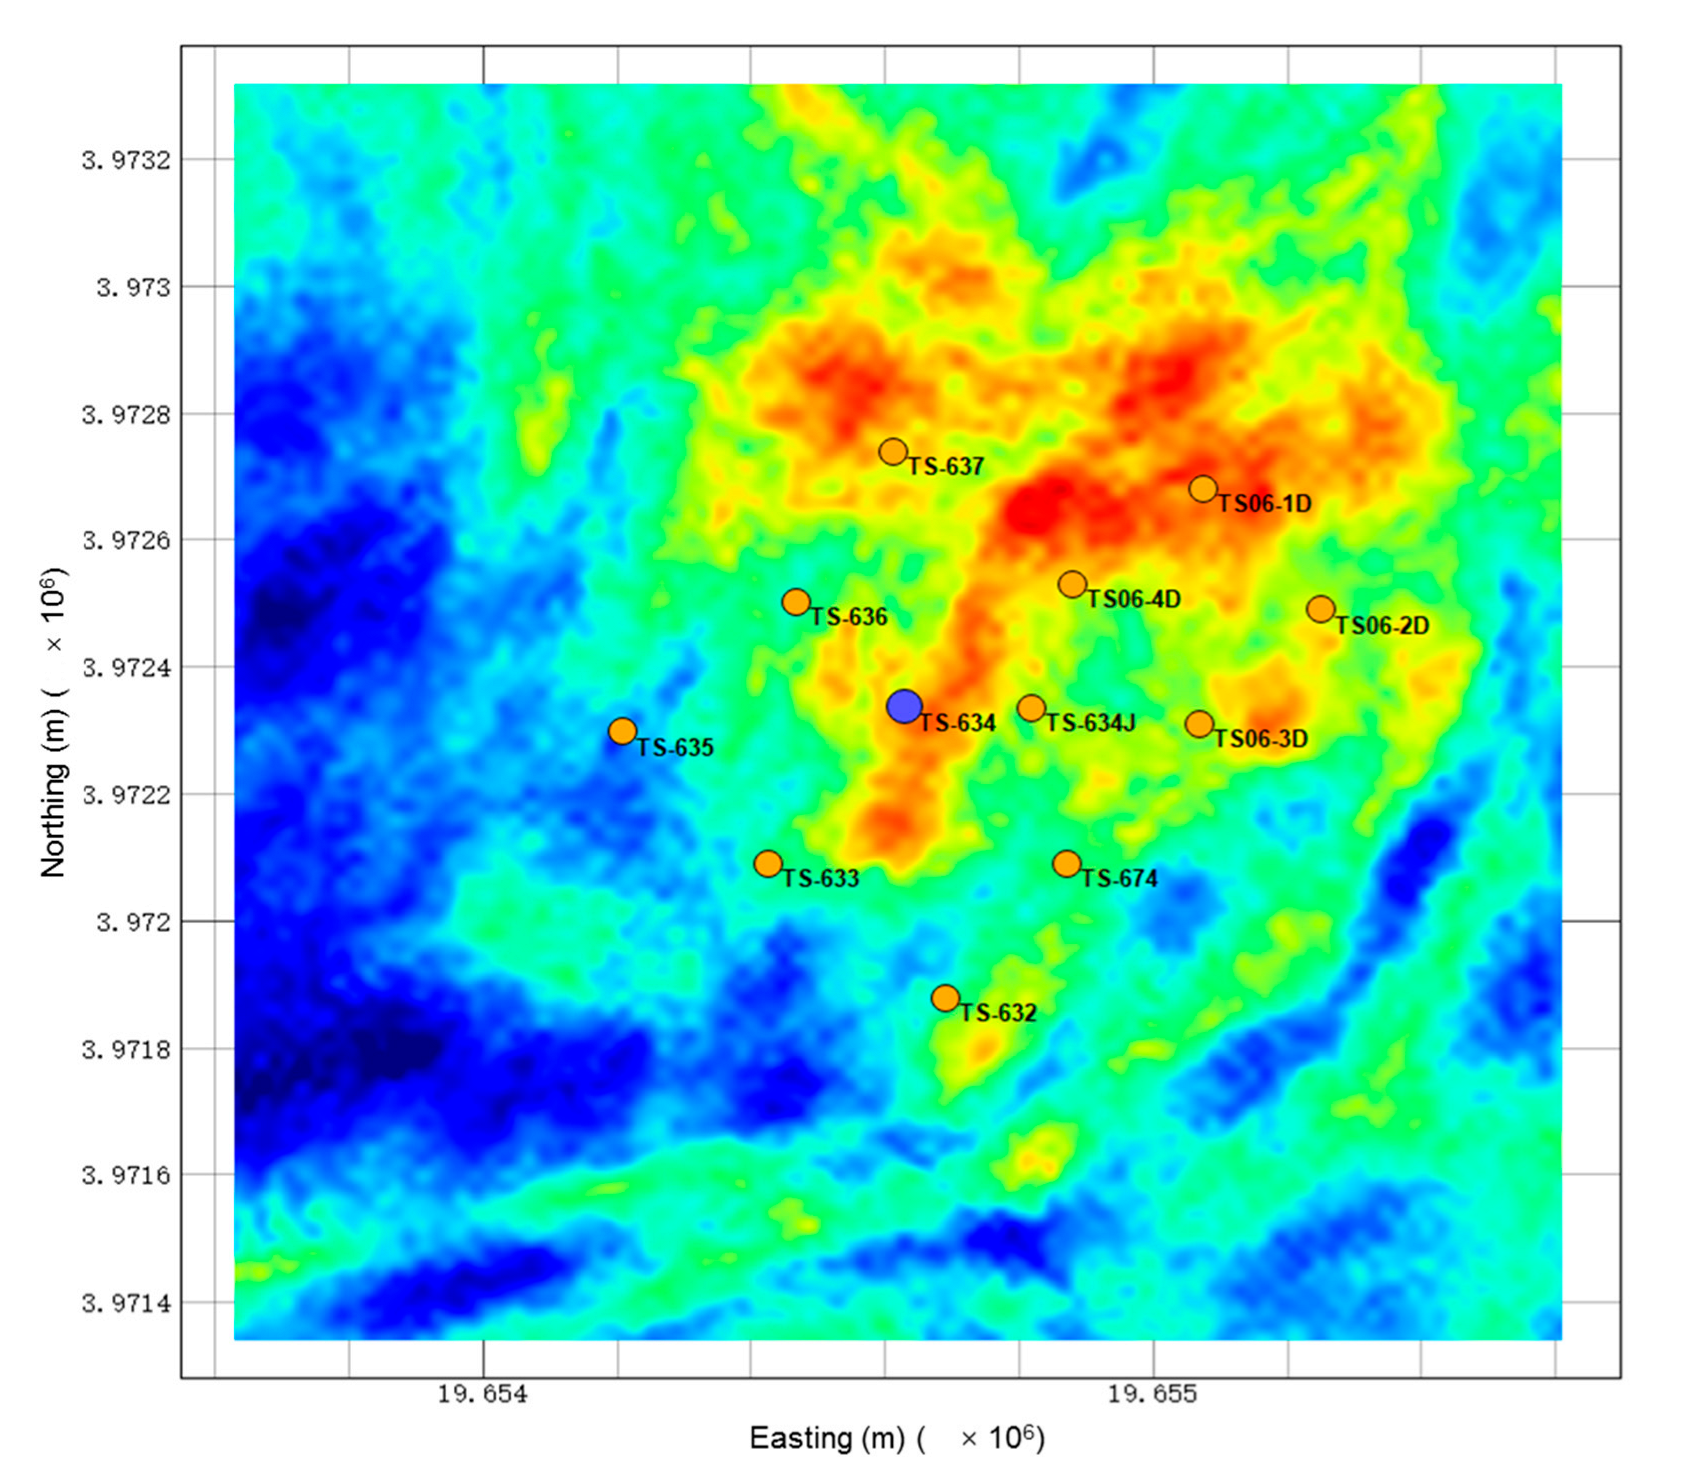
4.3. CCUS-EOR Project in Shaanxi, China

A CO2 injection project to improve the oil and gas recovery rate was led by Yanchang Group in 2018, jointly with several research units and universities. As of November 2022, the average daily injection volume of the well field in the oil area was 60 t, and the total injection volume was 3000 t. The highest injection pressure reaches 15 MPa. The surface is covered with loess, and the elevation difference of the ground can reach 150–120 m. The topographic conditions are complex. The distribution of the mountain beam is spread in a north–south direction. The submerged divergent river sand body at the delta front of the Long 6 oil formation group is a lithic-tectonic reservoir and a lithic oil and gas reservoir. The average porosity value of the Long 6 reservoir in the study area is around 10%, and the permeability is around 1 mD.
For the attenuation of seismic waves in the loess plateau landscape, a combined monitoring mode of surface shallow well and in-well monitoring was used (Figure 11). The surface monitoring stations were deployed on a larger scale, and in-well monitoring instruments were placed near the two injection wells. A total of 28 microseismic events were monitored during the injection period. The event point locations were all located inside the reservoir and were much smaller than the rupture intensity of the cap layer in the injection area; further, the events occurred over a large span with weak correlation between events, which were considered as episodic internal reservoir disturbances during the injection process (Figure 12).
The microseismic event processing and interpretation operation processes apply the team’s self-developed intelligent processing algorithm for joint well and ground data to harvest data in real time from the field to the laboratory. This allows complete automated localization and interpretation to further evaluate the impact of each event on the reservoir based on factors such as location, source mechanism, event magnitude size, and the relationship between the event and injection rate variation. Due to the low-speed layer factor, the ground signal quality is poor in this area. The event location is dominated by the well data and assisted by ground direction. This is because the timing of travel in space is more accurate. This processing method is different from that of the other work area. Each located event point is returned to the geological model of the site.
The project is a pilot test project in the study area with a small injection volume. By evaluating reservoir tolerance and recording reservoir behavior changes, the demonstration project has gradually been established, and the engineering behavior standards and specifications for CO2 injection into tight sandstone layers have been formed. Among them, microseismic monitoring plays a practical role in the efficient, accurate, and intelligent evaluation of reservoir geomechanical behavior.

5. Discussion and Prospects

5.1. Data Processing and Interpretation of CCUS Engineering Microseismic Monitoring

Whether it is water injection fracturing or CO2 injection, large earthquakes may occur. The main concern is that even a small degree of microseismic activity may threaten the sealing integrity of CO2 reservoirs. The reservoir conditions, monitoring schemes and monitoring results of each work area are recorded to ensure the safety of the reservoir and prevent leakage, and the monitoring and target prediction of the reservoir geomechanical behavior are carried out (Table 1).
The microseismic data of each work area are collected by observation instruments, and the underground induced source is quantitatively analyzed by denoising, effective event picking, seismic phase identification, source location and focal mechanism inversion. Identifiable microseismic events are the basis for studying microseismic location algorithms. Research has been performed for most of the work areas on the applicability of microseismic algorithms. Microseismic events are also the basis of studying reservoir geomechanics. The focal mechanism information of the event can be used to quickly determine the current local stress state of the reservoir and understand the fluid trend in the reservoir. Microseismic positioning and focal mechanism inversion algorithms have become quite mature. Due to the long injection cycles, the enormous amount of data will be a large challenge in the future.
In recent years, deep-learning-related microseismic data denoising [65], event picking, and seismic phase identification have been used [66,67,68,69,70]. In regard to data processing, algorithms for artificial intelligence or deep learning integration, the processes use the feature recognition capabilities of computers to complete a large number of repetitive manual operations to further extend the data processing and interpretation capability.
In the application of CCUS demonstrations project in China, in order to meet the timeliness and multidimensionality of engineering feedback, and in view of the large amount of data collected by observation instruments and the diversified data structure and characteristics, a set of intelligent microseismic data processing and interpretation processes and platforms based on artificial intelligence have been developed through continuous verification and practice. The platform includes microseismic data input, first arrival picking and microseismic phase identification, event location, and focal mechanism inversion. According to the focal mechanism inversion information, the discrete fracture network or continuous fracture network is obtained, and then the in situ stress state and permeability distribution under the current state are explained. The platform operates on a server, and the cloud is equipped with a large number of seismic data databases for the artificial intelligence network to extract features and satisfy the test requirements of various deep learning algorithms. Combined with the 5G communication network, the platform has a high level of real-time processing ability. Continuously collected data are transmitted from the field to the data processing laboratory, and the results of processing and interpretation are projected onto 3D geological models, which makes the visualization more intuitive.

5.2. Effectiveness and Safety Evaluation of Microseismic Monitoring in CCUS Projects

At present, the most popular risk assessment for induced earthquakes is the “traffic lights” system. The “traffic lights” system was originally developed to control seismic activity disasters caused by geothermal projects [71]. The data obtained from seismic network monitoring are the basis for constructing “traffic lights”. Modifying the fluid injection parameters [72,73,74] allows for responding to possible induced earthquakes [75]. The “traffic lights” system is designed based on the threshold of decision variables (earthquake magnitude, peak ground velocity, etc.) and the measures taken above the threshold. The current threshold setting is mainly based on local regulations [71,72,74,76], and the measures taken are usually temporary reductions in the fluid injection volume or injection rate to reduce the seismic risk.
The microseismic monitoring method of CO2 injection and storage projects is able to provide timely warnings through an intelligent processing flow in case of an emergency such as a leakage. Different from natural earthquakes, the microseismic activity induced by fluid injection into reservoirs has strong temporal and spatial correlations and is influenced by the injection rate, injection pressure, and injection volume. Effective and harmless microseismic information can sufficiently reflect the current reservoir state. The application of microseismic monitoring technology in CO2 injection engineering can also detect the occurrence of natural earthquakes. Compared with the local seismic network, it is helpful to screen whether there are natural earthquakes induced by fault slips caused by injection, that is, the correlation between natural earthquakes and reservoir engineering. Quantitative analysis of the magnitude, location, and time series related to natural earthquakes and the frequency of microseismic events in a certain period of time in the injection project, combined with geological information such as reservoir structure, can determine whether the injected CO2 significantly changes the current reservoir state. This analysis can guide the monitoring to further evaluate the integrity of the caprock and reservoir safety and thereby avoid greenhouse gas leakage and the induction of major earthquakes and other emergency events.

5.3. Selection and Integration of CCUS Engineering Geophysical Techniques

In order to achieve large-scale capacity of CO2 storage, it is necessary to explore the injection and storage engineering of abandoned reservoirs and tight reservoirs outside the brine layer. Microseismic monitoring technology can provide long-distance or non-contact measurement capabilities, and the response of microseismic events monitored by this technology can be used to evaluate the geomechanical behavior of reservoirs. This type of monitoring is suitable for various types of reservoirs and relies on data processing and interpretation to obtain intuitive results and evaluation. It still needs to rely on more accurate models and further reservoir geological information to enable more accurate reservoir state change evaluations.
Through continuous experiments and exploration in the process of two CCUS demonstration projects, a set of microseismic monitoring systems based on multi-physical field coupling of well–ground joint monitoring is proposed (Figure 13). The system starts from the study of reservoir rock properties and adapts the monitoring task to different reservoir types. The array mode of the well–ground combination is used to adapt to various near-surface conditions. Finally, combined with the intelligent processing and interpretation platform, the data processing work is completed quickly and accurately, and the risk assessment and warning processing are monitored by the multi-threshold setting.
The occurrence and magnitude of microseismic events are closely related to the injection pressure and rock properties, and the injection of CO2 will also cause changes in rock physical properties. Coupling processes should be considered when assessing the potential for (micro)seismicity or subsurface state changes induced by CO2 storage projects. These include reservoir rock physics, fluid mechanics, and even thermodynamic and chemical factors. These not only provide accurate parameters and a change basis for model simulation, but also introduce an effective model basis for microseismic monitoring data processing. The selection of multiple technologies and the coupling and superposition of multi-scale and multi-physical systems in time and space are conducive to the establishment of a fusion reservoir cap rock and fault monitoring and evaluation system, which provides a more accurate assessment of underground stability after injection.

6. Conclusions

1.
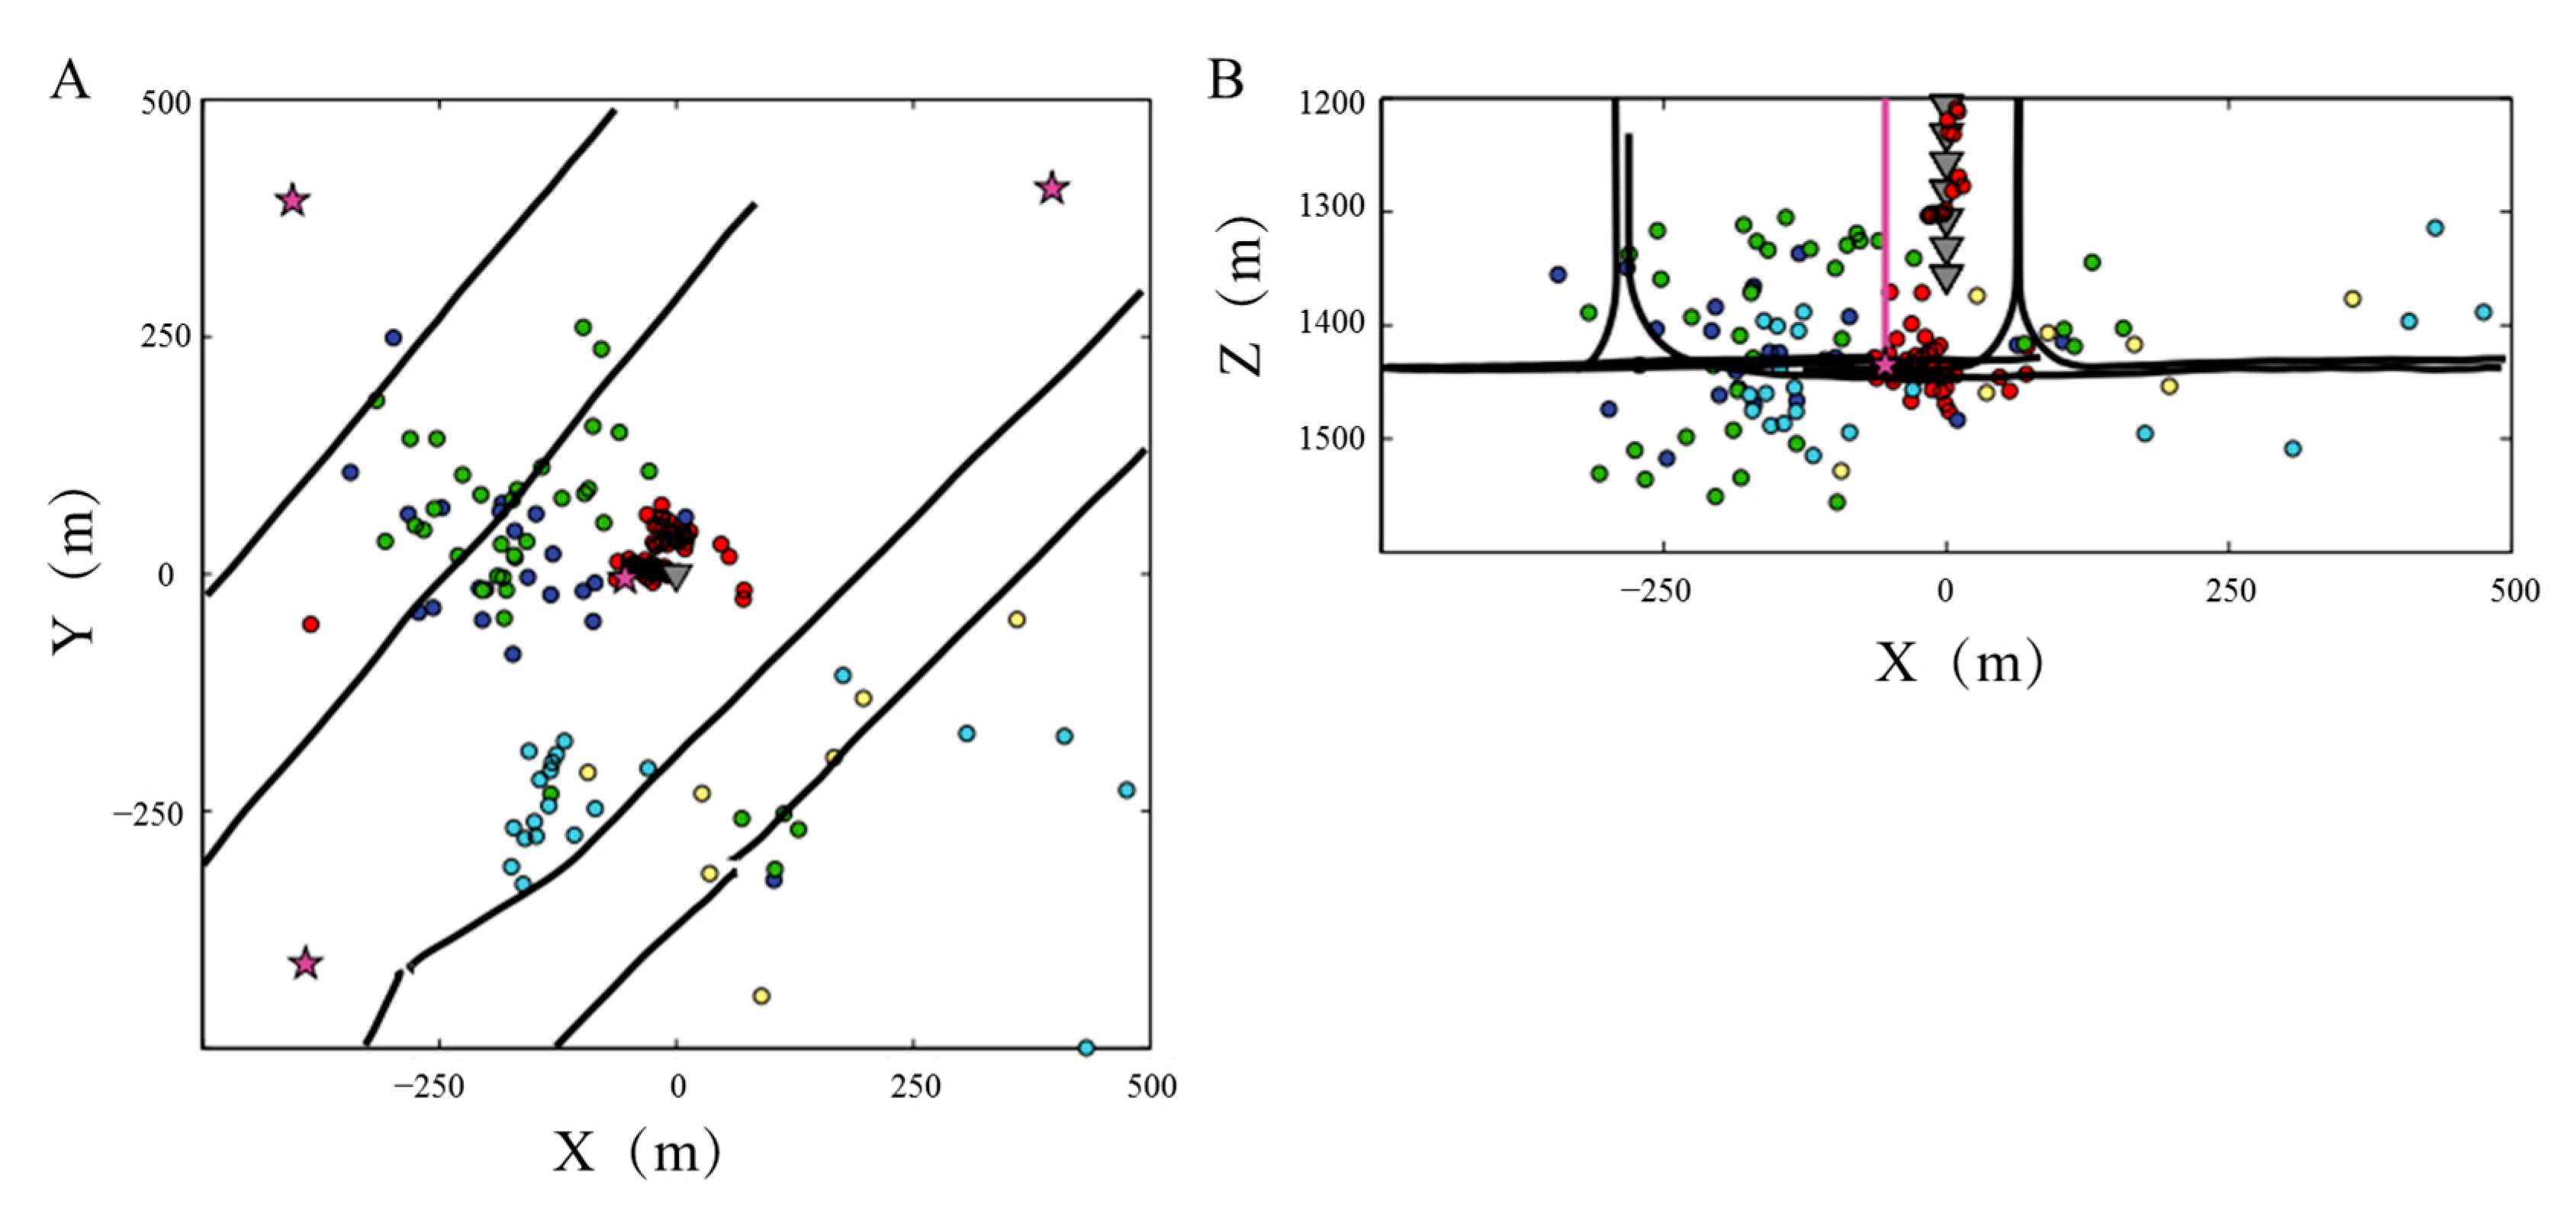
The microseismic monitoring results of CCUS engineering need to analyze the magnitude, mechanism, spatial and temporal frequency, and distribution of events to accurately reflect the geomechanical changes in injected reservoirs. In China’s projects, passive ambient noise imaging results can also better reflect the plume results. The relationship between the space–time law of the event distribution and the strength of the cap rock can effectively identify the breakthrough or even leakage behavior of CO2. The distribution of microseismic energy release can show the dynamic behavior of fluid in the reservoir.
2.
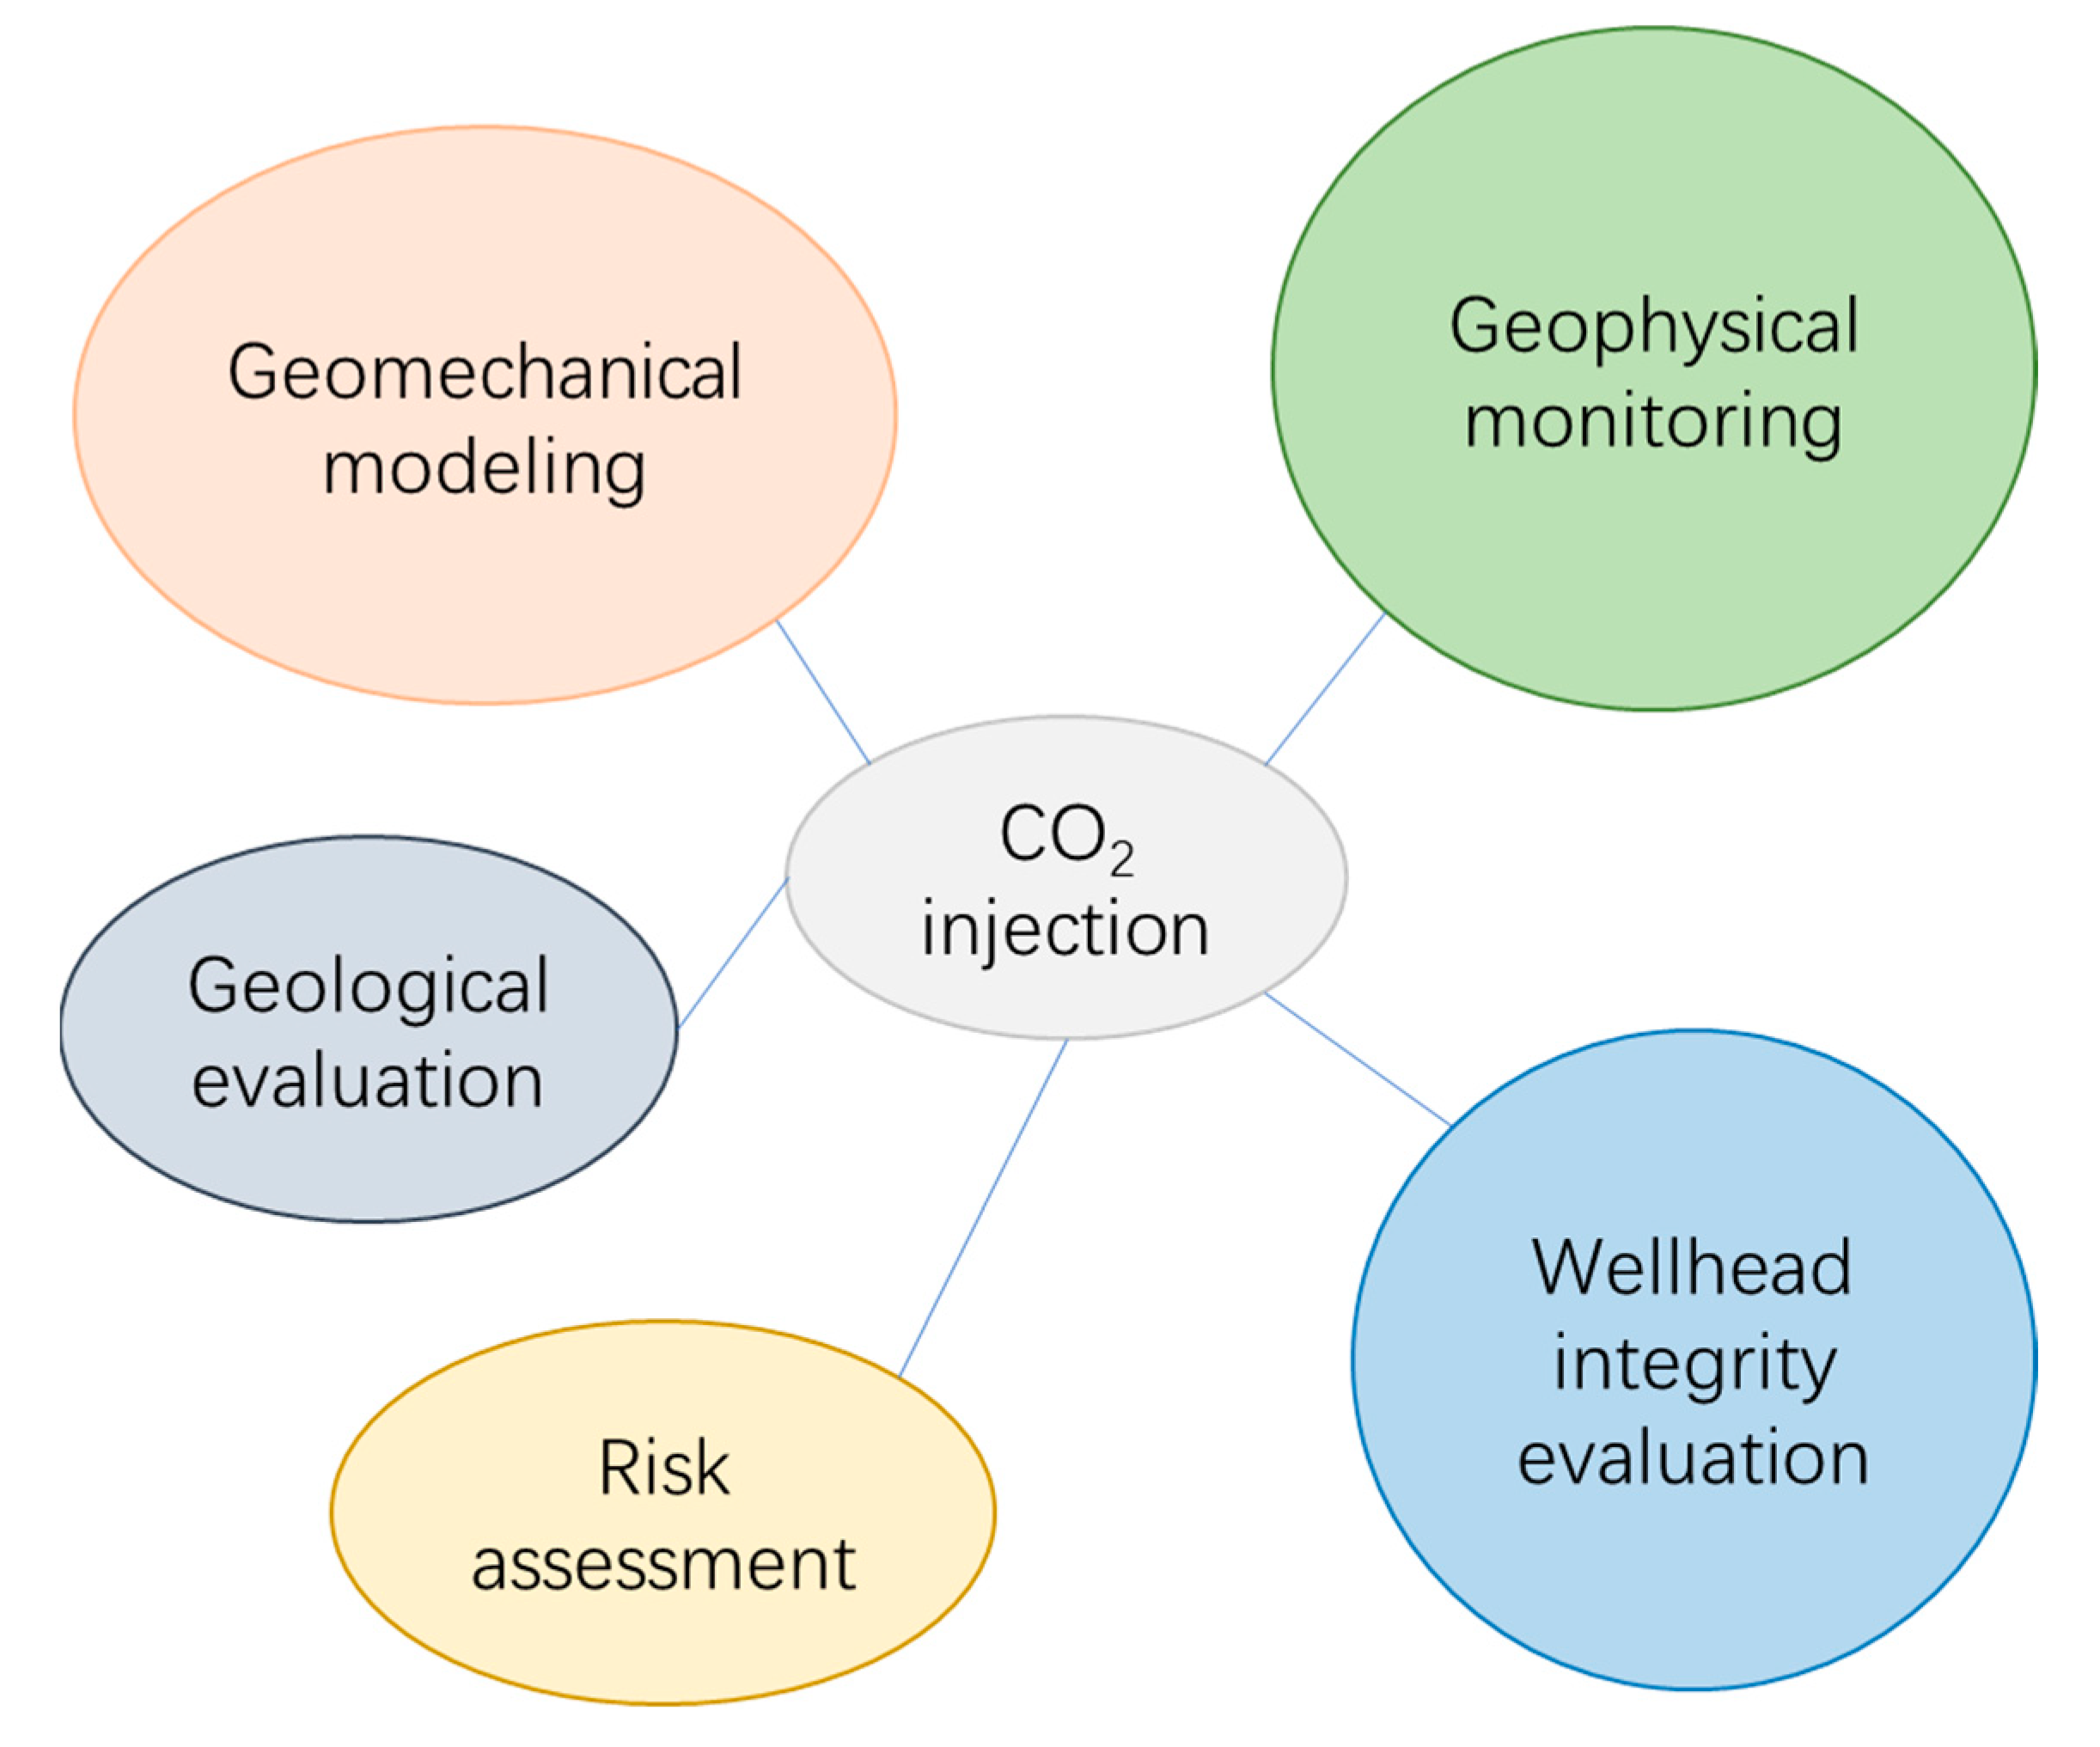
CCUS project needs to establish a reliable process of CO2 geological and geophysical injection analysis. The CCUS engineering microseismic monitoring technology can monitor (micro-)earthquakes that inject into the front edge or induce fault activation. It is necessary to combine the numerical simulation of reservoir fluid and rock physics modeling, and the numerical simulation of microseismic wave fields to form an important process in CO2 geological storage analysis. To achieve this, a direct means is to evaluate and analyze the plume distribution and reservoir geomechanical changes formed by CO2 injection.
3.
China’s CO2 injection monitoring has achieved good results thanks to a comprehensive monitoring strategy. CO2 geological storage monitoring is in the stage of testing and evaluation in China. Through two projects with obvious differences, a set of well–ground joint multi-array microseismic monitoring systems with high applicability and strong practicability are proposed, which are combined with artificial intelligence integration, and data processing and interpretation platforms. In future engineering work, it is necessary to further optimize and mature the technology and specifications. With the progress in optical fiber technology, the development of cost-controllable and permanent acquisition equipment will enable microseismic monitoring to meet the requirements of a certain period of repeated or continuous observations, and intelligently assess risks and deal with early warnings.

Author Contributions

Conceptualization, L.M. and J.Z.; validation, J.Z. and R.Y.; formal analysis, L.M., Y.S. and J.X.; investigation, D.L., L.M. and Y.S.; resources, D.L. and R.Y.; data curation, L.M., Y.S. and J.X.; writing—original draft preparation, L.M.; visualization, L.M.; supervision, S.P., J.Z. and R.Y.; funding acquisition, S.P. All authors have read and agreed to the published version of the manuscript.

Funding

This work was supported in part by the National Key Research and Development Program of China under Grant 2018YFB0605503 and 2018YFB0605603, and in part by the Open Fund of the State Key Laboratory of Coal Resources and Safe Mining under Grant SKLCRSM21LH01.

Data Availability Statement

Not applicable.

Acknowledgments

We are thankful to the data and related materials provided by China United Coalbed Methane Group and Yanchang Petroleum Group. The relevant research results are from the team led by Academician Peng Suping of China University of Mining and Technology (Beijing). The authors thank the anonymous reviewers and editors for their hard work.

Conflicts of Interest

The authors declare no conflict of interest.

References

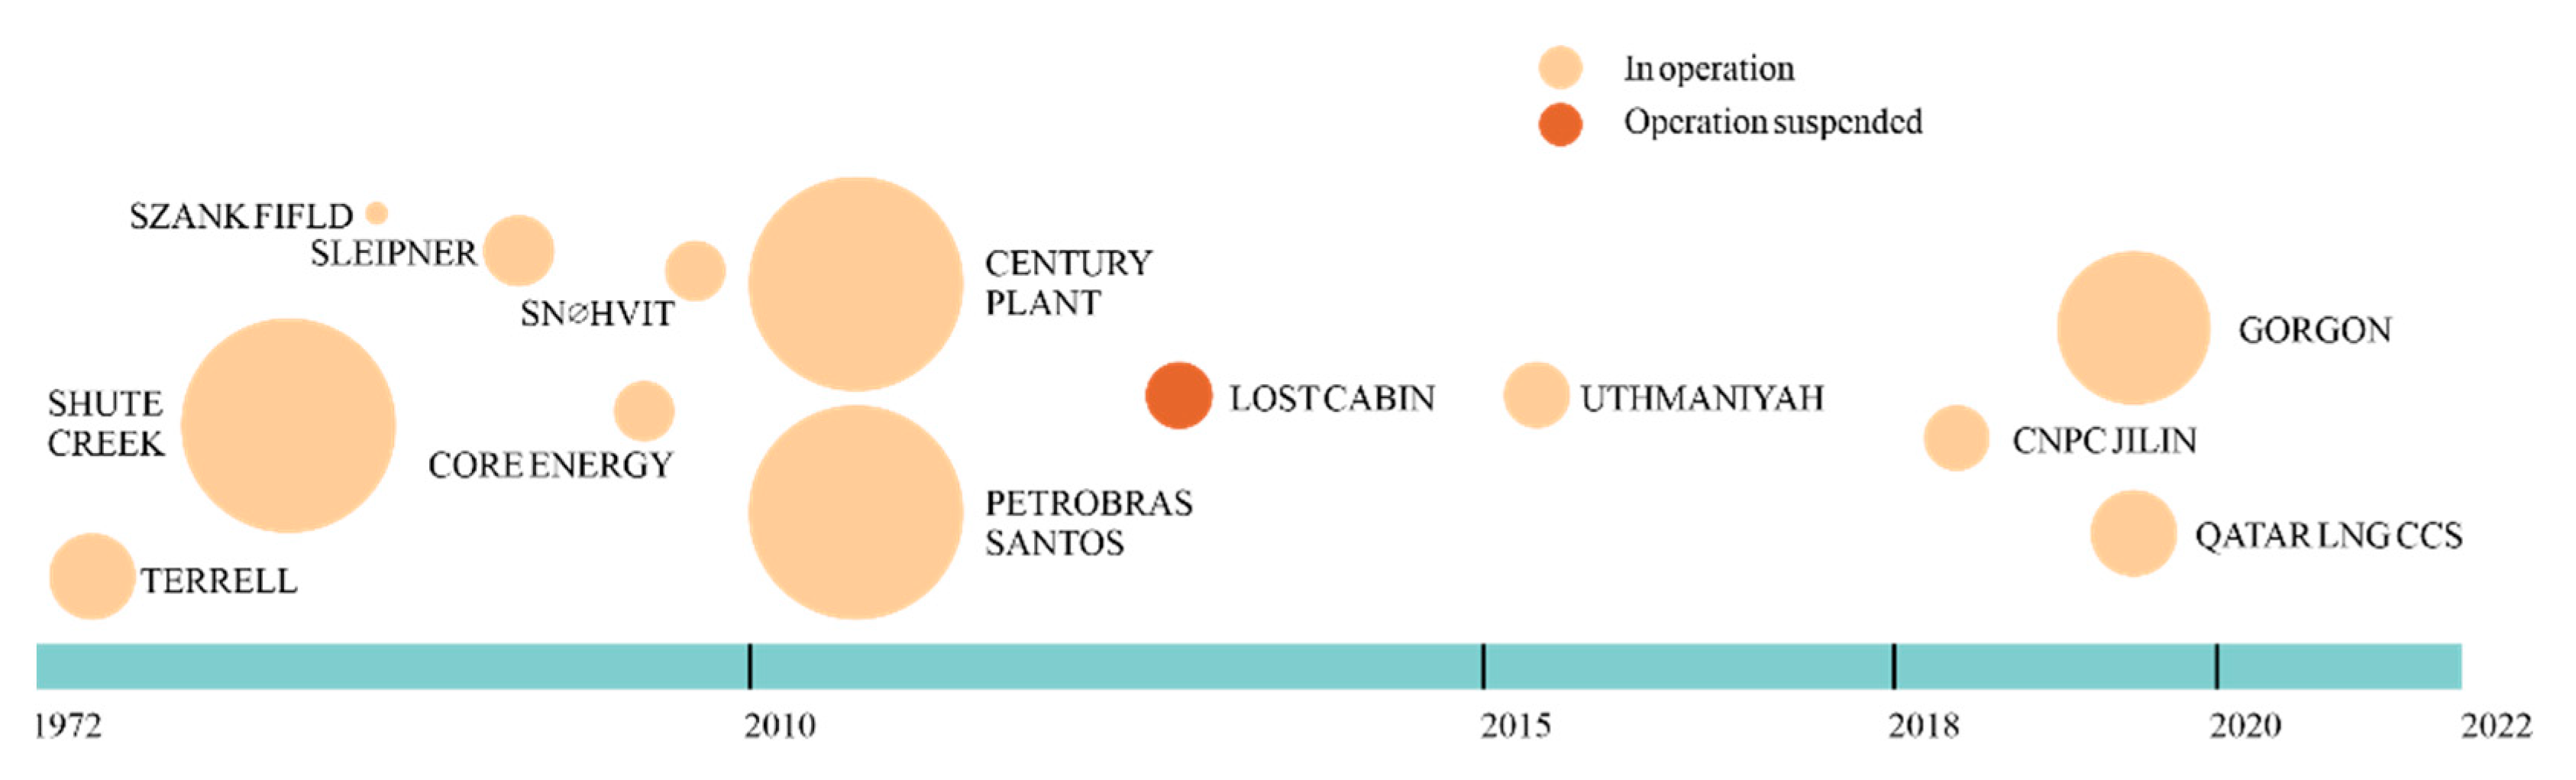
  1. Global CCS Institute. CO2RE Database. 2021. Available online: https://co2re.co/ (accessed on 25 June 2021).
  2. Eve, T. Carbon Removal with CCS Technologies. 2021. Available online: https://www.globalccsinstitute.com/resources/publications-reports-research/carbon-removal-and-ccs/ (accessed on 23 February 2021).
  3. IOGP. What Is CCUS? International Association of Oil and Gas Producers. 2021. Available online: https://www.iogp.org/blog/faqs/what-is-ccus/ (accessed on 23 February 2022).
  4. IEA. Technology Roadmap-Energy Storage. 2014. Available online: https://origin.iea.org/reports/technology-roadmap-energy-storage (accessed on 23 February 2022).
  5. Global CCS Institute. The Global Status of CCS. 2022. Available online: https://status22.globalccsinstitute.com/ (accessed on 23 February 2022).
  6. Bourne, S.; Crouch, S.; Smith, M. A risk-based framework for measurement, monitoring and verification of the Quest CCS Project, Alberta, Canada. Int. J. Greenh. Gas Control 2014, 26, 109–126. [Google Scholar] [CrossRef]
  7. Zhou, R.; Huang, L.; Rutledge, J. Microseismic event location for monitoring CO2 injection using double-difference tomography. Lead. Edge 2010, 29, 208–214. [Google Scholar] [CrossRef]
  8. Zoback, M.D. Reservoir Geomechanics; Cambridge University Press: Cambridge, UK, 2010. [Google Scholar]
  9. Rutqvist, J. The geomechanics of CO2 storage in deep sedimentary formations. Geotech. Geol. Eng. 2012, 30, 525–551. [Google Scholar] [CrossRef] [Green Version]
  10. Verdon, J.; Kendall, J.-M.; White, D.; Angus, D. Linking microseismic event observations with geomechanical models to minimise the risks of storing CO2 in geological formations. Earth Planet. Sci. Lett. 2011, 305, 143–152. [Google Scholar] [CrossRef] [Green Version]
  11. Vilarrasa, V.; Carrera, J.; Olivella, S.; Rutqvist, J.; Laloui, L. Induced seismicity in geologic carbon storage. Solid Earth 2019, 10, 871–892. [Google Scholar] [CrossRef] [Green Version]
  12. Paterson, L.; Lu, M.; Connell, L.D.; Ennis-King, J. Numerical modeling of pressure and temperature profiles including phase transitions in carbon dioxide wells. In Proceedings of the SPE Annual Technical Conference and Exhibition, Denver, CO, USA, 21–24 September 2008. [Google Scholar]
  13. Vilarrasa, V.; Makhnenko, R.Y.; Laloui, L. Potential for fault reactivation due to CO2 injection in a semi-closed saline aquifer. Energy Procedia 2017, 114, 3282–3290. [Google Scholar] [CrossRef] [Green Version]
  14. Vilarrasa, V.; Rutqvist, J. Thermal effects on geologic carbon storage. Earth-Sci. Rev. 2017, 165, 245–256. [Google Scholar] [CrossRef] [Green Version]
  15. King, G.C.; Stein, R.S.; Lin, J. Static stress changes and the triggering of earthquakes. Bull. Seismol. Soc. Amer. 1994, 84, 935–953. [Google Scholar]
  16. Stein, R.S. The role of stress transfer in earthquake occurrence. Nature 1999, 402, 605–609. [Google Scholar] [CrossRef]
  17. Cornet, F.; Helm, J.; Poitrenaud, H.; Etchecopar, A. Seismic and aseismic slips induced by large-scale fluid injections. In Seismicity Associated with Mines, Reservoirs and Fluid Injections; Birkhäuser Basel: Basel, Switzerland; pp. 563–583.
  18. Guglielmi, Y.; Cappa, F.; Avouac, J.-P.; Henry, P.; Elsworth, D. Seismicity triggered by fluid injection–induced aseismic slip. Science 2015, 348, 1224–1226. [Google Scholar] [CrossRef] [Green Version]
  19. Faulkner, D.; Mitchell, T.; Healy, D.; Heap, M. Slip on‘weak’faults by the rotation of regional stress in the fracture damage zone. Nature 2006, 444, 922–925. [Google Scholar] [CrossRef]
  20. Mazzoldi, A.; Rinaldi, A.P.; Borgia, A.; Rutqvist, J. Induced seismicity within geological carbon sequestration projects: Maximum earthquake magnitude and leakage potential from undetected faults. Int. J. Greenh. Gas Control 2012, 10, 434–442. [Google Scholar] [CrossRef]
  21. Riding, J.B. The IEA Weyburn CO2 Monitoring and Storage Project-Integrated results from Europe. In Greenhouse Gas Control Technologies 7; Elsevier: Amsterdam, The Netherlands, 2005; pp. 2075–2078. [Google Scholar]
  22. Celia, M.A. Geological storage of captured carbon dioxide as a large-scale carbon mitigation option. Water Resour. Res. 2017, 53, 3527–3533. [Google Scholar] [CrossRef]
  23. Hsieh, P.A.; Bredehoeft, J.D. A reservoir analysis of the Denver earthquakes: A case of induced seismicity. J. Geophys. Res. Solid Earth 1981, 86, 903–920. [Google Scholar] [CrossRef]
  24. Parotidis, M.; Shapiro, S.A.; Rothert, E. Back front of seismicity induced after termination of borehole fluid injection. Geophys. Res. Lett. 2004, 31, 475–496. [Google Scholar] [CrossRef]
  25. White, D.; Johnson, J. Integrated geophysical and geochemical research programs of the IEA GHG Weyburn-Midale CO2 monitoring and storage project. Energy Procedia 2009, 1, 2349–2356. [Google Scholar] [CrossRef] [Green Version]
  26. Jimenez, J.; Chalaturnyk, R.; Whittaker, S. A mechanical earth model for the Weyburn CO2 monitoring and storage project and its relevance to long-term performance assessment. Greenh. Gas Control Technol. 2005, 7, 2141–2145. [Google Scholar]
  27. Whittaker, S.; Rostron, B.; Hawkes, C.; Gardner, C.; White, D.; Johnson, J.; Chalaturnyk, R.; Seeburger, D. A decade of CO2 injection into depleting oil fields: Monitoring and research activities of the IEA GHG Weyburn-Midale CO2 Monitoring and Storage Project. Energy Procedia 2011, 4, 6069–6076. [Google Scholar] [CrossRef] [Green Version]
  28. Maxwell, S.; White, D.; Fabriol, H. Passive seismic imaging of CO2 sequestration at Weyburn. In Proceedings of the 2004 SEG Annual Meeting, Denver, CO, USA, 10–15 October 2004. [Google Scholar]
  29. Verdon, J.P.; Kendall, J.-M.; Stork, A.L.; Chadwick, R.A.; White, D.J.; Bissell, R.C. Comparison of geomechanical deformation induced by megatonne-scale CO2 storage at Sleipner, Weyburn, and In Salah. Proc. Natl. Acad. Sci. USA 2013, 110, E2762–E2771. [Google Scholar] [CrossRef] [PubMed] [Green Version]
  30. Duxbury, A.; White, D.; Samson, C.; Hall, S.A.; Wookey, J.; Kendall, J.-M. Fracture detection using AVOA for caprock assessment in the Weyburn-Midale CO2 monitoring and storage project. In SEG Technical Program Expanded Abstracts 2010; Society of Exploration Geophysicists: Houston, TX, USA, 2010; pp. 348–352. [Google Scholar]
  31. Duxbury, A.B. Fracture Detection Using Seismic Anisotropy at the Weyburn CO2 Storage Site, Saskatchewan; Carleton University: Ottawa, ON, Canada, 2010. [Google Scholar]
  32. Khazaei, C.; Hazzard, J.; Chalaturnyk, R. A discrete element model to link the microseismic energies recorded in caprock to geomechanics. Acta Geotech. 2016, 11, 1351–1367. [Google Scholar] [CrossRef]
  33. Verdon, J.P. Using microseismic data recorded at the Weyburn CCS-EOR site to assess the likelihood of induced seismic activity. Int. J. Greenh. Gas Control 2016, 54, 421–428. [Google Scholar] [CrossRef] [Green Version]
  34. Chadwick, R.; Holloway, S.; Brook, M.; Kirby, G. The case for underground CO2 sequestration in northern Europe. Geol. Soc. Lond. Spec. Publ. 2004, 233, 17–28. [Google Scholar] [CrossRef]
  35. Ringrose, P.; Mathieson, A.; Wright, I.; Selama, F.; Hansen, O.; Bissell, R.; Saoula, N.; Midgley, J. The In Salah CO2 storage project: Lessons learned and knowledge transfer. Energy Procedia 2013, 37, 6226–6236. [Google Scholar] [CrossRef] [Green Version]
  36. Stork, A.L.; Verdon, J.P.; Kendall, J.-M. The microseismic response at the In Salah Carbon Capture and Storage (CCS) site. Int. J. Greenh. Gas Control 2015, 32, 159–171. [Google Scholar] [CrossRef] [Green Version]
  37. Oye, V.; Aker, E.; Daley, T.M.; Kühn, D.; Bohloli, B.; Korneev, V. Microseismic monitoring and interpretation of injection data from the In Salah CO2 storage site (Krechba), Algeria. Energy Procedia 2013, 37, 4191–4198. [Google Scholar] [CrossRef] [Green Version]
  38. Mathieson, A.; Midgley, J.; Dodds, K.; Wright, I.; Ringrose, P.; Saoul, N. CO 2 sequestration monitoring and verification technologies applied at Krechba, Algeria. Lead. Edge 2010, 29, 216–222. [Google Scholar] [CrossRef]
  39. Vasco, D.; Rucci, A.; Ferretti, A.; Novali, F.; Bissell, R.; Ringrose, P.; Mathieson, A.; Wright, I. Satellite-based measurements of surface deformation reveal fluid flow associated with the geological storage of carbon dioxide. Geophys. Res. Lett. 2010, 37. [Google Scholar] [CrossRef] [Green Version]
  40. Shi, J.-Q.; Durucan, S.; Korre, A.; Ringrose, P.; Mathieson, A. History matching and pressure analysis with stress-dependent permeability using the In Salah CO2 storage case study. Int. J. Greenh. Gas Control 2019, 91, 102844. [Google Scholar] [CrossRef]
  41. Cao, W.; Shi, J.-Q.; Durucan, S.; Korre, A. Evaluation of shear slip stress transfer mechanism for induced microseismicity at in Salah CO2 storage site. Int. J. Greenh. Gas Control 2021, 107, 103302. [Google Scholar] [CrossRef]
  42. Benson, S.M.; Orr, F.M. Carbon dioxide capture and storage. MRS Bull. 2008, 33, 303–305. [Google Scholar] [CrossRef] [Green Version]
  43. Johnson, G.; Mayer, B.; Shevalier, M.; Nightingale, M.; Hutcheon, I. Quantifying CO2 pore-space saturation at the Pembina Cardium CO2 Monitoring Pilot (Alberta, Canada) using oxygen isotopes of reservoir fluids and gases. Energy Procedia 2011, 4, 3942–3948. [Google Scholar] [CrossRef] [Green Version]
  44. Dashtgard, S.E.; Buschkuehle, M.B.; Fairgrieve, B.; Berhane, H. Geological characterization and potential for carbon dioxide (CO2) enhanced oil recovery in the Cardium Formation, central Pembina Field, Alberta. Bull. Can. Pet. Geol. 2008, 56, 147–164. [Google Scholar] [CrossRef]
  45. Martínez-Garzón, P.; Bohnhoff, M.; Kwiatek, G.; Zambrano-Narváez, G.; Chalaturnyk, R. Microseismic monitoring of CO2 injection at the penn west enhanced oil recovery pilot project, canada: Implications for detection of wellbore leakage. Sensors 2013, 13, 11522–11538. [Google Scholar] [CrossRef] [Green Version]
  46. Das, I.; Zoback, M.D. Long-period, long-duration seismic events during hydraulic fracture stimulation of a shale gas reservoir. Lead. Edge 2011, 30, 778–786. [Google Scholar] [CrossRef]
  47. Kumar, A.; Zorn, E.; Hammack, R.; Harbert, W. Long-period, long-duration seismic events and their probable role in reservoir stimulation and stage productivity. SPE Reserv. Eval. Eng. 2019, 22, 441–457. [Google Scholar] [CrossRef]
  48. Hu, H.; Li, A.; Zavala-Torres, R. Long-period long-duration seismic events during hydraulic fracturing: Implications for tensile fracture development. Geophys. Res. Lett. 2017, 44, 4814–4819. [Google Scholar] [CrossRef]
  49. Caffagni, E.; Eaton, D.; van der Baan, M.; Jones, J.P. Regional seismicity: A potential pitfall for identification of long-period long-duration eventsLPLD or regional earthquake? Geophysics 2015, 80, A1–A5. [Google Scholar] [CrossRef] [Green Version]
  50. Bauer, R.A.; Will, R.; Greenberg, S.E.; Whittaker, S.G. Illinois basin–Decatur project. In Geophysics and Geosequestration; Cambridge University Press: Cambridge, UK, 2019; pp. 339–369. [Google Scholar]
  51. Dando, B.; Goertz-Allmann, B.; Kühn, D.; Langet, N.; Dichiarante, A.; Oye, V. Relocating microseismicity from downhole monitoring of the Decatur CCS site using a modified double-difference algorithm. Geophys. J. Int. 2021, 227, 1094–1122. [Google Scholar] [CrossRef]
  52. Bohnhoff, M.; Zoback, M.; Chiaramonte, L.; Gerst, J.; Gupta, N. Seismic detection of CO2 leakage along monitoring wellbores. Int. J. Greenh. Gas Control 2010, 4, 687–697. [Google Scholar] [CrossRef] [Green Version]
  53. Bohnhoff, M.; Zoback, M.D. Oscillation of fluid-filled cracks triggered by degassing of CO2 due to leakage along wellbores. J. Geophys. Res. Solid Earth 2010, 115. [Google Scholar] [CrossRef] [Green Version]
  54. Stork, A.; Nixon, C.; Hawkes, C.; Birnie, C.; White, D.; Schmitt, D.; Roberts, B. Is CO2 injection at Aquistore aseismic? A combined seismological and geomechanical study of early injection operations. Int. J. Greenh. Gas Control 2018, 75, 107–124. [Google Scholar] [CrossRef]
  55. Sabra, K.G.; Gerstoft, P.; Roux, P.; Kuperman, W.; Fehler, M.C. Surface wave tomography from microseisms in Southern California. Geophys. Res. Lett. 2005, 32. [Google Scholar] [CrossRef] [Green Version]
  56. Shapiro, N.M.; Campillo, M.; Stehly, L.; Ritzwoller, M.H. High-resolution surface-wave tomography from ambient seismic noise. Science 2005, 307, 1615–1618. [Google Scholar] [CrossRef] [PubMed] [Green Version]
  57. Yang, Y.; Ritzwoller, M.H.; Levshin, A.L.; Shapiro, N.M. Ambient noise Rayleigh wave tomography across Europe. Geophys. J. Int. 2007, 168, 259–274. [Google Scholar] [CrossRef] [Green Version]
  58. Roux, P.; Sabra, K.G.; Gerstoft, P.; Kuperman, W.; Fehler, M.C. P-waves from cross-correlation of seismic noise. Geophys. Res. Lett. 2005, 32. [Google Scholar] [CrossRef] [Green Version]
  59. Draganov, D.; Campman, X.; Thorbecke, J.; Verdel, A.; Wapenaar, K. Reflection images from ambient seismic noise. Geophysics 2009, 74, A63–A67. [Google Scholar] [CrossRef] [Green Version]
  60. Poli, P.; Campillo, M.; Pedersen, H.; Group, L.W. Body-wave imaging of Earth’s mantle discontinuities from ambient seismic noise. Science 2012, 338, 1063–1065. [Google Scholar] [CrossRef]
  61. Stork, A.L.; Allmark, C.; Curtis, A.; Kendall, J.-M.; White, D.J. Assessing the potential to use repeated ambient noise seismic tomography to detect CO2 leaks: Application to the Aquistore storage site. Int. J. Greenh. Gas Control 2018, 71, 20–35. [Google Scholar] [CrossRef]
  62. Zhang, L.; Ren, B.; Huang, H.; Li, Y.; Ren, S.; Chen, G.; Zhang, H. CO2 EOR and storage in Jilin oilfield China: Monitoring program and preliminary results. J. Pet. Sci. Eng. 2015, 125, 1–12. [Google Scholar] [CrossRef]
  63. Ren, B.; Ren, S.; Zhang, L.; Chen, G.; Zhang, H. Monitoring on CO2 migration in a tight oil reservoir during CCS-EOR in Jilin Oilfield China. Energy 2016, 98, 108–121. [Google Scholar] [CrossRef]
  64. Zhang, T.; Zhang, W.; Yang, R.; Gao, H.; Cao, D. Analysis of Available Conditions for InSAR Surface Deformation Monitoring in CCS Projects. Energies 2022, 15, 672. [Google Scholar] [CrossRef]
  65. Si, X.; Yuan, Y. Random noise attenuation based on residual learning of deep convolutional neural network. In Proceedings of the 2018 SEG International Exposition and Annual Meeting, Anaheim, CA, USA, 14–19 October 2018. [Google Scholar]
  66. Chen, Y.; Huang, L. Adaptive moment-tensor joint inversion of clustered microseismic events for monitoring geological carbon storage. Geophys. J. Int. 2019, 219, 80–93. [Google Scholar] [CrossRef]
  67. Ross, Z.E.; Meier, M.A.; Hauksson, E. P wave arrival picking and first-motion polarity determination with deep learning. J. Geophys. Res. Solid Earth 2018, 123, 5120–5129. [Google Scholar] [CrossRef]
  68. Maity, D.; Salehi, I. Neuro-evolutionary event detection technique for downhole microseismic surveys. Comput. Geosci. 2016, 86, 23–33. [Google Scholar] [CrossRef]
  69. Castellanos, F.; van der Baan, M. Microseismic event locations using the double-difference algorithm. CSEG Rec. 2013, 38, 26–37. [Google Scholar]
  70. Ma, J.; Dineva, S.; Cesca, S.; Heimann, S. Moment tensor inversion with three-dimensional sensor configuration of mining induced seismicity (Kiruna mine, Sweden). Geophys. J. Int. 2018, 213, 2147–2160. [Google Scholar] [CrossRef]
  71. Bommer, J.J.; Oates, S.; Cepeda, J.M.; Lindholm, C.; Bird, J.; Torres, R.; Marroquín, G.; Rivas, J. Control of hazard due to seismicity induced by a hot fractured rock geothermal project. Eng. Geol. 2006, 83, 287–306. [Google Scholar] [CrossRef] [Green Version]
  72. Häring, M.O.; Schanz, U.; Ladner, F.; Dyer, B.C. Characterisation of the Basel 1 enhanced geothermal system. Geothermics 2008, 37, 469–495. [Google Scholar] [CrossRef]
  73. Ellsworth, W.L. Injection-induced earthquakes. Science 2013, 341, 1225942. [Google Scholar] [CrossRef]
  74. Bosman, K.; Baig, A.; Viegas, G.; Urbancic, T. Towards an improved understanding of induced seismicity associated with hydraulic fracturing. First Break 2016, 34, 61–66. [Google Scholar] [CrossRef]
  75. Grigoli, F.; Cesca, S.; Priolo, E.; Rinaldi, A.P.; Clinton, J.F.; Stabile, T.A.; Dost, B.; Fernandez, M.G.; Wiemer, S.; Dahm, T. Current challenges in monitoring, discrimination, and management of induced seismicity related to underground industrial activities: A European perspective. Rev. Geophys. 2017, 55, 310–340. [Google Scholar] [CrossRef] [Green Version]
  76. Bachmann, C.E.; Wiemer, S.; Woessner, J.; Hainzl, S. Statistical analysis of the induced Basel 2006 earthquake sequence: Introducing a probability-based monitoring approach for Enhanced Geothermal Systems. Geophys. J. Int. 2011, 186, 793–807. [Google Scholar] [CrossRef] [Green Version]
Figure 1. CCUS geological storage reuse project operations up to 2022 (size of circles represents injection size, modified from Global CCS Institute, 2022 [5]).
Energies 16 03101 g001
Figure 2. Schematic diagram of reservoir changes after CO2 injection into the reservoir (modified from Rutqvist J, 2012 [9]).
Energies 16 03101 g002
Figure 3. Technical tools applied in CCUS projects (modified from Whittaker S et al., 2011 [27]).
Energies 16 03101 g003
Figure 4. Microseismic events cloud distribution during project operation (modified from Verdon J P et al., 2013 [29]. (A) is the XY view of the monitoring area. (B) is the XZ view of the monitoring area. The pentagram are injection wells. The triangle is the monitoring well. Events are colored by occurrence time: yellow dots are before CO2 injection, dark blue dots are during the initial injection stages, green dots during a period of elevated injection in summer 2004, light blue dots are during the second phase of monitoring in 2005–2006, and red dots are after injection well shut in September 2010).
Energies 16 03101 g004
Figure 5. Schematic of the Krechba field showing the location of injection and production wells (modified from Stork A L et al., 2015 [36]; the figure shows injection wells in blue and production wells in orange, and star symbol is the monitoring well).
Energies 16 03101 g005
Figure 6. Surface deformation observed in CO2 injection and production wells at the Krechba site (cited in Mathieson A et al., 2010 [38]).
Energies 16 03101 g006
Figure 7. IBDP project site monitoring system and event distribution (cited in Bauer et al., 2019 [50] and D E Dando et al., 2021 [51]).
Energies 16 03101 g007
Figure 8. A schematic diagram of microseismic monitoring results in the Jilin work area in China (modified according to Ren B et al., 2016 [63]; white dots are injection wells and black dots are production wells).
Energies 16 03101 g008
Figure 9. Schematic diagram of the monitoring system of the Shanxi project (cited in Tian Z et al., 2022 [64]).
Energies 16 03101 g009
Figure 10. Passive seismic monitoring results in the work area.
Energies 16 03101 g010
Figure 11. Combined well and ground observation system (red dot in the figure is the position of instruments in the well, and yellow dots are the positions of instruments on the ground).
Energies 16 03101 g011
Figure 12. Location of microseismic events (green dots are microseismic events).
Energies 16 03101 g012
Figure 13. CCUS geological and geophysical comprehensive monitoring technology. (a) Reservoir rock experiment. (b) Numerical simulation. (c) Combined well–ground monitoring system. (d) Intelligent processing interpretation platform.
Energies 16 03101 g013
Table 1. Statistics of microseismic monitoring parameters in each work area.
ProjectTotal
Injection Volume
Injection PressureDurationReservoir TypePorosity and PermeabilityMicroseismic Monitoring ResultsEvent MechanismObservation System
Weyburn Oilfield, Canada18 mt20+ MPa2000–2010Fractured carbonate reservoir15–26%, 10–20 mD200Injection center fracture activation, stress diffusionSingle borehole array
Sleipner, Norway13 mt6.4 MPa1996–2011Water-bearing sandstone reservoir35–40%, >1 D///
In Salah, Algeria3.8 mt25 MPa2004–2011Water-bearing sandstone reservoir10–17%, ~10 mD700Shear activation of fault zoneSingle borehole array
Pembina Oilfield, Alberta, Canada//2005–2008Sandstone reservoir14.8–16.4%, ~9.5 mD//Single borehole array
Illinois Basin–Decatur Project (IBDP)1 mt/2011–2014Sandstone reservoir10–30%, high permeability4000+Fracture shear activationTwo independent single borehole arrays
Bass Island Dolomite (BILD)0.01 mt8.5 MPa2006–2009Dolomite reservoir~13%, ~22 mD200Oscillation caused by fluid phase transition near wellboreSingle borehole array
Jilin, China0.2 mt11–14 MPa2008–2014Sandstone reservoir~12.7%, ~3.5 mDsome energy disturbancesFluid injection into production dynamicsSurface array
Shanxi, China 0.02 mt13 MPa2018–2021Coalbed methane reservoir3.65–5.96%, 0.01–1.10 mD38Depict fluid production pathMultiple arrays of borehole-ground joint geophones
Shaanxi, China 0.03 mt15 MPa2018–2021Tight sandstone reservoir~10%, ~1 mD28Internal activation of injection layerDense array of borehole-ground joint geophones
Disclaimer/Publisher’s Note: The statements, opinions and data contained in all publications are solely those of the individual author(s) and contributor(s) and not of MDPI and/or the editor(s). MDPI and/or the editor(s) disclaim responsibility for any injury to people or property resulting from any ideas, methods, instructions or products referred to in the content.

