Communication

Machine Learning for Geothermal Resource Exploration in the Tularosa Basin, New Mexico

1
Earth System Science Division, Pacific Northwest National Laboratory, Richland, WA 99352, USA
2
Earth and Environmental Sciences Division, Los Alamos National Laboratory, Los Alamos, NM 87545, USA
3
Matador Resources Company, Dallas, TX 75240, USA
4
EnviTrace LLC, Santa Fe, NM 87501, USA
5
Environmental Molecular Sciences Laboratory, Pacific Northwest National Laboratory, Richland, WA 99352, USA
*
Author to whom correspondence should be addressed.
Energies 2023, 16(7), 3098; https://doi.org/10.3390/en16073098
Submission received: 29 January 2023 / Revised: 20 March 2023 / Accepted: 22 March 2023 / Published: 29 March 2023

Abstract

:
Geothermal energy is considered an essential renewable resource to generate flexible electricity. Geothermal resource assessments conducted by the U.S. Geological Survey showed that the southwestern basins in the U.S. have a significant geothermal potential for meeting domestic electricity demand. Within these southwestern basins, play fairway analysis (PFA), funded by the U.S. Department of Energy’s (DOE) Geothermal Technologies Office, identified that the Tularosa Basin in New Mexico has significant geothermal potential. This short communication paper presents a machine learning (ML) methodology for curating and analyzing the PFA data from the DOE’s geothermal data repository. The proposed approach to identify potential geothermal sites in the Tularosa Basin is based on an unsupervised ML method called non-negative matrix factorization with custom k-means clustering. This methodology is available in our open-source ML framework, GeoThermalCloud (GTC). Using this GTC framework, we discover prospective geothermal locations and find key parameters defining these prospects. Our ML analysis found that these prospects are consistent with the existing Tularosa Basin’s PFA studies. This instills confidence in our GTC framework to accelerate geothermal exploration and resource development, which is generally time-consuming.

1. Introduction

Geothermal is a rapidly growing renewable resource that can be flexibly utilized with other energy sources. Currently, in the U.S., approximately 3.7 GJ/year (<1%) of electricity is generated from geothermal resources [1]. It is estimated that more than 2026 GJ/year of energy can be extracted with efficient geothermal exploration [2,3]. Significant technical and non-technical challenges must be overcome to secure such energy while reducing the risks and costs of exploration and development [4,5]. When there is no surface heat signature, geothermal resources are often hidden, requiring expensive and risky exploration [2,6,7]. The U.S. Department of Energy’s (DOE’s) Geothermal Technologies Office funded a series of play fairway analysis (PFA) projects to overcome this challenge [5].
The PFA concept, adapted from the oil and gas industry, is performed for geothermal exploration and development [4]. PFA integrates available geologic, geophysical, and geochemical attributes indicative of geothermal activity [8,9,10,11,12,13,14]. In this short paper, we provide a machine learning (ML)-enhanced data-driven concept that quantifies the important attributes for geothermal resource characterization. Specifically, the ML-enhanced PFA novelty is that it quantifies the relative importance of each attribute [15,16]. Our ML analysis is based on an open-source framework called GeoThermalCloud https://github.com/SmartTensors/GeoThermalCloud.jl (accessed on 21 March 2023), which simultaneously analyzes available attributes, finds geothermal prospects, and discovers critical parameters defining prospective locations [17,18].
The GeoThermalCloud (GTC) [18] utilizes various ML methods to (1) analyze large field datasets and fill data gaps, (2) assimilate model simulations (large inputs and outputs), (3) process sparse datasets, (4) perform transfer learning (between sites with different exploratory levels) [19], (5) extract hidden geothermal signatures in the field and simulation data, (6) label geothermal resources and processes, (7) identify high-value data acquisition targets, and (8) guide geothermal exploration and production by selecting optimal exploration, production, and drilling strategies. A key algorithm used in GTC to perform this ML analysis is called non-negative matrix factorization with customized k-means clustering (NMFk) [20,21]. This NMFk is available in the SmartTensors AI platform https://github.com/SmartTensors (accessed on 21 March 2023). This paper uses this NMFk method to analyze the Tularosa Basin, New Mexico, PFA dataset.
The Tularosa Basin is located in the Basin and Range Province, an area that is highly favorable for the occurrence of geothermal resources due to the high heat flow related to the Rio Grande rift (see Figure 1). Several geothermal facilities have been developed within the Basin and Range Province [22,23]. This basin has been the subject of geothermal studies in the past decade through Phase-I and Phase-II DOE-GTO PFA funding [11]. Traditional PFA studies have demonstrated the basin’s high geothermal potential, prompting interest from the U.S. Army [24] in using the geothermal resource as an energy source for the White Sands Missile Test Range and McGregor Range [25,26,27].
Geologically, the Tularosa Basin is situated on the eastern flank of the Rio Grande rift zone and is a north-trending intermontane graben located in south-central New Mexico. The Tularosa Basin is bounded to the east by the uplifted Sacramento Mountains and to the west by the uplifted Organ and San Andres Mountains. Faults related to the Rio Grande rift with several thousand feet of displacement separate the basin from the surrounding, uplifted mountains (see Figure 1). Stratigraphically, the Tularosa Basin consists of Paleozoic limestones and shales of Tertiary age [25,26,27,29], which contain lithium deposits. Rifting during the Paleogene resulted in high heat flow in south-central New Mexico [11,23]. This high heat flow makes the southern part of the Tularosa Basin favorable for geothermal exploration. Through DOE-GTO funding, PFA data were collected by Ruby Mountain, Inc. in the past decade to develop geothermal fields in the Tularosa Basin [24,30]. This PFA demonstrated favorable geothermal prospectivity within the basin. The collected data included geological, geophysical, geothermal, and geochemical attributes. In this study, we curated the PFA data (available from the DOE Geothermal Data Repository [31]) and then used the data in our GTC-based ML pipeline. Such an ML study provides insight into the relationship between the attributes and prospective geothermal locations.
This paper is outlined as follows: Section 2 provides the ML methods used to curate and analyze the geothermal data. Section 3 describes the geothermal data, attributes, and the locations of the wells where the data were collected during Phase-I and Phase-II of the PFA. Section 4 provides the ML results and discussion. Conclusions are drawn in Section 5.

2. Methods

Given observational data X with non-negative values and of size ( n , m ) , where m is the number of data locations and n is the number of data attributes observed at each site, the first step in the NMFk analysis is to decompose this matrix X into a non-negative ‘attribute’ matrix W of size ( n , k ) and the non-negative ‘location’ matrix H of size ( k , m ) :
X = W × H + ϵ ( k ) ,
where k is the unknown number of signals (features) present in the data, and ϵ ( k ) is the reconstruction error matrix for the k-th signal. The attribute matrix W represents how the extracted features are related to the attributes. The location matrix H expresses how the hidden features are related to the locations.
The optimal number of hidden signals k o p t is unknown and is estimated by performing a series of non-negative matrix factorizations for different values of k, where k = 2 , 3 , , n . The maximum value k cannot be expected to exceed n or m. This is achieved by minimizing the following objective function O based on the Frobenius norm for all possible values of k [32]:
O = | | X W × H | | F such that W , H 0 n , m , k .
For each k value in the range of 2 , 3 , , n , a non-negative matrix factorization is performed multiple times (typically on the order of 1000 times) based on random initial guesses for W and H matrices. The best estimate of O for a given k from all of these runs is applied to define the reconstruction error for each k value: O ( k ) . The magnitude of O ( k ) typically declines with an increase in k. As the number of signals increases, the number of unknowns (elements of W and H matrices) to be estimated also increases, resulting in higher degrees of freedom. The number of known elements (i.e., the number of non-missing elements of X) remains constant. The resulting multiple solutions of H (or W; typically, it is preferred to cluster the smaller matrix) are clustered into k clusters using customized k-means clustering. In our case, we have 10 data attributes and 120 locations. The resulting sizes of W (signature matrix) and H (location matrix) are 10 × k and k × 120 , respectively. Within each specified k, the data for custom k-means clustering are from W as it is a smaller matrix.
The location matrix H (size k × 120 ) contains information on site locations. We have k different weights for each location corresponding to the extracted signatures. The site is assigned a specific signature based on the maximum value among these weights. For example, if k = 4 , we have four signatures (say S1, S2, S3, S4) and corresponding weights (say w1, w2, w3, w4). For site-1, let us assume w2 is the maximum value among the weights. Then the site is assigned signature S2. For site-10, if the maximum value among the calculated weights is w3, the site is predominantly described by signature S3.
We enforce the condition that each k cluster contains an equal number of members during clustering, which is equivalent to the number of performed multiple random runs (e.g., in our case it is 1000 runs) [33]. After clustering, the average silhouette width S ( k ) is computed [34]. This metric measures how well the random NMF solutions are clustered for a given value of k. The values of S ( k ) theoretically can vary from −1 to 1. Typically, S ( k ) declines sharply after an optimal number, k o p t , is reached. The k o p t value is selected to be equal to the maximum number of signals that can accurately reconstruct the observational data matrix X, as estimated by O ( k o p t ) , and has an average silhouette width S ( k o p t ) that is close to 1. In this way, selecting the optimal number of signals targets parsimonious solutions with fewer signals. More details on the NMFk algorithm and its implementation are discussed in References [35,36].
We also note that the analyzed data can include negative entries (for example, amplitude values of seismic or acoustic signals). In such cases, the NMFk workflow allows for two alternative approaches. The first one is to pre-process the data by applying mathematical transformations to make them non-negative. An alternative method in NMFk is to relax some of the non-negativity constraints in the matrix decomposition process (e.g., non-negativity constraints can be applied to only specific elements of the decomposed matrices). Detailed discussions of the NMFk capabilities and features are provided via our SmartTensors AI Platform websites https://smarttensors.github.io (including tests, examples, and Jupyter notebooks; accessed on 21 March 2023). The NMFk is one of the algorithms within our SmartTensors AI Platform (http://tensors.lanl.gov; accessed on 21 March 2023) that is used for unsupervised, semi-supervised, and physics-informed ML. Figure 2 summarizes our proposed approach.

3. Data

This study used ten attributes: Temperature at 2 m depth (temperature @2 m), heat flow, NaK-Giggenbach geothermometer, K-Mg geothermometer, NaK-Fournier geothermometer, silica geothermometer, gravity, fault distance, Quaternary fault density, and the Li concentration, which were all sampled at ≈ 200 m below ground level and sampled in the same formation. All of these attributes are critical for geothermal resource discovery and exploration. Heat flow describes the transfer of heat to a potential geothermal reservoir from the deep subsurface. Geothermometers (NaK-Giggenbach geothermometer, K-Mg geothermometer, NaK-Fournier geothermometer, and silica geothermometer) are used to estimate temperature and geochemical processes in the subsurface [37]. These geothermometers help estimate potential reservoir temperatures (see the section on geothermometry methods) [38], leading to less exploratory drilling. Gravity may represent secondary mineralization and help characterize the geologic structure [39]. Faults can act as conduits for (1) subsurface groundwater flow from deep to shallow and (2) groundwater recharge. Two fault attributes were used in the NMFk analysis: fault distance and Quaternary fault density. Fault distance represents the distance from the fault to the data point. Fault density (Quaternary) is the number of faults per square meter of an area. Finally, Li concentration is a geochemical element that may represent deep fluid circulation (Figure 10 in the results section) [38], which may indicate that geothermal waters have undergone mixing with shallow non-geothermal groundwater. All 10 of the aforementioned attributes were collected or estimated at 120 locations shown in Figure 3.
Only temperature @2m was present at all 120 locations, as such, we applied different interpolation techniques to estimate the attributes not collected at certain locations. For heat flow, NaK-Giggenbach geothermometer, K-Mg geothermometer, NaK-Fournier geothermometer, silica geothermometer, gravity, and Li concentration, interpolation was performed based on block mean, kriging, and inverse distance weighting. Next, the R 2 -score was computed based on interpolated and actual values. We found that all methods provide equivalent R 2 -scores. Block means was selected as the optimal interpolation method because it takes the least time to execute. The nearest neighbor algorithm used the interpolated values to sample values at 120 locations. The nearest neighbor algorithm finds the mean value based on either the radius or the number of points around a specified point. Here, we used radius to find the mean value. The radius was calculated based on a variogram study of the data.
Fault distance and fault density were estimated using different approaches. First, we generated a regular raster on ArcMap to calculate fault distance. Then, we converted the raster to points. Next, we used a near coverage tool on ArcMap to compute the distance of each point from the closest faults. We also generated regular raster and converted points to estimate fault density, The near coverage tool was used to find the distance from a point to the closest fault. Finally, the kernel density function was used to calculate the fault density (SI unit is m/m2).

4. Results and Discussion

Figure 4 shows the reconstruction quality O ( k ) and average silhouette width S ( k ) for a range of geothermal signatures, k. O ( k ) values exponentially decrease with the increase in the number of signatures. However, this same trend is only sometimes true for S ( k ) . Although optimal solutions have low O ( k ) and high S ( k ) values, their optimal values are not theoretically established. Generally, low O ( k ) and S ( k ) > 0.25 can be considered acceptable. Here, the solutions for k = 2 , 3 , 4 , 5 , and 6 were accepted, while the k = 8 to 10 solutions were rejected by the ML algorithm. This conclusion is based on the high S ( k ) values ( > 0.25 ) and the O ( k ) decline curve (Figure 4). The k = 4 solution is optimal because of its low O ( k ) and high S ( k ) values. The solution with k < 4 is an underfitting representation, while k > 3 is an overfitting representation of data. In the following paragraphs, we will describe each signature of the k = 4 solution (Figure 5a,b).
Figure 5a shows a heatmap of the signatures found by NMFk. Each signature captures specific characteristics in the dataset. The colors in each signature represent the contribution of each attribute. Green, yellow, and brown–red colors represent minor, moderate, and significant contributions. Note that minor and significant contributions also mean low and high attribute values in the dataset.
The dominant attributes of Signature A are heat flow, K-Mg geothermometer, silica geothermometer, and Quaternary fault density (Figure 5a). Heat flow is one of the leading geothermal attributes, while K-Mg and silica geothermometers suggest high reservoir temperatures. Low contributions from NaK-Giggenbach and NaK-Fournier geothermometers suggest that Na-enriched minerals do not control geochemical processes in the reservoir. The high contribution of Quaternary fault density may indicate elevated secondary permeability. The contribution of temperature @2m is moderately consistent with high heat flow. Another critical component of this signature is the low contribution from fault distance. Low fault distance means the fault is close to the locations associated with this signature, which may lead to elevated secondary permeability. All of these factors are good indicators for high geothermal prospects; therefore, the locations associated with Signature A have a high chance of having geothermal resources (Figure 5b).
The dominant attributes of Signature B are temperature @2m, heat flow, Quaternary fault density, and Li concentration (Figure 5a). Temperature @2m and heat flow are the two main geothermal attributes. The high contribution of the Quaternary fault density may indicate elevated secondary permeability. The high contribution from Li suggests a potential fluid circulation from the deep subsurface, which is a characteristic of geothermal resources in NM (Figure 10 in the results section) [38]. The contribution from fault distance is also low. A low fault distance means faults are close to the locations associated with this signature. All of these factors are good indicators for high geothermal prospects; therefore, the locations associated with Signature B also have a high chance of potential geothermal resources (Figure 5b). However, no geothermometers had significant contributions to this signature except a moderate contribution from a silica geothermometer, suggesting the geothermal potential is not as high as Signature A. A careful and detailed analysis should be undertaken before deciding on the geothermal resource development associated with this signature.
No geothermal attributes contributed significantly to Signature C; therefore, we conclude that the locations associated with it have a low chance of possessing geothermal resources. In Signature D, the dominant attributes are NaK-Giggenbach and NaK-Fournier geothermometers. These attributes suggest that the reservoir has a high temperature. The moderate and high contributions of the Quaternary fault density and Li concentration suggest elevated secondary permeability and deep fluid circulation, which are also indicators of potential geothermal resources. On the other hand, temperature @2m and heat flow had low contributions. All of these factors suggest that the geothermal prospectivity of locations associated with Signature D (Figure 5b) is inconclusive. However, because of its proximity to Signature A (a high prospective signature), there is some potential for sustainable geothermal resources in the locations associated with Signature A. We note that the prospective geothermal locations are consistent with Ruby Mountain’s PFA prospects [9,10,24].
The NMFk results and Table 1, coupled with the subject matter analysis, allow us to discover potential geothermal resources and their spatial locations. Regional hydrogeological and geothermal conditions would facilitate a better understanding of whether a long-term geothermal facility can be developed here. We can use physics-informed ML methods to compute aquifer temperature, viscous heat flux, vadose heat flux, and advective heat flux to obtain such results. Among these four attributes, viscous heat flux and advective heat flux could be used to estimate the potential time to heat the geothermal reservoir temperature during energy production and injection, hence, assessing the viability and sustainability of geothermal reservoirs.

5. Conclusions

The Tularosa Basin has potential as a geothermal resource that could support several federal facilities located in the area. To find geothermal prospects, we studied 10 attributes at 120 locations (sampled at ≈200 m depth). Attributes include temperature @2 m, heat flow, NaK-Giggenbach geothermometer, K-Mg geothermometer, NaK-Fournier geothermometer, silica geothermometer, gravity, fault distance, Quaternary fault density, and Li concentration. The dataset was used as input parameters to the GTC-based ML framework. The ML approach found four signatures (A, B, C, and D), two of which are potential geothermal signatures. The locations associated with Signatures A and B have high geothermal resource prospects that are spatially consistent with the well locations from the PFA study. We also found that the locations associated with Signature D are less prospective than Signatures A and B. Still, they might assist with a sustainable geothermal reservoir in the area around the locations of Signature A. The key attributes defining the geothermal resources are heat flow, K-Mg geothermometer, silica geothermometer, Quaternary fault density, temperature @2m, fault density, and Li concentration. These key attribute–location pairs instill confidence in our proposed ML methodology to better explore geothermal resources within the Tularosa Basin in New Mexico, USA. Future work will involve the interpolation results within the basin and corresponding performance metrics. In Reference [19], Ahmmed and Vesselinov performed such an analysis for the Great Basin region.

Author Contributions

B.A.: conceptualization, data curation, software, formal analysis, writing—review and editing. M.K.M.: conceptualization, formal analysis, writing—original draft writing, review and editing. E.R.: writing—review and editing. V.V.V.: software, writing—review and editing. S.K.: writing—review and editing. All authors have read and agreed to the published version of the manuscript.

Funding

This research is based upon work supported by the U.S. Department of Energy’s (DOE) Office of Energy Efficiency and Renewable Energy (EERE) under the Geothermal Technology Office (GTO) Machine Learning (ML) for Geothermal Energy funding opportunity, Award Number DE-EE-3.1.8.1. Los Alamos National Laboratory is operated by Triad National Security, LLC, for the National Nuclear Security Administration of the U.S. Department of Energy (Contract No. 89233218CNA000001). The Pacific Northwest National Laboratory is operated for the DOE by Battelle Memorial Institute under contract DE-AC05-76RL01830. The views and opinions of the authors expressed herein do not necessarily state or reflect those of the United States Government or any agency thereof.

Data Availability Statement

The data used in this study can be downloaded from the U.S. DOE Geothermal Data Repository https://gdr.openei.org/home (accessed on 21 March 2023). The GeoThermalCloud is available at. https://github.com/SmartTensors/GeoThermalCloud.jl (accessed on 21 March 2023). The SmartTensors AI platform is available at https://github.com/SmartTensors (accessed on 21 March 2023).

Acknowledgments

The authors thank Rene Frijhoff for the useful discussion and comments. The authors thank the reviewers whose feedback helped to substantially improve the manuscript.

Conflicts of Interest

The authors declare that they do not have any conflict of interest. This paper was prepared as an account of work sponsored by an agency of the United States Government. Neither the United States Government nor any agency thereof, nor any of their employees, makes any warranty, express or implied, or assumes any legal liability or responsibility for the accuracy, completeness, or usefulness of any information, apparatus, product, or process disclosed, or represents that its use would not infringe on privately owned rights. References herein to any specific commercial product, process, or service by trade name, trademark, manufacturer, or otherwise do not necessarily constitute or imply an endorsement, recommendation, or favoring by the United States Government or any agency thereof.

Abbreviations

The following abbreviations are used in this manuscript:
DOEDepartment of Energy
GTOGeothermal Technologies Office
GTCGeoThermalCloud
MLmachine learning
NMFnon-negative matrix factorization
NMFkNMF + custom k-mean clustering
PFAplay fairway analysis
SMEsubject matter expertise

References

  1. Nardini, I. Geothermal Power Generation. In The Palgrave Handbook of International Energy Economics; Springer: Berlin/Heidelberg, Germany, 2022; pp. 183–194. [Google Scholar]
  2. Tester, J.; Blackwell, D.; Petty, S.; Richards, M.; Moore, M.; Anderson, B.; Livesay, B.; Augustine, C.; DiPippo, R.; Nichols, K.; et al. The future of geothermal energy: An assessment of the energy supply potential of engineered geothermal systems (EGS) for the United States. In Proceedings of the 32nd Workshop on Geothermal Reservoir Engineering, Stanford University, Stanford, CA, USA, 22–24 January 2007. [Google Scholar]
  3. Huttrer, G.W. Geothermal power generation in the world 2015–2020 update report. In Proceedings of the World Geothermal Congress, Reykjavik, Iceland, 24–27 October 2021; Volume 1. [Google Scholar]
  4. GeoVision: Harnessing the Heat Beneath Our Feet. 2019. Available online: https://www.energy.gov/eere/geothermal/articles/geovision-harnessing-heat-beneath-our-feet (accessed on 21 March 2023).
  5. Hamm, S.G.; Anderson, A.; Blankenship, D.; Boyd, L.W.; Brown, E.A.; Frone, Z.; Hamos, I.; Hughes, H.J.; Kalmuk, M.; Marble, A.; et al. Geothermal Energy R&D: An Overview of the US Department of Energy’s Geothermal Technologies Office. J. Energy Resour. Technol. 2021, 143, 100801. [Google Scholar]
  6. Lindsey, C.R.; Ayling, B.F.; Asato, G.; Seggiaro, R.; Carrizo, N.; Larcher, N.; Marquetti, C.; Naon, V.; Serra, A.C.; Faulds, J.E.; et al. Play fairway analysis for geothermal exploration in north-western Argentina. Geothermics 2021, 95, 102128. [Google Scholar] [CrossRef]
  7. Dobson, P.F. A Review of Exploration Methods for Discovering Hidden Geothermal Systems. 2016. Available online: https://publications.mygeoenergynow.org/grc/1032385.pdf (accessed on 21 March 2023).
  8. Faulds, J.; Hinz, N.; Coolbaugh, M.; Shevenell, L.; Siler, D. The Nevada play fairway project-Phase II: Initial search for new viable geothermal systems in the Great Basin region, western USA. GRC Trans. 2016, 40. Available online: https://www.osti.gov/servlets/purl/1724099 (accessed on 21 March 2023).
  9. Bennett, C.R.; Nash, G.D.; Sorkhabi, R.; Moore, J.; Simmons, S.; Brandt, A.; Barker, B.; Swanson, B. The Convergence of Heat, Groundwater & Fracture Permeability. Innovative Play Fairway Modelling Applied to the Tularosa Basin Phase 1 Project Report; Technical Report; Ruby Mountain: Salt Lake City, UT, USA, 2015. [Google Scholar]
  10. Bennett, C.; Nash, G.; Barker, B. The Convergence of Heat, Groundwater & Fracture Permeability: Innovative Play Fairway Modelling Applied to the Tularosa Basin; Technical Report; Ruby Mountain: Salt Lake City, UT, USA, 2020. [Google Scholar]
  11. Nash, G. Tularosa Basin Play Fairway Analysis: White Sands Missile Range Main Cantonment and NASA Area Faults, New Mexico; Technical Report; Energy and Geoscience; USDOE Geothermal Data Repository: Washington, DC, USA, 2017. [Google Scholar]
  12. Ito, G.; Frazer, N.; Lautze, N.; Thomas, D.; Hinz, N.; Waller, D.; Whittier, R.; Wallin, E. Play fairway analysis of geothermal resources across the state of Hawaii: 2. Resource probability mapping. Geothermics 2017, 70, 393–405. [Google Scholar] [CrossRef]
  13. Siler, D.L.; Zhang, Y.; Spycher, N.F.; Dobson, P.F.; McClain, J.S.; Gasperikova, E.; Zierenberg, R.A.; Schiffman, P.; Ferguson, C.; Fowler, A.; et al. Play-fairway analysis for geothermal resources and exploration risk in the Modoc Plateau region. Geothermics 2017, 69, 15–33. [Google Scholar] [CrossRef] [Green Version]
  14. Lautze, N.; Thomas, D.; Hinz, N.; Apuzen-Ito, G.; Frazer, N.; Waller, D. Play fairway analysis of geothermal resources across the State of Hawaii: 1. Geological, geophysical, and geochemical datasets. Geothermics 2017, 70, 376–392. [Google Scholar] [CrossRef]
  15. Smith, C.M. Machine Learning Techniques Applied to the Nevada Geothermal Play Fairway Analysis. Ph.D. Thesis, University of Nevada, Reno, NV, USA, 2021. [Google Scholar]
  16. Holmes, R.C.; Fournier, A. Machine Learning-Enhanced Play Fairway Analysis for Uncertainty Characterization and Decision Support in Geothermal Exploration. Energies 2022, 15, 1929. [Google Scholar] [CrossRef]
  17. Vesselinov, V.V.; Ahmmed, B.; Frash, L.; Mudunuru, M.K. GeoThermalCloud: Machine Learning for Discovery, Exploration, and Development of Hidden Geothermal Resources; Technical Report. In Proceedings of the 47th Workshop on Geothermal Reservoir Engineering, Stanford University, Stanford, CA, USA, 7–9 February 2022. [Google Scholar]
  18. Mudunuru, M.K.; Vesselinov, V.V.; Ahmmed, B. GeoThermalCloud: Machine Learning for Geothermal Resource Exploration. J. Mach. Learn. Model. Comput. 2022, 3, 57–72. [Google Scholar] [CrossRef]
  19. Ahmmed, B.; Vesselinov, V.V. Machine learning and shallow groundwater chemistry to identify geothermal prospects in the Great Basin, USA. Renew. Energy 2022, 197, 1034–1048. [Google Scholar] [CrossRef]
  20. Siler, D.L.; Pepin, J.D.; Vesselinov, V.V.; Mudunuru, M.K.; Ahmmed, B. Machine learning to identify geologic factors associated with production in geothermal fields: A case-study using 3D geologic data, Brady geothermal field, Nevada. Geotherm. Energy 2021, 9, 1–17. [Google Scholar] [CrossRef]
  21. Discovering hidden geothermal signatures using non-negative matrix factorization with customized k-means clustering. Geothermics 2022, 106, 102576. [CrossRef]
  22. Grant, P.R., Jr. Geothermal Energy Resources of Northwest New Mexico. 1978. Available online: https://archives.datapages.com/data/fcgs/data/014a/014001/9_four-corners140009.htm (accessed on 21 March 2023).
  23. Williams, C.F.; Reed, M.J.; Mariner, R.H.; DeAngelo, J.; Galanis, S.P. Assessment of Moderate-and High-Temperature Geothermal Resources of the United States; Technical Report; Geological Survey (US): Reston, VA, USA, 2008. [Google Scholar]
  24. Nash, G.D.; Brandt, A.; Pfaff, B.; Hardwick, C.; Gwynn, M.; Blake, K.; Simmons, S.; Bennett, C.R. Phase 2: Updated Geothermal Play Fairway Analysis of the Tularosa Basin, New Mexico. Trans.-Geotherm. Resour. Counc. 2017, 41. Available online: https://www.osti.gov/servlets/purl/1766306 (accessed on 21 March 2023).
  25. Finger, J.T.; Jacobson, R.D. Fort Bliss Exploratory Slimholes: Drilling and Testing; Technical Report; Sandia National Lab: Albuquerque, NM, USA, 1997. [Google Scholar]
  26. O’Donnell, T., Jr.; Miller, K.; Witcher, J. A seismic and gravity study of the McGregor geothermal system, southern New Mexico. Geophysics 2001, 66, 1002–1014. [Google Scholar] [CrossRef]
  27. Barker, B.; Moore, J.; Segall, M.; Nash, G.; Simmons, S.; Jones, C.; Lear, J.; Bennett, C. Exploration Drilling and Technology Demonstration At Fort Bliss; Technical Report; El Paso County/Ruby Mountain Inc.: Salt Lake City, UT, USA, 2014. [Google Scholar]
  28. Newton, B.T.; Land, L. Brackish Water Assessment in the Eastern Tularosa Basin, New Mexico; Aquifer Mapping Program; New Mexico Bureau of Geology and Mineral Resources: Socorro, NM, USA, 2016. [Google Scholar]
  29. Broadhead, R.F. Petroleum Geology of the McGregor Range, Otero County, New Mexico; Publications-West Texas Geological Society, 2000; pp. 207–208. [Google Scholar]
  30. Brandt, A. Tularosa Basin Play Fairway Analysis: Methodology Flow Charts; Technical Report; USDOE Geothermal Data Repository US: Salt Lake City, UT, USA, 2015. [Google Scholar]
  31. Weers, J.; Huggins, J. Getting Data Out of the Ground: Modern Challenges Facing EGS Collab, the DOE Geothermal Data Repository, and the Geothermal Industry. In Proceedings of the 44th Workshop on Geothermal Reservoir Engineering, Stanford, CA, USA, 11–13 February 2019. [Google Scholar]
  32. Lee, D.D.; Seung, H.S. Learning the parts of objects by non-negative matrix factorization. Nature 1999, 401, 788–791. [Google Scholar] [CrossRef] [PubMed]
  33. Alexandrov, B.S.; Vesselinov, V.V. Blind source separation for groundwater pressure analysis based on nonnegative matrix factorization. Water Resour. Res. 2014, 50, 7332–7347. [Google Scholar] [CrossRef]
  34. Rousseeuw, P.J. Silhouettes: A graphical aid to the interpretation and validation of cluster analysis. J. Comput. Appl. Math. 1987, 20, 53–65. [Google Scholar] [CrossRef] [Green Version]
  35. Vesselinov, V.V.; Alexandrov, B.S.; O’Malley, D. Contaminant source identification using semi-supervised machine learning. J. Contam. Hydrol. 2018, 212, 134–142. [Google Scholar] [CrossRef] [PubMed]
  36. Vesselinov, V.V.; Mudunuru, M.K.; Karra, S.; O’Malley, D.; Alexandrov, B.S. Unsupervised machine learning based on non-negative tensor factorization for analyzing reactive-mixing. J. Comput. Phys. 2019, 395, 85–104. [Google Scholar] [CrossRef] [Green Version]
  37. Karingithi, C.W. Chemical geothermometers for geothermal exploration. In Short Course IV on Exploration for Geothermal Resources; Geothermal Training Program Lake Vaivasha, Kenya; United Nations University: Shibuya City, Tokyo, 2009; Volume 1. [Google Scholar]
  38. Pepin, J.D.; Person, M.; Phillips, F.; Kelley, S.; Timmons, S.; Owens, L.; Witcher, J.; Gable, C.W. Deep fluid circulation within crystalline basement rocks and the role of hydrologic windows in the formation of the T ruth or Consequences, New Mexico low-temperature geothermal system. In Crustal Permeability; Wiley: Hoboken, NJ, USA, 2012; pp. 155–173. [Google Scholar]
  39. Biehler, S.; Rex, R. Gravity studies in the Imperial Valley. In Cooperative Geological-Geophysical-Geochemical Investigations of Geothermal Resources in the Imperial Valley of California; University of California–Riverside Education Research Service: Riverside, CA, USA, 1971; pp. 29–41. [Google Scholar]
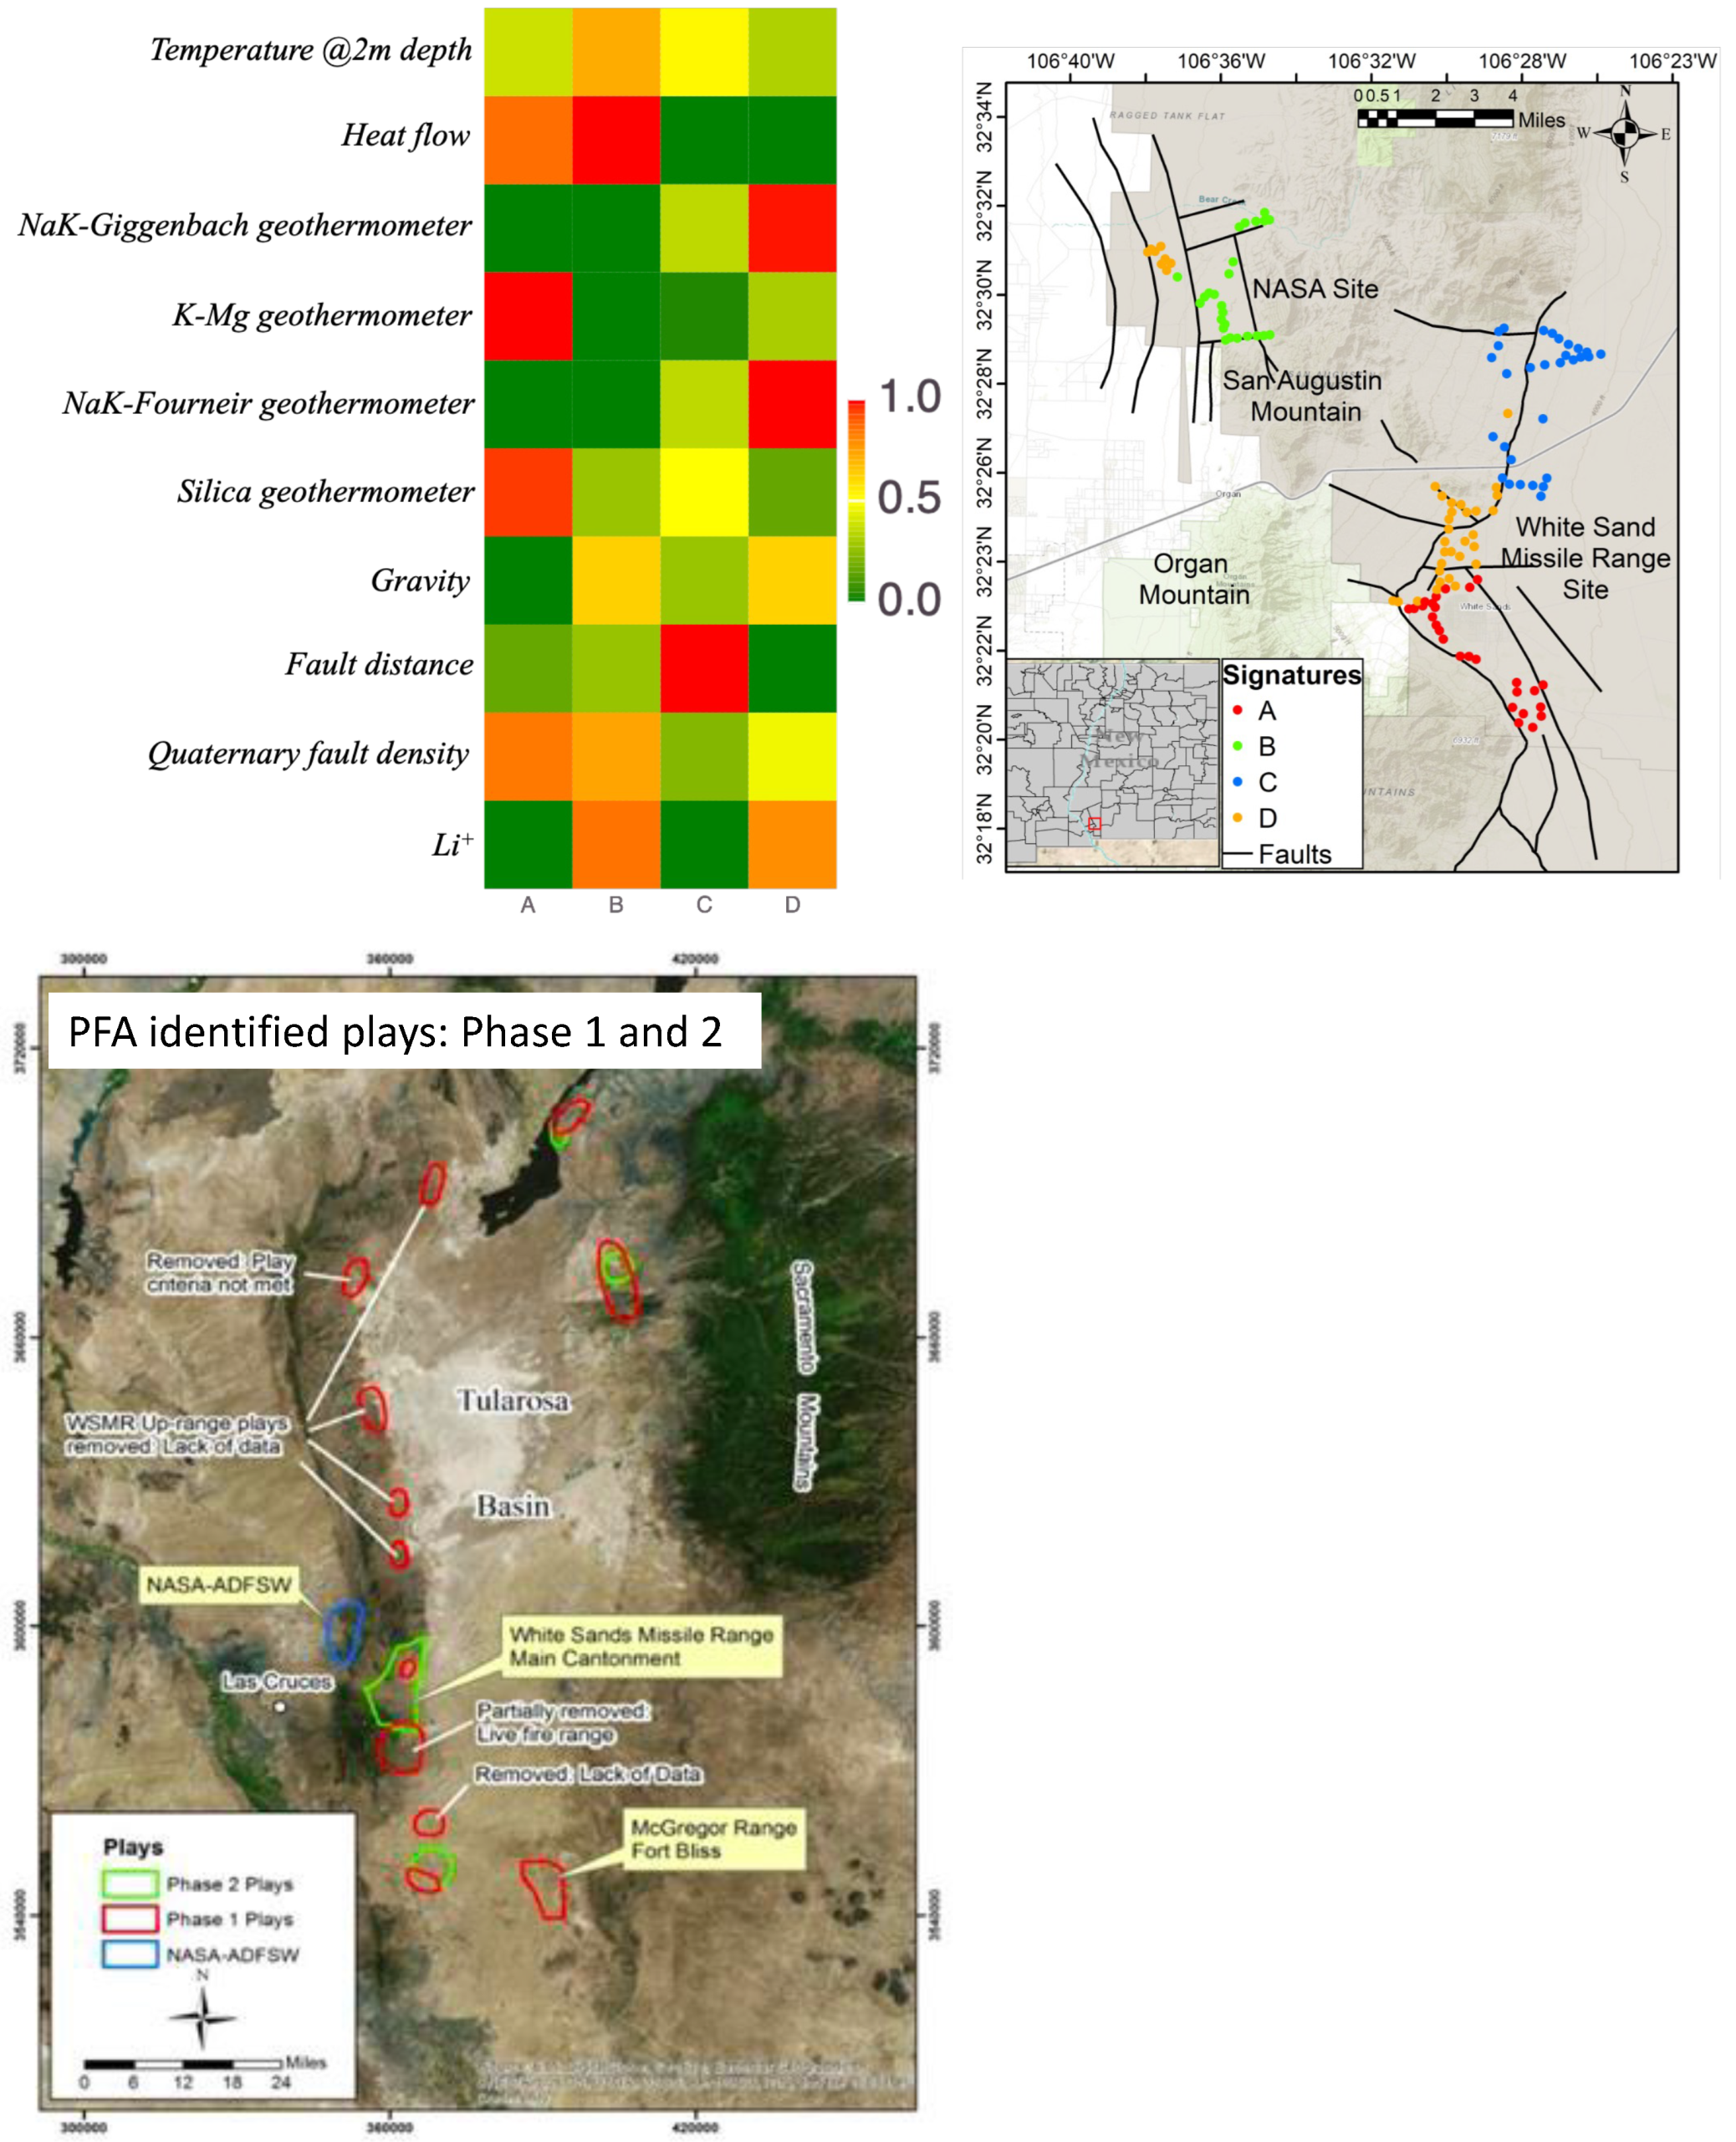
Figure 1. Location of Tularosa Basin within New Mexico: This figure shows a schematic of the region within New Mexico. The left figure shows the basin of interest for geothermal exploration. The right figure shows a schematic of the geology (cross-section AA’) of the fault-bounded basin with two half-grabens. The eastern part is bounded by the west-dipping Alamogordo fault zone, while the west part is bounded by the west-dipping Jarilla fault zone. The western edge of the basin is defined by the San Andres Fault. Courtesy of Newton and Land [28].
Energies 16 03098 g001
Figure 2. GeoThermalCloud for exploration: This figure summarizes our proposed approach using GTC to analyze geothermal data for enhanced exploration. We collect and curate the geothermal data for ML analysis in the first step. The NMFk method in the SmartTensors AI platform is used for this ML analysis, which is the second step. To understand the geothermal potential within the region of interest, subject matter experts should analyze the obtained attribute and location matrices, which is the final step.
Energies 16 03098 g002
Figure 3. Data: This figure shows the data locations and Quaternary faults in the study area. The data were collected during the Phase-I and Phase-II PFAs within this region. The collected data were downloaded from the DOE’s GDR and curated using the SmartTensors AI platform.
Energies 16 03098 g003
Figure 4. Metrics for geothermal signal discovery: This figure shows the metrics and ML results from the NMFk analysis. We show the normalized reconstruction quality/fit O ( k ) in red. The solution robustness is based on the average silhouette S ( k ) width of the clusters and is shown in blue (for different numbers of signals k).
Energies 16 03098 g004
Figure 5. NMFk analysis and comparison with traditional PFA: The top left figure shows the geothermal signature heatmap (a) and their spatial distribution (b). Each signature captures specific characteristics in the geothermal data. Here, Signatures A and B represent highly prospective geothermal signatures. Green, golden, and red colors in (a) represent low, medium, and high contributions. The bottom figure shows the regions identified by the traditional Tularosa Basin’s PFA in Phases I and II (courtesy of (and modified from) Reference [24]). The comparison between the ML spatial plot and the PFA study shows that NMFk can identify geothermal plays of interest.
Energies 16 03098 g005
Table 1. Dominant attributes of each hidden geothermal signature and corresponding resource prospectivity.
SignatureDominant AttributesGeothermal Resource Prospectivity
AHeat flow, K-Mg geothermometer,High
silica geothermometer, quaternary fault density
BTemperature at 2 m, heat flow, gravity,High
quaternary fault density, Lithium concentration
CFault distanceLow
DNaK-Giggenbach geothermometer, gravity,Moderate
NaK-Fournier geothermometer, Lithium concentration
Disclaimer/Publisher’s Note: The statements, opinions and data contained in all publications are solely those of the individual author(s) and contributor(s) and not of MDPI and/or the editor(s). MDPI and/or the editor(s) disclaim responsibility for any injury to people or property resulting from any ideas, methods, instructions or products referred to in the content.

