Article

Optimal Allocation Scheme of Renewable Energy Consumption Responsibility Weight under Renewable Portfolio Standards: An Integrated Evolutionary Game and Stochastic Optimization Approach

1
Hubei Power Exchange Center, Wuhan 430072, China
2
College of Letter and Science, University of California Davis, Davis, CA 95618, USA
3
School of Economics and Management, Wuhan University, Wuhan 430072, China
*
Author to whom correspondence should be addressed.
Energies 2023, 16(7), 3085; https://doi.org/10.3390/en16073085
Submission received: 1 March 2023 / Revised: 22 March 2023 / Accepted: 27 March 2023 / Published: 28 March 2023

Abstract

:
Developing renewable energy has become a major strategy for China to accelerate the energy transition and combat climate change. Accordingly, a guarantee mechanism for renewable energy consumption with renewable portfolio standards (RPS) has been set in China. However, currently, the top-down allocation of regional renewable energy consumption targets often has issues of unfairness and inefficiency. It is necessary to investigate the issue of how to stimulate the renewable energy consumption potential on the demand side and reasonably formulate the consumption responsibility weights of various market entities. This paper aimed to develop a new methodology for the weight allocation of renewable energy consumption responsibilities. In doing so, an integrated model of an evolutionary game and stochastic optimization was constructed between market entities and governments. Then, the equilibrium strategies of market entities and governments were obtained through the evolutionary game. Furthermore, based on the equilibrium strategies, this paper optimized the renewable energy consumption weight of each market entity, which constitutes the optimal allocation scheme of renewable energy consumption responsibility weights. Finally, using the data of 7069 market entities in Hubei Province in 2021, this study simulated the model to verify its effectiveness and practicability. The results indicate that the willingness of market entities to assume more consumption responsibility is positively correlated with the government’s incentives and the maturity of the green electricity trading market. This study provides important implications for optimizing government regulations and promoting renewable energy consumption.

1. Introduction

In recent years, the issues of energy shortages and extreme climates have become increasingly prominent [1]. It has become the consensus and action of many countries to promote the development and utilization of renewable energy, reduce carbon emissions, and realize the green and low-carbon transformation of the energy structure [2]. Taking 2021 as an example, Japan released the “Green Growth Strategy”, the European Union launched the “European Solar Initiative”, and China issued the “Opinions on Completely, Accurately and Comprehensively Implementing the New Development Concept and Doing a Good Job of Carbon Peak and Carbon Neutrality” (hereinafter referred to as the “Opinions”). These policies all focus on the further development of renewable energy. For example, the “Opinions” clearly stated the following aim: “incorporate carbon peaking and carbon neutrality into the overall economic and social development, with energy, green and low-carbon development as the key”. The development of renewable energy is an important measure to achieve these goals in China [3].
Although renewable energy has the characteristics of cleanness and environmental protection, its market competitiveness is weak due to high consumption costs and an imperfect technical standard system [4,5]. With the increase in renewable energy penetration, the characteristics of renewable energy output such as high volatility with climate, strong randomness, and anti-peak regulation characteristics are also becoming more and more prominent. These characteristics have caused serious abandonment of wind and light, bringing risks to the economic and stable operation of the grid and challenges to renewable energy policy planning [6,7].
To promote the consumption, development, and utilization of renewable energy, countries around the world have successively launched renewable portfolio standards (RPS) and supporting green certificate trading mechanisms (tradable green certificate, TGC) or renewable energy certificate systems (renewable energy certificate, REC) [8]. RPS stipulate that in the electricity produced (or sold) by each power generation company (or electricity sales company), renewable energy must account for a certain proportion of electricity consumption. Currently, countries such as the United States, Australia, the United Kingdom, Italy, and the Netherlands have implemented RPS [9]. In 2018, the National Energy Administration of China released three rounds of drafts for soliciting opinions on “Renewable Energy Power Quotas and Assessment Methods”, which clarified the market entities and quota assessment methods for China to undertake quota obligations, including regional renewable energy power consumption responsibility weights [10]. The weight of renewable energy power consumption responsibility refers to the proportion of renewable energy power consumption in the total electricity use. RPS and their supporting green certificate trading mechanisms have discovered the monetary value of the environmental attributes of renewable energy in a market-oriented manner [11], increased the liquidity of the renewable energy market, and greatly promoted the consumption of renewable energy [12,13].
However, the current renewable energy consumption guarantee mechanism (such as a quota system) implemented in China is still in its initial stage, and the design of the governmental regulatory system is not yet mature [14]. Therefore, in the process of renewable energy consumption, to a certain extent, there is a national regulatory department subjectively deciding the intensity of regulation and provincial (regional) governments, ignoring the consumption characteristics and willingness of market players to consume. There is also the problem of “one size fits all” in setting the consumption target. These problems may cause unnecessary regulatory costs and even hinder the balanced development of renewable energy [15].
Meanwhile, academic research on renewable energy consumption under a quota system mainly focuses on its impact on each power sector [16], and there has not yet been a study on renewable energy consumption under a quota system considering the regulation and market players’ consumption characteristics and willingness to consume. China’s renewable energy consumption process under RPS is mainly divided into two stages. In the first stage, the national regulatory authority formulates a reward and punishment system for the completion of renewable energy quotas by provincial regional governments; that is, rewards are given to local governments that exceed their renewable energy consumption targets, while provincial governments that have not fulfilled their renewable energy consumption quotas will be punished [17]. In this stage, provincial governments will also determine the quota completion strategy of administrative regions according to the rewards and punishments of the national regulatory department; that is, whether to complete the renewable energy consumption quota or not [18]. In the second stage, provincial governments further distribute the quota weights to the responsible entities in the regional electricity market of each municipality according to their own consumption strategies, and accordingly, these responsible entities will make decisions on renewable energy electricity consumption under government supervision [19,20].
Accordingly, we need to consider the allocation of renewable energy quota weights from various aspects. For the national regulator (NR), when formulating the reward and punishment system for renewable energy quota completion, it wants to maximize the promotion of provincial (regional) governments to meet their renewable energy consumption targets, on the one hand, and minimize the cost of regulation, on the other hand [21]. For example, when the regulator increases the level of reward and punishment (in this paper, we adopted a dynamic reward and punishment mechanism, i.e., the more the provincial (regional) government falls short in renewable energy consumption, the more the regulator punishes the provincial (regional) government), on the one hand, it may encourage the provincial (regional) government to meet the renewable energy consumption target; on the other hand, the regulator may punish the provincial (regional) government more. Further, it may increase the cost of regulation, thus leading to greater social losses.
For provincial (regional) governments, when formulating renewable energy consumption strategies and allocating consumption weights among different market players in their administrative areas, they should consider three effects that affect each other. The first is the reward and punishment for completing the renewable energy quota [22]; the second is the cost needed to complete the renewable energy quota; and the third is the effect of different consumption weights on market players with different consumption characteristics and willingness to consume [23].
For market participants, when deciding their own renewable energy consumption, they need to consider their own consumption characteristics and willingness to consume as well as the profit and loss from completing the quota. Market participants will consume more renewable energy if the benefits of further quota fulfillment are greater [24].
Therefore, the three types of actors mentioned above will play a complex game in renewable energy consumption. In order to explore the game mechanism, so as to better promote the consumption and balanced development of renewable energy, this paper conducted an in-depth study on the following three issues:
(1)
How does the reward and punishment system of the central government regulator interact with the provincial (regional) government’s consumption decisions? How can we observe future evolutionary trends in RPS policy efficiency on a practical basis?
(2)
How do provincial (regional) governments set differentiated consumption weights to influence the consumption decisions of market players with different consumption characteristics and willingness to consume?
(3)
How can we design a quota weighting scheme that takes into account both cost and efficiency, while reconciling the conflicting interests of all parties?
From the perspective of provincial governments, this paper constructed an evolutionary game model between national regulatory authorities and provincial governments and a stochastic optimization model for provincial governments to optimize their consumption weights, considering the willingness of market entities and the characteristics of their renewable energy consumption. In detail, first, through the evolutionary game model, this paper identified the tendency of national regulators to choose regulatory strategies and the tendency of provincial governments to choose consumption strategies. Then, based on the results of the evolutionary game equilibrium, this paper utilized a stochastic optimization model to solve the optimal consumption weight allocation scheme of each market entity. Finally, this paper conducted a simulation analysis to verify the effectiveness and practicability of the model, by using the data of 7069 market entities in Hubei Province in 2021. As the first province in China to issue a double-certified green certificate for the “electricity–carbon” market, Hubei Province has a relatively mature electricity market with complete transaction data [25,26]. Therefore, we chose Hubei Province as a representative province to discuss the general topic of quota policy weighting.
The rest of this paper is as follows. Section 2 presents the literature review. Section 3 presents the problem description. In Section 4, the consumer responsibility weight allocation model is introduced. Section 5 presents a simulation analysis. In Section 6, we conclude this research.

2. Literature Review

In the context of dual carbon targets in China, to accelerate the construction of a clean, low-carbon, safe, and efficient energy system, the proportions of renewable energy installed capacity and renewable energy power generation have shown a trend of rapid development, and some areas have formed a renewable energy power system with a high proportion [27]. With the rapid development of renewable energy, understanding how to solve the problem of renewable energy consumption and mobilize the enthusiasm of China’s provinces for the consumption of renewable energy power is a major challenge and a practical problem.
Moreover, in the process of realizing the low-carbon transformation and ensuring the consumption of renewable energy, RPS, as one of the more effective policy tools, have been favored by many countries and widely used in power generation. Therefore, the research on RPS policy in academia has never stopped, and many studies have carried out in-depth research on the implementation effect of RPS policy. Farooq et al. analyzed the impact of an RPS on the energy, environment, and economy of Pakistan, using a long-term energy system based on the MARKAL framework. The results showed that under a highly optimistic RPS of 80%, fossil fuel consumption and greenhouse gas emissions will drop significantly in 2050, yet electricity prices will increase significantly [28]. Kwon took South Korea’s RPS and auction as an example, evaluated the combined effect of the two based on efficiency and effectiveness standards, and pointed out that the high market risk and information asymmetry of the RPS can be alleviated by the policy combination of the RPS and auction [29]. Zhang et al. explored the impact of a reduction in the feed-in tariff (FIT) and the introduction of an RPS on the development of distributed photovoltaic power generation in China by constructing a system dynamics model. They found that after the cancellation of the FIT, the RPS effectively helped to maintain the trend of grid parity [30]. There are also a large number of studies based on different perspectives to explore the synergistic impact of the price-based policy tool FIT and the quantity-based policy tool RPS [31,32], or the difference in their impacts [33,34].
Although the evaluation of renewable energy consumption policies is important, it is more practical to discuss and analyze the decision-making process of renewable energy consumption to promote renewable energy consumption and serve policy formulation. Therefore, many scholars start from different perspectives and conduct research on different key points involved in the process of renewable energy consumption. Overall, these points mainly concern the weight allocation of renewable energy consumption, the decision making of the responsible entity for renewable energy consumption, and government supervision.
In implementing and engaging in the consumption of renewable energy, the primary core issue is understanding how to allocate the responsibility for the consumption of renewable energy to different entities; that is, the weight allocation. Many studies have tried to offer certain solutions. According to objective management principles, Wang et al. constructed a clear policy framework for China’s renewable energy portfolio standards and used the entropy method to equally and reasonably allocate the regional responsibility for renewable energy consumption [35]. Wang et al. [36] introduced the cost of the RPS policy and established a stochastic optimization model for quota allocation. Finally, they proposed an allocation method to achieve the renewable energy quota target on this basis. From both macro and micro perspectives, Tang et al. [37] used game theory to propose a renewable energy consumption and allocation strategy; that is, three proportional allocation methods (power consumption, power sales profit, and power purchase cost) and a group satisfaction degree method were used to determine reasonable weights and assign the regulated consumption quota ratios to market entities. They took Anhui Province, China, as an example to empirically test the effectiveness and practicability of the proposed strategy. Xu et al. [38] studied the allocation of renewable energy consumption weights among Chinese provinces based on efficiency and fairness; that is, they established a quota allocation model based on the lowest cost of renewable energy power generation to determine provincial RPS targets in China. Zhou et al. [39] also applied the zero-sum gains data envelopment analysis (ZSG-DEA) model combined with the entropy model based on the principles of equality and efficiency to allocate China’s renewable energy consumption weights, and further evaluated the allocation results, showing that the quota allocation results achieved the goal of transferring the renewable energy quota responsibility from the western provinces to the eastern provinces. Xu et al. [40] took the micro-entities of power plants and users as the entry point and proposed a provincial-level optimal allocation strategy for renewable power consumption under China’s RPS policy through a multi-objective equilibrium model.
After completing the allocation of renewable energy consumption weights, understanding how to carry out power trading under the established goals and constraints to meet the contract performance requirements is the key point that requires further study. Some studies focused on this decision-making process and analyzed how responsible parties promote and implement renewable energy consumption based on existing targets. Wang et al. [41] used game theory to build a two-tier decision-making model with the government and power plants as the main body, deduced the upper and lower bounds of the green certificate trading market based on the maximization of social welfare, and simulated the quotas of power plants and their decision making in the green certificate trading market and carbon trading market under different scenarios. The simulation results showed the following: based on the status quo of the electricity market, there is an optimal renewable energy combination standard for power plants to maximize social welfare. Eghlimi et al. believe that the use of renewable energy can optimize power production, and regional power trading can promote the consumption of renewable energy. Therefore, they used a decision-making model to plan power trading considering mixed wind and solar energy, and proposed a regional power exchange model to obtain the optimal level of electricity trading between national entities [42]. Wu et al. took the microgrid as the research object, considered its network structure, operating objectives, and transaction relations, and proposed a price mechanism to promote the consumption of renewable energy; then, a multi-layer optimization model based on Lyapunov theory was used to solve the interlayer coordination and individual optimization [43]. Residents play an important role in renewable energy consumption [44]. To fully understand the influencing factors of renewable energy consumption, Sun et al. used the Stackelberg game to run the proposed incentive mechanism and provided the optimal strategy for each participant. They found that retailers will send incentive signals to residents in the game process to guide them in choosing the optimal proportion of renewable energy consumption, thereby maximizing their welfare [45].
Finally, the government is regarded as the main force in promoting the consumption of renewable energy. The role that the government plays in the entire process of renewable energy consumption and how it motivates and supervises responsible entities to promote energy transformation are major concerns for the government itself and also the academic community. Zhao et al. suggested that the government adopts measures such as price subsidies and tax incentives in various energy fields to implement renewable energy portfolio standards [23]. Mundaca et al. analyzed the impact of government incentives on the adoption of photovoltaic power generation. They found that 53% of residents decided to install photovoltaics under government incentives [43]. To understand the evolution and internal influencing factors of the choice of renewable energy consumption policy tools, Chai et al. [44] used text content analysis to analyze the historical evolution trend of renewable energy policy tools, policy categories, leading governments, and industry subdivision, serving the government in formulating and designing relevant policies.
Compared with the previous literature, this research has three innovations. From the perspective of the research content, in the face of government supervision, the allocation of the weights of renewable energy consumption by local and regional responsible entities is essentially an evolutionary game process. The existing literature lacks solutions to this process. We analyzed the equilibrium strategy and obtained the optimal decision. In addition, this paper takes the maximization of individual interests into consideration: each responsible entity formulates the optimal decision making of renewable energy consumption according to the maximization of self-benefit, which is reflected in implementing the specific indicator of the purchased renewable energy. Furthermore, the dynamic penalty mechanism in the process of renewable energy consumption was not considered in the previous literature. In this paper, the introduction of this mechanism makes the whole analysis more comprehensive and realistic.

3. Problem Description

In many countries, the political system determines the top-down policy implementation system. The same is true for RPS policy. The RPS target planned and allocated by the central government is distributed to different provincial regions in the form of policy documents. Subsequently, the provincial decision makers affected by the policy arrangements need to formulate the province’s renewable energy consumption strategy. Since these provincial regions are usually divided into prefecture-level cities, RPS quota targets will continue to be distributed from top to bottom until they are allocated to renewable energy consumption responsibilities that are active in different prefecture-level power markets.
In fact, the implementation of the above process is extremely challenging and risky. First, it is difficult for the central government to make optimal allocation decisions, and due to the difficulty of supervision, it is also difficult for the central government’s planning to be completely and accurately implemented in each province. Secondly, there are certain differences in resource endowment, industrial structure, economic scale, and other aspects in various provincial regions, which are reflected in the implementation of RPS policy because there are differences in consumption willingness. Attitudes toward energy consumption performance are difficult to define. Finally, there are a large number of renewable energy consumption responsibilities in different cities in these provinces, with different types, and the strategic choices for renewable energy consumption are also inconsistent.
Therefore, considering the problem of quota weight allocation faced in the implementation of RPS policy, to explore the respective renewable energy consumption strategies of different entities, this study started from the perspective of different stakeholders, such as the central government and provincial regions. Considering the current power system operation and market competition, a two-stage model was constructed.
In our two-stage model, we chose the theoretical methods of an evolutionary game and stochastic optimization. This is because, in the implementation process of the quota policy, the real consumption willingness of different provincial regions needs to be taken into consideration, and at the same time, it is necessary to ensure that a cost-effective renewable energy consumption weight allocation scheme is found. Therefore, we first constructed a dynamic reward–punishment evolutionary game model between provincial-level regions that undertake consumption responsibilities and the central government. By observing the evolutionary game equilibrium, we obtained the strategy selection tendency of both sides of the game. This allowed us to observe the selection of consumption strategies and the intensity of supervision by the central government in provincial regions that face a certain degree of supervision by the central government. Subsequently, on the basis of the equilibrium results of the evolutionary game, we constructed a stochastic optimization model for the participants in the municipal-level regional electricity market, so as to solve the optimal consumption strategy of each market entity based on the perspective of maximizing social welfare.
To sum up, the two-stage model not only describes the implementation of policies based on the division of administrative regions, but also takes into account the interests of different entities for comprehensive consideration. The specific ideas of the model are shown in Figure 1.
In the evolutionary game model in the first stage, the game entities of bounded rationality are the provincial regions responsible for the consumption of renewable energy and the central government supervision department, and the provincial regions need to implement the RPS policy objectives stipulated in the central government’s planning. In addition to external factors and the province’s own conditions, these provincial regions may choose different consumption strategies due to the different degrees of central government supervision. Correspondingly, there are some differences between the actual implementation and the efforts made by these provincial regions to achieve the RPS goal.
To ensure the realization of the RPS quota target, the central government regulatory department will reward and punish these provincial regions to a certain extent. More specifically, government regulators will reward provinces that actively promote the construction of a green power trading market, while provincial-level regions that fail to meet quota consumption targets will be punished. To fit the reality, we chose the method of important research [14] to set the dynamic reward and punishment mechanism of the central government. In addition, observing the strategic choices of the central government can provide a basis for us to estimate the optimal consumption of different market entities in the provincial regions in the second stage.
In the second stage, there is a certain scale of the electricity market in the provincial region affected by the central government’s regulation. Similarly, the provincial electricity market can also be divided into municipal electricity markets. A large number of market entities are active in the electricity market. While participating in electricity transactions, they are also the ultimate executors to achieve the RPS quota target. Market entities involved in the consumption of renewable energy include electricity sales companies, large power users, and foreign-funded enterprises. For convenience, we use “REFCs” to represent these market entities below. To explore the REFCs’ choice of final consumption strategy in the market, we constructed a stochastic optimization model to explore the consumption strategy that minimizes the cost of each entity after comprehensively considering the quota requirements and REFCs’ different consumption intentions.
The assumptions of this study are as follows:
Assumption 1.
The decision makers in the provincial regions can choose their own quota proportion. The strategy set is {strategy A, strategy B}. The group of provincial decision makers will choose strategy A with probability p (0 ≤ p ≤ 1), and strategy B with probability (1 − p). Among them, the meaning of strategy A is that decision makers at the provincial level choose to undertake a consumption quota that is less than the national standard quota, which is set as e 1 (28–32.5%). The meaning of strategy B is that provincial decision makers choose to undertake consumption quotas exceeding the national standard, which is set as e 3 (≥32.5%). Since it is very difficult to achieve the unique situation where the proportion of the consumption quota undertaken by the provincial region just meets the national standard, we do not list it as a separate strategy, but to display the results, we still use e 2 (32.5%) to represent this situation. In addition, corresponding to the two different strategy options, the renewable energy electricity actually consumed (bought or self-generated) in the provincial power market is represented by q t , i (i = 1, 2).
Assumption 2.
In the game process, the strategy set of the central government regulatory department is {high-intensity supervision, low-intensity supervision}. It is assumed that it selects high-intensity supervision with probability g ( 0 g 1 ) , and low-intensity supervision with probability (1 − g). When choosing a high-intensity supervision strategy, the government supervision department will pay the supervision cost c s to take action to ensure that the market entity bears the quota responsibility.
Assumption 3.
Under the condition of high-intensity supervision by the government regulatory department, provincial regions that choose strategy A or strategy B will receive different payments according to the degree of reward and punishment of the regulatory department. A responsible entity that reaches the consumption ratio of the national standard quota will be rewarded by the regulatory department, and the payoff of the unit electricity of the excess consumption part will be r. Furthermore, depending on the degree of government supervision, the reward r will also be different. For example, when the government chooses high-intensity supervision, the reward given by the central government is represented by r 1 ; when the government chooses low-intensity supervision, the reward given by the government is represented by r 2 , where r 1 < r 2 .
Assumption 4.
Provincial regions that fail to meet the national standard quota consumption ratio will face penalties from the regulatory authorities, and the penalty faced by the unit that fails to meet the standard consumption is c f , i . When the government chooses high-intensity regulation, the corresponding fine is represented by c f , 1 ; when the government chooses low-intensity regulation, the corresponding fine is represented by c f , 2 . In reality, the central government regulatory department usually adjusts the penalty amount according to the implementation of the provincial RPS policy, which we call a dynamic penalty mechanism. It is assumed that the central government’s penalty for the provincial region is proportional to the behavior of the provincial region’s selection strategy A; that is, F i ( q n ) = p c f , i q n , i = 1,2 . Here, c f , i can be understood as the upper limit of the punishment, and q n indicates that the actual consumption of the province is less than that required by the national standard quota. Here, we assume that c f 1 < c f 2 .
Assumption 5.
In the model of this paper, the provincial region needs to make a trade-off to determine the amount of electricity generated by renewable energy and purchased, and the cost per unit of electricity is recorded as a . The part of the electricity that exceeds the quota will not only be encouraged by the government regulatory department, but will also be able to participate in the green certificate transaction; the income corresponding to the unit electricity in the green certificate transaction is set as v. According to the description of Assumption 1, it is obvious that the purchased and self-consumed power consumed by a provincial region that chooses strategy A is less than the purchased and self-consumed power consumed by a provincial region that chooses strategy B ( q 1 < q 2 ).
Assumption 6.
The number of prefecture-level cities in a provincial area is assumed to be G, and the total number of REFCs in each prefecture-level city is denoted by N.
For convenience, the meanings of all the parameters in this study are shown in Table 1.

4. Consumer Responsibility Weight Allocation Model

To obtain the optimal weight consumption scheme of REFCs in the electricity market of different provinces, we built an evolutionary game model and a stochastic optimization model. In Section 4.1, we present the evolutionary game model and analysis, and in Section 4.2, we introduce the stochastic optimization model.

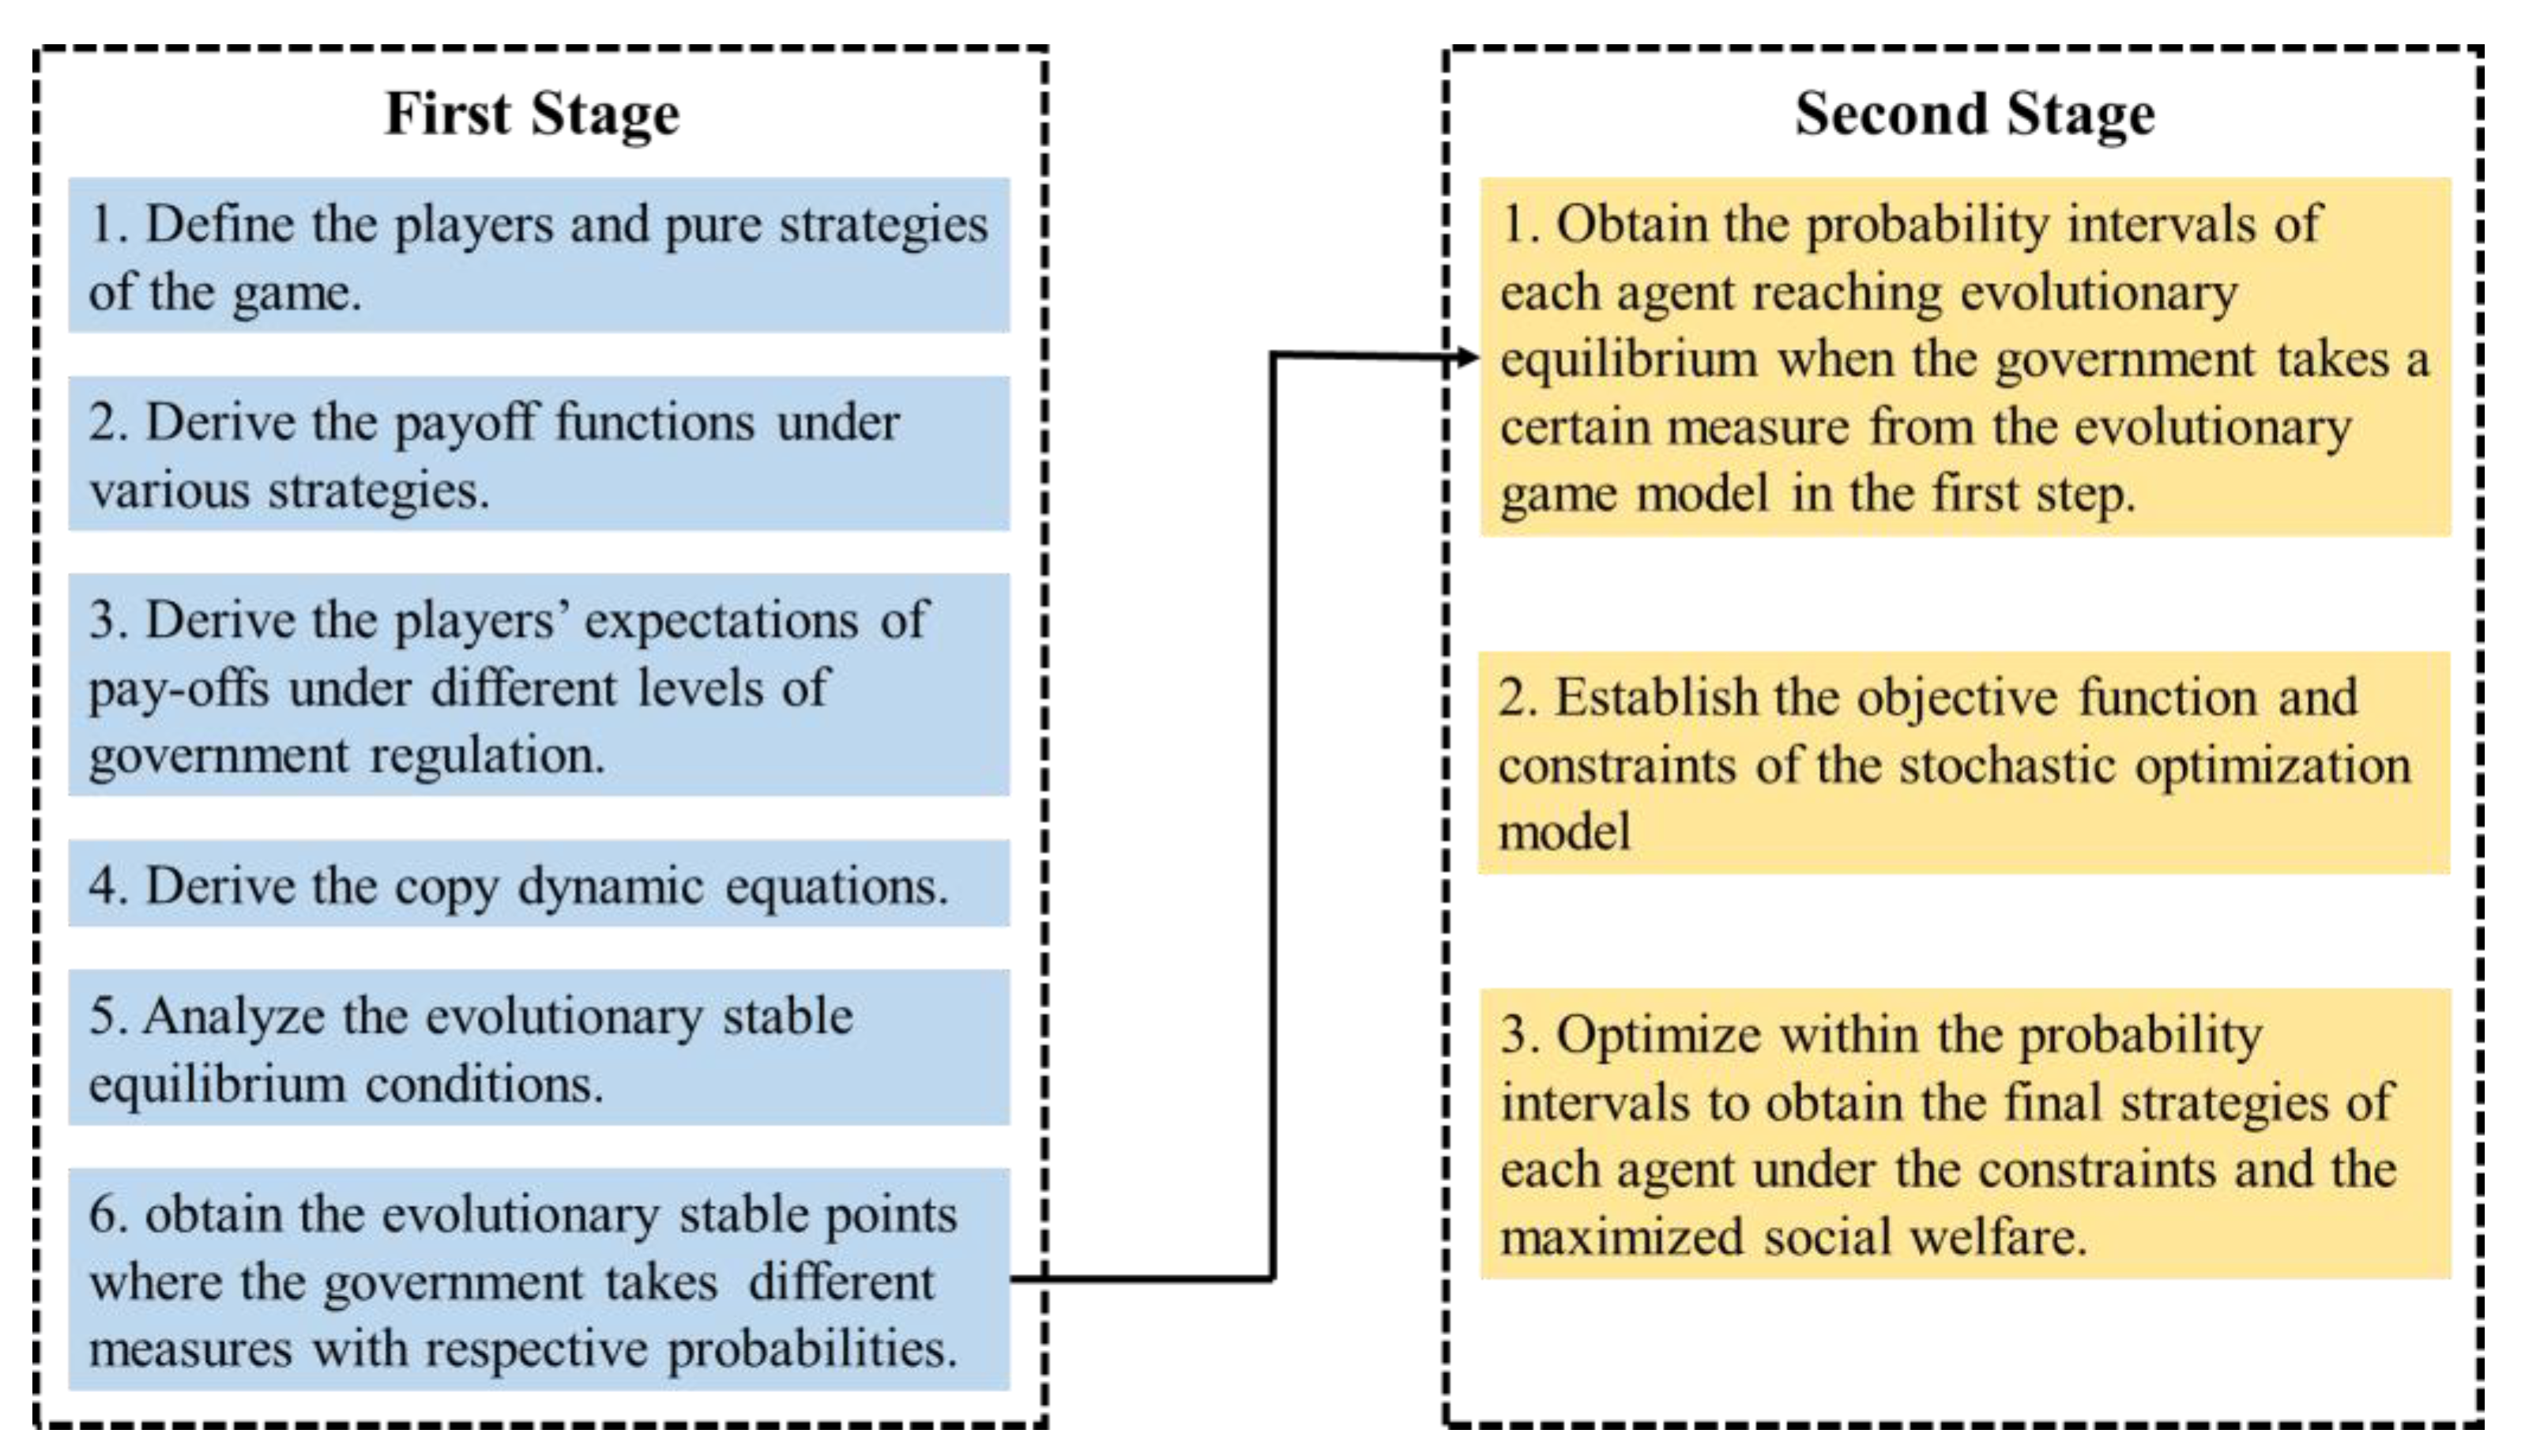
4.1. Evolutionary Game Model

4.1.1. Game Model Construction

According to the description and basic assumptions in the previous section, we can construct an evolutionary game model between the provincial regions and government regulatory departments. For convenience and the standardization of expression, the profit matrix of both parties in the game is shown in Table 2.
According to the model assumptions and the benefit matrix, the fitness of provincial decision makers to choose strategy A is:
U I c A = g a q t , 1 + F 1 q n + 1 g ( a q t , 1 F 2 q n )
where F i = p c f , i q n . The fitness of provincial decision makers to choose strategy B is:
U I C B = g a q t , 2 + r 1 q e + v q s + 1 g a q t , 2 + r 2 q e + v q s
The average fitness is:
U A = & p U I C A + 1 p U I C B
The growth rate of strategy A selected by provincial-level regional decision makers is equal to its fitness U I c A minus the average growth rate U A , and the replication dynamic equation is obtained:
d p d t = H 1 p = p U I c A U A = p 1 p a q t 2 q t 1 + F 2 F 1 r 1 q e + r 2 q e g c f 2 q n r 2 q e v q s
In the same way, we can obtain the fitness of the two strategies of the government regulatory department:
U p g h r = p F 1 c s + 1 p r 1 q e c s + ω q e
U p g l r = p F 2 + 1 p ω q e r 2 q e
Replication dynamic equations:
d g d t = H 2 g = g U g s U s = g 1 g [ c s r 2 q e r 1 q e + F 2 F 1 p r 1 r 2 q e ]
Deriving H 1 ( p ) and H 2 ( g ) , we obtain:
h 1 p = H 1 p = 1 2 p [ a q t 2 q t 1 + F 2 F 1 r 1 q e + r 2 q e g F 2 r 2 q e v q s ] + c f 2 q n c f 1 q n p ( 1 p ) h 2 g = H 2 g = ( 1 2 g ) [ c s r 2 q e r 1 q e + F 2 F 1 p r 1 r 2 q e ]
A two-dimensional dynamical system (I) can be obtained from Formulas (4) and (5):
p ˙ = p 1 p [ a q t 2 q t 1 + F 2 F 1 r 1 q e + r 2 q e g c f 2 q n r 2 q e v q s ] g ˙ = g 1 g [ c s r 2 q e r 1 q e + F 2 F 1 p r 1 r 2 q e ]
Proposition 1.
The equilibrium points of system (I) are 0 , 0 , 0,1 , 1,0 , and 1 , 1 . When c s < c f 1 c f 2 q n , a q t 2 q t 1 > c f 2 q n + r 2 q e + v q s , a q t 2 q t 1 v q s < r 1 q e + c f 1 q n , ( p 0 , g 0 ) is also the equilibrium point of the system, where
p 0 = q e r 1 r 2 ± r 1 r 2 2 q e 2 + 4 [ c s + q e ( r 1 r 2 ) ] ( c f 1 c f 2 ) q n 2 ( c f 1 c f 2 ) q n g 0 = a q t 2 q t 1 c f 2 q n r 2 q e v q s ( r 1 r 2 ) q e + ( c f 1 c f 2 ) q n
Proof of Proposition 1.
In system (I), let d p d t = 0 , d g d t = 0 . It can be found that O 0 , 0 , A 0,1 , B 1,0 , and C 1 , 1 are the equilibrium points of the system. In addition, let d p d t = 0 , d g d t = 0 , where we can obtain ( p 0 , g 0 ) . From the basic assumptions, it can be known that r 1 > r 2 and c f 1 > c f 2 ; considering c s < ( c f 1 c f 2 ) q n , we can conclude that p 0 ( 0,1 ) . Similarly, when a q t 2 q t 1 > c f 2 q n + r 2 q e + v q s , a q t 2 q t 1 v q s < r 1 q e + c f 1 q n , we have g 0 ( 0,1 ) . Proof completed. □
According to Proposition 1, if and only if it satisfies c s < c f 1 c f 2 q n , a q t 2 q t 1 > c f 2 q n + r 2 q e + v q s , a q t 2 q t 1 r 2 q e v q s < ( r 1 r 2 ) q e + c f 1 q n , there is an equilibrium point inside the feasible region of system (I), i.e., ( p 0 , g 0 ) . In particular, a q t 2 q t 1 > c f 2 q n + r 2 q e + v q s means that, compared with strategy A, the total cost paid by the entity of market consumption responsibility who chooses strategy B to purchase and voluntarily consume renewable energy power is greater than the benefits it obtains from participating in the green certificate exchange.
c s < ( c f 1 c f 2 ) q n indicates that the action cost paid by the government regulatory department is less than the difference between the fines charged by the two strategies. From a practical point of view, this is obviously true.
a q t 2 q t 1 r 2 q e v q s < ( r 1 r 2 ) q e + c f 1 q n shows that, for government regulators who weigh the pros and cons of the strategy, the cost of strategy B minus the fines charged is less than the benefits of rewards and green certificate transactions compared with strategy A.

4.1.2. Evolutionary Equilibrium Analysis

The equilibrium point obtained by solving the replication dynamic equation is not necessarily the evolutionarily stable strategy (ESS) of the system. According to the method proposed by Friedman, the stability of the equilibrium point can be obtained by analyzing the Jacobian matrix (denoted as G) of the system. The Jacobian (jacobian) matrix of system (I) is as follows:
G = p * p p * g g * p g * g = a 11 a 12 a 21 a 22 = 2 p 1 A 1 + c f 2 q n c f 1 q n p ( 1 p ) p p 1 [ p ( c f 1 c f 2 ) q n + q e ( r 1 r 2 ) ] g ( g 1 ) [ 2 ( c f 1 c f 2 ) q n + q e ( r 1 r 2 ) ] 2 g 1 A 2
where A 1 = a q t 2 q t 1 + c f 2 q n c f 1 q n r 1 q e + r 2 q e g c f 2 q n r 2 q e v q s , and A 2 = [ c s r 2 q e r 1 q e + p c f 2 q n p c f 1 q n p r 1 r 2 q e ] .
We have the following: (1) t r G = a 11 + a 22 < 0 ; (2) det G = a 11 a 12 a 21 a 22 > 0 . The equilibrium point of the replication dynamic equation is stable, which is an evolutionarily stable strategy (ESS).
When c s < c f 1 c f 2 q n , a q t 2 q t 1 > c f 2 q n + r 2 q e + v q s , a q t 2 q t 1 r 2 q e v q s < ( r 1 r 2 ) q e + c f 1 q n , by substituting the value of the system equilibrium point in Proposition 1 into the Jacobian matrix, the determinant and trace of the matrix are obtained after sorting, as shown in Table 3.
Let π 1 = a q t 1 q t 2 + q s v + q e r 2 + c f 2 q n , π 2 = a q t 1 q t 2 + q s v + q e r 1 + c f 1 q n . π 3 = c s + ( c f 2 c f 1 ) q n . π 1 represents the difference between the returns of the REFC when choosing strategy B in the face of low-intensity regulation by the regulatory department and the returns of the REFC when choosing strategy A. Similarly, π 2 represents the difference between the income obtained when the REFC chooses strategy B in the face of high-intensity supervision and the income obtained when it chooses strategy A. π 3 represents the process of the regulator weighing whether to choose high-intensity regulation. Considering the basic assumptions r 1 > r 2 , c f 1 > c f 2 , Lemma 1 can be obtained:
Lemma 1.
(i) If π_1 > 0, then there must be π_2 > 0, and vice versa. (ii) If π_2 < 0, then there must be π_1 < 0, and vice versa.
According to the local stability analysis method of the Jacobian matrix, next, we analyze the stability of the five equilibrium points obtained in Proposition 1. The characteristic roots λ 1 and λ 2 corresponding to the point D ( p 0 , g 0 ) are a pair of pure imaginary roots. According to Taylor et al.’s research [34], D ( p 0 , g 0 ) is a stable equilibrium point of the system, but not an asymptotically stable point. The evolution track of the system is a closed loop around the equilibrium point D ( p 0 , g 0 ) .
For the other four stable points O 0 , 0 , A 0,1 , B 1,0 , and C 1 , 1 , taking C 1 , 1 as an example, we have:
Proposition 2.
When π 2 > 0 , π 3 < 0 , C 1 , 1 is asymptotically stable.
Proof of Proposition 2.
The Jacobian matrix of the system at the equilibrium point C 1 , 1 is:
J = a q t 1 q t 2 + c f 1 q n + q e r 1 + q s v 0 0 c s + c f 2 c f 1 q n
The eigenvalues of matrix J are λ 3 = a q t 1 q t 2 + c f 1 q n + q e r 1 + q s v , and λ 4 = c s + c f 2 c f 1 q n . If π 2 > 0 , π 3 < 0 are satisfied, then λ 1 and λ 2 are both smaller than 0, and C 1 , 1 is asymptotically stable. Proof completed. □
Proposition 2 provides the asymptotically stable condition at the equilibrium point C(1, 1). The stable state of the system is as follows: for REFCs facing high-intensity supervision, if strategy A is the dominant strategy, the REFC group will tend to choose strategy A ( p = 1 ), and correspondingly, the government will choose high-intensity supervision to reverse this situation. Similarly, by integrating Lemma 1, the asymptotic stability conditions at the remaining three equilibrium points can be obtained, as shown in Table 4.
In Table 4, since a characteristic root λ 5 = c s + q e r 1 r 2 < 0 corresponding to the equilibrium point A ( 0,1 ) is always established, it is impossible for A ( 0,1 ) to be an asymptotically stable point, which is represented using “-”.
To sum up, for the replication dynamic system of both regulators and provincial decision makers, there may only be three asymptotically stable points of O 0 , 0 , B 1,0 , C ( 1 , 1 ) . When the payoff of the provincial region that chooses strategy B can make up for the cost it has paid for excess consumption, the evolutionary stable point is O ( 0 , 0 ) , and the corresponding evolutionary stable strategy is {choose strategy B, low-intensity supervision}. That is, provincial-level regions take the initiative to undertake consumption quotas that exceed national standards (including just meeting national standards), and the government chooses a loose regulatory strategy. In this case, Pareto efficiency is achieved. However, once the cost of high-intensity supervision by the regulatory authority is too high and the effect is minimal, the central regulatory authority will let the provincial-level regions with low consumption willingness give up on fulfilling the quota target. The case of A ( 0,1 ) is discarded, which happens to be a case that violates reality.
In summary, the evolutionary game model in this section focuses on the evolutionary equilibrium between the national government department and the provincial administrative departments, which aims to provide a strategic equilibrium solution between the regulatory intensity of the national government department and the renewable energy consumption of the provincial administrative departments. For provincial administrations, if they choose to over-consume renewable energy (or under-consume renewable energy), market players in the administrative area need to further decide the optimal proportion of renewable energy to be consumed if they are not sure about the intensity of regulation by the state government. Thus, we built a stochastic optimization model on the basis of the decision-making tendencies of the above-mentioned game entities, which is presented in the next section, so that the model can comprehensively consider the probability range of the government’s reward and punishment policy, and the choice of accommodation strategy in the provincial regions. Then, the selection of consumption strategies of the responsible market entities in each province affected by the provincial regional decision making can be obtained.

4.2. Stochastic Optimization Analysis Model Construction

To take into account the impacts of different levels of government incentives and punishments on provincial regions, this paper regarded the probability of different levels of regulatory behavior by government regulatory authorities as a random variable, and used this as a condition to carry out optimal calculations, after observing the evolutionary game equilibrium results. At the same time, provincial regions were further decomposed into municipal regions, and REFCs in these municipal regional power markets were regarded as the main force to complete the province’s quota. In this phase, this paper constructed a stochastic optimization model for the consumption strategies of the REFCs in the province. Since the willingness of REFC consumption is largely influenced by provincial decision makers, this study first constructed a stochastic optimization model for the overall social welfare of provincial regions, so as to feed back the central government’s supervision and the efforts made by provincial-level decision makers to the choice of REFC consumption strategy. The objective function based on social welfare maximization is as follows:
m a x i = 1 2 s = 1 2 h s × ( a × q t i c f , s × q n i + r s × q e i )
where h s represents the probability interval of the central government adopting different levels of regulatory measures. Considering the quota target stipulated by the RPS policy, we formulated the policy constraints for the optimization model, as shown below:
i = 1 2 q t i q p e
q p e = e p × Q p
Taking a step further, we replaced the variables in the stochastic optimization model with REFCs in various cities in the province. These REFCs may also have different consumption strategies, but regardless of whether they achieve excess consumption, their overall consumption constitutes the total quantity of the whole province. With this setting, the stochastic optimization model can be replaced by an optimal consumption strategy optimization model of a certain REFC. In addition, for each prefecture-level city, its total consumption should not be less than the power consumption of renewable energy obtained from power flow tracking, so we also formulated the following constraints:
g G n N q t g , n = i = 1 2 q t i
g G n N q e g , n = i = 1 2 q e i
g G n N q n g , n = i = 1 2 q n i
n = 1 N q t g , n Q m , n
where Q p represents the annual sales/consumption of electricity in the province (kWh), G represents the number of prefecture-level cities in the province, N represents the number of REFCs in each prefecture-level city, q t g , n represents the actual consumption of different entities in each prefecture-level city, and Q m , n represents the renewable energy consumption (kWh) of each prefecture-level city obtained from the trend tracking method.

5. Simulation Analysis

For ease of exposition, we used the actual data of renewable energy consumption in Hubei Province in 2021 to simulate and analyze the above model. The basic data of various cities are shown in Figure 2. In Section 5.1, we simulate the game behavior between 7069 renewable energy consumption market entities and regulatory authorities, and obtain the probability interval of government rewards and punishments on the basis of verifying the robustness of the theoretical model. In Section 5.2, we substitute the results of the evolutionary game simulation analysis into the stochastic optimization model as the calculation conditions and, based on this, calculate the optimal responsibility weight of REFCs.

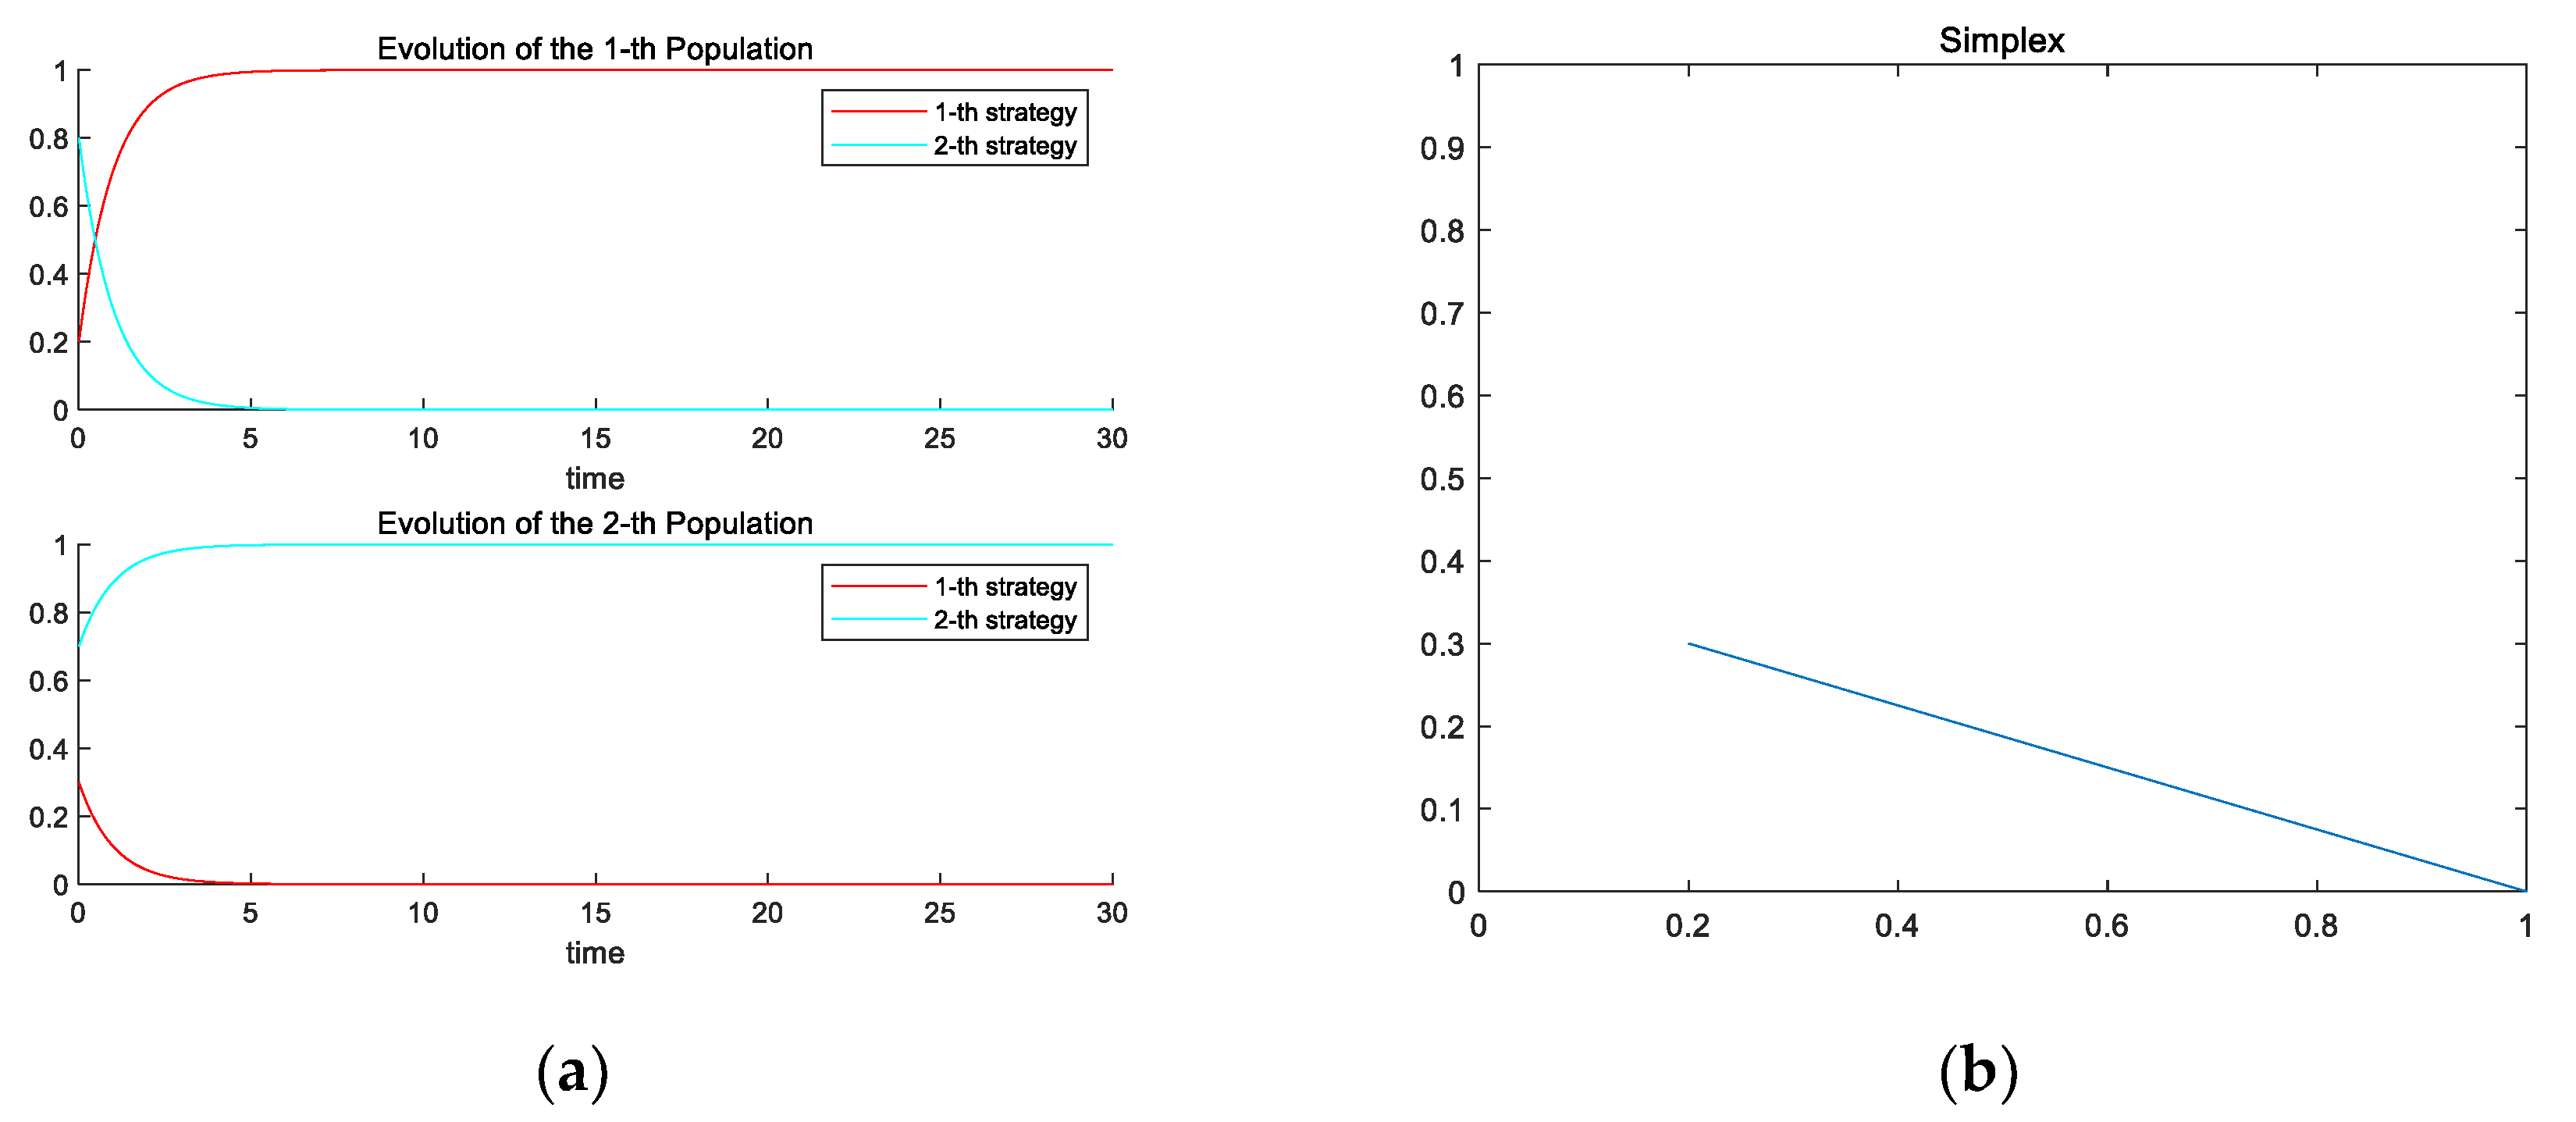
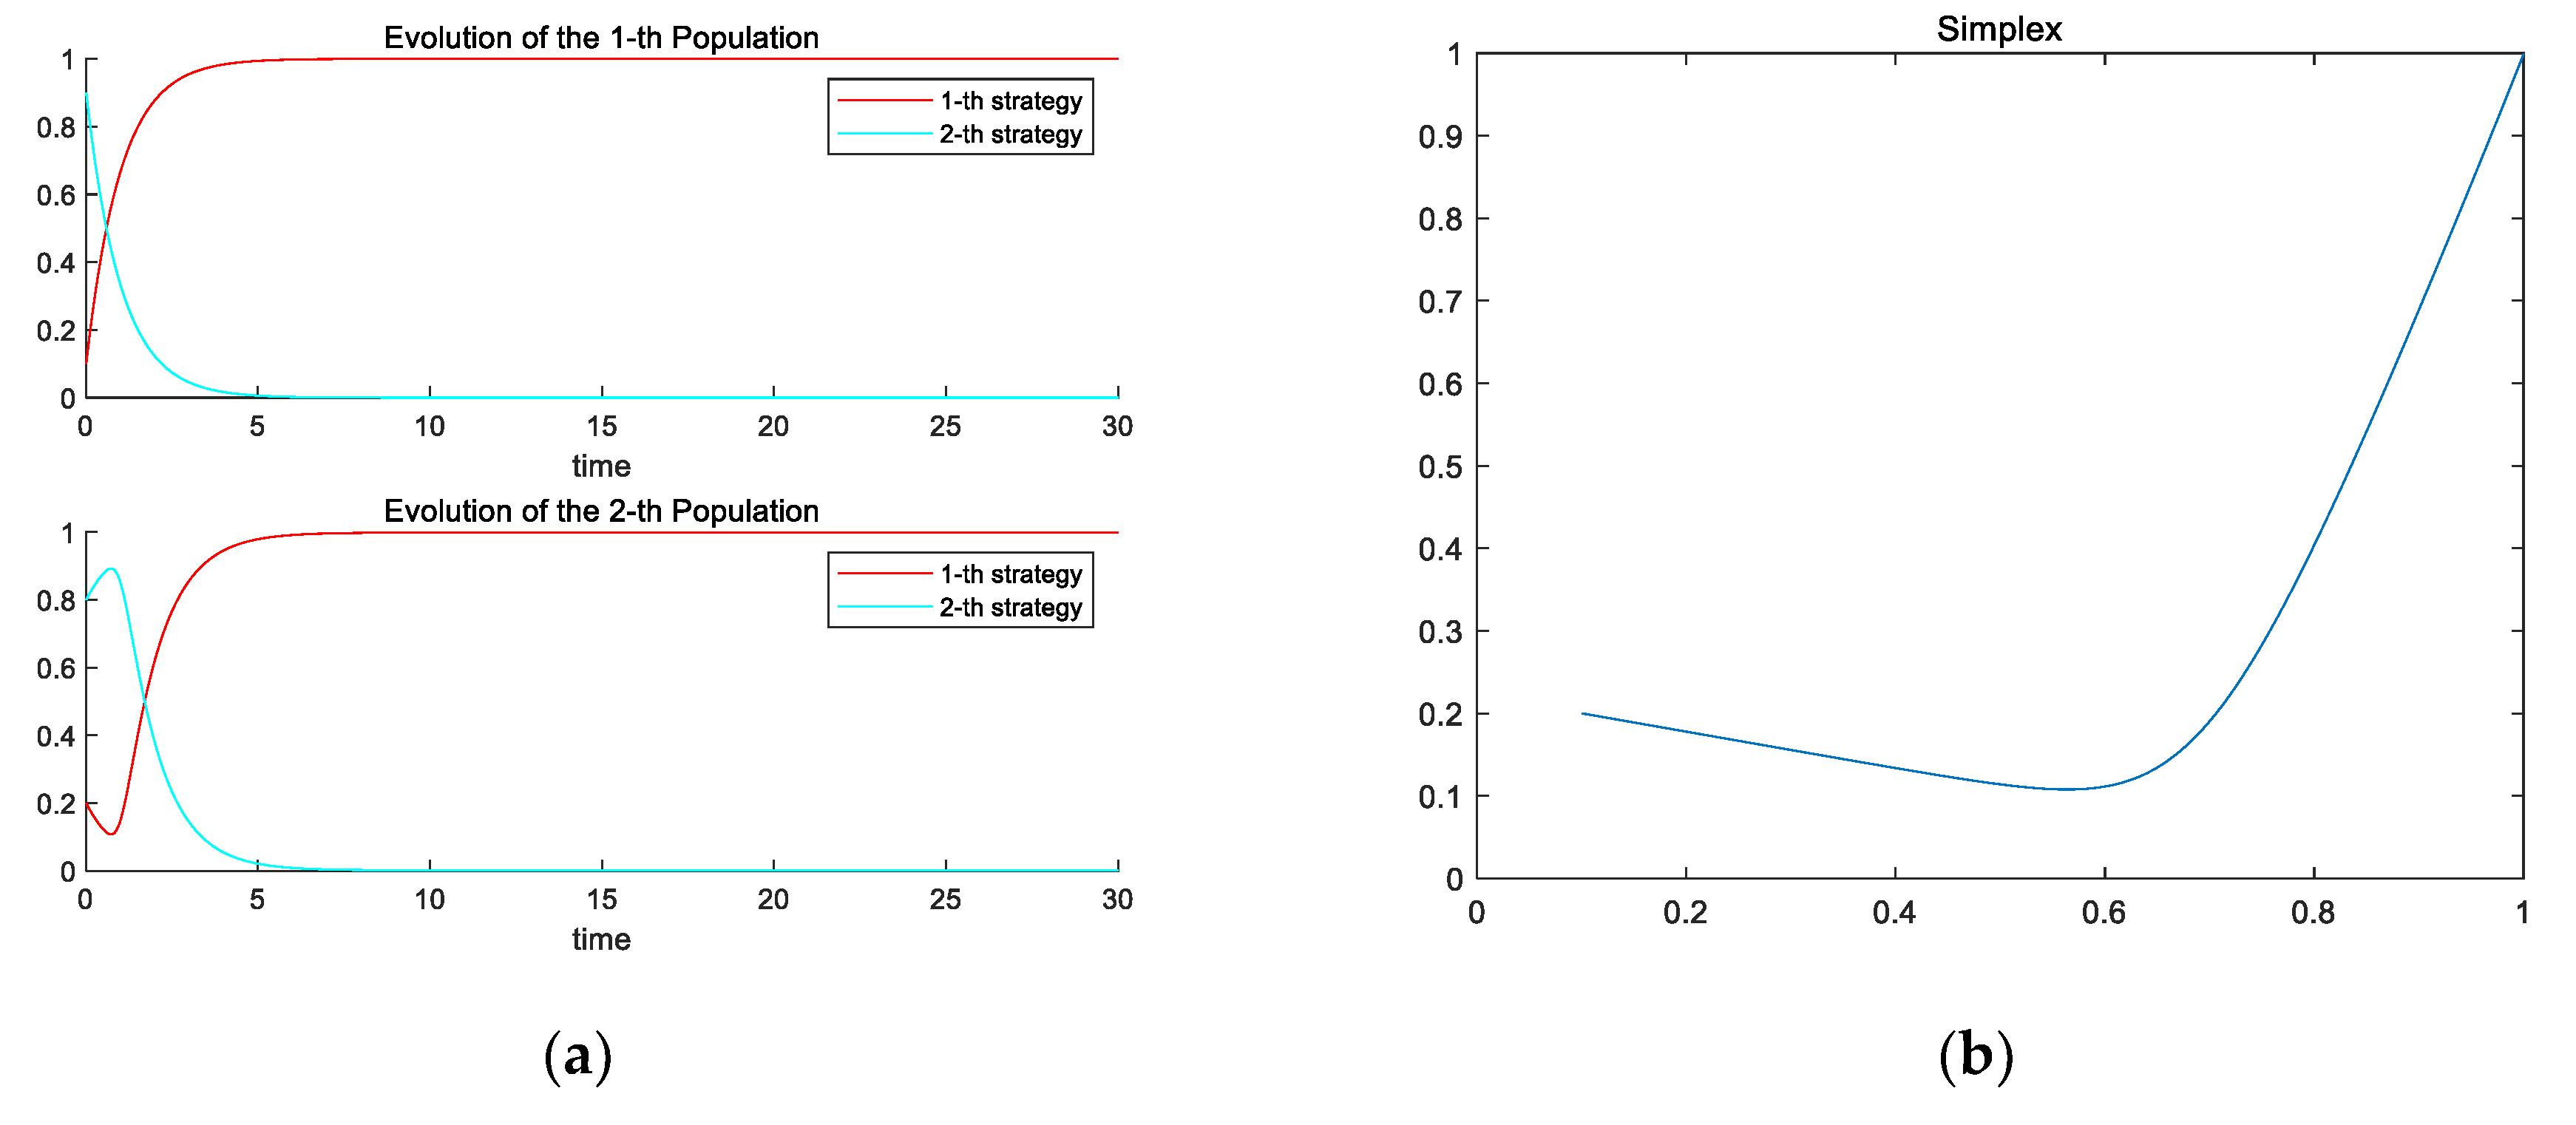
5.1. Simulation Analysis of the Evolutionary Game

On the basis of evolutionary equilibrium analysis, we simulated and analyzed the above evolutionary game model through Matlab 2022Ra. On the premise of meeting the requirements of the model, by combining the actual data, we proposed the following model parameters: a = 0.457, r = 0.08, ω = 0.02 , q t 1 = 0.954 × 10 9 , q t 2 = 1.2 × 10 9 , q s = 1.833 × 10 8 , v = 0.3 , c f = 1.2 , q n = 0.67 × 10 8 , c s = 2.2 × 10 7 , satisfying π 1 < 0 , π 3 > 0 . In this situation, the strategic evolution paths of both players in the game are shown in Figure 3a,b.
Consistent with the theoretical model mentioned above, for a provincial region facing a consumption strategy choice, once it realizes that promoting the construction of a green electricity trading market and policy incentives are not enough to cover the cost of excess consumption, the game party will choose strategy A to evade the responsibility for consumption. At the same time, in this situation, the central government needs to pay more costs and make more efforts to carry out supervision. When the resistance is high enough, the central government will also choose loose supervision. The system eventually stabilizes in the case of {strategy A, loose regulation}. This is exactly the situation in the initial stage of the construction of the green power trading market. When the government realizes the importance of renewable energy consumption and continues to increase policy promotion efforts, it reduces the resistance from the market; that is, the regulatory cost. The system will be stable in the situation shown in Figure 4a,b. Consistent with the analysis of Proposition 2, in this case, due to the imperfect reward and punishment mechanism, the entity responsible for consumption is still not motivated to assume more responsibility for consumption.
Due to the continuous advancement of the construction of the electricity market, there has been an improvement in relevant policies for the green electricity market. Under the influence of many factors, including government incentives, green certificate transaction income, and the cost of buying and voluntarily reducing the cost of electricity consumed by units, provincial regions will spontaneously choose to bear more consumption weight in order to seek greater benefits. With the other parameters remaining unchanged, this paper increased the unit green power transaction price v and the value of the government unit green power reward parameter r. The system finally stabilized at point (0, 0), as shown in Figure 5a.
As a comparison, we continued to increase the values of parameters v and r 1 . As shown in Figure 5b, each province will converge to the evolutionarily stable strategy {strategy B} at a faster rate. In other words, the enthusiasm of provincial decision makers to assume more consumption responsibilities is positively correlated with the strength of government incentives and the maturity of the green power trading market. Scientifically and rationally designing incentive policies and a sound market trading mechanism will effectively encourage the responsible consumption entity to consciously undertake the obligation of green power consumption, promote the consumption of renewable energy, and, at the same time, enable the central government to efficiently encourage the entities to establish a sense of consumption responsibility, thereby reducing the investments and avoiding a loss of economic efficiency.
To sum up, the willingness to consume renewable energy power at the provincial level is largely influenced by the regulation intensity, and more specifically, by the probability range of rewards and punishments by the central government. For example, when the government adopts high-intensity supervision, some provinces tend to choose excessive consumption; that is, the consumption is greater than the set standard quota ratio of 32.5%. Since these provinces need to meet the consumption tasks of the whole province and distribute the consumption targets to the market entities in the province, in the next section, we will summarize the conclusions of this section and substitute them into the stochastic optimization, considering the division of municipal administrative regions as calculation conditions in the simulation analysis.

5.2. Results of Stochastic Optimization

(1)
Summary findings
Based on the equilibrium results of the evolutionary game, we further solved the optimal renewable energy consumption weights of 7069 power purchase entities in the electricity market. The solution results are shown in Figure 6.
Figure 6 shows the optimal renewable energy consumption weights of 7069 market entities. Through the partially enlarged picture of Figure 6, it can be seen that different entities basically fall into three levels ( e 1 , e 2 , e 3 ) . According to the evolutionary game model, we can see that each market entity that accepts the RPS assessment has two strategies; that is, not reaching the RPS target and over-fulfilling the RPS target. The goal of maximizing the income from renewable energy is obtained, and then the optimal weight of renewable energy consumption is obtained. Due to the lack of enthusiasm for the consumption of renewable energy, some entities choose the lowest consumption level ( e 1 ), and some entities choose to just reach the RPS target ( e 2 ); the remaining market entities will over-fulfill the target and will be at the upper line of the over-consumption level ( e 3 ).
(2)
Sensitivity analysis
In order to further explore the impact of government supervision and the number of incentives and punishments under the established supervision on the consumption of renewable energy by market entities, the following robustness analysis was conducted. In view of the clarity of the image presentation, the first 225 market entities were first analyzed. The results can be seen in Figure 7.
Figure 7a shows that when the government adopts different regulatory strategies, the renewable energy consumption strategies adopted by market entities will show differences. The difference is not big, but when the government implements strict supervision, more market entities will take the initiative to meet the RPS target. Driven by high rewards, some entities choose to consume renewable energy in excess on the basis of meeting the RPS target. In the process of government supervision, the rewards and punishments given are different, and the enthusiasm of market entities to achieve the RPS goal is significantly different. When the rewards and punishments are greater, market entities are more motivated to complete the consumption responsibility weight. As shown in Figure 7b, the yellow dotted line indicates that the rewards and punishments intensity is at a high level, and the proportion of renewable energy consumption of market entities reaches the RPS target (32.5%). We also found that, under certain conditions, for the two types of market entities with insufficient consumption willingness and sufficient consumption willingness, respectively, it is more reasonable to assign 32.5% and 36% of the consumption amount, respectively, than to assign 32.5% and 34%. This is because, at this time, the rewards and punishments issued by the government can be smaller and the total social welfare will be greater. The stronger the government’s supervision, the higher the price of rewards and punishments, and the smaller the annual sales/consumption of electricity by the responsible entity with a high willingness to consume.

6. Conclusions and Policy Implications

6.1. Conclusions

In the context of China’s implementation of the guarantee mechanism for renewable energy consumption, this paper proposed a weight distribution method for market entities’ renewable energy consumption responsibilities based on evolutionary games and stochastic optimization models. To make this research more pertinent and practical, this paper assumed that the provincial regions facing the supervision of the central government can independently analyze the probability of the government issuing different rewards and punishments. After the evolutionary game, considering that the market entities in the municipal electricity market in each province will be affected by the implementation of the provincial policies, we constructed a stochastic optimization model to explore the consumption strategy of each market entity to minimize its own costs. Finally, in order to draw a more general conclusion, this study selected the data of 7069 actual market entities in Hubei Province in 2021 for calculation, and then simulated the top-down allocation process of quota policy weights. The results show the following: under the influence of many factors including government incentives, green certificate transaction income, and the cost of purchasing and voluntarily reducing the cost of unit consumption of electricity, both the provincial-level regions and the main body responsible for market consumption will voluntarily choose to bear more consumption weight to seek greater benefits. Our research can provide a new way of thinking about the implementation and promotion of the renewable energy power consumption guarantee mechanism.

6.2. Policy Implications

Considering that the central government and local governments in provincial regions are included in our model in two different stages, we can capture the defects of current policies while observing the evolution trend of the future electricity market. Based on the discussion in this paper, we present the following policy implications:
(1)
As a policy tool to stimulate the consumption of renewable energy, RPS can indirectly reduce carbon emissions by specifying the consumption amount. However, in the process of distributing RPS quota weights, the central regulator needs to take into account the geographical heterogeneity and development demands of different provincial regions, which will directly determine the effect of RPS policy implementation.
(2)
As a key link to ensure the smooth realization of RPS policy goals, provincial and regional governments should distribute quota weights to market entities on the basis of fully considering the characteristics of regional power markets and the varying consumption willingness of market entities. For subjects with a willingness to absorb, they can be encouraged to bear a greater quota weight.
(3)
In the process of building a new power system, the most critical thing is to restore the process of market competition. In fact, with the continuous improvement of the green certificate trading market and the continuous maturity of renewable energy power generation technology, the carbon market is gradually moving towards operation. Renewable energy power will increasingly be selected by market entities. Therefore, regulators should try their best to ensure that the market operates in a regulated manner and prevent the emergence of market forces.
(4)
In the current stage, the government’s supervision should focus on strict supervision, and encourage market entities to establish environmental awareness. As the power market matures, the regulations can be appropriately relaxed, but it is still necessary to design and maintain a reasonable dynamic reward and punishment mechanism.

6.3. Limitations and Future Work

Based on the comprehensive use of two mathematical models, this study examined the distribution scheme of RPS quota weights, drawing conclusions based on the consumption preferences of different responsible subjects. However, our research has the following limitations:
(1)
Although this research focused on the quota policy and the green certificate trading system supporting the quota policy, it calculated the optimal quota weight distribution scheme on the basis of observing the game behavior of market entities. However, since the carbon market is in the pilot stage in China and transaction data are not yet sufficient, we have not included the carbon market in our model. Therefore, future research should consider the impact from the carbon market.
(2)
In our research, in order to focus more on the game behavior of provincial regional market entities, based on assumptions, we did not consider cross-regional electricity market transactions. In fact, the power purchased/sold by the subject responsible for consumption does not necessarily have to be in the province. Therefore, bringing cross-regional power trading into the discussion will be more in line with the actual situation and help draw more macro conclusions.

Author Contributions

Y.T., Y.L., W.H., M.C., S.Y. and L.C. contributed equally to this paper. All authors have read and agreed to the published version of the manuscript.

Funding

This research received no external funding.

Data Availability Statement

Data will be made available on request.

Conflicts of Interest

The authors declare no conflict of interest.

References

  1. Yu, B.; Fang, D.; Kleit, A.N.; Xiao, K. Exploring the driving mechanism and the evolution of the low-carbon economy transition: Lessons from OECD developed countries. World Econ. 2022, 45, 2766–2795. [Google Scholar] [CrossRef]
  2. Min, C.-G.; Park, J.K.; Hur, D.; Kim, M.-K. The Economic Viability of Renewable Portfolio Standard Support for Offshore Wind Farm Projects in Korea. Energies 2015, 8, 9731–9750. [Google Scholar] [CrossRef] [Green Version]
  3. National Development and Reform Commission; National Energy Board. Notification on the Weight of Responsibility for Renewable Energy Power Consumption in 2021 and Related Matters. Available online: https://www.ndrc.gov.cn/xxgk/zcfb/tz/202105/t20210525_1280789.html (accessed on 5 March 2023).
  4. Mamkhezri, J.; Malczynski, L.; Chermak, J. Assessing the Economic and Environmental Impacts of Alternative Renewable Portfolio Standards: Winners and Losers. Energies 2021, 14, 3319. [Google Scholar] [CrossRef]
  5. Yu, B.; Fang, D.; Xiao, K.; Pan, Y. Drivers of renewable energy penetration and its role in power sector’s deep decarbonization towards carbon peak. Renew. Sustain. Energy Rev. 2023, 178, 113247. [Google Scholar] [CrossRef]
  6. Pan, Y.; Dong, F. Factor substitution and development path of the new energy market in the BRICS countries under carbon neutrality: Inspirations from developed European countries. Appl. Energy 2023, 331, 120442. [Google Scholar] [CrossRef]
  7. Li, T.; Gao, C.; Chen, T.; Jiang, Y.; Feng, Y. Medium and long-term electricity market trading strategy considering renewable portfolio standard in the transitional period of electricity market reform in Jiangsu, China. Energy Econ. 2022, 107, 105860. [Google Scholar] [CrossRef]
  8. Fan, J.-L.; Wang, J.-X.; Hu, J.-W.; Yang, Y.; Wang, Y. Will China achieve its renewable portfolio standard targets? An analysis from the perspective of supply and demand. Renew. Sustain. Energy Rev. 2021, 138, 110510. [Google Scholar] [CrossRef]
  9. Novacheck, J.; Johnson, J.X. The environmental and cost implications of solar energy preferences in Renewable Portfolio Standards. Energy Policy 2015, 86, 250–261. [Google Scholar] [CrossRef]
  10. Yu, B.; Fang, D.; Meng, J. Analysis of the generation efficiency of disaggregated renewable energy and its spatial hetero-geneity influencing factors: A case study of China. Energy 2021, 234, 121295. [Google Scholar] [CrossRef]
  11. Tan, Y.; Xu, Z.; Xu, W. A Two-Phase Hybrid Trading of Green Certificate under Renewables Portfolio Standards in Community of Active Energy Agents. Energies 2022, 15, 6915. [Google Scholar] [CrossRef]
  12. Pan, Y.; Dong, F. Green finance policy coupling effect of fossil energy use rights trading and renewable energy certificates trading on low carbon economy: Taking China as an example. Econ. Anal. Policy 2023, 77, 658–679. [Google Scholar] [CrossRef]
  13. Wang, S.; Zhao, W.; Fan, S.; Xue, L.; Huang, Z.; Liu, Z. Is the Renewable Portfolio Standard in China Effective? Research on RPS Allocation Efficiency in Chinese Provinces Based on the Zero-Sum DEA Model. Energies 2022, 15, 3949. [Google Scholar] [CrossRef]
  14. Fang, D.; Zhao, C.; Kleit, A.N. The impact of the under enforcement of RPS in China: An evolutionary approach. Energy Policy 2019, 135, 111021. [Google Scholar] [CrossRef]
  15. Xiao, K.; Yu, B.; Cheng, L.; Li, F.; Fang, D. The effects of CCUS combined with renewable energy penetration under the carbon peak by an SD-CGE model: Evidence from China. Appl. Energy 2022, 321, 119396. [Google Scholar] [CrossRef]
  16. Farooq, M.K.; Kumar, S.; Shrestha, R.M. Energy, environmental and economic effects of Renewable Portfolio Standards (RPS) in a Developing Country. Energy Policy 2013, 62, 989–1001. [Google Scholar] [CrossRef]
  17. Dong, F.; Shi, L.; Ding, X.; Li, Y.; Shi, Y. Study on China’s Renewable Energy Policy Reform and Improved Design of Renewable Portfolio Standard. Energies 2019, 12, 2147. [Google Scholar] [CrossRef] [Green Version]
  18. Kwon, T.-H. Policy synergy or conflict for renewable energy support: Case of RPS and auction in South Korea. Energy Policy 2018, 123, 443–449. [Google Scholar] [CrossRef]
  19. Zhang, L.; Chen, C.; Wang, Q.; Zhou, D. The impact of feed-in tariff reduction and renewable portfolio standard on the development of distributed photovoltaic generation in China. Energy 2021, 232, 120933. [Google Scholar] [CrossRef]
  20. Gribiss, H.; Aghelinejad, M.M.; Yalaoui, F. Configuration Selection for Renewable Energy Community Using MCDM Methods. Energies 2023, 16, 2632. [Google Scholar] [CrossRef]
  21. Das, A.; Peu, S.D.; Akanda, A.M.; Islam, A.R.M.T. Peer-to-Peer Energy Trading Pricing Mechanisms: Towards a Comprehensive Analysis of Energy and Network Service Pricing (NSP) Mechanisms to Get Sustainable Enviro-Economical Energy Sector. Energies 2023, 16, 2198. [Google Scholar] [CrossRef]
  22. Tvaronavičienė, M. Towards Renewable Energy: Opportunities and Challenges. Energies 2023, 16, 2269. [Google Scholar] [CrossRef]
  23. Zhao, W.; Bao, X.; Yuan, G.; Wang, X.; Bao, H. The Equilibrium Model for the Coexistence of Renewable Portfolio Standards and Emissions Trading: The Supply Chain Analysis. Energies 2019, 12, 439. [Google Scholar] [CrossRef] [Green Version]
  24. Wen, M.; Zhou, C.; Konstantin, M. Deep Neural Network for Predicting Changing Market Demands in the Energy Sector for a Sustainable Economy. Energies 2023, 16, 2407. [Google Scholar] [CrossRef]
  25. Zhou, X.; Guan, X.; Zhang, M.; Zhou, Y.; Zhou, M. Allocation and simulation study of carbon emission quotas among China’s provinces in 2020. Environ. Sci. Pollut. Res. 2017, 24, 7088–7113. [Google Scholar] [CrossRef]
  26. Ministry of Commerce of The People’s Republic Of China. Hubei Issued the First Group of Dual-Certified Green Power Transaction Certificates in China. Available online: https://zycpzs.mofcom.gov.cn/html/qita/2022/4/1651135669670.html (accessed on 15 March 2023).
  27. Hao, P.; Guo, J.-P.; Chen, Y.; Xie, B.-C. Does a combined strategy outperform independent policies? Impact of incentive policies on renewable power generation. Omega 2020, 97, 102100. [Google Scholar] [CrossRef]
  28. Dong, Z.; Yu, X.; Chang, C.-T.; Zhou, D.; Sang, X. How does feed-in tariff and renewable portfolio standard evolve syner-gistically? An integrated approach of tripartite evolutionary game and system dynamics. Renew. Energy 2022, 186, 864–877. [Google Scholar] [CrossRef]
  29. Choi, G.; Huh, S.-Y.; Heo, E.; Lee, C.-Y. Prices versus quantities: Comparing economic efficiency of feed-in tariff and renewable portfolio standard in promoting renewable electricity generation. Energy Policy 2018, 113, 239–248. [Google Scholar] [CrossRef]
  30. Xin-Gang, Z.; Pei-Ling, L.; Ying, Z. Which policy can promote renewable energy to achieve grid parity? Feed-in tariff vs. renewable portfolio standards. Renew. Energy 2020, 162, 322–333. [Google Scholar] [CrossRef]
  31. Wang, B.; Wei, Y.-M.; Yuan, X.-C. Possible design with equity and responsibility in China’s renewable portfolio standards. Appl. Energy 2018, 232, 685–694. [Google Scholar] [CrossRef]
  32. Wang, G.; Zhang, Q.; Li, Y.; Mclellan, B.C. Efficient and equitable allocation of renewable portfolio standards targets among China’s provinces. Energy Policy 2019, 125, 170–180. [Google Scholar] [CrossRef]
  33. Tang, D.; Dong, C.; Wu, X.; Qian, H.; Wang, H.; Jiang, H.; Zhang, Z.; Chen, Y.; Deng, X.; Lin, Z.; et al. Allocation strategy of regulated consumption quota ratio of renewable energy based on game theory. Energy Rep. 2021, 7, 67–74. [Google Scholar] [CrossRef]
  34. Xu, J.; Lv, T.; Hou, X.; Deng, X.; Liu, F. Provincial allocation of renewable portfolio standard in China based on efficiency and fairness principles. Renew. Energy 2021, 179, 1233–1245. [Google Scholar] [CrossRef]
  35. Zhou, D.; Hu, F.; Zhu, Q.; Wang, Q. Regional allocation of renewable energy quota in China under the policy of renewable portfolio standards. Resour. Conserv. Recycl. 2022, 176, 105904. [Google Scholar] [CrossRef]
  36. Xu, J.; Yang, G.; Wang, F.; Shu, K. A provincial renewable portfolio standards-based distribution strategy for both power plant and user: A case study from Guangdong, China. Energy Policy 2022, 165, 112935. [Google Scholar] [CrossRef]
  37. Wang, L.; Li, K. Research on renewable energy consumption and emission reduction in power market based on bilevel decision making in China. Energy 2022, 260, 125119. [Google Scholar] [CrossRef]
  38. Jha, A.P.; Mahajan, A.; Singh, S.K.; Kumar, P. Renewable energy proliferation for sustainable development: Role of cross-border electricity trade. Renew. Energy 2022, 201, 1189–1199. [Google Scholar] [CrossRef]
  39. Wu, Y.; Liang, X.; Huang, T.; Lin, Z.; Li, Z.; Hossain, M.F. A hierarchical framework for renewable energy sources consumption promotion among microgrids through two-layer electricity prices. Renew. Sustain. Energy Rev. 2021, 145, 111140. [Google Scholar] [CrossRef]
  40. Dong, F.; Yu, B.; Hua, Y.; Zhang, S.; Wang, Y. A Comparative Analysis of Residential Energy Consumption in Urban and Rural China: Determinants and Regional Disparities. Int. J. Environ. Res. Public Health 2018, 15, 2507. [Google Scholar] [CrossRef] [PubMed] [Green Version]
  41. Sun, B.; Li, M.; Wang, F.; Xie, J. An incentive mechanism to promote residential renewable energy consumption in China’s electricity retail market: A two-level Stackelberg game approach. Energy 2023, 269, 126861. [Google Scholar] [CrossRef]
  42. Xin-Gang, Z.; Tian-Tian, F.; Lu, C.; Xia, F. The barriers and institutional arrangements of the implementation of renewable portfolio standard: A perspective of China. Renew. Sustain. Energy Rev. 2014, 30, 371–380. [Google Scholar] [CrossRef]
  43. Mundaca, L.; Samahita, M. What drives home solar PV uptake? Subsidies, peer effects and visibility in Sweden. Energy Res. Soc. Sci. 2020, 60, 101319. [Google Scholar] [CrossRef]
  44. Chai, S.; Liu, Q.; Yang, J. Renewable power generation policies in China: Policy instrument choices and influencing factors from the central and local government perspectives. Renew. Sustain. Energy Rev. 2023, 174, 113126. [Google Scholar] [CrossRef]
  45. Taylor, P.D.; Jonker, L.B. Evolutionary stable strategies and game dynamics. Math. Biosci. 1978, 40, 145–156. [Google Scholar] [CrossRef]
Figure 1. Framework of the two-stage model.
Energies 16 03085 g001
Figure 2. Statistics of electricity consumption and the number of power users in various cities in Hubei Province.
Energies 16 03085 g002
Figure 3. The strategic evolution path of the game entity when π 1 < 0 , π 3 > 0 . ((a) indicates the evolution path of the game strategy; (b) describes the stabilization process for a fixed point).
Energies 16 03085 g003
Figure 4. The evolution path of the agent’s strategy described by Proposition 2. ((a) indicates the evolution path of the game strategy; (b) describes the stabilization process for a fixed point).
Energies 16 03085 g004
Figure 5. The strategic evolution path of the game entity and the changes after adjusting the parameters ( π 1 > 0 ). ((a) indicates the evolution path of the game strategy; (b) describes the impact of parameter changes on the evolution path of the game strategy).
Energies 16 03085 g005
Figure 6. Optimal solution of renewable energy consumption weights for each market entity.
Energies 16 03085 g006
Figure 7. Sensitivity analysis of the completion of the weight of the market entity’s consumption responsibility. (a) The completion of the consumption responsibility weight of market entities under different levels of rewards and punishments. (b) The completion of the consumption responsibility weight of market entities under different levels of government supervision.
Energies 16 03085 g007
Table 1. Notation for variables and parameters.
Parameter ExplanationSymbols
Costs paid for buying and self-generating units to consume electricity a
Incentives are given by the regulator to the main body of over-consumption (per unit of electricity consumed) r i
Revenue from the sale of renewable electricity (CNY/kwh) v
Social welfare benefits for regulators from over-consumption of responsible entities ω
Penalty tariff for unfulfilled quota portion of electricity (yuan/kwh) c f , i
The cost of action by regulators to strictly regulate payments c s
Commercial and industrial customers who choose strategy A choose to buy and self-generate their electricity consumption q t , 1
Commercial and industrial customers who choose strategy B choose to buy and self-generate the electricity consumed q t , 2
The portion of electricity lower than the standard quota (kwh) q n
The portion of electricity higher than the standard quota (kwh) q e
The portion of electricity involved in green power trading (kwh) q s
The lowest proportion of renewable energy consumption under the RPS e p
Minimum consumption quantity of renewable energy under RPS q p e
Table 2. Evolutionary game model.
Entity and Strategy SelectionRegulatory Authorities
High-Intensity RegulationLow-Intensity Regulation
ProvincesStrategy A a q t , 1 F 1 , F 1 c s a q t , 1 F 2 ,   F 2
Strategy B a q t , 2 + r 1 q e + v q s ,   r 1 q e c s + ω q e a q t , 2 + r 2 q e + v q s ,   ω q e r 2 q e
Table 3. Matrix determinant and trace expressions corresponding to the system (I) equilibrium points.
Equilibrium Point ( p , g ) Matrix Determinant and Trace Expression
O ( 0 , 0 ) d
et
G
[ c s + q e r 1 r 2 ] [ a q t 1 q t 2 + q s v + q e r 2 + c f 2 q n ]
tr
G
c s + a q t 2 q t 1 c f 2 q n q e r 1 v q s
A ( 0,1 ) d
et
G
[ c s + q e r 1 r 2 ] [ a q t 1 q t 2 + q s v + q e r 1 + c f 1 q n ]
tr
G
c s + a q t 2 q t 1 c f 1 q n q e r 2 v q s
B ( 1,0 ) d
et
G
[ c s + q n c f 2 c f 1 ] [ a q t 1 q t 2 + q s v + q e r 2 + c f 2 q n ]
tr
G
c s + a q t 1 q t 2 + c f 1 q n + q e r 2 + v q s
C ( 1 , 1 ) d
et
G
[ c s + q n c f 2 c f 1 ] [ a q t 1 q t 2 + q s v + q e r 1 + c f 1 q n ]
tr
G
c s + a q t 1 q t 2 + c f 2 q n + q e r 1 + v q s
D ( p 0 , g 0 ) d
et
G
[ c s + q n c f 2 c f 1 ] [ c s + q e r 1 r 2 ] [ a q t 1 q t 2 + q s v + q e r 1 + c f 1 q n ] [ a q t 1 q t 2 + q s v + q e r 2 + c f 2 q n ] [ ( r 1 r 2 ) q e + ( c f 1 c f 2 ) q n ] 2
tr
G
0
Table 4. Stability analysis results.
Equilibrium PointAsymptotically Stable Condition
O ( 0 , 0 ) π 1 > 0
A ( 0,1 )
B ( 1,0 ) π 1 < 0 , π 3 > 0
C ( 1 , 1 ) π 2 < 0 , π 3 < 0
Disclaimer/Publisher’s Note: The statements, opinions and data contained in all publications are solely those of the individual author(s) and contributor(s) and not of MDPI and/or the editor(s). MDPI and/or the editor(s) disclaim responsibility for any injury to people or property resulting from any ideas, methods, instructions or products referred to in the content.

