
Repowering a Coal Power Plant Steam Cycle Using Modular Light-Water Reactor Technology


Abstract
:1. Introduction
2. Methods
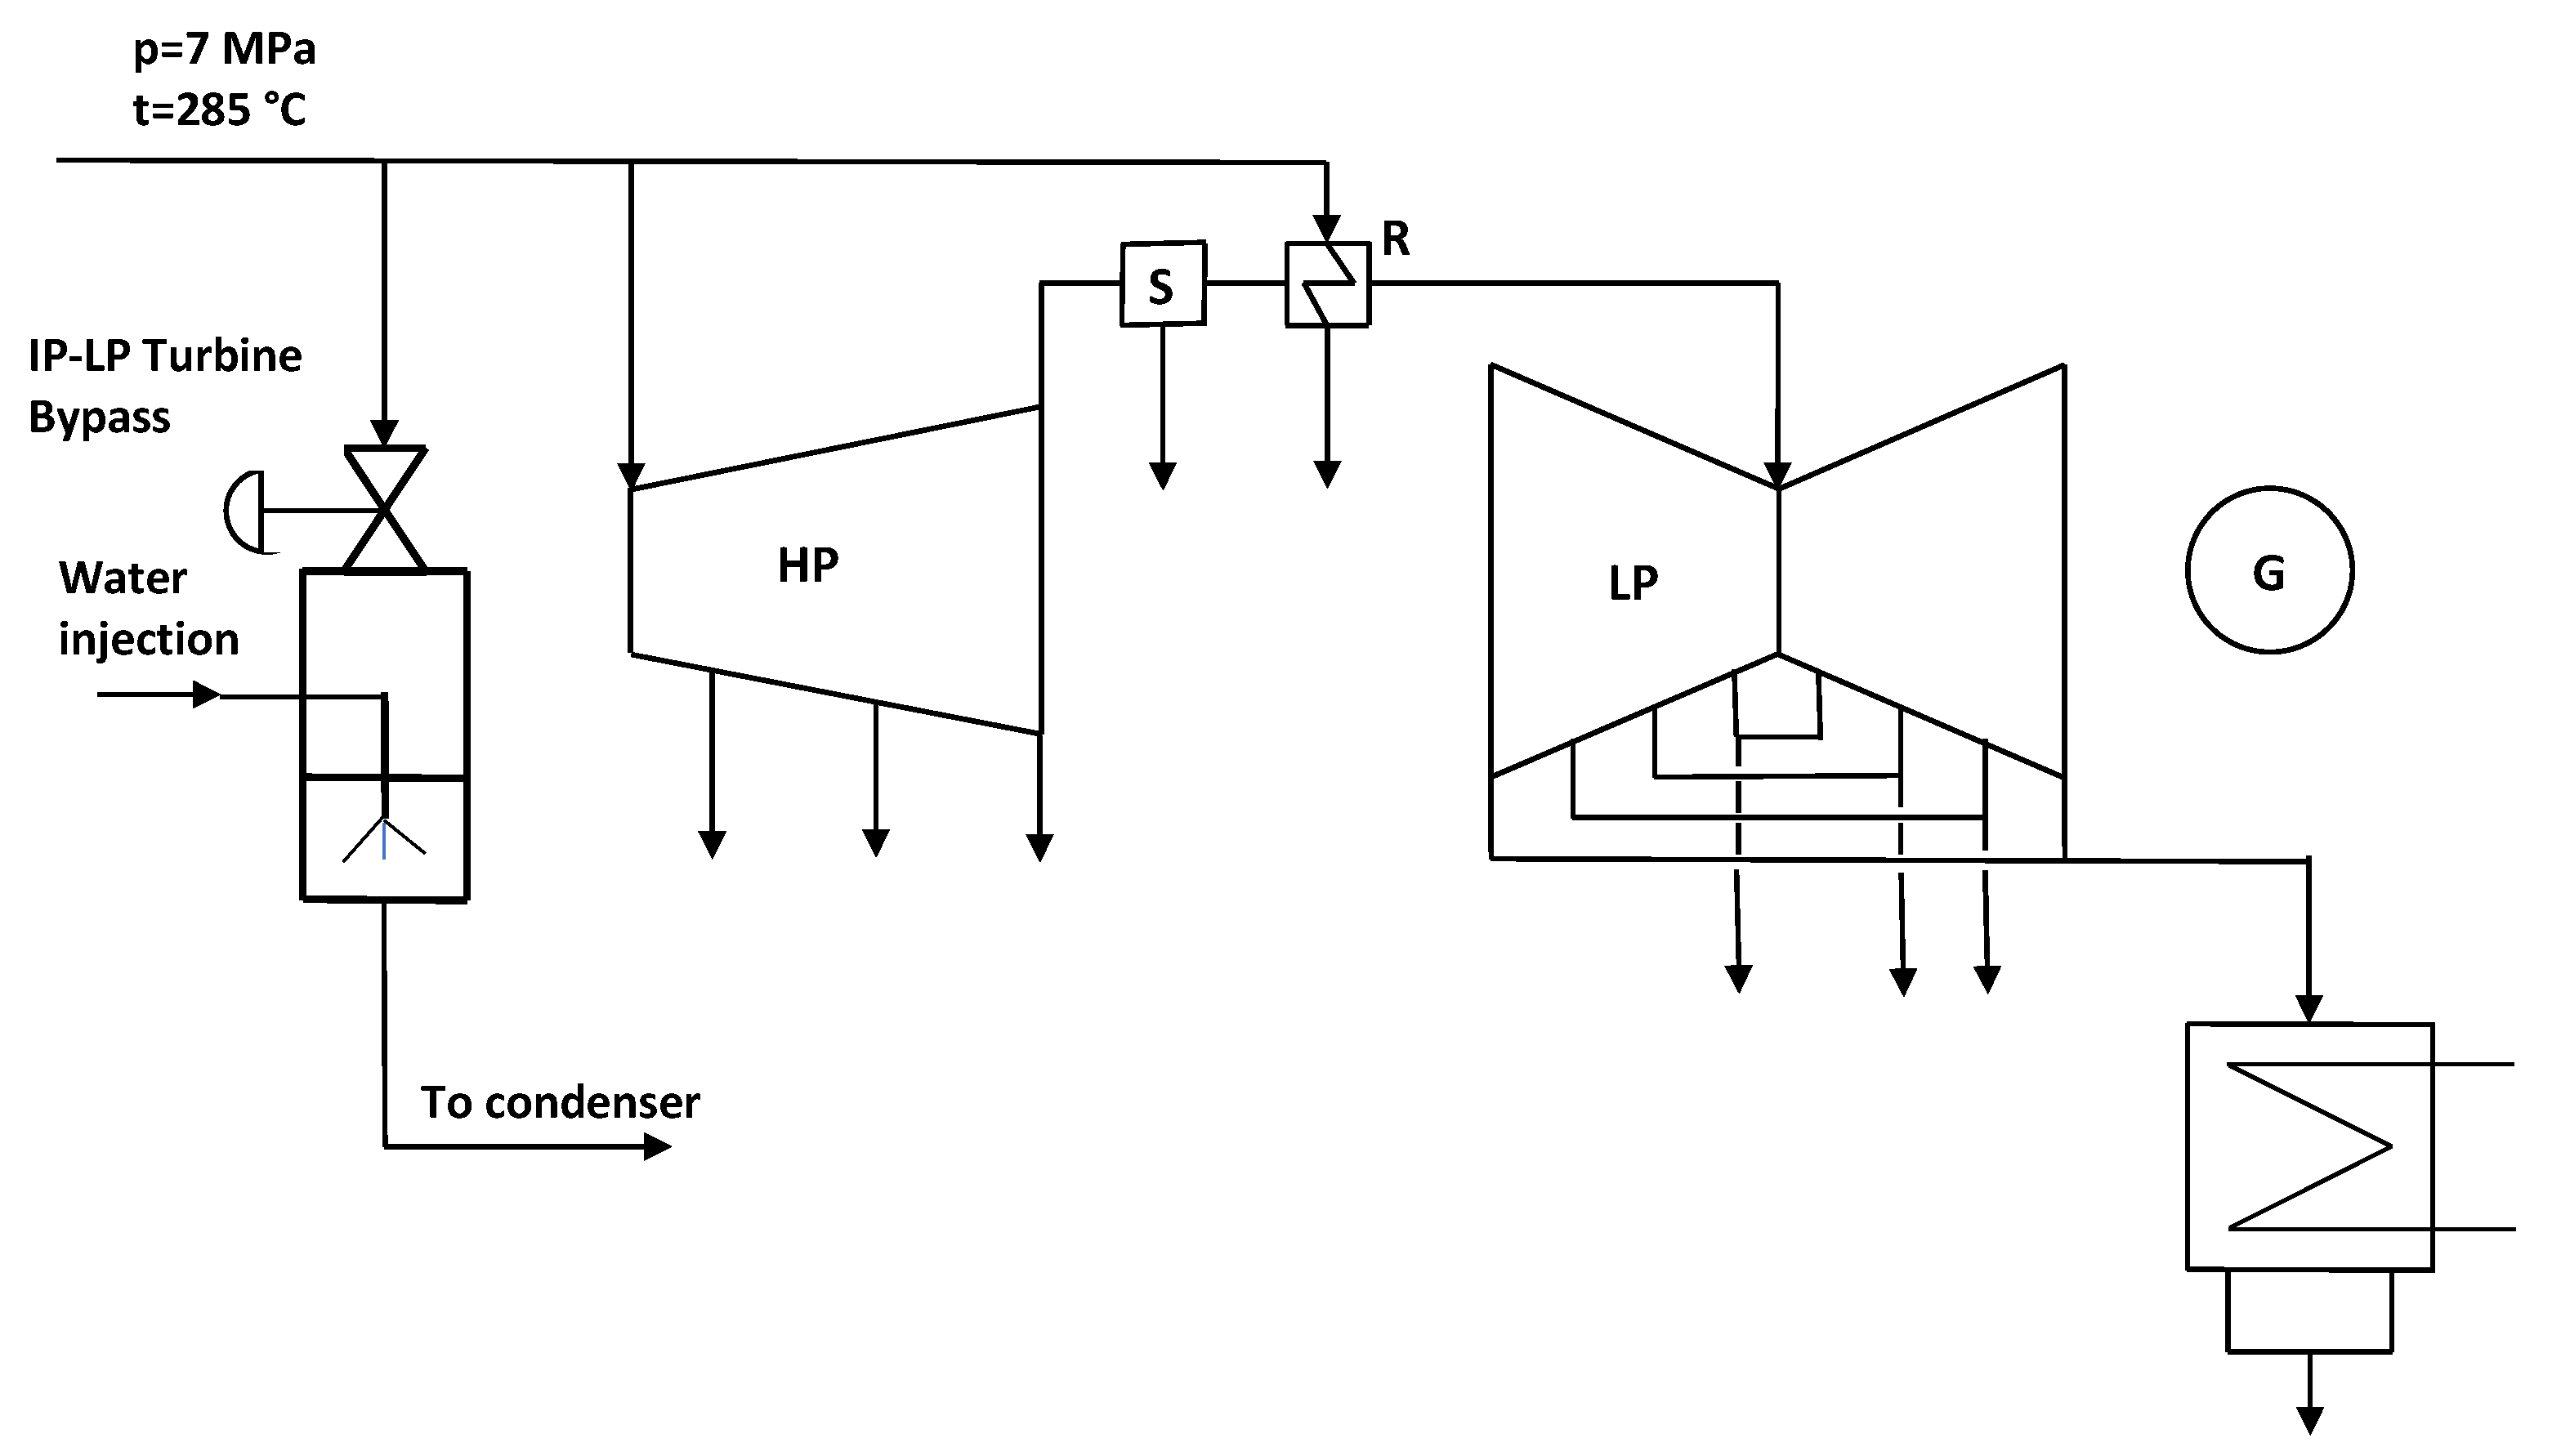
2.1. Selection of the Turbine for Cooperation with SMRs
2.2. Modelling of the Steam Cycle
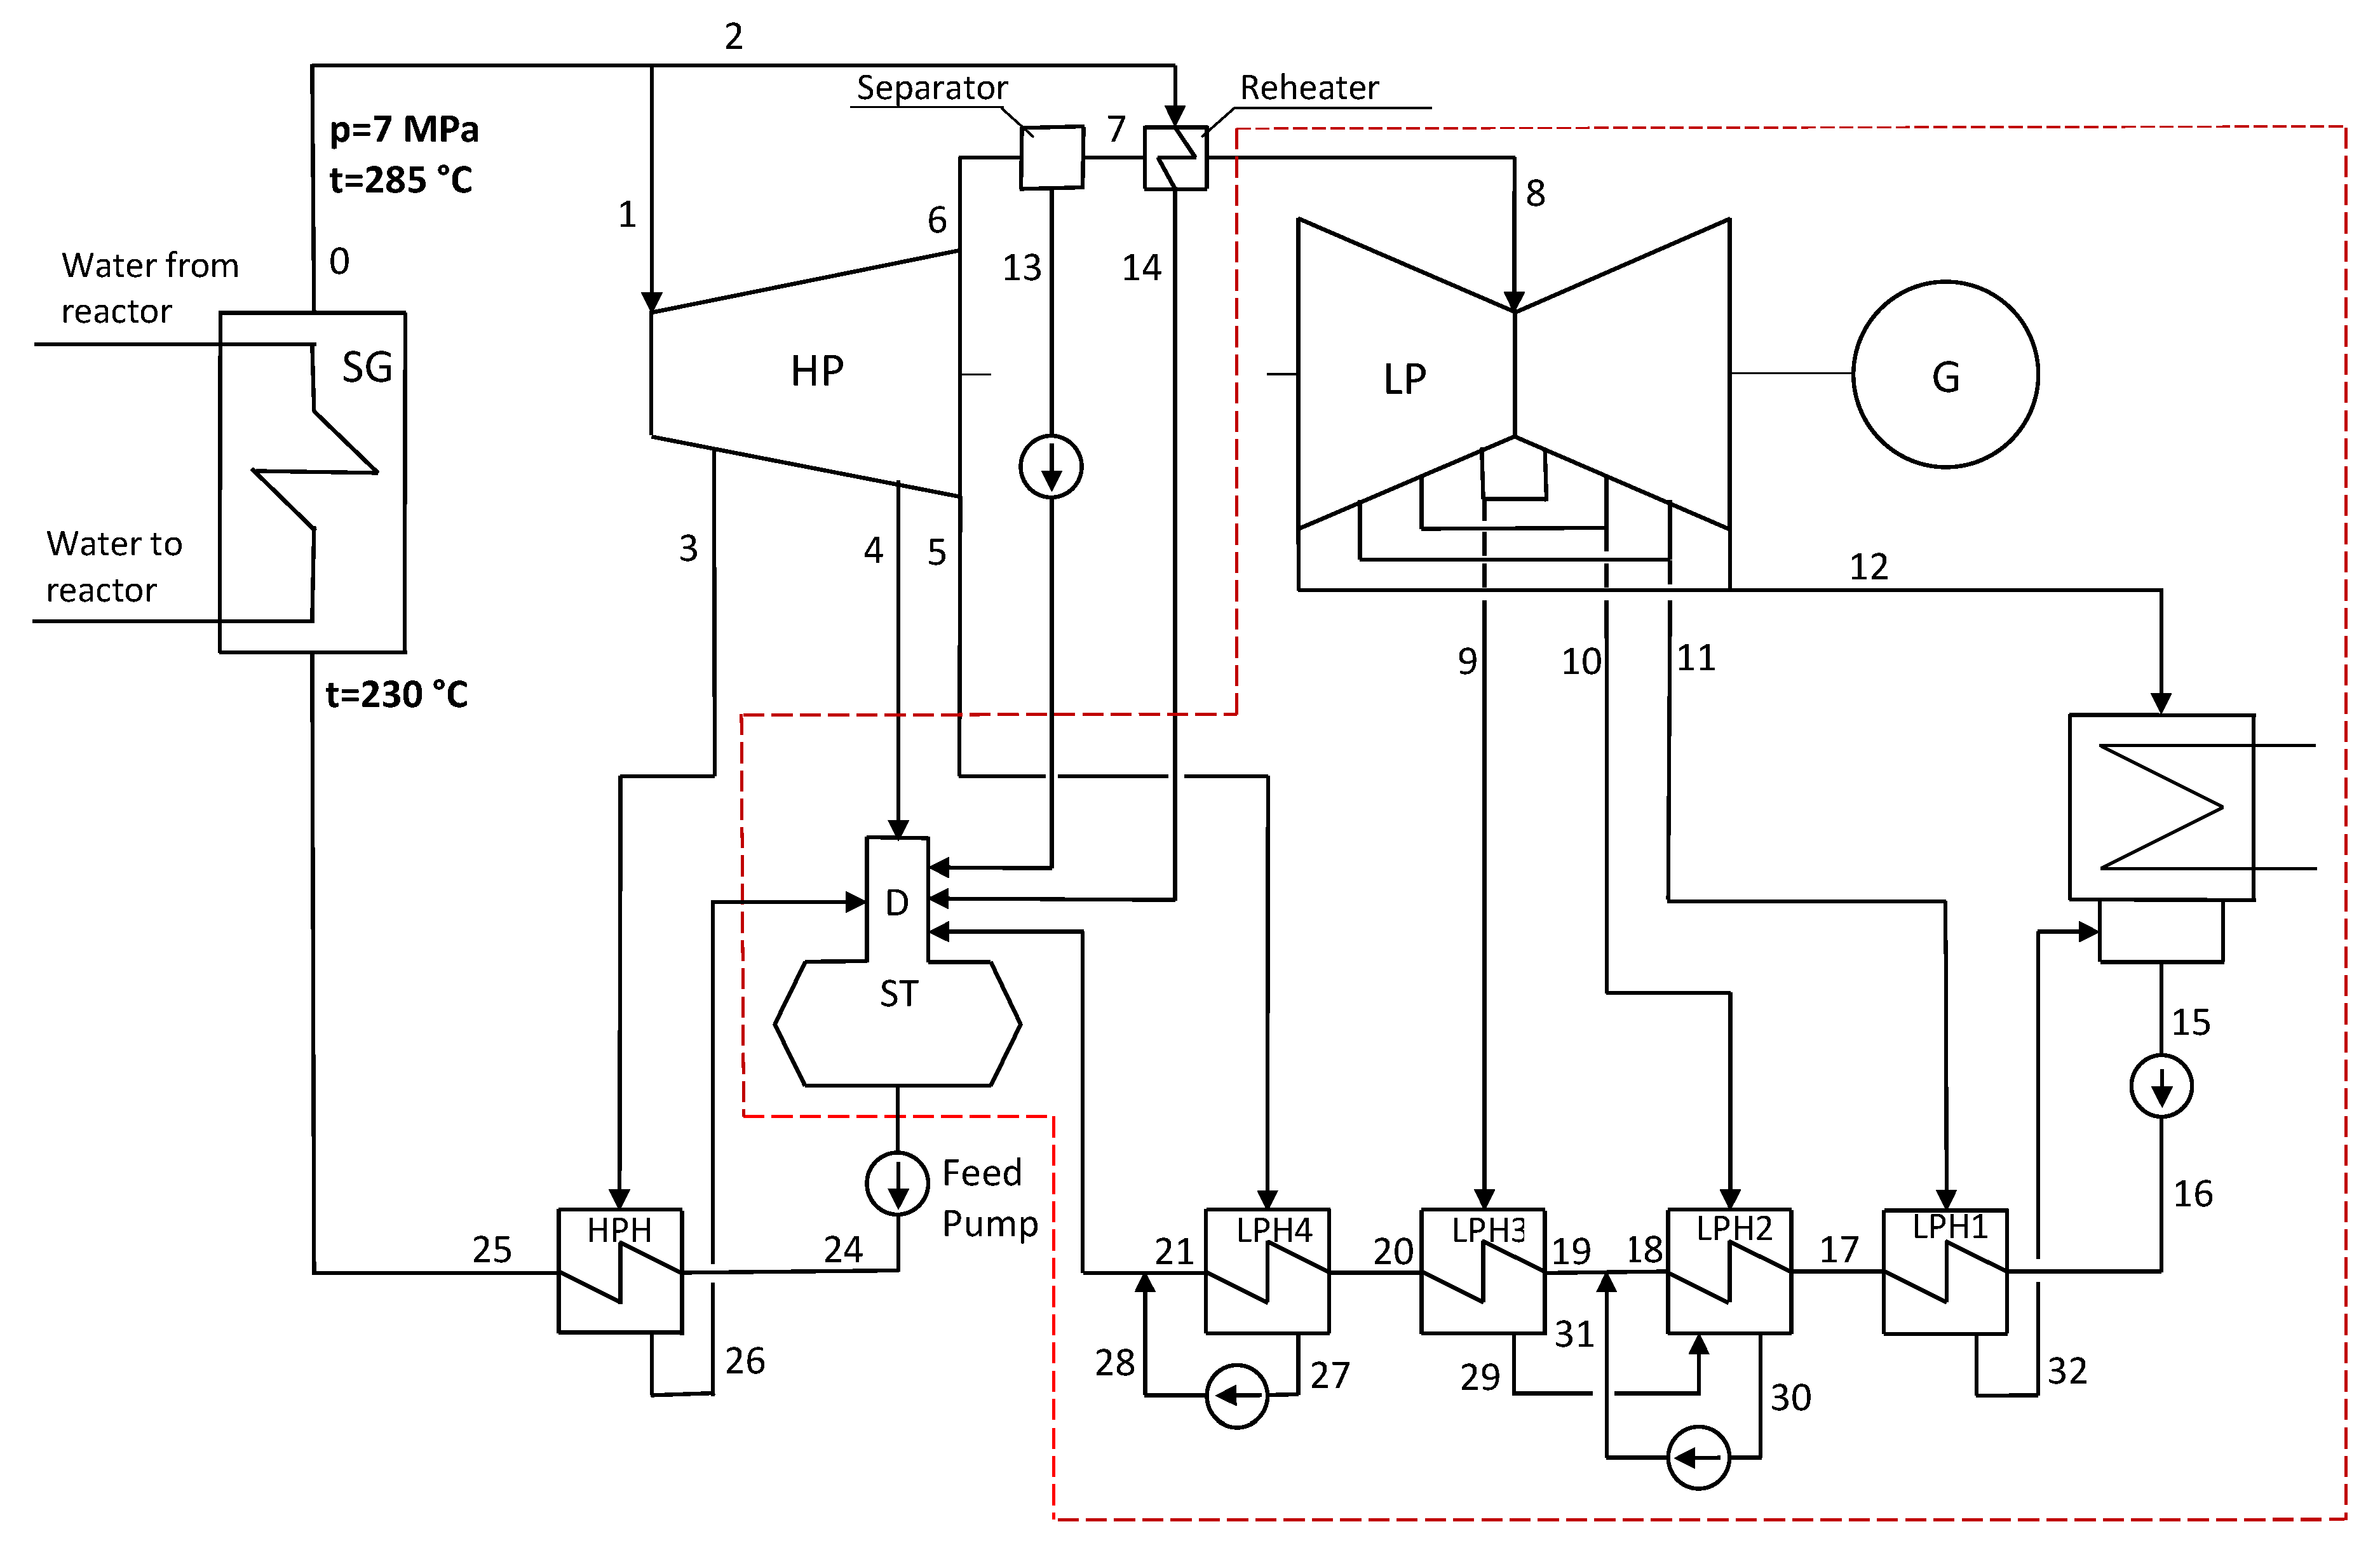
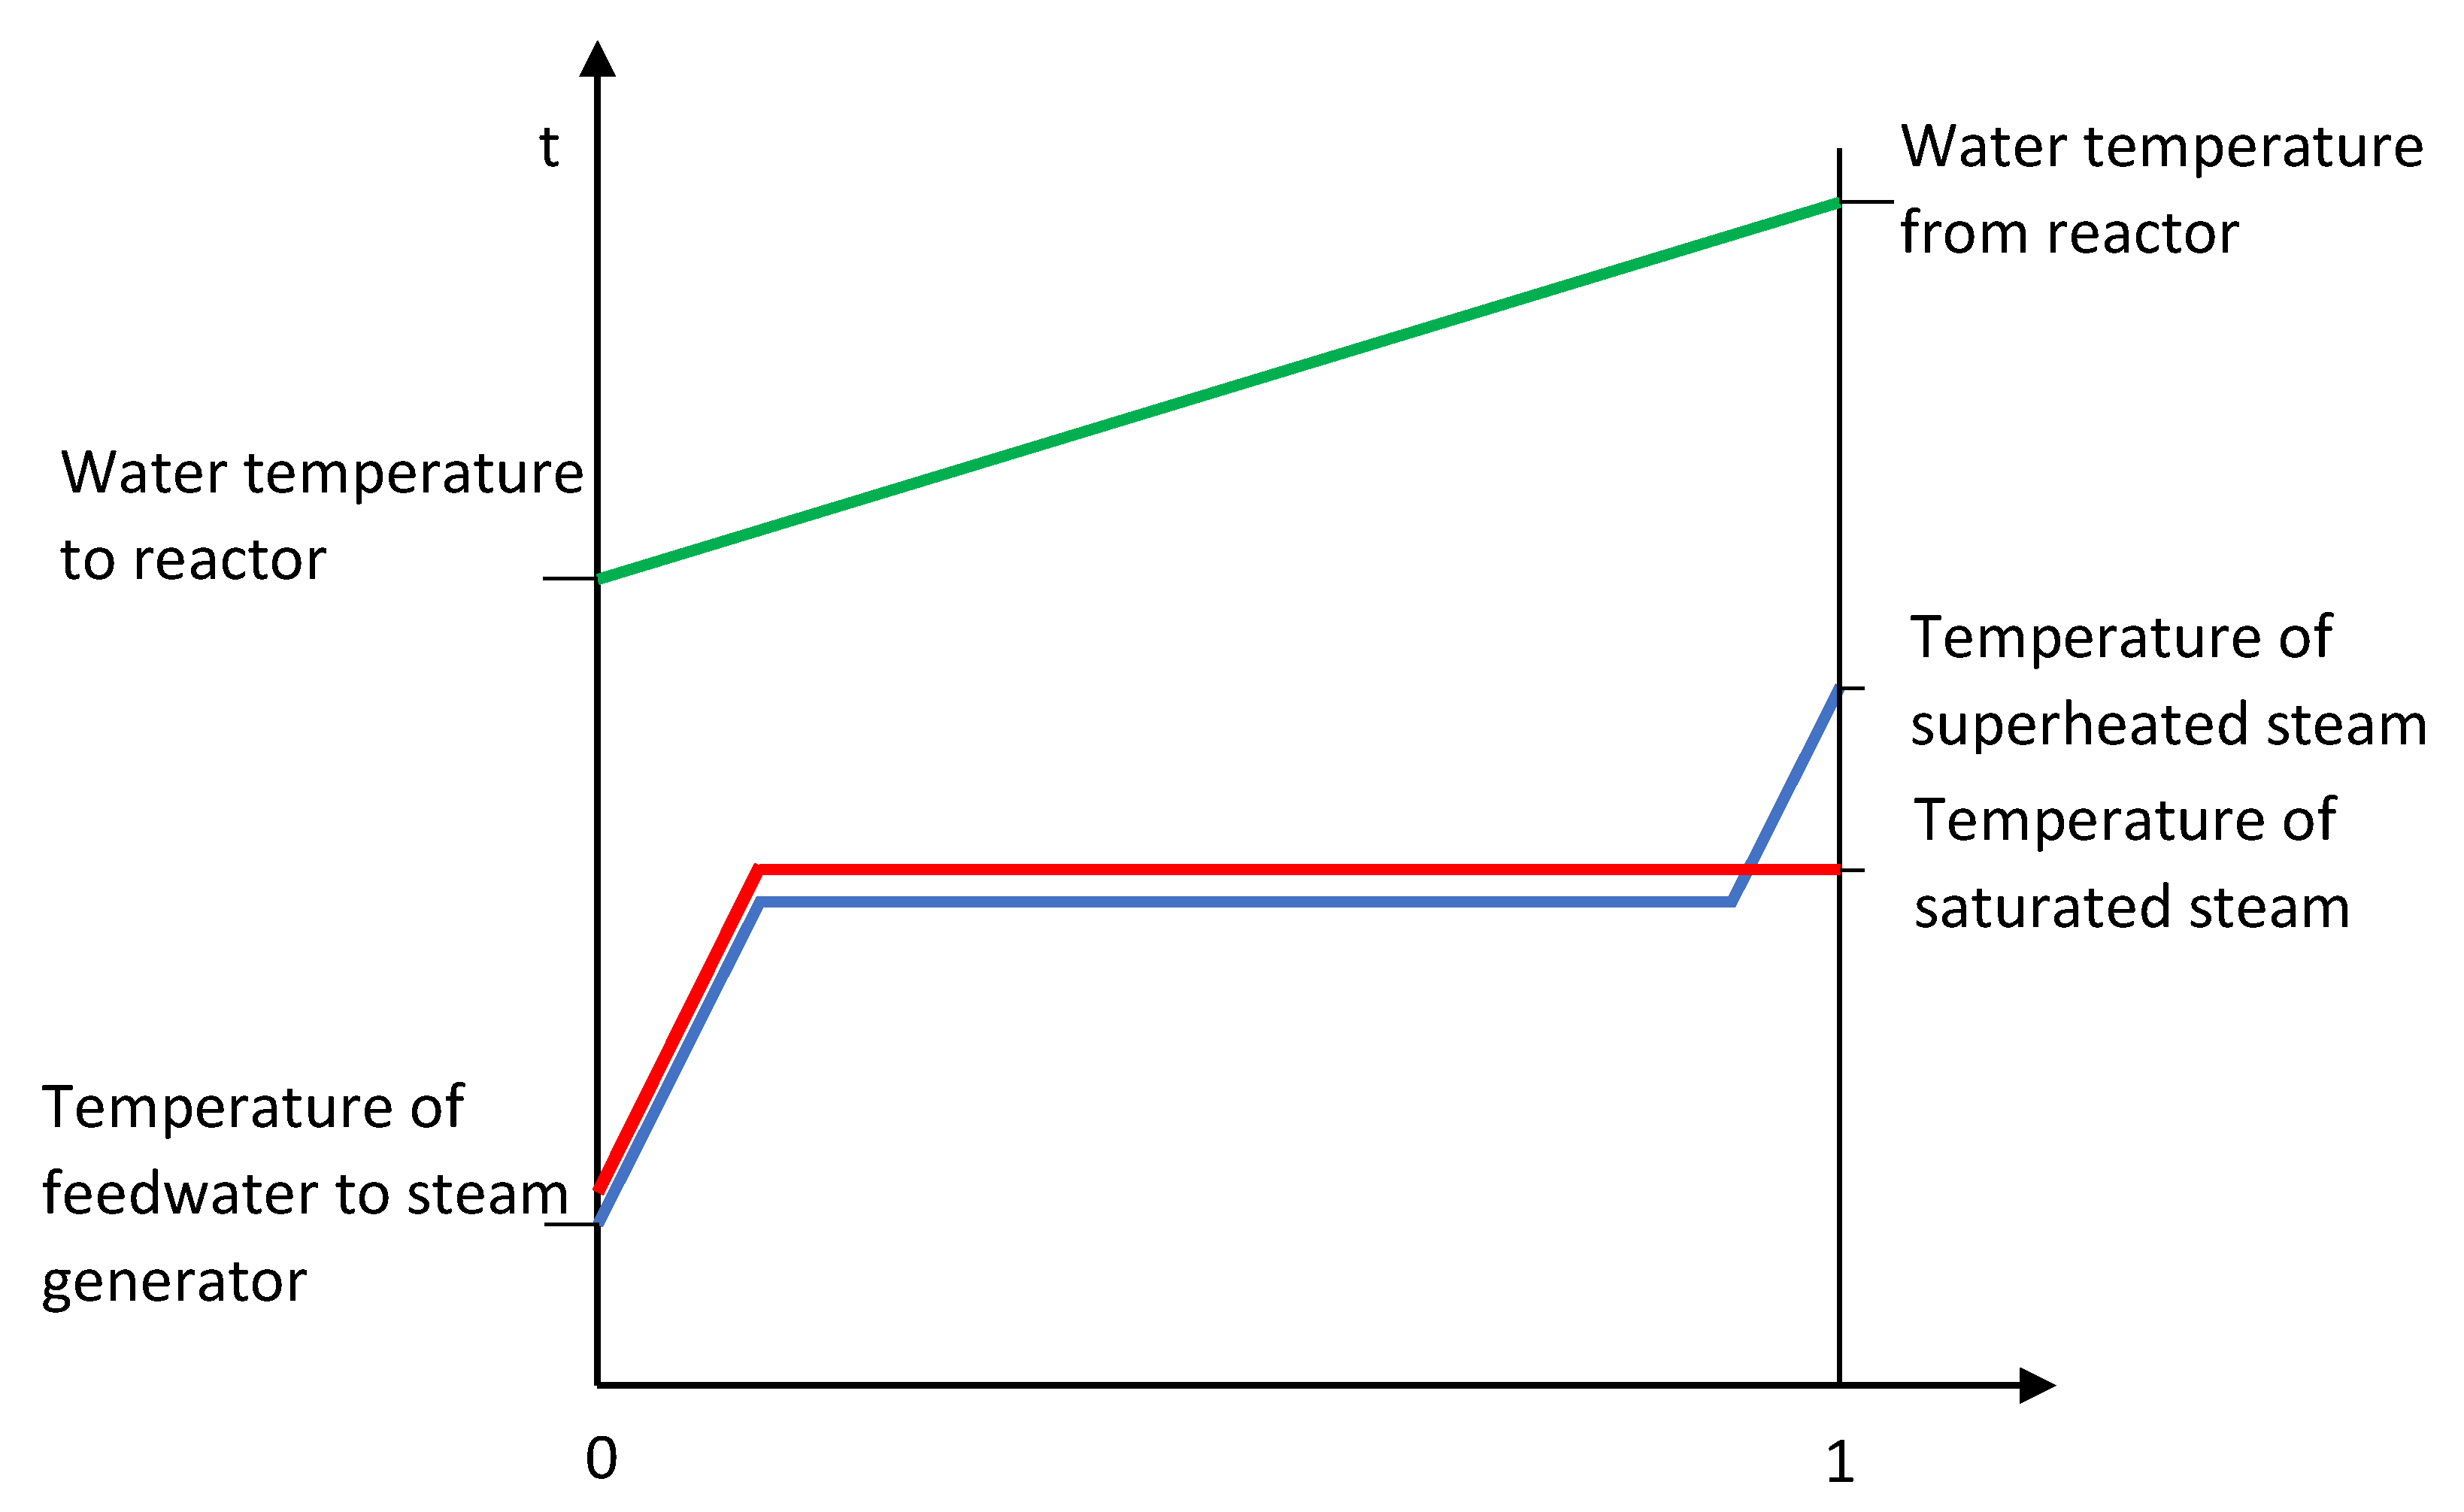
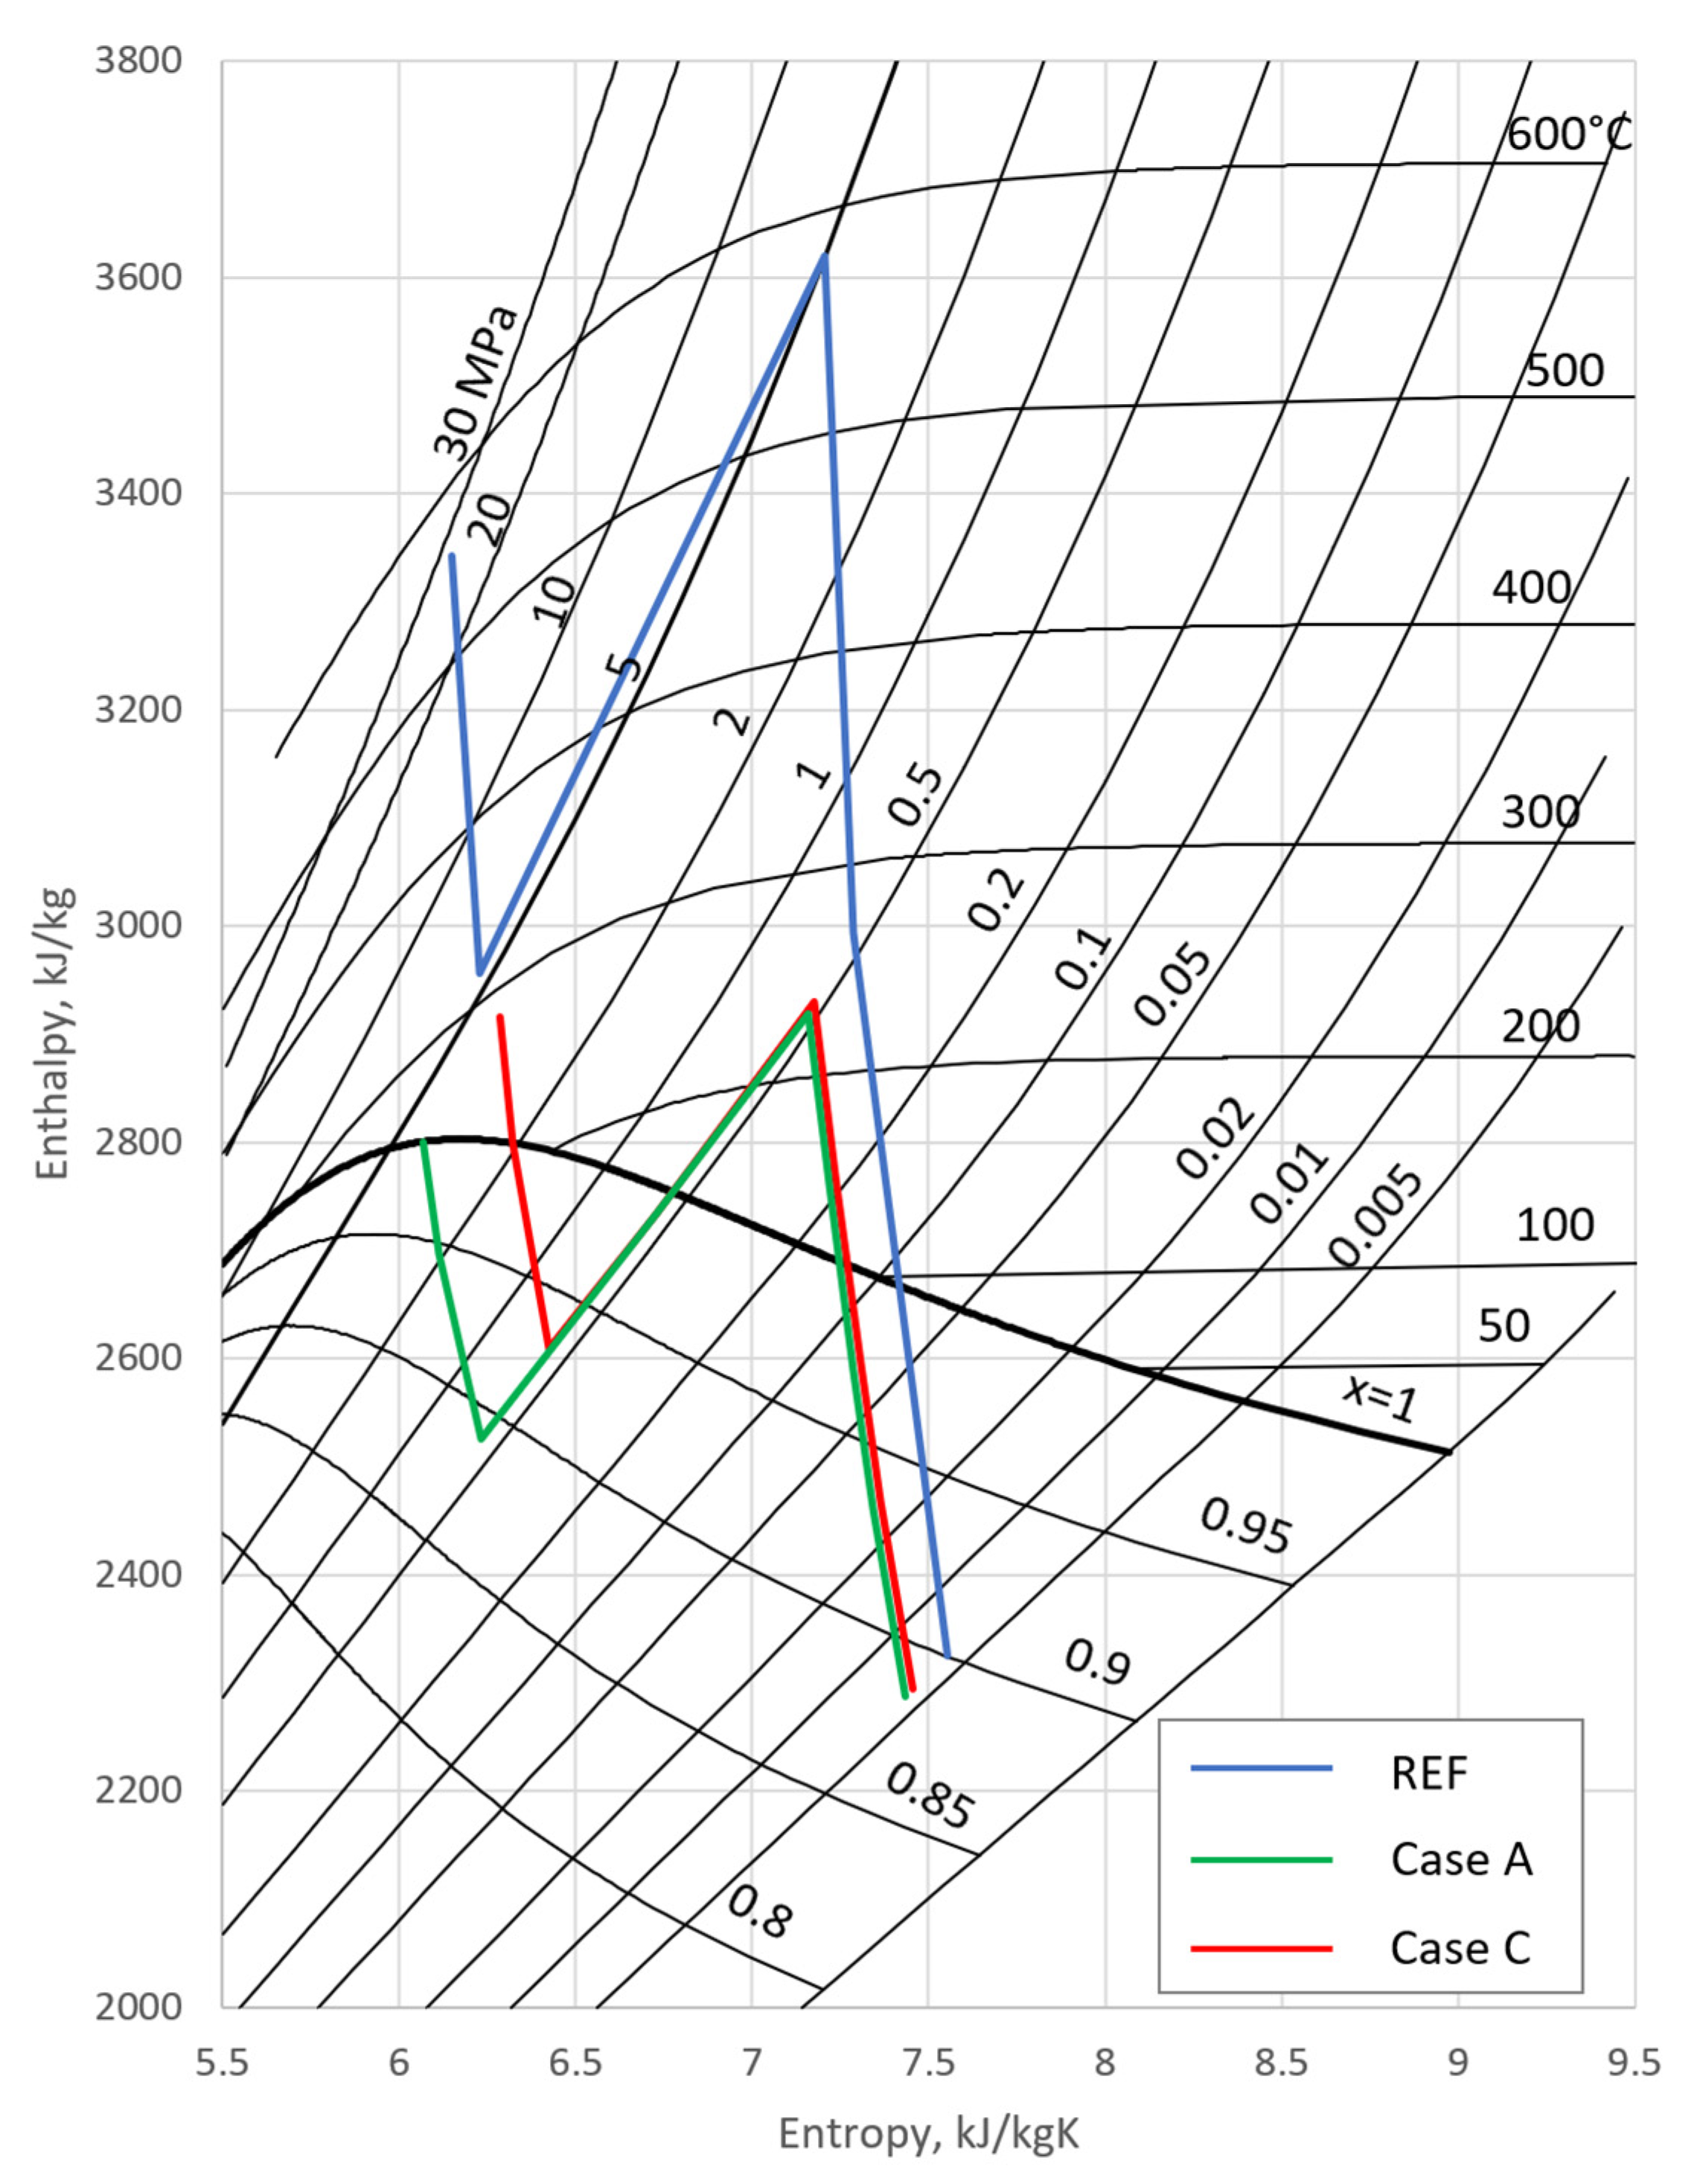
2.2.1. Nuclear Retrofit Case with Modernization of the Original IP Section (Case A–C)
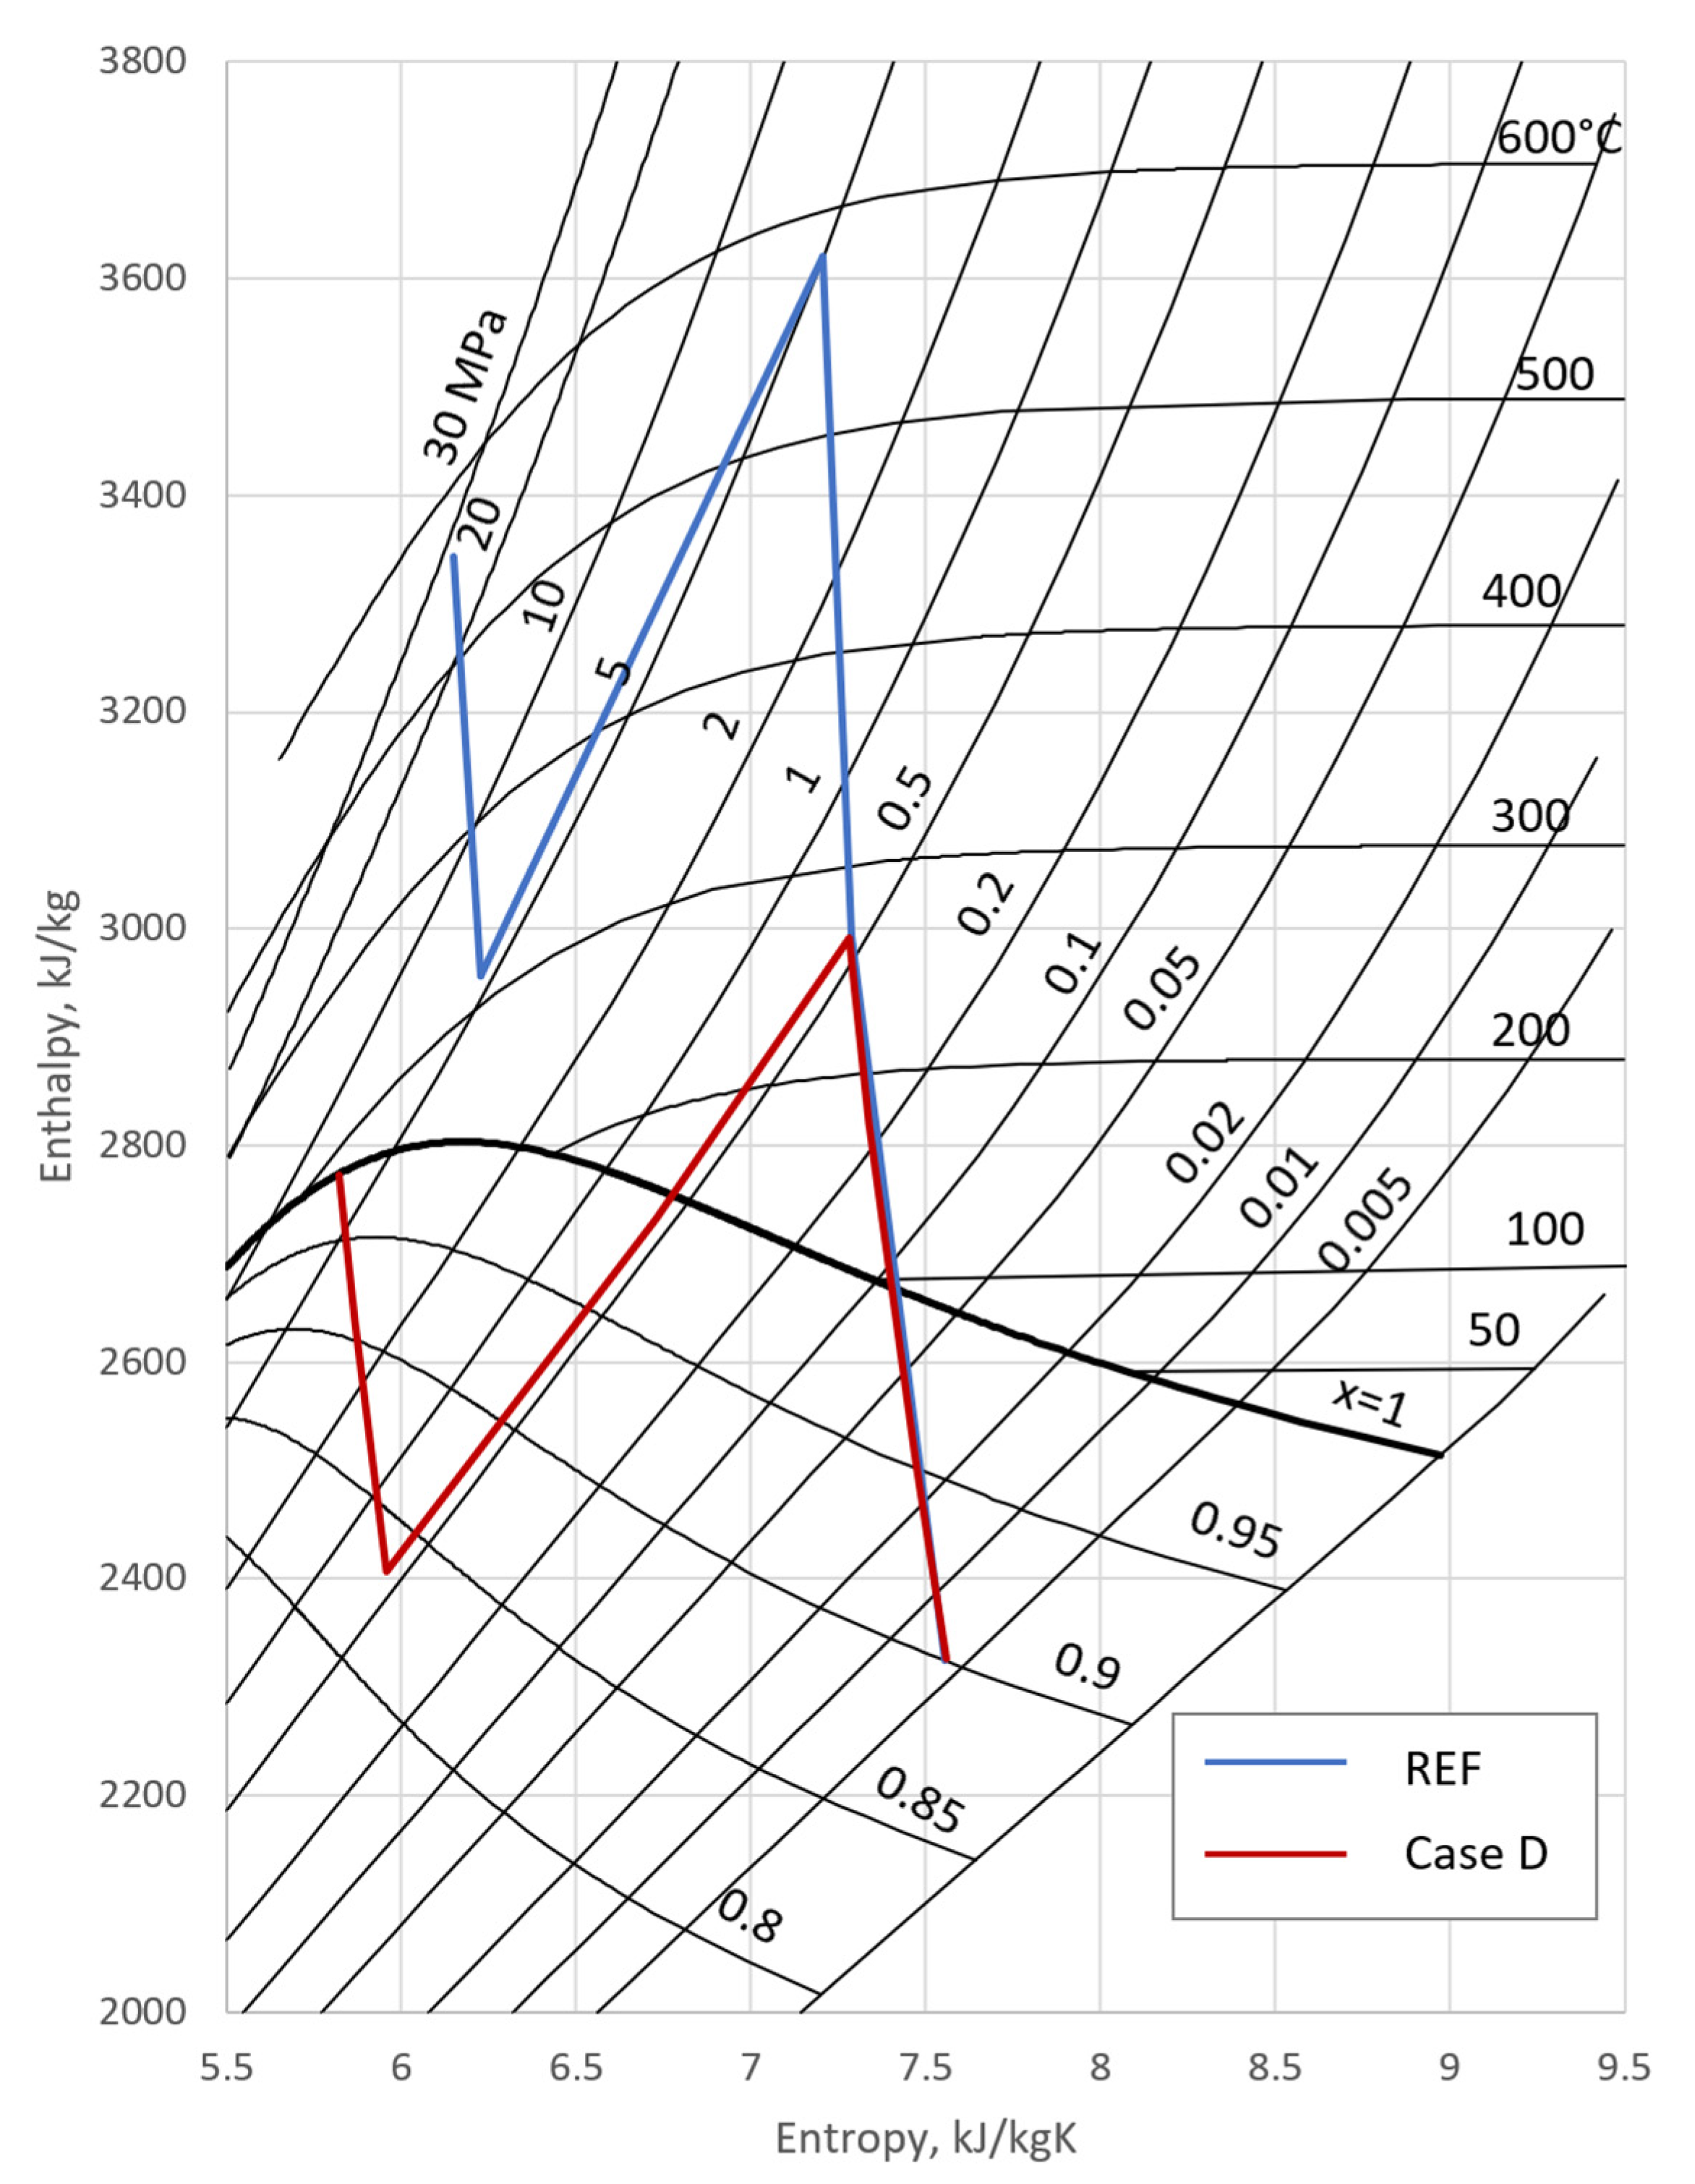
2.2.2. Retrofit Case with New HP Section (Case D)
- -
- saturated steam parameters at the turbine inlet: pressure of 7 MPa and corresponding saturation temperature of 285 °C,
- -
- the LP section operating conditions will not change compared to design values: the steam mass flow and parameters upstream the LP section are the same as for the 460 MW turbine,
- -
- the pressure at the HP section exhaust is higher than the pressure at the LP inlet due to pressure losses in the moisture separator and in the steam reheater,
- -
- the deaerator pressure is equal to the design pressure value at the reference load,
- -
- the steam bleed parameters in the HP section make it possible to heat feed water at the inlet the steam generator to the assumed temperature of 230 °C.
2.3. Economic Assessment
2.3.1. Assessment Indicators
2.3.2. Assumptions
3. Results
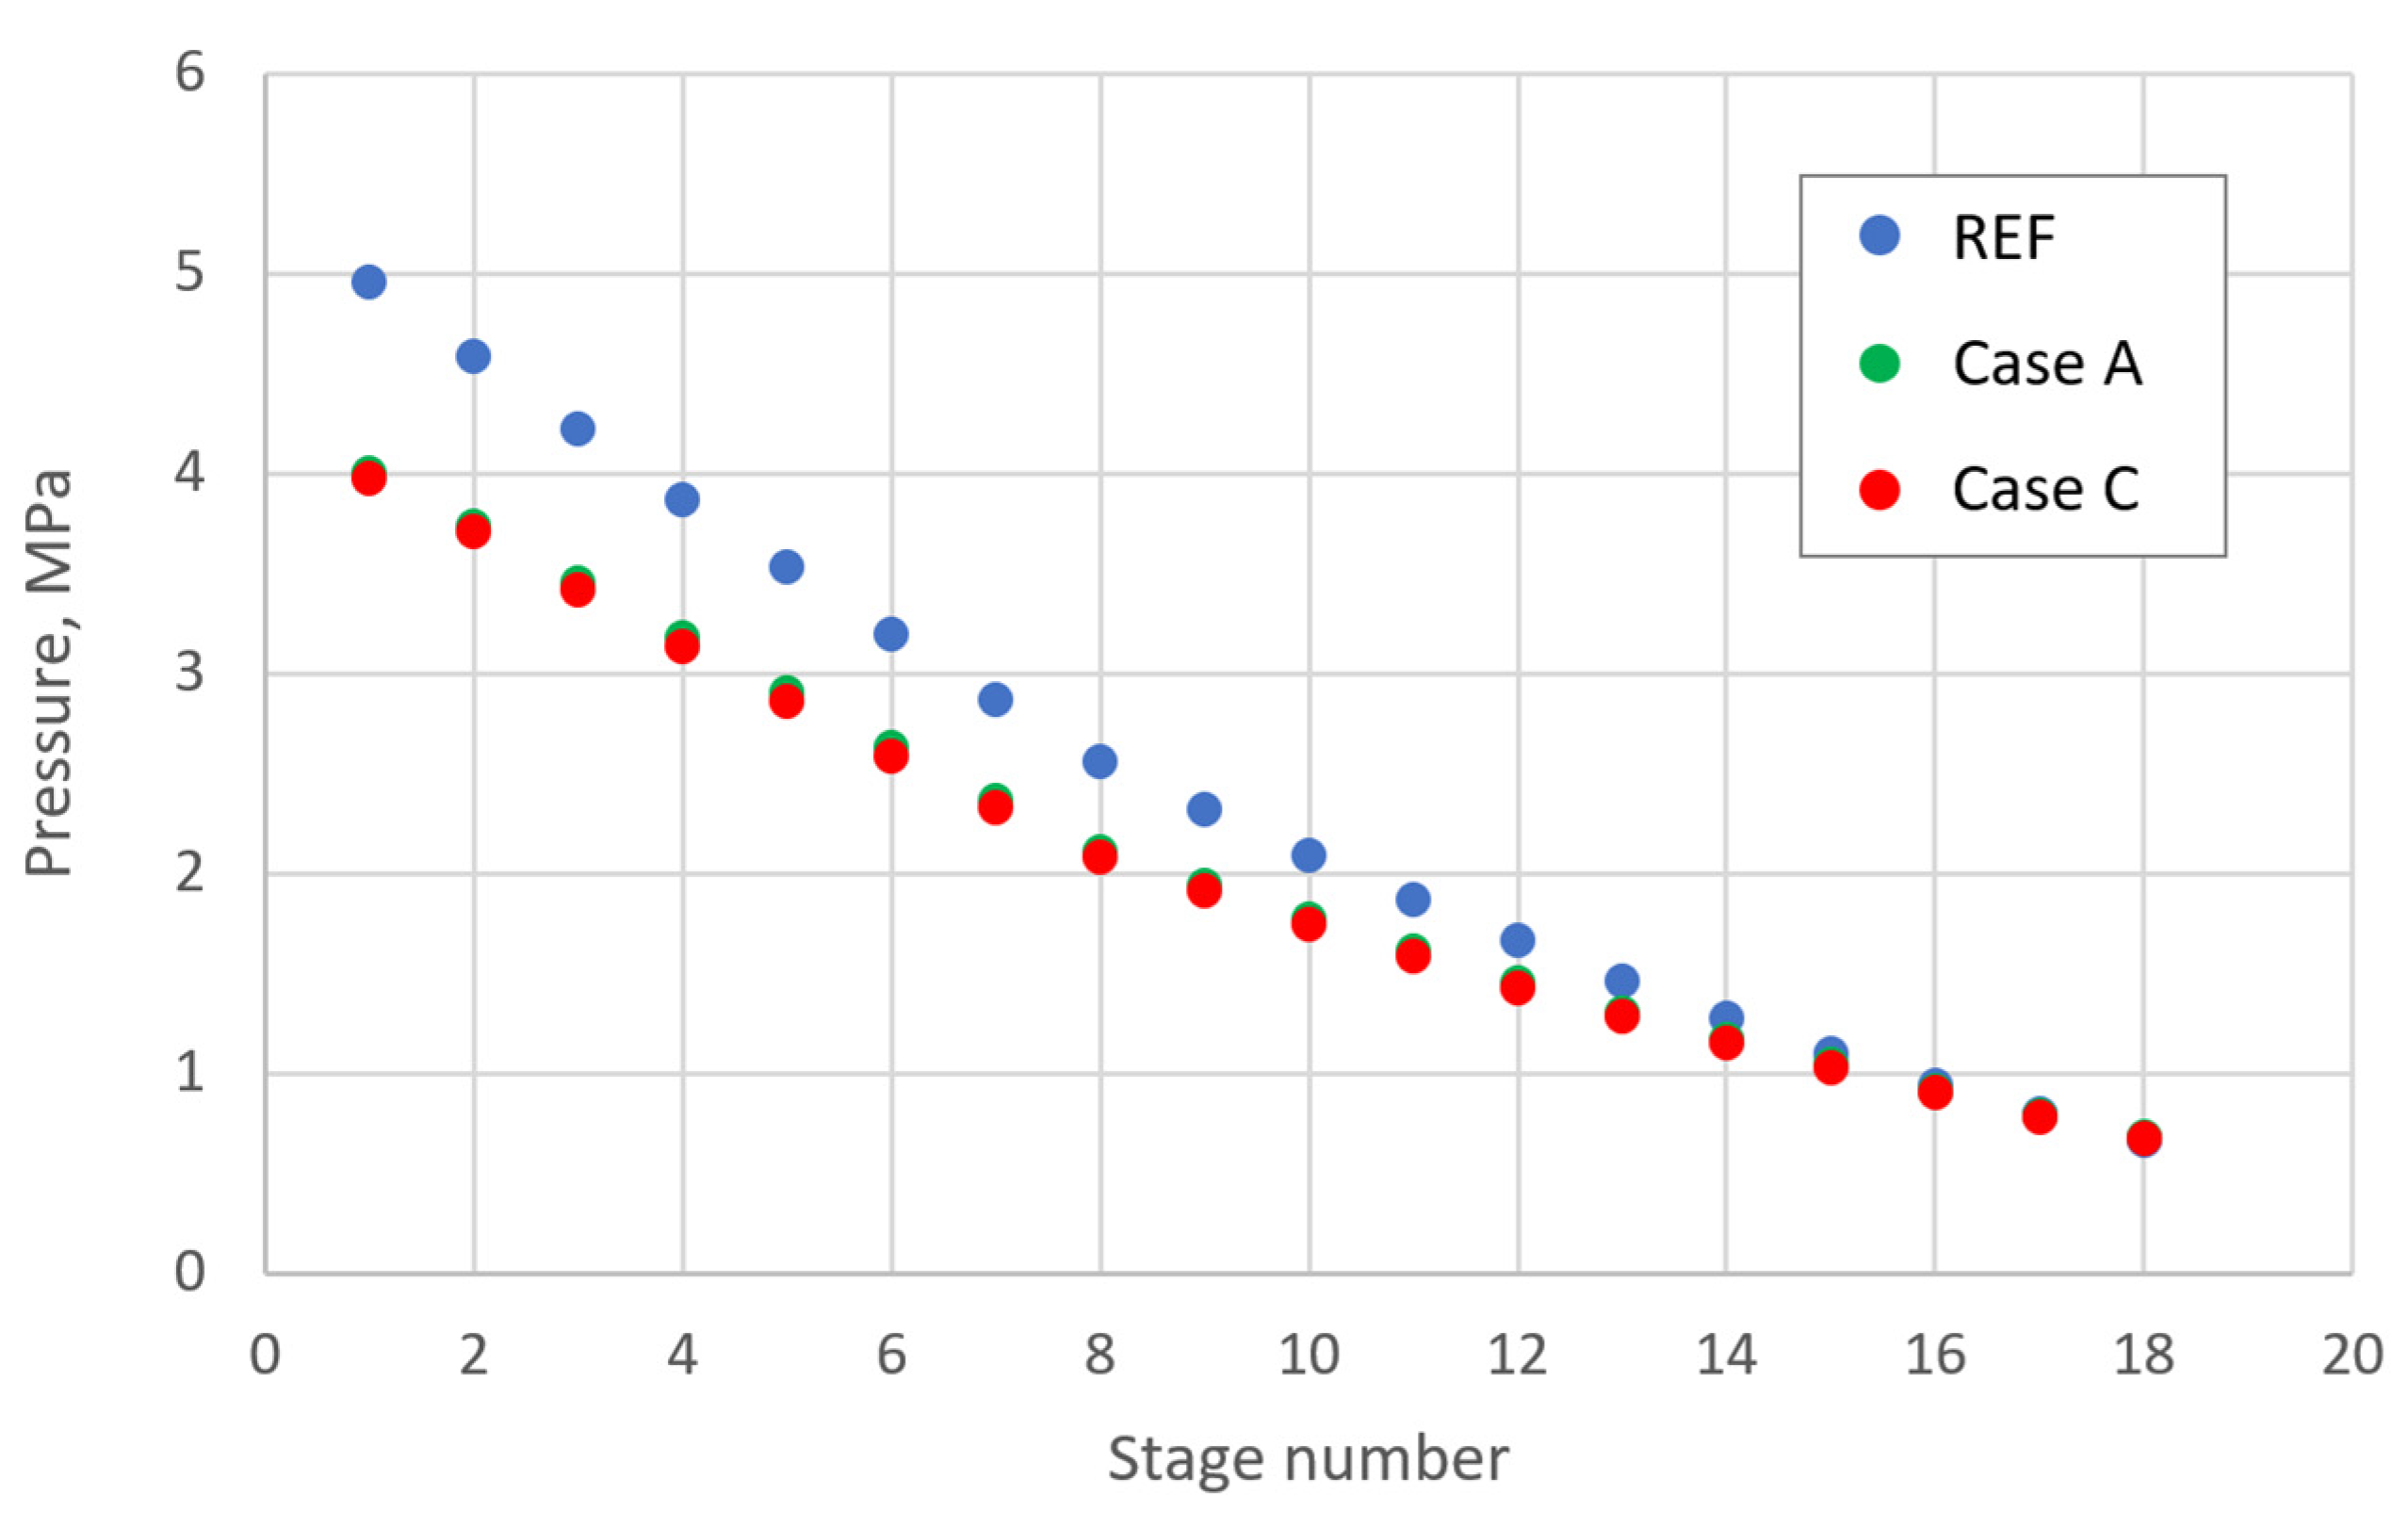
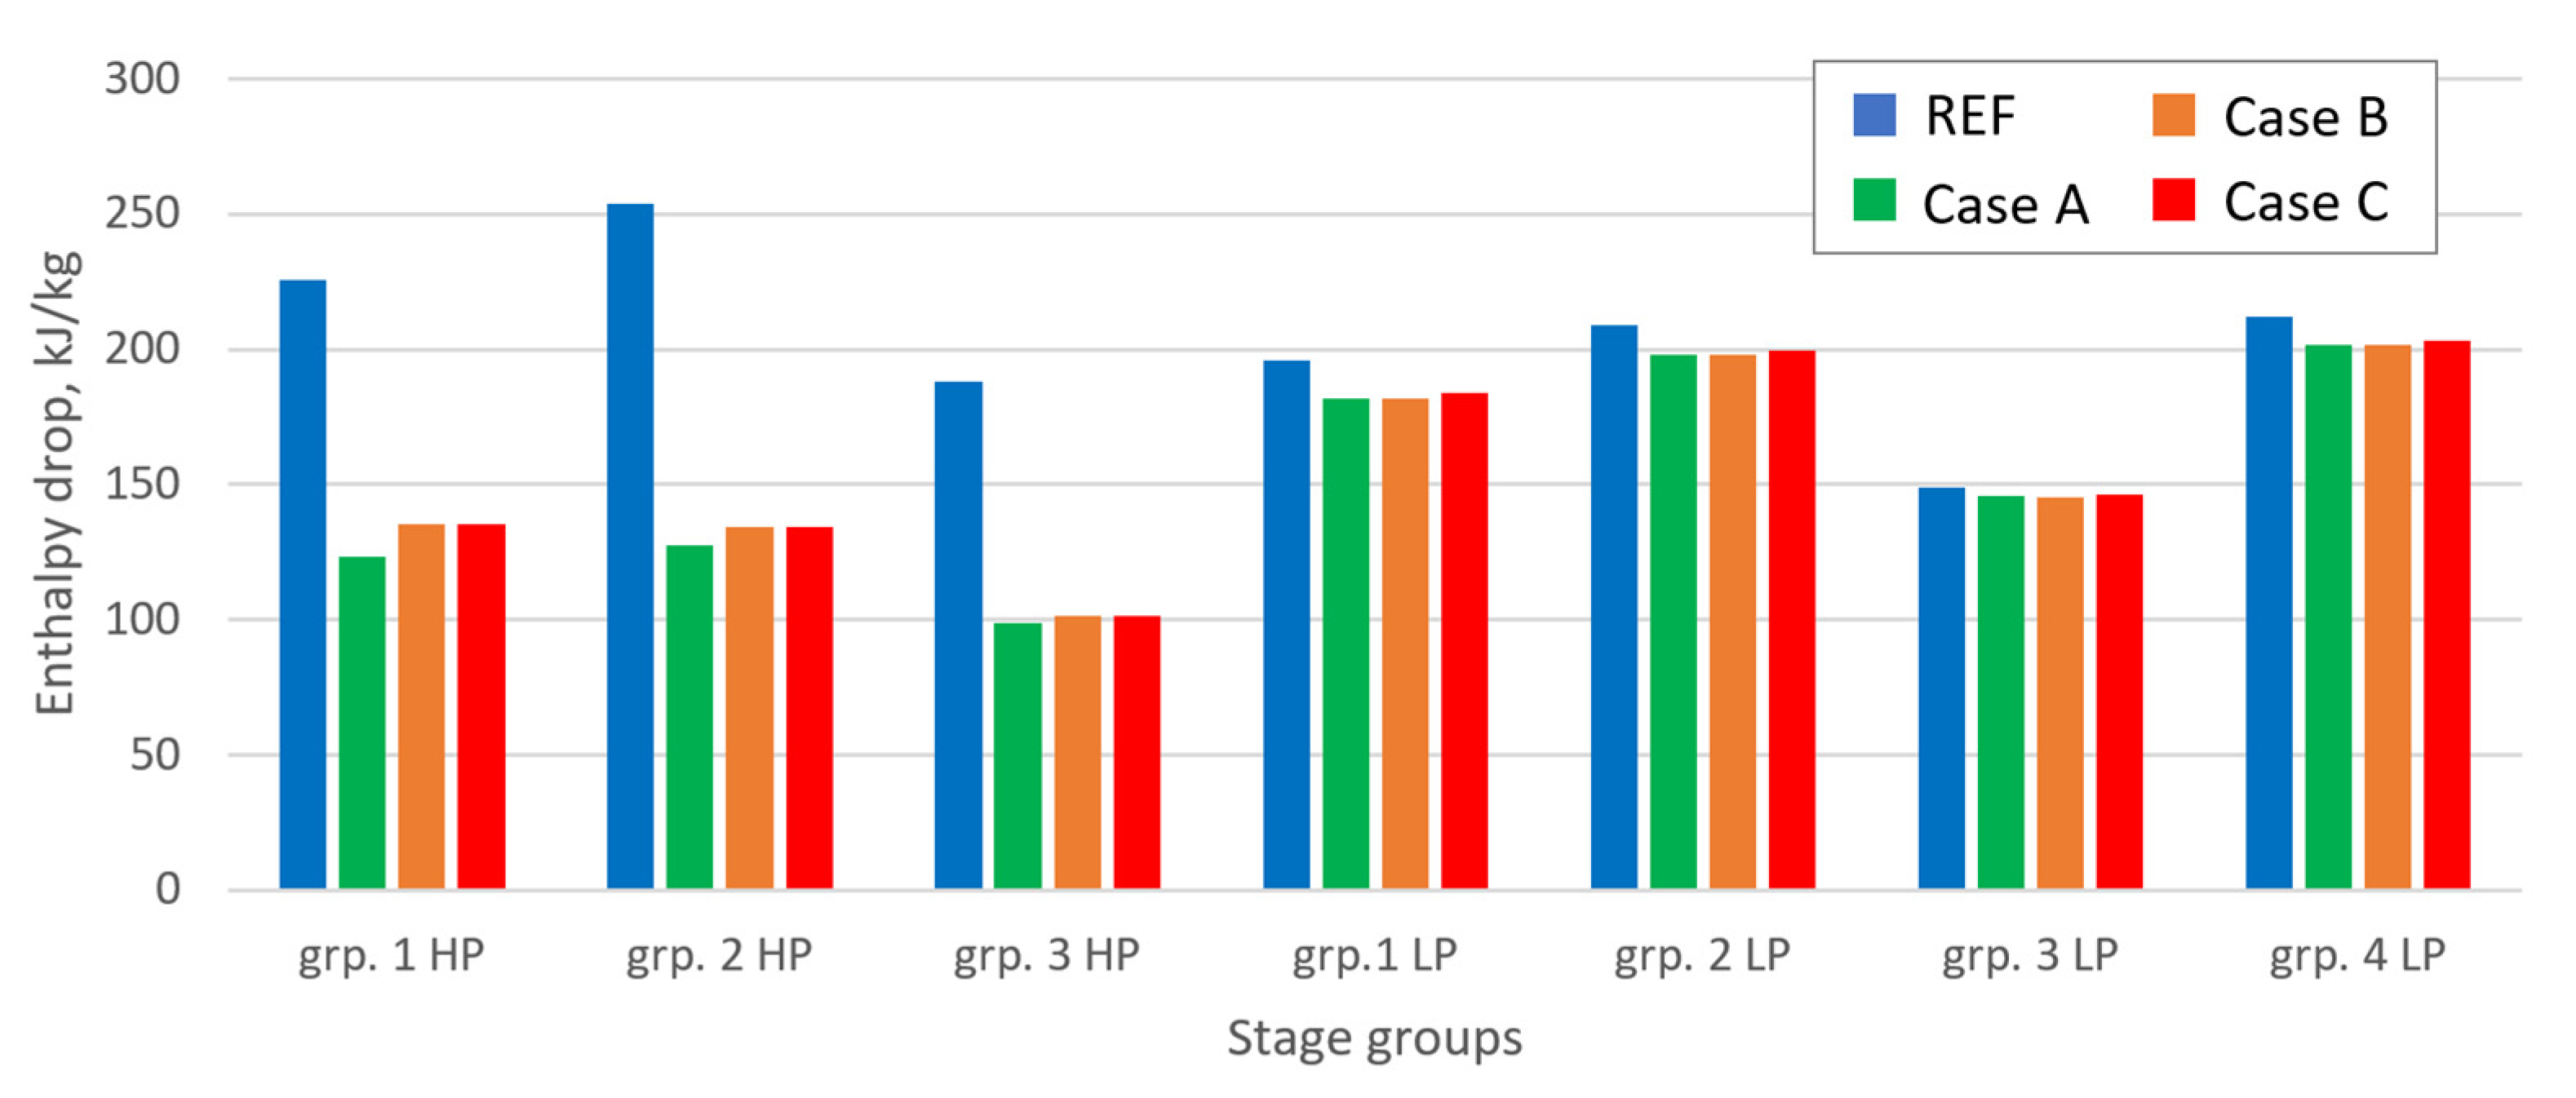
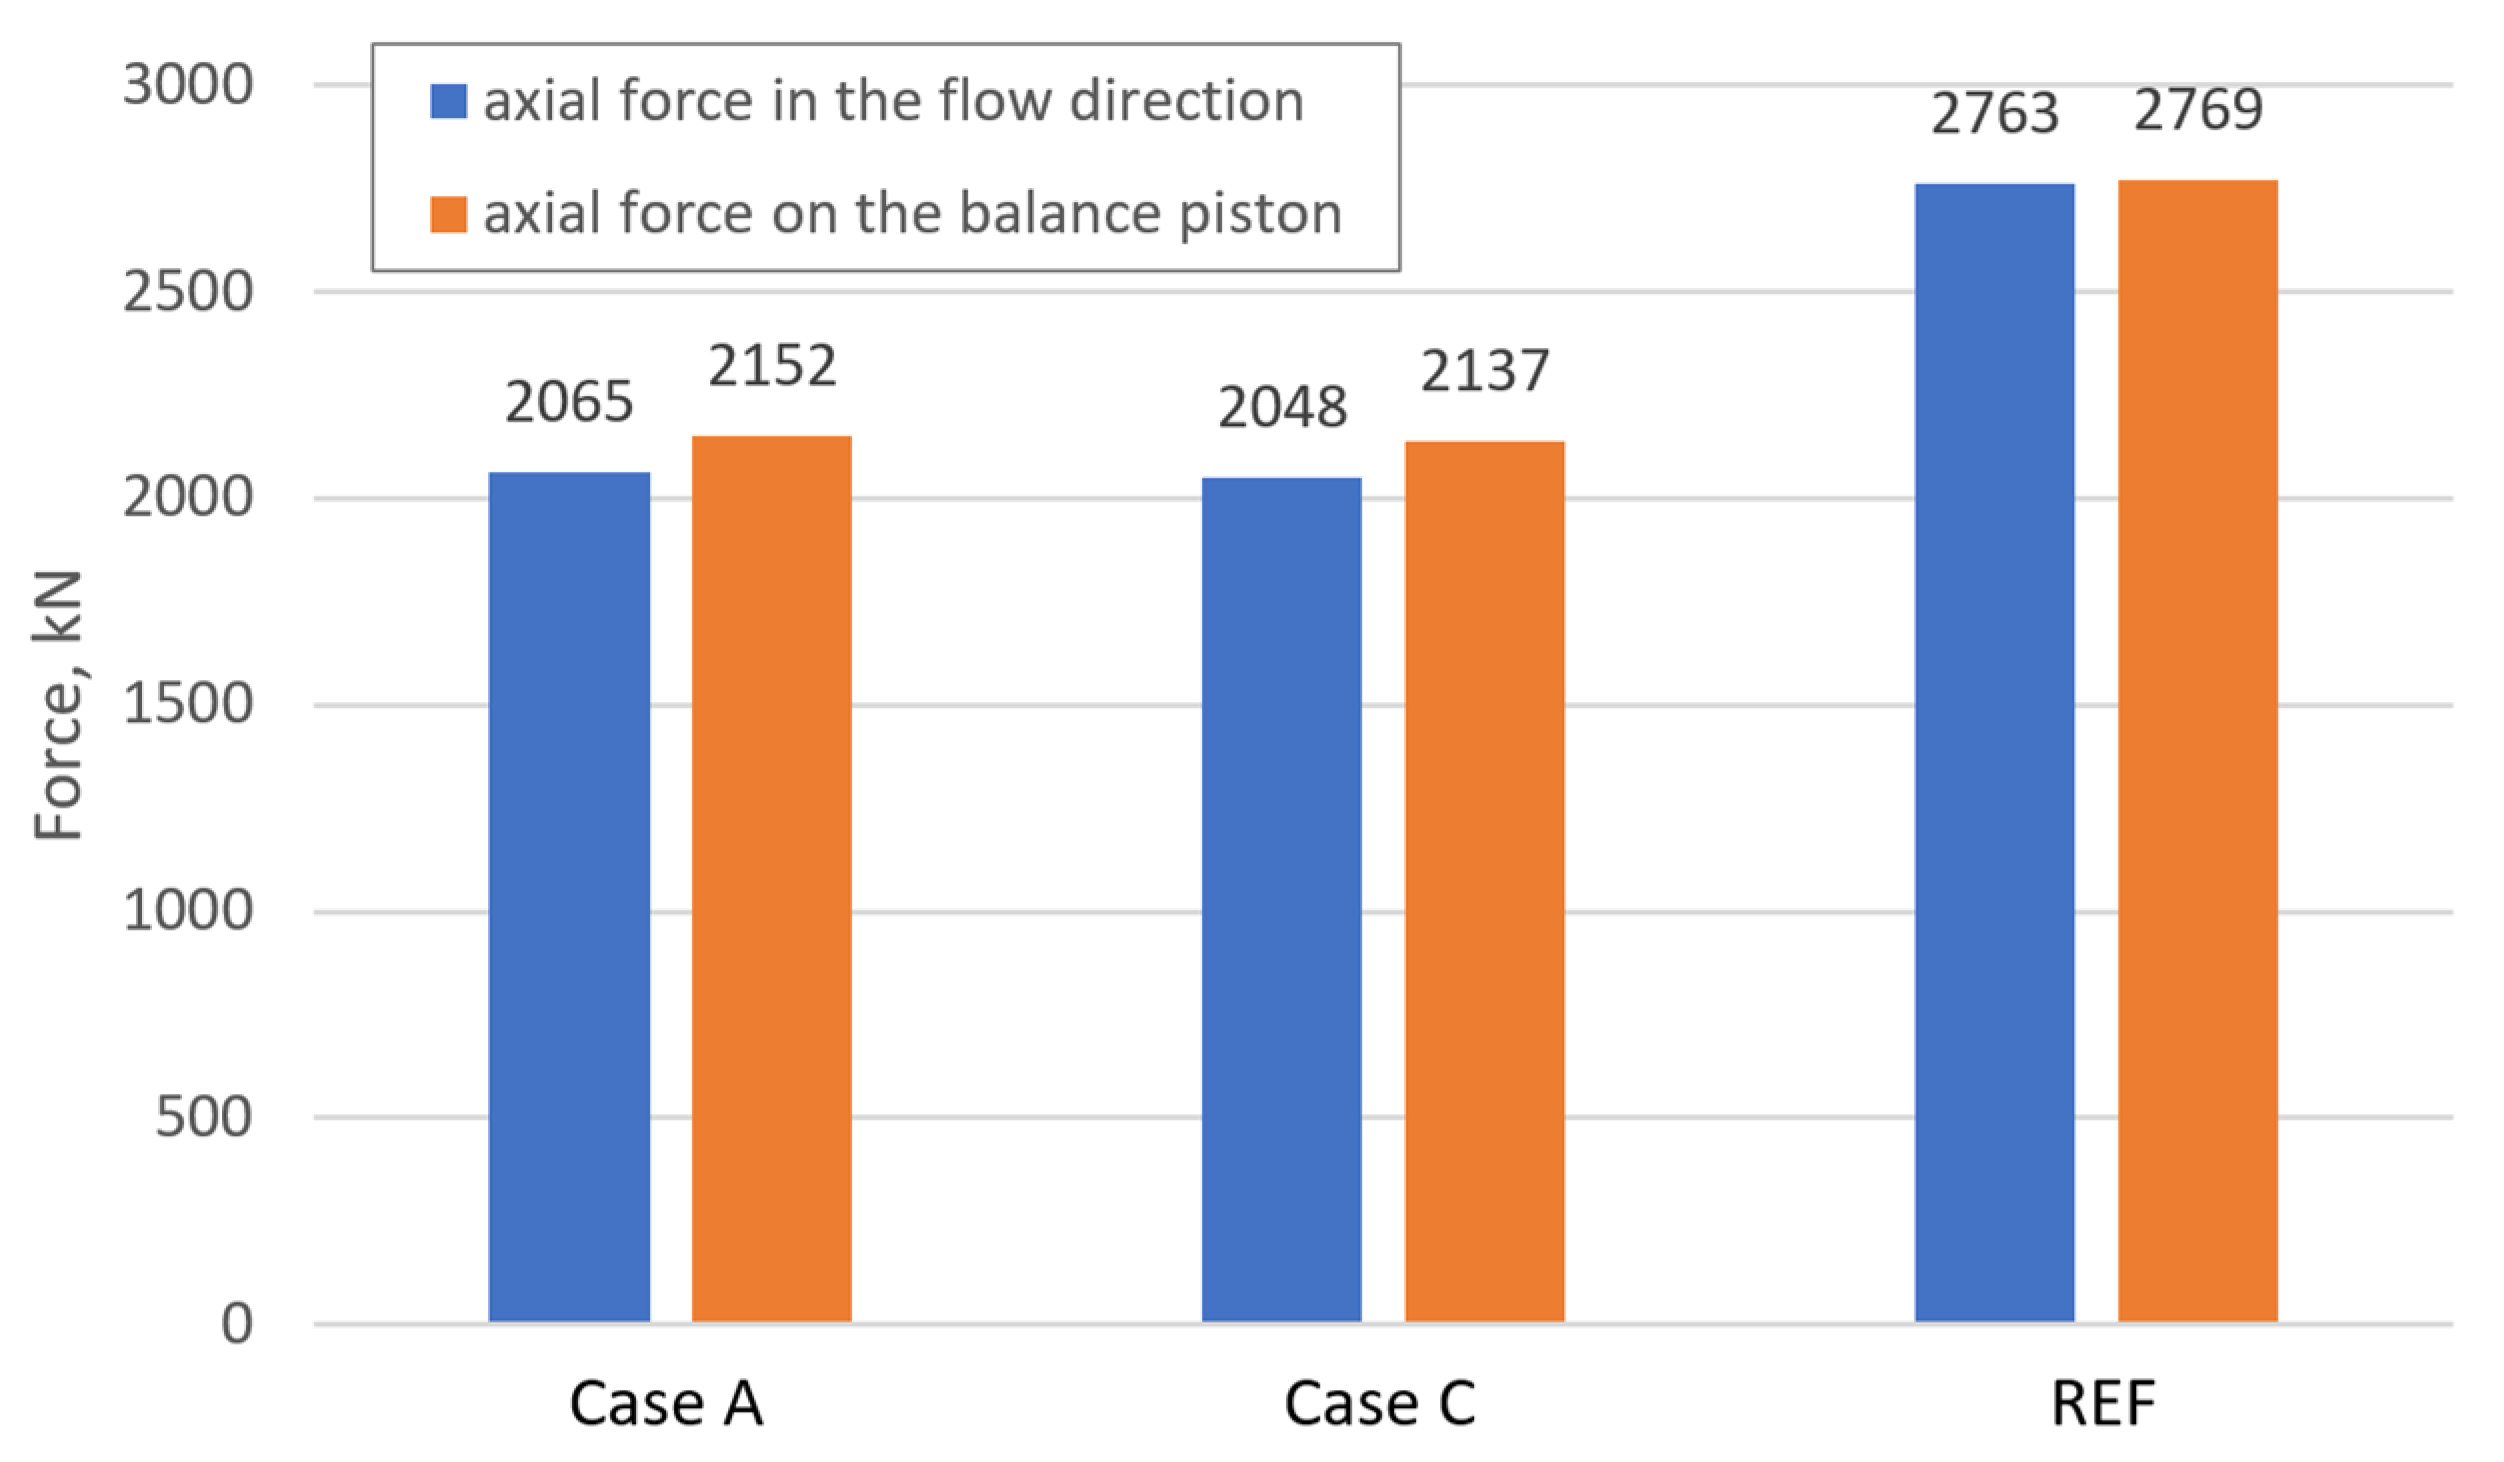
3.1. Technical and Energy Performance Assessment Results
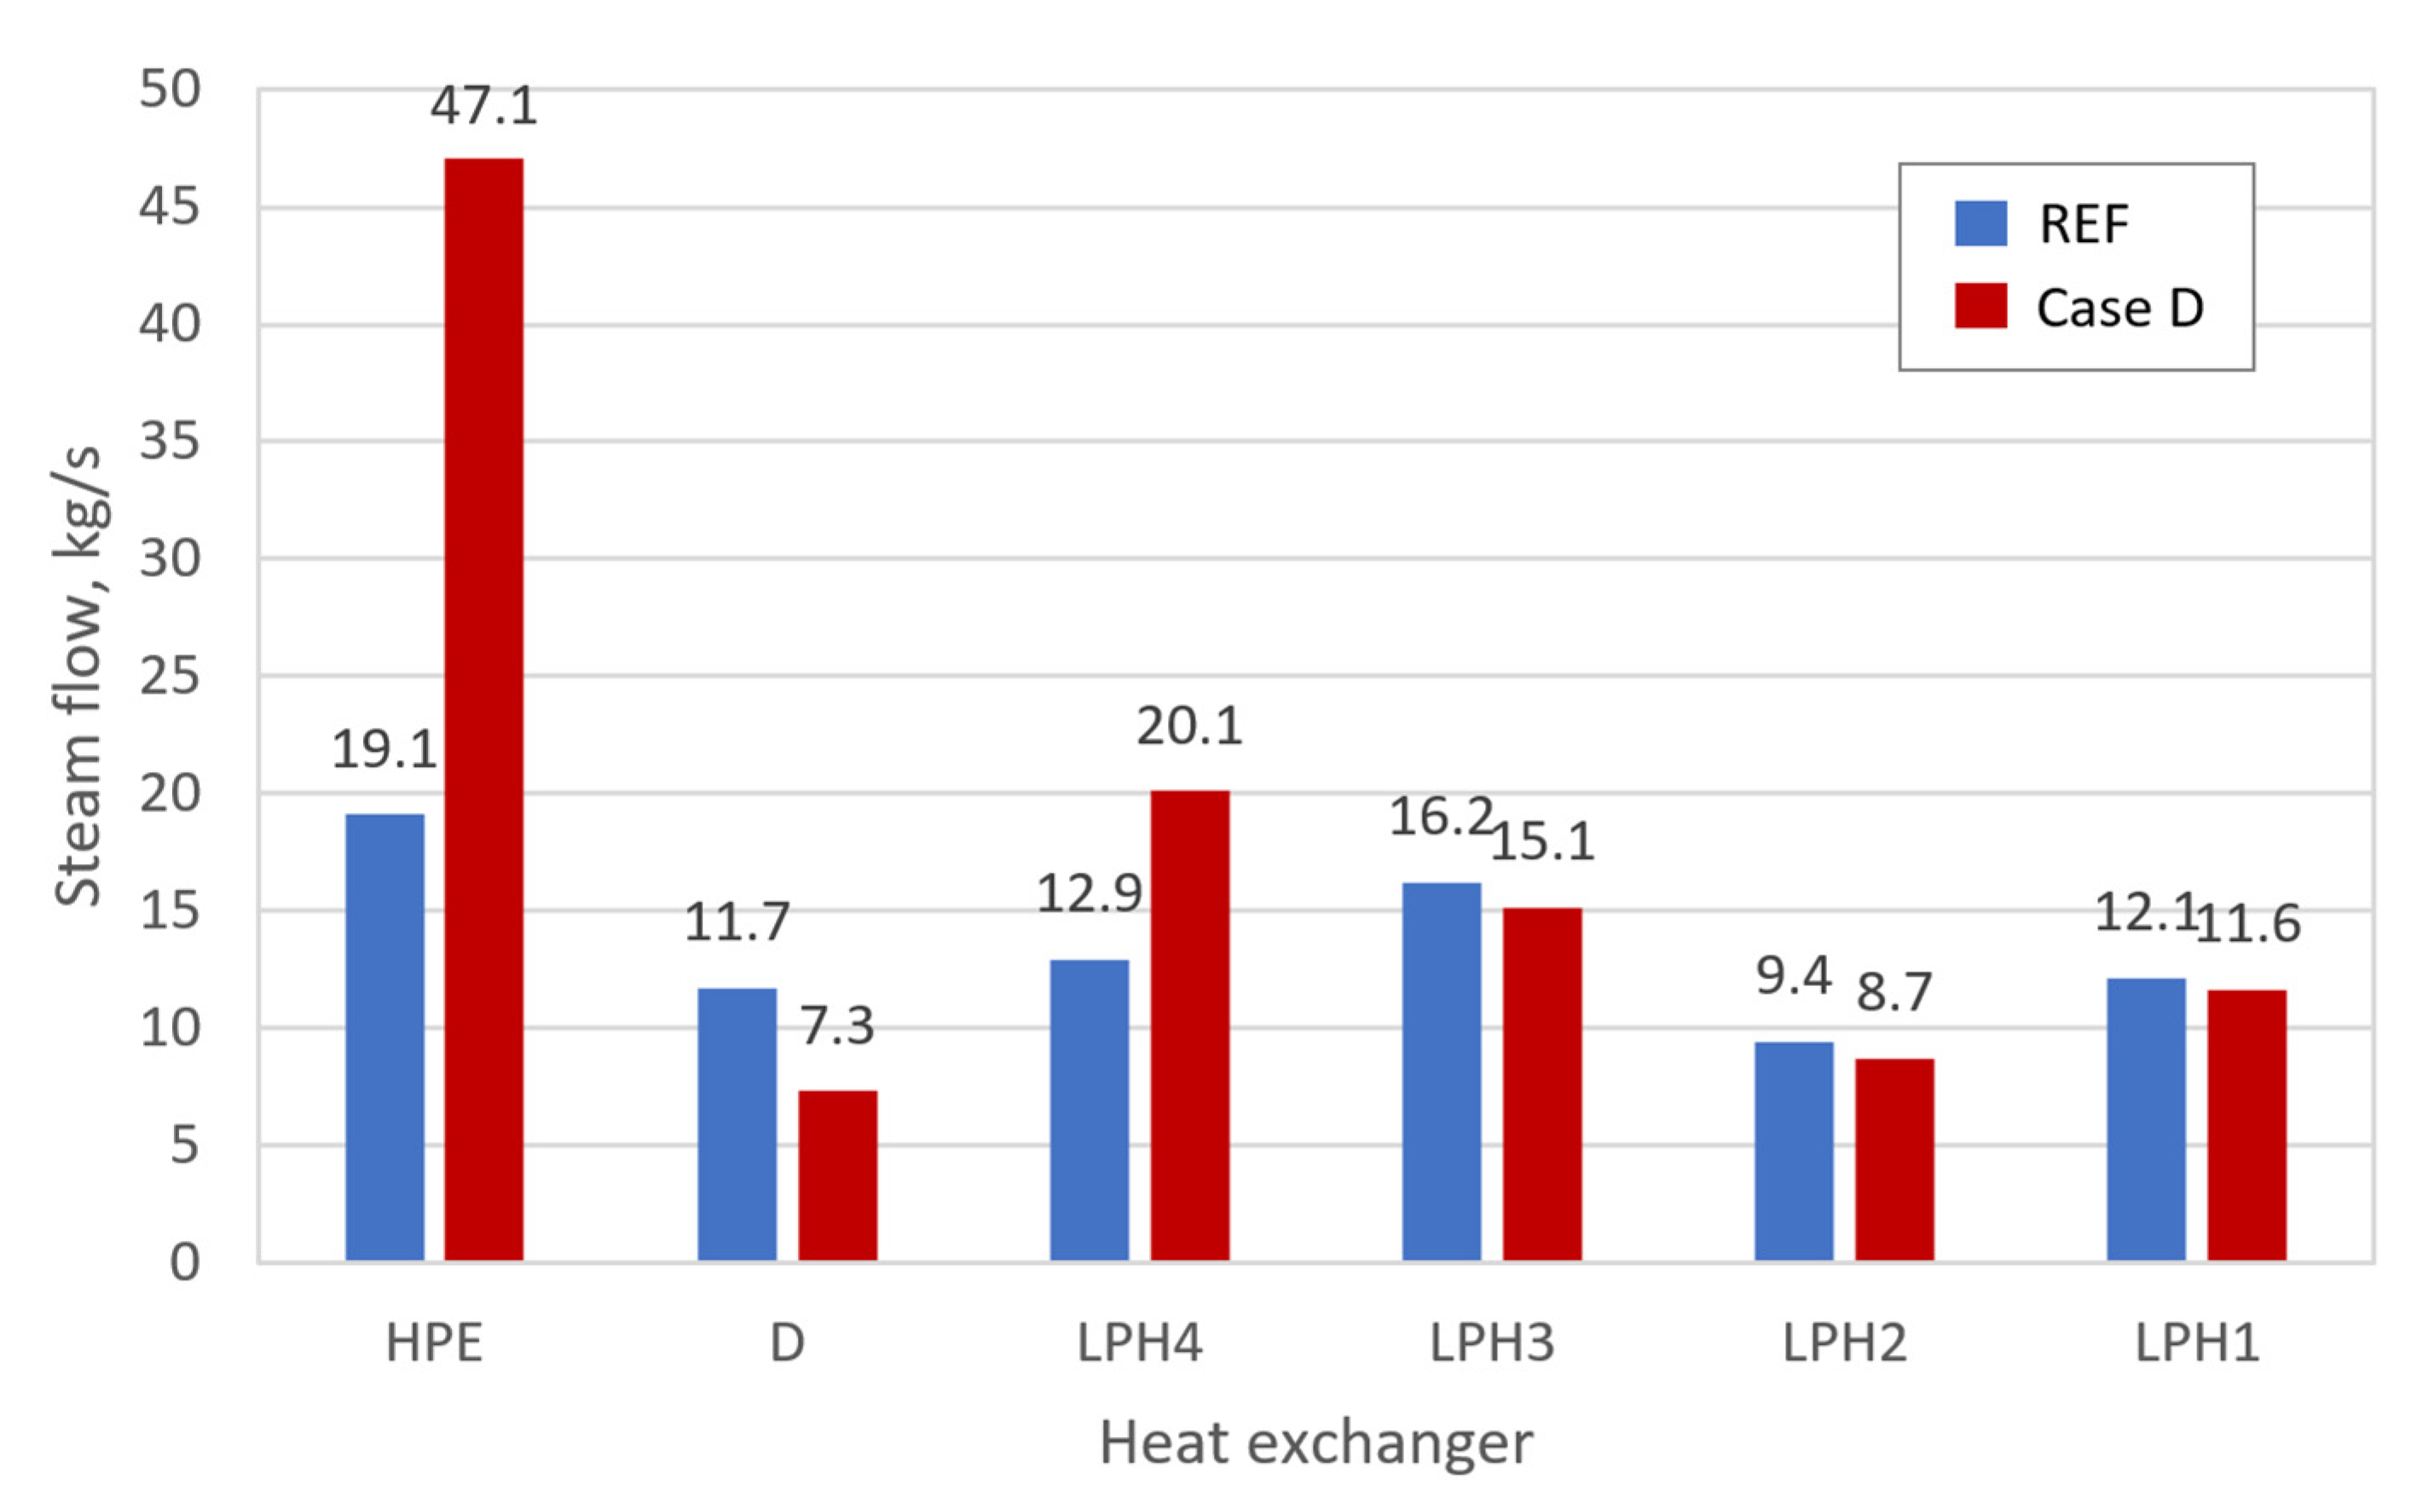
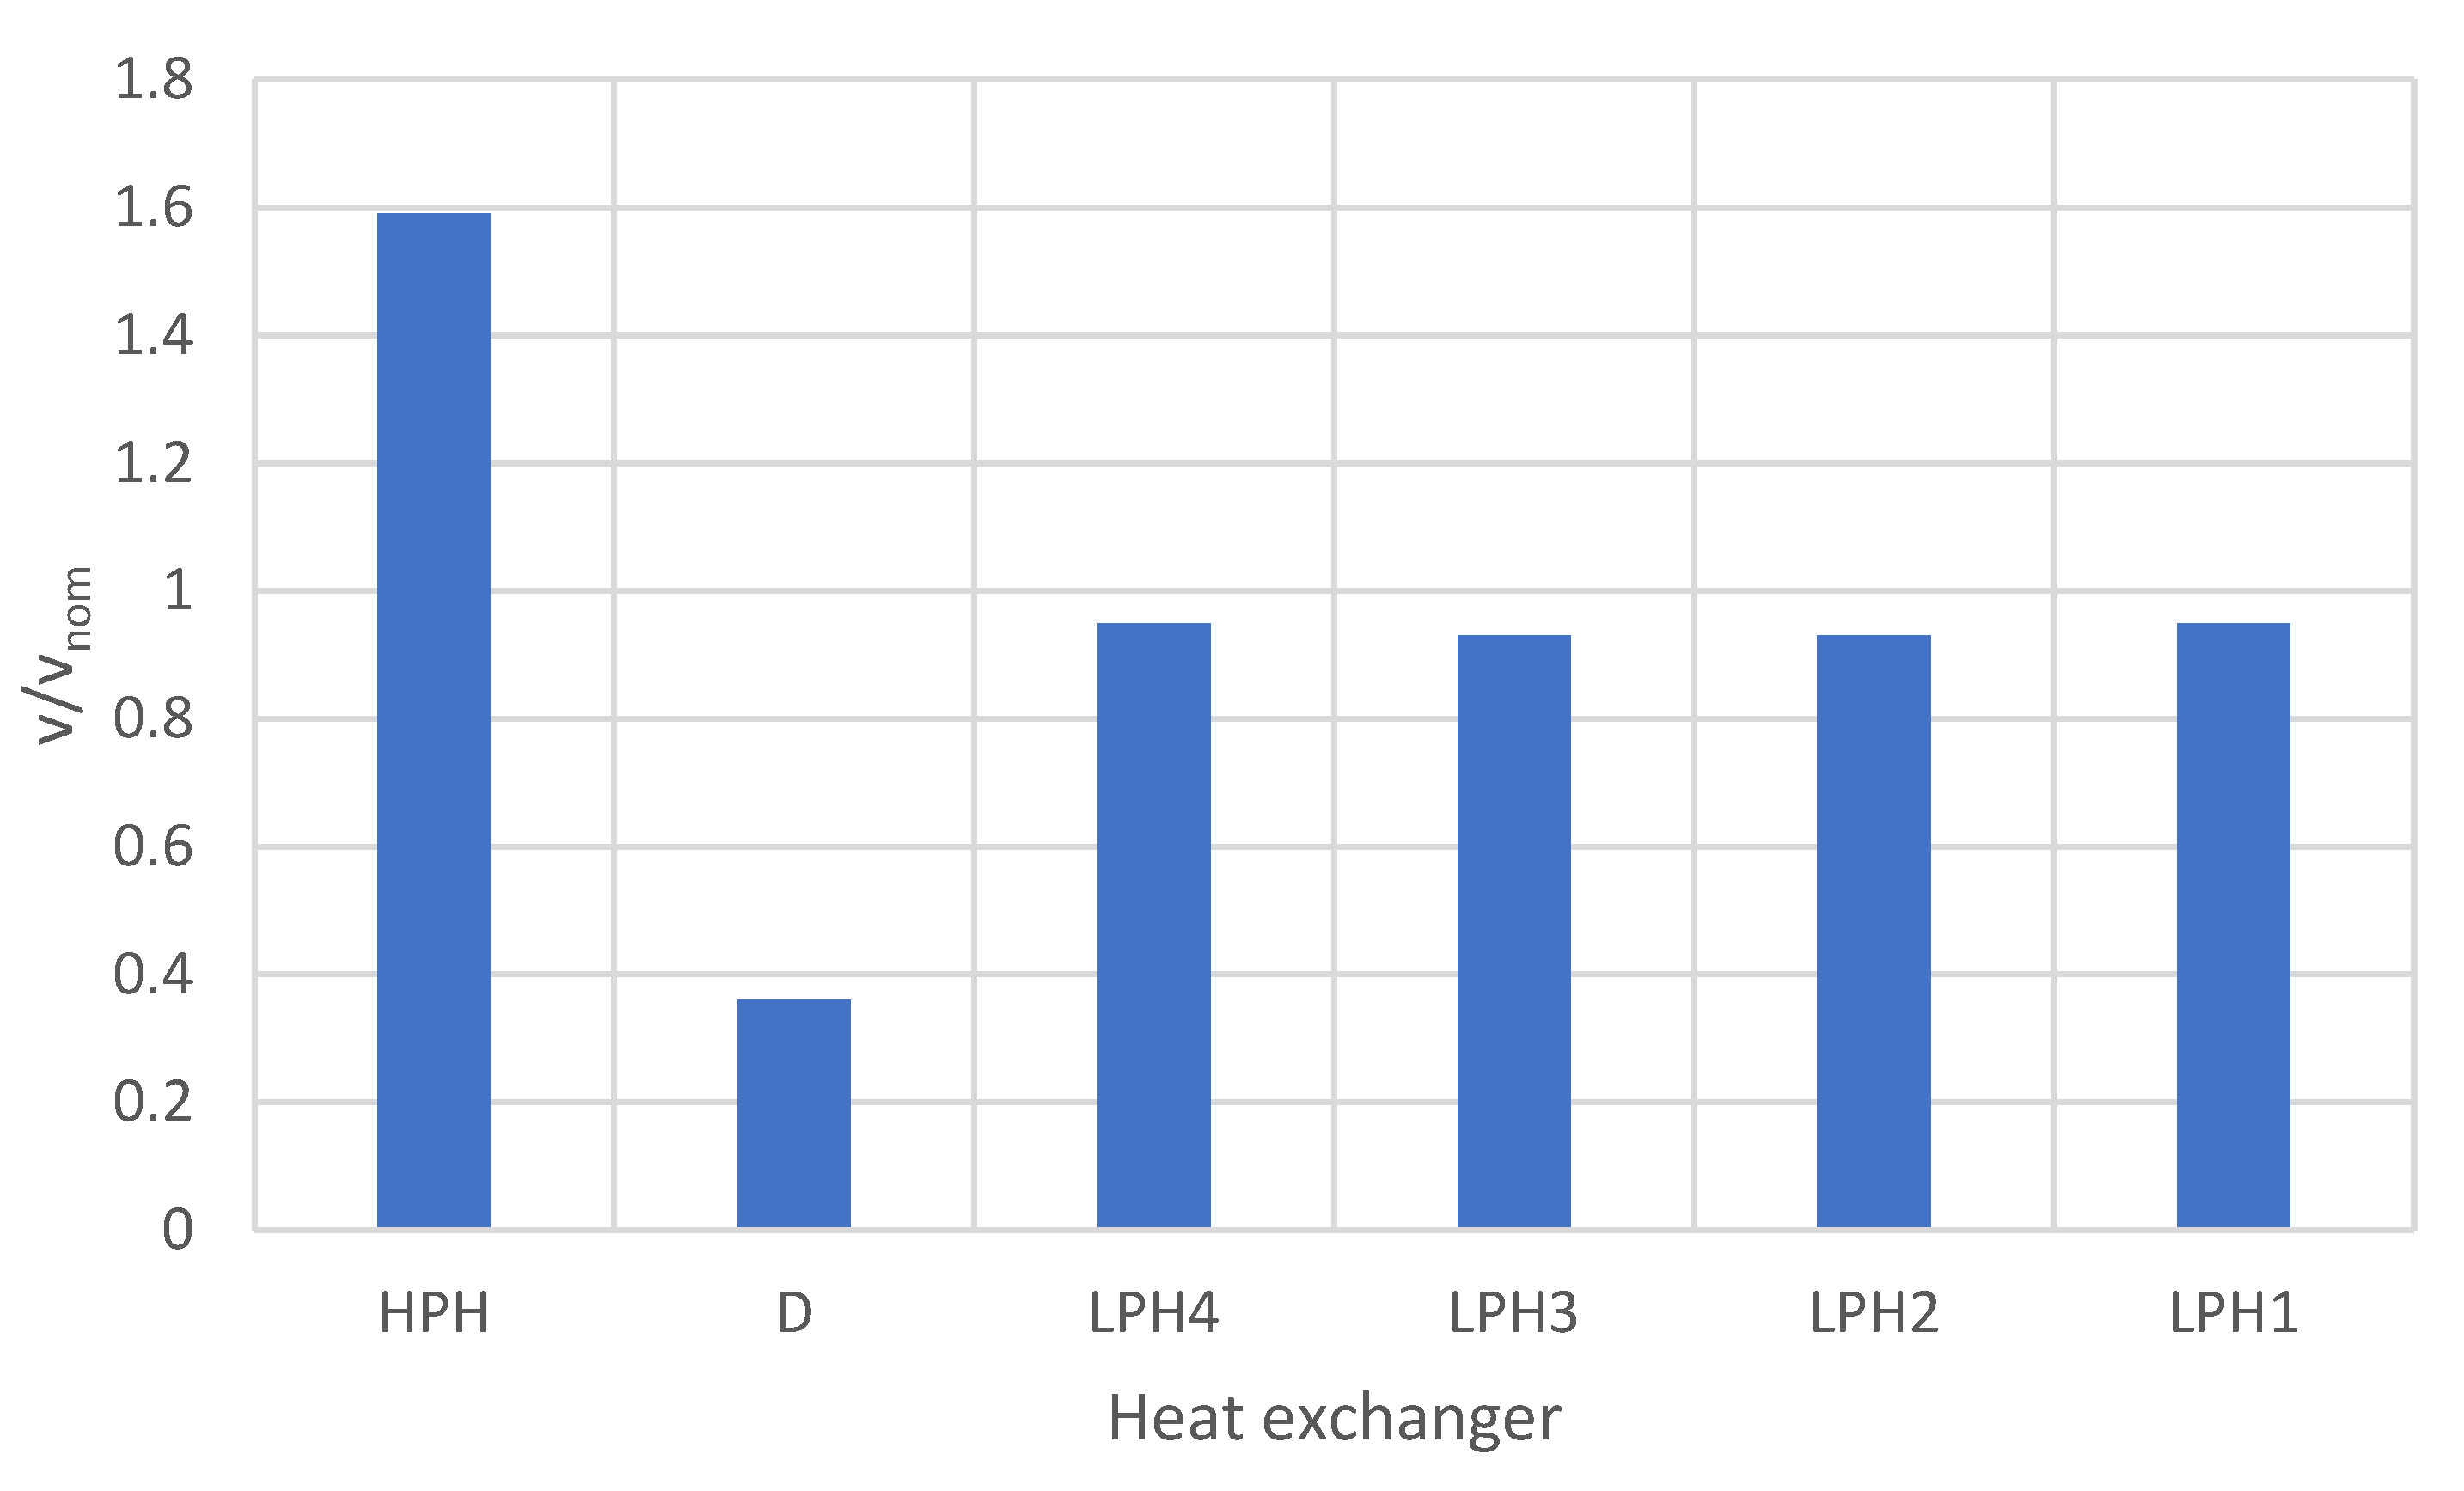
Flow through Bypass of the IP–LP Section of the Turbine
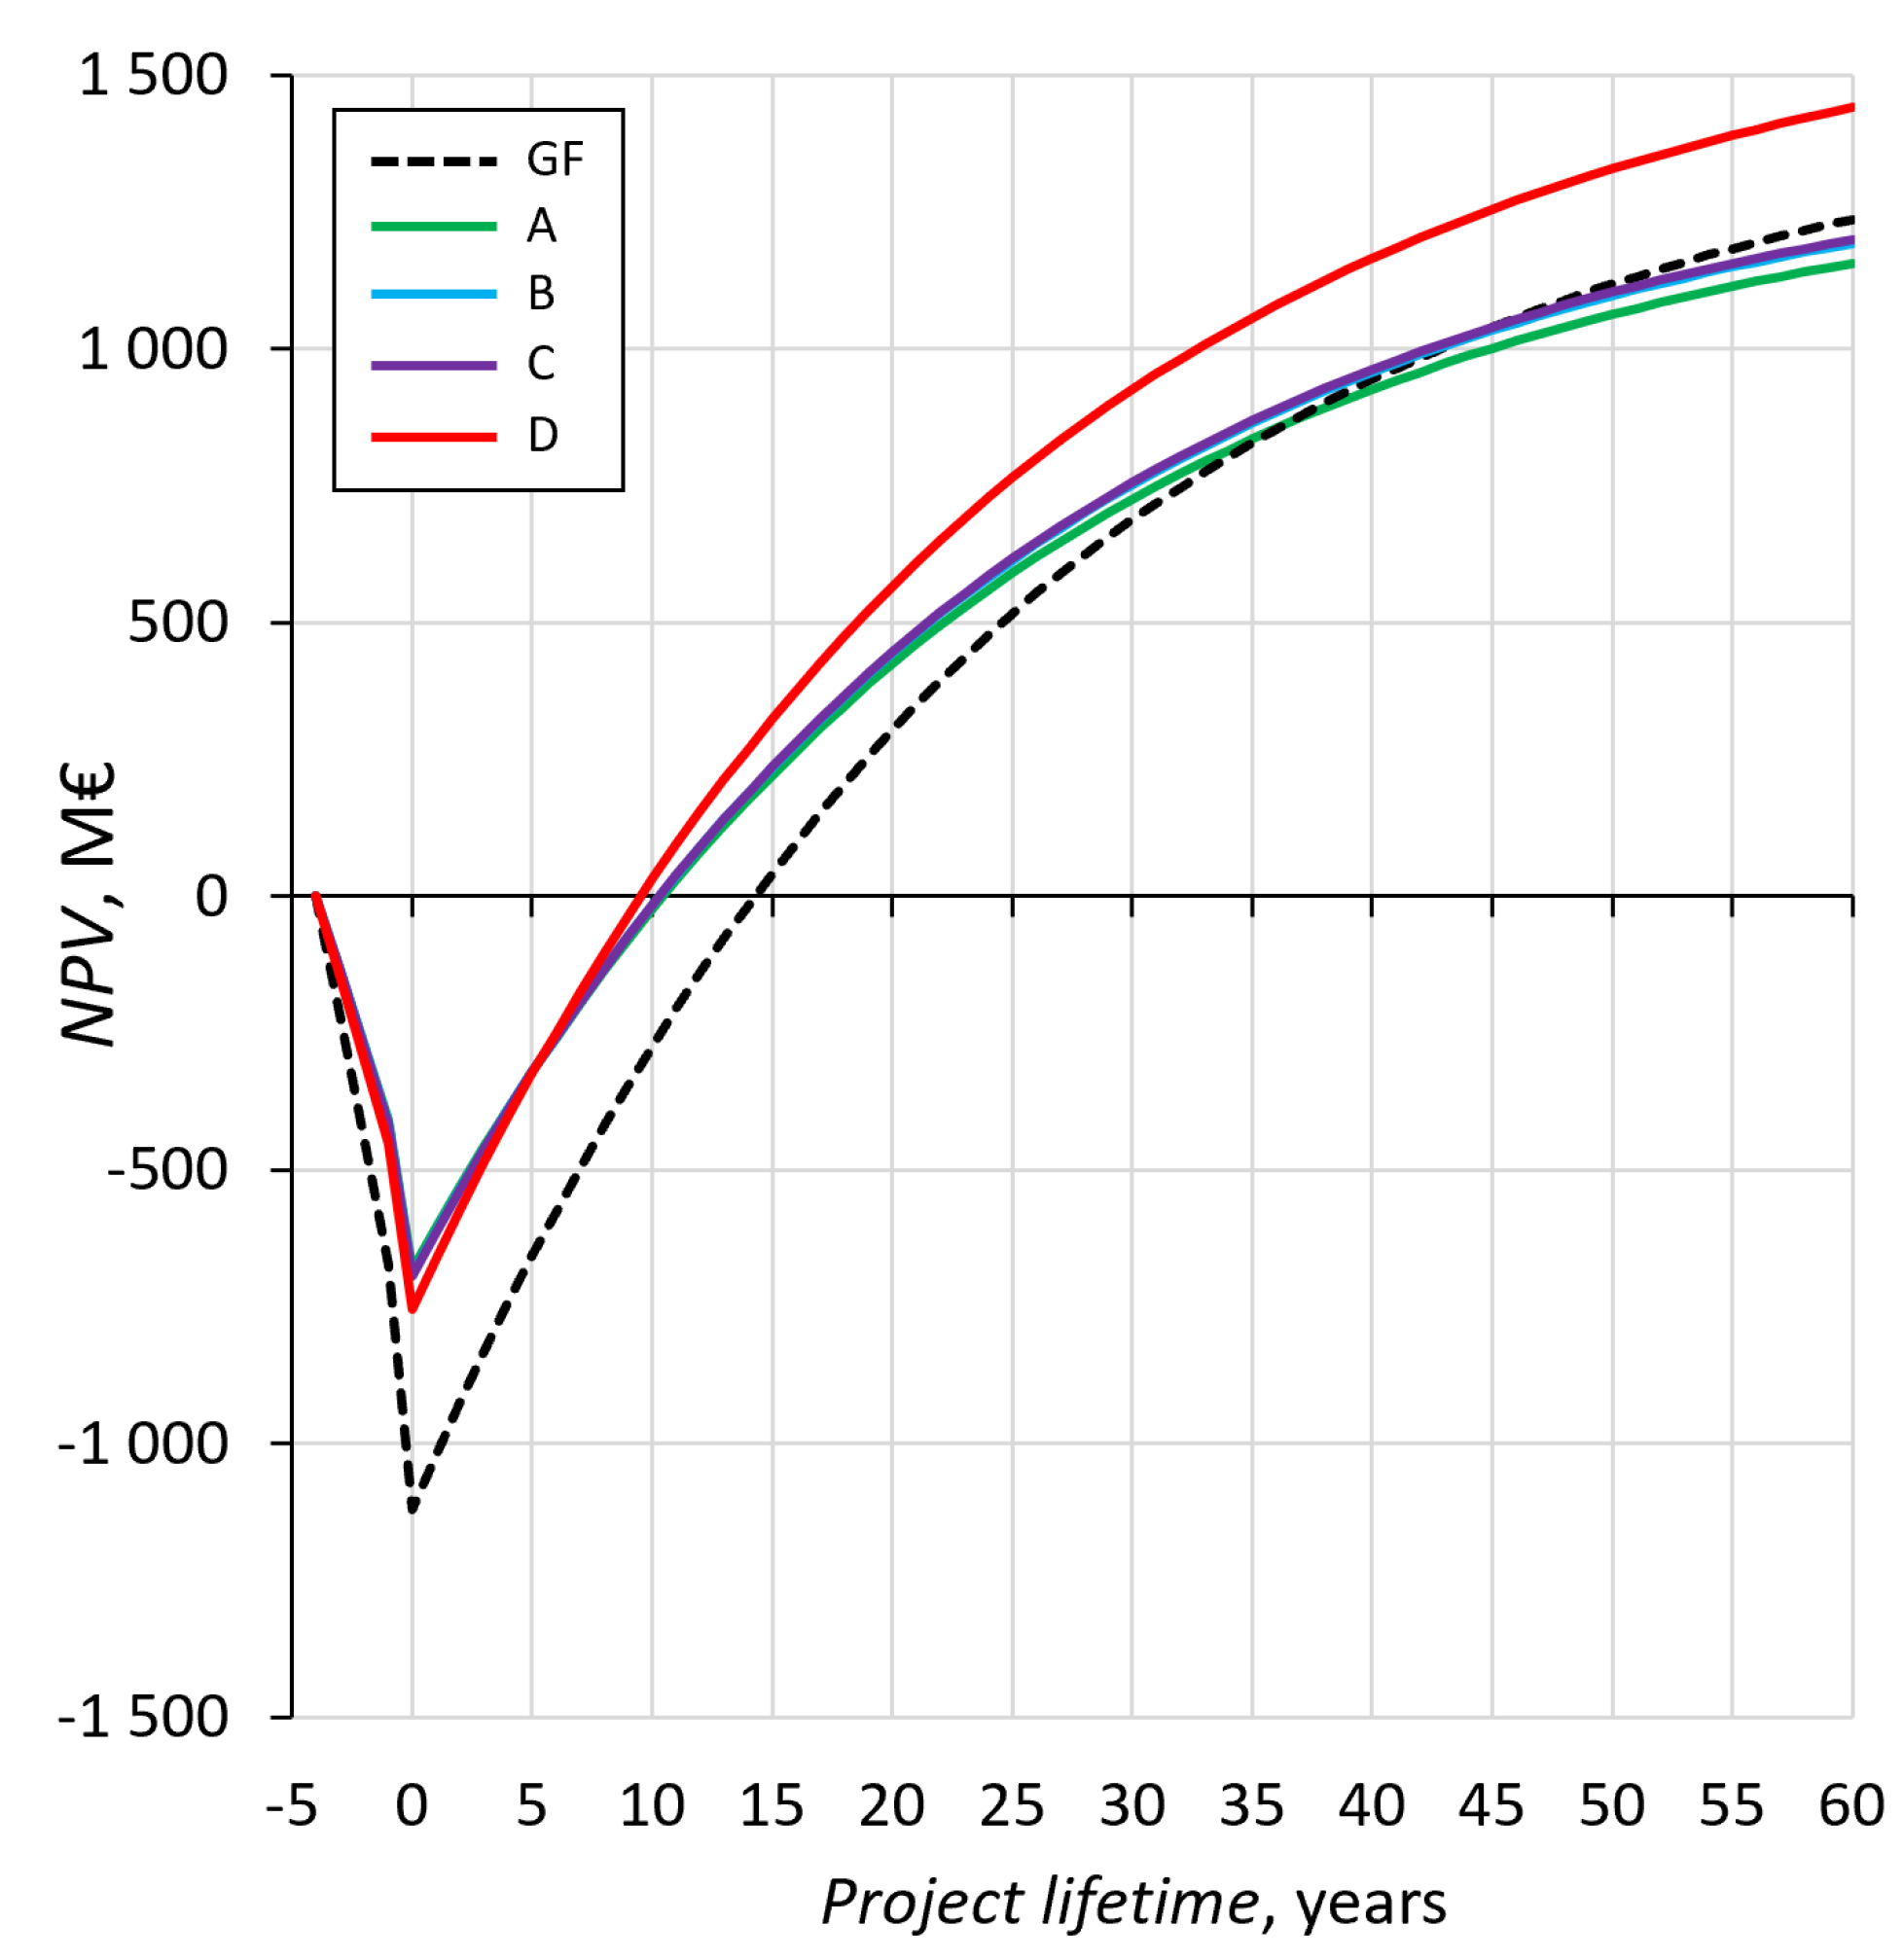
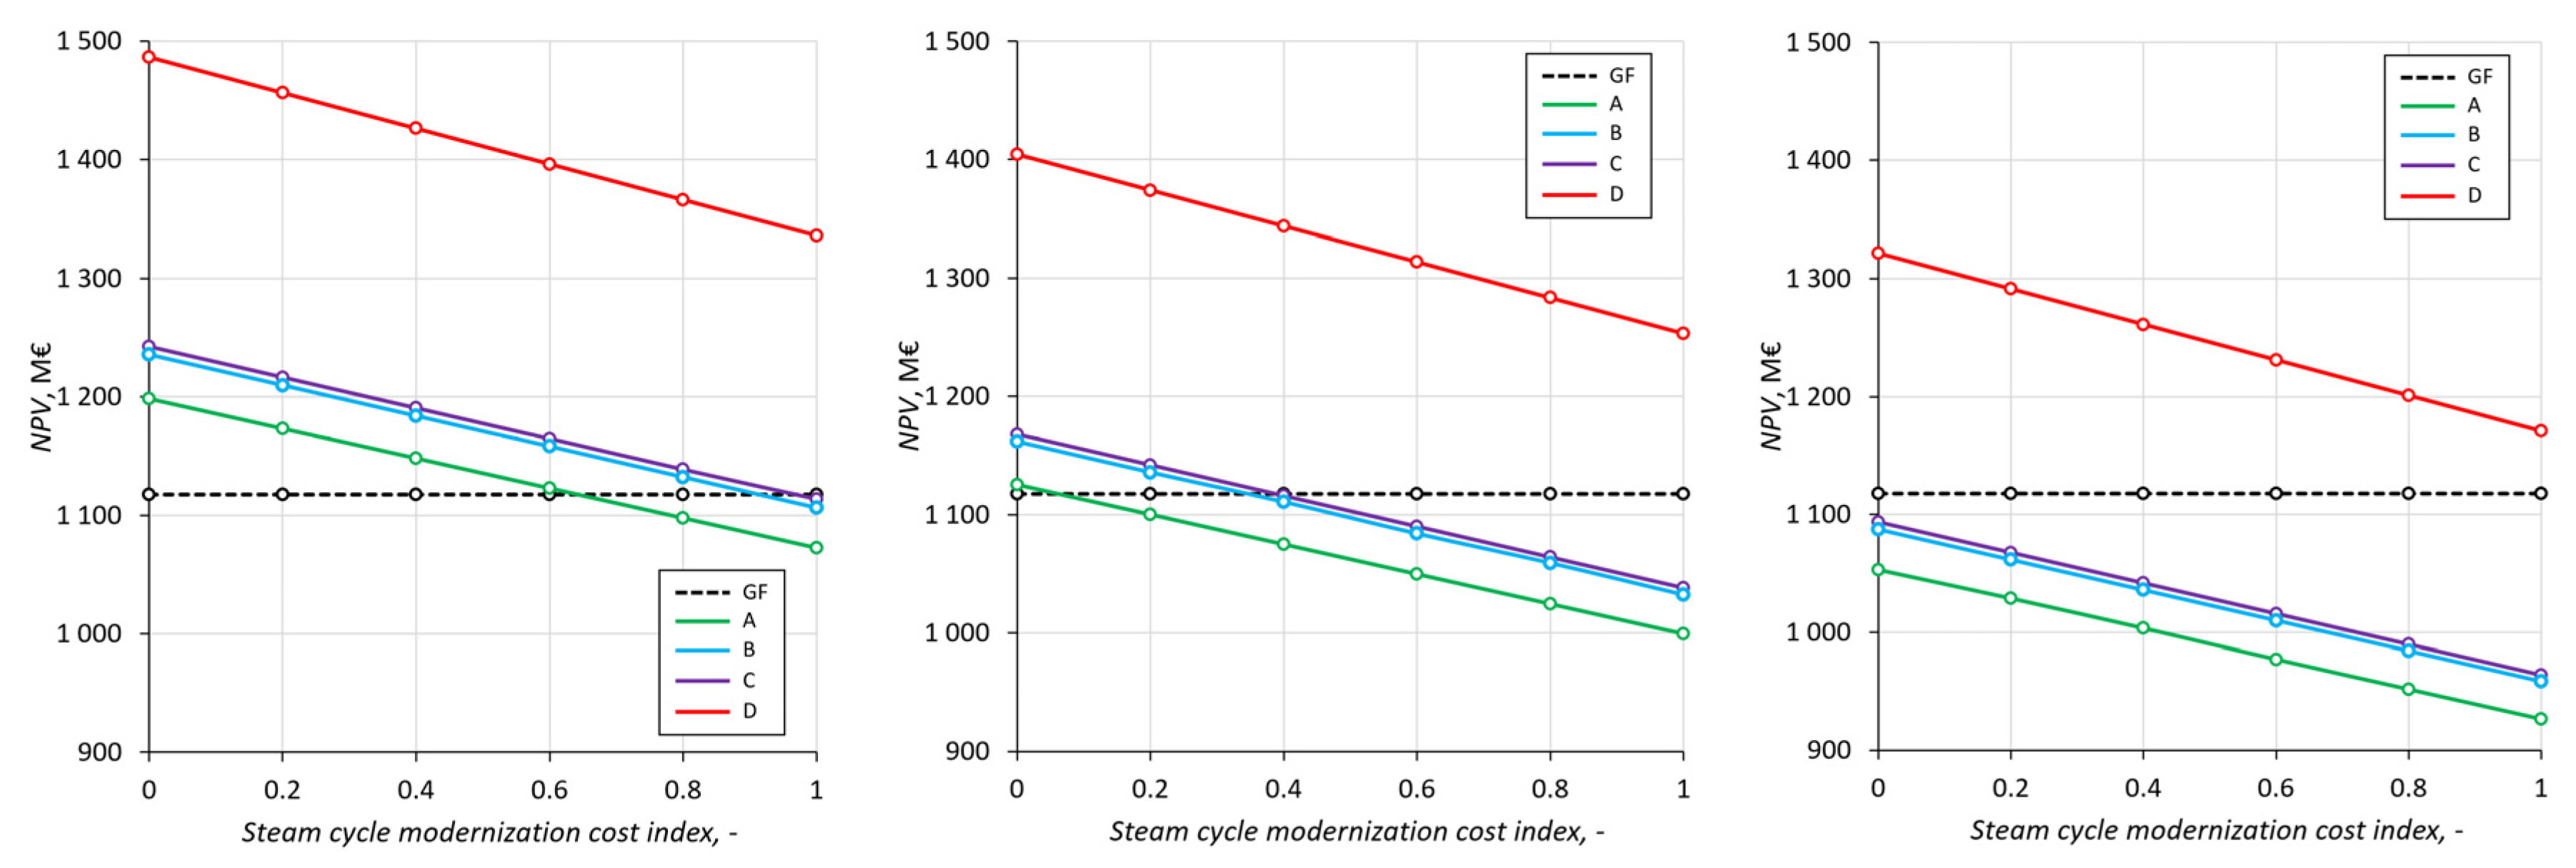
3.2. Economic Assessment Results
4. Discussion
5. Summary
Author Contributions
Funding
Data Availability Statement
Acknowledgments
Conflicts of Interest
Appendix A

References
- Mrozowska, S.; Wendt, J.A.; Tomaszewski, K. The Challenges of Poland’s Energy Transition. Energies 2021, 14, 8165. [Google Scholar] [CrossRef]
- Halser, C.; Paraschiv, F. Pathways to Overcoming Natural Gas Dependency on Russia—The German Case. Energies 2022, 15, 4939. [Google Scholar] [CrossRef]
- Bartela, Ł.; Kotowicz, J.; Dubel, K. Technical-economic comparative analysis of energy storage systems equipped with a hydrogen generation installation. J. Power Technol. 2016, 96, 92–100. [Google Scholar]
- Ministry of Economy of the Republic of Poland. Polish Nuclear Power Programme; Ministry of Economy of the Republic of Poland: Warsaw, Poland, 2014.
- IPCC. Summary for Policymakers. In Global Warming of 1.5 °C, an IPCC Special Report on the Impacts of Global Warming of 1.5 °C above Pre-Industrial Levels and Related Global Greenhouse Gas Emission Pathways, in the Context of Strengthening the Global Response to the Threat of Climate Change, Sustainable Development, and Efforts to Eradicate Poverty; IPCC: Geneva, Switzerland, 2018. [Google Scholar]
- Yue, X.; Peng, M.Y.P.; Anser, M.K.; Nassani, A.A.; Haffar, M.; Zaman, K. The role of carbon taxes, clean fuels, and renewable energy in promoting sustainable development: How green is nuclear energy? Renew. Energy 2022, 193, 167–178. [Google Scholar] [CrossRef]
- Wang, Q.; Guo, J.; Li, R.; Jiang, X. Exploring the role of nuclear energy in the energy transition: A comparative perspective of the effects of coal, oil, natural gas, renewable energy, and nuclear power on economic growth and carbon emissions. Environ. Res. 2023, 221, 115290. [Google Scholar] [CrossRef]
- Nuclear Energy Agency. Uranium 2020: Resources, Production and Demand. A Joint Report by the Nuclear Energy Agency and the International Atomic Energy Agency; Nuclear Energy Agency: Paris, France, 2020. [Google Scholar]
- A Cost Competitive Nuclear Power Solution. Available online: https://www.nuscalepower.com/benefits/cost-competitive (accessed on 2 October 2022).
- Qvist, S.; Gładysz, P.; Bartela, Ł.; Sowiżdżał, A. Retrofit decarbonization of coal power plants—A case study for Poland. Energies 2021, 14, 120. [Google Scholar] [CrossRef]
- Hansen, J.; Jenson, W.; Wrobel, A.; Stauff, N.; Biegel, K.; Kim, T.; Belles, R.; Omitaomu, F. Investigating Benefits and Challenges of Converting Retiring Coal Plants into Nuclear Plants; Nuclear Fuel Cycle and Supply Chain; U.S. Department of Energy Report; United States Department of Energy: Washington, DC, USA, 2022; INL/RPT-22-67964.
- Xu, S.; Lu, Y.H.M.; Mutailipu, M.; Yan, K.; Zhang, Y.; Qvist, S. Repowering Coal Power in China by Nuclear Energy—Implementation Strategy and Potential. Energies 2022, 15, 1072. [Google Scholar] [CrossRef]
- Bartela, Ł.; Gładysz, P.; Andreades, C.; Qvist, S.; Zdeb, J. Techno-Economic Assessment of Coal-Fired Power Unit Decarbonization Retrofit with KP-FHR Small Modular Reactors. Energies 2021, 14, 2557. [Google Scholar] [CrossRef]
- Bartela, Ł.; Gładysz, P.; Ochmann, J.; Qvist, S.; Sancho, L.M. Repowering a Coal Power Unit with Small Modular Reactors and Thermal Energy Storage. Energies 2022, 15, 5830. [Google Scholar] [CrossRef]
- Ingersoll, E.; Gogan, K.; Herter, J.; Foss, A. The ETI Nuclear Cost Drivers Project Full Technical Report; Energy Systems Catapult: Birmingham, UK, 2020. [Google Scholar]
- Hampe, J.; Madlener, R. Economic feasibility of high-temperature reactors for industrial cogeneration: An investor’s perspective. J. Nucl. Sci. Technol. 2016, 53, 1839–1857. [Google Scholar] [CrossRef]
- Nuclear Regulatory Commission. NRC Issues Subsequent Renewed Licenses for Turkey Point Reactors; US NRC: Rockville, MD, USA, 2019.
- Scully Capital Services Inc. Business Case for Small Modular Reactors; Report on Findings to the U.S. Department of Energy Office of Nuclear Energy; Scully Capital Services Inc.: Washington, DC, USA, 2014. [Google Scholar]
- Pannier, C.; Skoda, R. Comparison of Small Modular Reactor and Large Nuclear Reactor fuel cost. Energy Power Eng. 2014, 6, 45669. [Google Scholar] [CrossRef] [Green Version]
- Swedish Nuclear Waste Fund. Annual Report. 2020. Available online: http://www.karnavfallsfonden.se/download/18.5903daa61784af90c4619b3c/1616593059594/Annual%20report%202020.pdf (accessed on 12 December 2022).
- Parsons Brinckerhoff. Quantitative Analysis and Initial Business Case—Establishing Anuclear Power Plant and Systems in South Australia; WSP: Quebec City, QC, Canada, 2016. [Google Scholar]


| Case | Live Steam Pressure | Live Steam Temperature | Reheated Steam Temperature | Inlet Temperature to Boiler/SG | Boiler/SG Thermal Power |
|---|---|---|---|---|---|
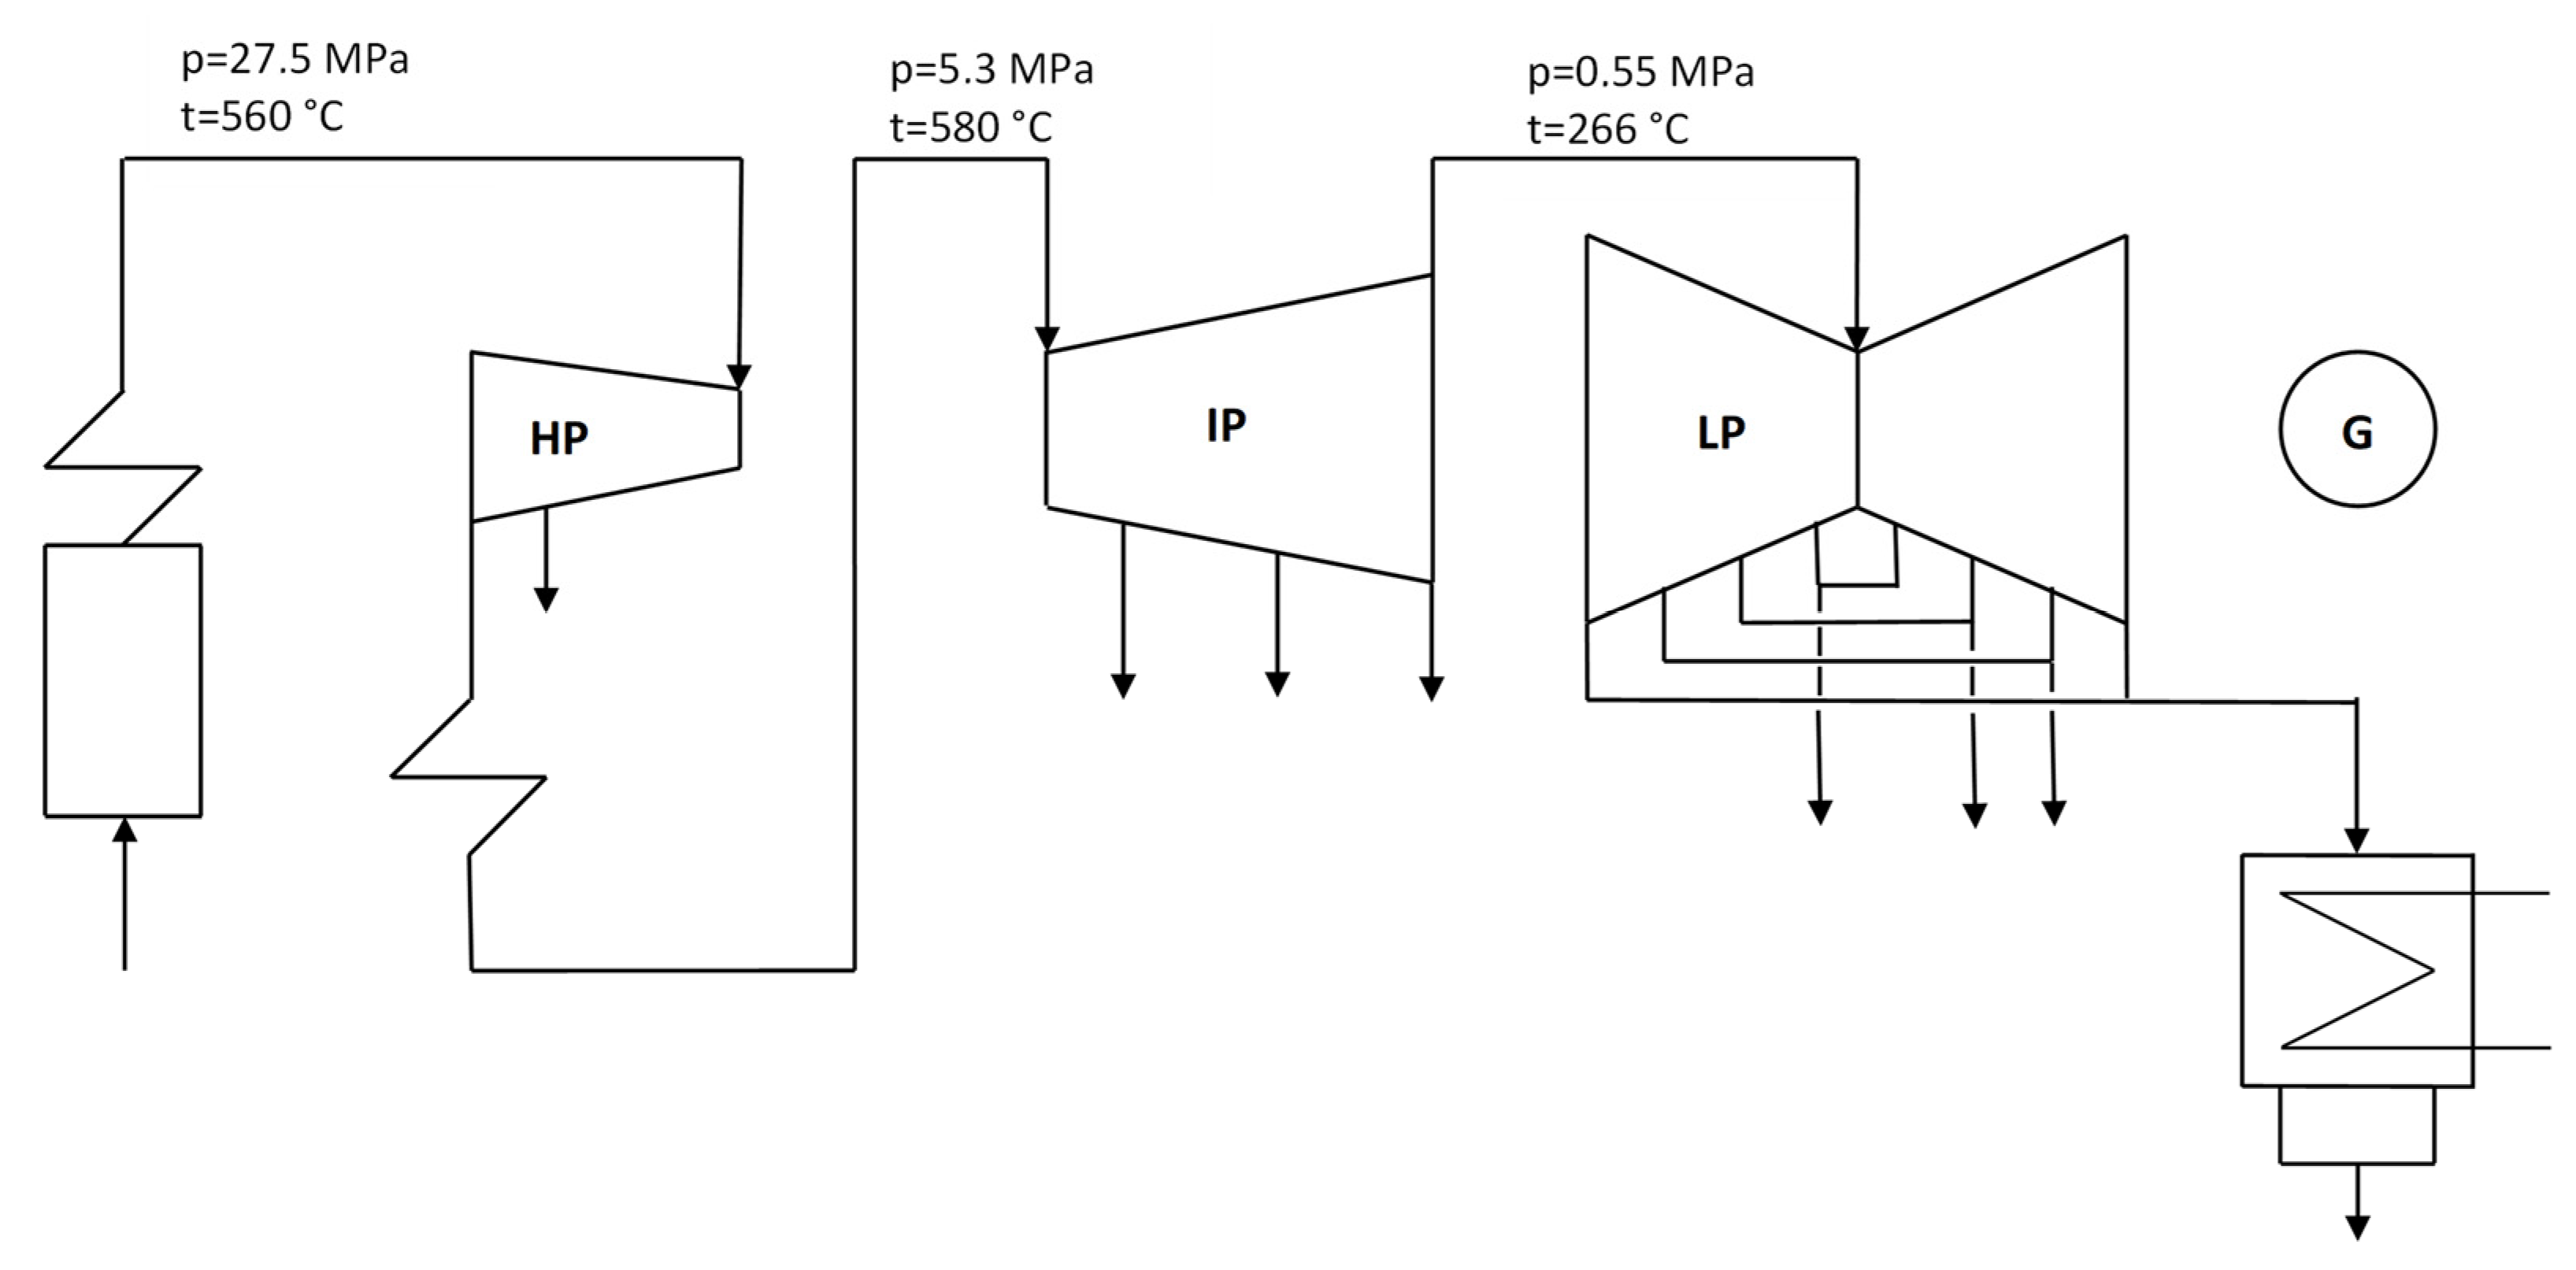
| Original plant | 28 MPa | 560 °C | 580 °C | 290 °C | 957.1 MW |
| Repowered plant | 7 MPa | 285 °C | Varies | Varies | Varies |
| Calculation Point | Parameters | Case A, No Reheater | Case B, 1-Stage Reheat | Case C, 2-Stage Reheat |
|---|---|---|---|---|
| 0 | p, MPa | 4.058 | 4.035 | 4.035 |
| t, °C | 251.2 | 285.0 | 285.0 | |
| x, - | 1.0 | Superheated steam | Superheated steam | |
| h, kJ/kg | 2800.6 | 2916.7 | 2916.7 | |
| , kg/s | 356.096 | 337.788 | 339.281 | |
| 1 | p, MPa | 3.997 | 3.974 | 3.974 |
| t, °C | 250.2 | 284.2 | 284.2 | |
| x, - | 0.999 | Superheated steam | Superheated steam | |
| h, kJ/kg | 2800.6 | 2916.7 | 2916.7 | |
| , kg/s | 329.5 | 313.0 | 313.0 | |
| 6 | p, MPa | 0.589 | 0.589 | 0.589 |
| t, °C | 158.1 | 158.1 | 158.1 | |
| x, - | 0.890 | 0.930 | 0.930 | |
| h, kJ/kg | 2525.7 | 2609.2 | 2609.2 | |
| , kg/s | 272.003 | 260.257 | 260.488 | |
| 8 | p, MPa | 0.536 | 0.535 | 0.539 |
| t, °C | 230.6 | 230.3 | 235.6 | |
| x, - | Superheated steam | Superheated steam | Superheated steam | |
| h, kJ/kg | 2919.3 | 2918.6 | 2929.6 | |
| , kg/s | 244.533 | 244.489 | 244.706 | |
| 12 | p, MPa | 0.006 | 0.006 | 0.006 |
| t, °C | 35.9 | 35.9 | 35.9 | |
| x, - | 0.885 | 0.885 | 0.887 | |
| h, kJ/kg | 2288.2 | 2287.8 | 2294.1 | |
| , kg/s | 208.924 | 208.886 | 209.102 | |
| 25 | p, MPa | 4.509 | 4.483 | 4.483 |
| t, °C | 212.1 | 211.5 | 211.5 | |
| h, kJ/kg | 908.2 | 905.3 | 905.3 | |
| , kg/s | 356.096 | 337.788 | 339.281 | |
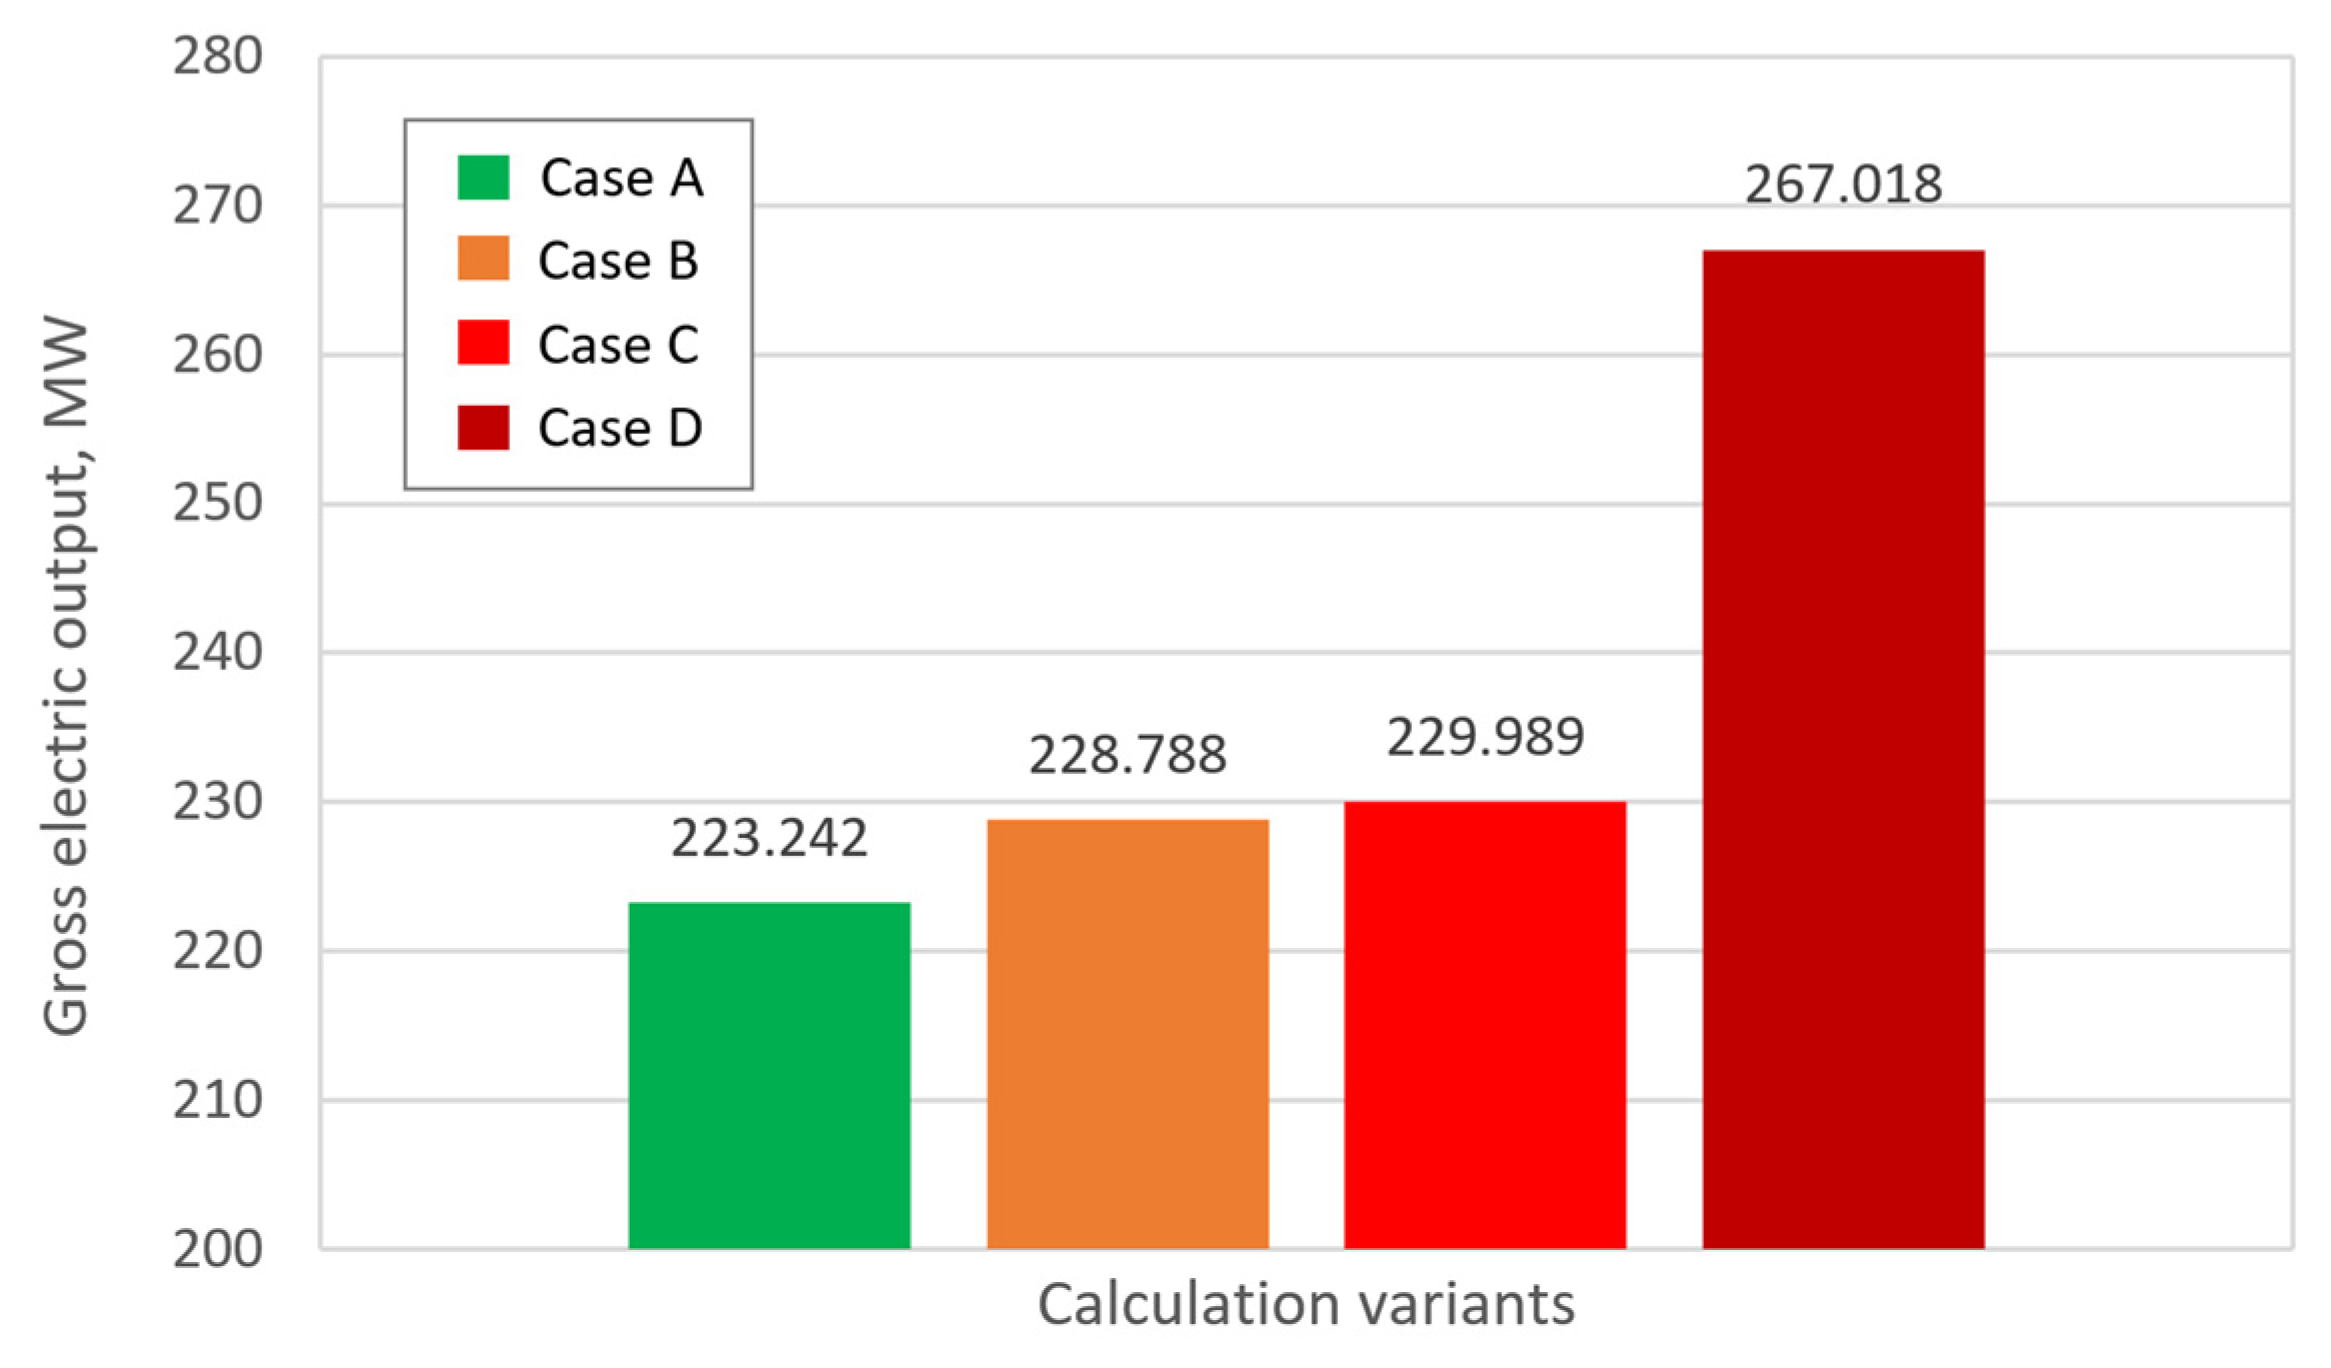
| Gross electric output, MW | 223.242 | 228.788 | 229.989 | |
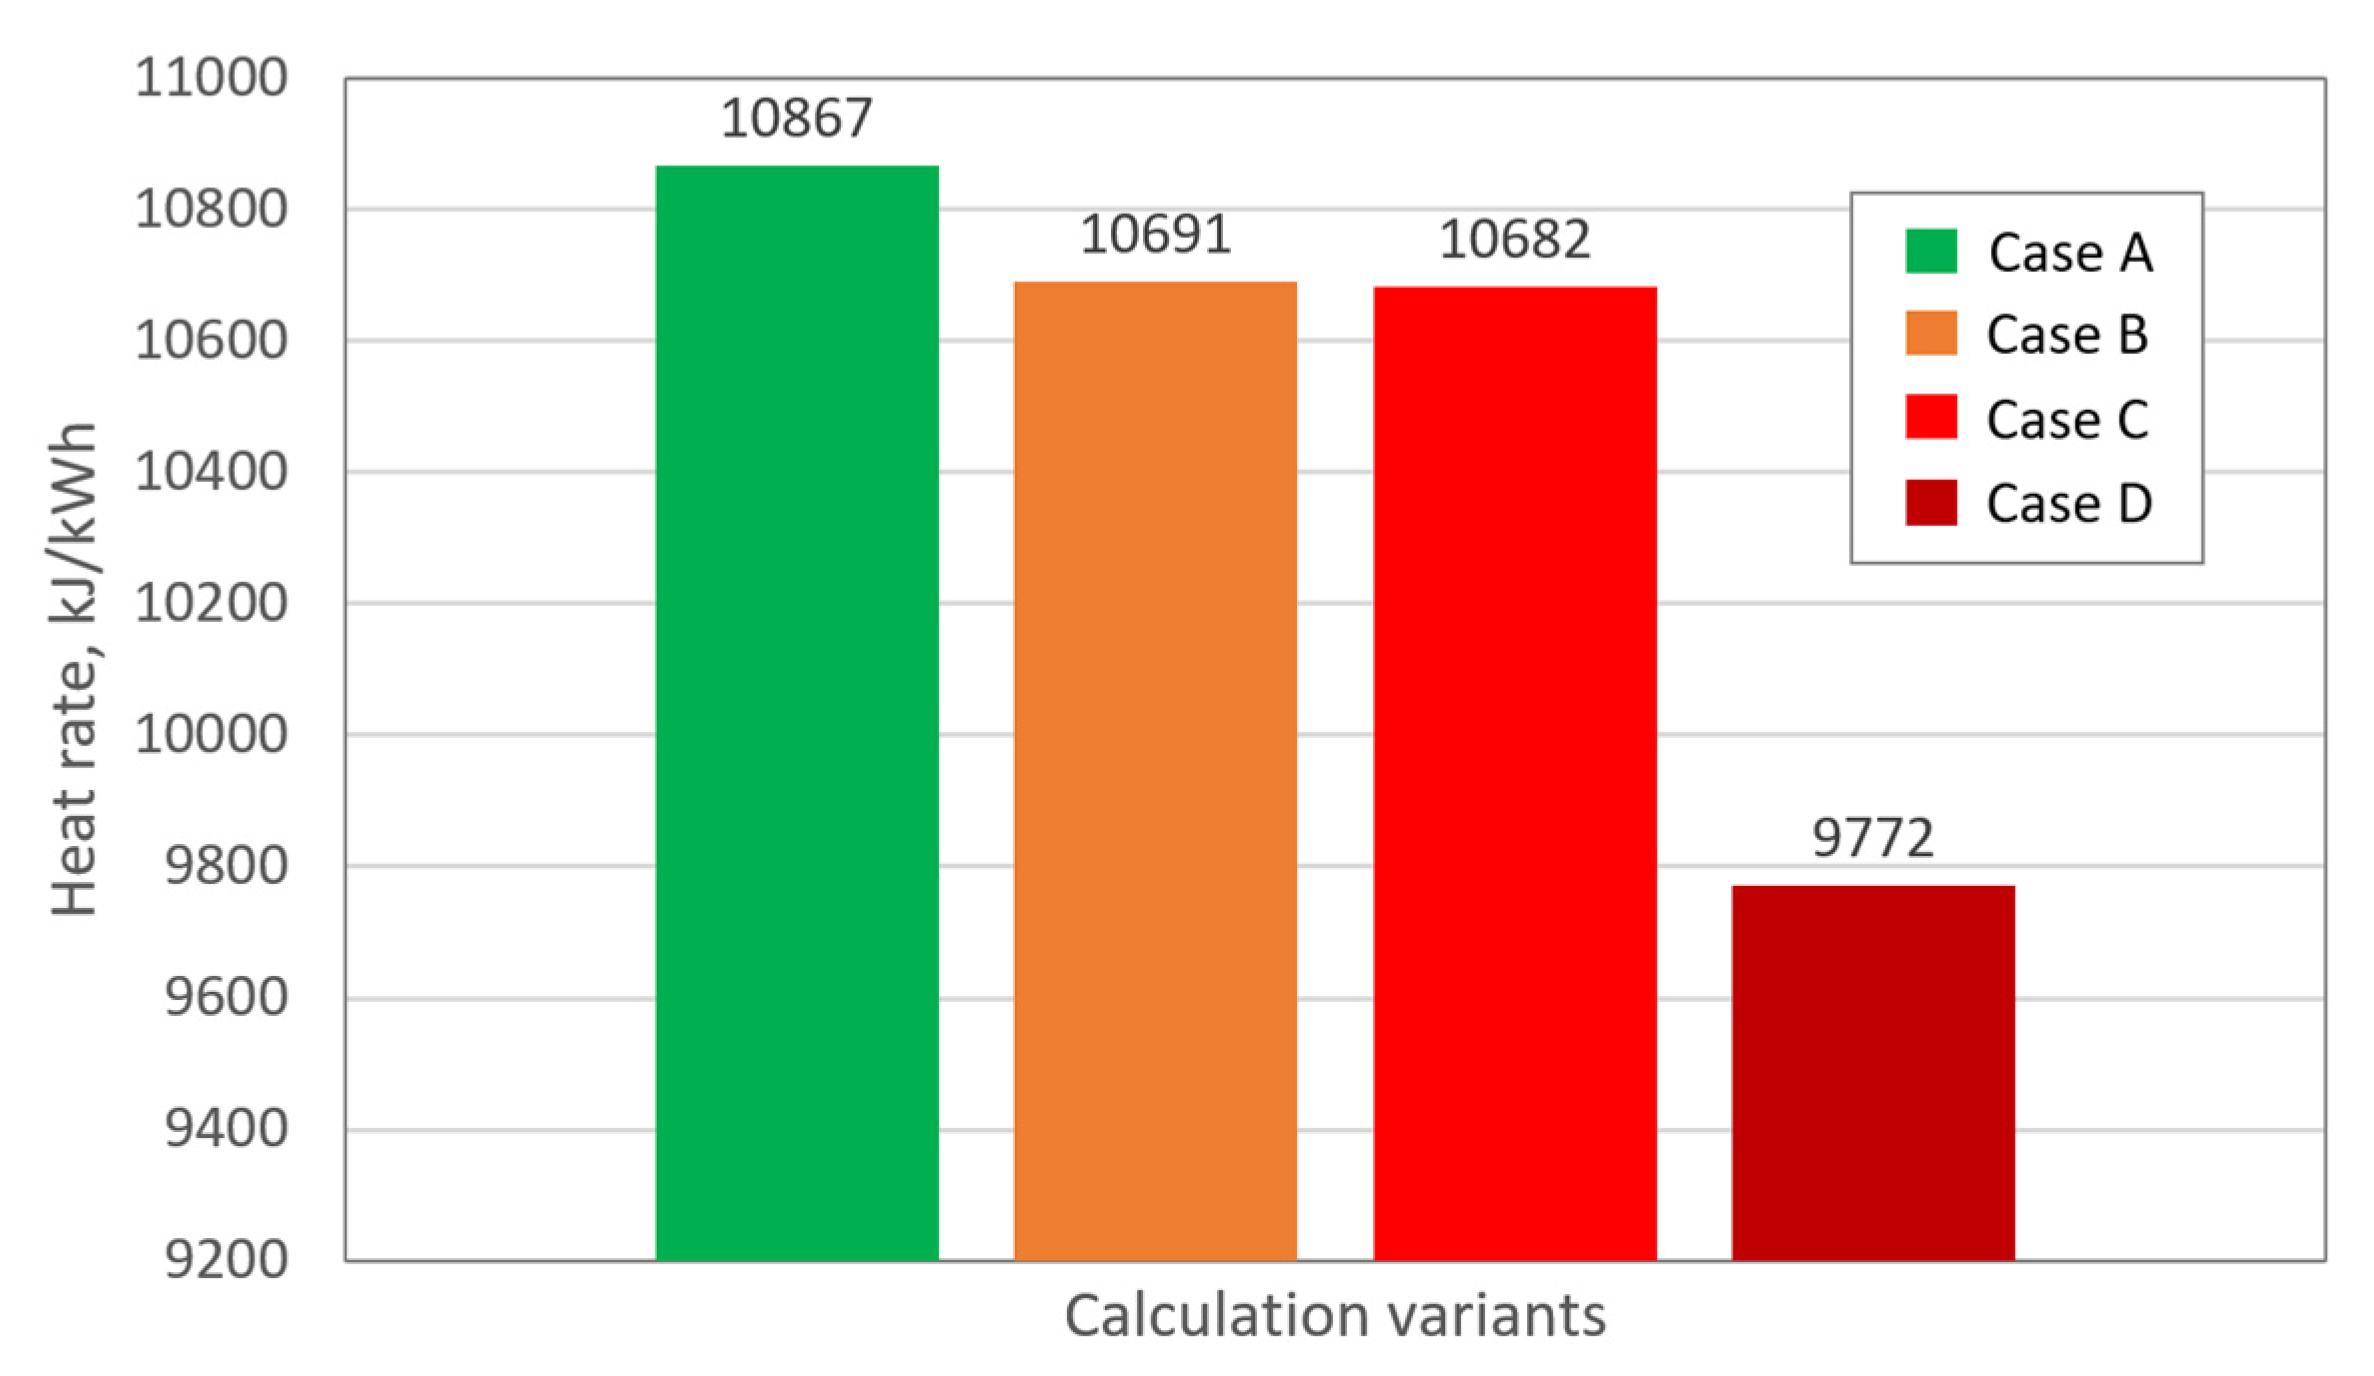
| Heat rate, kJ/kWh | 10,867.1 | 10,690.9 | 10,682.0 |
| Based on the Conservation Equation | Based on the Stodola Equation | Absolute Difference | Relative Difference | |
|---|---|---|---|---|
| Steam pressure at the turbine inlet | 4.035 MPa | 4.356 MPa | 0.321 MPa | 7.96% |
| Electric power | 228.8 MW | 234.4 MW | 5.6 MW | 2.45% |
| Heat rate | 10,691 kJ/kWh | 10,539 kJ/kWh | 152 kJ/kg | −1.42% |
| Calculation Point | p [MPa] | t/x [°C/-] | h [kJ/kg] | m [kg/s] |
|---|---|---|---|---|
| 0 | 7.000 | 285.830 | 2772.6 | 406.865 |
| 1 | 6.895 | 284.531 | 2772.6 | 365.100 |
| 2 | 6.930 | 284.959 | 2772.6 | 41.765 |
| 6 | 0.589 | 0.833 | 2406.1 | 290.584 |
| 7 | 0.571 | 0.990 | 2733.1 | 244.428 |
| 8 | 0.554 | 265.151 | 2990.9 | 244.428 |
| 12 | 0.006 | 0.901 | 2326.7 | 209.031 |
| 25 | 7.778 | 230.000 | 991.2 | 406.865 |
| Gross power output | 267.018 | kW | ||
| Heat rate | 9771.5 | kJ/kWh | ||
| Component of Costs | Category | Symbol of Component | Budgeted Share *, % | Minimal Retrofit Savings, % | Mid-Level Retrofit Savings, % | Maximum Retrofit Savings, % |
|---|---|---|---|---|---|---|
| - | i | or | or | or | or | |
| Initial fuels inventory | R | 7.0 | 0.0 | 0.0 | 0.0 | |
| Other costs (transmission, owner’s, etc.) | T | 10.0 | 100.0 | 100.0 | 100.0 | |
| Land and land rights | R + T | 0(~0) | 100.0 | 100.0 | 100.0 | |
| Structure and improvements | R | 15.0 | 0.0 | 12.0 | 24.0 | |
| Reactor plant equipment | R | 18.0 | 0.0 | 0.5 | 1.0 | |
| Turbine plant equipment | T | 15.0 | 0.0 | 49.5 | 99.0 | |
| Electric plant equipment | T | 5.0 | 42.0 | 60.0 | 78.0 | |
| Miscellaneous plant equipment | R + T | 2.0 | 6.0 | 48.5 | 91.0 | |
| Main condenser and heat rejection system | T | 3.0 | 0.0 | 50.0 | 100.0 | |
| Total indirect costs | R + T | 25.0 | 16.0 | 27.5 | 39.0 |
| Parameter | Symbol | Value (GF = Greenfield, RE = Repowered) | References |
|---|---|---|---|
| Lifetime | |||
| Construction time, years | CT | 4 | [15] |
| Time operational in year, hours | τa | 7884 | [16] |
| Total operation time assumed for the NPV analysis, years | TOT | 50 | [17] |
| Capital costs | |||
| Unit overnight capital cost (GF investment type), €/kW | uOCCGF | 4000 | [15] |
| Variable O&M costs | |||
| Refuelling costs, €/MWh | uVOMC(RC) | 7 | [18,19] |
| Spent nuclear fuel costs, €/MWh | uVOMC(SFC) | 5 | [20,21] |
| Electricity average price, €/MWh | 85 | * | |
| Non-fuel and non-emission costs for turbine island, €/MWh | uVOMC(nnTI) | 1.50 | * |
| Fixed O&M costs, €/MW/y | uFOMC | 100,000 (GF)/104,000 (RET) | [15] |
| Turbine island, €/MW/y | uFOMC(TI) | 16,000 (GF)/20,000 (RET) | * |
| Nuclear Island, €/MW/y | uFOMC(NI) | 84,000 | [15] |
| Others | |||
| Discount rate, % | 6 | * | |
| Tax rate, % | 19 | * |
| Case | |||||
|---|---|---|---|---|---|
| GF | A | B | C | D | |
| NPV, M€ | 1117.75 | 1062.61 | 1096.96 | 1103.12 | 1328.69 |
| NPVR, M€ | 0.997 | 1.556 | 1.587 | 1.588 | 1.759 |
Disclaimer/Publisher’s Note: The statements, opinions and data contained in all publications are solely those of the individual author(s) and contributor(s) and not of MDPI and/or the editor(s). MDPI and/or the editor(s) disclaim responsibility for any injury to people or property resulting from any ideas, methods, instructions or products referred to in the content. |
© 2023 by the authors. Licensee MDPI, Basel, Switzerland. This article is an open access article distributed under the terms and conditions of the Creative Commons Attribution (CC BY) license (https://creativecommons.org/licenses/by/4.0/).
Share and Cite
Łukowicz, H.; Bartela, Ł.; Gładysz, P.; Qvist, S. Repowering a Coal Power Plant Steam Cycle Using Modular Light-Water Reactor Technology. Energies 2023, 16, 3083. https://doi.org/10.3390/en16073083
Łukowicz H, Bartela Ł, Gładysz P, Qvist S. Repowering a Coal Power Plant Steam Cycle Using Modular Light-Water Reactor Technology. Energies. 2023; 16(7):3083. https://doi.org/10.3390/en16073083
Chicago/Turabian StyleŁukowicz, Henryk, Łukasz Bartela, Paweł Gładysz, and Staffan Qvist. 2023. "Repowering a Coal Power Plant Steam Cycle Using Modular Light-Water Reactor Technology" Energies 16, no. 7: 3083. https://doi.org/10.3390/en16073083