Article

Bilevel Optimal Economic Dispatch of CNG Main Station Considering Demand Response

1
School of Electrical Engineer, Shandong University, Jinan 250061, China
2
Department of Electrical & Electronic Engineering, Imperial College London, London SW7 2AZ, UK
3
Huaneng Shandong Power Generation Co., Ltd., Jinan 250013, China
*
Author to whom correspondence should be addressed.
Energies 2023, 16(7), 3080; https://doi.org/10.3390/en16073080
Submission received: 2 January 2023 / Revised: 21 March 2023 / Accepted: 24 March 2023 / Published: 28 March 2023
(This article belongs to the Special Issue Development Trend Analysis of Power Distribution Systems)

Abstract

:
Compressed natural gas (CNG) main stations are critical components of the urban energy infrastructure for CNG distribution. Due to its high electrification and significant power consumption, researching the economic operation of the CNG main station in demand response (DR)-based electricity pricing environments is crucial. In this paper, the dehydration process is considered in the CNG main station energy consumption model to enhance its participation in DR. A bilevel economic dispatch model for the CNG main station is proposed, considering critical peak pricing. The upper-level and lower-level models represent the energy cost minimization problems of the pre-system and rear-system, respectively, with safety operation constraints. The bilevel programming model is solved using a genetic algorithm combined with a bilevel programming method, which has better efficiency and convergence. The proposed optimization scheme has better control performance and stability, reduces the daily electricity cost by approximately 21.04%, and decreases the compressor switching frequency by 50.00% without changing the CNG filling demand, thus significantly extending the compressor’s service life. Moreover, the average comprehensive power cost of processing one unit of CNG reduces 20.62%.

1. Introduction

With the development of more types of energy, an increasing number of industrial and commercial users are gradually changing from single-energy-load users to integrated energy users (IEUs), integrating multiple loads such as electricity, gas, heat, and cooling [1,2,3]. However, IEUs have difficulties in responding to the demand response (DR) considering meeting multiple loads. To solve this, integrated energy scheduling strategies are needed. Among them, the compressed natural gas (CNG) main station is responsible for the functions of natural gas dehydration, compression, storage, and transportation in the urban natural gas energy system. The integrated electricity–gas system (IEGS) is a typical example of a large-scale integrated energy system with great potential to participate in demand response (DR) programs. This integration can improve the safety and flexibility of the connected distribution system while reducing the economic costs of the station. The integrated utilization and efficient configuration of energies can also be promoted [4,5,6]. Therefore, the economic scheduling of CNG main stations has great significance for IEUs to participate in DR.
With the continuous acceleration of natural gas resource development and transport pipeline construction, natural gas energy systems are playing a more important role in the development of cities. Approximately 60 million households use services related to natural energy systems in the US [7]. As an alternative fuel for automobiles, natural gas has unique advantages over diesel and gasoline in terms of supply stability, technical feasibility, and cleanliness [8]. As of December 2019, the level of natural gas vehicle (NGV) ownership worldwide reached 28,541 × 103. The number of natural gas vehicles (NGVs) in cities has continued to grow globally, especially in Asia. The average annual growth rate of NGV from 2002 to 2012 was as high as 35.1%, and the growth rate of China remained above 8% from 2010 to 2018 [9]. As of 2018, the number of NGVs in China exceeded 6760 × 103 [10], and about 9.6% of vehicles use natural gas to replace traditional vehicle fuels [11]. At the same time, the growing NGV filling demand has driven the rapid development of urban natural gas filling networks. As of 2019, the number of natural gas refueling stations reached 33,383. As of 2018, China had over 9000 natural gas fueling stations, including more than 5600 CNG refueling stations. From 2010 to 2018, the number of natural gas fueling stations in China grew consistently at a rate of over 5% [10]. Up to now, China has initially formed an urban natural gas filling network integrating CNG standard stations and main slave stations [12].
In the urban natural gas filling network, the CNG main station integrates CNG pretreatment, compression, storage, and filling functions. It is the largest electricity–gas demand IEU in the urban natural gas filling network [13]. According to calculations, the annual electricity consumption of a typical CNG refueling station in China is about 7084 × 103 kWh, and the annual intake of natural gas was about 43,200 × 103 N·m3 in 2020 [14]. The main process systems of the CNG main station include dehydration, compression, storage, and filling process systems. Among all the systems in the CNG main station, the dehydration and compression process systems consume most of the energy, accounting for about 92.48% of the total energy consumption. The compression process system accounts for 54.19%, and the dehydration process system accounts for 38.29% [15]. The CNG main station needs to process the imported natural gas into CNG in advance to meet the real-time NGV filling demand; therefore, it is generally equipped with a storage process system [16], which can temporarily store CNG, and the CNG main station production plan can be flexibly changed within the allowable range of the storage device pressure. The electricity–gas load of the production equipment can also be dispatched without affecting the NGV filling load in the station. The CNG main station is an important infrastructure for producing CNG and has a high level of electrification, making it a key player in the electricity market. Therefore, responding to DR price signals in order to reduce operating costs and improve market competitiveness is of great significance to CNG main station operators. Above all, CNG main stations have great potential and urgent practical needs for participating in DR.
Scholars have made significant research progress in the modeling of electrical–gas behavior and energy optimization scheduling problems for CNG main stations. In the literature [17], a gas behavior model for the filling process between single-stage gas storage and NGV cylinders was established according to the first law of thermodynamics. Subsequently, researchers expanded the CNG main station model by considering other infrastructure models in the station. For example, the authors of [18] studied the influence of connecting pipes on the filling process, while the gas state equation was used to extend the gas behavior model of a single-stage gas storage device to multistage in [19]. The authors of [20] further considered the pressure change influence of the multistage storage device caused by the reciprocating compressor during the filling process, and established a CNG main station fast filling model that included the reciprocating compressor model. The front-end device model was also supplemented in [13], including a buffer tank and dehydration device, for compatibility with the reciprocating compressor and its front device. In terms of energy consumption optimal dispatch of the CNG main station, the authors of [21] regarded the compressor power in the station as a variable load and used the SCIP solver to transfer the power load under the guidance of a time-of-use electricity price strategy. Subsequently, the power of the pre-system [13], the user charging management [22], and the back-level control strategy [23] have also been introduced into optimal dispatch of the CNG main station.
However, the existing electrical–gas behavior studies of the CNG main station mainly focused on the compression process system. The energy consumption of the equipment participating in DR is only about half of the total energy consumption of the station. Less attention is paid to the electrical–gas behavior modeling of the dehydration process system, which consumes nearly the same level of energy as the compression process system.
The main contributions and novelty of this study are as follows:
(i) The present study represents a breakthrough in the simultaneous modeling of the dehydration and compression process system of a CNG main station. It further deepens the CNG main station’s participation in DR and improves the whole system control performance by avoiding the danger of device overpressure caused by the mismatch between the proposed CNG operation plan and the actual operating conditions. Meanwhile, the joint scheduling of the dehydration and the compression process system in the optimal dispatch of the CNG main station enables the whole process systems to participate in DR.
(ii) This study proposes an improved bilevel programming method combined with genetic algorithm (GA) to minimize the daily electricity cost and compressor switching frequency of a CNG main station.
(iii) The objective is to optimize the shift-load production plan for process systems, achieving both DR program benefits and user CNG filling demands. By using critical peak pricing (CPP) to guide the electrical–gas behavior of the CNG main station, power-consuming equipment operation can be altered to achieve lower electricity costs. The reduced electricity costs can be passed on to consumers to increase the attractiveness of natural gas energy. This can help to reduce the pollution caused by traditional energy vehicles and promote the cleanliness development of the automobile industry, further meeting the urgent requirements for promoting the world’s energy revolution.
The remainder of this paper is organized as follows: Section 2 presents the general framework of the study, followed by the presentation of the optimal economic dispatch model of the CNG main station combined with demand response (DR) in Section 3. Section 4 provides details of the bilevel programming algorithm combined with the genetic algorithm (GA). In Section 5, we present the case data of the CNG main station, including device parameters, CNG filling demand, and the local critical peak pricing (CPP) strategy. Section 6 includes five comparative experiments to verify the efficiency of the proposed algorithm, the control and stability of the proposed model, and the economy of the optimization result considering CPP and time-of-use (TOU) pricing. Lastly, we conclude the study in Section 7.

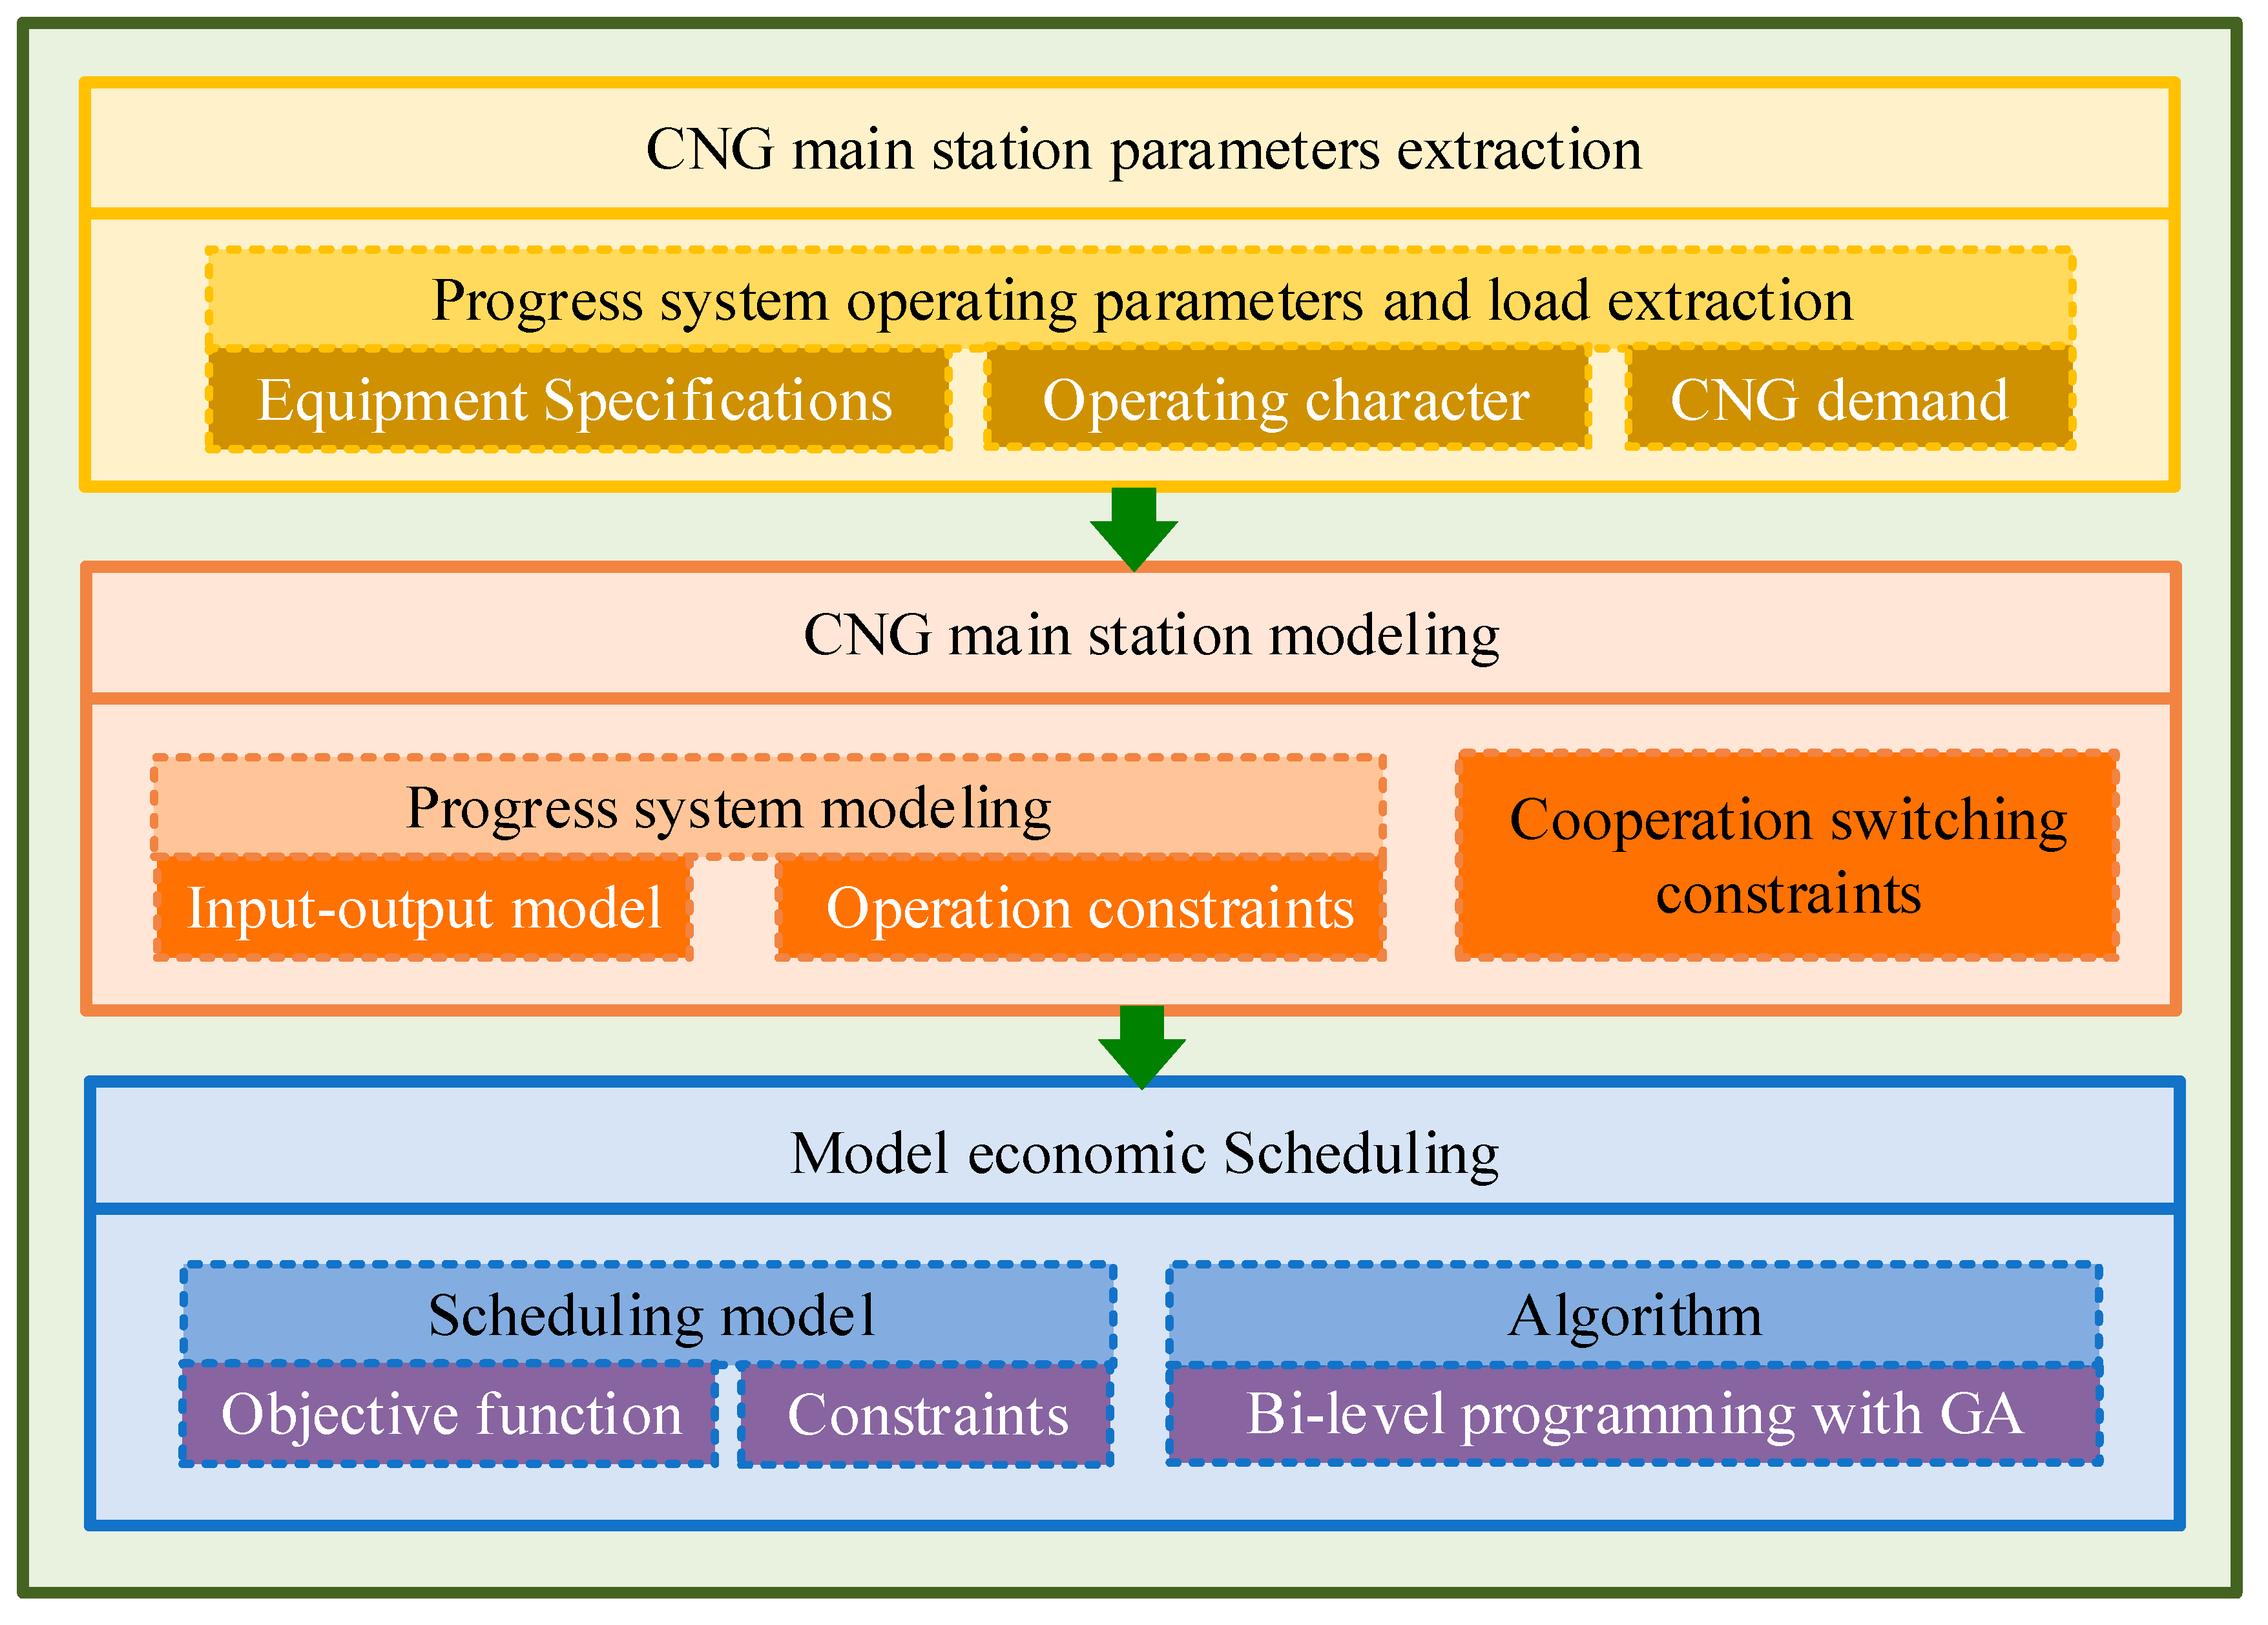
2. General Framework of the Study

In this paper, we propose a bilevel optimal economic dispatch model for a CNG main station considering demand response, as shown in Figure 1.
Firstly, we extract the characteristic parameters of the CNG main station by obtaining equipment parameters from the nameplate and extracting process system operating characteristic parameters from the corresponding PLC. We also obtain the typical CNG demand curve of the station by analyzing historical data from the dispenser.
Secondly, process system models of the CNG main station are established for each equipment, on the basis of its electricity–gas behavior and the corresponding process system operating characteristics. Additionally, equipment safety operation constraints are proposed. Furthermore, to consider the cooperative switching constraints between both progress systems, an operation model for the CNG main station is generated.
Lastly, an economic scheduling objective function is obtained from the local CPP policy and compressor switching frequency penalty, which is combined with the operation model to obtain the optimal economic dispatch model of the CNG main station. Terminal constraints are added to the safety operation constraints to solve potential instability problems. A bilevel programming algorithm combined with GA is proposed to solve this optimal model. The solving results show that this method can obtain the day-ahead economic scheduling plan of the CNG main station considering CPP.

3. Dispatch Modeling and Problem Formulation

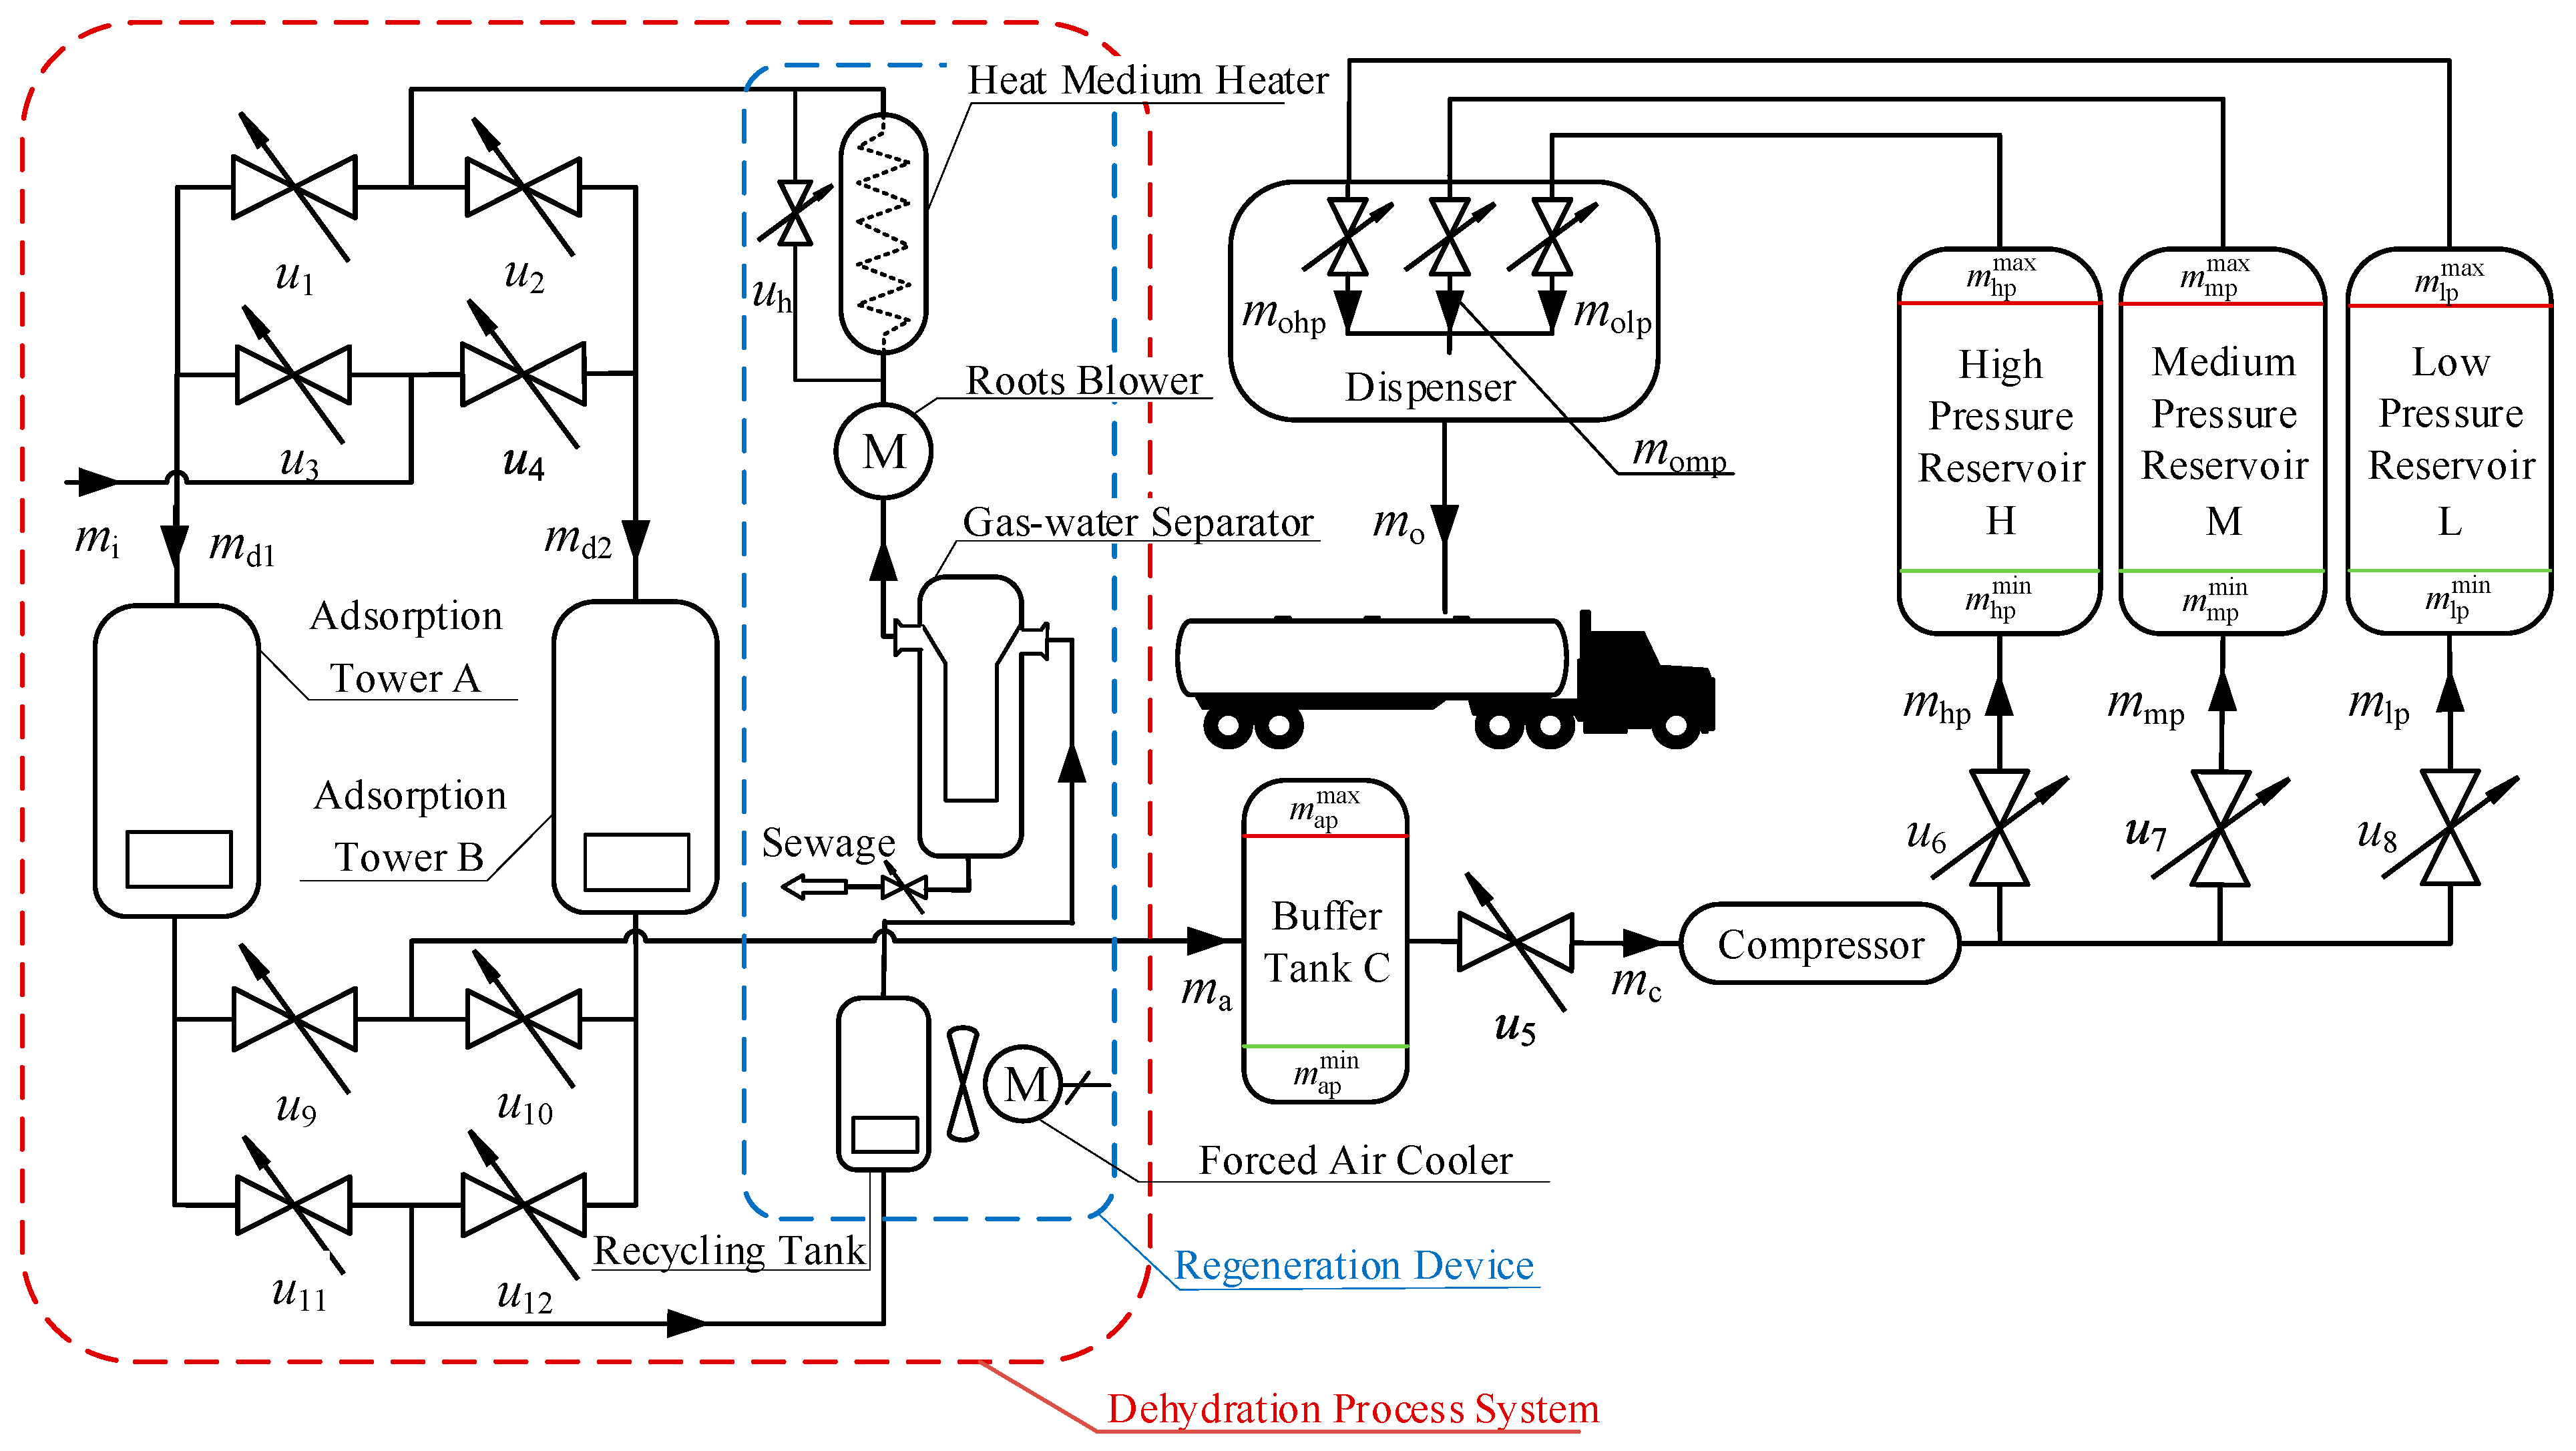
3.1. Structure of CNG Main Station

The CNG main station process systems are composed of natural gas dehydration, compression, storage, and filling systems [24]. The sketch of the CNG main station model is shown in Figure 2. It can be seen from the figure that the operation of each system is closely related. The equipment in the station is divided into four process systems: The dehydration process system mainly includes adsorption tower A, adsorption tower B, a heat medium heater, a Roots blower, a gas–water separator, and a forced air cooler; the buffer tank and compressor form the compression process system; the storage process system is composed of high-pressure reservoir H, medium-pressure reservoir M, and low-pressure reservoir L; the filling process system mainly consists of several dispensers. The equipment in the CNG main station is connected through corresponding switches controlled by the PLC.

3.2. Equipment Modeling

(1) Dehydration device model: The CNG main station is generally located at the end of a long-distance natural gas pipeline. During long-distance pipeline transportation, external impurities may be mixed into the gas due to pipeline sealing problems [25]. These impurities may cause damage to the compressor and even cause the compressor to stop during operation [26,27,28]. Therefore, the CNG main station is generally equipped with a dehydration process system.
The molecular sieve dehydration method is the most used in the dehydration process system of the CNG main station [24]. This method is essentially a single-molecular-layer physical adsorption method, and the molecular sieve dehydration devices are usually configured in an absorption tower. The dehydration process is mainly divided into adsorption, regeneration, and cold purging processes [24]. In the adsorption process, the wet natural gas from the long-distance gas pipeline enters the molecular sieve adsorption tower, and its entrained liquid droplets are adsorbed by molecular sieves. Then, the dehydrated gas leaves the adsorption tower and enters the compression process system. Due to the continuous accumulation of liquid molecules, the dehydration performance of the molecular sieve declines as the working time increases; hence, it needs regeneration after working for a period to ensure dehydration efficiency. The adsorption tower in the regeneration process is not able to dehydrate intake gas. To meet the demand of real-time load, the dehydration process system of the CNG main station is generally equipped with dual towers to ensure that at least one adsorption tower can work in the dehydration process in each period.
The regeneration device consists of a heat medium heater, Roots blower, recycling tank, gas–water separator, and forced air cooler. Regenerated gas is firstly stored in the recovery tank; then, the regenerated gas is driven by the Roots blower to carry out molecular sieve purging and the regeneration cycle during the regeneration process. The higher temperature can help the liquid molecules to separate from the molecular sieve more quickly. Therefore, the regenerated gas needs to be heated by a heat medium heater during the regeneration process before entering the adsorption tower. After that, the regenerated gas is filled into the adsorption tower to heat and regenerate the molecular sieve dehydration device in the tower. Next, the high-temperature gas entrains droplets and leaves the tower; after being cooled by the forced air cooler, the water-containing low-temperature gas enters the gas–water separator. The water is separated from the gas by centrifugal force. The separated water is removed from the dehydration progress system by the sewage pipe, and the dehydrated gas is reheated by the electric heater to start a new cycle until the water dew value of the regeneration gas drops to the predetermined value.
Lower temperature can increase the adsorption capacity of the molecular sieve. The adsorption towers after regeneration must be cooled to a certain temperature by unheated dry gas before dehydration operation [29]. It is necessary to continue the cold purging cycle: the PLC controls the bypass switch of the heat medium heater to open; the regenerated gas bypasses the heater and enters the adsorption tower for cooling; the heat is taken out from the adsorption tower by the regenerated gas and discharged to the environment through the forced air cooler. After the cold purging cycle is over, the regenerated gas is recovered again and stored in the recycling tank.
According to the above process, the electric–gas model of the dehydration device can be expressed as
W d ( t ) = i = 1 t p d 1 t s [ u 3 ( i ) + u 4 ( i ) ] + t = 1 t p d 2 [ u 1 ( t ) + u 2 ( t ) ] t s = i = 1 t p d 1 t s [ u 3 ( i ) + u 4 ( i ) ] + t = 1 t ( p m + p w ) [ u 1 ( t ) + u 2 ( t ) ] t s
m d ( t ) = m d 1 ( t ) + m d 2 ( t ) = i = 1 t t s m dmp [ u 9 ( i ) + u 10 ( i ) ] ,
where t = 1, 2, 3, …, N. The day-ahead optimized scheduling time is defined where t = 1, 2, 3, …, N. The day-ahead optimized scheduling time tn is defined as 24 h, and the sampling time is defined as ts (h); then, the total number of samples N = 24/ts. Wd(t) is the electrical energy of the dehydration device before time t (kWh). pd1 is the dehydration power of a single adsorption tower (kW), and pd2 is the regeneration and cold purging power of a single adsorption tower (kW). pm is the power of the Roots blower (kW), and pw is the power of the forced air cooler (kW). The heat medium heater is a kind of organic heat carrier heating furnace [30], which generally uses coal, oil, or combustible liquid as fuel; hence, it is not listed in the electricity–gas model of the dehydration progress system. md(t) is the total processing gas volume of the dehydration device before the period t (kg), md1(t) is the total processing gas volume of the adsorption tower A before the period t (kg), and md2(t) is the total processing gas volume of the adsorption tower B before the period t (kg). mdmp is the outlet mass flow rate of the dehydration process of a single adsorption tower (kg/h). It can be calculated as follows:
m dmp = ρ std × Q std . d = M w g M w a × ρ std . a × Q std . d ,
where ρstd is the compressed gas density under standard conditions (0 °C and 105 Pa). Mwg is the molecular weight of compressed gas, Mwa is the molecular weight of air, and ρstd.a is the density of air under standard conditions (kg/m3). Qstd.d is the dehydration capacity of the single adsorption tower under standard conditions (N·m3/h).
Certain switch combination constraints are also required for the operation safety of the dehydration process system. A shorter regeneration time increases the regeneration air flow rate and increases the size of the regeneration equipment. Appropriately increasing the regeneration time can make the adsorption more complete [31]. Therefore, the CNG main station generally adopts the working mode of the designated regeneration time to ensure the deepening regeneration of the adsorption tower. To ensure the operating efficiency of the molecular sieve, the regeneration and cold purging process should run uninterruptedly. However, the dehydration process can still intermittently run as required by the subsequent compression system. In addition, the dual adsorption towers in the dehydration device share the same inlet and outlet gas pipelines for reducing construction costs; thus, certain switch combinations are needed to prevent the working status of the dual towers from interfering with each other. Lastly, the equipment except for the gas storage device is generally not used for storage. To achieve this, all levels of switches are required to cooperate to avoid the accumulation of gas in the equipment [13]. Above all, the switches combination constraints to ensure the safe operation of the dehydration device are described as
i = 1 N u 1 ( i ) = T ; i = 1 N 1 ( u 1 ( i + 1 ) u 1 ( i ) ) 2 = 2 ,
i = 1 N u 2 ( i ) = T ; i = 1 N 1 ( u 2 ( i + 1 ) u 2 ( i ) ) 2 = 2 ,
u 1 ( i ) + u 2 ( i ) 1 ; u 2 ( i ) + u 4 ( i ) 1 ; u 1 ( i ) + u 3 ( i ) 1   ,
u 1 ( i ) = u 11 ( i ) ;   u 2 ( i ) = u 12 ( i ) ;   u 3 ( i ) = u 9 ( i ) ;   u 4 ( i ) = u 10 ( i ) ,
where T is the regeneration and cold purging process time of a single adsorption tower. Equations (4) and (5) respectively limit the uninterrupted process of regeneration of adsorption towers A and B within the scheduling time. Equation (6) avoids the interference between the dehydration and regeneration process of the adsorption tower A and B. Equation (7) limits the accumulation of gas in adsorption towers A and B during the regeneration and dehydration process.
(2) Compressor model: The reciprocating compressor converts the work done by the prime mover into the pressure energy and kinetic energy of the conveyed fluid, and processes natural gas into CNG. It is the core equipment of the CNG main station. The model can be expressed as follows [13]:
W c ( t ) = i = 1 t t s p c u 5 ( i ) ,
m c ( t ) = i = 1 t t s m cmp u 5 ( i ) ,
where t = 1, 2, 3, …, N. Wc(t) is the electrical energy of the compressor before the period t (kWh), and pc is the compressor power (kW). u2(i) is the switch state of the switch u2 in the i-th sampling interval, and mc(t) is the total gas output of the compressor before the period t (kg); mcmp is the compressor outlet mass flow rate (kg/h), which can be calculated by
m cmp = ρ std × Q std . c = M w g M w a × ρ std . a × Q std . c ,
where Qstd.c is the capacity of the compressor under standard conditions (N·m3/h).
(3) Dispenser model: The dispenser is the end control device of the CNG main station and is directly connected to the NGV tank. It is equipped with a flow sensor and an electronic sequence valve controlled by a microprocessor. When the NGV enters the station with a low-pressure tank, the dispenser automatically connects the NGV tank with a reservoir, and the pressure difference allows the gas to be quickly filled into the NGV tank. The pressure of the NGV tank continues to rise in the filling process; thus, the filling rate decreases. When the filling flow rate drops to a certain limit level, the dispenser automatically switches the NGV tank to a higher-pressure reservoir to achieve a faster filling rate. In some cases, NGV may enter the CNG main station with a high-pressure tank for filling, and the dispenser automatically determines the initial filling reservoir on the basis of the initial NGV tank pressure. Above all, the dispenser is always in working condition, and its daily electricity cost is fixed [21]. Its model can be expressed as
W b ( t ) = p b t n ,
where pb is the dispenser device power (kW). The gas flow of the dispenser should be consistent with the CNG filling demand; thus, its gas model is omitted.
(4) Buffer tank model: The reciprocating compressor widely used in CNG main stations has periodic intake and exhaust processes during the compression process [32], which are inevitably accompanied by pressure pulses. When the pulse exceeds the equipment’s tolerable range, resonance occurs inside the compressor, causing damage to various parts of the fuselage [33,34]. A gas pulsation suppression device is needed in front of the reciprocating compressor, and the buffer tank is the most used for CNG main stations. The buffer tank takes advantage of its large volume, which can effectively buffer the intake pressure pulse and make the gas enter the compressor smoothly [35]. However, the volume of the buffer tank is constant. If too much gas is injected into it during the scheduling process, it may exceed the design working pressure of the buffer tank and decrease the pulse suppression effect. Thus, it is necessary to consider the storage capacity of the buffer tank during the scheduling process. The gas mass mcp(t) in buffer tank C at sampling time t can be calculated as follows:
m cp ( t ) = m cp ( 0 ) + m d ( t ) m c ( t ) = m cp ( 0 ) + i = 1 t t s m dmp [ u 9 ( i ) + u 10 ( i ) ] i = 1 t t s m cmp u 5 ( i )
where mcp(0) is the initial gas volume of the buffer tank (kg). The pressure generated by the gas in the buffer tank during the dispatch period should not exceed the design working pressure range of the buffer tank. It can be described as
m cp min m cp ( t ) m cp max ,
where  m cp max  and  m cp min  are the maximum and minimum gas mass that the buffer tank can withstand. The gas mass limits can be obtained from the gas state equation [13]:
m cp max = M V c p cp max z R T max ,   m cp min = M V c p cp min z R T min ,
where M is the molar mass of the gas (kg/mol), and Vc is the volume of the buffer tank (L).  p cp max  and  p cp min  represent the maximum and minimum pressure that the buffer tank can withstand (MPa); z is the gas compression coefficient, and R is the general gas constant (J/(mol·K)). Tmax and Tmin respectively represent the highest and lowest ambient temperatures of the buffer tank (K).
(5) Cascaded storage system model: The CNG main station generally uses the cascaded storage system in the storage link for reducing the filling time of the NGV. The CNG station employs a cascaded storage system, which is divided into three reservoirs of high pressure, medium pressure, and low pressure. This system allows for efficient storage and transfer of natural gas, ensuring a reliable and constant supply for customers. After being processed by the compressor, CNG is stored in the three reservoirs under the control of the priority control panel to maintain the corresponding reservoir pressure.
Only one reservoir is opened by the priority control panel to fill CNG during each period [20], and this switch constraint is described as
u 5 ( i ) + u 6 ( i ) + u 7 ( i ) + u 8 ( i ) = 0 ,
where u6(i), u7(i), and u8(i) are the states of switches u6, u7, and u8 in the i-th sampling time, respectively. The gas mass mhp(t), mmp(t), and mlp(t) of the high-pressure reservoir H, medium-pressure reservoir M, and low-pressure reservoir L in the t-th period should not exceed its reservoir design working pressure range. This can be expressed as follows [21]:
m hp min m hp ( t ) m hp max ,
m mp min m mp ( t ) m mp max ,
m lp min m lp ( t ) m lp max ,
where  m hp min ,   m mp min , and  m hp min  are the minimum mass of three reservoirs of the cascaded storage system (kg), and  m hp max m mp max , and  m lp max  are the maximum mass of three reservoirs of the cascaded storage system (kg). Through the gas state Equation (14), they can also be obtained from the three-level reservoir volumes Vh, Vm, and Vl, and pressure limits  p hp max p mp max p lp max p hp min p mp min , and  p lp min , as expressed in Equations (A1)–(A3) (Appendix A) [21].

3.3. Objective Function

Critical peak pricing (CPP) is an important demand response (DR) method. It stimulates users to change their electricity consumption behaviors and benefits both the grid and users [36]. CPP is formed by superimposing flexible critical peak rates based on time-of-use pricing (TOU), and it can result in a longer timescale load shape change compared with TOU [37]. The total daily electricity cost CN of the CNG main station considering CPP can be calculated by the following equation:
C N = [ W c ( N ) + W d ( N ) ] p e ( t ) = i = 1 N p c p e ( i ) u 5 ( i ) t s + i = 1 N p d 1 t s [ u 3 ( i ) + u 4 ( i ) ] p e ( i ) + i = 1 N p d 2 [ u 1 ( i ) + u 2 ( i ) ] t s p e ( i )
where pe(t) is the electricity price during sampling time t. The electricity cost of the CNG main station also includes other constant cost components. These components do not participate in DR and should be discarded in the optimal economic model of the CNG main station [38].
The high switching frequency of rotating equipment affects its lifespan and increases its maintenance costs [37]. Frequent switching of the compressor for off-peak production is not worth the gain. Therefore, it is necessary to add a penalty term of compressor switching frequency into the objective function. The CNG main station daily comprehensive electricity cost J is expressed as
J = ψ C N + ( 1 ψ ) f N = ψ C N + ( 1 ψ ) t = 1 N 1 ( u 5 ( t + 1 ) u 5 ( t ) ) 2 .

3.4. Constraints

The open-loop strategy may cause system instability in the continuous operation progress; thus, it is necessary to set terminal constraints in the gas storage equipment model. The terminal constraints specific expressions can be expressed as
m ap ( 0 ) M a m ap ( N ) m ap ( 0 ) + M a ,
m hp ( 0 ) M h m hp ( N ) m hp ( 0 ) + M h ,
m mp ( 0 ) M m m mp ( N ) m mp ( 0 ) + M m ,
m lp ( 0 ) M l m lp ( N ) m lp ( 0 ) + M l ,
where Ma, Mh, Mm, and Ml are the terminal restriction margins of the buffer tank and the cascaded storage system. They generally take 10% of the initial gas mass of the corresponding storage device [21]. Furthermore, the decision switch variables uj are all binary, the constraints can be expressed as
u j ( i ) { 0 , 1 } ,
where j = 1, 2, …, 8. The switch variables u1(i) and u11(i), u2(i) and u12(i), u3(i) and u9(i), and u4(i) and u10(i) are kept in sync, and only one switch variable in each group needs to participate in the day-ahead scheduling. Meanwhile, the day-ahead economic optimal model of the CNG main station should meet the operating constraints of the equipment model in the station. All in all, Equations (4)–(7), (13), (15), (16)–(18), and (21)–(25) together constitute the constraints of the day-ahead economic optimal model of the CNG main station.

4. Algorithm Description

The day-ahead economic optimal model of the CNG main station contains 8 N decision variables, and it is a large-scale 0–1 mixed-integer nonlinear programming model when the sampling time ts is small. Large-scale 0–1 variable programming is one of the current research focuses of evolutionary algorithms [39,40,41,42,43]. Having the advantages of better convergence, simpler calculation, and fewer parameter settings for 0–1 programming problems [44,45,46], the genetic algorithm (GA) has received more and more attention in this field. However, the massive variable dimension has become a bottleneck when decision variables are increasing.
Some experts have proposed that the cooperative co-evolution method can effectively improve the efficiency of evolutionary algorithms [41,47]. According to this method, a bilevel programming method combined with GA was used to solve the optimal model of the CNG main station: The station model is decomposed into a two-level programming model, and the decision variables are divided into two groups on average. The mature MATLAB Solving Constraint Integer Programs (SCIP) solver in the OPTI toolbox was used to solve the fitness of the upper and lower levels, respectively. Only the intermediate variables needed to participate in the optimization process of GA; thus, the convergence efficiency of the algorithm was effectively improved.

4.1. Bilevel Programming Model of CNG Main Station

Bilevel programming explores the interaction between two subjects with different objective functions in an orderly or noncooperative manner [48]. The upper-level decision makers have decision-making priority, and the lower-level decision makers respond according to their interests. It is essentially a Stackelberg game [49].
(1) Upper-level model: The upper-level model is mainly the CNG main station compression and storage process system, including the compressor and cascaded storage system model. The objective function of the upper-level model is to minimize the daily comprehensive power cost of the compression and storage process system, denoted as J1. It can be expressed as
J 1 = ψ W c ( N ) p e ( t ) + ( 1 ψ ) i = 1 N 1 ( u 5 ( i + 1 ) u 5 ( i ) ) 2 = ψ i = 1 N p c p e ( i ) u 5 ( i ) t s + ( 1 ψ ) i = 1 N 1 ( u 5 ( i + 1 ) u 5 ( i ) ) 2
The upper-level model constraints are composed of Equations (13), (15), (16)–(18), and (22)–(24). The upper-level model can be established as
min   f 1 T x U + ( f 2 T x U ) ( f 2 T x U ) subject   to   A eq . c x U = b eq . c b min . U A U x U b max . U l x U u
The upper-level model achieves the minimum objective function ( f 1 T x U + ( f 2 T x U ) ( f 2 T x U ) ) under the constraints of equality constraints (Aeq.cxU = beq.c), inequality constraints (bmin.UAUxUbmax.U), and the limits of decision variables (lxUu). The decision variables u5(i), u6(i), u7(i), and u8(i) together form the decision variable vector xU of the upper model. It can be expressed as
x U = [ u 5 ( 1 ) u 5 ( N )   u 6 ( 1 ) u 6 ( N ) u 7 ( 1 ) u 7 ( N ) u 8 ( 1 ) u 8 ( N ) ] T 4 N × 1
The specific descriptions of the matrices Aeq.c, AU, and f2 and the vectors f1, beq.c, bmin.U, bmax.U, l, and u are shown in Equations (A4)–(A18) (Appendix A).
(2) Lower-level model: The lower-level model is mainly the CNG main station dehydration process system, including the pretreatment system composed of the dehydration device model and the buffer tank model [13]. The goal of the lower-level model is to minimize the daily comprehensive power cost of the dehydration process system of the CNG main station, denoted as J2. It can be expressed as
J 2 = ψ p e ( t ) W d ( N ) = ψ i = 1 N p d 1 t s [ u 3 ( i ) + u 4 ( i ) ] p e ( i ) + ψ i = 1 N p d 2 t s [ u 1 ( i ) + u 2 ( i ) ] p e ( i )
The lower model constraints are composed of Equations (4)–(7), (13), and (21). The lower-level model is established as
min   f 3 T x L subject   to   A eq . d x L = b eq . d ( A eq . m x L ) ( A eq . m x L ) = b eq . m ( A eq . n x L ) ( A eq . n x L ) = b eq . n b min . L A L x L b max . L l x L u
The lower-level model achieves the minimum objective function ( f 3 T x L ) under the equality constraints (Aeq.dxL = beq.d, (Aeq.mxL)·(Aeq.mxL) = beq.m, (Aeq.nxL)·(Aeq.nxL) = beq.n)), inequality constraints (bmin.LALxLbmax.L), and the limits of decision variables (lxLu). The decision variables u1(i), u2(i), u3(i), and u4(i) together form the decision variable vector xL of the lower-level model. It can be expressed as
x L = [ u 1 ( 1 ) u 1 ( N )   u 2 ( 1 ) u 2 ( N )   u 3 ( 1 ) u 3 ( N ) u 4 ( 1 ) u 4 ( N ) ] T 4 N × 1
The matrices Aeq.d, Aeq.m, Aeq.n, and AL and the vector f3, beq.d, beq.m, beq.n, bmin.L, and bmax.L are described in Equations (A19)–(A35) (Appendix A).

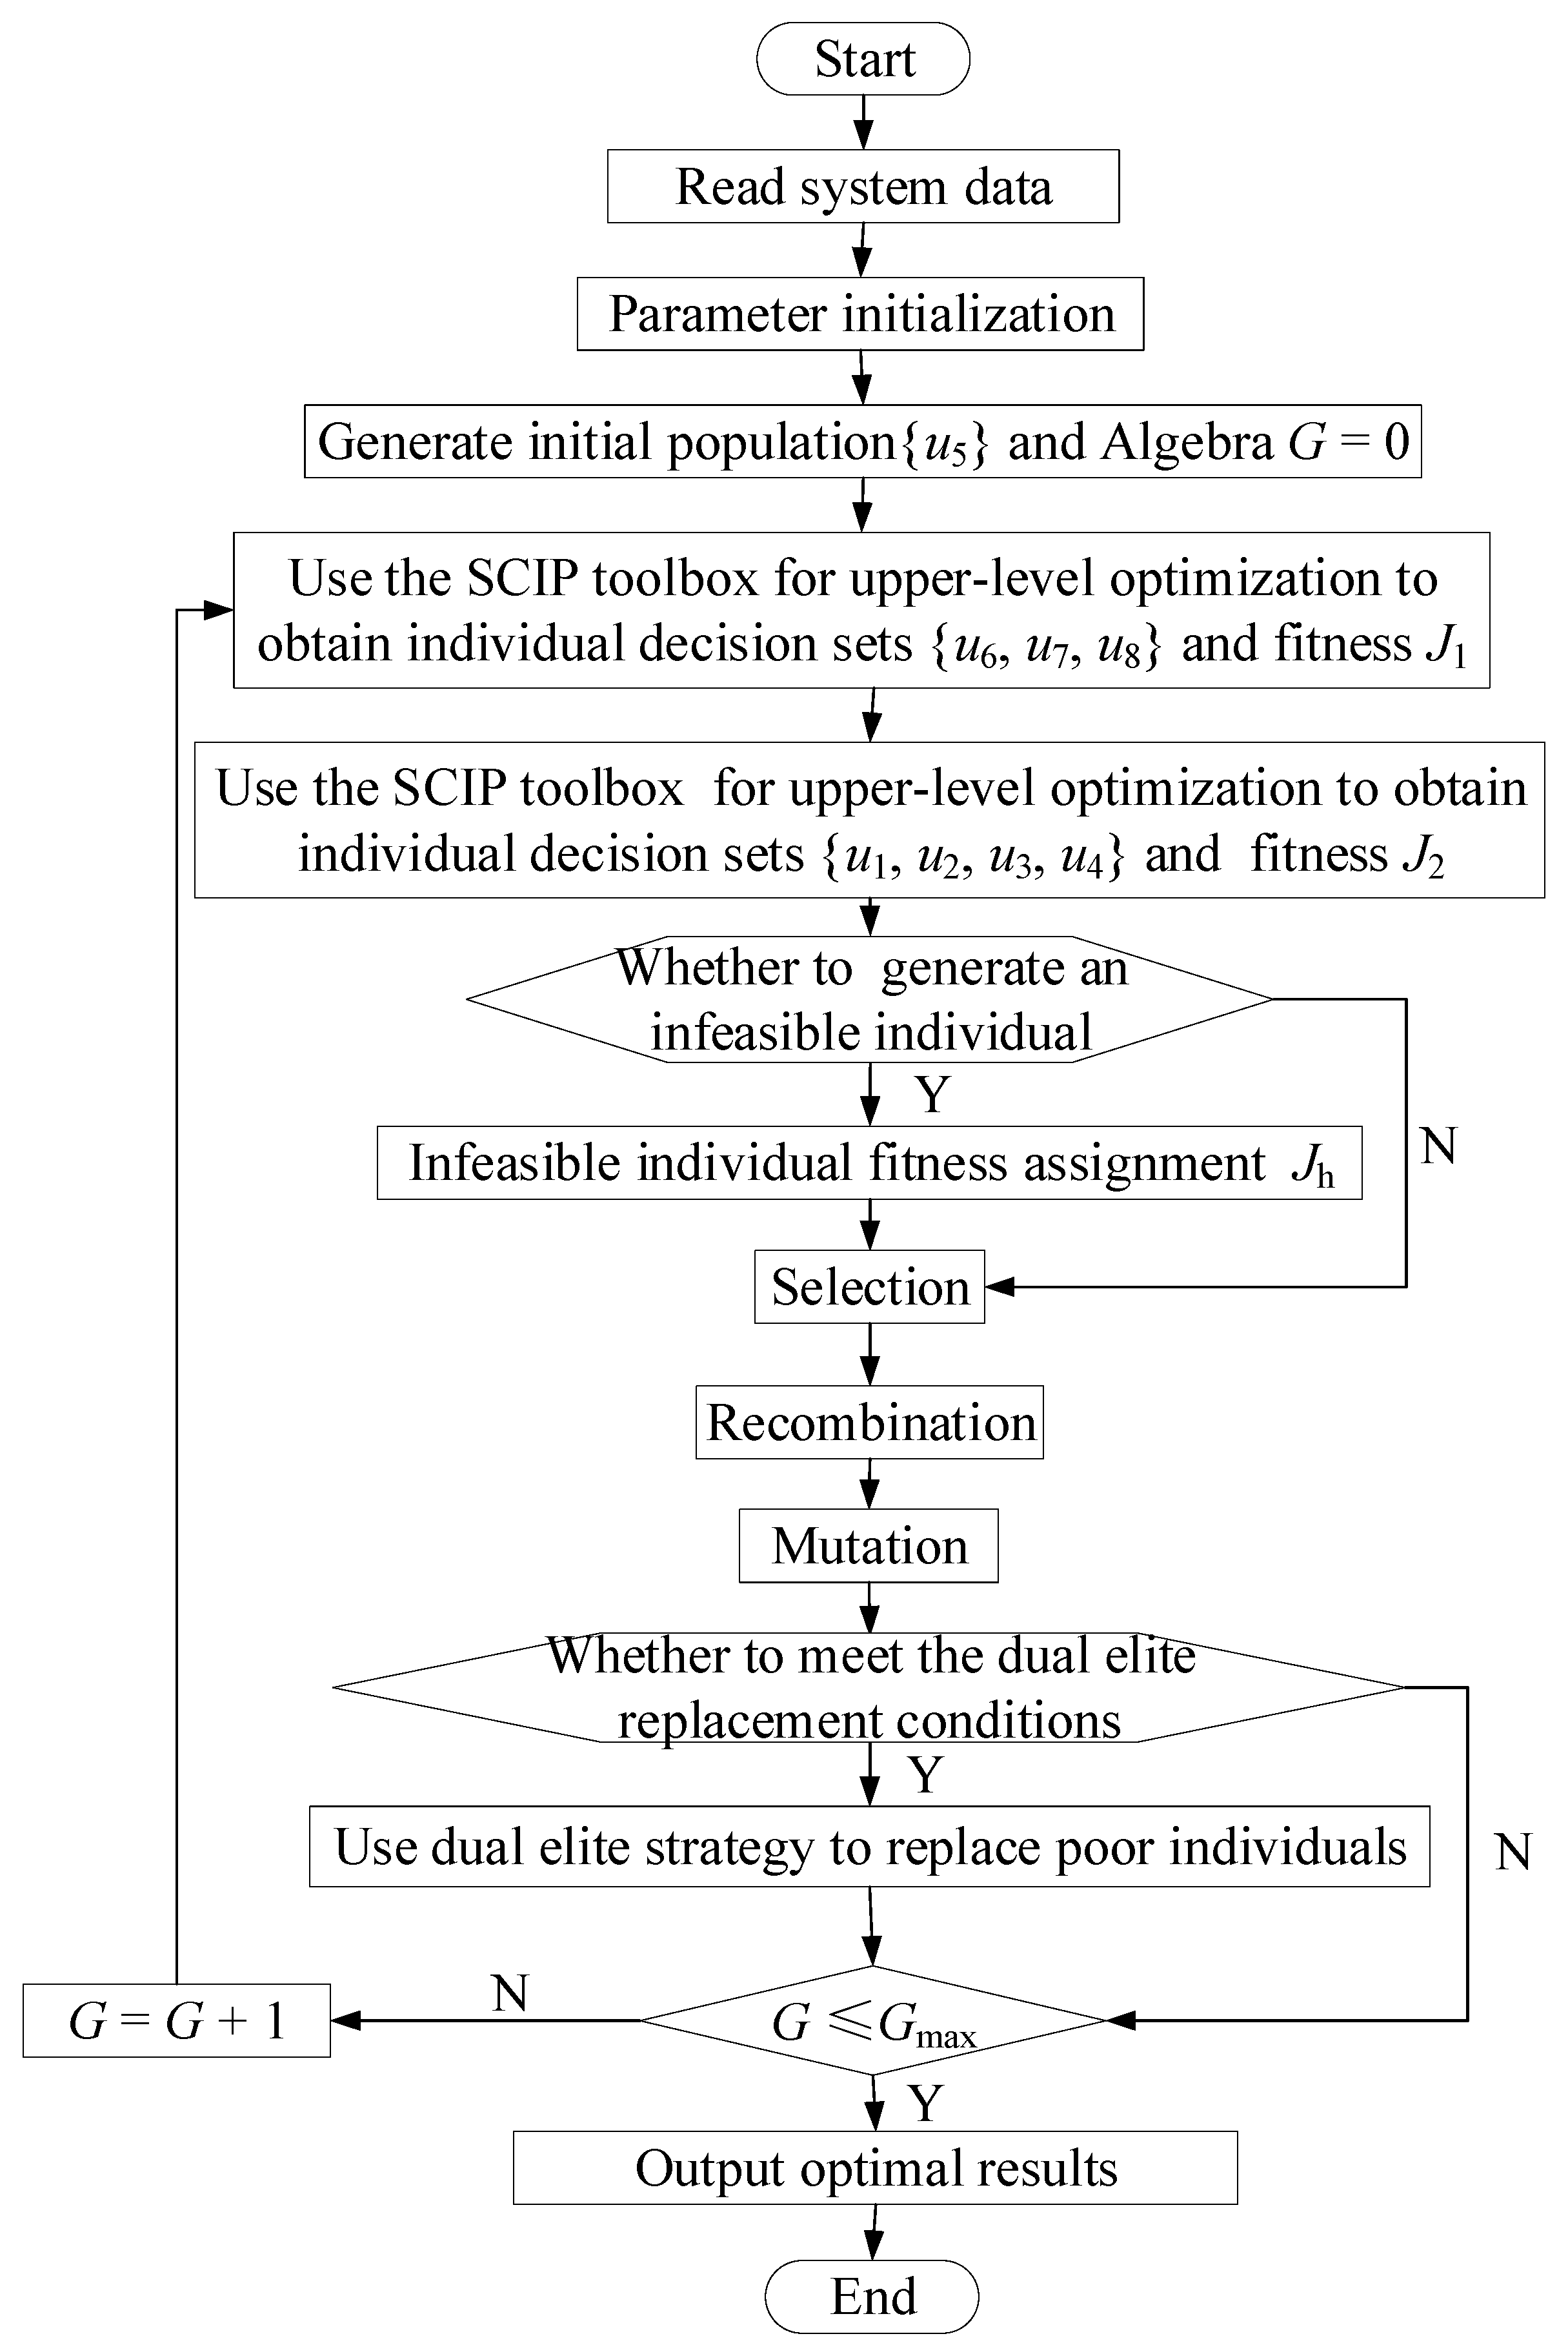
4.2. The Process of Bilevel Programming Method Combined with GA

The GA and mature SCIP solver were used to solve this bilevel model. The process of bilevel programming method combined with GA is as follows:
(1) The algorithm randomly generates the initial population, and the number of individuals is Np. The intermediate variable u5 is selected individually. Each individual gene uses N-bit binary code, where u5 = {u5(1), u5(2), …, u5(N)}.
(2) The algorithm brings the genetic individual u5 as a known quantity into the upper model and introduces the SCIP solver to search the optimal combination of {u6, u7, u8} by the objective function J1. According to the optimal upper-level results, the optimal switches combination of {u1, u2, u3, u4} is solved by the SCIP solver with the smallest objective function J2.
(3) The inferior value Jh is assigned to the infeasible individuals’ fitness generated in step 2. The infeasible individuals are eliminated in the selection process. The linear sorting method is used to allocate fitness, and stochastic universal selection is introduced to select high-fitness individuals in the selection process. The probability of an individual being selected is proportional to its fitness, and individuals with low fitness are not able to pass genes to their offspring through genetic processes. The value of Jh is much larger than the optimized solution. Therefore, the probability of the infeasible individual being selected is the lowest in the entire population, and the infeasible individual is gradually eliminated.
(4) The order crossover is used in the recombination process with a crossover rate of pc. The discrete mutation operator is used in the mutation process with a mutation rate of pm.
(5) Genetic manipulation may destroy the optimal individual. If the optimal individual is destroyed in step 4), the dual-elite retention strategy is used to ensure the algorithm’s solution speed. When the optimal individual fitness in the current generation is less than the optimal individual fitness in the previous generation, the two worst fitness individuals in the current generation are replaced by the two best individuals in the previous generation.
(6) The next-generation optimization process is repeated to the maximum number of iterations, and the optimal dispatch scheme of the CNG main station is outputted.
The specific calculation flowchart is shown in Figure 3. It can be observed that the algorithm decomposes the 8 N decision vector set into three decision vector sets, and GA only needs to process the N decision vector set. This effectively improves the solution efficiency of GA.

5. Case Data

5.1. CNG Main Station Data

A CNG main station in China was selected as the example for research. According to the pipeline intake quality and CNG filling demand, the CNG main station is equipped with a dehydration device, a compressor, three attached buffer tanks, a cascade storage system, and three dispensers. The corresponding switches are automatically controlled by a PLC according to the preset operation strategy. The equipment parameters of the CNG main station are shown in Table 1.

5.2. Critical Peak Pricing Mechanism

The CPP is usually based on TOU pricing. The CPP system includes critical peak days and hours, critical peak prices, peak prices, standard prices, and valley prices. The local power company only imposes the critical peak rate from June to August, while other periods still use the TOU pricing. The electricity price mechanism can be expressed as follows [50]:
p eHD ( t ) = p o = 0.3180   C / kWh t [ 0 , 7 ] [ 23 , 24 ] h p s   = 0.6089   C / kWh t [ 7 , 8.5 ] [ 11.5 , 16 ] [ 21 , 23 ] h p p   = 0.8998   C / kWh t [ 8.5 , 10.5 ] [ 16 , 19 ] h p c   = 1.0161   C / kWh t [ 10.5 , 11.5 ] [ 19 , 21 ] h ,
p eLD ( t ) = p o = 0.3180   C / kWh t [ 0 , 7 ] [ 23 , 24 ] h p s   = 0.6089   C / kWh t [ 7 , 8.5 ] [ 11.5 , 16 ] [ 21 , 23 ] h p p   = 0.8998   C / kWh t [ 8.5 , 11.5 ] [ 16 , 21 ] h ,
where C represents Chinese yuan. peHD(t) and peLD(t) respectively represent the CPP in the high-demand season (June to August) and the low-demand season. po, ps, pp, and pc are the valley price, the standard price, the peak price, and the critical peak electricity price, respectively.

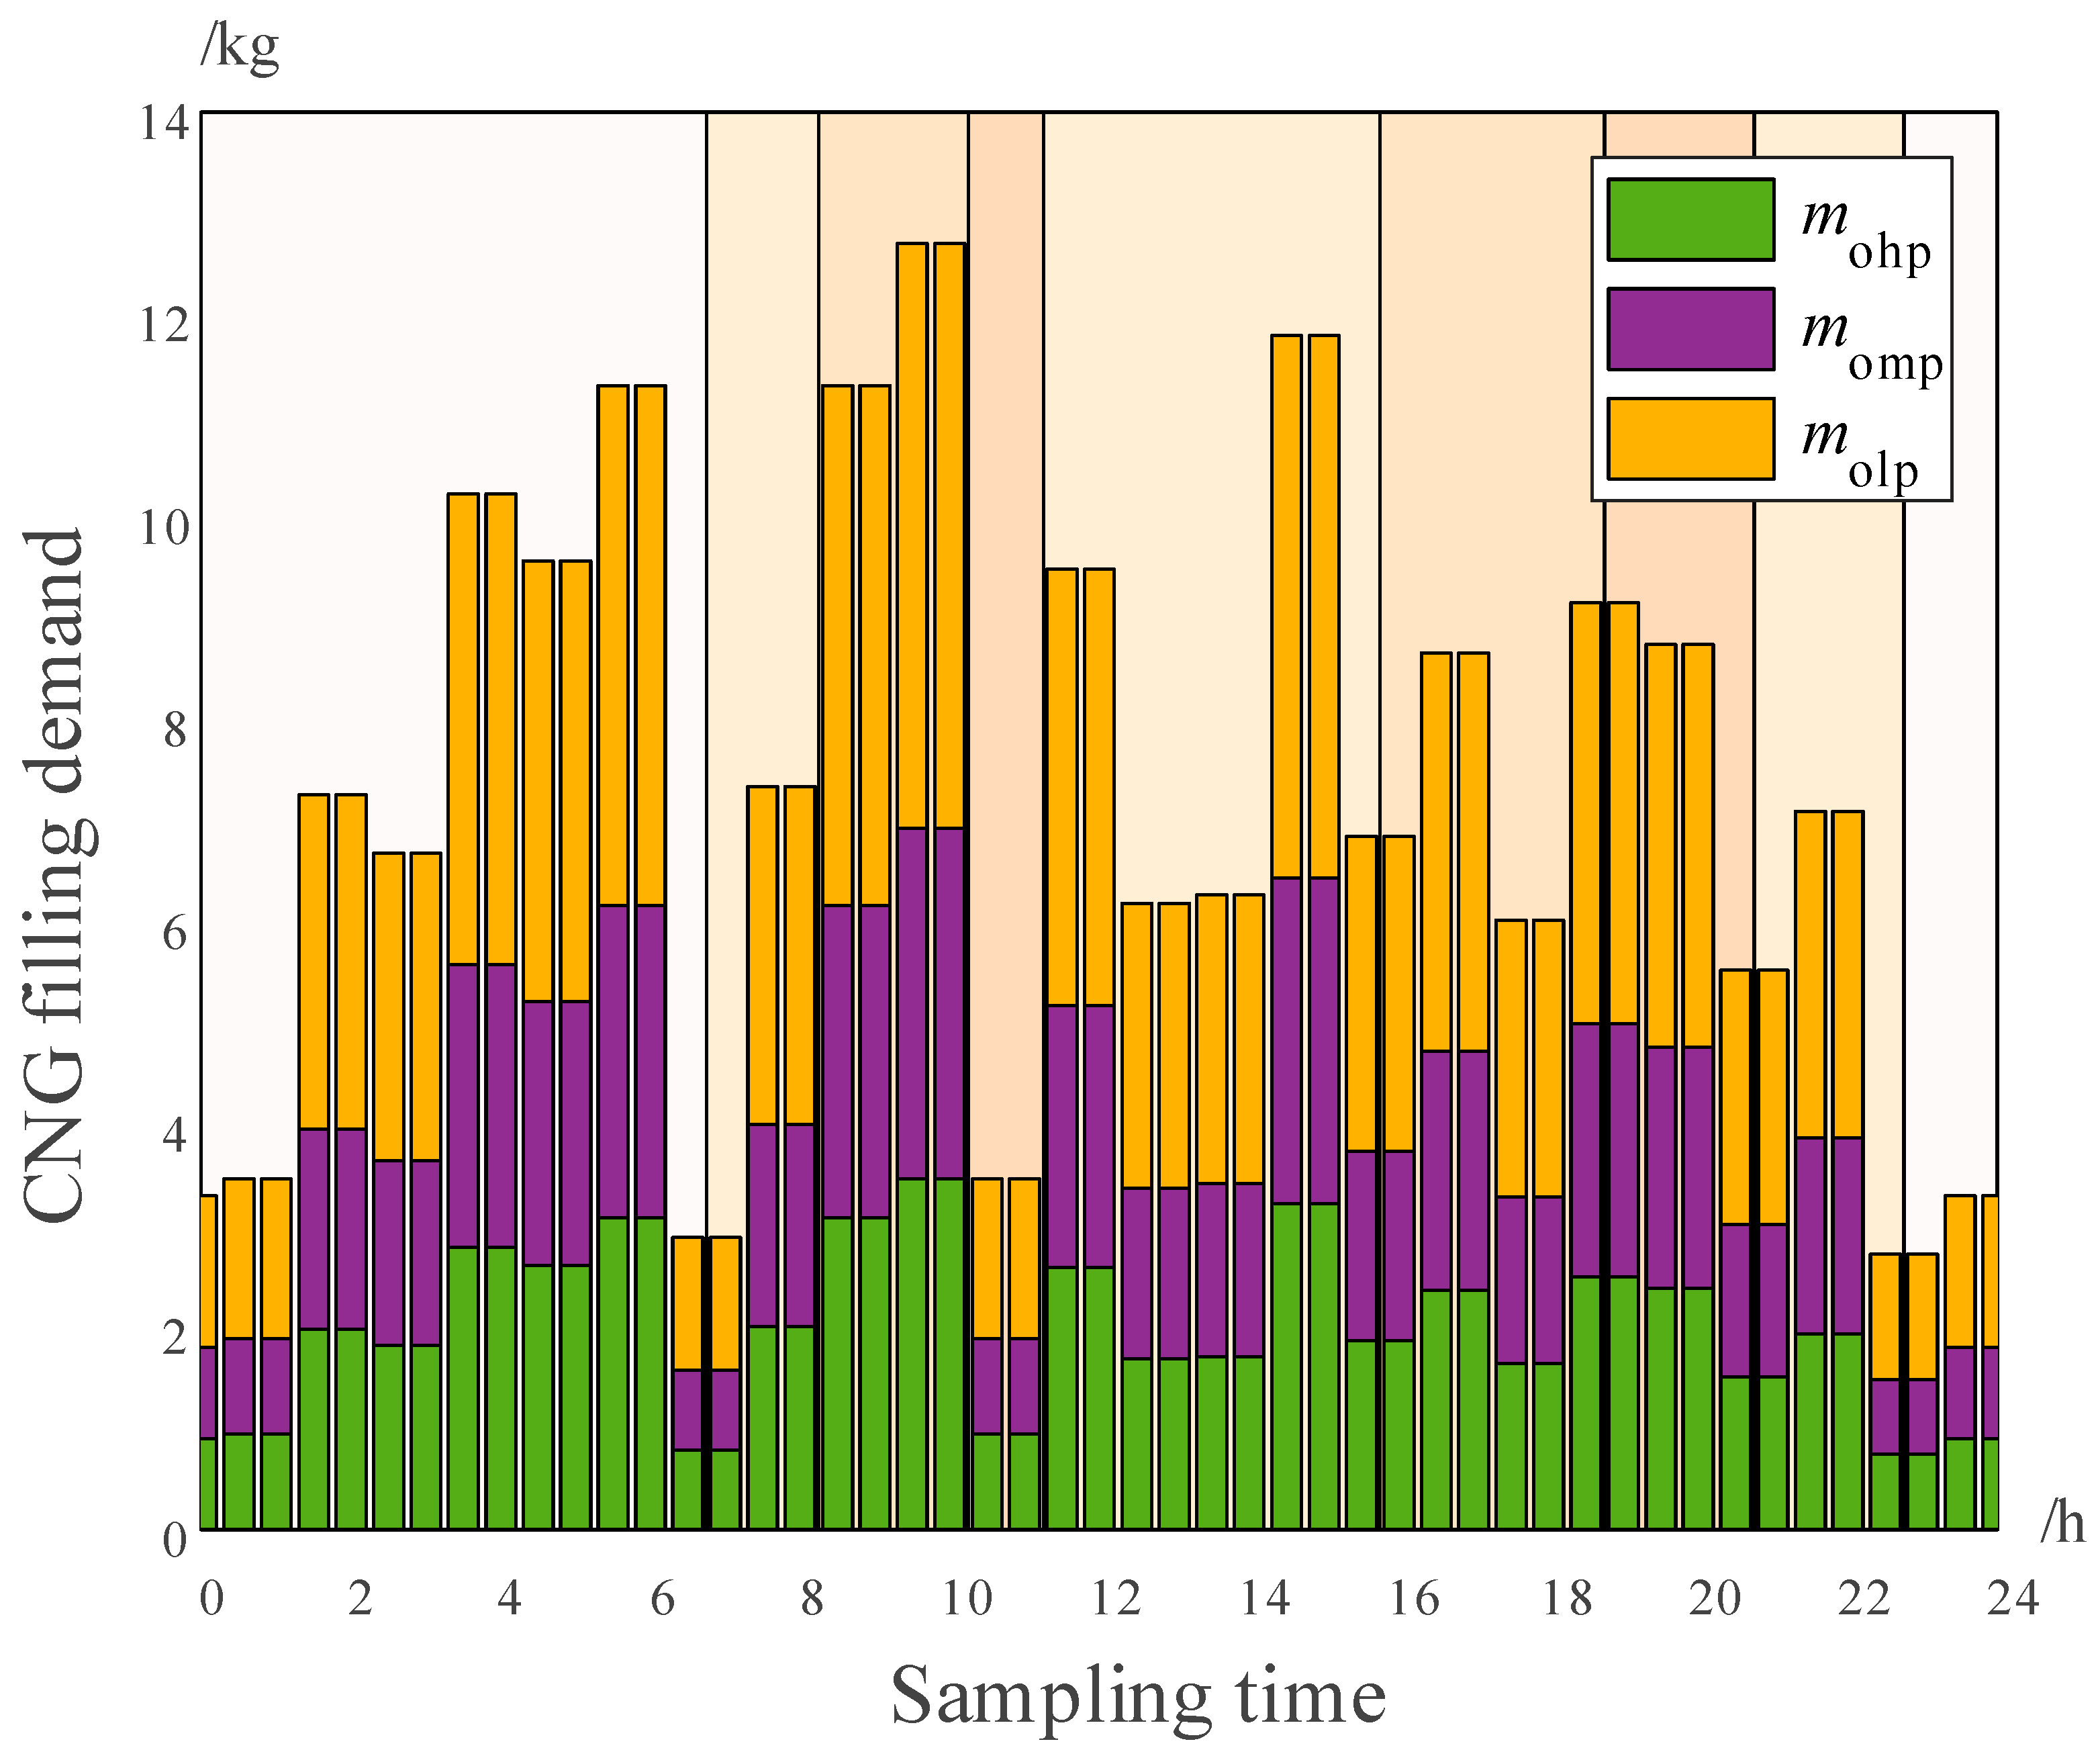
5.3. CNG Filling Demand

The main users of NGV in China are public service vehicles such as buses, taxis, logistics distribution vehicles, passenger cars, and sanitation vehicles. Their working hours and modes are relatively fixed [9], and the CNG filling demand of the station can remain relatively stable. By tracking the filling demand of CNG refueling stations in different cities, the authors of [51] found that the monthly CNG filling demand of CNG refueling stations was basically stable throughout the year, independent of seasonal changes. Meanwhile, the daily CNG filling demand also changed little during the months, and the unevenness coefficient was between 0.82 and 1.15 [52]. Above all, the typical CNG filling demand curve of the CNG main station obtained from the historical records of the flow sensor in the dispenser can be used as the basis for DR scheduling. The CNG filling demand curve of the CNG main station obtained from the dispenser is shown in Figure 4. Public service vehicles generally fill up storage tanks in advance to meet transportation service requirements during peak hours. Therefore, the CNG filling demand at this station increases significantly a few hours before the morning and evening peaks, and the CNG filling demand of this station decreases during morning and evening peak hours. There is a certain difference in time characteristics between the CNG filling demand and the CPP mechanism, which is the basis for CNG filling stations to participate in DR. Above all, CPP can be considered to optimize the electricity consumption behavior of the CNG main station without changing the CNG filling demand at the station.

6. Model Verification and Analysis

The day-ahead dispatch model solving algorithm for the CNG main station was implemented using MATLAB programming. The crossover rate (pc) in GA and the mutation rate (pc) were set to 0.6 and 0.01, respectively. The number of population individuals was set to 25, and the maximum number of iterations was 40. The sampling time of the CNG main station model (C) was 0.5 h. The initial gas volumes of the buffer tanks, high-pressure, medium-pressure, and low-pressure reservoirs were set to 150, 450, 350, and 250 kg, respectively. The weight factor (ξ) was set to 0.01 to make the penalty term the same order of magnitude as the CN. The inferior solution (Jh) was set to 40.

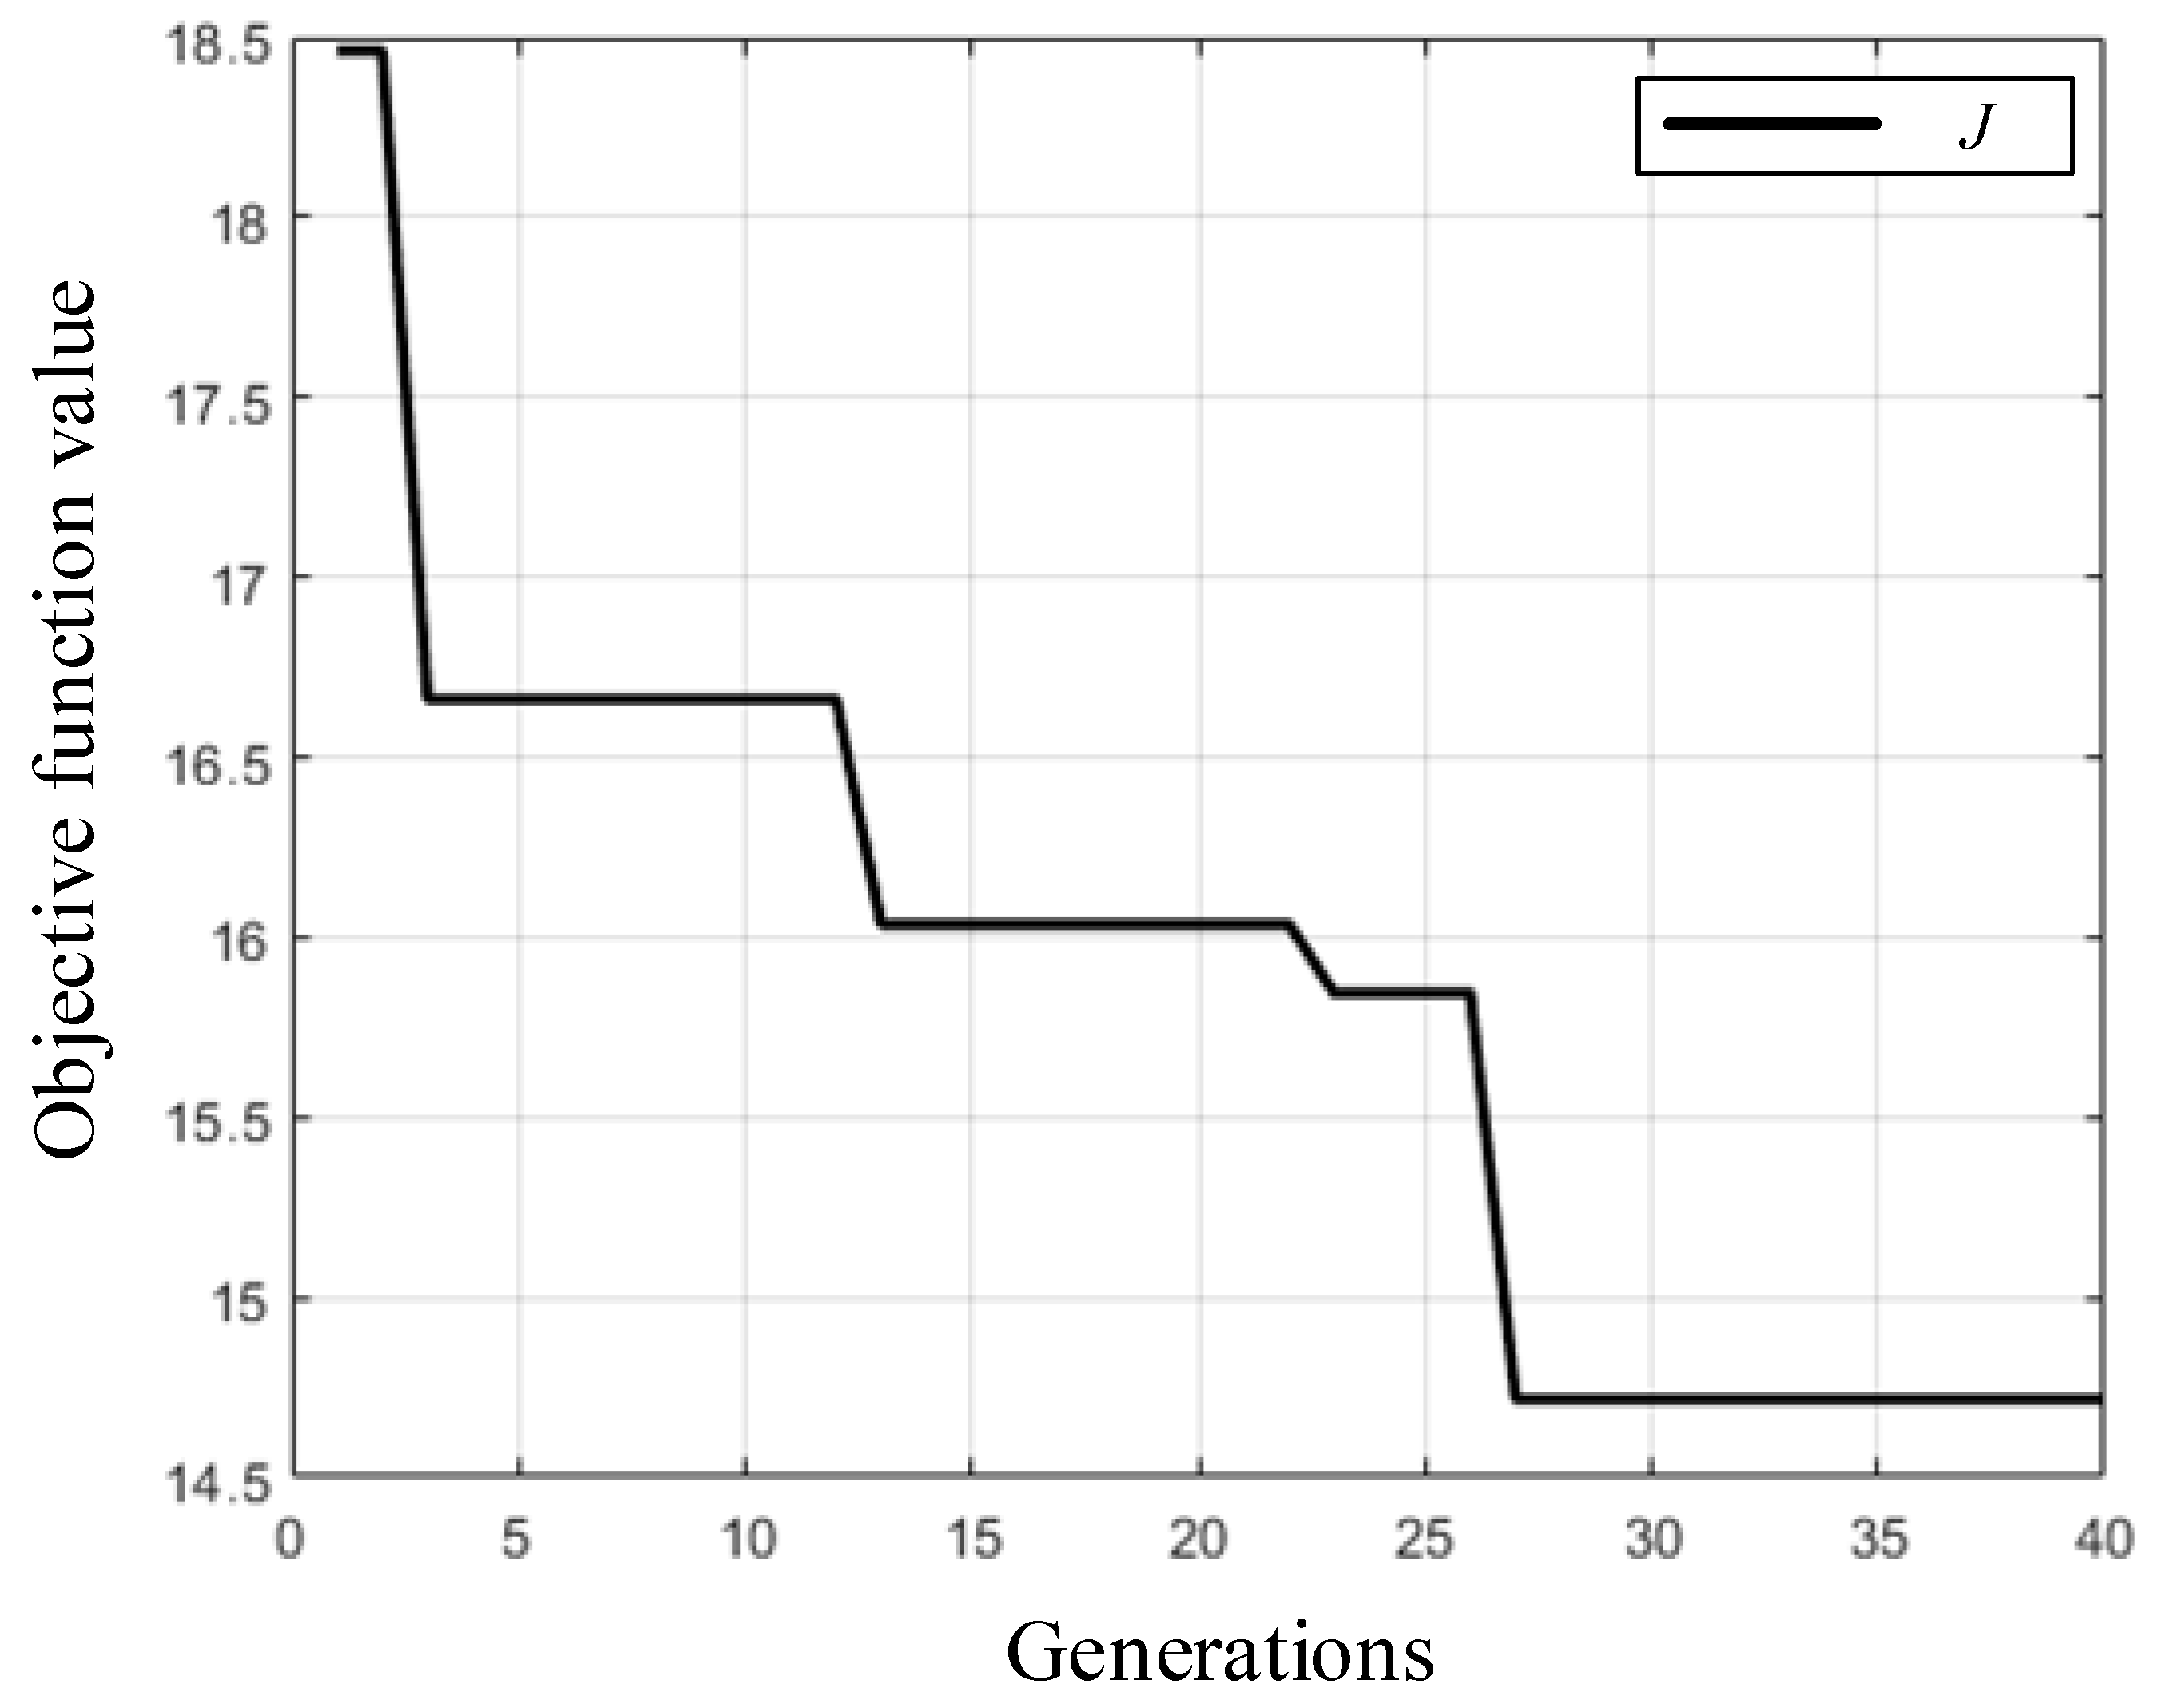
6.1. Solving Efficiency Comparison Experiment of Algorithms

To verify the efficiency of the day-ahead dispatch model solving algorithm during the evolution process, two standard comparison algorithms were introduced for comparison experiments, Algorithm I and Algorithm II, using the GA and SCIP solvers to solve the whole model, respectively. Neither algorithm used the decomposed bilevel model, and the parameter settings of the two algorithms were the same as the proposed algorithm. The computer used for the solution was configured with an Intel Core i5-9300H CPU and 24 GB memory. The comparative experiment results are as follows: Algorithm I was trapped in an infeasible area until the maximum iterations. whereas Algorithm II returned an invalid value for exceeding the maximum calculation time of the solver. The algorithm introduced in this paper obtained an effective scheduling scheme in the first iteration process and converged in the 27th generation. The optimal process of the introduced algorithm is shown in Figure 5, where the optimal scheme objective function value J was 14.7165.

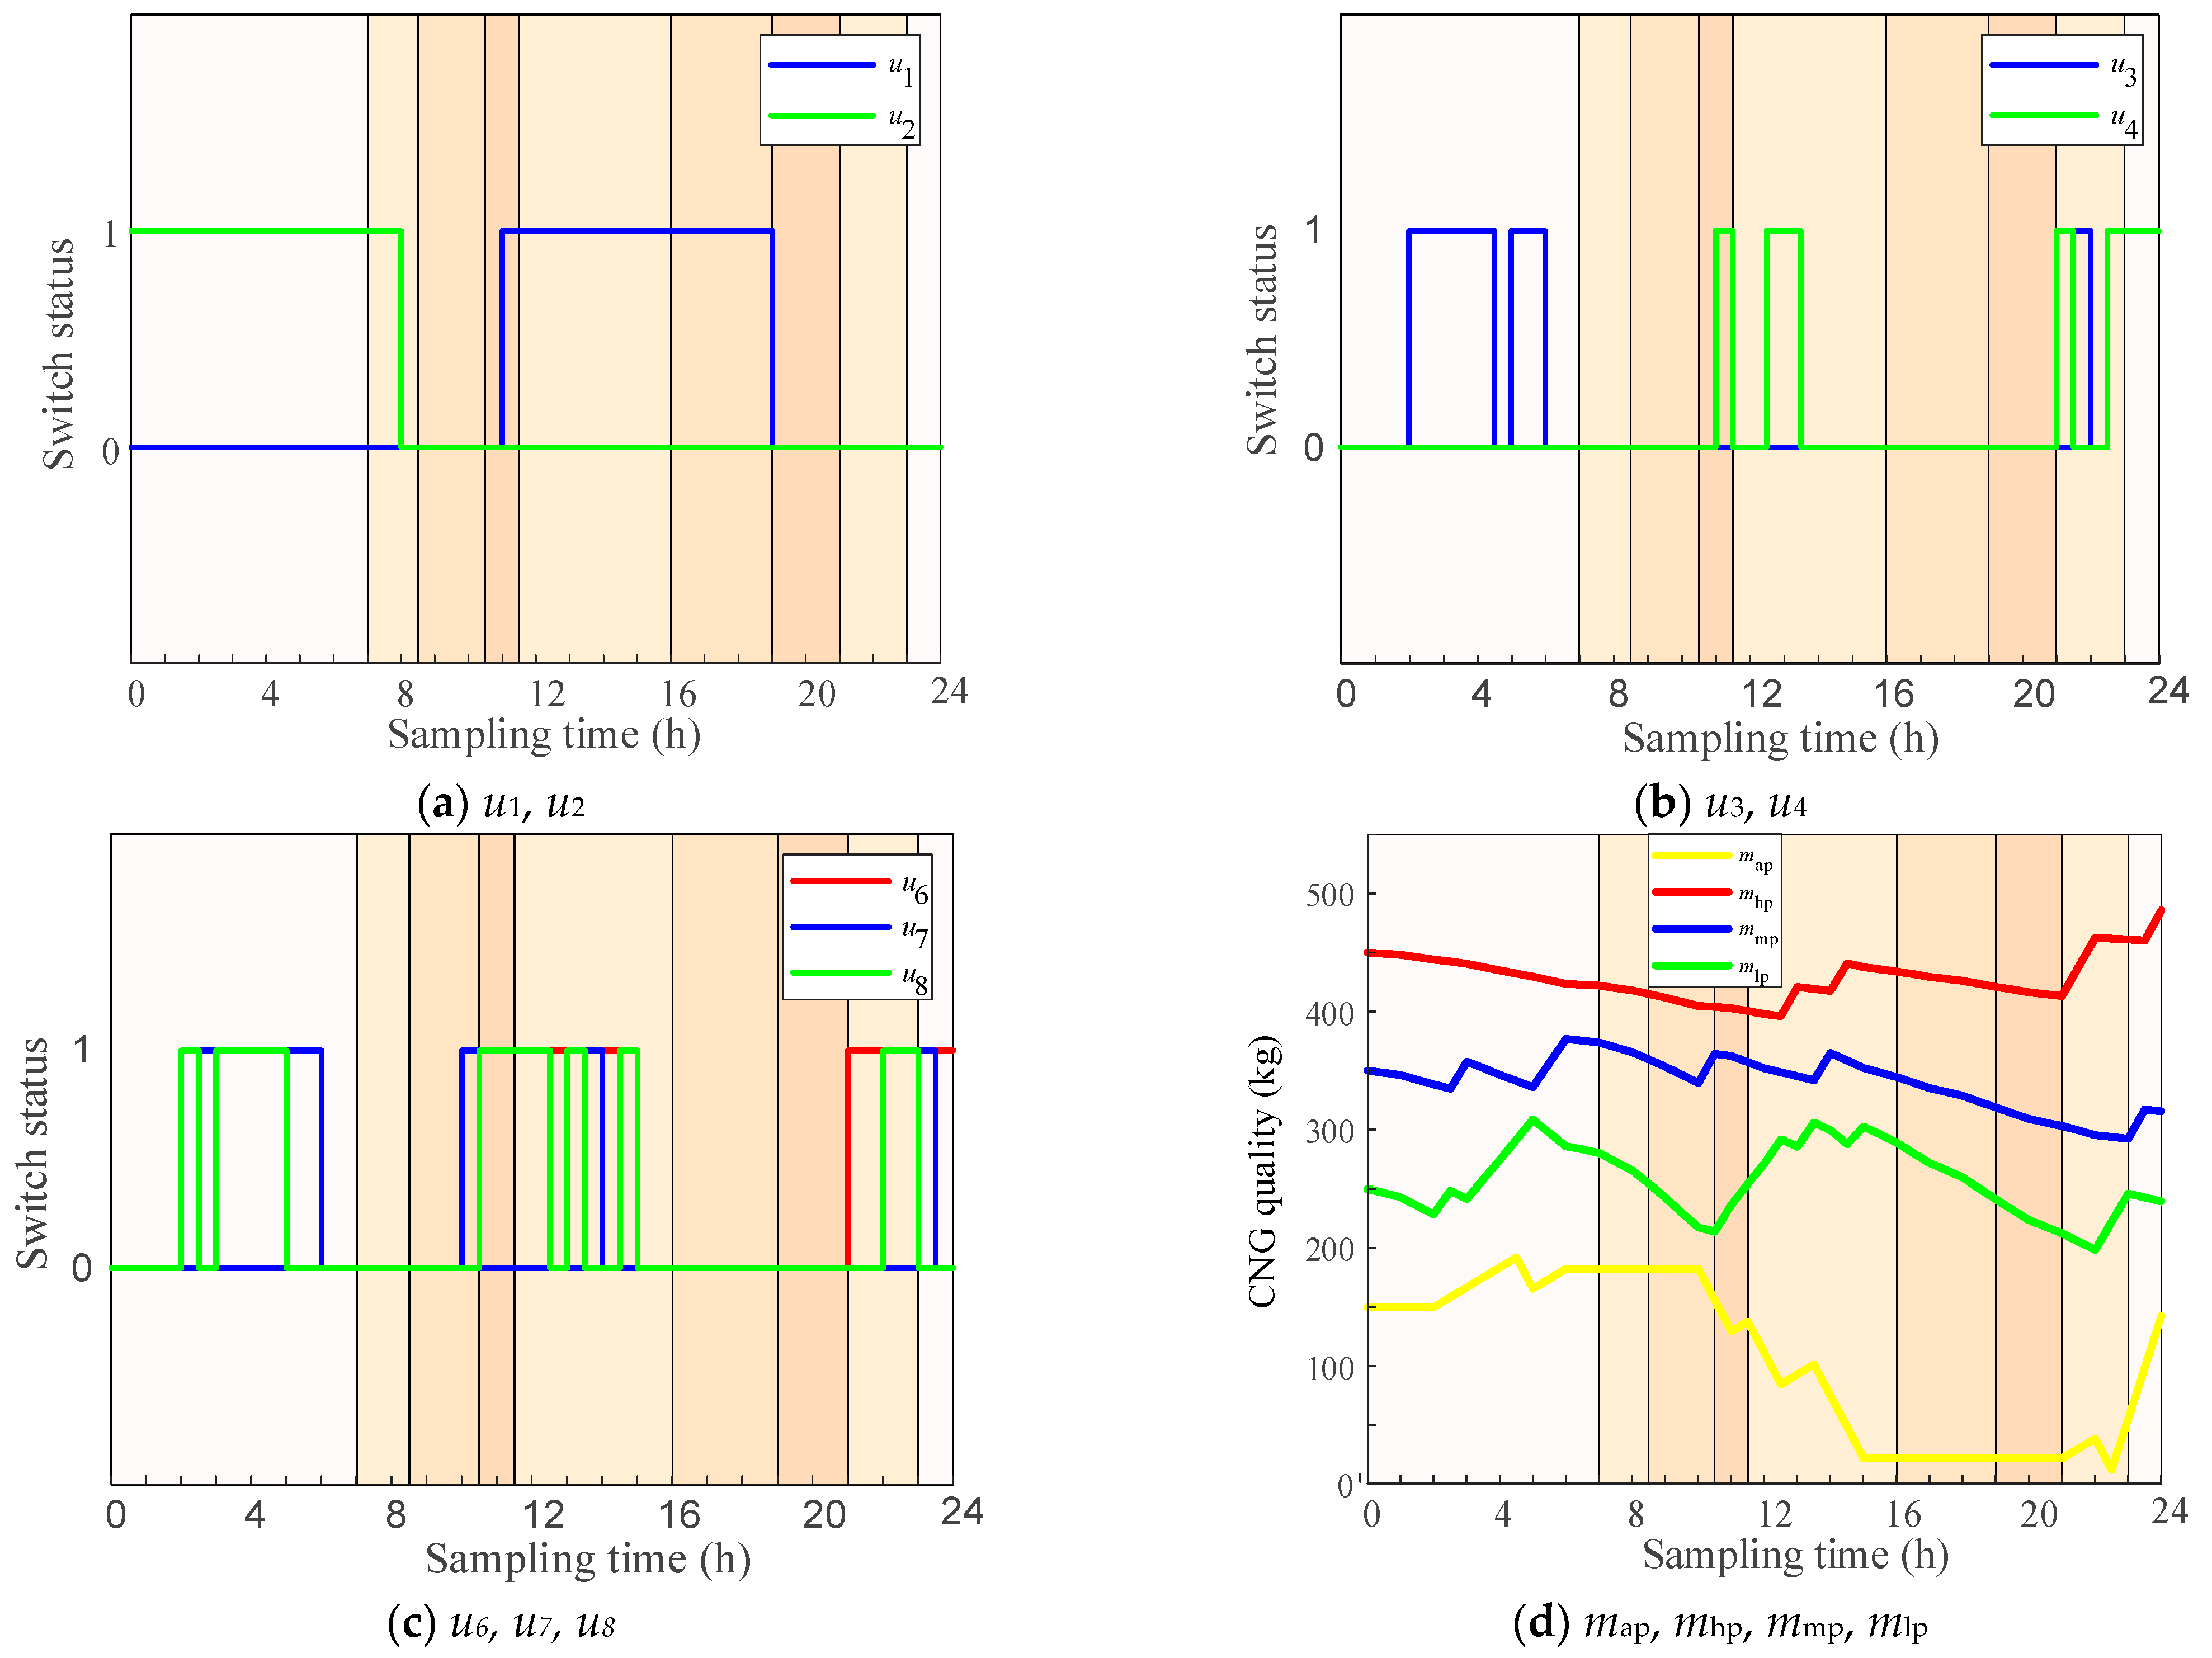
6.2. Economy Comparative Experiment of CNG Main Stations Dispatch Models Considering CPP

The optimization results of the day-ahead optimal economic dispatch model of the CNG main station are shown in Figure 6. From Figure 6c,d, it can be observed that the compressor basically avoids power consumption during the evening peak period. However, to meet the night CNG filling demand and low switching frequency requirements, the compressor continues to consume power during the morning peak period. Meanwhile, the dispatch of the upper-level compressor model also influences the behaviors of the lower-level dehydration device model during the evening peak period. From Figure 6a,b, it can be observed that the dehydration device basically avoids power consumption during the evening peak period. However, the dehydration device should complete the regeneration and cold purging progress in advance, and both towers need to work for the continuous dehydrated gas demand of the compressor. This results in power consumption behavior of the dehydration device during the morning and evening peak periods.
To verify the economy of the optimal dispatch scheme, the original operation strategy dispatch results to the typical CNG filling demand of the CNG main station were used for comparison. The scheduling result is shown in Figure 7. The original operation strategy of the CNG main station can be described as follows: when the reservoir pressure of the cascaded storage system drops to the lower limit, the PLC automatically controls the compressor to work and replenish CNG to the upper limit of the reservoir pressure. In the case of conflicts between the reservoir switches, the reservoir of higher pressure is replenished first to ensure the efficiency of the fast filling process. The PLC of the buffer tank employs the same strategy as the cascaded storage system. The dual adsorption towers in the dehydration device alternately perform dehydration work. The regeneration and cold purging progress of the adsorption towers is carried out at a fixed time of night to meet the day CNG filling demand. The action value of the PLC should have a certain margin Mg from the pressure limit of the gas storage device [9] considering real-time load requirements. Mg was selected 25 kg; other parameter settings were consistent with the optimal dispatch model.
Compared with the original operation strategy of the CNG main station, the proposed strategy could reduce the daily comprehensive electricity cost index J from 21.2786 to 14.7165 with a 30.84% reduction. Furthermore, the daily electricity cost CN decreased from 1236.86 C to 976.65 C with a 21.04% reduction, and the compressor switching frequency fN decreased from nine times to five times with a 50.00% reduction. Different compressor operation times in scheduling schemes would lead to a difference in the processed CNG mass. If only the daily comprehensive power cost of the CNG main station is compared, it is difficult to judge the economy. To address this, the average comprehensive power cost of processing one unit of CNG (dCN) was introduced to compare the economy of the dispatching schemes. This can be expressed as follows:
d C N = C N m c ( N )
According to Equation (34), the proposed strategy could reduce dCN from 0.97 C to 0.77 C with a 20.62% reduction. Above all, the proposed economic dispatch strategy of the CNG main station was more economical after considering CPP.

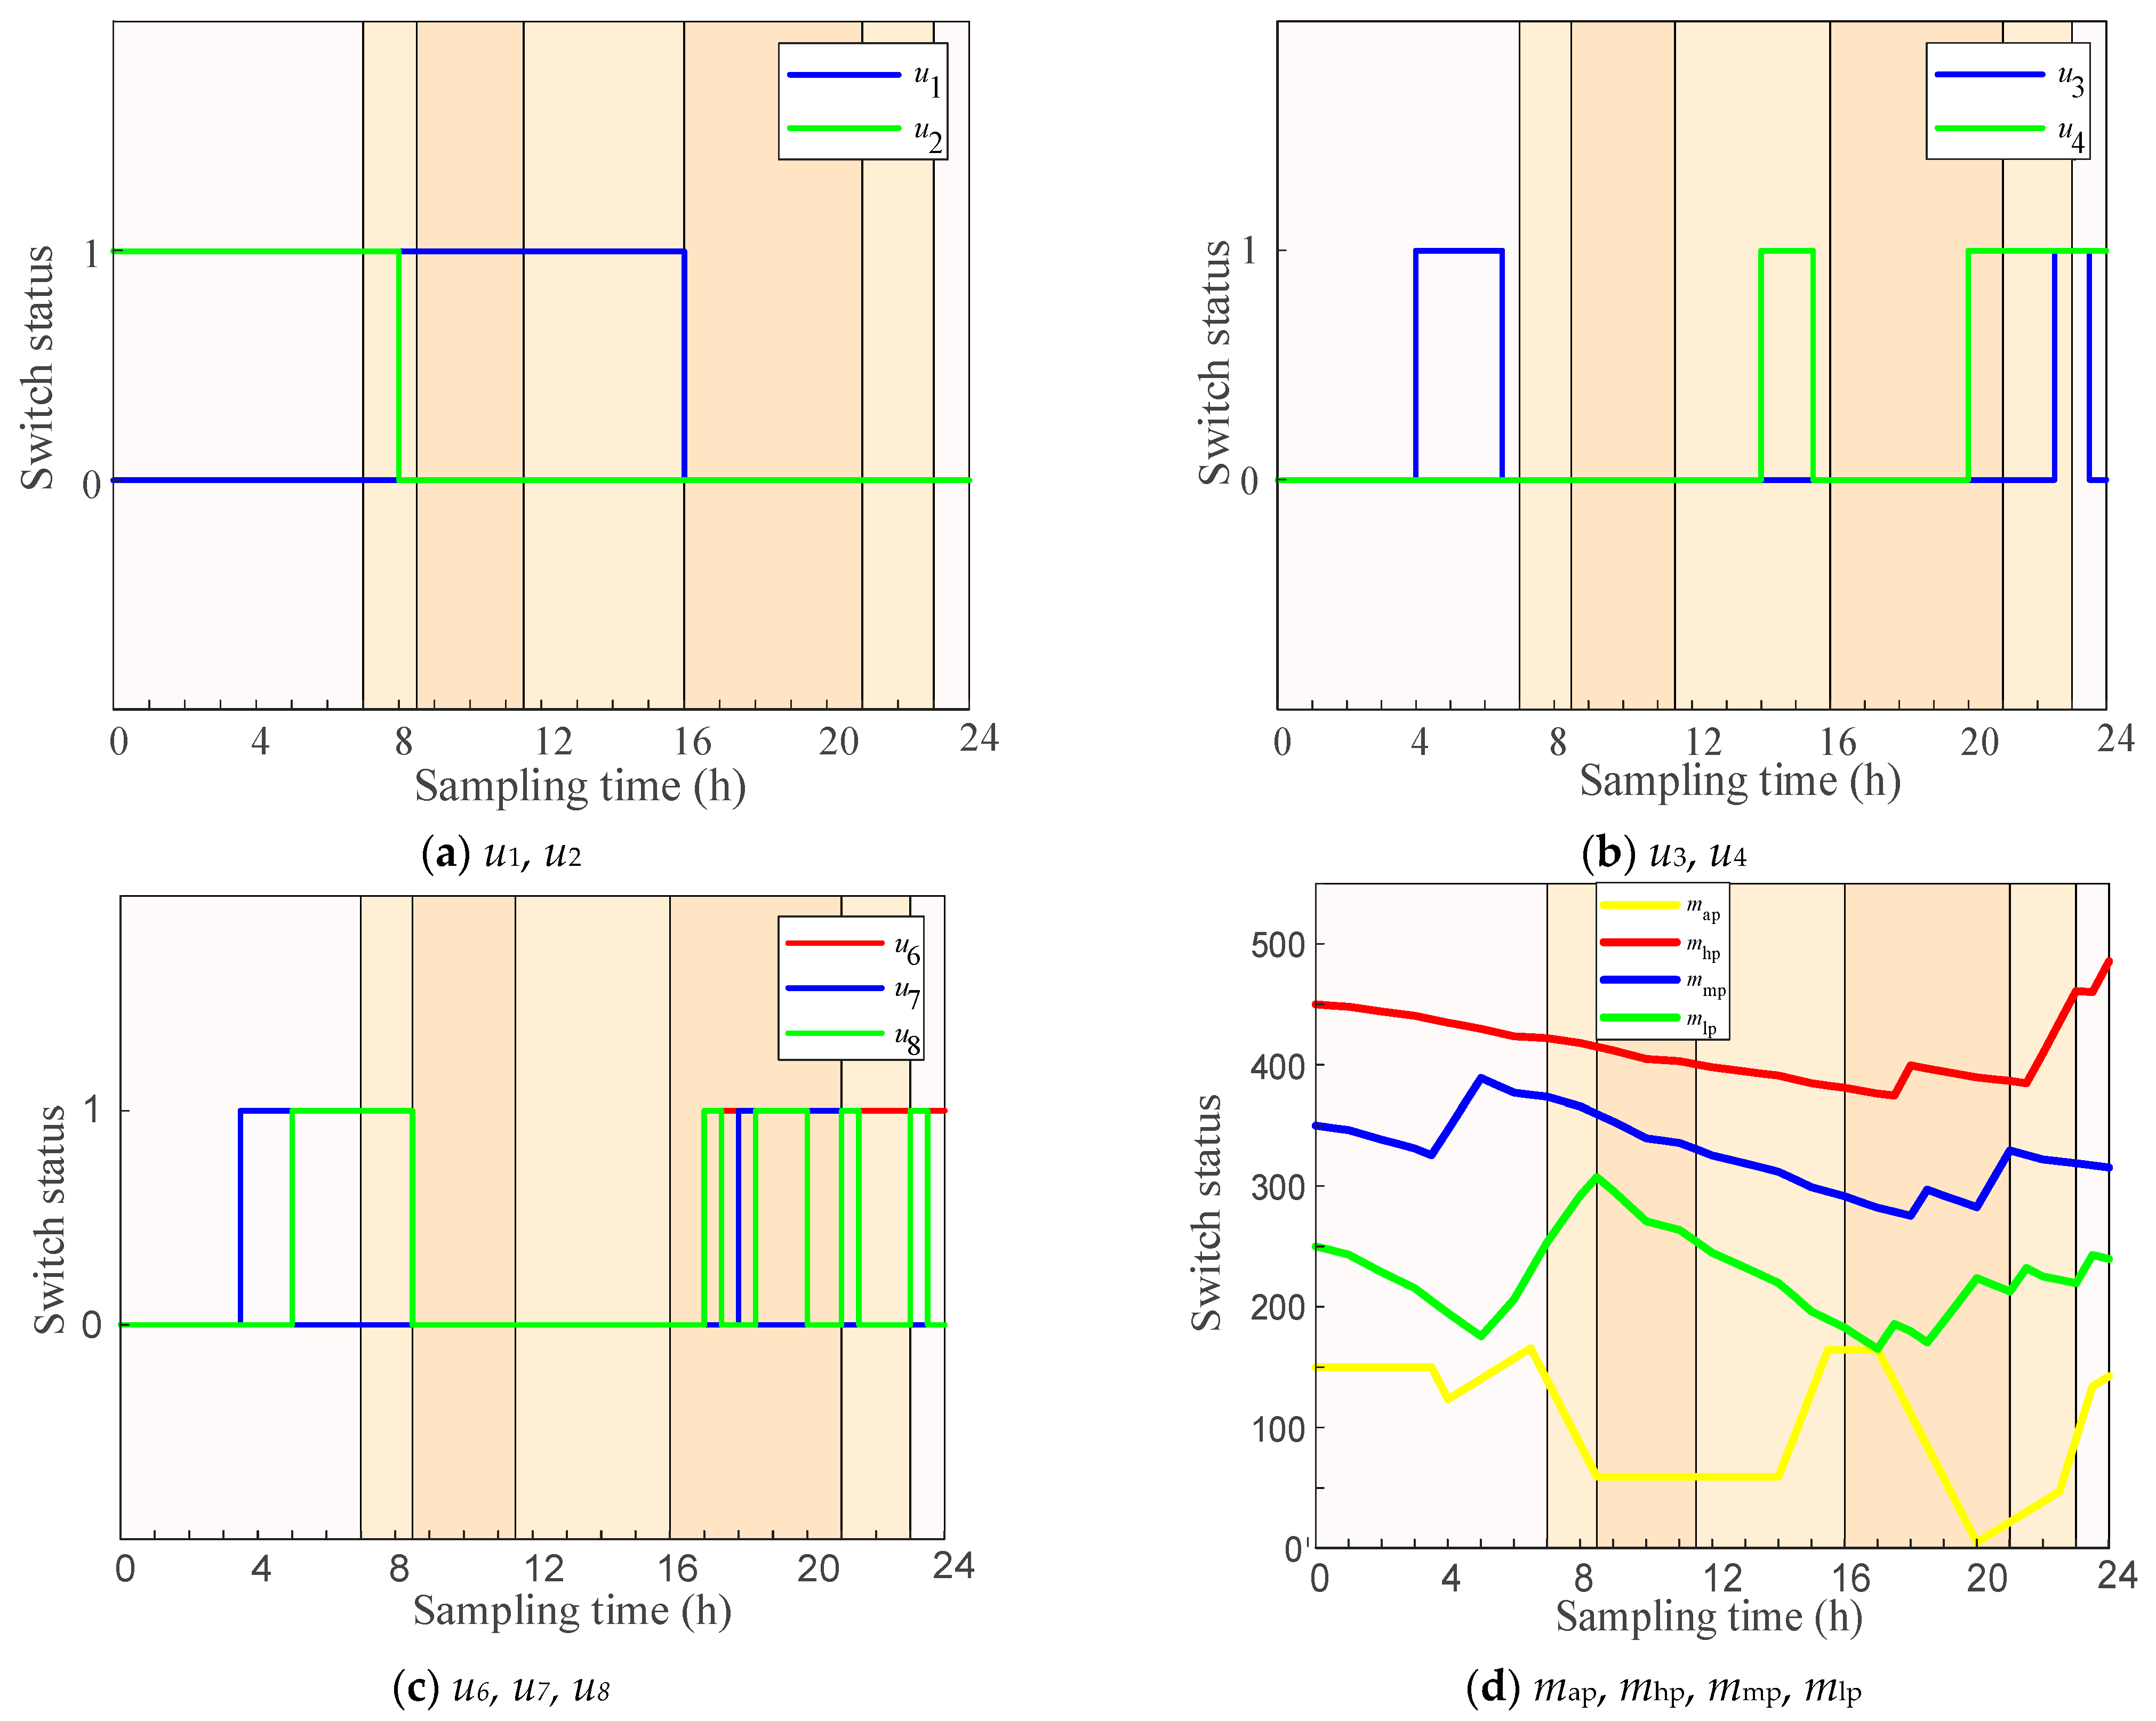
6.3. Economy Comparative Experiment of CNG Main Station Dispatch Model Considering TOU

To further verify the economic versatility of the optimal model, the proposed strategy was carried out in the CNG station after considering TOU adopted by the local power company in the low-power demand season. The dispatching results are shown in Figure 8. Compared with the original operation strategy of the CNG main station, the proposed strategy could reduce the daily comprehensive electricity cost index J from 21.0192 to 14.1553 with a 32.66% reduction. The daily electricity cost decreased from 1210.92 C to 1118.53 C with an 8.26% reduction. The compressor switching frequency was reduced from nine times to three times with a 66.67% reduction. The dCN decreased from 0.95 C to 0.88 C with a 7.37% reduction. For the power system, the CNG main station basically avoided the power consumption behavior of the morning load peak period and increased its power consumption behavior during the low load valley period according to the price signal of TOU. This could help alleviate dispatch pressure on the distribution network. However, TOU could not reduce the power consumption behavior of the CNG main station during the evening load peak period (7:00 p.m. to 9:00 p.m.) compared with Figure 6. Above all, the CPP policy implemented by the local power company was necessary to reduce the dispatching pressure during the evening peak in the high-power demand season.

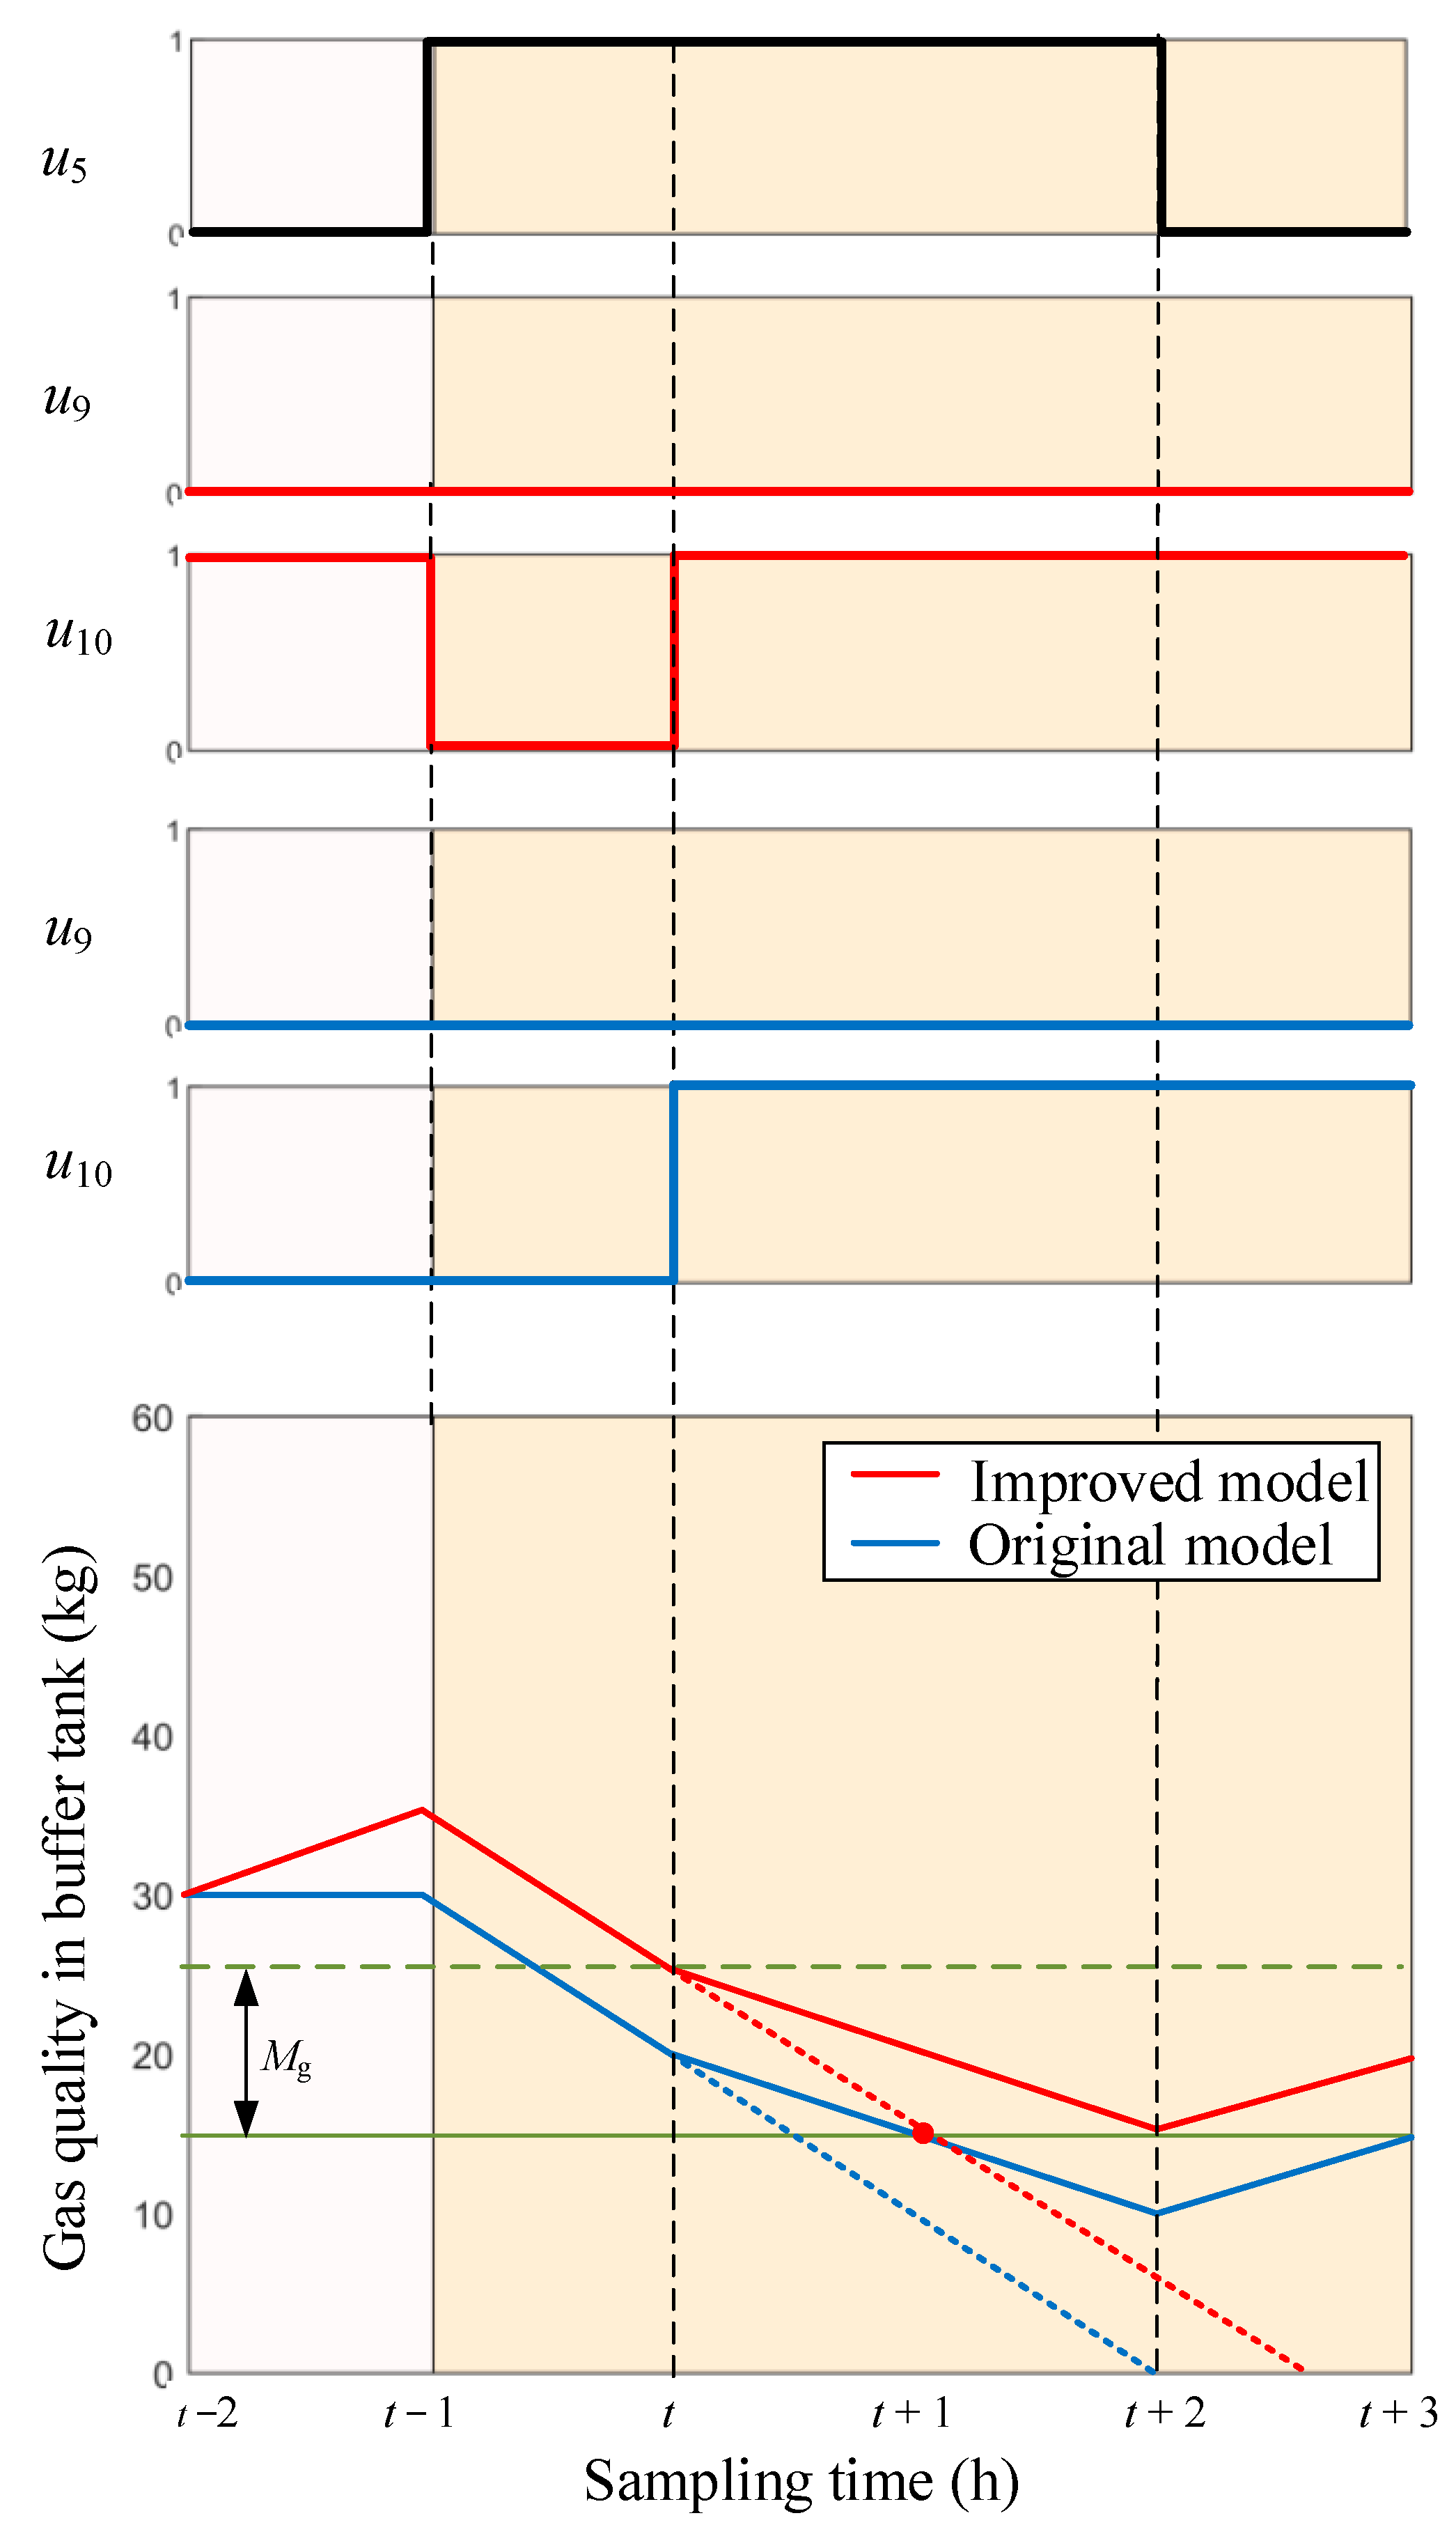
6.4. Control Performance Comparison Experiment of CNG Main Station Dispatch Model

The regeneration and cold purging time T are important factors in ensuring the efficiency of the dehydration process system’s operation. The regeneration and cold purging time can be appropriately shortened to achieve the purpose of energy saving and consumption reduction under the premise of ensuring the regeneration quality [25]. For the dual adsorption tower dehydration progress system, the currently commonly used 12 h empirical switching method has the problem of high operating energy consumption. Therefore, it is necessary to appropriately extend the switching period to 18–20 h, which enables saving 15,399 m3 of fuel gas per month in a typical CNG refueling station in theory [53]. In the pre-system model established in [13], the dehydration progress system was highly simplified to a single port element, and the regeneration and cold purging time was fixed at 12 h. This model cannot extend the switching cycle of the dual adsorption tower, making it difficult to meet the requirements of energy saving and cost reduction in the CNG main station. The proposed CNG main station model establishes a specific dehydration process model, which can specify the regeneration and cold blowing time T. Considering the optimal scheduling of the dehydration process system, the proposed model further deepens the CNG main station’s participation in DR and reduces the operating costs and energy consumption.
The proposed model can resolve the mismatch between the front and rear process systems of the CNG main station and improve the control performance of the station model. A comparison experiment was designed to better explain the control performance improvement of the CNG main station dispatch model after considering the dehydration progress system. The sampling time ts was set at 0.5 h, the mdmp was set 10 kg/h, and mcmp was 20 kg/h. The minimum CNG mass in the buffer tank was limited to 15 kg. During the actual CNG main station scheduling process, the original optimal model only considered the compression process system, and other process systems ran automatically according to the original strategy set in the PLC in the system. The low-pressure action margin in the buffer tank was Mg = 20 × 0.5 = 10 kg. The scheduling schemes are shown in Figure 9. Only the gas quality and corresponding switching behavior of the buffer tank within a certain period are listed for illustration. Both schemes required the adsorption tower A to work in the regeneration state during [t − 2, t + 3], the adsorption tower B to work in the dehydration state during [t − 2, t + 3], and the compressor to keep running during [t − 1, t + 2]. In the original model, the PLC automatically opened u10 at sampling time t to make the dehydration device run to prevent the pressure in the buffer tank from exceeding the pressure limit at the next sampling time t + 1. However, the continuous operation of the compressor still caused the buffer tank pressure to exceed the limit at sampling time t + 2. This could make the dispatching plan lose coordination with the station’s operating conditions and result in danger. Hence, it is necessary to incorporate the dehydration process system model into the economic dispatch model of the CNG main station. In the proposed model, the PLC opened the u10 and filled gas to the buffer tank in advance in the low-electricity-price period [t − 2, t − 1] through the unified dispatch of the dehydration process system model and the compression process system. This ensured that the buffer tank pressure did not exceed the limit at sampling time t + 2 and reduced operating power costs.

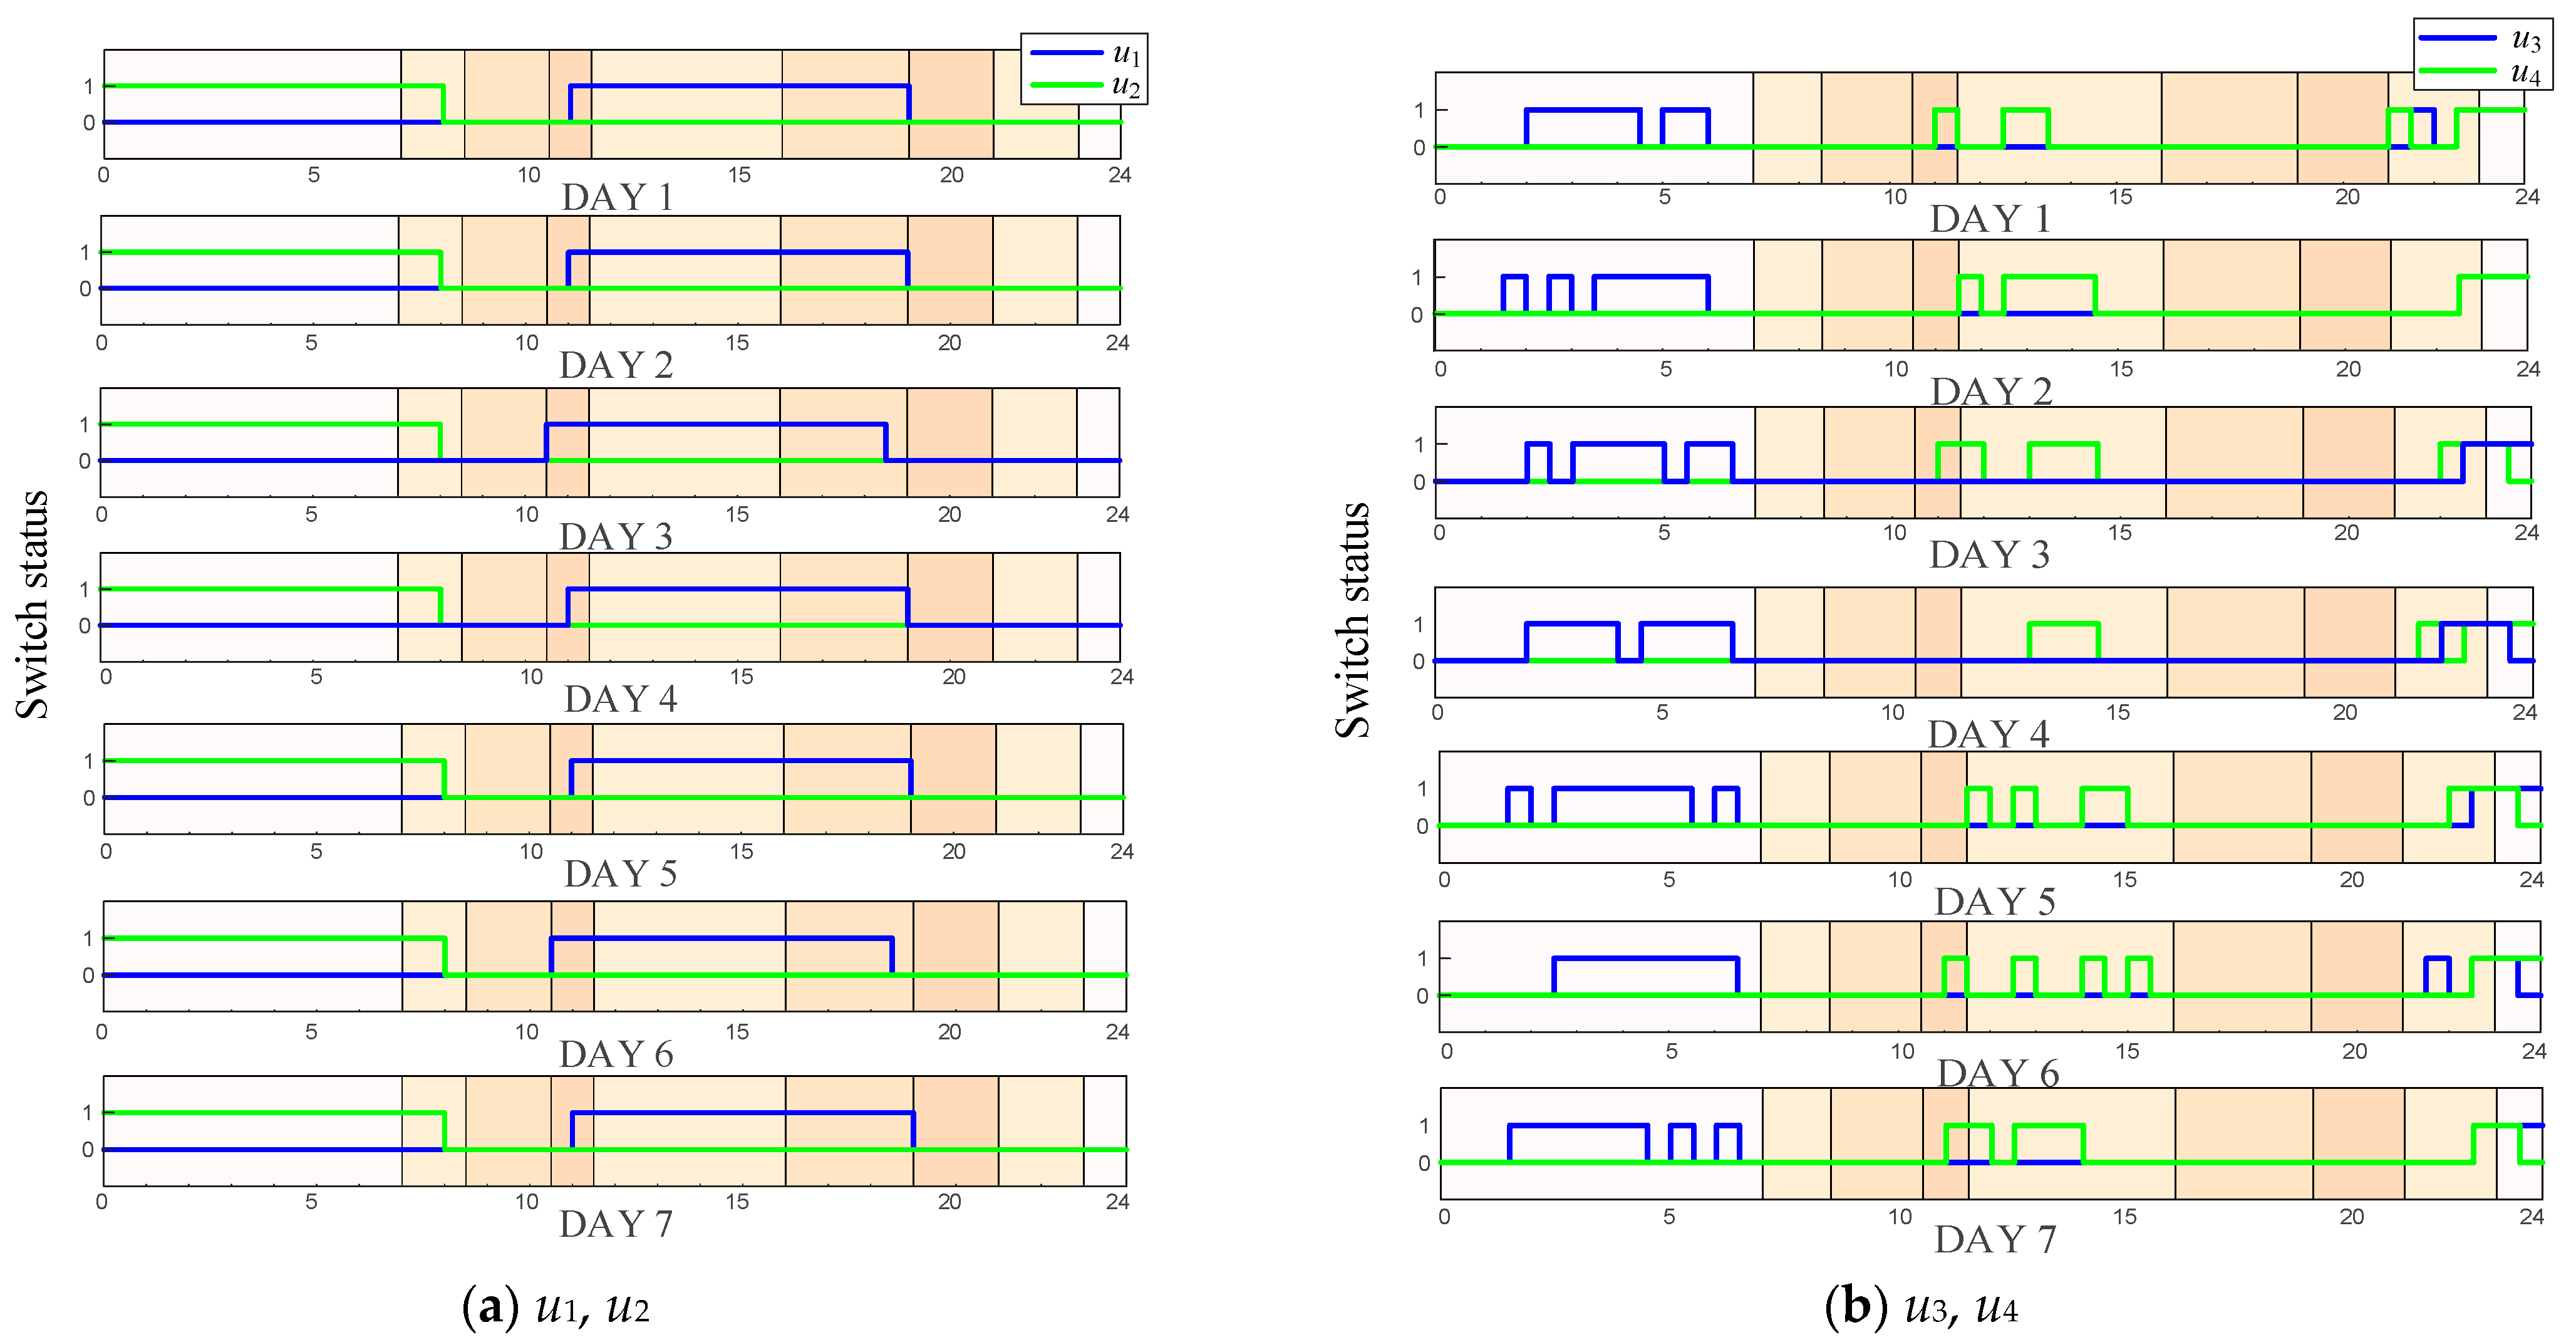
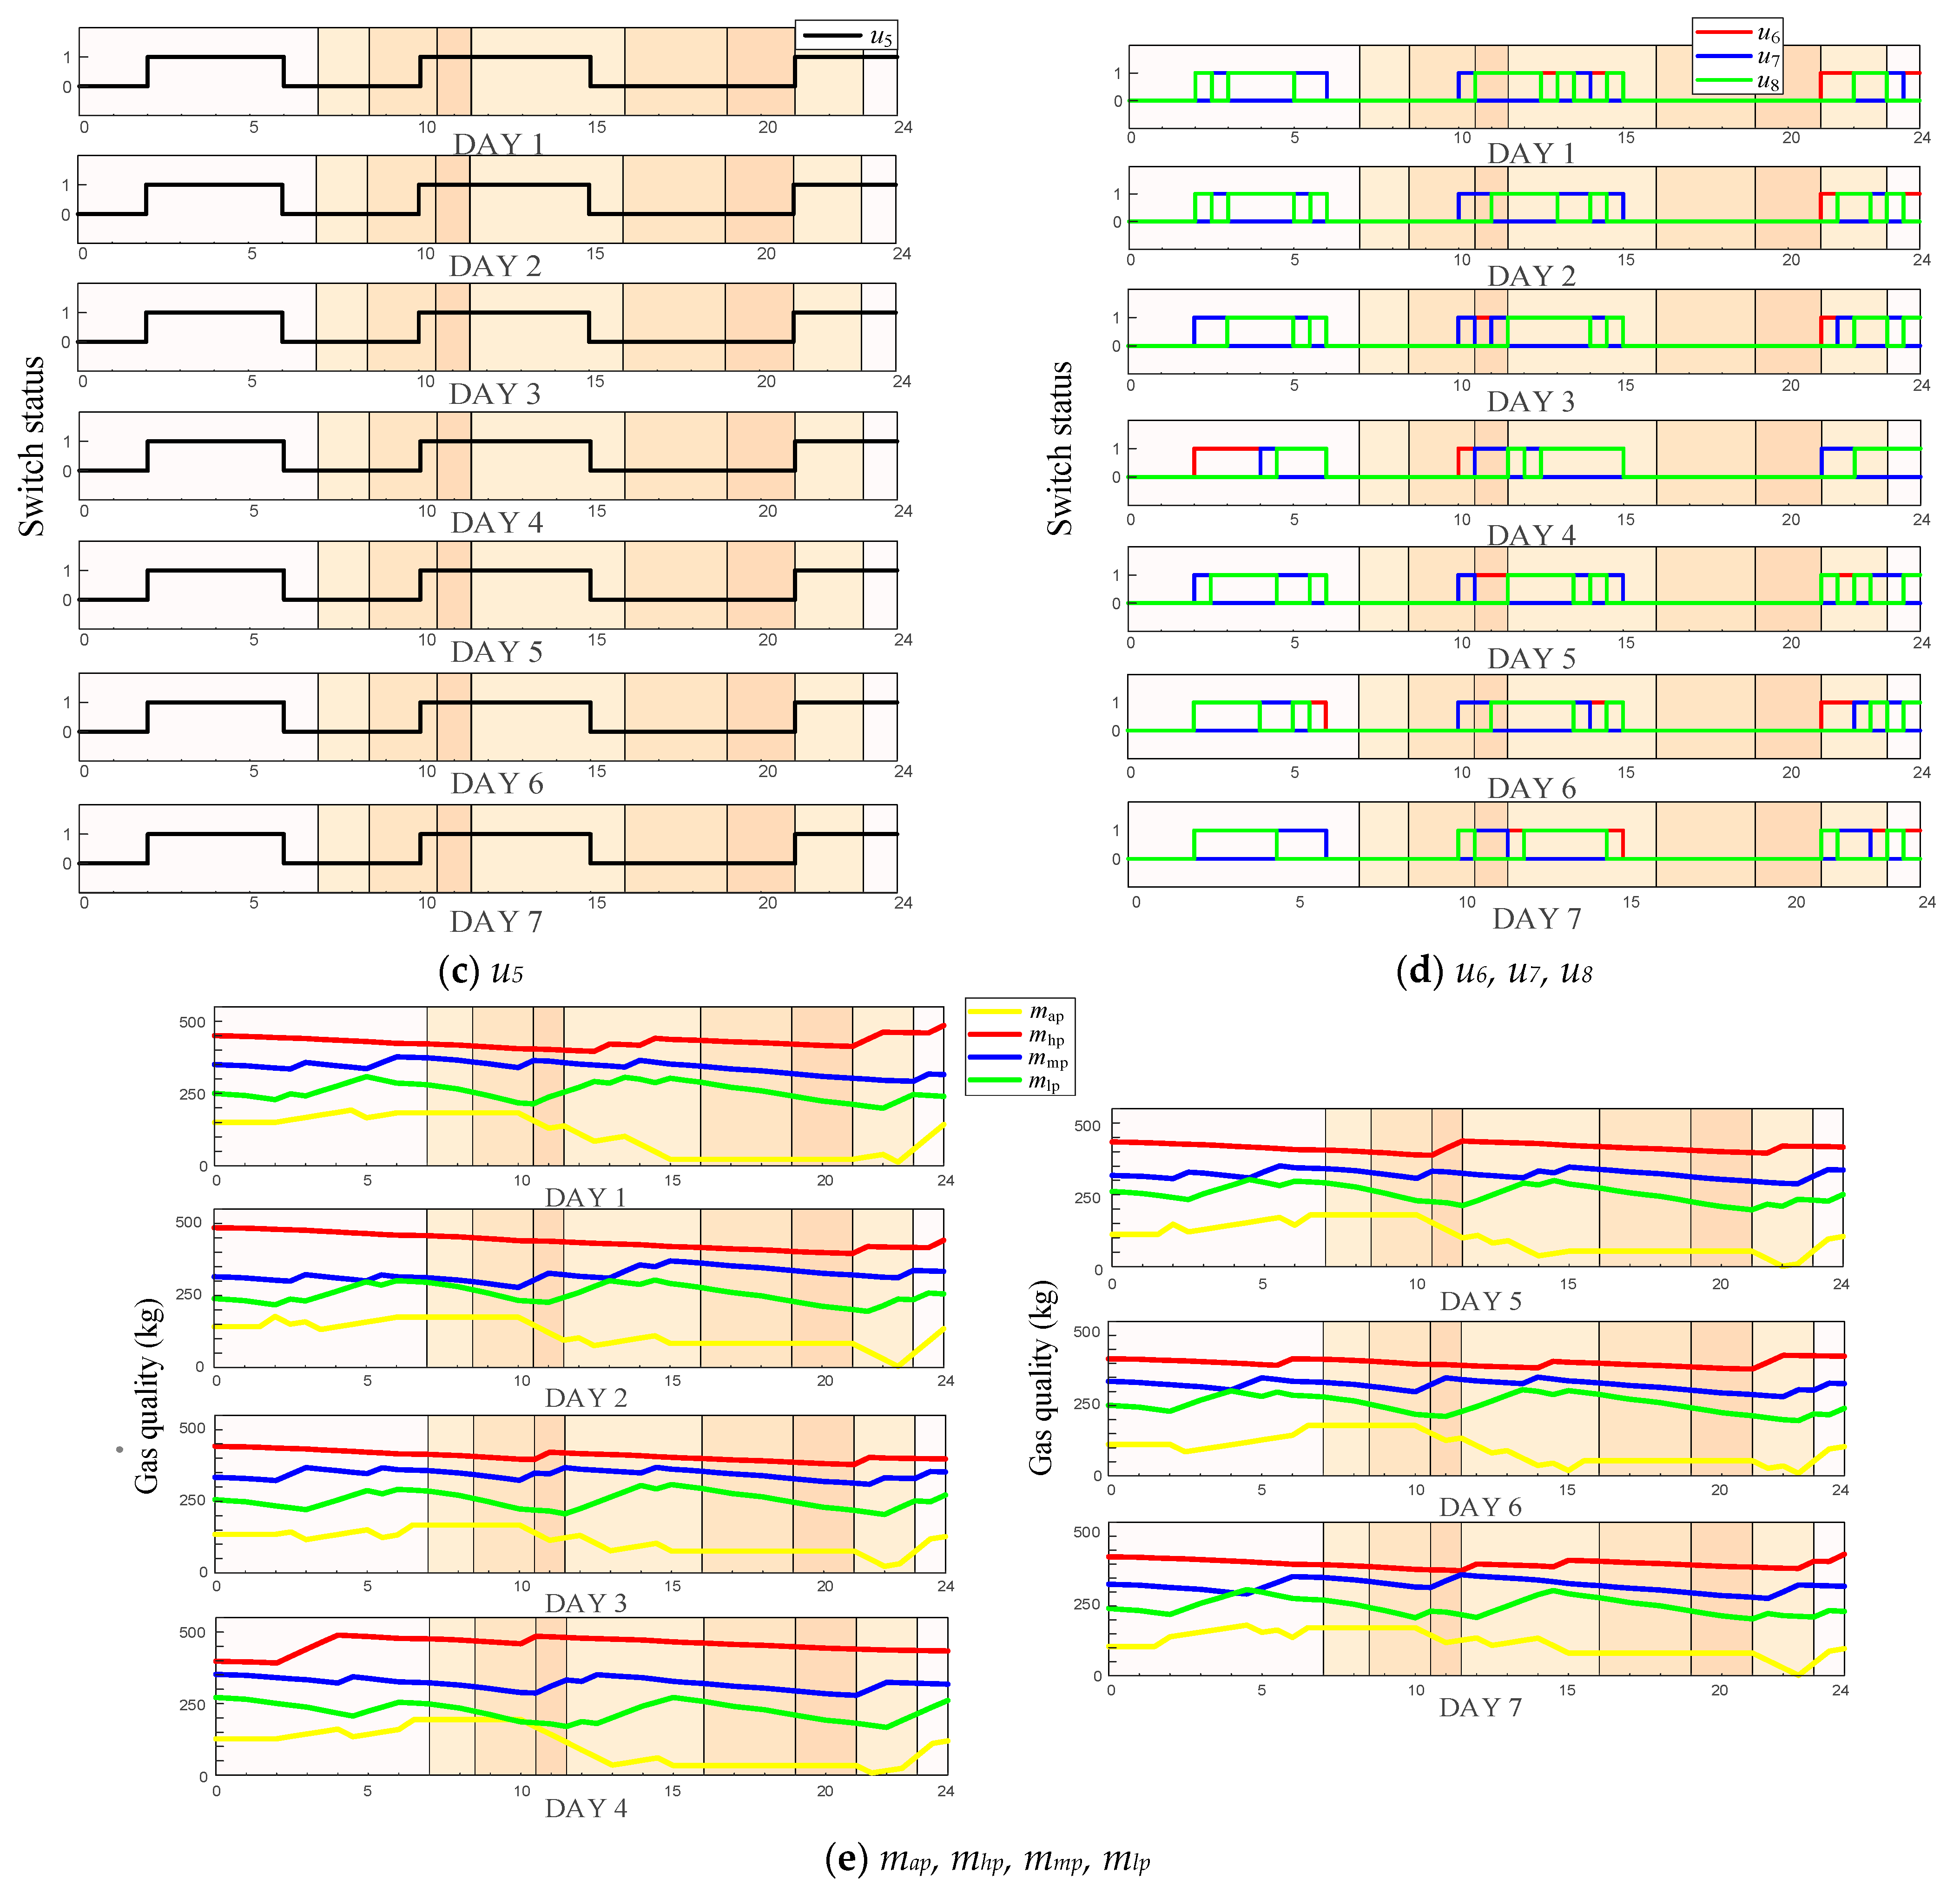
6.5. Continuous Operation Experiment of CNG Main Station Dispatch Model

The terminal restraint limits the end pressure level of gas to be similar to the initial conditions in the gas storage device. However, small changes in the initial conditions disturb the optimal strategy and affect its stability. A trend of increasing equipment switching instances has been observed at certain sampling moments. To verify the stability of the optimal economic dispatch strategy of the CNG main station, the proposed strategy was implemented in a week-long continuous experiment considering CPP. The results are shown in Figure 10. As shown in Figure 10e, the initial conditions of CNG main stations changed every day. However, the compressor maintained its daily switching sequence, and the total switching instances were 50% lower than the number of instances of the original operation strategy scheduling scheme. The dehydration device switching examples varied greatly to maintain a low compressor switching frequency. During the continuous experiment, the proposed strategy was universal in dealing with changes in initial conditions, and it could continuously provide the economic dispatch plan of the CNG main station considering CPP.
The daily economic operation evaluation indicators of the continuous experiment are shown in Table 2. The average daily comprehensive electricity cost index of the CNG main station was 14.7082, with a 30.88% reduction compared to the original strategy scheduling scheme. The average electricity cost was 975.82 C with a 21.10% reduction. The average processing unit CNG electricity cost was 0.77 C with a 21.10% reduction.

7. Discussion and Conclusions

The existing CNG refueling station process system energy consumption model was further supplemented with the electricity–gas consumption model of the dehydration process system. The proposed model is more in line with the actual process system than the original model, and the operation coordination degree between the process system energy consumption model was improved. The total energy consumption of the progress systems in the station that can be controlled by the operating model increased by about 70.47%.
The electricity–gas consumption model of the CNG main station process system proposed is a high-dimensional 0–1 integer nonlinear programming model. A bilevel algorithm combined with GA was designed for the model. The 8 N decision variables in the model were divided into two groups according to the decision status, whereby the GA only needs to process N binary decision variables. The algorithm using GA only was trapped in an infeasible area until the maximum iterations. The algorithm using the SCIP solver returned an invalid value for exceeding the maximum calculation time of the solver. The algorithm introduced in this paper obtained an effective scheduling scheme in the first iteration process and converged in the 27th generation.
From the perspective of DR, an economic dispatch model for a CNG main station was proposed combined with the local power company CPP strategy. The potential instability problem during the continuous operation of the model was solved by adding terminal constraints. Compared with the original operation strategy of the CNG main station, the proposed strategy could reduce the daily comprehensive electricity cost index J from 21.2786 to 14.7165 with a 30.84% reduction. Furthermore, the daily electricity cost CN decreased from 1236.86 C to 976.65 C with a 21.04% reduction, and the compressor switching frequency fN decreased from nine times to five times with a 50.00% reduction. Moreover, the average daily comprehensive electricity cost index of the CNG main station was 14.7082, with a 30.88% reduction compared to the original strategy scheduling scheme. The average electricity cost was 975.82 C with a 21.10% reduction, and the average processing unit CNG electricity cost was 0.77 C with a 21.10% reduction. This model considers the variable load in the dehydration process system and further deepens the CNG main station participation in the DR.
Guided by the current electricity price strategy, the CNG main stations have the potential to effectively participate in the DR. Improving the optimal operation capacity of the CNG main station is in line with the trend of world electricity reform technological development. The proposed strategy can also be promoted to help IEUs to participate in the DR without affecting the normal operating load. In future research, more attention can be paid on the planning and operation of the comprehensive energy supply station for new-energy vehicles.

Author Contributions

Conceptualization, Y.L. (Yongliang Liang) and Z.L.; methodology, Y.L. (Yongliang Liang) and Z.L.; software, Y.L. (Yuchuan Li); validation, Y.L. (Yongliang Liang), Z.L. and S.L.; formal analysis, Y.L. (Yongliang Liang), Z.L. and S.L.; investigation, Y.L. (Yongliang Liang), Z.L. and H.C.; resources, Y.L. (Yongliang Liang) and K.L.; data curation, Y.L. (Yongliang Liang) and Z.L.; writing—original draft preparation, Y.L. (Yongliang Liang) and Z.L.; writing—review and editing, Y.L. (Yongliang Liang), Z.L., Y.L. (Yuchuan Li), S.L. and H.C.; visualization, Y.L. (Yongliang Liang), Y.L. (Yuchuan Li) and K.L.; supervision, Y.L. (Yongliang Liang) and K.L.; project administration, Y.L. (Yongliang Liang) and K.L.; funding acquisition, Y.L. (Yongliang Liang) and K.L. All authors have read and agreed to the published version of the manuscript.

Funding

This research was funded by the [National Natural Science Foundation of China] grant number [U2166202].

Data Availability Statement

The data that support the findings of this study are openly available.

Conflicts of Interest

The authors declare no conflict of interest.

Nomenclature

JObjective functionQstd.dCapacity of the dehydration device under standard conditions (N·m3/h)
MwaMolecular weight of the air (g)tsSampling time (h)
MwgMolecular weight of the gas (g)tnDay-ahead optimal dispatching time (h)
  m ap max   Maximum mass for buffer tank (kg)ujState of switches
  m ap min   Minimum mass for buffer tank (kg)MaTerminal restriction margins of the buffer tank (kg)
mcCompressor total gas output (kg)Mh, Mm, MlTerminal restriction margins of high-pressure, medium-pressure, and low-pressure reservoirs (kg)
mdDehydration device total gas output (kg)VaVolume of buffer tanks (L)
  m hp max   ,   m mp max   ,   m lp max   Maximum mass for high-pressure, medium-pressure, and low-pressure reservoirs (kg)Vh, Vm, VlVolume of high-pressure, medium-pressure, and low-pressure reservoirs (L)
  m hp min   ,   m mp min   ,   m lp min   Minimum mass for high-pressure, medium-pressure, and low-pressure reservoirs (kg)WcCompressor electrical energy (kWh)
mohp, momp, molpMass demand from high-pressure, medium-pressure, and low-pressure reservoirs (kg)WfPre-filter electrical energy (kWh)
mcmpCompressor outlet mass flow rate (kg)WdDehydration device electrical energy (kWh)
mdmpDehydration device outlet mass flow rate (kg)RUniversal gas constant (L·bar/K·mol)
pcCompressor power rating (kW)TRegeneration and cold purging processes time (h)
pd1Dehydration power rating (kW)TmaxMaximum ambient temperature (K)
pd2Regeneration and cold purging power rating (kW)TminMinimum ambient temperature (K)
pbDispenser power rating (kW)zCompressibility factor of CNG
Qstd.cCapacity of the compressor under standard conditions (N·m3/h)ρstd.aDensity of air under standard conditions (kg/m3)

Appendix A

The gas state equation of the cascaded storage system model device can be expressed as
m hp max = M V h p hp max z R T max ,   m hp min = M V h p hp min z R T min ,
m mp max = M V m p mp max z R T max ,   m mp min = M V m p mp min z R T min ,
m lp max = M V l p lp max z R T max ,   m lp min = M V l p lp min z R T min .
The optimization functions f1 and f2 in the upper model can be expressed as
f 1 T = [ ψ p c p e ( 1 ) t s ψ p c p e ( N ) t s   0 0     0 0     0 0 ] 1 × 4 N ,
f 2 T = [ ( 1 ψ ) A a     0     0     0 ] N × 4 N ,
where
A a = 1 1 0 0 0 1 1 0 0 0 0 0 0 1 1 0 0 N × N .
The inequality constraint matrix AU, vectors bmax.U, bmin.U can be expressed as
A U = A 1 A 2 A 3 3 N × 3 N b min . U = b 1 b 3 b 5 3 N × 1 b max . U = b 2 b 4 b 6 3 N × 1 ,
where
A 1 = [ 0 A b 0 0 ] N × 4 N ,
A 2 = [ 0 0 A b 0 ] N × 4 N ,
A 3 = [ 0 0 0 A b ] N × 4 N ,
A b = t s m cmp 0 0 t s m cmp t s m cmp 0 t s m cmp t s m cmp t s m cmp t s m cmp N × N ,
b 1 = m hp ( 0 ) + m hp m in + m ohp ( 1 ) m hp ( 0 ) + m hp min + [ m ohp ( 1 ) + m ohp ( 2 ) ] m hp ( 0 ) + m hp min + [ m ohp ( 1 ) + m ohp ( 2 ) + + m ohp ( N 1 ) ] M h + [ m ohp ( 1 ) + m ohp ( 2 ) + + m ohp ( N ) ] N × 1 ,
b 2 = m hp ( 0 ) + m hp max + m ohp ( 1 ) m hp ( 0 ) + m hp max + [ m ohp ( 1 ) + m ohp ( 2 ) ] m hp ( 0 ) + m hp max + [ m ohp ( 1 ) + m ohp ( 2 ) + + m ohp ( N 1 ) ] M h + [ m ohp ( 1 ) + m ohp ( 2 ) + + m ohp ( N ) ] N × 1 ,
b 3 = m mp ( 0 ) + m mp min + m omp ( 1 ) m mp ( 0 ) + m mp min + [ m omp ( 1 ) + m omp ( 2 ) ] m mp ( 0 ) + m mp min + [ m omp ( 1 ) + m omp ( 2 ) + + m omp ( N 1 ) ] M m + [ m omp ( 1 ) + m omp ( 2 ) + + m omp ( N ) ] N × 1 ,
b 4 = m mp ( 0 ) + m mp max + m omp ( 1 ) m mp ( 0 ) + m mp max + [ m omp ( 1 ) + m omp ( 2 ) ] m mp ( 0 ) + m mp max + [ m omp ( 1 ) + m omp ( 2 ) + + m omp ( N 1 ) ] M m + [ m omp ( 1 ) + m omp ( 2 ) + + m omp ( N ) ] N × 1 ,
b 5 = m lp ( 0 ) + m lp min + m olp ( 1 ) m lp ( 0 ) + m lp min + [ m olp ( 1 ) + m olp ( 2 ) ] m lp ( 0 ) + m lp min + [ m olp ( 1 ) + m olp ( 2 ) + + m olp ( N 1 ) ] M l + [ m olp ( 1 ) + m olp ( 2 ) + + m olp ( N ) ] N × 1 ,
b 6 = m lp ( 0 ) + m lp max + m olp ( 1 ) m lp ( 0 ) + m lp max + [ m olp ( 1 ) + m olp ( 2 ) ] m lp ( 0 ) + m lp max + [ m olp ( 1 ) + m olp ( 2 ) + + m olp ( N 1 ) ] M l + [ m olp ( 1 ) + m olp ( 2 ) + + m olp ( N ) ] N × 1 .
The equality constraint matrix Aeq.c, with vector beq.c, can be expressed as
A eq . c = [ I I I I ] N × 4 N b eq . c = [ 0 ] N × 1 ,
where I represents the identity matrix.
The optimization function f3 in the lower model can be expressed as
f 3 T = [ p d 2 p e ( 1 ) t s   p t p e ( N ) t s p d 2 p e ( 1 ) t s   p t p e ( N ) t s p d 1 p e ( 1 ) t s   p t p e ( N ) t s p d 1 p e ( 1 ) t s   p t p e ( N ) t s ] 1 × 4 N
The inequality constraint matrix AL, with vectors bmax.L and bmin.L, can be expressed as
A L = A 4 A 5 A 6 A 7 4 N × 4 N b min . L = b 7 b 9 b 9 b 9 4 N × 1 b max . L = b 8 b 10 b 10 b 10 4 N × 1 ,
where
A 4 = [ 0 0 A c A c ] N × 4 N ,
A 5 = [ I I 0 0 ] N × 4 N ,
A 6 = [ 0 I 0 I ] N × 4 N ,
A 7 = [ I 0 I 0 ] N × 4 N ,
A c = t s m amp 0 0 t s m amp t s m amp 0 t s m amp t s m amp t s m amp t s m amp N × N ,
b 7 = m ap ( 0 ) + m ap min m ap ( 0 ) + m ap min M a N × 1 ,
b 8 = m ap ( 0 ) + m ap max m ap ( 0 ) + m ap max M a N × 1 ,
b 9 = Inf N × 1 ,
b 10 = 1 N × 1 .
The equality constraint matrices Aeq.d, Aeq.m, and Aeq.n and the vectors beq.d, beq.m, and beq.n can be expressed as
A eq . d = 1 1 0 0 0 0 0 0 0 0 1 1 0 0 0 0 2 × 4 N ,
b eq . d = t d 24 × N t d 24 × N 2 × 1 ,
A eq . m = A v 0 0 0 N × 4 N ,
A eq . n = 0 A v 0 0 N × 4 N ,
b eq . m = b eq . n = 2 1 × 1 ,
where
A v = 1 0 0 0 1 1 0 0 0 1 1 0 0 0 1 1 N × N .

References

  1. Javed, H.; Muqeet, H.A.; Shehzad, M.; Jamil, M.; Khan, A.A.; Guerrero, J.M. Optimal Energy Management of a Campus Microgrid Considering Financial and Economic Analysis with Demand Response Strategies. Energies 2021, 14, 8501. [Google Scholar] [CrossRef]
  2. Chen, K.; Liu, H.; Gao, Y.; Wang, J. Potential Assessment Method of Integrated Demand Response and Its Utilization in Park Operation. In Proceedings of the 2022 IEEE 5th International Electrical and Energy Conference (CIEEC), Nangjing, China, 27–29 May 2022; pp. 1545–1550. [Google Scholar] [CrossRef]
  3. Wu, X.; Wu, H.; Zhang, N.; Dai, H. A Comprehensive Evaluation Method of Integrated Energy System based on Hierarchical Decomposition. In Proceedings of the 2022 11th International Conference on Communications, Circuits and Systems (ICCCAS), Singapore, 13–15 May 2022; pp. 290–295. [Google Scholar] [CrossRef]
  4. Zhang, H.; Gong, C.; Ju, W.; Pan, G.; Wang, W. Optimization Dispatch Modeling for Demand Response Considering Supply and Demand balance and Security Constraints. In Proceedings of the 2021 Power System and Green Energy Conference (PSGEC), Shanghai, China, 20–22 August 2021; pp. 166–170. [Google Scholar] [CrossRef]
  5. Liu, Q.; Wang, B.; Cao, J.; Peng, X.; Huang, K. Automatic Demand Response Evaluation Method of Regional Power Grid. In Proceedings of the 2021 IEEE Sustainable Power and Energy Conference (iSPEC), Nanjing, China, 23–25 December 2021; pp. 2493–2497. [Google Scholar] [CrossRef]
  6. Geng, Y.; Tian, Y.; Qi, Z.; Yang, C.; Wang, L.; Zhuang, Y. Research on multi-demand response resources involved in spinning reserve optimization for new power system. In Proceedings of the 2022 China International Conference on Electricity Distribution (CICED), Changsha, China, 7–8 September 2022; pp. 411–415. [Google Scholar] [CrossRef]
  7. Chu, S.; Majumdar, A. Opportunities and challenges for a sustainable energy future. Nature 2012, 7411, 294–303. [Google Scholar] [CrossRef] [PubMed]
  8. Mignone, B.K.; Showalter, S. Sensitivity of natural gas deployment in the US power sector to future carbon policy expectation. Energy Policy 2017, 110, 518–524. [Google Scholar] [CrossRef]
  9. Yang, Y.; Zhou, S.; Li, L.; Liu, X.; Sun, H. Development actuality and prospect of domestic NGV business. Oil Gas Storage Transp. 2013, 32, 939–942. [Google Scholar]
  10. Wang, Y.; He, T.-B.; Wang, X.; Wang, Y.; Mao, D. Suggestions on the future development of natural gas vehicle industry in China. Nat. Gas Ind. 2020, 40, 106–112. [Google Scholar]
  11. Cheng, F.; Shu, B.; Qin, Y.; Hu, A. Global utilization trend of natural gas and its enlightenments and suggestions. Nat. Gas Technol. Econ. 2017, 11, 67–73. [Google Scholar]
  12. Zhong, Q.; Tong, D.; Kuby, M.; Wei, F.; Fowler, J.; Bailey, K. Locating Alternative Fuel Stations for Maximizing Coverage and Ensuring Sufficient Spacing: A Case Study of CNG Truck Fueling. Process Integr. Optim. Sustain. 2019, 3, 455–470. [Google Scholar] [CrossRef]
  13. Ma, C.; Duan, Q.; Guo, C.; Liang, Y.; Xu, R.; Liu, W. Economic Dispatch of CNG Refueling Station Considering Peak-Valley Time-of-Use Electricity Price Strategy. High Volt. Eng. 2021, 47, 584–595. [Google Scholar]
  14. Sun, J. Feasibility Study on the JiYang CNG Station Project; China University of Petroleum: Beijing, China, 2010. [Google Scholar]
  15. Dang, M. Study on Energy Consumption Analysis and Energy Saving Approach of CNG Filling Station; Southwest Petroleum University: Chengdu, China, 2015. [Google Scholar]
  16. Ji, Z.; He, S.; Chen, H.; Zeng, G. Numerical simulation of residual strength of CNG underground gas storage well considering cracks. Oil Gas Storage Transp. 2020, 39, 284–289+306. [Google Scholar]
  17. Khadem, J.; Saadat-Targhi, M.; Farzaneh-Gord, M. Mathematical modeling of fast filling process at CNG refueling stations considering connecting pipes. J. Nat. Gas Sci. Eng. 2015, 26, 176–184. [Google Scholar] [CrossRef]
  18. Kountz, K. Modeling the Fast Fill Process in Natural Gas Vehicle Storage Cylinders; Tech. Rep.; Institute of Gas Technology: Chicago, IL, USA, 1994. [Google Scholar]
  19. Mahmood, F.; Morteza, S.; Javad, K. Selecting optimal volume ratio of reservoir tanks in CNG refueling station with multi-line storage system. Int. J. Hydrog. Energy 2016, 48, 23109–23119. [Google Scholar]
  20. Morteza, S.; Javad, K.; Mahmood, F. Thermodynamic analysis of a CNG refueling station considering the reciprocating compressor. J. Nat. Gas Sci. Eng. 2016, 29, 453–461. [Google Scholar]
  21. Kagiri, C.; Wanjiru, E.M.; Zhang, L.; Xia, X. Optimized response to electricity time-of-use tariff of a compressed natural gas fuelling station. Appl. Energy 2018, 222, 244–256. [Google Scholar] [CrossRef] [Green Version]
  22. Charles, K.; Zhang, L.; Xia, X. A Hierarchical Optimization of a Compressed Natural Gas Station for Energy and Fuelling Efficiency under a Demand Response Program. Energies 2019, 12, 2165. [Google Scholar]
  23. Kagiri, C.; Zhang, L.; Xia, X. Receding Horizon Operation Control of a Compressed Natural Gas Station. Energy Procedia 2019, 158, 2853–2858. [Google Scholar] [CrossRef]
  24. Adelino, M.I.; Fitri, M. Modeling Combinatorial Optimization of Compressed Natural Gas Filling Station Location Using Set Covering Approach. In Proceedings of the 2021 International Conference on Computer Science and Engineering (IC2SE), Padang, Indonesia, 16–18 November 2021; pp. 1–5. [Google Scholar] [CrossRef]
  25. Qi, X. Study on Optimization of Desulfurization Process of Dehydration Equipment CNG Master Station; Northeast Petroleum University: Daqing, China, 2015. [Google Scholar]
  26. Tatiana, M. Vibroacoustic Modeling of a Compressor Pipeline System. In Proceedings of the 2021 International Scientific and Technical Engine Conference (EC), Samara, Russia, 23–25 June 2021; pp. 1–5. [Google Scholar] [CrossRef]
  27. Kryukov, O.; Gulyaev, I.; Teplukhov, D. Optimize of Parallel Operation Several Electric Driven Gas Pumping Units on a Single Gas Pipeline. In Proceedings of the 2021 3rd International Conference on Control Systems, Mathematical Modeling, Automation and Energy Efficiency (SUMMA), Lipetsk, Russia, 10–12 November 2021; pp. 1070–1074. [Google Scholar] [CrossRef]
  28. Venturini, P.; Andreoli, M.; Borello, D.; Rispoli, F.; Gabriele, S. Modeling of Water Droplets Erosion on a Subsonic Compressor Cascade. Flow, Turbulence and Combustion 2019, 103, 1109–1125. [Google Scholar] [CrossRef]
  29. Jiang, L.; An, C.; Yang, N.; Zhang, C. Analysis and countermeasures of gas quality problems in CNG filling station. China Petrochem 2016, 23, 128–129. [Google Scholar]
  30. Hu, H.; Liu, Y.; Zhou, L.; Liu, Y. Heat Transfer Calculation of Organic Heat medium Heater and Analysis of maximum film temperature. IOP Conf. Series. Mater. Sci. Eng. 2020, 721, 12027. [Google Scholar] [CrossRef]
  31. Zhou, S. On quality control of compressed natural gas for vehicle. China Pet. Chem. Stand. Qual. 2019, 39, 43–44. [Google Scholar]
  32. Li, Y.; Quan, K.; Wu, R.; Chang, Y.; Guo, B.; Zhang, B. Numerical simulation and experimental validation of large pressure pulsation in reciprocating compressor. Energy Procedia 2019, 160, 606–613. [Google Scholar] [CrossRef]
  33. Ghanbariannaeeni, A.; Ghazanfarihashemi, G. Gas pulsation study for reciprocating compressors in chemical plants. Proc. Inst. Mech. Eng. Part E J. Process Mech. Eng. 2016, 230, 65–75. [Google Scholar] [CrossRef]
  34. Brun, K.; Simons, S.; Kurz, R. The impact of reciprocating compressor pulsations on the surge margin of centrifugal compressors. J. Eng. Gas Turbines Power 2017, 139, 82604–82619. [Google Scholar] [CrossRef]
  35. Cervera-Vázquez, J.; Montagud-Montalvá, C.; Corberán, J.M. Sizing of the buffer tank in chilled water distribution air-conditioning systems. Sci. Technol. Built Environ. 2016, 22, 290–298. [Google Scholar] [CrossRef] [Green Version]
  36. Yan, X.; Ozturk, Y.; Hu, Z.; Song, Y. A review on price-driven residential demand response. Renew. Sustain. Energy Rev. 2018, 96, 411–419. [Google Scholar] [CrossRef]
  37. Gazijahani, F.; Salehi, J. Reliability constrained two-stage optimization of multiple renewable-based microgrids incorporating critical energy peak pricing demand response program using robust optimization approach. Energy 2018, 161, 999–1015. [Google Scholar] [CrossRef]
  38. Wanjiru, E.M.; Zhang, L.; Xia, X. Model predictive control strategy of energy-water management in urban households. Apply Energy 2016, 179, 821–831. [Google Scholar] [CrossRef] [Green Version]
  39. Mashwani, W.K.; Hamdi, A.; Asif Jan, M.; Göktaş, A.; Khan, F. Large-scale global optimization based on hybrid swarm intelligence algorithm. J. Intell. Fuzzy Syst. 2020, 39, 1257–1275. [Google Scholar] [CrossRef]
  40. Zou, X.; Liu, J. A mutual information-based two-phase memetic algorithm for large-scale fuzzy cognitive map learning. IEEE Trans. Fuzzy Syst. 2018, 26, 2120–2134. [Google Scholar] [CrossRef]
  41. Lin, B.; Zhao, Y. The systematic optimization of train formation in loading stations. Symmetry 2019, 11, 1238. [Google Scholar] [CrossRef] [Green Version]
  42. Feng, X.; Xu, Z. Integrated production and transportation scheduling on parallel batch-processing machines. IEEE Access 2019, 7, 148393–148400. [Google Scholar] [CrossRef]
  43. Li, J.; Liu, J.; Gao, Q.; Huang, T. The decision latency optimization problem in sdn with multi-controller. IEEE Commun. Lett. 2019, 23, 2344–23470. [Google Scholar] [CrossRef]
  44. Hou, R.; Yang, Y.; Yuan, Q.; Chen, Y. Research and application of hybrid wind-energy forecasting models based on cuckoo search optimization. Energies 2019, 12, 3675. [Google Scholar] [CrossRef] [Green Version]
  45. Sun, L.; Lin, L.; Li, H.; Gen, M. Hybrid cooperative co-evolution algorithm for uncertain vehicle scheduling. IEEE Access 2018, 6, 71732–71742. [Google Scholar] [CrossRef]
  46. Feng, X.; Chu, F.; Chu, C.; Huang, Y. Crowdsource-enabled integrated production and transportation scheduling for smart city logistics. Int. J. Prod. Res. 2020, 59, 2157–2176. [Google Scholar] [CrossRef]
  47. Wen, J.Q.; Zeng, B.; Zhang, J.H. Bi-level programming method for distributed generator considering stakeholders game relationship in an electricity market environment. Autom. Electr. Power Syst. 2015, 39, 61–67. [Google Scholar]
  48. Li, Y.; Yang, Z.; Li, G.; Mu, Y.; Zhao, D.; Chen, C.; Shen, B. Optimal scheduling of isolated microgrid with an electric vehicle battery swapping station in multi-stakeholder scenarios: A bi-level programming approach via real-time pricing. Appl. Energy 2018, 232, 54–68. [Google Scholar] [CrossRef] [Green Version]
  49. Nguyen, H.H.; Chan, C.W. Applications of artificial intelligence for optimization of compressor scheduling. Eng. Appl. Artif. Intell. 2006, 19, 113–126. [Google Scholar] [CrossRef]
  50. State Grid Shandong Electric Power Company. Introduction to Time-of-Use Tariff Business; State Grid Shandong Electric Power Company: Binzhou, China, 2018. [Google Scholar]
  51. Fuyang City Gas Company. Compilation of Statistical Research on Urban Gas Load Indicators and Gas Consumption Rules; China Gas Association: Beijing, China, 2004; Volume 10, p. 85. [Google Scholar]
  52. Zhao, L. The Study of Natural Gas User Load and Use Rule; Beijing University of Civil Engineering and Architecture: Beijing, China, 2016. [Google Scholar]
  53. Chen, D. Research on Energy Saving of Molecular Sieve Dehydration Unit in Jiangyou Light Hydrocarbon Plant. In Proceedings of the 2017 National Natural Gas Academic Conference, Hangzhou, China, 19 October 2017; Volume 7. [Google Scholar]
Figure 1. The framework of CNG main station optimal economic dispatch model.
Energies 16 03080 g001
Figure 2. Sketch of the CNG main station model.
Energies 16 03080 g002
Figure 3. Bilevel programming method based on GA calculation flowchart.
Energies 16 03080 g003
Figure 4. Typical natural CNG filling demand of a CNG main station.
Energies 16 03080 g004
Figure 5. The evolution process of the introduced algorithm.
Energies 16 03080 g005
Figure 6. Optimal dispatching results of CNG main station considering CPP.
Energies 16 03080 g006
Figure 7. Optimal dispatching results of CNG main station based on original operation strategy.
Energies 16 03080 g007
Figure 8. Optimal dispatching results of CNG main station based on TOU.
Energies 16 03080 g008
Figure 9. Gas quality in buffer tank of scheduling schemes.
Energies 16 03080 g009
Figure 10. Continuous operation experimental results of optimized dispatch strategy for CNG main station.
Energies 16 03080 g010aEnergies 16 03080 g010b
Table 1. Equipment parameters of CNG main station.
SymbolQuantityValue
pd1Dehydration power rating10 kW
pmRoots motor power rating7.5 kW
pwForced air cooler power rating5 kW
pcPower rating of compressor132 kW
Qstd.dCapacity of dehydration device101 N·m3/min
Qstd.cCapacity of the compressor76.67 N·m3/min
  p ap max Maximum pressure of buffer tank3.2 MPa
  p ap min Minimum pressure of buffer tank0.1 MPa
  p hp max Maximum pressure of high-pressure reservoir25.0 MPa
  p mp max Maximum pressure of medium-pressure reservoir21.0 MPa
  p lp max Maximum pressure of low-pressure reservoir15.0 MPa
  p hp min Minimum pressure of high-pressure reservoir17.5 MPa
  p mp min Minimum pressure of medium-pressure reservoir12.5 MPa
  p lp min Minimum pressure of low-pressure reservoir7.5 MPa
TRegeneration and cold purging time of dehydration device8 h
TmaxLowest ambient temperature304.15 K
TminLowest ambient temperature284.15 K
VaVolume of buffer tank4000 × 3 L
Vh (Vm, Vl)Volume of the reservoirs4000 L
Table 2. The daily economic operation evaluation indicators of the continuous experiment.
DateJCNdCNfN
Day 114.7165976.650.775
Day 214.7165976.650.775
Day 314.7165976.650.775
Day 414.7020975.200.775
Day 514.7020975.200.775
Day 614.7020975.200.775
Day 714.7020975.200.775
Disclaimer/Publisher’s Note: The statements, opinions and data contained in all publications are solely those of the individual author(s) and contributor(s) and not of MDPI and/or the editor(s). MDPI and/or the editor(s) disclaim responsibility for any injury to people or property resulting from any ideas, methods, instructions or products referred to in the content.

