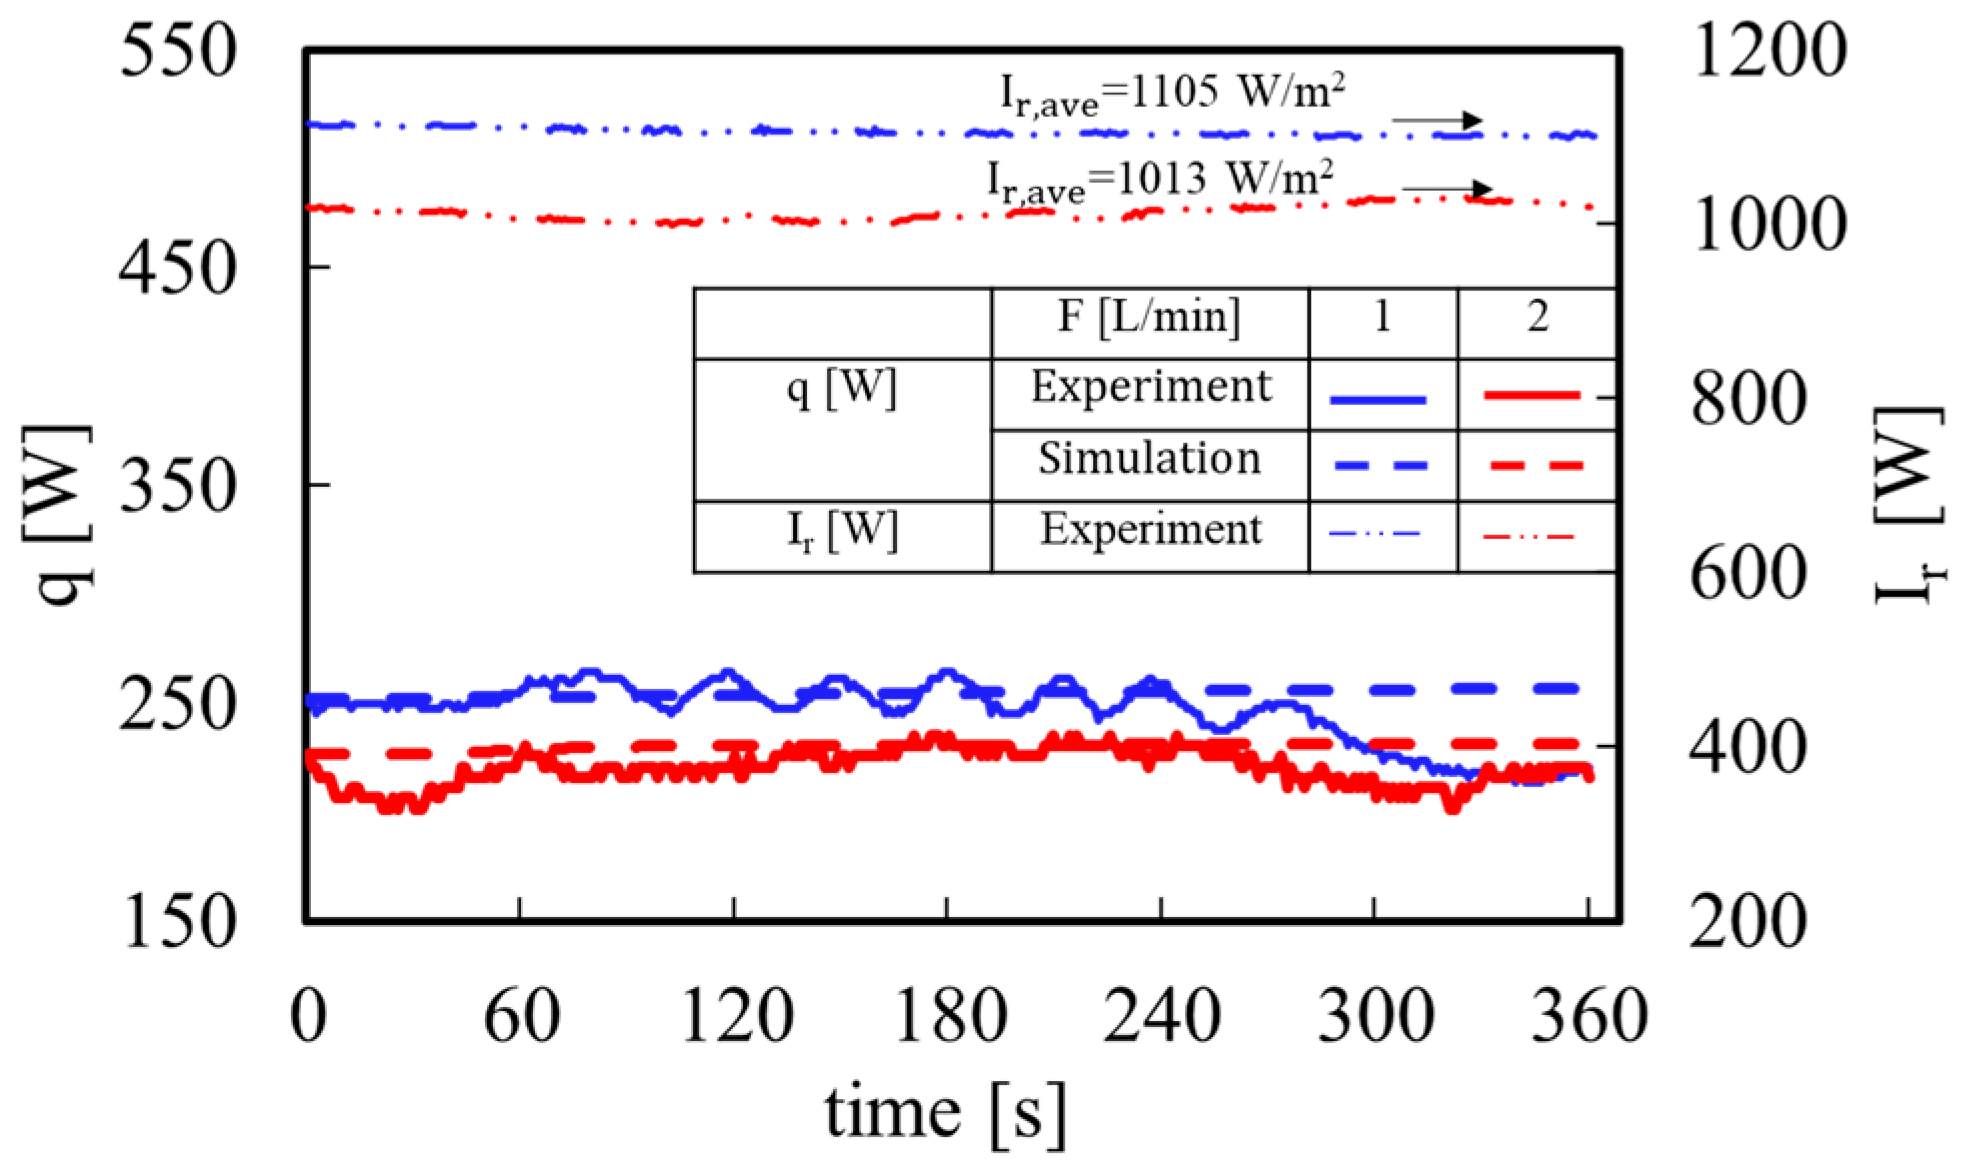
In this section, we first verify the grid and time-step independence before proceeding with the simulations. We compare the simulation results with the experimental results to validate the accuracy of the mathematical model. To consider the rheological properties, we calculate the specific viscosities of the PCM fluid. Additionally, we examine the effects of flow rate and PCM weight fraction on the melting mass and the recovered heat. We also calculate the relative circulation power of the loop and evaluate the net transportable energy and estimate the heat-storing time for the SCHP unit.
3.1. Grid and Time-Step Independence
Meshing grid density and time step can affect the computational cost and accuracy of the simulation results. To verify the independence of grid density and time step on the simulation results, this section verifies the independence of three different sizes of grids (the total elements number is , and , respectively) and three different time steps (0.1 s, 1 s, and 5 s) on the simulation results. The mean absolute percentage errors (MAPEs) of temperature at four locations (Re inlet/outlet and SC inlet/outlet) were compared at different grid densities and time steps.
Table 4 presents the MAPEs results for grid independence. It considers the maximum elements number of
as the actual value. The MAPEs of
are 0.75~1.06% and that of
are 0.33~0.35%. Considering the computational cost and memory usage, the grid density
is adopted in this study.
Table 5 displays the MAPEs results for time-step independence. It considers the minimum time step of 0.1 s as the actual value. This table shows that the time step only has minimal effect on the simulation results, and the MAPEs of 1 s and 5 s are distributed between 0.017% and 0.066%. Because of the computational cost and better convergence, the time step used in the sensible heat step is 1 s and when latent heat is involved it is 0.1 s.
3.4. Effects of Flow Rates on Recovered Heat
In this subsection, four different flow rates of the PCM fluid are chosen to study the effects of flow rates on melting rate and enhanced recovered heat. The four flow rates in connecting pipes (CPs) are 0.5 L/min (8.3 × 10
−6 m
3/s), 1 L/min (1.6 × 10
−5 m
3/s), 2 L/min (3.3 × 10
−5 m
3/s), and 3 L/min (5 × 10
−5 m
3/s). The PCM fluid used in this subsection contains 10 wt% PCM, which was tested in previous studies [
37]. The Reynolds numbers are 34, 67, 130, and 195, respectively (the physical properties of the mixture are calculated by volume average).
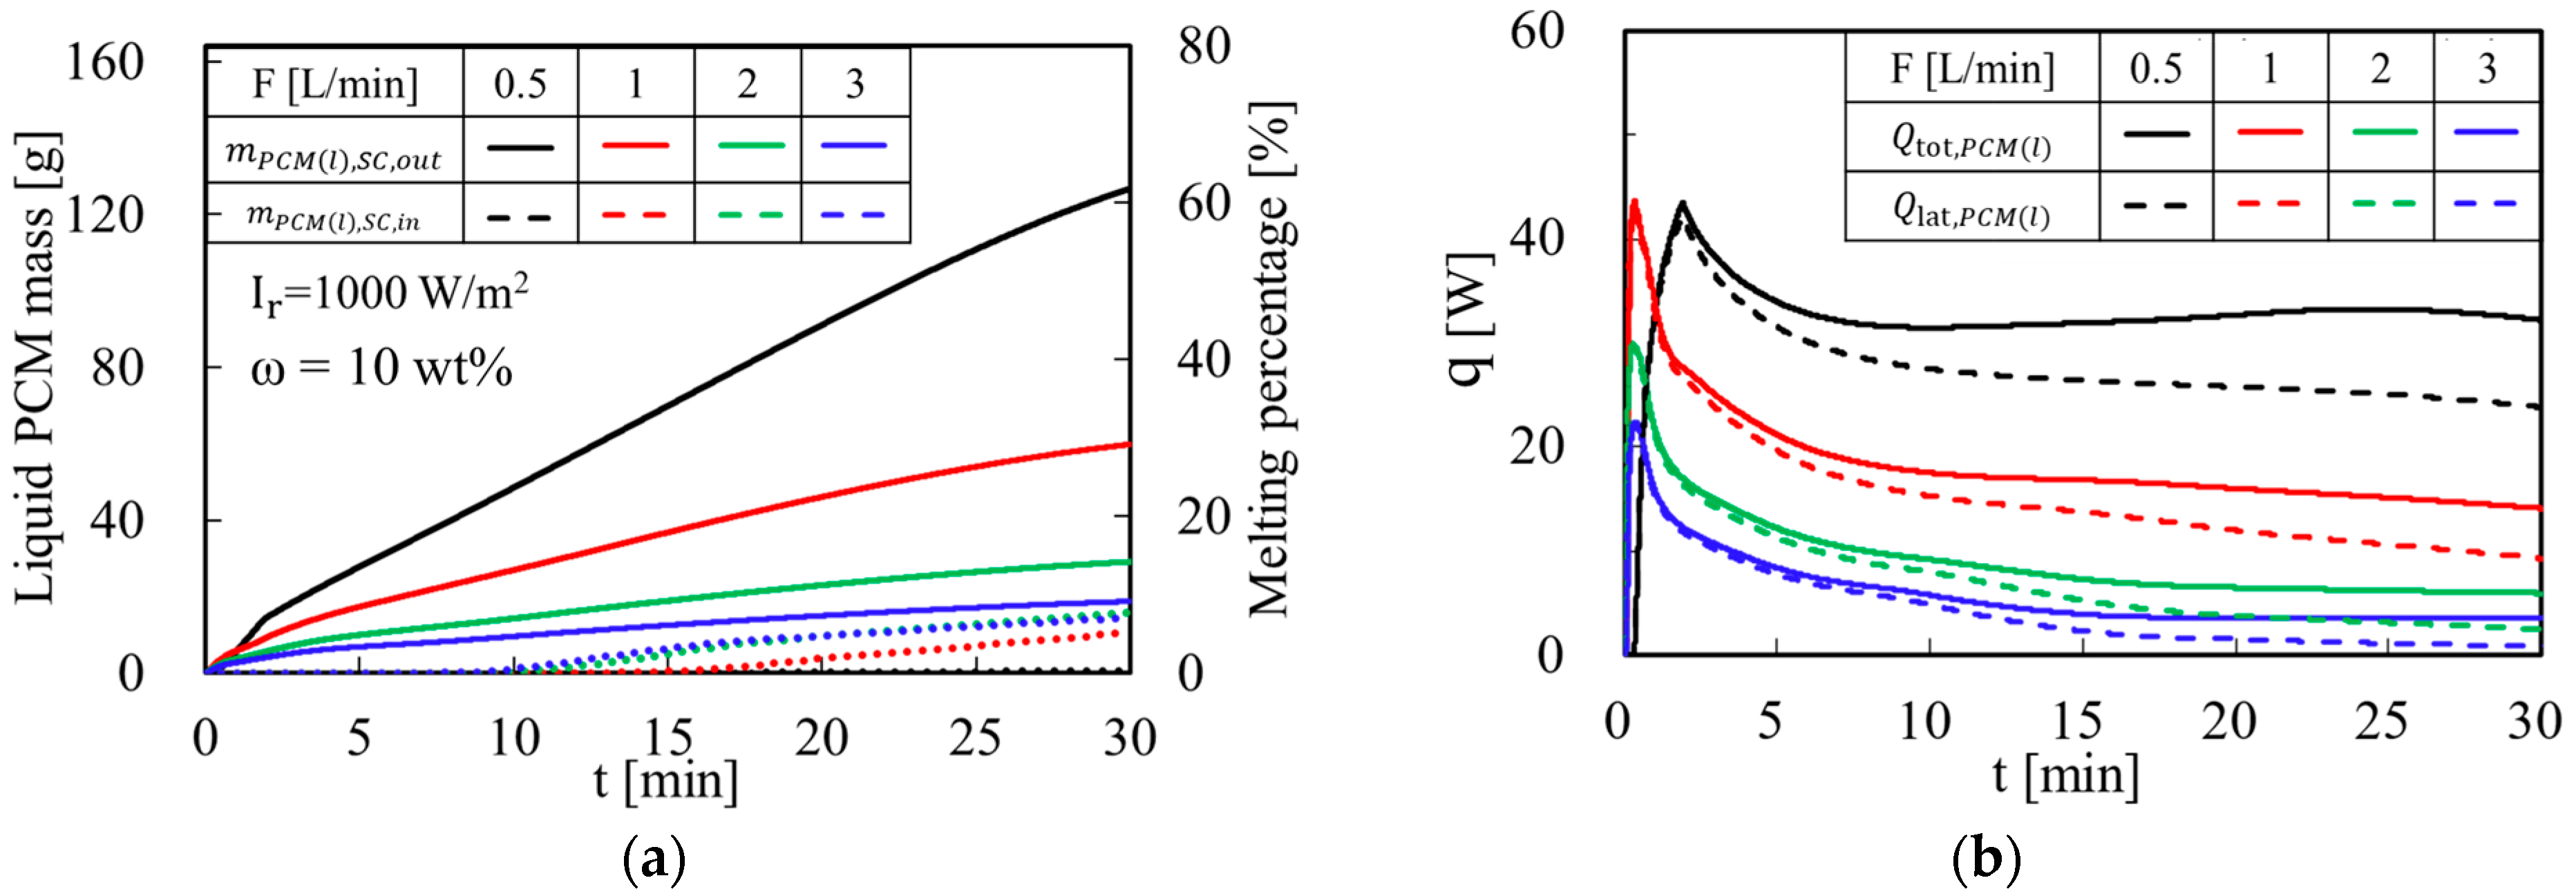
Figure 4a indicates the mass and melting percentage of liquid PCM over time at the SC outlet. As the PCM fluid is continuously circulated through the CPs between SC and Re, the melted PCM accumulates during the cycle. With the same content of PCM and in the first 30 min, 62% of the PCM is melted at the flow rate of 0.5 L/min, 30% is melted at 1 L/min, 14% is melted at 2 L/min, and 9% is melted at 3 L/min after liquid PCM is detected at the SC outlet. Melting mass increases as the flow rate decreases.
Figure 4b shows the recovered heat of liquid PCM. 1 L/min has the highest peak power, followed by 0.5 L/min, 2 L/min, and 3 L/min. The power from latent heat decreases significantly over time. In the cases of 1–3 L/min, as the flow rate decreases, the peak power gradually decreases. Due to the lower convective heat transfer in the case of 0.5 L/min, the peak-recovered heat appears later. Moreover, the average power is inversely proportional to the flow rate. This is because as the melting progresses, the PCM fluid with a lower flow rate can stay in the SC for a longer period of time. Hence under the conditions of the same solar heat flux, the PCM fluid with a lower flow rate receives more solar irradiance, and, therefore, the melting mass and recovered heat of the liquid PCM are significant.
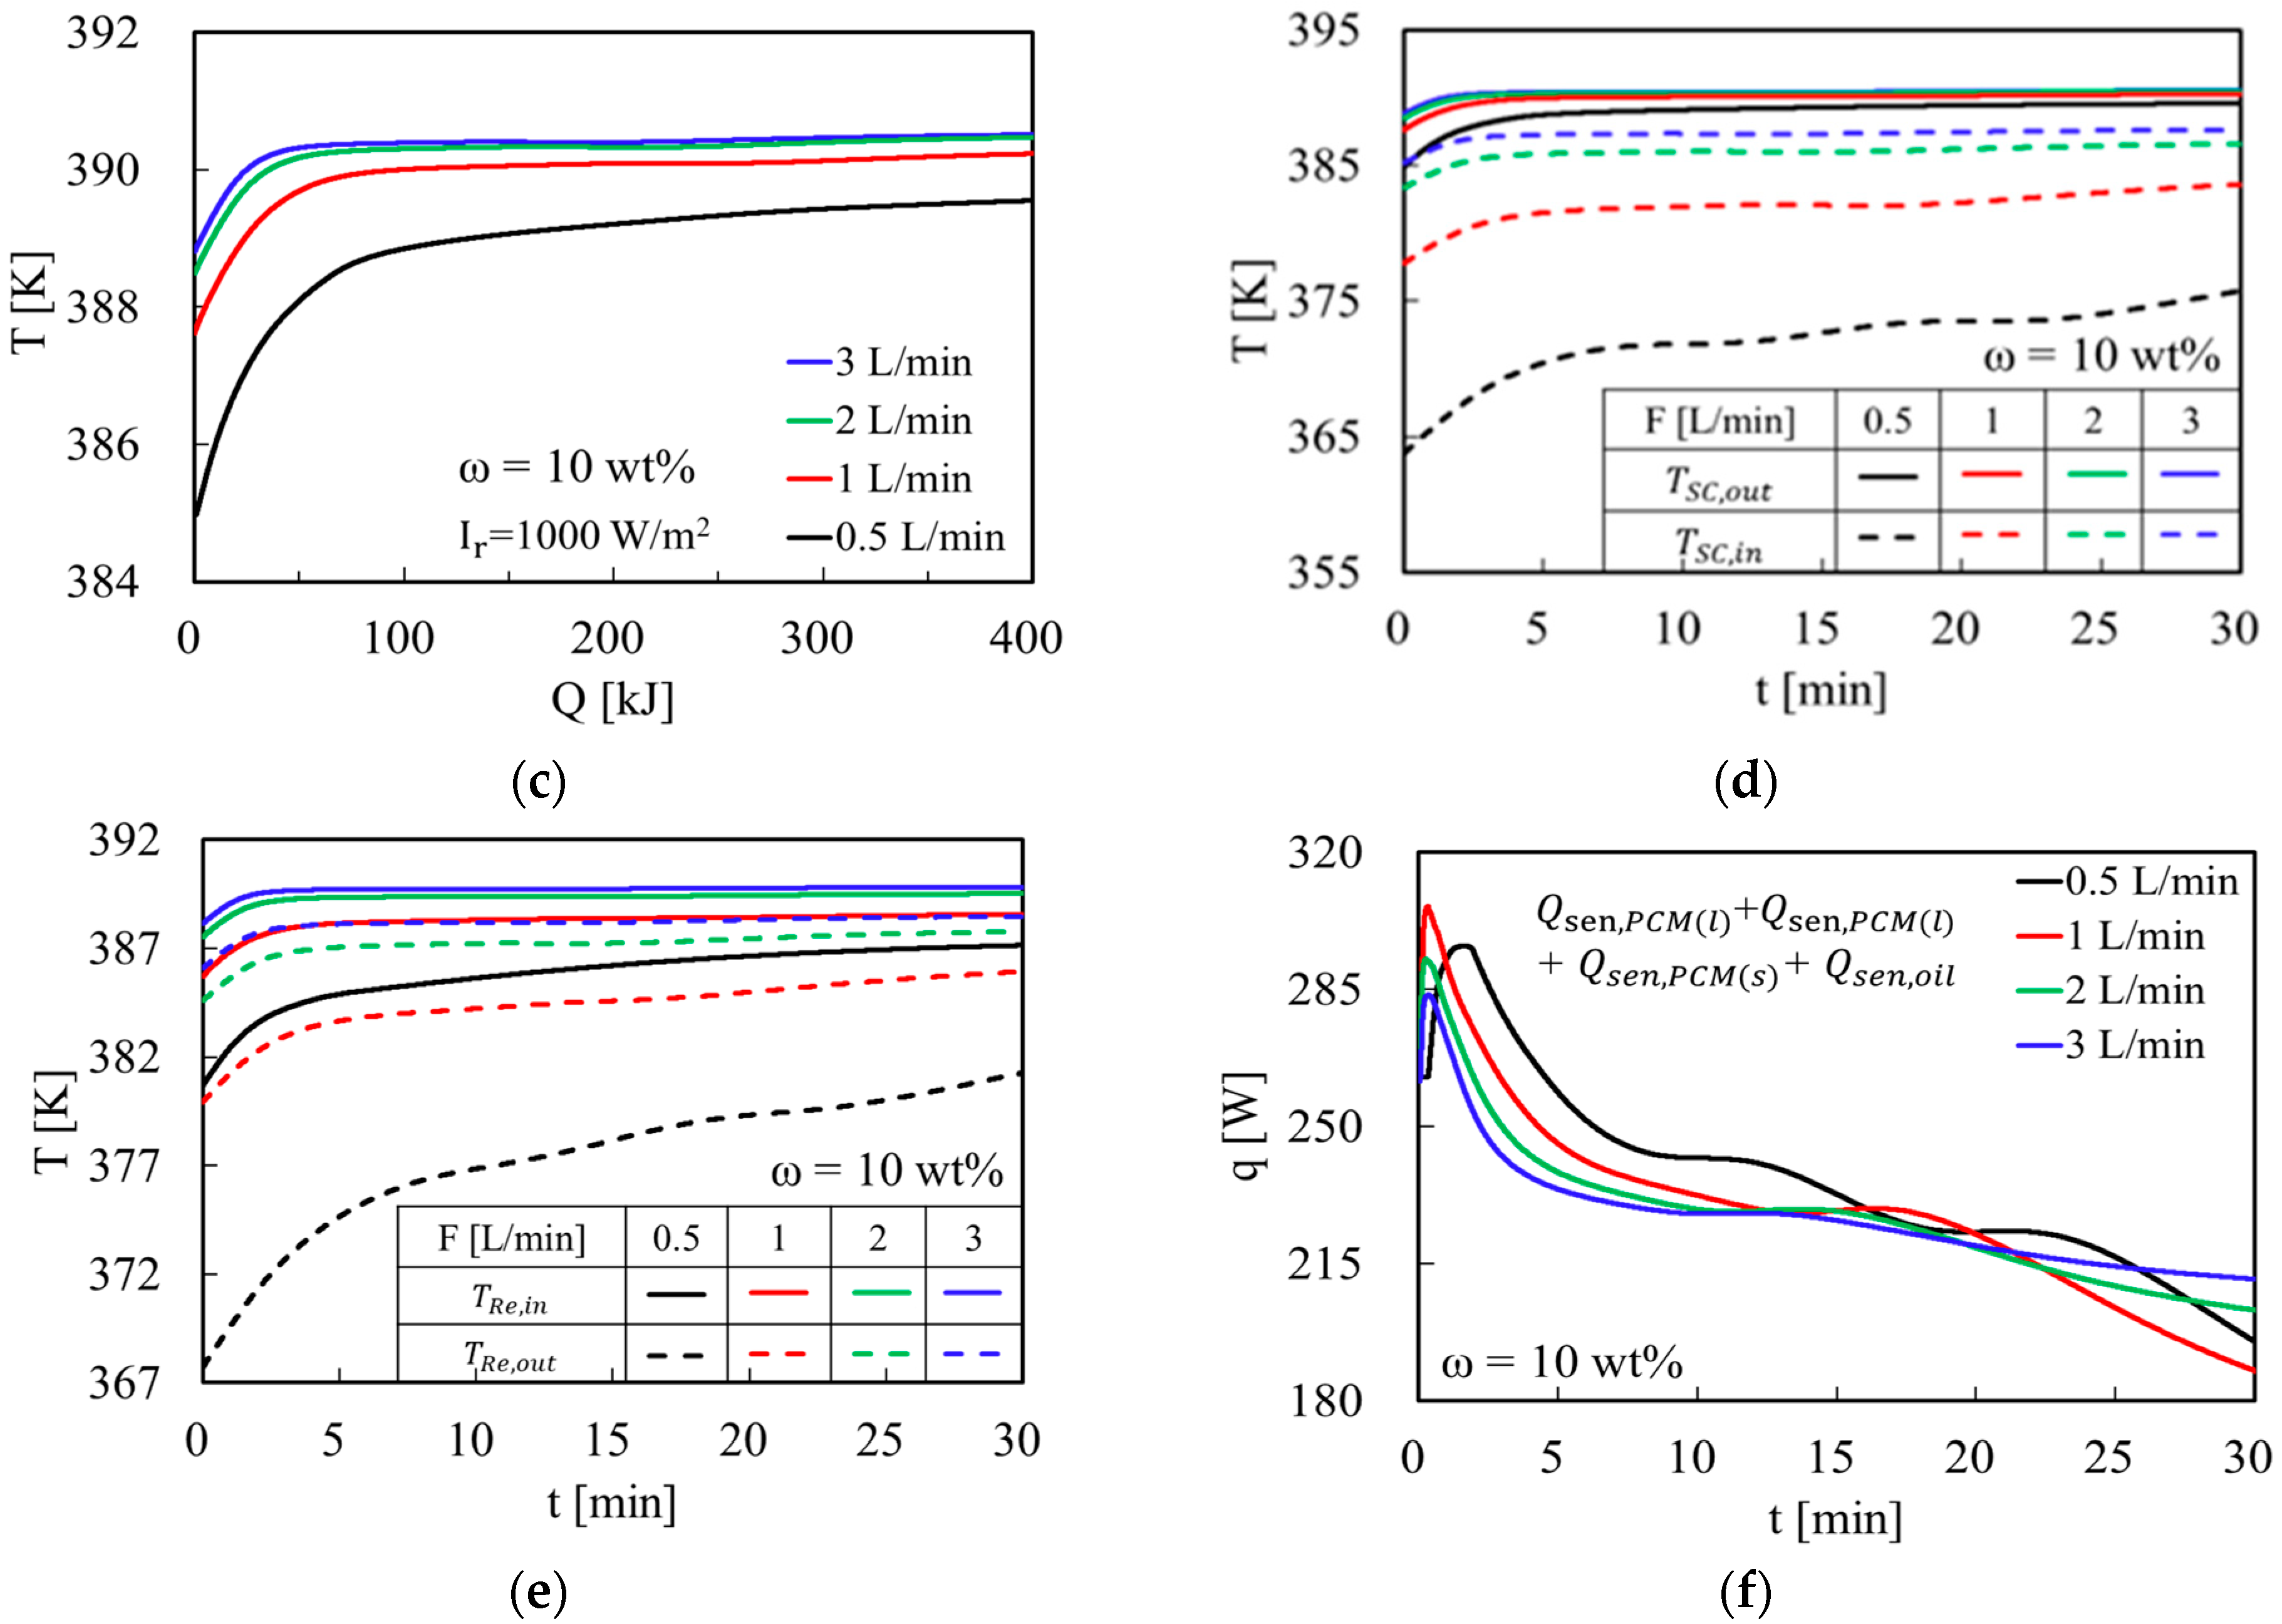
Figure 4c presents the SC outlet temperature over total recovered heat (kJ). During the melting process, the difference in temperature change at the SC outlet among the three flow rates is small. In the melting temperature range, 2 L/min and 3 L/min are close, 1 L/min is lower, and 0.5 L/min is the lowest. This indicates that the PCM fluid at 0.5 L/min starts to melt earlier.
Figure 4d,e display the temperature of PCM fluid at the SC and Re inlet/outlet after melting over time. The larger flow rate and PCM mass carries the greater latent heat. This results in a slower temperature rise at the inlet of the SC. Similarly, 0.5 L/min has the largest temperature rise at the Re outlet due to its lower heat capacity.
Figure 4f represents the total recovered heat of the PCM fluid (including sensible heat of silicone oil, solid PCM, liquid PCM, and latent heat). Compared to the recovered heat of pure silicone oil shown in
Figure 2, the total recovered heat of 10 wt% PCM fluid in the SC is enhanced when the PCM starts melting. Compared to using pure silicone oil as HTF, the recovered heat at 0.5 L/min is enhanced to a maximum of 296 W and an average of 236 W, at 1 L/min is enhanced by a maximum of 1.33 times (from 230 W to 306 W) and an average of 1.01 times (from 230 W to 231 W), at 2 L/min is enhanced by a maximum of 1.29 times (from 227 W to 292 W) and an average of 1.01 times (from 227 W to 228 W), and at 3 L/min is enhanced by a maximum of 283 W and average of 227 W.
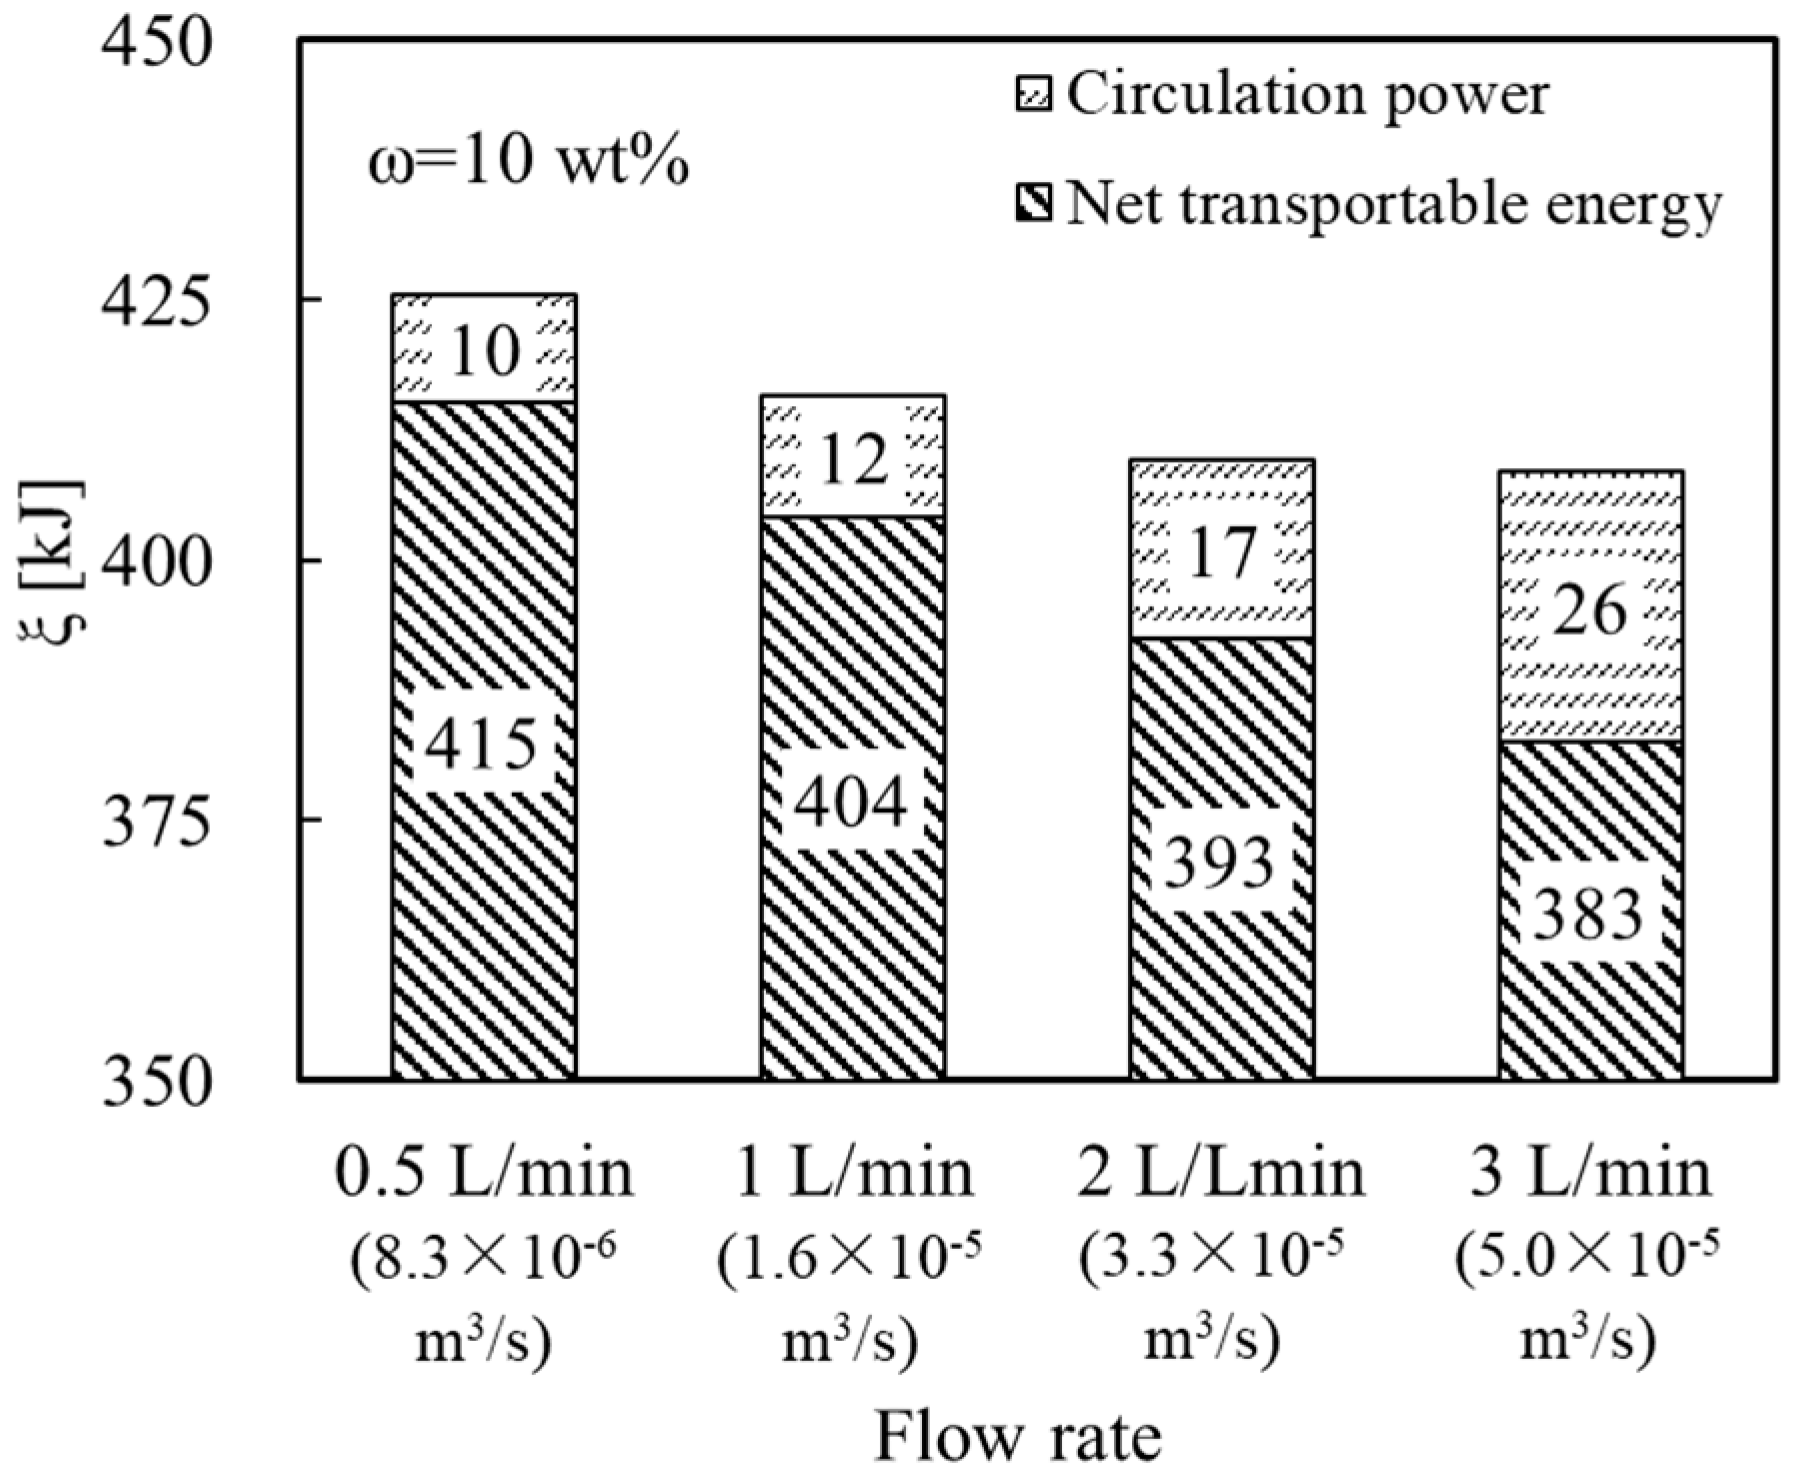
With the SC area of 1 m
2, when solar irradiation is constant at 1000 W/m
2, and after a continuous circulation of 30 min,
Figure 5 presents the net transportation energy and circulation power of the loop under different flow rates at 30 min. At 30 min, the net transportation energy of PCM fluid from 0.5 L/min to 3 L/min is 415 kJ, 404 kJ, 393 kJ, and 383 kJ, respectively. Therefore, in these cases, the net transportation energy will increase as the flow rate decreases. In this case, lower flow rates (0.5 L/min and 1 L/min) can promote the recovered heat and net transportation energy.
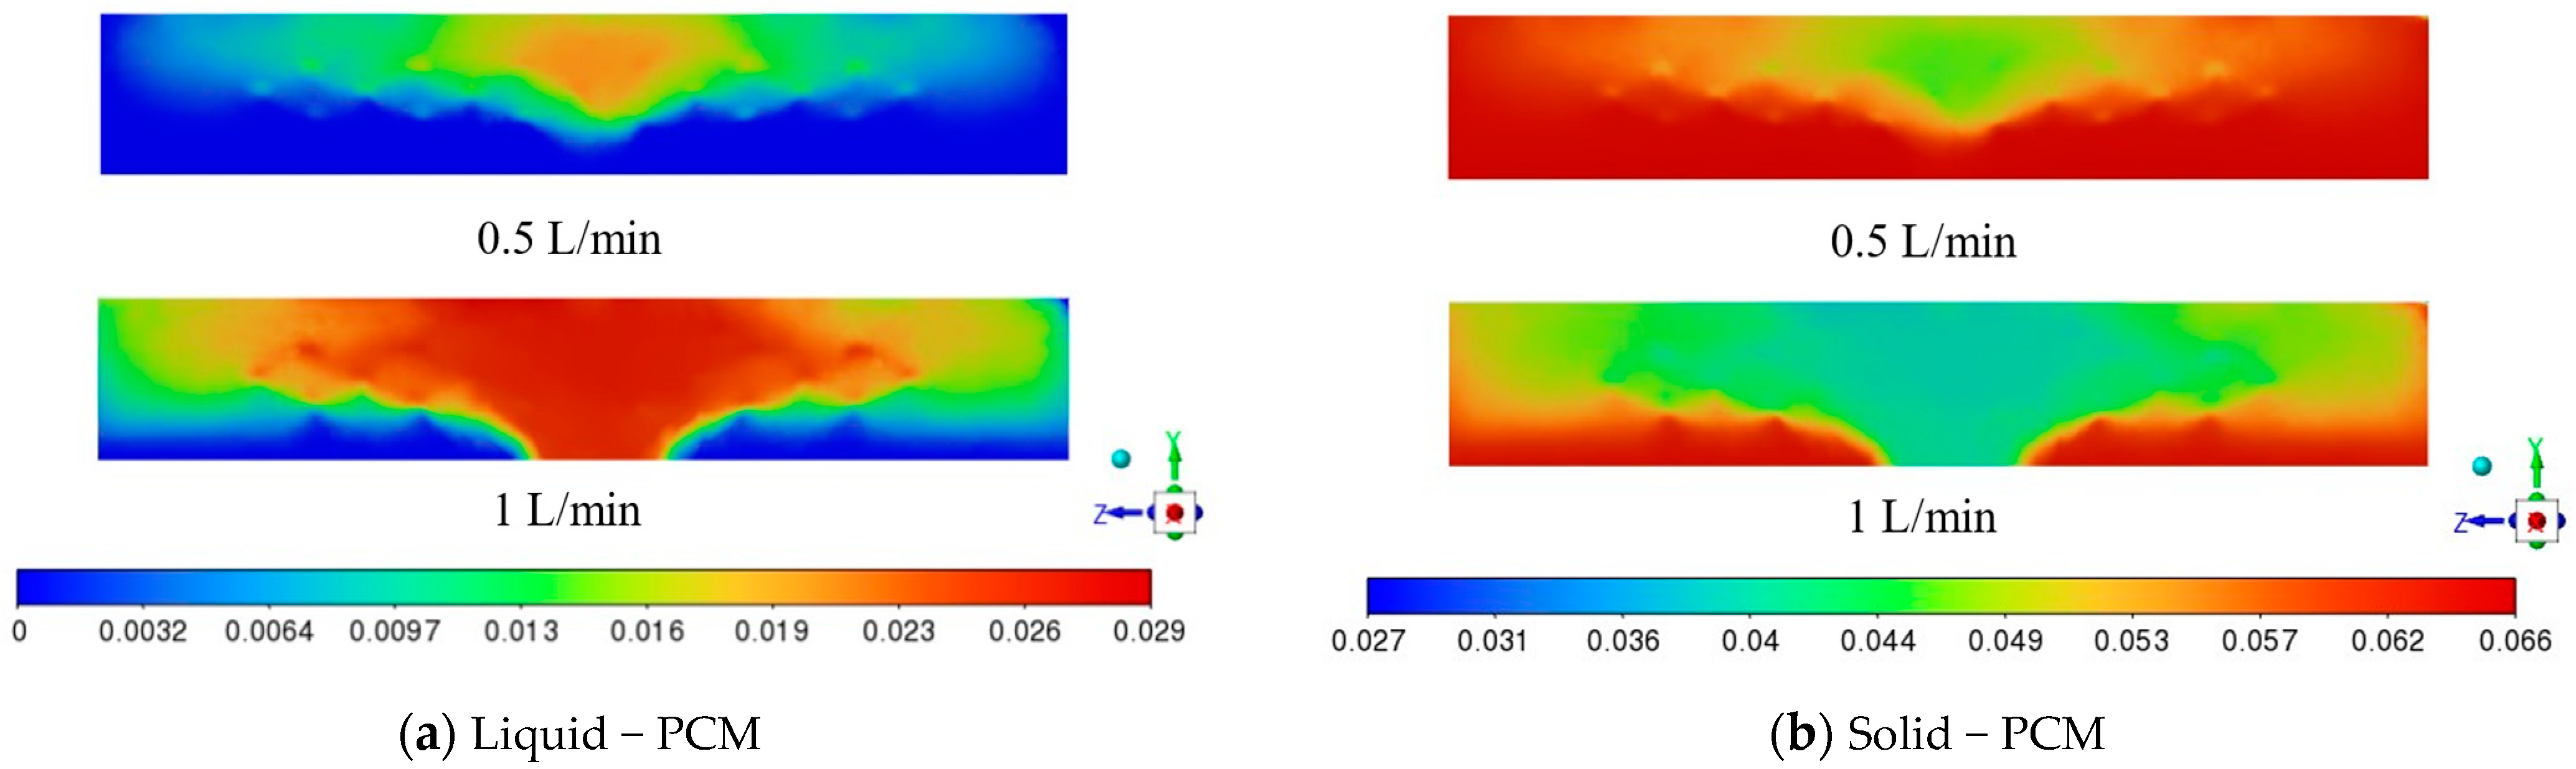
However,
Figure 6 presents the sectional view of 10 wt% PCM fluid at the Re inlet. The fraction of lower liquid PCM and higher solid PCM almost coincides. At 0.5 L/min, underdeveloped flow resulted in more solid PCM remaining at the bottom of the reactor, creating a “dead zone” and precipitation. In addition, underdeveloped flow caused by a low flow rate can lead to small heat transfer and mass transfer characteristics. For example, in the chemical heat-storing step, the fluid is used for heating the reactant, and the underdeveloped flow can reduce the heat transfer rate and cause hot spots on the reactant, leading to reduced efficiency and even equipment failure.
Therefore, considering the above reasons, 1 L/min should be one of the best choices.
3.5. Effects of Weight Fractions of PCM on Recovered Heat
In this subsection, we investigated the effects of different PCM weight fractions on melting mass and recovered heat. The previous study [
37] found that using 10 wt% PCM fluid in a straight pipe had little effect on pressure drop. However, due to the intricate piping in the SCHP unit, which includes the U-shaped pipes in the SC and heat exchange pipes of the Re, a higher particulate loading may lead to pipeline blockage and unstable flow path, resulting in greater pressure drop. To address this issue, we analyzed the performance of lower particulate loadings, specifically 2 wt% and 5 wt%.
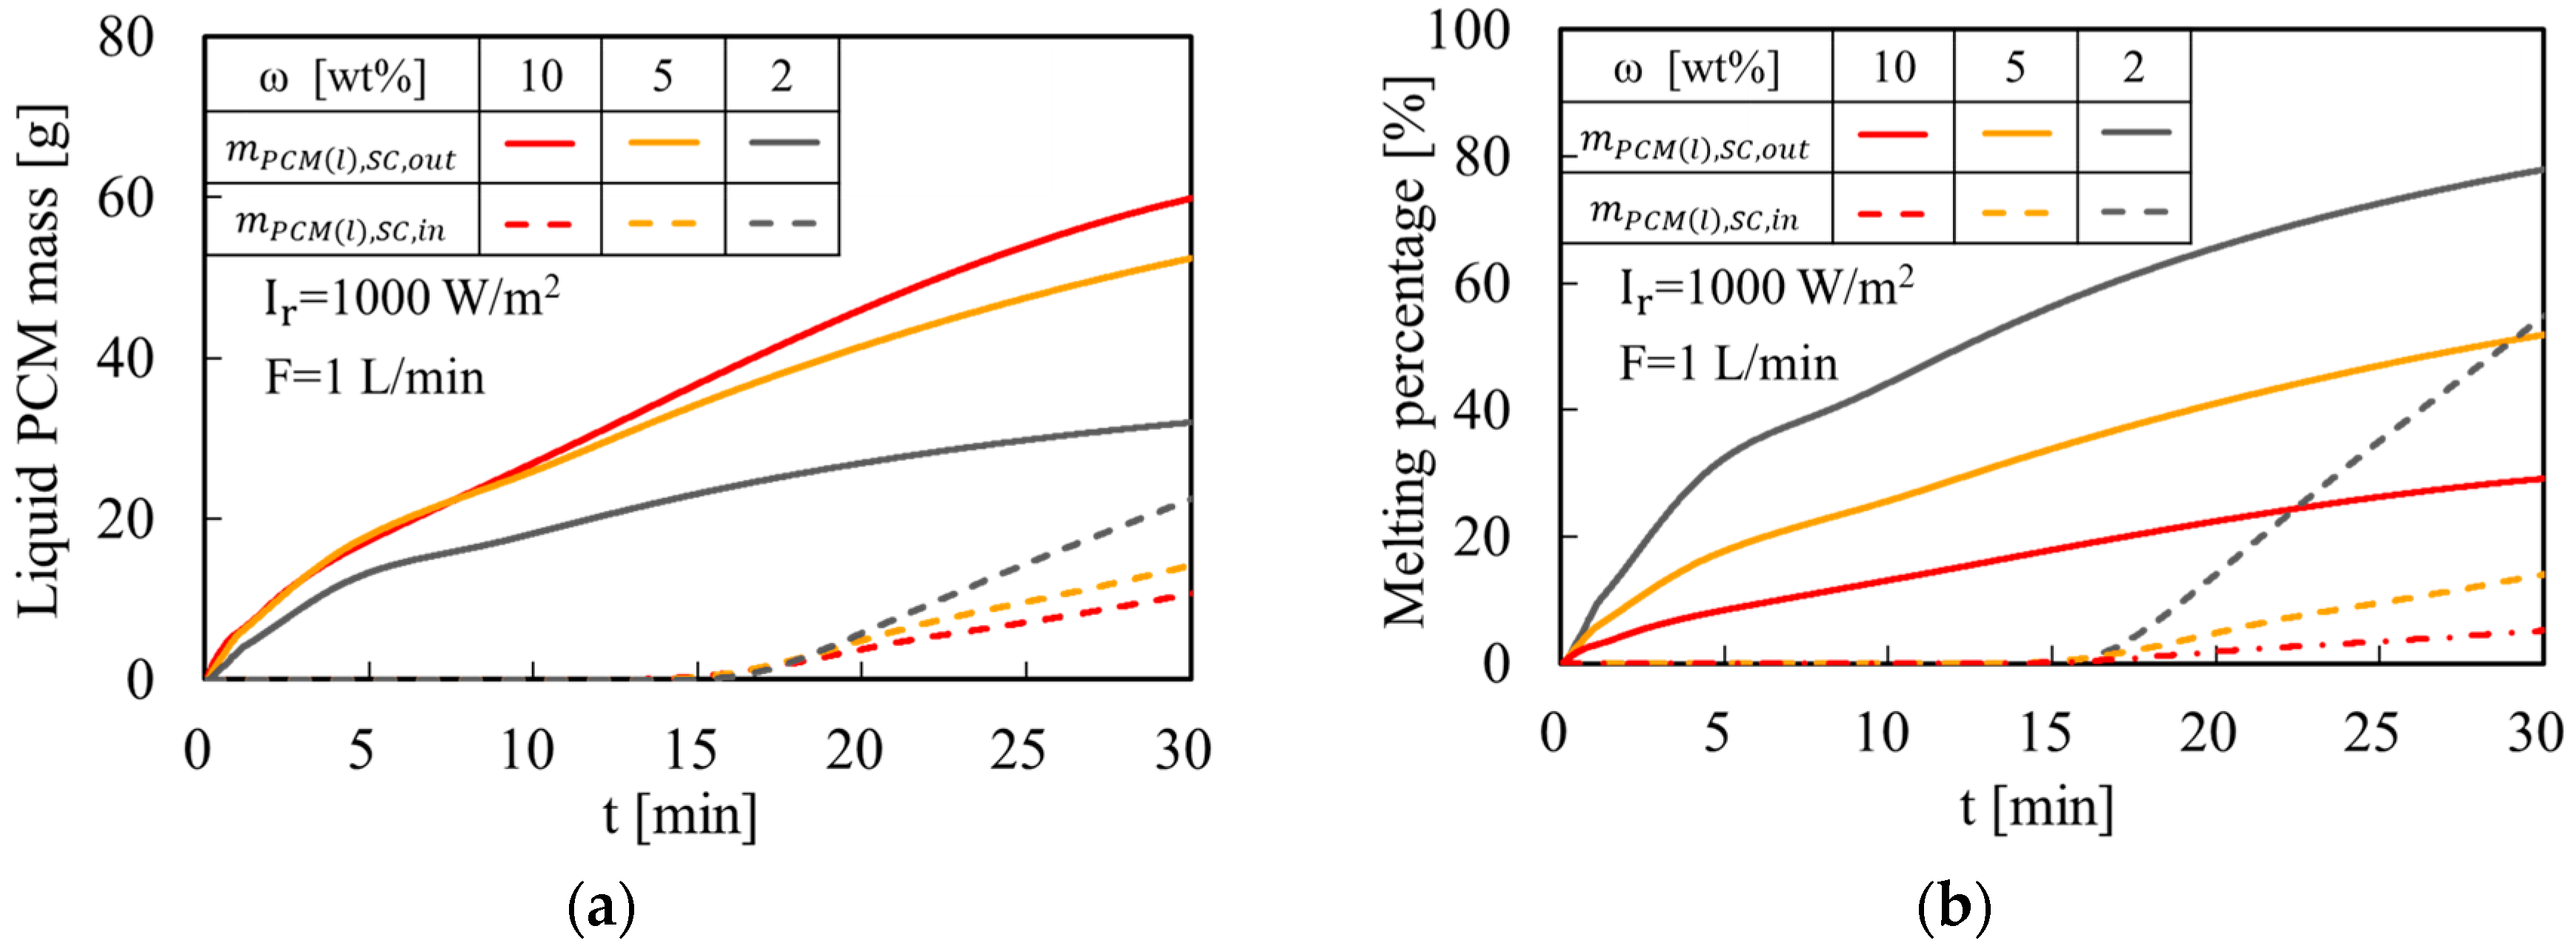
Figure 7a displays the mass of liquid PCM at the SC inlet and outlet over time. When subjected to the same flow rates, a higher concentration of PCM results in a greater quantity of melted PCM within the same time interval, as predicted. However, the rate of increase in the amount of melted PCM decreases as the PCM concentration increases. Specifically, reducing the PCM content by 5 times (from 10 wt% to 2 wt%) does not correspondingly decrease the melting amount by the same factor. This phenomenon is likely due to Equation (15), which utilizes the temperature differential between the melting point and the PCM fluid temperature as the driving force for phase change. The increased specific heat of higher PCM concentrations inhibits the temperature growth, resulting in a lower melting mass. On the other hand, as
Figure 7a,b show, the maximum amount of liquid PCM detected at the SC inlet is 2 wt% PCM fluid, likely due to the higher fluid temperature (
Figure 7e,f) of the 2 wt% PCM fluid in the Re. This high temperature makes it more difficult for the PCM to solidify in the Re, allowing the liquid PCM to return directly to the SC without solidification.
Figure 7b presents the percentage of melting over time for different PCM contents. Within the first 30 min, only 29% of the PCM is melted using 10 wt%, 52% using 5 wt%, and 78% using 2 wt%. However, after 30 min, the melting speed of 2 wt% decreased to almost zero. Increasing the PCM contents can prolong the gain time of latent heat.
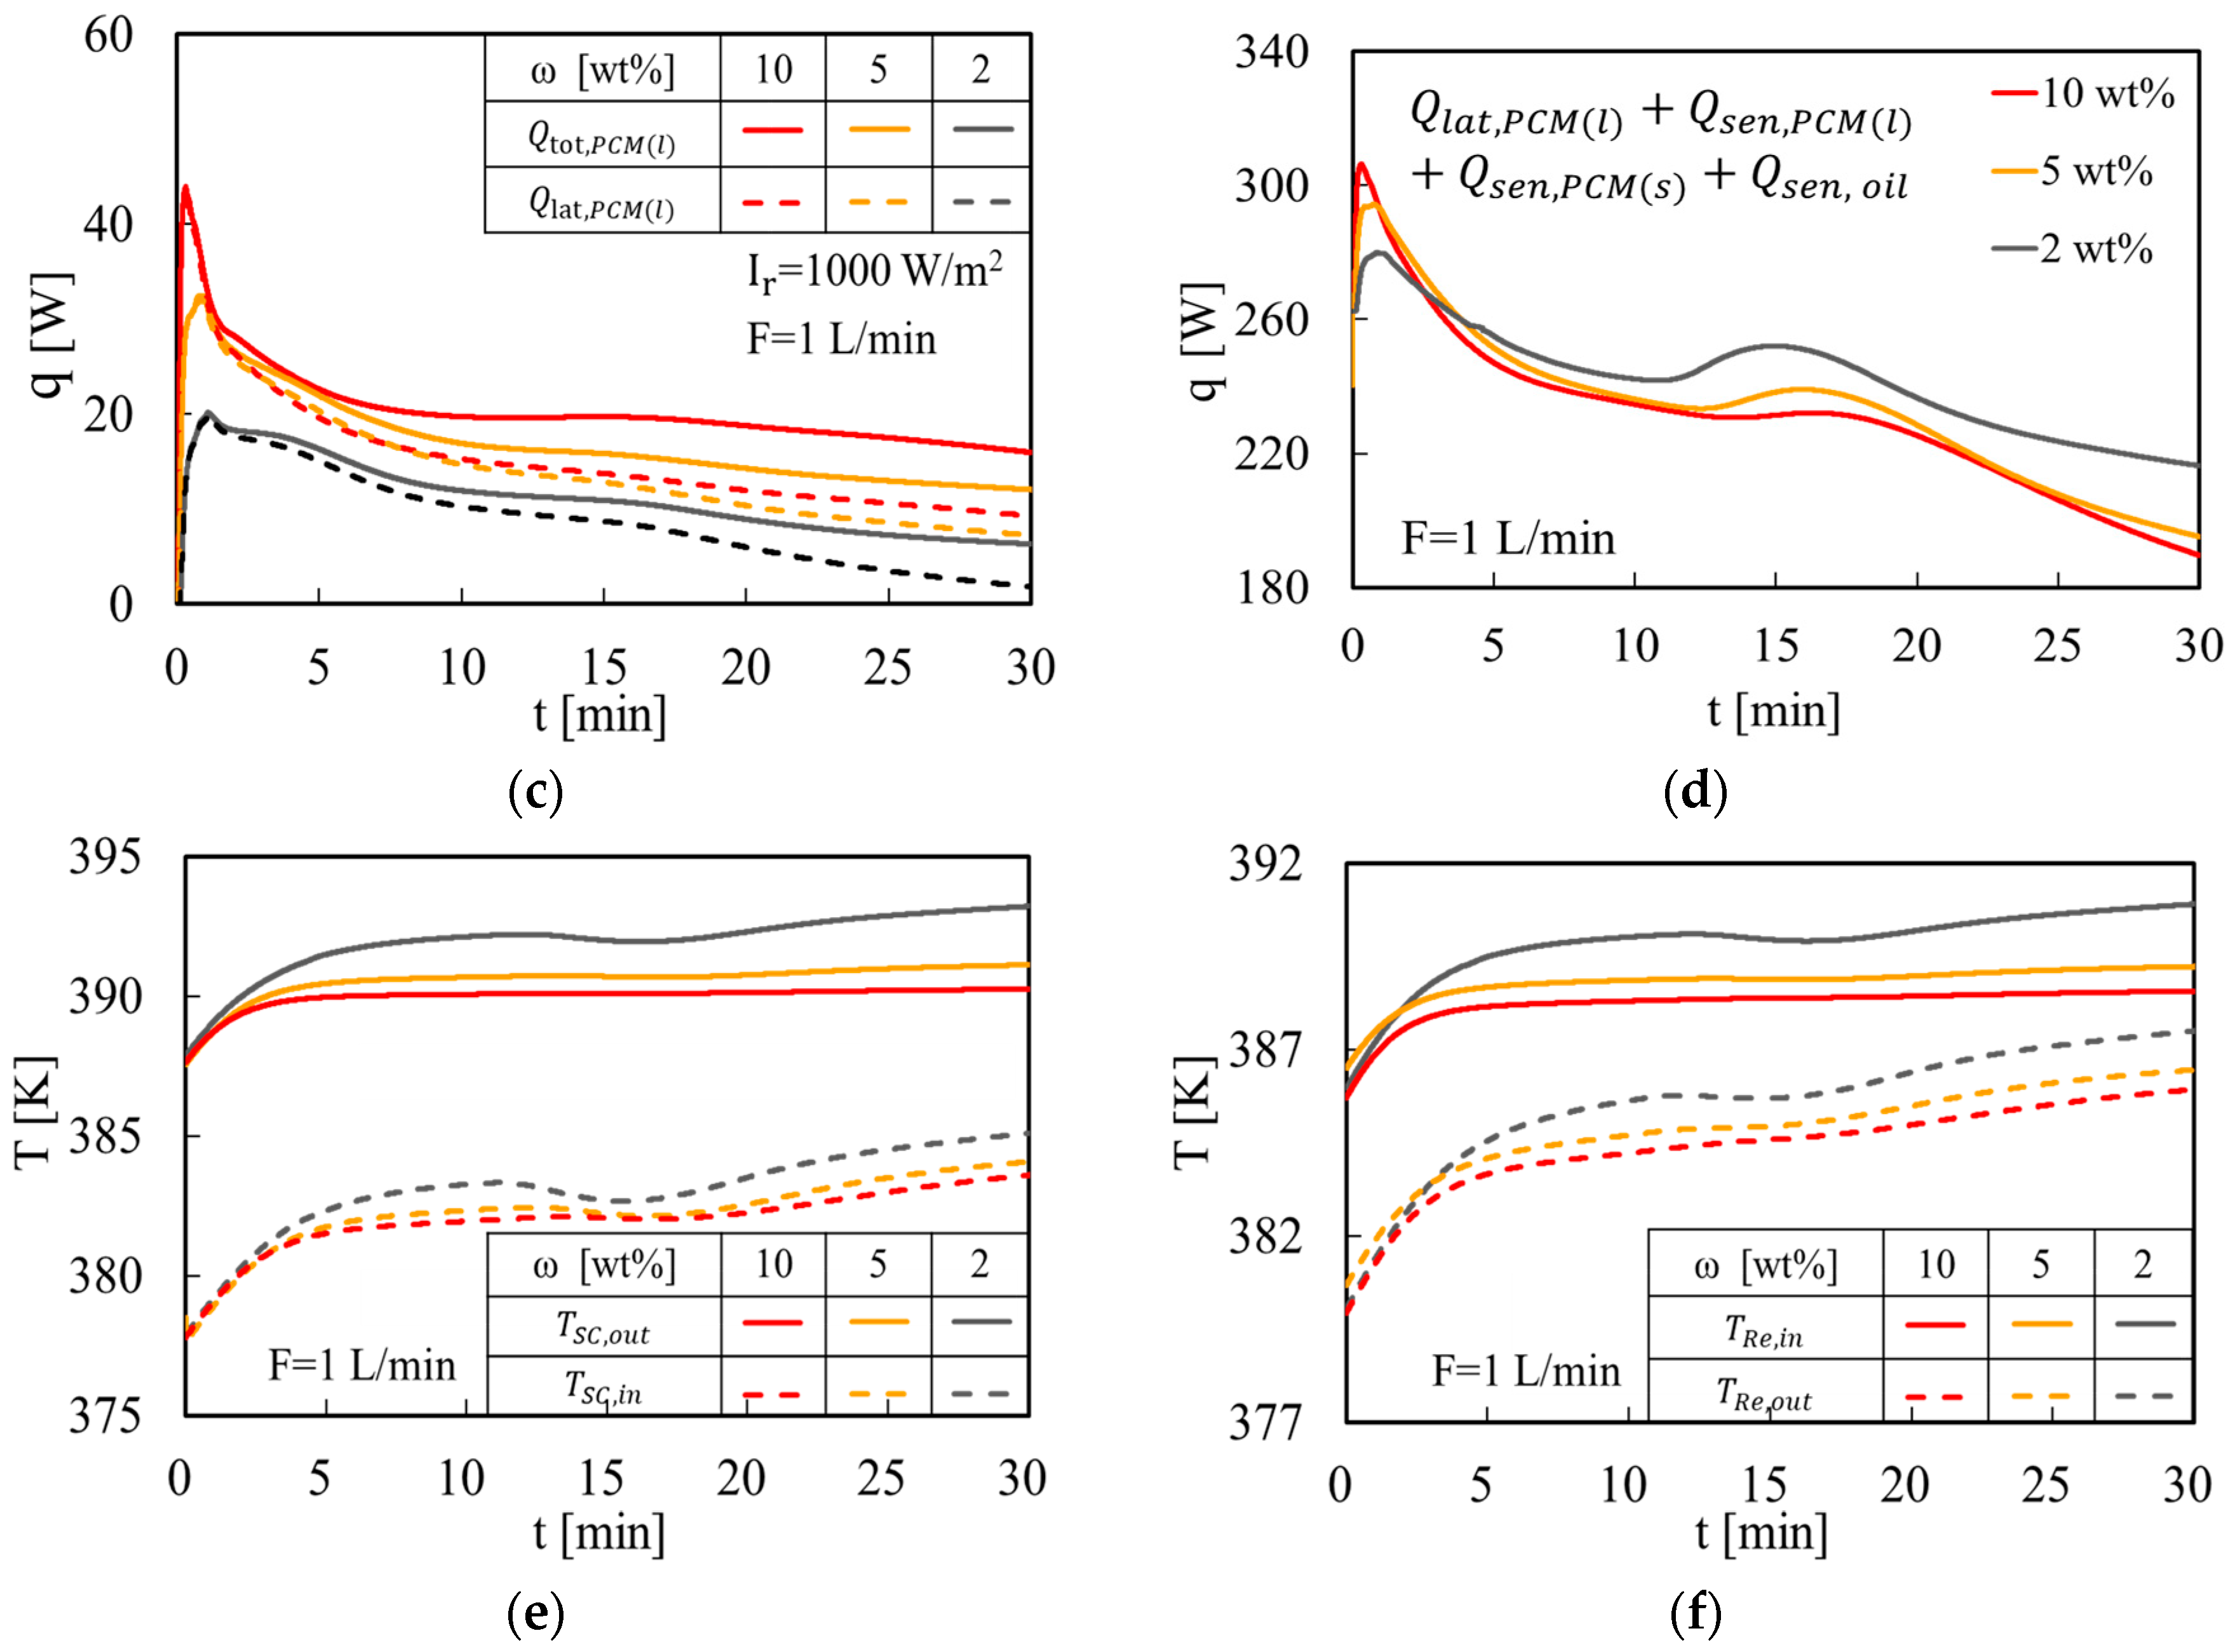
Figure 5c illustrates the recovered heat of liquid PCM over time. The peak power of 10 wt%, 5 wt%, and 2 wt% PCM fluid is 44 W, 32 W, and 20 W, respectively. The average power of the three cases is 20 W, 17 W, and 11 W, respectively. Additionally, the latent power brought by 2 wt% is almost zero at 30 min, but there is still sensible heat power brought by the melted PCM.
Figure 7d demonstrates the effects of PCM weight fraction on the total recovered heat of PCM fluid. The temperature difference between the SC inlet and outlet directly affects the recovered heat of the SC. As shown in
Figure 7e, the temperature difference for all three-weight fractions at the beginning of melting is 10 K, but after 30 min of melting, the minimum temperature difference of 10 wt% is 6.7 K, whereas the maximum temperature difference for 2 wt% is 8.1 K. This leads to a higher recovered heat of 2 wt% PCM. Compared to using pure silicone oil as HTF, the recovered heat using 10 wt% PCM is enhanced by a maximum of 1.33 times (from 230 W to 306 W) and an average of 1.01 times (from 230 W to 231 W), using 5 wt% is enhanced by a maximum of 1.28 times (from 230 W to 294 W) and an average of 1.02 times (from 230 W to 234 W), and using 2 wt% is enhanced by a maximum of 1.22 times (from 230 W to 280 W) and an average of 1.06 times (from 230 W to 243 W).
Figure 7e,f respectively display the temperature of PCM fluid at the SC and Re inlet/outlet after melting over time. The three weight fractions exhibit varying degrees of temperature drop and rise. This phenomenon can be explained from a thermodynamic viewpoint. As the PCM absorbs heat during melting, it absorbs energy from its surroundings, including the heat from silicone oil, causing the temperature of the mixture to drop slightly. The heat absorbed by the PCM during melting reduces the total heat of the mixture. This temperature drop is relatively small and depends on factors such as the heating rate, the amount of PCM in the mixture, and the nature of the silicone oil.
When the PCM and silicone oil mixture is heated until the PCM melts, the smaller the amount of PCM in the mixture, the faster the temperature of the mixture will rise. As PCM melts, the heat capacity of the mixture decreases since liquid PCMs generally have a smaller heat capacity than solid PCMs. When the content of the PCM in the mixture is small, the total heat capacity of the mixture is small, and the same absorbed heat will lead to a larger temperature rise.
Therefore, using a 10 wt% PCM fluid will result in the smallest degree of temperature rise at the SC outlet due to its largest specific heat, while using a 2 wt% PCM fluid will result in the largest temperature rise due to its smallest specific heat. Moreover, the temperature rise of the fluids with different PCM contents is similar at the SC inlet since the difference in heat capacity between the three cases is small in the SC inlet. Combined with the above findings, the total recovered heat of 2 wt% PCM fluid is relatively large.
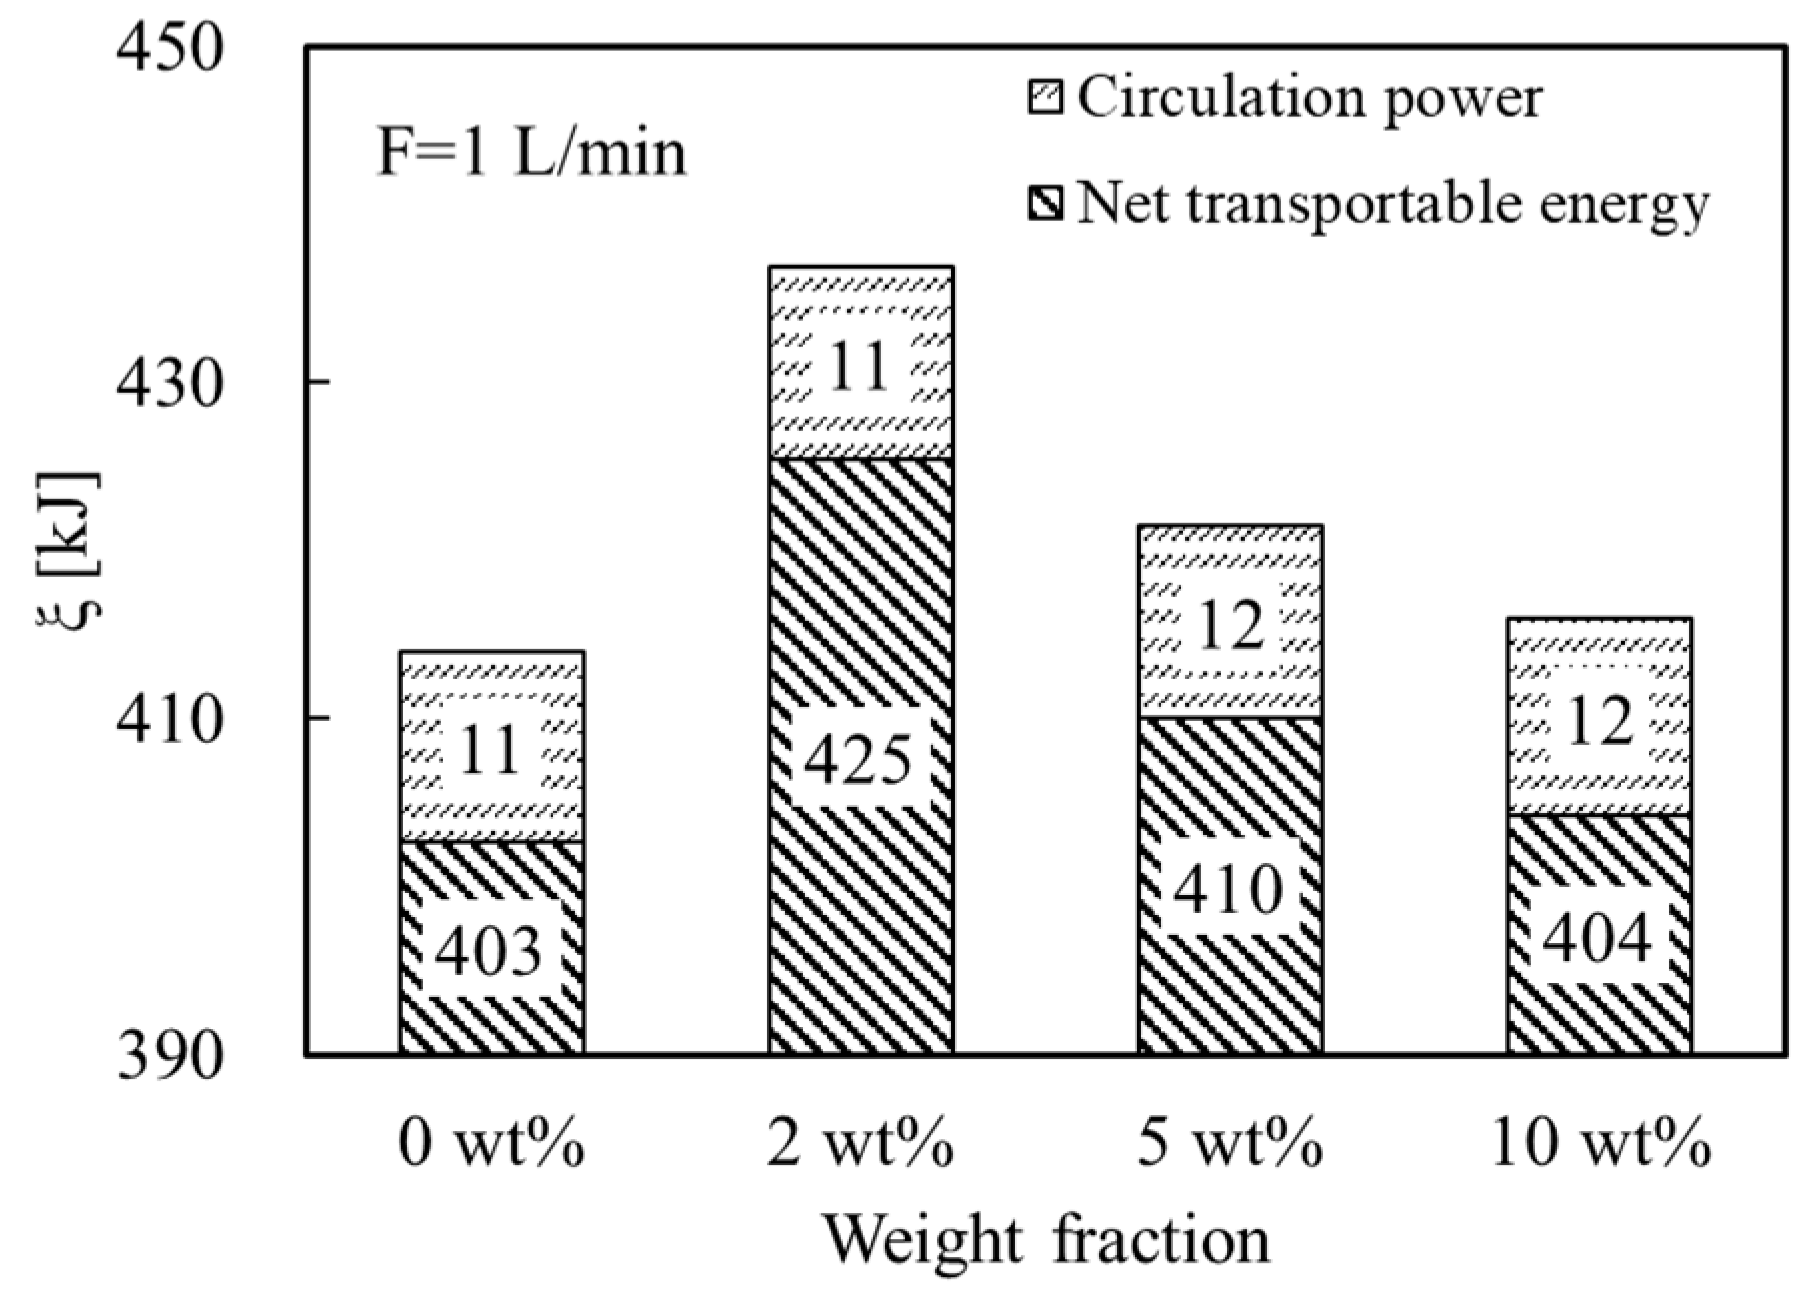
With the SC area of 1 m
2, when solar irradiation is constant at 1000 W/m
2, and after a continuous circulation of 30 min,
Figure 8 presents the net transportation energy and circulation power of the loop under different flow rates at 30 min. At the flow rate of 1 L/min, compared to 0 wt% PCM fluid, when using 2 wt%, 5 wt%, and 10 wt% PCM fluid, the circulation power increases by 1.004, 1.012, and 1.028 times, respectively. At 30 min, the recovered heat of 0 wt%, 2 wt%, 5 wt%, and 10 wt% PCM fluid is 414 kJ, 436 kJ, 422 kJ, and 416 kJ, respectively, and the relative theoretical circulation power of the PCM fluids is 11.4 kJ, 11.4 kJ, 11.5 kJ, and 11.7 kJ, respectively. Therefore, in these cases, 2 wt% PCM fluid achieves the highest net transportable energy due to higher recovered heat and lower circulation power.
3.6. Estimation of Heat-Storing Time for SCHP Unit
In this subsection, we conduct a trial estimation of the shortening effect of using PCM fluid on the heat-storing time for the SCHP unit based on the above simulations. For example, 33% of the recovered heat will be used for the heat exchange of the reactor [
8]. Meanwhile, it is assumed that the latent heat is completely released in the Re during the entire heat-storing step; furthermore, the condenser temperature is set at 288 K, the equilibrium temperature of the reactant is 373 K, and the dehydration conversion of chemical heat storing can reach 100%.
The sensible heat-storing time and chemical heat-storing time of the reactant bed are calculated by the following formulas:
The time of sensible heat storing is the sum of the sensible heat of the reactant bed
and the reactor
divided by the amount of heat exchange in the reactor
. The time of chemical heat storing is the chemical heat of the reactant
divided by the amount of heat exchange in the reactor.
Table 6 presents the amount of heat exchange in the reactor.
Table 7 presents the demand energy in the reactor.
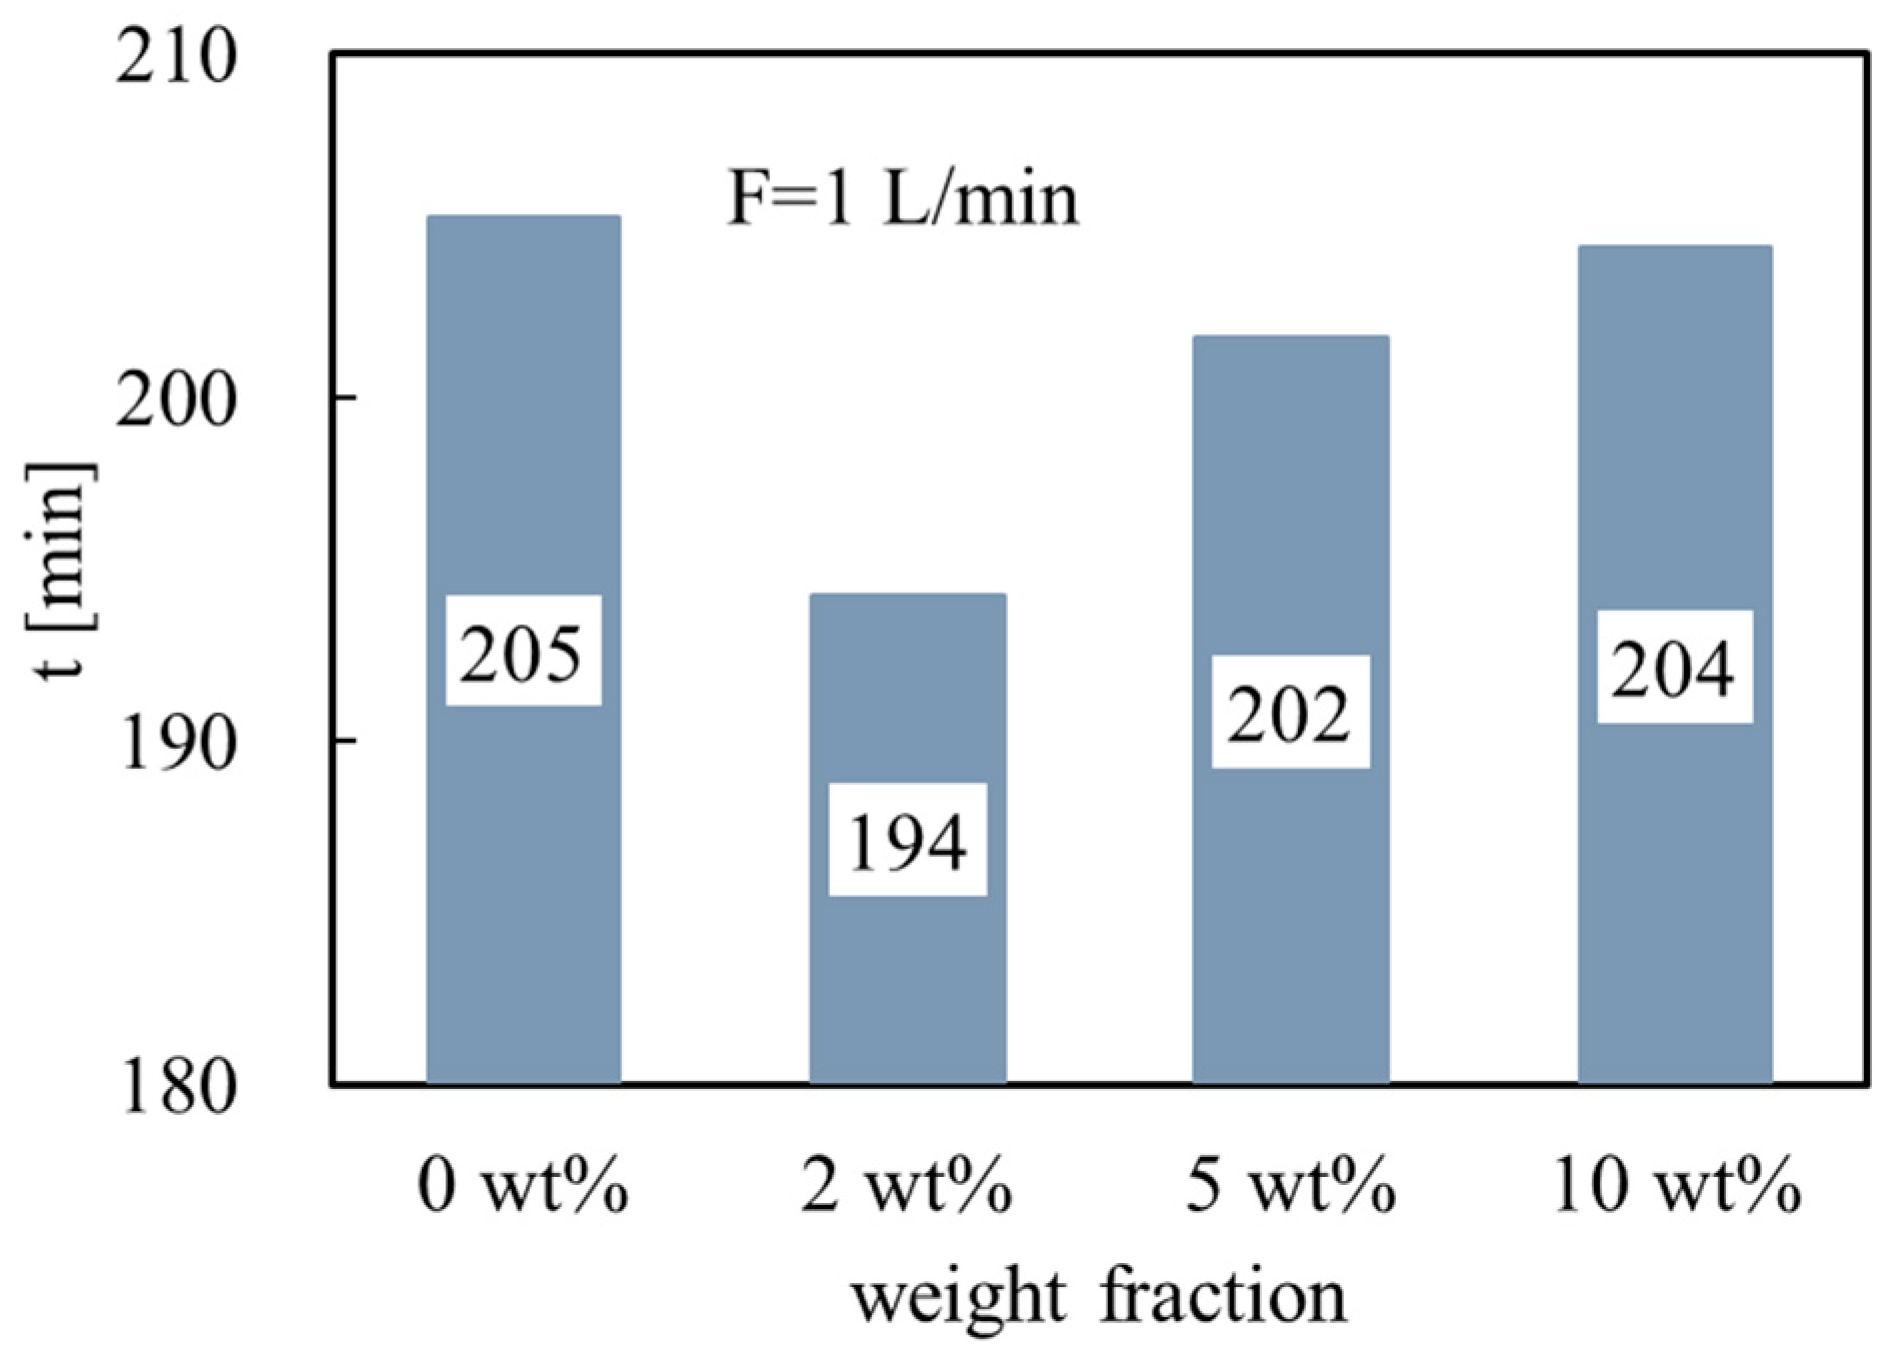
The relationship between weight fraction and total heat-storing time is illustrated in
Figure 9. For a fixed solar irradiation of 1000 W/m
2 and SC area of 1 m
2, the pure silicone oil as the HTF requires a heat-storing time of 205 min. The shortest heat-storing time of 194 min is achieved using 2 wt% PCM fluid. As observed in this study, increasing the PCM content leads to an increase in the heat-storing time.


