Article

Enhancing the Performance of AnMBR Treating Municipal Wastewater at a High Organic Loading Rate with Iron Addition

Sanitary Engineering Laboratory, Department of Water Resources and Environmental Engineering, School of Civil Engineering, National Technical University of Athens, Iroon Polytechniou 9, Zografou, 157 80 Athens, Greece
*
Author to whom correspondence should be addressed.
Energies 2023, 16(7), 3069; https://doi.org/10.3390/en16073069
Submission received: 22 February 2023 / Revised: 20 March 2023 / Accepted: 24 March 2023 / Published: 28 March 2023
(This article belongs to the Section B: Energy and Environment)

Abstract

:
The performance of a laboratory-scale 40 L anaerobic membrane bioreactor (AnMBR) treating municipal wastewater with and without iron supplementation was evaluated at ambient temperatures at a hydraulic retention time (HRT) of 6 h and sludge retention time (SRT) of 50 days. The system exhibited satisfactory performance during the summer and winter periods with average COD removal efficiencies of 73 ± 4% and 60 ± 4%, respectively. Moreover, two different FeCl3 dosages were studied for optimizing operation in terms of organic load removal, phosphorus removal, biogas production, membrane fouling, and emerging contaminant removal. The addition of 25 mg FeCl3 L−1 improved the performance of the AnMBR. More specifically, average effluent COD concentrations without FeCl3 addition were 177 ± 21 mg/L, while after the addition of 25 mg FeCl3 L−1 and 30 mg FeCl3 L−1, COD decreased to 147 ± 8 mg/L and 149 ± 11 mg/L, respectively. Moreover, effluent TP decreased by 75% with the dosage of 25 mg FeCl3 L−1 and was almost completely removed with 30 mg FeCl3 L−1. The membrane performance was slightly improved by FeCl3 dosing while biogas production was not affected by iron addition. AnMBR appeared inadequate for the removal of almost all the selected micropollutants, and the effect of iron addition on micropollutant removal was very limited.

1. Introduction

In December 2015, the European Commission (EC) adopted its first Circular Economy Action Plan, updated again in March 2020, with a program of measures to help close the product life cycle through more recycling and reuse [1]. Recovering energy and water for reuse are important factors that can make water management an important part of the EU initiative mentioned above. The Circular Economy Action Plan is one of the key building blocks of the European Green Deal, which aims to put the EU on the path to a green transformation with the goal of becoming climate neutral by 2050 [2] The vision of “Zero Pollution for a Toxic-Free Environment” is to reduce pollution of air, water, and soil by 2050 to levels that are no longer considered harmful to health and natural ecosystems, thus creating a toxic-free environment.
In this context, wastewater treatment plants (WWTPs) play a key role, as they consume large amounts of energy and can discharge unwanted pollutants into water bodies if not properly treated. In Europe and in Greece, existing wastewater treatment plants are not sufficient to fully support the circular economy and the goals of the Green Deal.
More specifically, the total electricity consumption of wastewater treatment plants in Europe (only plants with at least 2000 population equivalents (PEs) were considered) was estimated at 24,747 GWh per year, which corresponds to about 0.8% of electricity consumption in the EU-28 [3]. Less than 1% of these plants are currently using technologies to recover resources from wastewater. In this context, wastewater treatment is considered a major energy consumer. Assuming that conventional activated sludge (CAS) treatment plants consume 0.47 kWh/m 3, the total annual energy consumption in the EU could reach 25 billion kWh [4]. In addition, WWTPs are widely recognized as a major source of greenhouse gas (GHG) emissions in the water industry [5]. Reported values of GHG emissions from conventional activated sludge treatment plants with nutrient removal range from 0.9 to 2.2 kgCO2e/m3 [6]. Furthermore, 16 Scandinavian WWTPs report annual GHG emissions in the range of 7–108 kgCO2e/PE [7]. Reducing GHG emissions in a cost-effective way without deteriorating wastewater quality therefore seems to be a major challenge for WWTP operators.
The average annual specific energy consumption in Greek WWTPs is about 38 kWh/PE and ranges from 15 to 86 kWh/PE. Accordingly, the average annual GHG emissions in Greek WWTPs are in the order of 94 kCO2e/PE, ranging from 61 to 161 kgCO2e/PE [8,9]. Energy consumption for aeration accounts for 40–70% of the total energy consumption of a WWTP. Another key issue is the depletion of natural water resources due to climate change and the increasing demand for water due to population growth and urbanization. Wastewater reuse is a driving force for a circular economy that minimizes waste generation, promotes sustainable lifestyles, conserves freshwater sources, and mitigates climate impacts.
Taking all this into consideration, interest in anaerobic membrane bioreactors (AnMBRs) is progressively increasing, due to their higher potential regarding energy production, resource recovery, and circular economy. This is also reflected in the fact that AnMBRs are part of the EU Innovation Deal, which envisages sustainable wastewater treatment with a combination of anaerobic membrane technology and water reuse. The innovation deal aims to shift from the conventional treatment of municipal wastewater to its use as a water resource. Anaerobic treatment enables energy recovery by converting the organic carbon into methane biogas, thus providing a pathway to energy neutrality [10]. Studies have determined that the potential energy content of wastewater is 9 times higher than the electricity consumed to run the treatment plant [11]. Applying this technology to wastewater treatment seems to be a very good solution and would contribute significantly to reducing the energy footprint while providing very good quality treated wastewater that could also be appropriate for irrigation.
The major drawback of the anaerobic wastewater treatment is the low growth rate of the anaerobic bacteria, resulting in a relatively long HRT and, as a result, a large reactor volume. One of the main benefits of AnMBR technology is that it retains all biomass, resulting in greater mixed liquor suspended solid concentrations in comparison to conventional activated sludge systems, while also yielding very low effluent suspended solid concentrations. This unique feature allows for longer solid retention times (SRTs) and a corresponding reduction in hydraulic retention time (HRT). Studies have shown that AnMBR systems can achieve SRTs ranging from 150 days to over 200 days [12], and the production of sludge is up to 20 times lower than that in aerobic processes [13]. This not only lowers operational and maintenance costs, but also has a positive impact on the environment by reducing waste production. Therefore, AnMBRs enable performance enhancement in terms of biogas production and organic reduction via retaining the slow-growing methanogens and filtering out methane fermentation inhibitors (such as ammonia), thus achieving better process stability and largely reduced reactor volumes.
Τhe AnMBR technology was first applied in 1978, and in the last few decades, the research and application of this technology have increased significantly [14]. For example, in the last three years, more than 250 articles have been published on AnMBR, compared to less than 10 in 2010. To the best of our knowledge, the impact of novel antifouling membranes, membrane materials, and advanced AnMBR configurations on energy demand and production is significant and has not yet been investigated. Furthermore, the way to calculate and control energy consumption in AnMBRs (via membrane fouling and operating conditions) has not been investigated in recent years. In addition to these limitations, the wide application and optimized sustainability of the AnMBR system are also still unexplored.
A very important problem to consider in connection with AnMBRs is membrane fouling. The shorter the hydraulic residence time and the lower the operating temperature, the more likely fouling is to occur. Generally, fouling occurs due to the adsorption of inorganic precipitates and organic matter and the attachment of biological colloidal particles to the membrane surface [15,16]. As mentioned earlier, membrane fouling tends to be more severe when high solid content, higher OLRs, and lower temperatures occur [17,18]. Due to the higher viscosity of water, membrane permeability decreases with decreasing temperature. There are studies reporting that membrane fouling worsens at lower temperatures due to changes in sludge properties [19,20]. Therefore, the cost-effective control of fouling with lower maintenance and impact on the biological unit is still an important research topic that is being pursued by optimizing operating conditions, developing novel bioreactor configurations, and exploring different cleaning strategies. Several studies have demonstrated that the addition of FeCl3 can effectively reduce membrane fouling in bench-scale aerobic MBR systems (Koseoglu et al., 2008; Ji et al., 2010; Fan et al., 2007; Song et al., 2008; Zhang et al., 2008). The mechanism underlying this phenomenon is associated with the promotion of larger particle sizes and decreased levels of soluble microbial products (SMPs) and colloidal materials. However, there is a lack of information in the existing literature regarding the influence of FeCl3 on membrane performance in continuously operated AnMBRs.
In terms of safe water reuse or disposal to recipient water bodies, the presence of micropollutants or contaminants of emerging concern (CECs) is another important issue to take into consideration. These refractory contaminants show pseudo-persistence due to their continuous discharge into the environment, leading also to bioaccumulation and rising potential toxicity issues for both aquatic organisms and humans [21]. Landfill leachates, agricultural runoff, and domestic, hospital, and industrial wastewater are their main sources for entering the environment [21]. Conventional wastewater treatment processes are ineffective in eliminating these recalcitrant compounds, contributing to a major extent to their occurrence in the wastewater effluent receptors. Hence, different kinds of technologies, including adsorption on innovative materials, membrane and filtration, chemical and electrochemical methods, biological treatment [22], and combinations are being investigated nowadays for the removal of CECs from wastewater. Although the elimination of these trace organics has been investigated through MBR treatment showing promising results [23,24,25,26,27,28,29], studies related to AnMBR treatment, especially for real wastewater, are limited [30,31,32,33,34].
Endocrine-disrupting chemicals (EDCs) and pharmaceuticals or pharmaceutically active compounds (PhACs) are two main groups of CECs. EDCs, which are chemicals that can mimic natural hormones and interfere with the endocrine system, may cause tumors, developmental disorders, and sexual and reproductive issues both in wildlife and humans [35]. PhACs, which mainly include hormones, antibiotics, antifungal agents, antidepressants, antiepileptics, analgesics, and nonsteroidal anti-inflammatory drugs (NSAIDs), enter the WWTP either as metabolized or as parent compounds after consumption and excretion in urine and feces [36]. NSAIDs are the most frequently quantified medicine category since they are widely used to treat pain, fever, and inflammation, including both prescribed and nonprescribed drugs [37], and their consumption increased more during the COVID-19 pandemic [38]. Their toxic effects on nontarget aquatic organisms are of great importance and include bioaccumulation, oxidative stress, and reproductive and genetic disruptions which in the long term may lead to the degeneration of populations [38,39].
The current study investigates the performance and optimization of a laboratory-scale AnMBR operating at 6 h HRT at ambient temperatures treating low-strength municipal wastewater with the addition of FeCl3 to control membrane fouling and achieve phosphorus removal. AnMBR treatment efficiency was evaluated according to overall AnMBR removal rates, biogas production, removal of pollutants such as COD, total suspended solids (TSS), removal of nutrients, and removal of selected organic micropollutants from the NSAID and EDC groups. It is expected that the results of this study will provide a sound understanding of AnMBR operation at short HRTs and facilitate the application of AnMBRs for the treatment of low-strength wastewater.

2. Materials and Methods

2.1. Wastewater Characteristics

For this study, a laboratory-scale AnMBR, fed with screened municipal wastewater from the Metamorfosis WWTP (Athens, Greece), operated at the R&D department of Athens Water Supply and Sewerage Company (EYDAP S.A.) for more than two years. The physicochemical characteristics of the screened municipal wastewater are presented in Table 1.

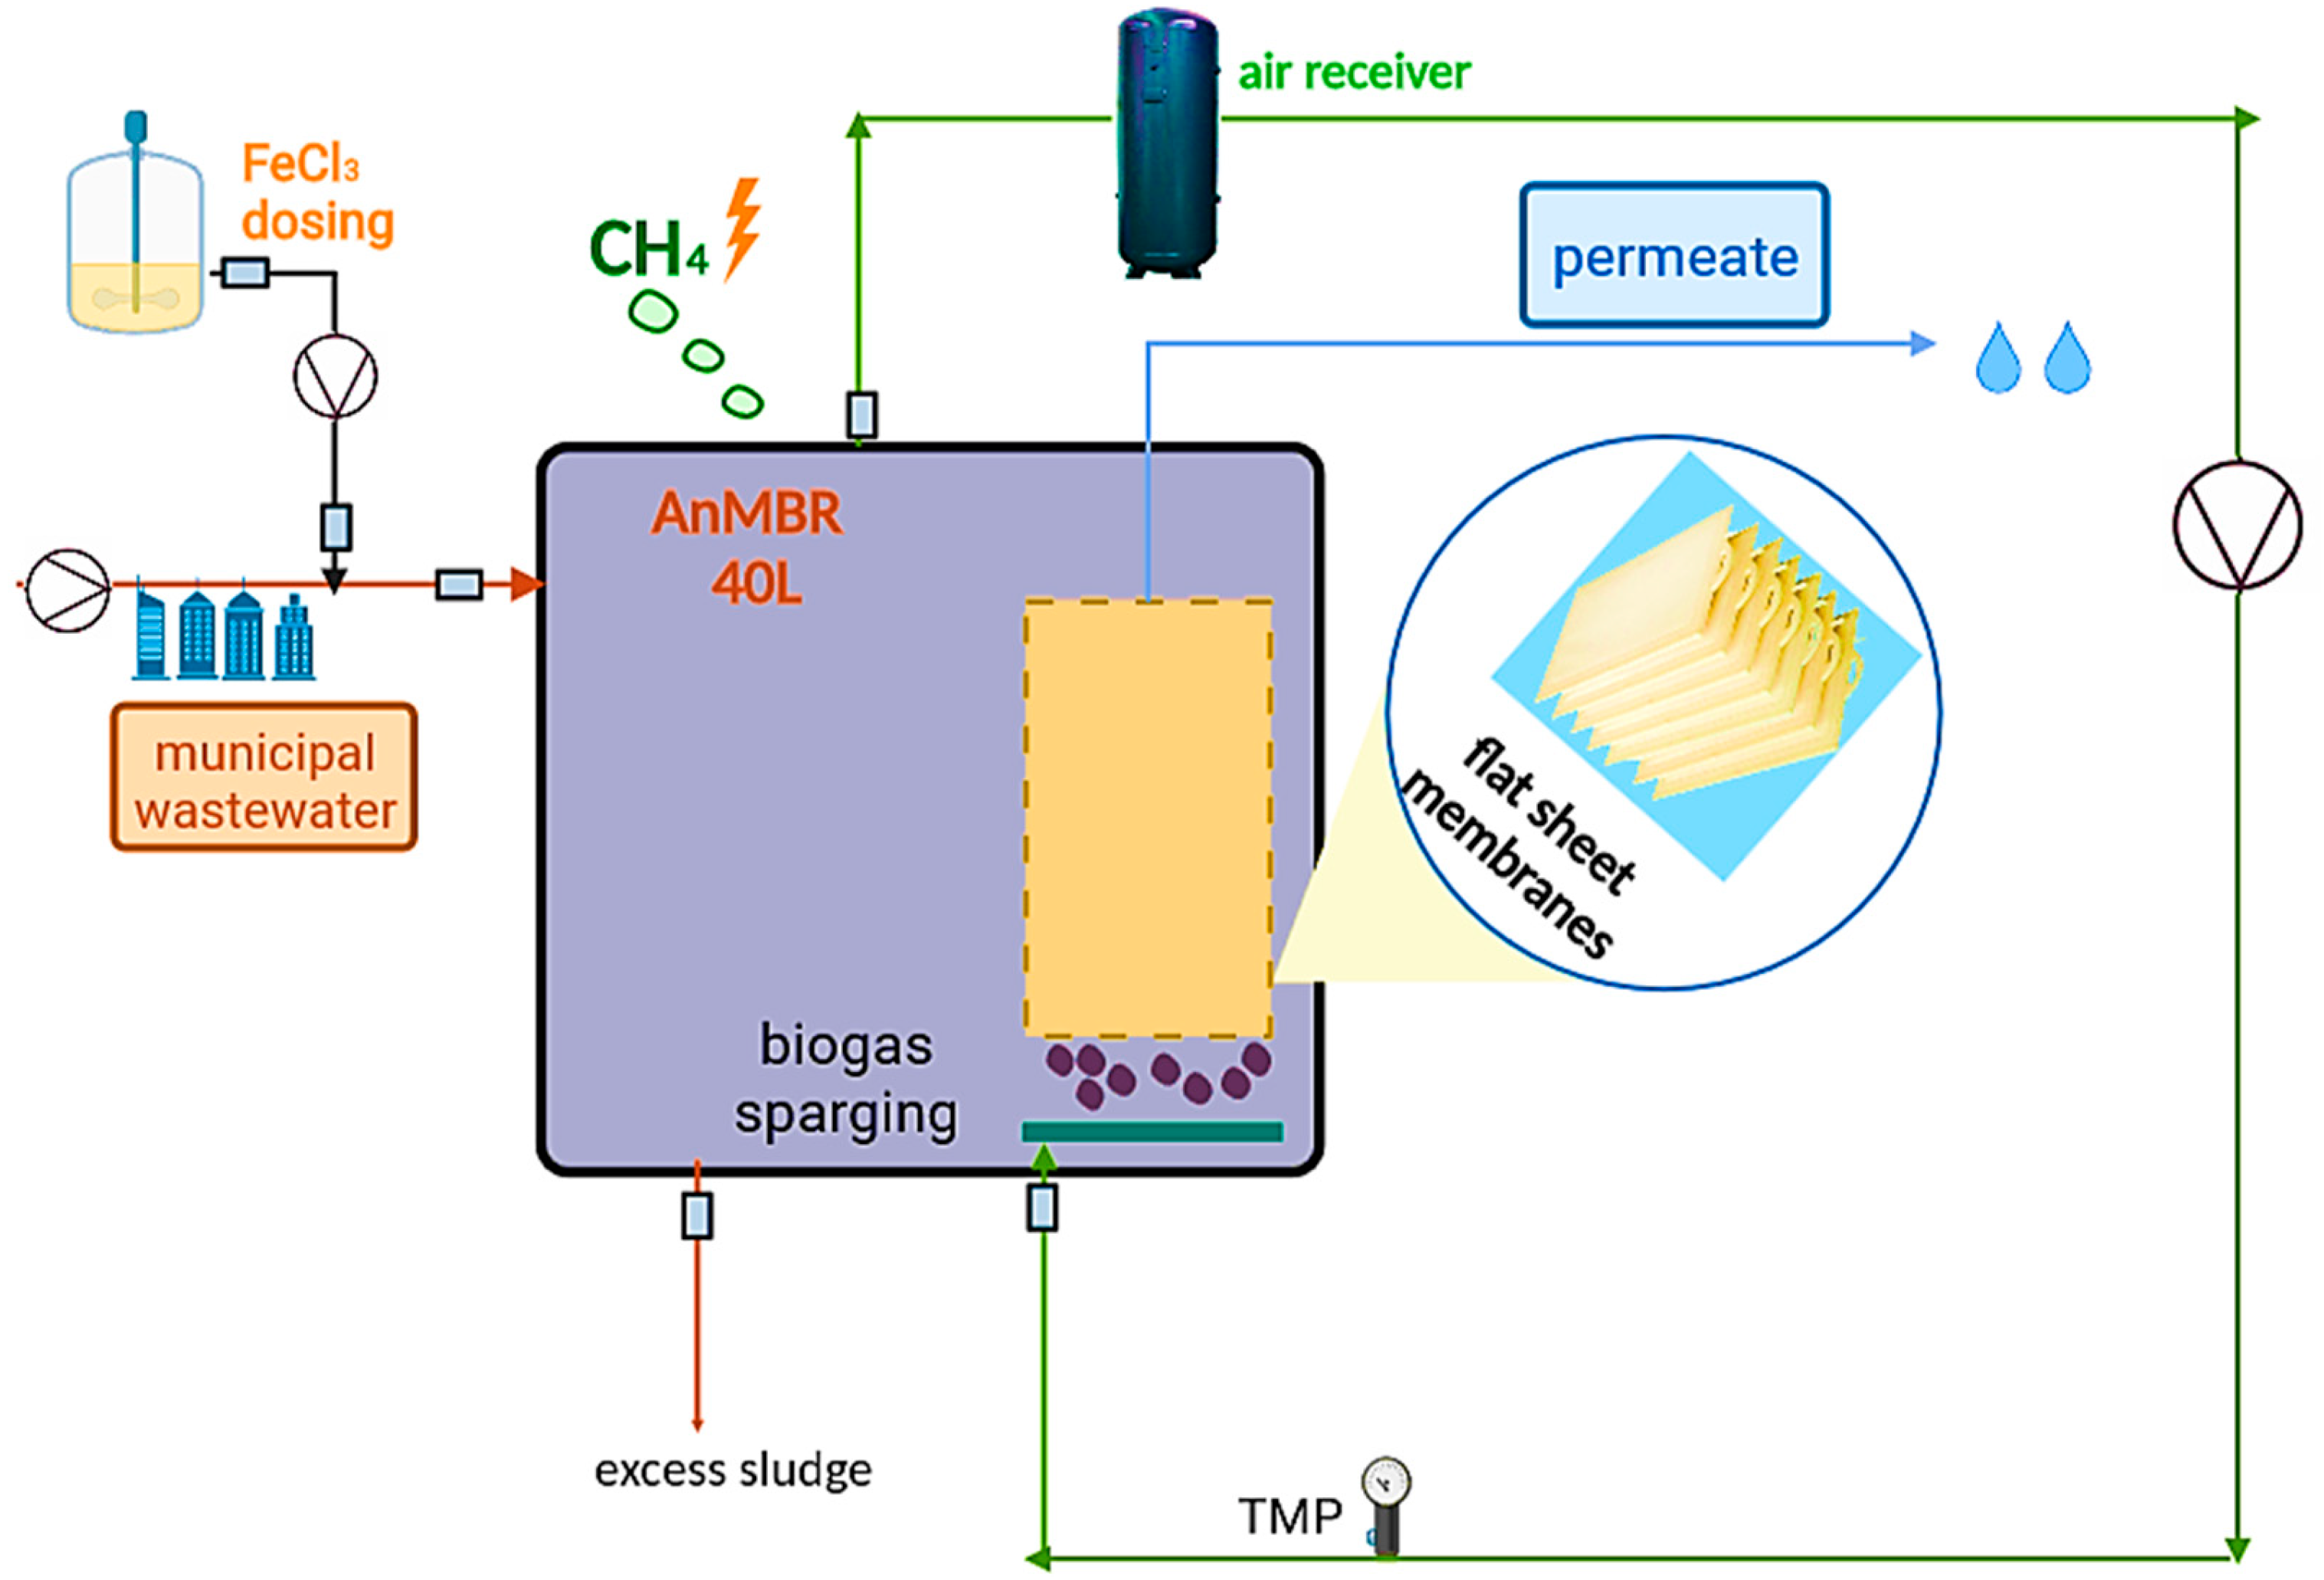
2.2. AnMBR Setup and Operation

Throughout the study, the reactor HRT and SRT were maintained at 6 h and 50 days, respectively, while the membrane flux was maintained at 13 L/m2/h (LMH) with a peristaltic pump. The temperature of the reactor was constantly measured through a temperature sensor installed in the reactor and varied from 15 to 25 °C. All the operating parameters are summarized in Table 2.
The laboratory-scale AnMBR consisted of a fully mixed 40 L reactor equipped with a flat membrane module made of polyvinylidene fluoride (PVDF) with a surface area of 0.5 m2 and a pore size of <0.1 μm (SINAP 10) (Table 3). The biogas produced in the anaerobic reactor was collected and measured in a 40-liter tank consisting of four inverted cylinders housed in tanks of acidified water. Moreover, temperature, redox, and transmembrane pressure (TMP) sensors were installed for the control of the anaerobic processes.
An operating cycle of the AnMBR consisted of an 8 min filtration and a 2 min relaxation mode to maintain membrane permeability. The membranes were cleaned to reduce membrane fouling with biogas via a biogas pump that recycled the biogas at a flow rate of 0.36 m3 air/m2 membrane/h. The unit was chemically cleaned with sodium hypochlorite. The schematic diagram of the experimental unit is shown in Figure 1.
The study was carried out in four phases that each had a duration of 60 days. Chemical cleaning of the membranes took place at the beginning of each phase. During phases 1 and 2, which covered a winter and a summer period with working temperatures 18 ± 3 °C and 23 ± 2 °C, respectively, the AnMBR operated on screened municipal wastewater. During phases 3 and 4 which both covered winter periods, the AnMBR operated on municipal wastewater supplemented with 25 and 30 mg FeCl3 L−1, respectively, to control membrane fouling and achieve phosphorus removal. The doses of iron used in this study were selected based on literature in order to achieve 50–100% phosphorus removal. According to [40], approximately 2.5 g of iron is needed to remove 1 g of phosphorus. Therefore, taking into account that chemical P removal amounted to approximately 4 mg/L, ferric and FeCl3 additions were in the 8–10 mg/L and 15–30 mg/L ranges, respectively.
The positive effect of low pH on coagulation and COD removal is well documented in the literature ([41,42]). However, because it was observed that due to iron addition the pH level dropped below 7 at the iron dosage of 30, we decided not to increase FeCl3 dose any further in order to avoid any potential inhibition of biological activities and especially methanogenesis [43].
The pressures of the headspace in the membrane tank and in the permeate line were recorded with manometers. The transmembrane pressure (TMP) was calculated as the difference between the pressure in the membrane tank and the pressure in the permeate line. Chemical cleaning commenced every time the TMP reached 300 mbar.

2.3. Analytical Procedures

Samples of the screened wastewater influent, permeate, and mixed liquor/excess sludge were collected three times a week from permeate pumping and from the reservoir. Chemical analyses of the conventional parameters total suspended solids (TSSs), volatile suspended solids (VSSs), and chemical oxygen demand (COD) were carried out three times a week, while analyses of total nitrogen and total phosphorus were carried out once a week. All analyses were according to Standard Methods [44]. Biogas production, reactor temperature, ambient temperature, pH, redox, TMP, and effluent flow were monitored daily.
To measure the biogas production rates, the water displacement method was employed. Gas samples were extracted from the reservoir using a gasbag with a volume of 200 mL. The captured gas was then transferred into a gas-tight syringe for analysis. The concentration of methane in the gas samples was measured using a Perkin-Elmer Autosystem XL gas chromatographer equipped with a PLOT column GS-GasPro (30 m in length and 0.32 mm in diameter, J&W, Folsom, CA, USA) and a flame ionization detector (FID). A volume of 50 μL of sample headspace was injected using a gas-tight syringe (100 μL). The analysis was conducted isothermally at 50 °C, while the injector and detector were maintained at 220 °C and 250 °C, respectively. To prepare standards, a known amount was added to 160 mL serum bottles, which had the same headspace-to-liquid ratio as the reactor (6:10). The methane detection limit was found to be 2 μg/L. Biogas was converted to STP based on the International Union of Pure and Applied Chemistry (IUPAC) 0 °C (273.15 K) and 1 atm (101.325 kPa) [45].
Dissolved methane concentration was determined in permeate samples collected in 120 mL serum vials. The vials were closed with butyl rubber septa and sealed with aluminum caps to prevent gas leakage. The vial was shaken for 3 h to achieve equilibrium between liquid and gaseous phases. The headspace gas sample was collected using a gas-tight syringe, and the methane was measured as described above. Dissolved methane concentration was calculated based on Henry’s law.
The measurements of VFAs (acetic acid, propionic acid, isobutyric acid, and butyric acid) were performed with a GC/FID from Perkin Elmer on a Nukol column. Analyses were performed using an isothermal method (160 °C) while the injector and detector were maintained at 220 °C and 250 °C, respectively.
Ibuprofen (IBU), naproxen (NPX), diclofenac (DCF), and ketoprofen (KFN) are the NSAIDs investigated and more frequently detected in the literature among some others, so they were selected as representatives from the NSAID category. Bisphenol A (BPA), nonylphenol (NP), and triclosan (TCS) were selected as the representative compounds from the EDC group. BPA is one of the most frequently detected endocrine-disrupting phenols in soil, surface water, and groundwater because of its release during the manufacture of plastics/resins [46,47]. NP is mainly used as an intermediate in the chemical manufacturing industry to produce NP polyethoxylates (NPnEO) which are used as emulsifiers and dispersing, wetting, and foaming agents [48], while their partial biodegradation is the primary source of NP in the environment [49]. TCS is a highly used antiseptic agent due to its antimicrobial action. The main physicochemical properties and the chemical structure of the target compounds which are important influencing factors for the fate of these substances during the AnMBR treatment are presented in Table 4.
The quality and quantity analysis of micropollutants was based on the method developed in [53]. According to this method, filtration of samples was carried out, and then samples were acidified (pH = 2.5) to prevent any biological interaction. The addition of the surrogates took place using deuterated bisphenol A (BPA-d16) for EDCs and meclofenamic acid sodium salt (MCF) for NSAIDs. Afterward, solid-phase extraction was performed, producing a 6 mL elution of ethyl acetate (ETH), and then each sample’s elution was evaporated to dryness under N2 purging. The derivatization step was achieved with the use of 10 μL pyridine and 50 μL bis(trimethylsilyl)trifluoroacetamide (BSTFA) + 1% trimethylchlorosilane (TMCS) and a bathing device at 70 °C for 20 min. The last step was the manual injection (1 μL) of each sample into the gas chromatograph (GC)–mass selective detector (MSD) with an analysis time of approximately 18 min. A 7890A GC and 5975C MSD accompanied by the software ChemStation by Agilent Technologies were used.

3. Results and Discussion

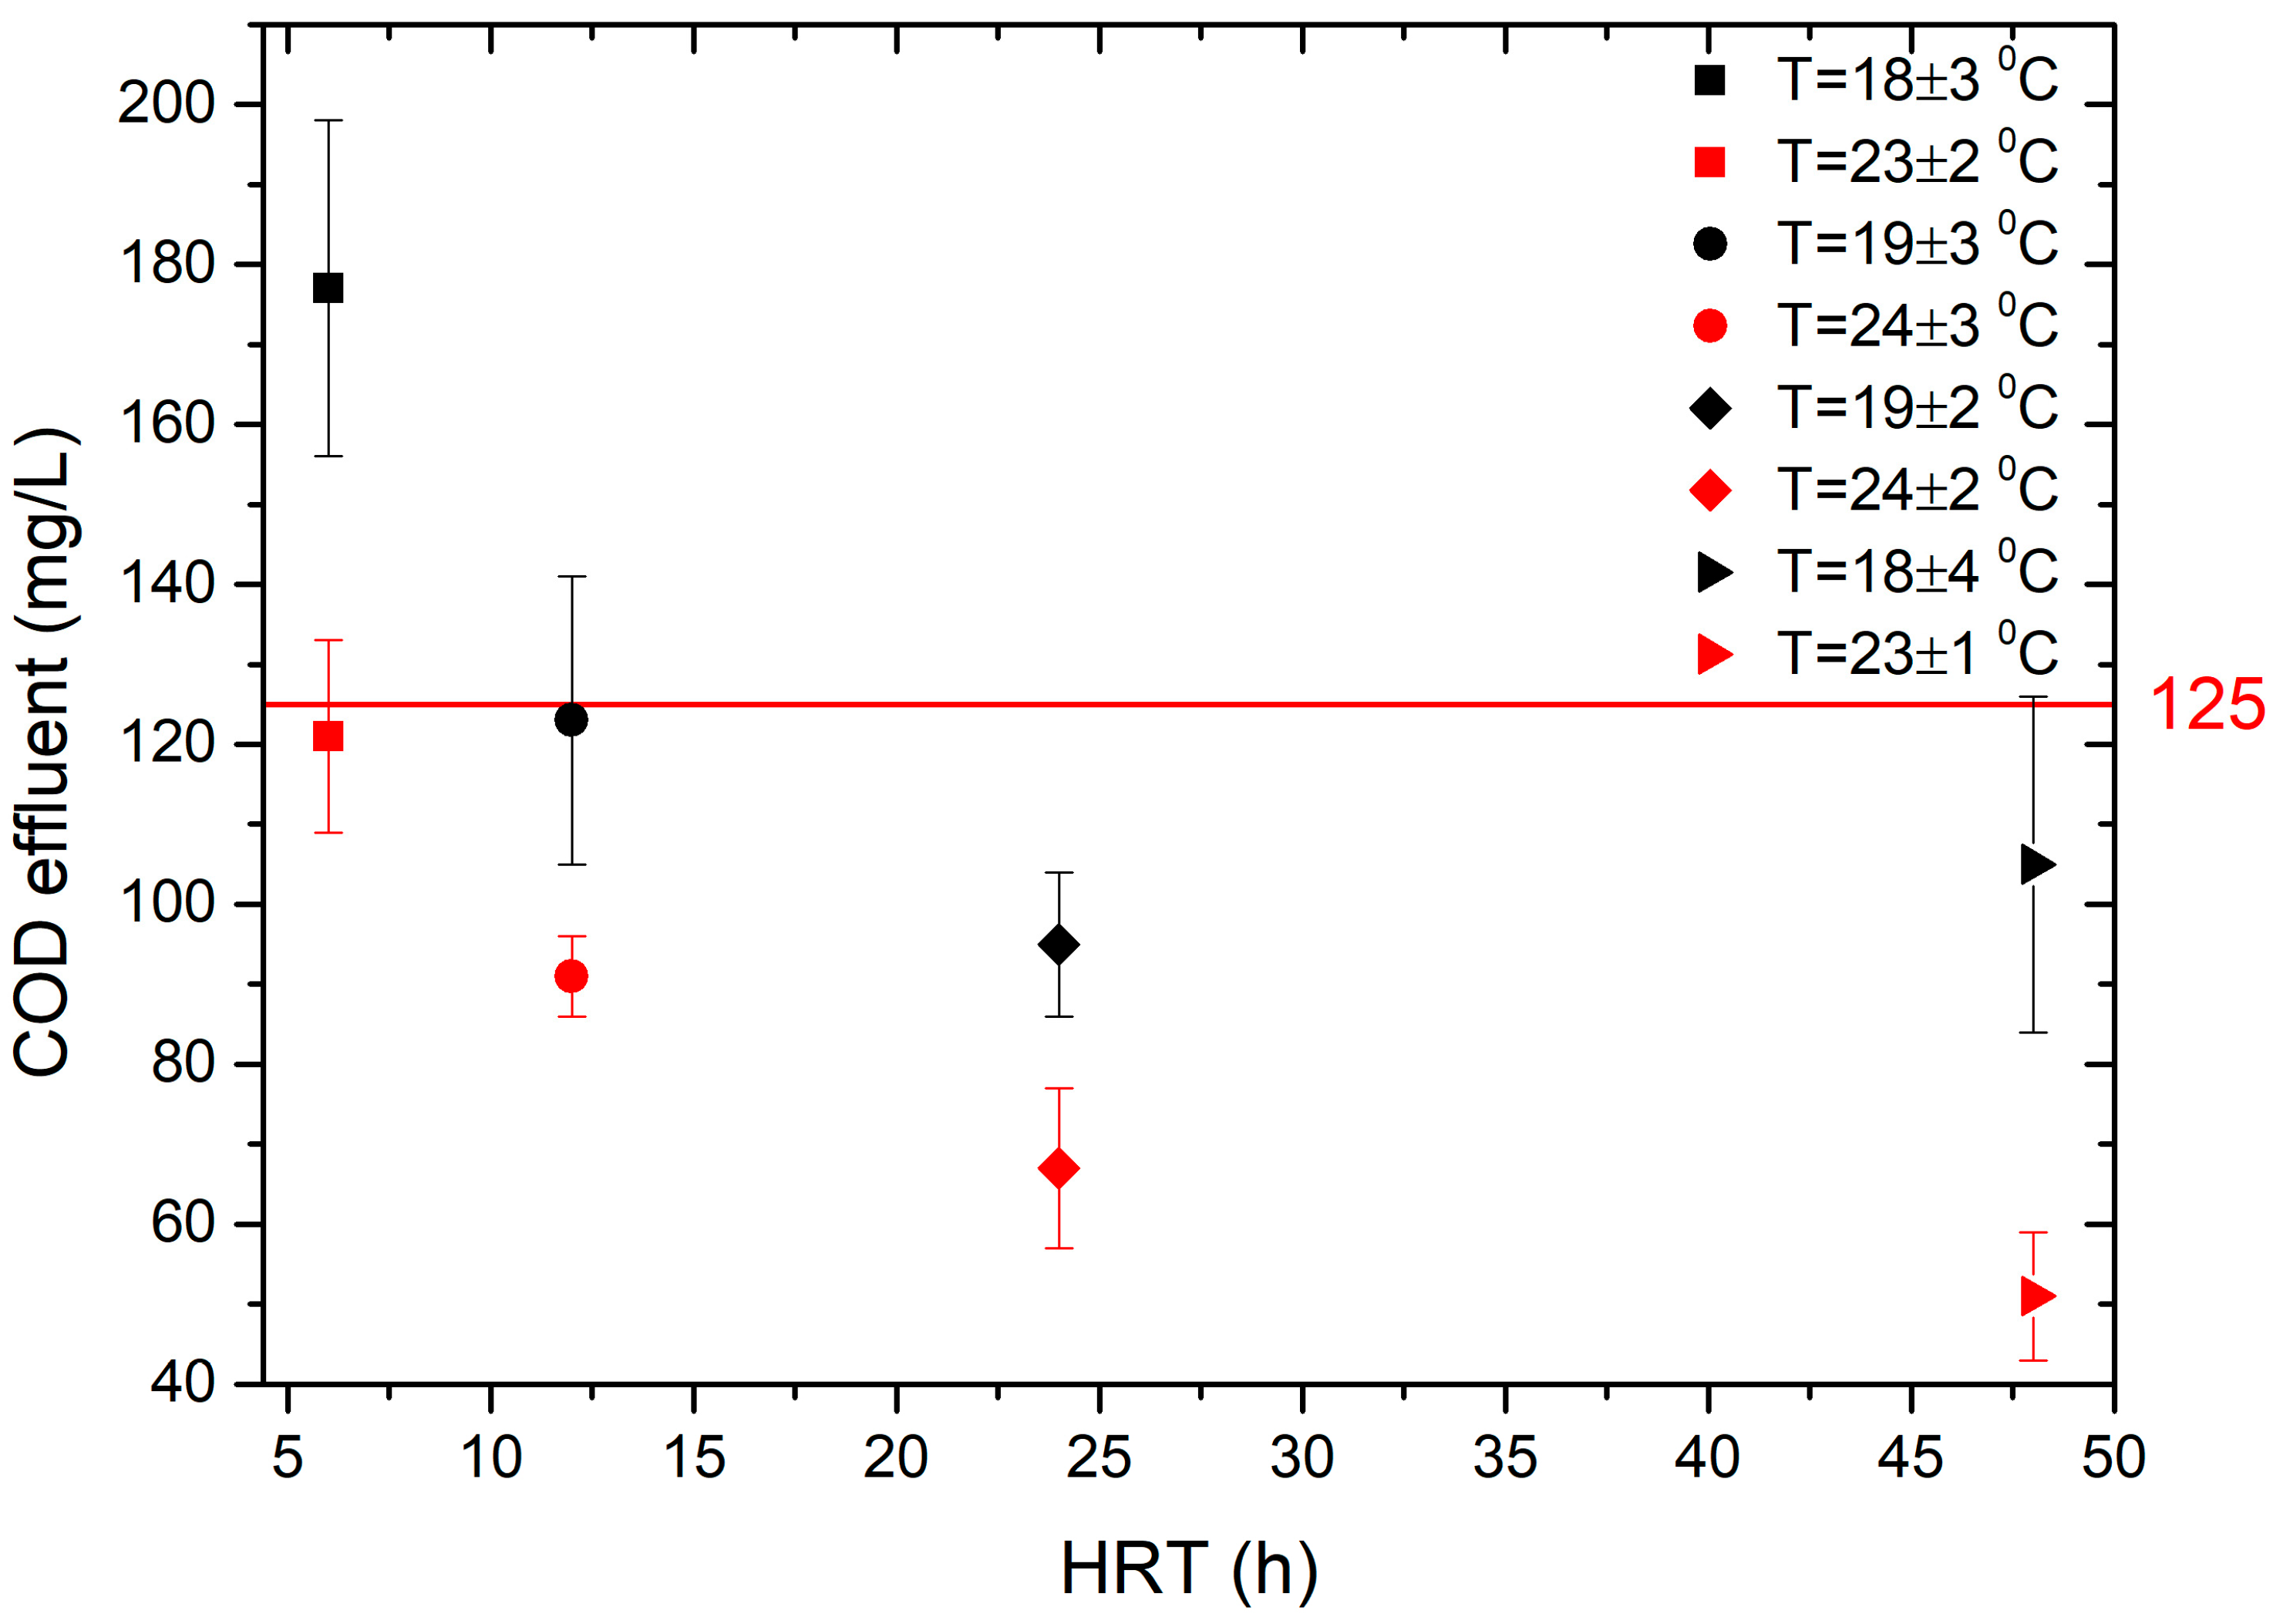
3.1. Previous Results at Different HRTs Studied

Prior to the present study, the experimental system was evaluated at HRTs between 0.5 and 2 days with no iron addition, at ambient conditions, with very encouraging results [54]. More specifically, it operated for 2 days, 1 day, and 12 h during both winter and summer temperatures. The summer period showed results that were within the limits set by the UWWTD for all HRTs studied. However, when the HRT was reduced to 12 h during the winter period, the effluent COD exceeded 125 mg/L. In addition, membrane fouling was more pronounced during the winter period at all HRTs and increased with decreasing HRT. Therefore, in the experiments with Fe3+ addition at 6 h HRT, AnMBR performance was evaluated according to the following: (i) compliance with effluent COD limit set by the UWWTD (125 mg/L COD), (ii) phosphorus removal and membrane biofouling control, (iii) biogas production, and (iv) micropollutant removal.

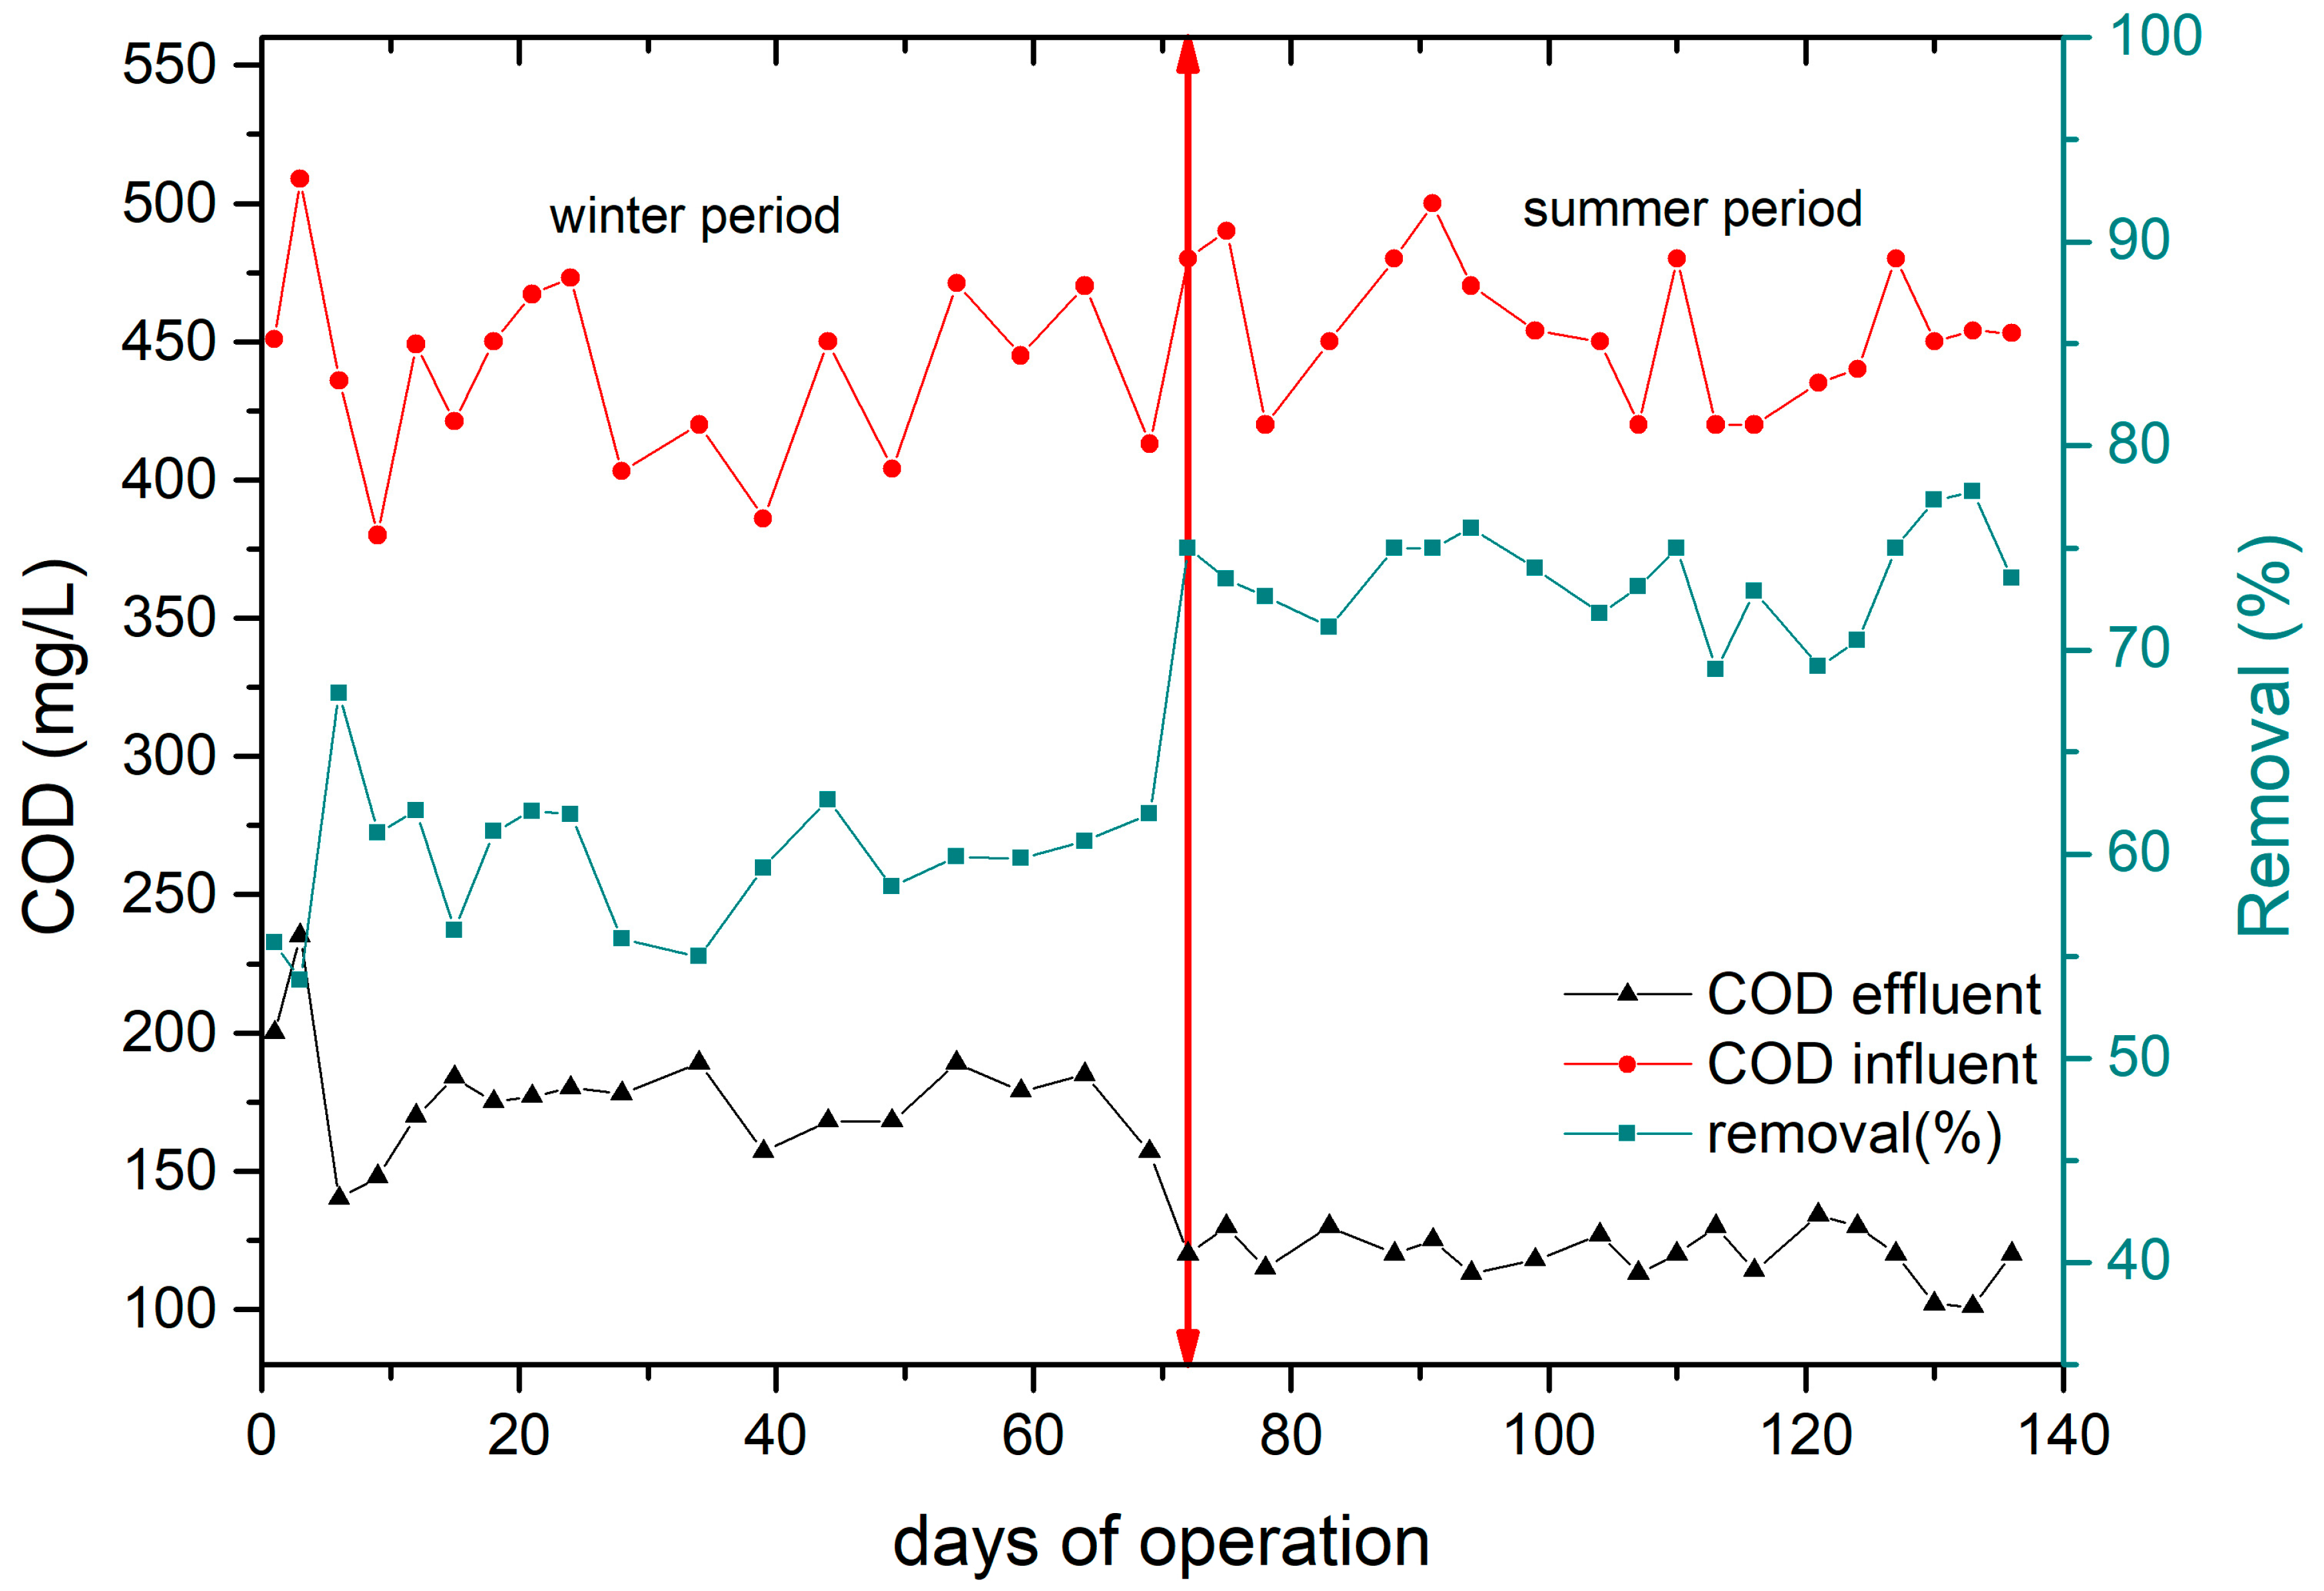
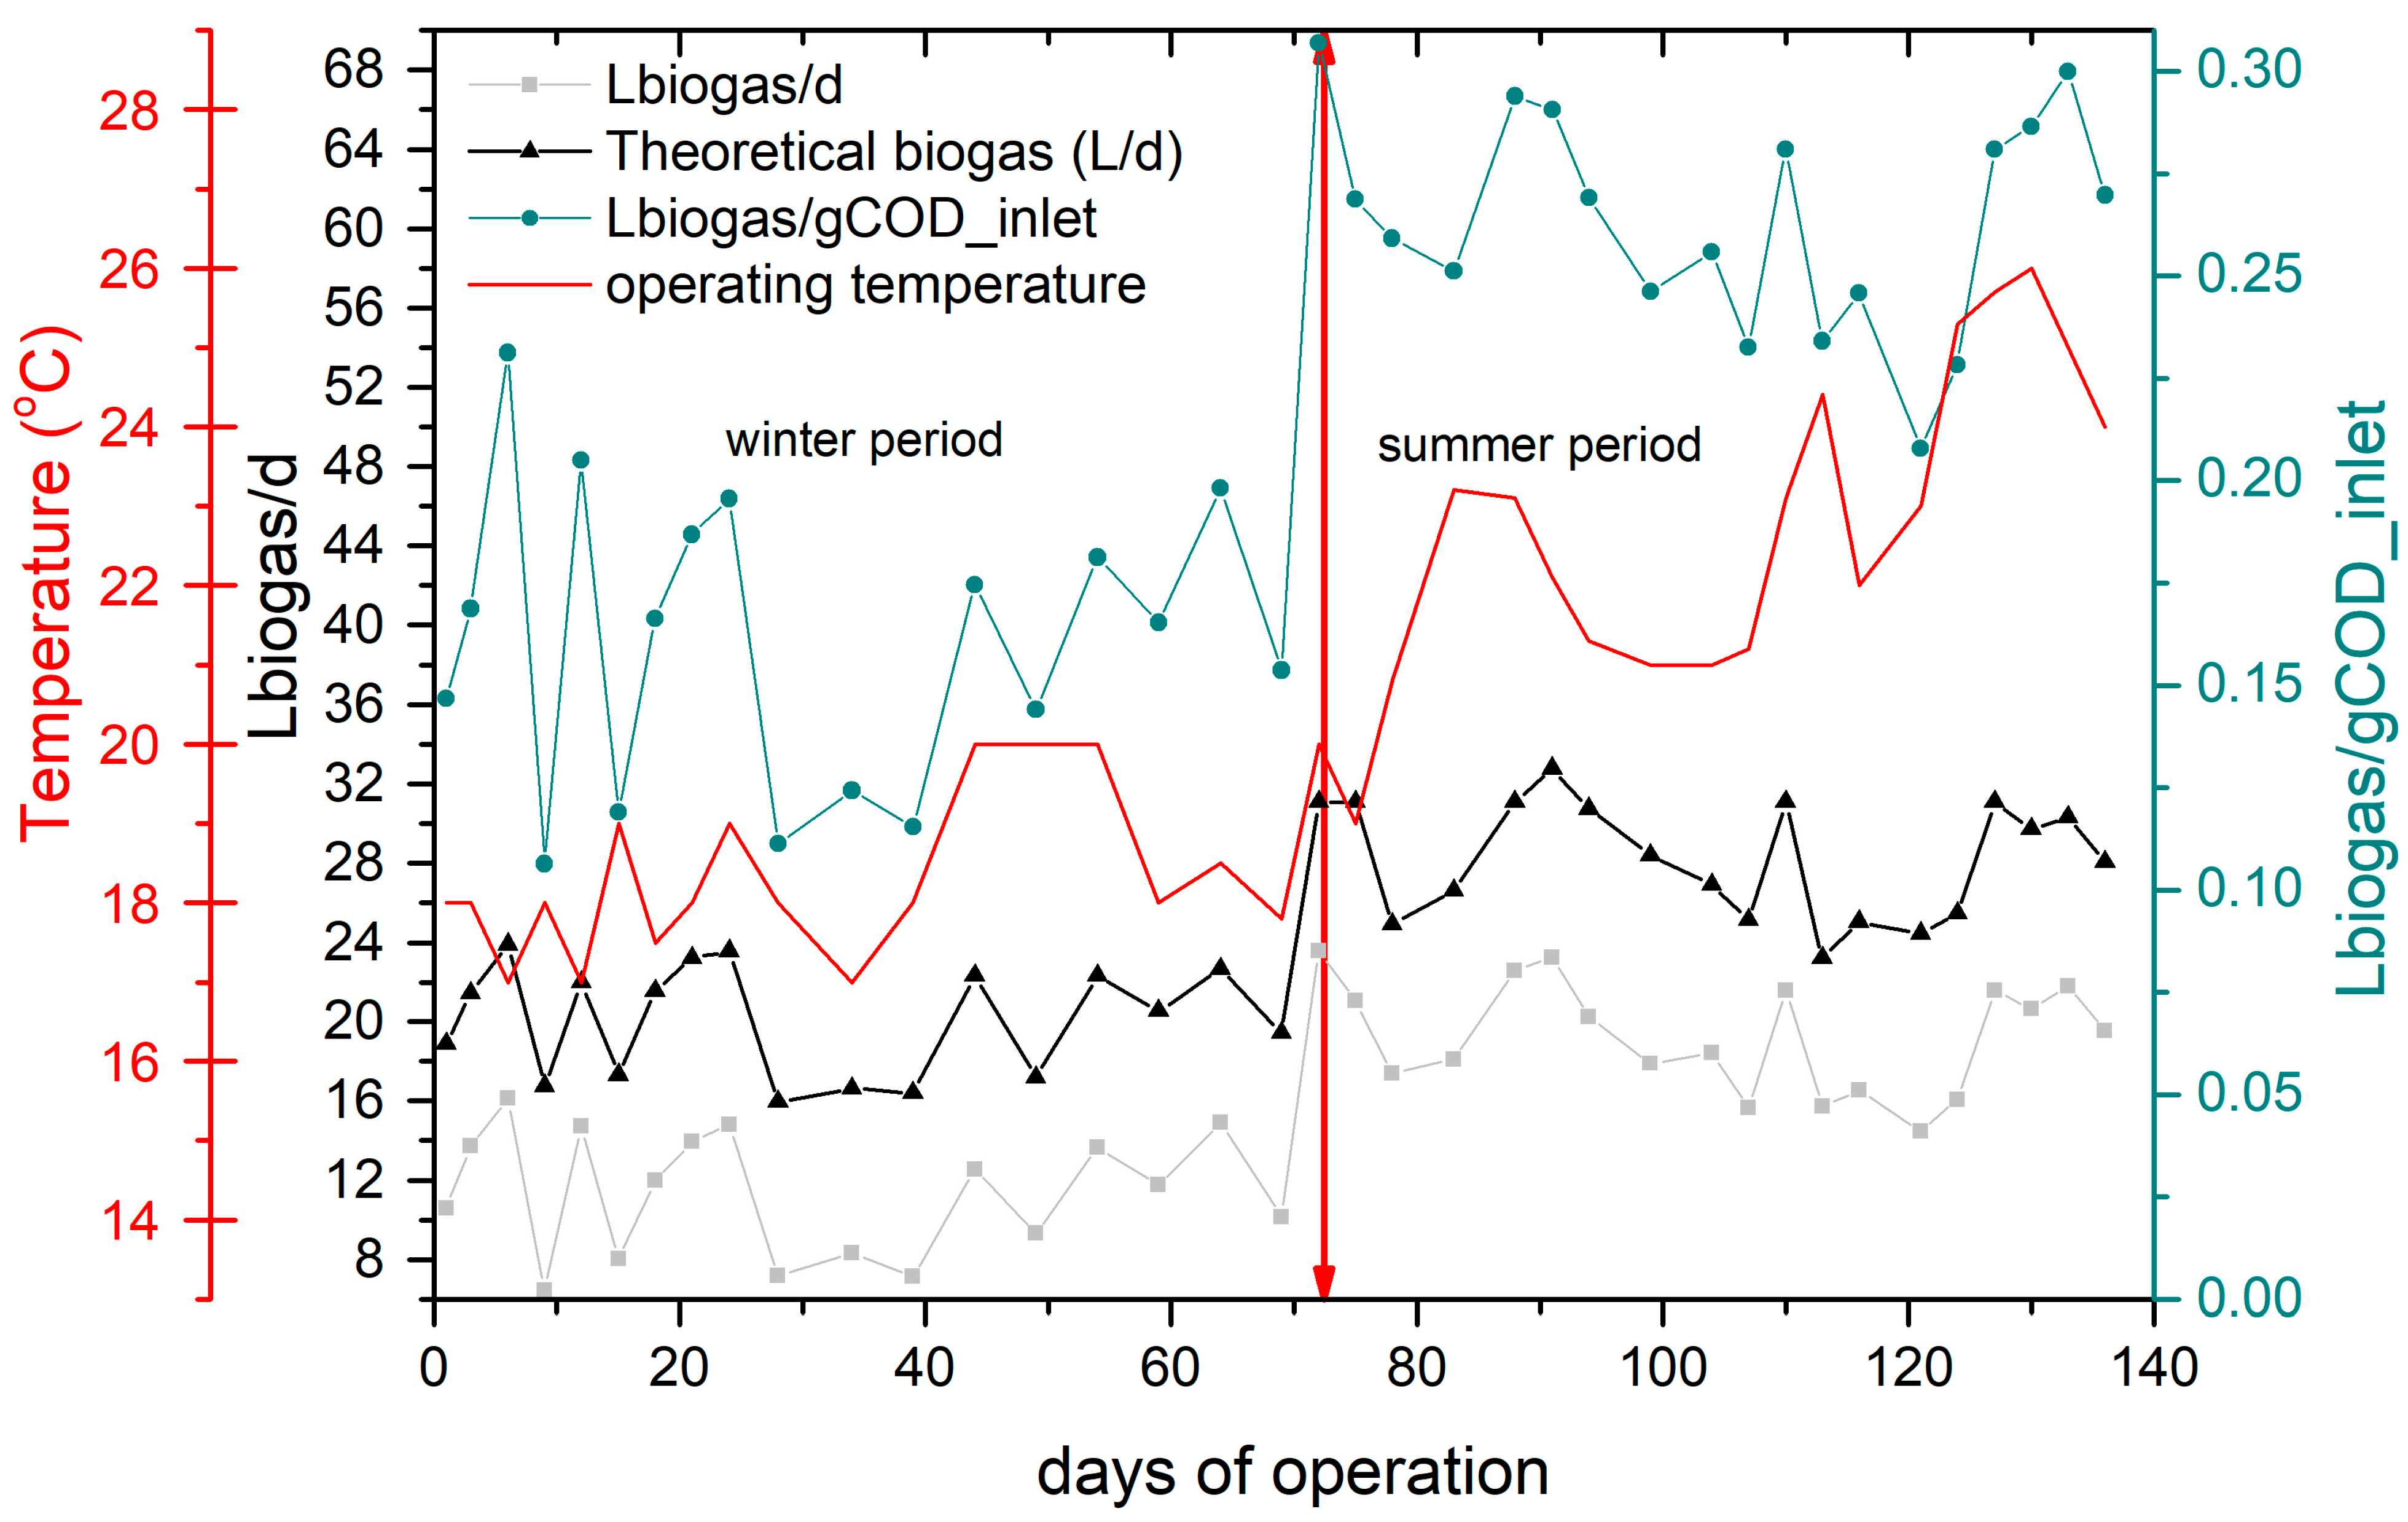
3.2. AnMBR Overall Performance at 6 h HRT without Iron Addition

AnMBR performance was assessed at an HRT of 6 h, with no iron addition, in terms of effluent quality, membrane fouling, and biogas production. The mean (±SD) concentrations of COD, VFAs, biogas production, TΝ, and TP in the untreated and treated effluent and removal efficiencies for the winter and summer periods are illustrated in Table 5. Theoretical biogas values were calculated assuming 0.5 to 0.7 L of biogas generated per kg of COD removed due to methanogenesis [55]. In addition, COD of influent, permeate and removal rates are shown in Figure 2.
As shown in Table 4, average operating reactor temperatures were 18 ± 3 °C and 23 ± 2 °C during the winter and summer periods, respectively. During the winter period, AnMBR permeate had an average COD value of 177 ± 21 mg L−1 and a percentage removal of 60 ± 4%. Thus, at winter temperatures, the AnMBR could not meet the UWWTD requirements for secondary treatment. During summer conditions, effluent COD had an average value of 121 ± 12 mg L−1 and a COD removal of 73 ± 4%, thus being just within the UWWTD limits. To compare these results with the available literature, we reviewed similar studies employing AnMBRs treating real and synthetic municipal wastewater [56,57,58,59]. According to our review, very few studies were conducted at psychrophilic temperatures. A study that treated domestic wastewater operating at a similar HRT but lower flux showed a maximum COD removal of 87% at 25 °C. In our study, the maximum COD removal reached 77% at a lower average temperature of 22 °C (±2). Another study conducted with synthetic municipal wastewater, at the same flow and HRT (13 L/m2/h and 6 h respectively) and the average temperature of 25 °C, but with an external tubular membrane, showed a maximum COD removal of 90% [60].
TN and TP effluent concentration values remained the same during both operating periods. Practically very limited nutrient removal was obtained only due to sludge yield. As expected during the anaerobic process, nutrient removal is limited to biomass growth and cannot meet any nutrient removal requirements [61].
Biogas production, as well as L biogas produced/COD inlet for winter and summer periods, is presented in Figure 3. Average biogas production, expressed in L/day, increased during the summer period and reached an average value of 0.47 L/g COD removed, while biogas production decreased to 0.39 L biogas/g COD removed during the winter period. Similarly, [62] reported a biogas production in the 0.42–0.48 L biogas/g COD removed range.
Biogas production was quite satisfactory with an average of 11.4 ± 3.1 L biogas/day in winter and 18.8 ± 3 L biogas/day in summer. Methane biogas content was 69% in winter and 71% in summer. Theoretical biogas production values calculated assuming 0.6 L of biogas generated per kg of COD removed [55] are shown in Table 4. The difference observed between operational data and theoretical biogas production values is attributed to dissolved methane lost in the effluent. Indicative experimental results showed that the effluent dissolved methane concentrations were high, close to the saturation concentrations. Specifically, in this study, the values of dissolved methane lost in the effluent as a percentage of the total methane produced were 20.6% and 43.8% in the summer and winter, respectively. In another study using a lower flux of 7 L/m2/h, a mean methane yield of 0.24 L CH4/g COD removed was found, which is quite similar to the value from our study in winter, which is 0.29 L CH4/g COD [63].

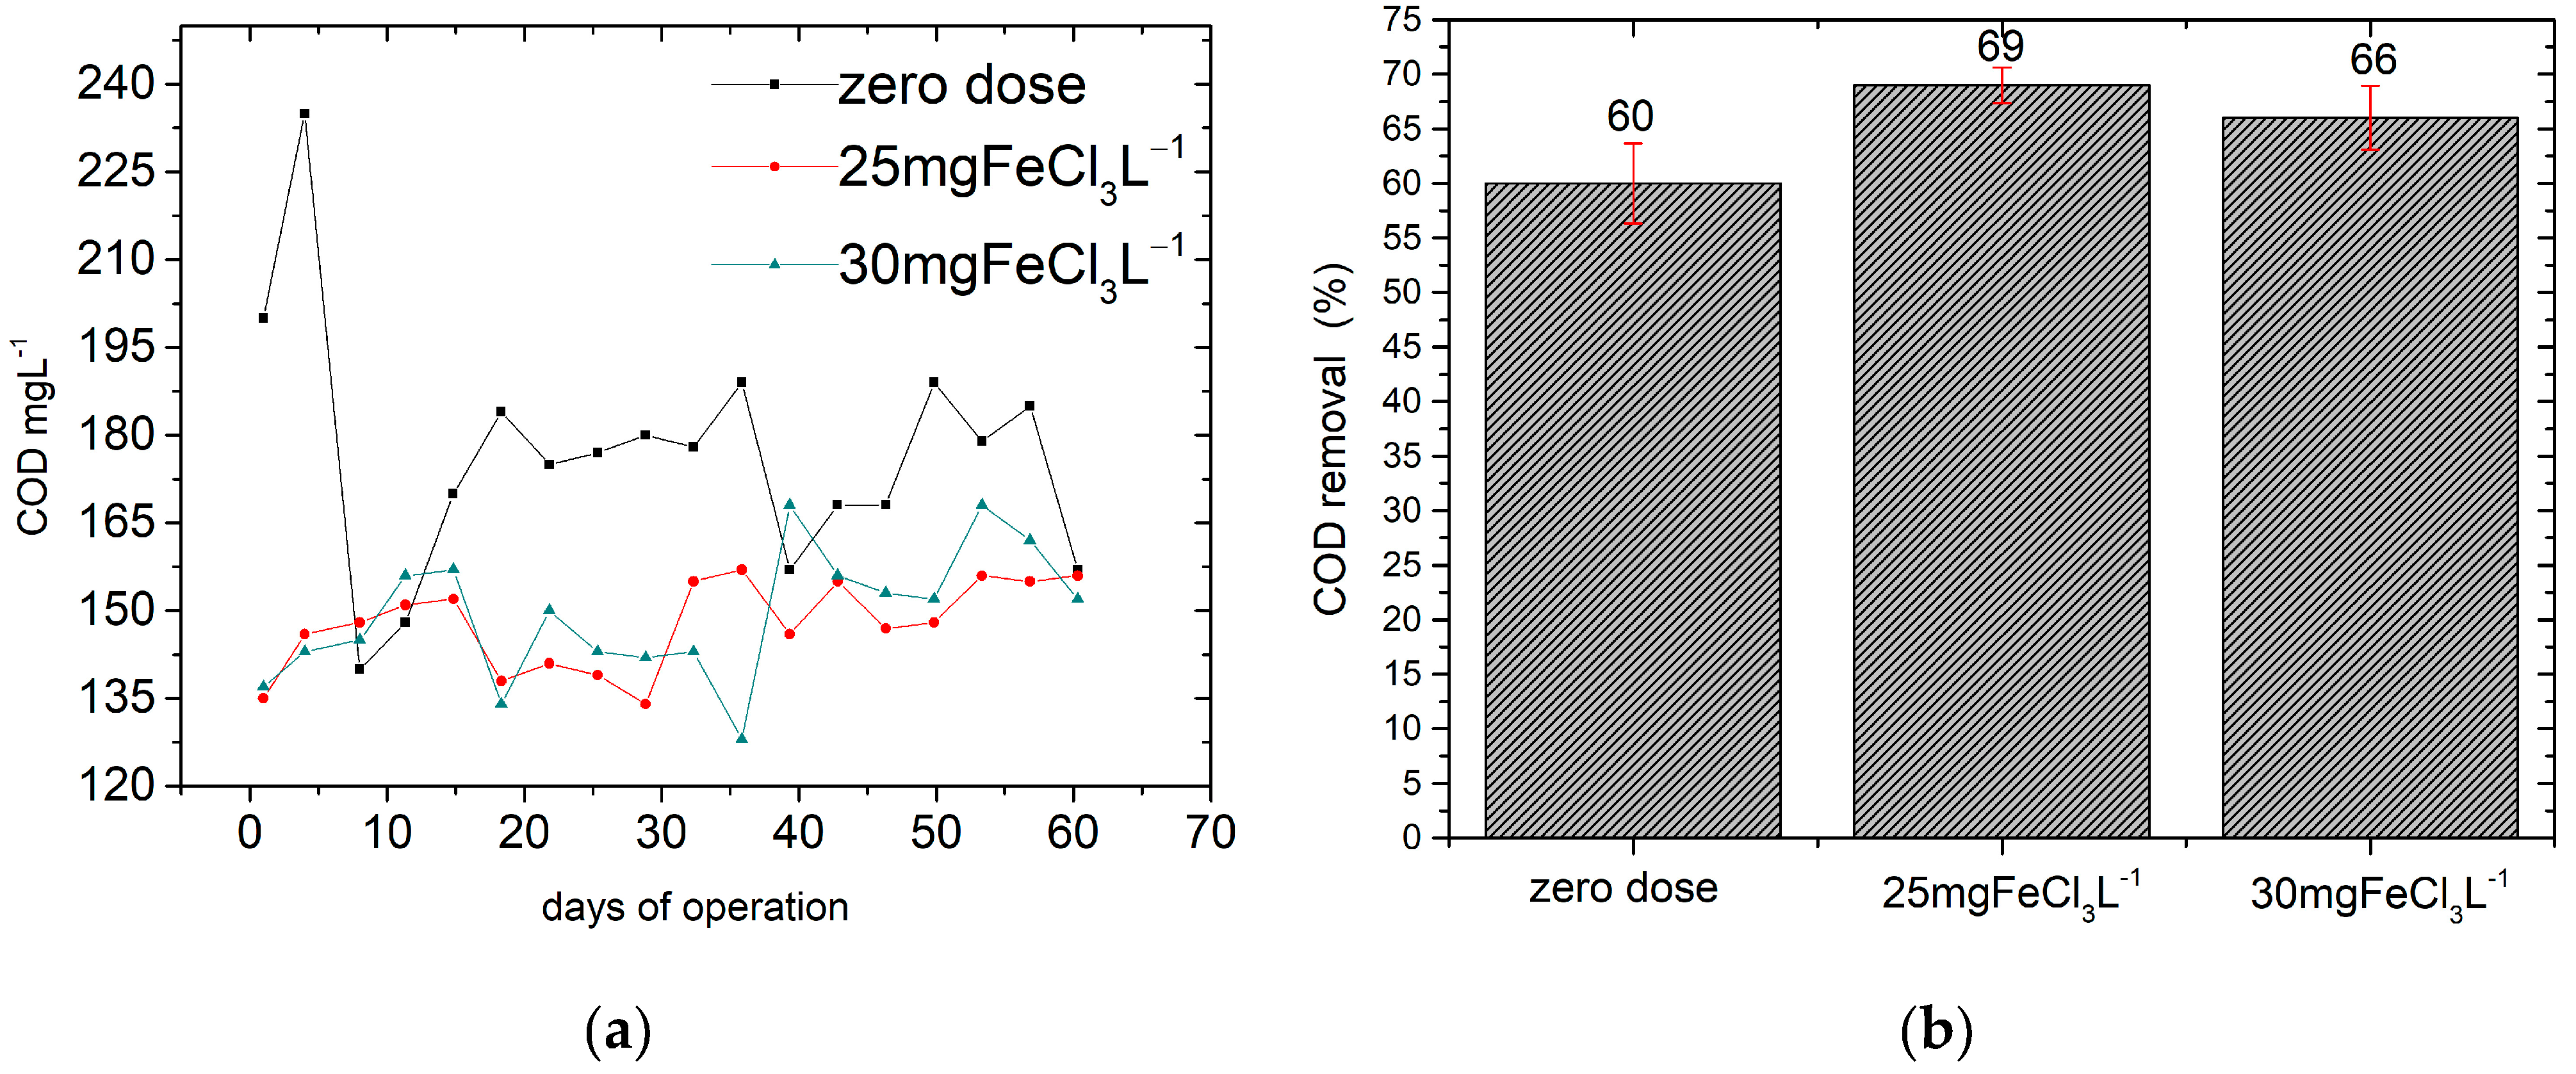
3.3. AnMBR Performance with Iron Addition

According to the findings presented in the previous section, the AnMBR operating at a 6 h HRT was found not to achieve satisfactory organic load removal during the winter period. Moreover, the membrane fouling rate was higher when compared with other HRTs or with operational data obtained during summer. For this reason, iron addition was employed at two different concentrations, 25 and 30 mg FeCl3 L−1, respectively.
Again, bioprocess performance was evaluated in terms of effluent quality, membrane fouling, and biogas production. Mean (±SD) concentrations of COD, VFAs, biogas production, TΝ, and TP in the untreated and treated effluent and removal efficiencies are shown in Table 5. The removal efficiencies were used to investigate the effect of FeCl3 addition on the treatment efficiency. The average effluent concentration of COD was 177 mg/L without FeCl3 addition, while with 25 mg FeCl3 L−1 and 30 mg FeCl3 L−1, COD decreased to 147 mg/L and 149 mg/L, respectively (Figure 4), still not complying with the respective UWWTD limit. TP removal efficiencies obtained at 30 mg FeCl3 L−1 and 25 mg FeCl3 L−1 were 100% and 75%, respectively. The results suggest that the addition of FeCl3 had a significant effect on the COD and P removal. It is anticipated that some of the soluble organic matter was coagulated and formed flocs that were retained by the membrane in the reactor.
In addition, as shown in Table 6, iron addition resulted in increased mixed liquor suspended solid (MLSS) concentrations due to chemical P removal and the formation of iron phosphate salts. The analysis revealed a 20% increase in the value of MLSS due to iron addition. This finding highlights a potential environmental problem regarding the formation of ferric-rich sludge, which could restrict disposal or reuse alternatives [64,65]. Furthermore, due to iron addition, membrane fouling was mitigated. As reported in [66,67], coagulant addition introduces positive charges, neutralizing the negative charge of activated sludge flocs and thus favoring flocculation and reduction of colloidal matter. The addition of ferric chloride concentrations of 25 and 30 mg FeCl3 L−1 significantly lowered the biomass pH to 6.7 and 6.6, respectively. It is expected that higher ferric doses will require pH adjustment in order to avoid unacceptably low values that would inhibit biomass growth [67].
Biogas production decreased slightly with the addition of FeCl3, while methane content also decreased from 69% to 67%. The energy and mixing needs of the AnMBR can be met by methane production and pumping, which may contribute to the sustainability of the AnMBR [68]. However, Fe3+ addition can theoretically reduce methane production by (i) binding organic material or (ii) acting as an external electron acceptor. In our case, biogas production decreased only slightly due to FeCl3 addition. It can be concluded that FeCl3 addition, at the dosages studied, does not inhibit the activity of methanogens or significantly reduce the availability of organic material.
Previous AnMBR studies have shown that methane yield decreased from 102 ± 29 mL CH4/g COD to 91 ± 37.8 mL CH4/g COD when fed with a dose of 26 mg/L FeCl3 [69]. Therefore, no significant effect on biogas production occurred. However, at higher iron dosages, methane yield decreased from 0.167 ± 0.017 g CH4 as COD/g COD feed to about 0.079 gCH4 as COD/g COD feed with the addition of 43 mg/L FeCl3 [69]. Therefore, FeCl3 dosage should be carefully considered as it may affect biogas production.

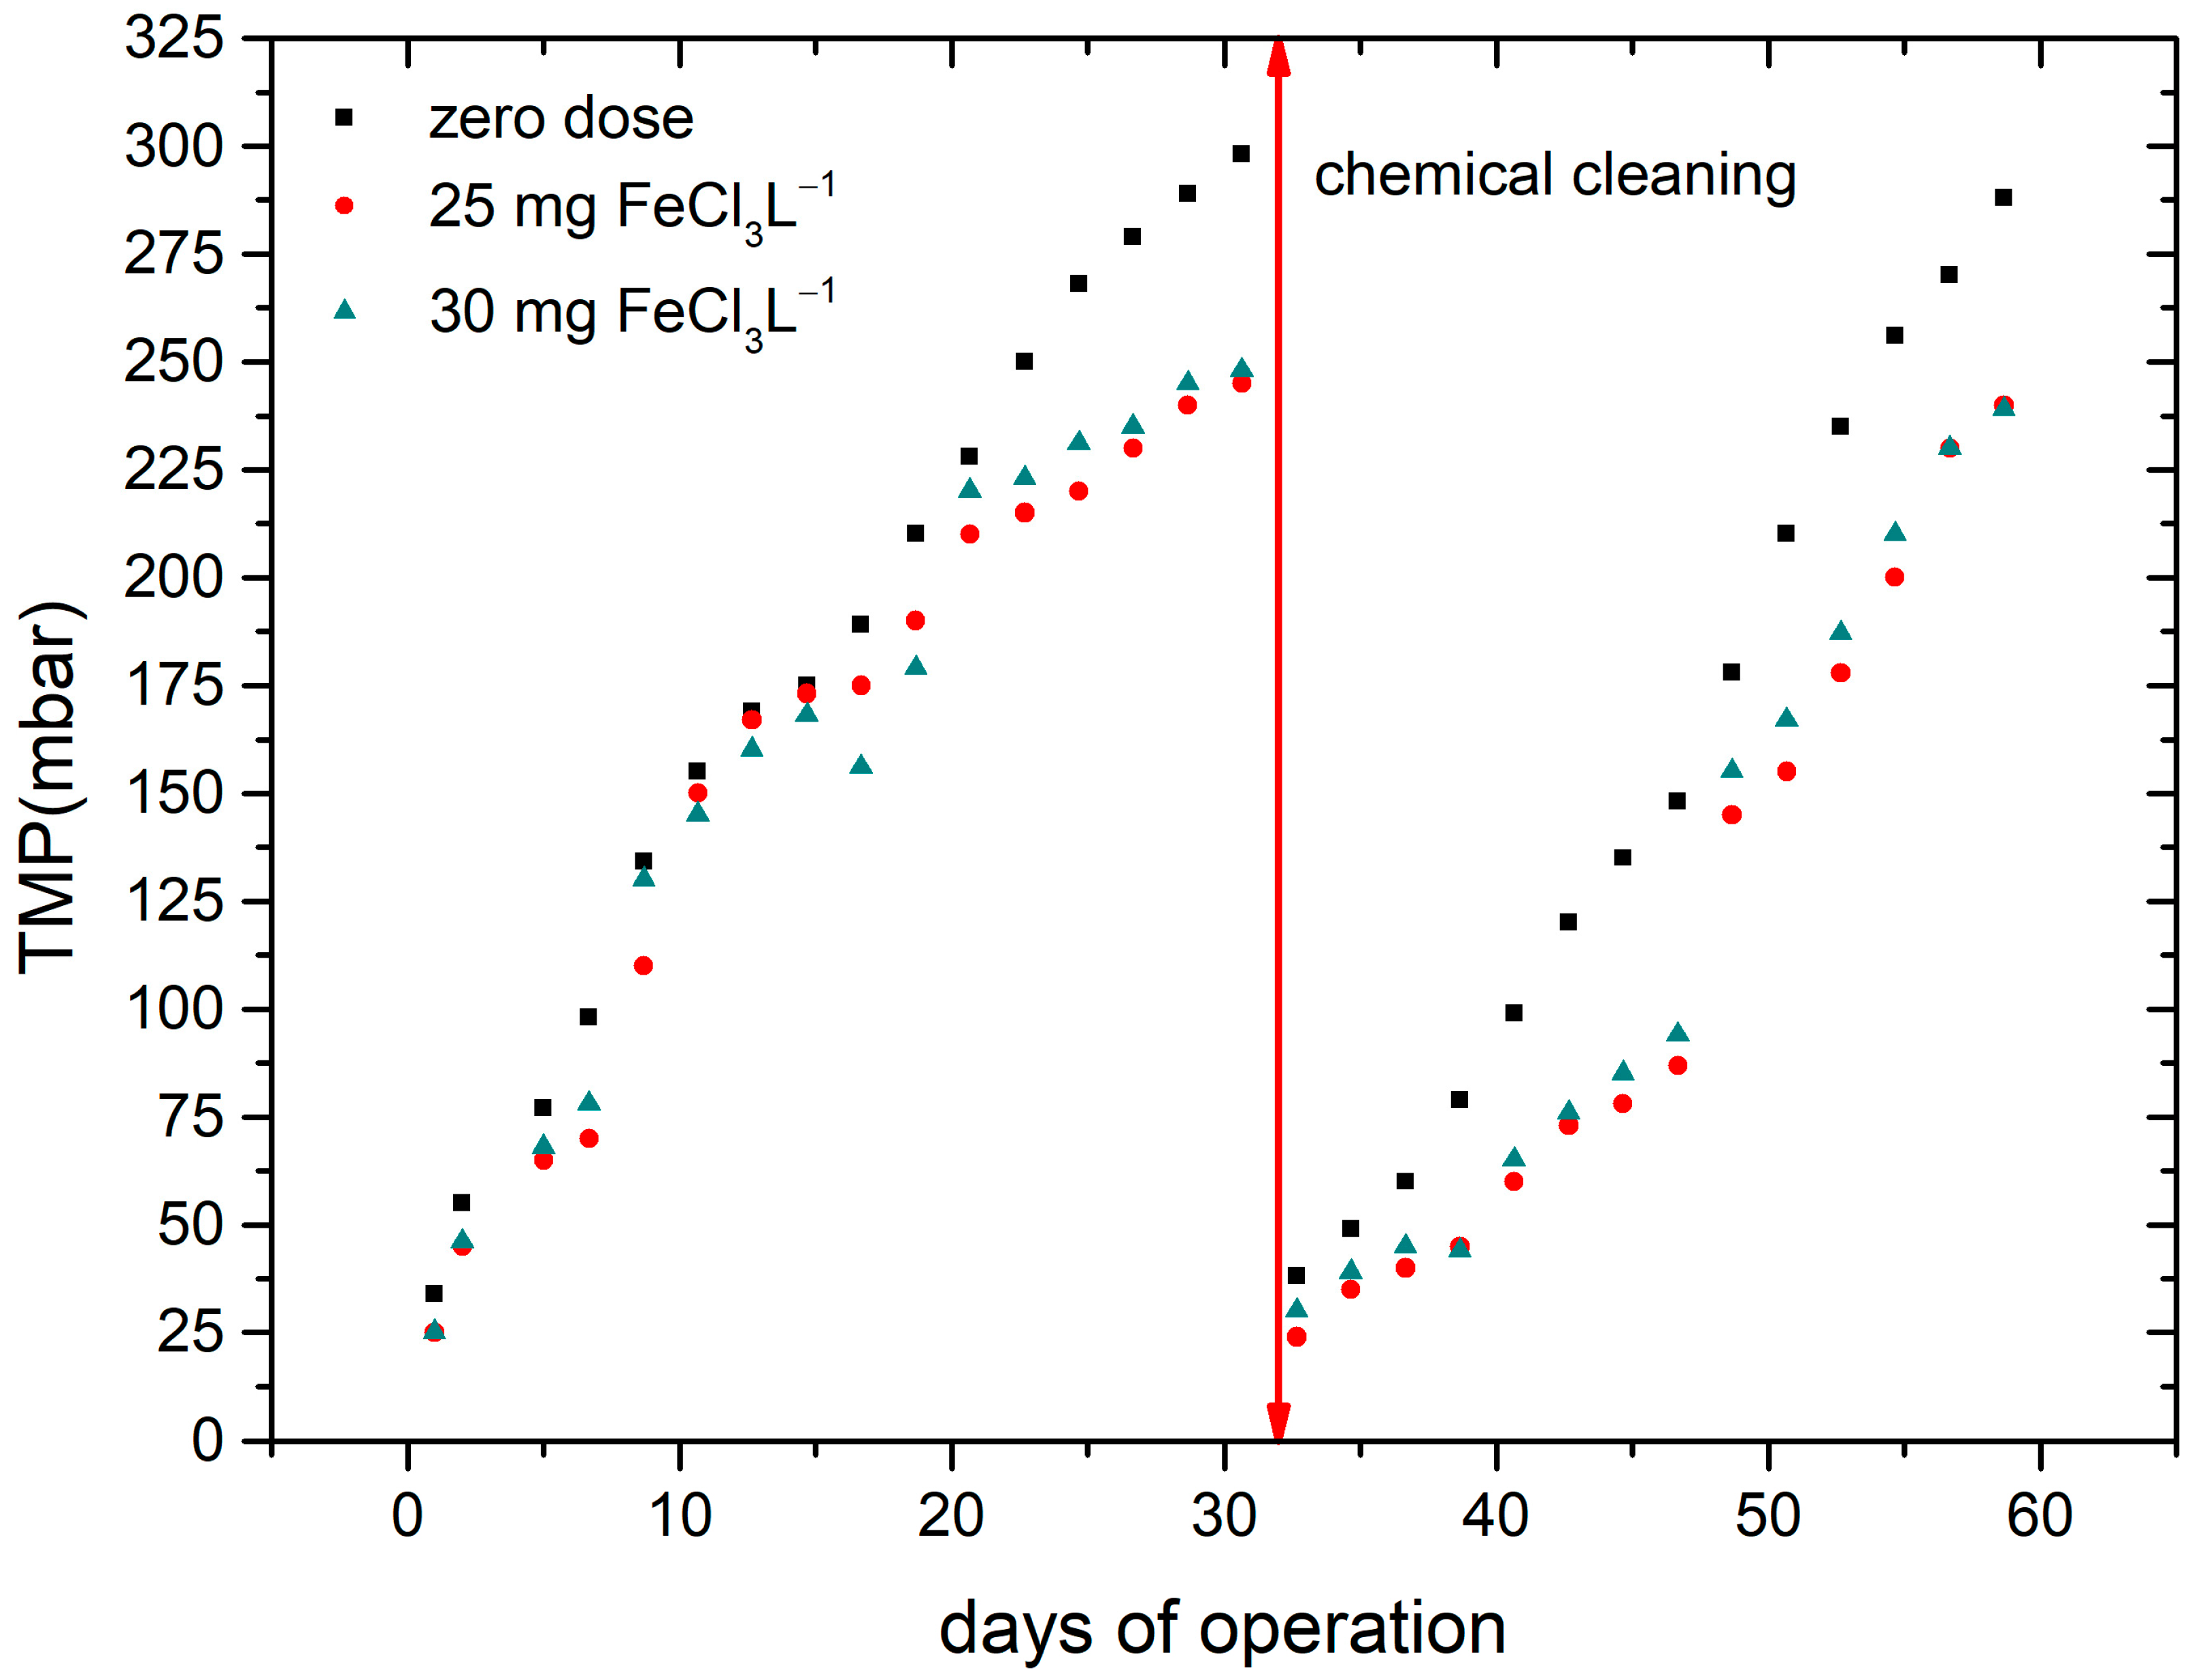
3.4. Membrane Performance with and without Iron Addition

The outcomes of this study are presented for the winter season, during which the operational temperature was maintained at 18 °C ± 3, utilizing two distinct dosages of iron. The membrane utilized in the AnMBR had a manufacturer-designated upper pressure limit of 300 mbar as a protective measure. Under normal operating conditions, this limit was attained within approximately one month. In order to rejuvenate the membrane, it underwent a cleansing procedure involving sodium hypochlorite. The differences in the fouling rates of both zero-iron dose and 25 mg FeCl3 L−1 iron dose were evaluated by monitoring the TMP changes over time. TMP values were employed to characterize fouling since the AnMBR was operated at a constant flux of 13 LMH.
ΤΜP showed a slight improvement upon FeCl3 addition, but no further improvement upon increasing iron dose (Figure 5) was observed. The TMP after 30 days of operation with iron addition did not reach 300 mbar TMP (value initiating chemical cleaning), which means that membrane operation time can be extended without chemical cleaning, resulting in AnMBR operation improvement.
The analysis showed that during the first 18 days, the TMP increased with a slope value of 10 mbar/day for the zero-iron dose, while the other two doses had very similar values of around 9 mbar/day, indicating that their rates of increase were almost the same. However, between days 20 and 30, the slope rates for both iron doses were significantly lower than that of the zero-iron dose.
After the chemical cleaning process, the TMP increased much faster until day 48, with a slope rate value of 10 mbar/day for the zero-iron dose, while the iron doses reduced the value by half. However, in the final 10 days, the three values were closer, but the rate of increase for the zero-iron dose remained higher. These results suggest that the addition of iron affects the rate of increase of TMP and that the zero-iron dose had the highest rate of increase throughout the study period.
In another study, carried out with the addition of FeCl3, there was again a reduction in the TMP value [37]. More specifically, the absence of FeCl3 resulted in an initial TMP range of 5.7–6.3 kPa for 45 days, which subsequently increased to 21.5 kPa by day 91. In contrast, when FeCl3 was added, TMP values were initially in the range of 1.5–5.1 kPa for 75 days, followed by an increase to 8.8 kPa on day 90.

3.5. Micropollutant Removal with and without Iron Addition

Micropollutant removal investigation was conducted at a 25 mg FeCl3 L−1 dose, as this dose provided the most satisfactory results regarding membrane fouling mitigation and organic load removal. The removal of micropollutants in wastewater treatment is mainly due to biosorption and biotransformation. In AnMBR systems, biotransformation removal outweighs sludge sorption, especially at long SRTs [32]. The high SRT increases the efficiency of the removal of micropollutants, as it increases the exposure time to the slowly growing anaerobic microbial populations [70].
In our study, the effect of iron addition on micropollutant removal in the AnMBR was investigated by monitoring influent and effluent micropollutant concentrations. Specifically, seven organic micropollutants—nonyphenol (NP), triclosan (TCS), and bisphenol A (BPA) from the EDC group and ibuprofen (IBU), naproxen (NPX), diclofenac (DCF), and ketoprofen (KTP) from the NSAID category—were measured with 25 FeCl3 mg/L and without iron addition. The results of the removal efficiency for the target compounds are shown in Figure 6.
The results revealed that iron addition enhanced the removal of TCS and DCF, while the removal of IBU, NPX, and BPA appeared to improve in the absence of iron. For the remaining compounds (NP, KTP) the effect of iron on their removal seems to be insignificant. The overall efficiency of the system is that it can achieve high nonylphenol removal efficiency with and without iron addition, while removal of other target compounds remains low to moderate. The high NP removal obtained can be associated with its high hydrophobic–lipophilic nature (logKow = 5.76) with a high affinity for sorption (logKoc = 3.1) and bioaccumulation. Thus, both the sorption into the sludge and the anaerobic degradation seem to play a crucial role in the eradication of NP [22], while iron seems not to have a significant effect. KTP removal was on average 27%, consistent with other removals recorded in the literature [33,71], while biotransformation was presented as the primary removal mechanism. The poor removal performance of AnMBR systems for ibuprofen and diclofenac has also been reported by others [32,33]. The enhanced removal of diclofenac in our system when FeCl3 is supplied to the reactor could be attributed to sorption into ferric complexes formed in the presence of water molecules and hydroxyls under anaerobic conditions. These complexes are trapped in the reactor by precipitation or by retainment by the membrane. Other researchers claim that although the biodegradability of DCF under anaerobic conditions is low, it is the primary removal mechanism [32], while others [71] support that biodegradation is negligible and low adsorption on sludge occurs. According to the results of this study, it was confirmed that TCS degradation is low under anaerobic conditions and the observed removal can be attributed both to sorption and biodegradation, which remained low with iron addition. Others also report adsorption as the major removal mechanism in an AnMBR system, though only at the early stages of the experiments [32]. Accumulation in sludge has also been reported for target hydrophobic compounds (BPA, TCS, NP), but biodegradation is suggested as the main removal mechanism [30].
As aforementioned, the anaerobic treatment seemed less effective for most of the target compounds (BPA, TCS, IBU, KFN, DCF), which is also reported by others in the literature [32,33,72,73]. Aerobic treatment (CAS, MBR) has been reported to be quite effective for the removal of almost all the target compounds (NP, BPA, TCS, IBU, NPX, KFN) [26,28,71,72,73]. Evidently, as far as DCF is concerned, it should be noted that even though its biodegradation is poor under aerobic and anaerobic environments, it could be enhanced through the combination of anoxic–oxic processes [72]. Even though the physiochemical properties, such as molecular weight, ring structure, and functional groups, influence biodegradability and govern the removal of each pollutant, especially for those with low hydrophobicity, the biotransformation of the compounds is highly influenced by the redox conditions since the variety of microbial communities and metabolic pathways, as well as microbial activity, are driven by them [26,70]. As such, the rapid metabolism of aerobic bacteria and the short biodegradation pathway of organic matter during aerobic treatment are possible explanations for the enhanced removal, as reported in other studies [74]. In addition, the sorption mechanism is another factor to take into consideration, especially for the more hydrophobic CECs, because it results in a much higher retention time in the reactor. Therefore, according to the literature [26,33], the higher biodegradation obtained under aerobic conditions is partly attributed to increased sorption to biosolids due to smaller floc size which enhances mass transfer by diffusion.

4. Study Implications and Research Prospects

Figure 7 shows COD effluent values for the winter and summer periods for three different HRTs studied in a previous paper [54], in combination with the HRT of 6 h studied in this paper.
The findings presented in Figure 7 show that for the 24 h and 48 h HRTs, the effluent COD values were consistently below the UWWTD limit of 125 mg/L during both winter and summer periods. However, for the 12 h HRT during the summer season, the values met the required criteria, while during winter, some of the values exceeded the set limit. Moreover, for the 6 h HRT, even during the summer period, some values exceeded the limit, and during the winter season, all values were considerably higher than the 125 mg/L threshold. Based on the findings discussed, it can be concluded that for future scaling up of this technology, the optimal HRT would be 12 h during the summer period and 24 h during the winter period. By operating under these conditions, the effluent COD values would meet the standards set by the UWWTD.
Although the addition of iron at the HRT of 6 h showed some improvement, the COD values remained outside of the desired range. To address this issue, future studies could consider increasing the HRT to 12 h and examining the addition of iron to limit the values that are out of range. This may improve the overall performance of the reactor and help achieve the desired values.
The addition of iron to the reactor is not anticipated to have a substantial economic impact on system operation. The cost of operating the system with the iron addition increases by a marginal amount of 0.005 EUR/m3, which is negligible in comparison to other operation costs such as maintenance and energy expenses.

5. Conclusions

The AnMBR exhibited quite satisfactory treatment performance even without iron addition during the summer, with an average COD removal efficiency of 73 ± 4% and an average permeate COD concentration of 121 ± 12 mg-L−1. During the winter, the AnMBR performance decreased to 60 ± 4%, and the effluent COD averaged 177 ± 21 mg-L−1.
FeCl3 dosing of 25 mg FeCl3 L−1 improved COD removal efficiency by 17%, removed TP by 75%, and slightly improved membrane performance The dose of 30 mg FeCl3 L−1 did not show any further improvement in terms of COD and membrane performance, but the TP was 100% removed.
Methane yield was not affected for both iron doses. Biogas production was satisfactory with and without iron addition and averaged approximately 0.37 L biogas/g COD removed during the winter period. However, the values of soluble methane in permeate were equal to saturation: 20.6% and 43.8% of the total methane produced during summer and winter, respectively. Therefore, for full-scale applications of AnMBR technology, the development of an effective dissolved methane recovery process is of great interest for optimizing bioenergy production and minimizing direct greenhouse gas emissions to the atmosphere.
Except for NP removal, the AnMBR achieved low to moderate micropollutant removal. The AnMBR achieved greater than 70% NP removal efficiency with and without iron addition. However, the percentage removal of all other micropollutants studied was relatively low and ranged between 10 and 40%. With respect to our work, it can be concluded that anaerobic conditions are inefficient for the removal of most of the target CECs, as also reported by other studies for BPA, TCS, DCF, IBU, and KTP [75].
According to the findings of this study, an AnMBR unit operating at ambient temperatures and at high organic and hydraulic loading rates supplemented with iron addition can meet secondary effluent COD and P limits while producing significant quantities of biogas that amount to approximately 0.1 m3 biogas/m3 of treated wastewater. AnMBR optimization is of increasing importance globally but also specifically in Europe, in view of the anticipated requirement for energy-neutral urban wastewater treatment plants that is included in the European Commission proposal (https://environment.ec.europa.eu/publications/proposal-revised-urban-wastewater-treatment-directive (accessed on 13 March 2023)) for the revision of the Urban Wastewater Treatment Directive (UWWTD) 91/271/EEC.

Author Contributions

Conceptualization, D.M. and C.N.; data curation, A.P. and E.B.; writing—original draft preparation, A.P. and E.B.; writing—review and editing, D.M. and C.N.; supervision, D.M. All authors have read and agreed to the published version of the manuscript.

Funding

This research was co-financed by Greece and the European Union (European Social Fund-ESF) through the Operational Programme “Human Resources Development, Education and Lifelong Learning” in the context of the project “Strengthening Human Resources Research Potential via Doctorate Research” (MIS-5000432), implemented by the State Scholarships Foundation (ΙΚΥ).

Data Availability Statement

The data presented in this study are available in this article and in Plevri et al., 2021 [54].

Acknowledgments

The authors would like to thank the Research and Development Department of EYDAP S.A. for their support.

Conflicts of Interest

The authors declare no conflict of interest.

References

  1. European Commission, “EU Circular Economy Action Plan”. 2020. Available online: https://ec.europa.eu/environment/circular-economy/ (accessed on 6 November 2020).
  2. Fetting, C. The European Green Deal; ESDN Report; ESDN Office: Vienna, Austria, 2020. [Google Scholar]
  3. Ganora, D.; Hospido, A.; Husemann, J.; Krampe, J.; Loderer, C.; Longo, S.; Moragas Bouyat, L.; Obermaier, N.; Piraccini, E.; Stanev, S.; et al. Opportunities to improve energy use in urban wastewater treatment: A European-scale analysis. Environ. Res. Lett. 2019, 14, 044028. [Google Scholar] [CrossRef]
  4. Drechsel, P.; Qadir, M.; Wichelns, D. Wastewater: Economic Asset in an Urbanizing World; Springer: Berlin/Heidelberg, Germany, 2015; pp. 1–282. ISBN 978-94-017-9544-9. [Google Scholar]
  5. U.S. Environmental Protection Agency|US EPA. Available online: https://www.epa.gov/ (accessed on 11 October 2022).
  6. Flores-Alsina, X.; Corominas, L.; Snip, L.; Vanrolleghem, P.A. Including greenhouse gas emissions during benchmarking of wastewater treatment plant control strategies. Water Res. 2011, 45, 4700–4710. [Google Scholar] [CrossRef] [PubMed]
  7. Gustavsson, D.J.I.; Tumlin, S. Carbon footprints of Scandinavian wastewater treatment plants. Water Sci. Technol. 2013, 68, 887–893. [Google Scholar] [CrossRef]
  8. Mamais, D.; Noutsopoulos, C.; Dimopoulou, A.; Stasinakis, A.; Lekkas, T.D. Wastewater treatment process impact on energy savings and greenhouse gas emissions. Water Sci. Technol. 2015, 71, 303–308. [Google Scholar] [CrossRef] [PubMed]
  9. Goliopoulos, N.; Mamais, D.; Noutsopoulos, C.; Dimopoulou, A.; Kounadis, C. Energy Consumption and Carbon Footprint of Greek Wastewater Treatment Plants. Wate 2022, 14, 320. [Google Scholar] [CrossRef]
  10. Ketheesan, B.; Stuckey, D.C. Effects of hydraulic/organic shock/transient loads in anaerobic wastewater treatment: A review. Crit. Rev. Environ. Sci. Technol. 2015, 45, 2693–2727. [Google Scholar] [CrossRef]
  11. Shizas, I.; Bagley, D.M. Experimental Determination of Energy Content of Unknown Organics in Municipal Wastewater Streams. J. Energy Eng. 2004, 130, 45–53. [Google Scholar] [CrossRef]
  12. Robles, Á.; Ruano, M.V.; Charfi, A.; Lesage, G.; Heran, M.; Harmand, J.; Seco, A.; Steyer, J.-P.; Batstone, D.J.; Kim, J.; et al. A review on anaerobic membrane bioreactors (AnMBRs) focused on modelling and control aspects. Bioresour. Technol. 2018, 270, 612–626. [Google Scholar] [CrossRef] [Green Version]
  13. Pretel, R.; Moñino, P.; Robles, A.; Ruano, M.V.; Seco, A.; Ferrer, J. Economic and environmental sustainability of an AnMBR treating urban wastewater and organic fraction of municipal solid waste. J. Environ. Manag. 2016, 179, 83–92. [Google Scholar] [CrossRef] [Green Version]
  14. Grethlein, H.E. Anaerobic membrane domestic digestion separation wastewater. J. (Water Pollut. Control. Fed.) 1978, 50, 754–763. [Google Scholar]
  15. Fuwad, A.; Ryu, H.; Malmstadt, N.; Kim, S.M.; Jeon, T.J. Biomimetic membranes as potential tools for water purification: Preceding and future avenues. Desalination 2019, 458, 97–115. [Google Scholar] [CrossRef]
  16. Shahid, M.K.; Kashif, A.; Rout, P.R.; Aslam, M.; Fuwad, A.; Choi, Y.; Banu J, R.; Park, J.H.; Kumar, G. A brief review of anaerobic membrane bioreactors emphasizing recent advancements, fouling issues and future perspectives. J. Environ. Manag. 2020, 270, 110909. [Google Scholar] [CrossRef] [PubMed]
  17. Kanai, M.; Ferre, V.; Wakahara, S.; Yamamoto, T.; Moro, M. A novel combination of methane fermentation and MBR—Kubota Submerged Anaerobic Membrane Bioreactor process. Desalination 2010, 250, 964–967. [Google Scholar] [CrossRef]
  18. Cheng, H.; Li, Y.; Kato, H.; Li, Y.Y. Enhancement of sustainable flux by optimizing filtration mode of a high-solid anaerobic membrane bioreactor during long-term continuous treatment of food waste. Water Res. 2020, 168, 115195. [Google Scholar] [CrossRef]
  19. Ma, Z.; Wen, X.; Zhao, F.; Xia, Y.; Huang, X.; Waite, D.; Guan, J. Effect of temperature variation on membrane fouling and microbial community structure in membrane bioreactor. Bioresour. Technol. 2013, 133, 462–468. [Google Scholar] [CrossRef]
  20. Tao, C.; Parker, W.; Bérubé, P. Interaction of operating HRT and temperature on fouling of tertiary membranes treating municipal wastewater. Sci. Total Environ. 2023, 858, 159812. [Google Scholar] [CrossRef]
  21. Arman, N.Z.; Salmiati, S.; Aris, A.; Salim, M.R.; Nazifa, T.H.; Muhamad, M.S.; Marpongahtun, M. A review on emerging pollutants in the water environment: Existences, health effects and treatment processes. Water 2021, 13, 3258. [Google Scholar] [CrossRef]
  22. Azizi, D.; Arif, A.; Blair, D.; Dionne, J.; Filion, Y.; Ouarda, Y.; Pazmino, A.G.; Pulicharla, R.; Rilstone, V.; Tiwari, B.; et al. A comprehensive review on current technologies for removal of endocrine disrupting chemicals from wastewaters. Environ. Res. 2022, 207, 112196. [Google Scholar] [CrossRef]
  23. Tiwari, B.; Sellamuthu, B.; Piché-Choquette, S.; Drogui, P.; Tyagi, R.D.; Vaudreuil, M.A.; Sauvé, S.; Buelna, G.; Dubé, R. Acclimatization of microbial community of submerged membrane bioreactor treating hospital wastewater. Bioresour. Technol. 2021, 319, 124223. [Google Scholar] [CrossRef]
  24. Ahmed, F.N.; Lan, C.Q. Treatment of landfill leachate using membrane bioreactors: A review. Desalination 2012, 287, 41–54. [Google Scholar] [CrossRef]
  25. Chtourou, M.; Mallek, M.; Dalmau, M.; Mamo, J.; Santos-Clotas, E.; Salah, A.B.; Walha, K.; Salvadó, V.; Monclús, H. Triclosan, carbamazepine and caffeine removal by activated sludge system focusing on membrane bioreactor. Process Saf. Environ. Prot. 2018, 118, 1–9. [Google Scholar] [CrossRef]
  26. Tadkaew, N.; Hai, F.I.; McDonald, J.A.; Khan, S.J.; Nghiem, L.D. Removal of trace organics by MBR treatment: The role of molecular properties. Water Res. 2011, 45, 2439–2451. [Google Scholar] [CrossRef] [PubMed] [Green Version]
  27. Bertanza, G.; Steimberg, N.; Pedrazzani, R.; Boniotti, J.; Ceretti, E.; Mazzoleni, G.; Menghini, M.; Urani, C.; Zerbini, I.; Feretti, D. Wastewater toxicity removal: Integrated chemical and effect-based monitoring of full-scale conventional activated sludge and membrane bioreactor plants. Sci. Total Environ. 2022, 851, 158071. [Google Scholar] [CrossRef] [PubMed]
  28. Gurung, K.; Ncibi, M.C.; Sillanpää, M. Assessing membrane fouling and the performance of pilot-scale membrane bioreactor (MBR) to treat real municipal wastewater during winter season in Nordic regions. Sci. Total Environ. 2017, 579, 1289–1297. [Google Scholar] [CrossRef] [PubMed]
  29. Boonnorat, J.; Techkarnjanaruk, S.; Honda, R.; Prachanurak, P. Effects of hydraulic retention time and carbon to nitrogen ratio on micro-pollutant biodegradation in membrane bioreactor for leachate treatment. Bioresour. Technol. 2016, 219, 53–63. [Google Scholar] [CrossRef] [PubMed]
  30. Wijekoon, K.C.; McDonald, J.A.; Khan, S.J.; Hai, F.I.; Price, W.E.; Nghiem, L.D. Development of a predictive framework to assess the removal of trace organic chemicals by anaerobic membrane bioreactor. Bioresour. Technol. 2015, 189, 391–398. [Google Scholar] [CrossRef] [PubMed] [Green Version]
  31. Abargues, M.R.; Robles, A.; Bouzas, A.; Seco, A. Micropollutants removal in an anaerobic membrane bioreactor and in an aerobic conventional treatment plant. Water Sci. Technol. 2012, 65, 2242–2250. [Google Scholar] [CrossRef]
  32. Xiao, Y.; Yaohari, H.; De Araujo, C.; Sze, C.C.; Stuckey, D.C. Removal of selected pharmaceuticals in an anaerobic membrane bioreactor (AnMBR) with/without powdered activated carbon (PAC). Chem. Eng. J. 2017, 321, 335–345. [Google Scholar] [CrossRef]
  33. Monsalvo, V.M.; McDonald, J.A.; Khan, S.J.; Le-Clech, P. Removal of trace organics by anaerobic membrane bioreactors. Water Res. 2014, 49, 103–112. [Google Scholar] [CrossRef]
  34. Song, X.; Luo, W.; Hai, F.I.; Price, W.E.; Guo, W.; Ngo, H.H.; Nghiem, L.D. Resource recovery from wastewater by anaerobic membrane bioreactors: Opportunities and challenges. Bioresour. Technol. 2018, 270, 669–677. [Google Scholar] [CrossRef]
  35. Ojha, A.; Tiwary, D.; Oraon, R.; Singh, P. Degradations of endocrine-disrupting chemicals and pharmaceutical compounds in wastewater with carbon-based nanomaterials: A critical review. Environ. Sci. Pollut. Res. 2021, 28, 30573–30594. [Google Scholar] [CrossRef] [PubMed]
  36. Peng, Q.; Song, J.; Li, X.; Yuan, H.; Liu, M.; Duan, L.; Zuo, J. Pharmaceutically active compounds (PhACs) in surface sediments of the Jiaozhou Bay, north China. Environ. Pollut. 2020, 266, 115245. [Google Scholar] [CrossRef] [PubMed]
  37. Hawash, H.B.; Moneer, A.A.; Galhoum, A.A.; Elgarahy, A.M.; Mohamed, W.A.A.; Samy, M.; El-Seedi, H.R.; Gaballah, M.S.; Mubarak, M.F.; Attia, N.F. Occurrence and spatial distribution of pharmaceuticals and personal care products (PPCPs) in the aquatic environment, their characteristics, and adopted legislations. J. Water Process Eng. 2023, 52, 103490. [Google Scholar] [CrossRef]
  38. Wojcieszyńska, D.; Guzik, H.; Guzik, U. Non-steroidal anti-inflammatory drugs in the era of the Covid-19 pandemic in the context of the human and the environment. Sci. Total Environ. 2022, 834, 155317. [Google Scholar] [CrossRef]
  39. Moreno Ríos, A.L.; Gutierrez-Suarez, K.; Carmona, Z.; Ramos, C.G.; Silva Oliveira, L.F. Pharmaceuticals as emerging pollutants: Case naproxen an overview. Chemosphere 2022, 291, 132822. [Google Scholar] [CrossRef] [PubMed]
  40. Sedlak, R.I. Phosphorus and Nitrogen Removal from Municipal Wastewater Principles and Practice, 2nd ed.; CRC Press: Boca Raton, FL, USA, 2018; ISBN 9780873716833. Available online: https://www.routledge.com/Phosphorus-and-Nitrogen-Removal-from-Municipal-Wastewater-Principles-and/Sedlak/p/book/9780873716833 (accessed on 13 March 2023).
  41. Dong, H.; Gao, B.; Yue, Q.; Wang, Y.; Li, Q. Effect of pH on floc properties and membrane fouling in coagulation–Ultrafiltration process with ferric chloride and polyferric chloride. Chemosphere 2015, 130, 90–97. [Google Scholar] [CrossRef]
  42. Altmann, T.; Das, R. Process improvement of sea water reverse osmosis (SWRO) and subsequent decarbonization. Desalination 2021, 499, 114791. [Google Scholar] [CrossRef]
  43. Siegrist, H.; Vogt, D.; Garcia-Heras, J.L.; Gujer, W. Mathematical model for meso- and thermophilic anaerobic sewage sludge digestion. Environ. Sci. Technol. 2002, 36, 1113–1123. [Google Scholar] [CrossRef]
  44. Braid, R.; Bridgewater, L. Standard Methods for the Examination of Water and Wastewater, 23rd ed.; Eaton, A.D., Clesceri, L.S., Greenberg, A.E., Eds.; AWWA (American Water Works Association) Water Environment Federation: Washington, DC, USA, 2017; ISBN 9780875532875. [Google Scholar]
  45. Cox, J.D. Notation for states and processes, significance of the word standard in chemical thermodynamics, and remarks on commonly tabulated forms of thermodynamic functions. Pure Appl. Chem. 1982, 54, 1239–1250. [Google Scholar] [CrossRef]
  46. Luo, Z.; Chen, H.; Wu, S.; Yang, C.; Cheng, J. Enhanced removal of bisphenol A from aqueous solution by aluminum-based MOF/sodium alginate-chitosan composite beads. Chemosphere 2019, 237, 124493. [Google Scholar] [CrossRef]
  47. Mahmad, A.; Zango, Z.U.; Noh, T.U.; Usman, F.; Aldaghri, O.A.; Ibnaouf, K.H.; Shaharun, M.S. Response surface methodology and artificial neural network for prediction and validation of bisphenol a adsorption onto zeolite imidazole framework. Groundw. Sustain. Dev. 2023, 21, 100925. [Google Scholar] [CrossRef]
  48. Müller, S.; Schlatter, C. Oestrogenic potency of nonylphenol in vivo—A case study to evaluate the relevance of human non-occupational exposure. Pure Appl. Chem. 1998, 70, 1847–1853. [Google Scholar] [CrossRef]
  49. Crini, G.; Cosentino, C.; Bradu, C.; Fourmentin, M.; Torri, G.; Ruzimuradov, O.; Arslan-Alaton, I.; Tomei, M.C.; Derco, J.; Barhoumi, M.; et al. Advanced Treatments for the Removal of Alkylphenols and Alkylphenol Polyethoxylates from Wastewater. Environ. Chem. Sustain. World 2021, 2, 305–398. [Google Scholar] [CrossRef]
  50. PubChem. Available online: https://pubchem.ncbi.nlm.nih.gov/ (accessed on 13 March 2023).
  51. Petrie, B.; Barden, R.; Kasprzyk-Hordern, B. A review on emerging contaminants in wastewaters and the environment: Current knowledge, understudied areas and recommendations for future monitoring. Water Res. 2015, 72, 3–27. [Google Scholar] [CrossRef]
  52. Madikizela, L.M.; Ncube, S. Occurrence and ecotoxicological risk assessment of non-steroidal anti-inflammatory drugs in South African aquatic environment: What is known and the missing information? Chemosphere 2021, 280, 130688. [Google Scholar] [CrossRef] [PubMed]
  53. Samaras, V.G.; Thomaidis, N.S.; Stasinakis, A.S.; Lekkas, T.D. An analytical method for the simultaneous trace determination of acidic pharmaceuticals and phenolic endocrine disrupting chemicals in wastewater and sewage sludge by gas chromatography-mass spectrometry. Anal. Bioanal. Chem. 2011, 399, 2549–2561. [Google Scholar] [CrossRef] [PubMed]
  54. Plevri, A.; Mamais, D.; Noutsopoulos, C. Anaerobic MBR technology for treating municipal wastewater at ambient temperatures. Chemosphere 2021, 275, 129961. [Google Scholar] [CrossRef]
  55. Grady, L.; Daigger, G.; Love, N.; Filipe, C. Biological Wastewater Treatment; CRC Press: Boca Raton, FL, USA, 2011. [Google Scholar]
  56. Lew, B.; Tarre, S.; Beliavski, M.; Dosoretz, C.; Green, M. Anaerobic membrane bioreactor (AnMBR) for domestic wastewater treatment. Desalination 2009, 243, 251–257. [Google Scholar] [CrossRef]
  57. Gao, D.W.; Zhang, T.; Tang, C.Y.Y.; Wu, W.M.; Wong, C.Y.; Lee, Y.H.; Yeh, D.H.; Criddle, C.S. Membrane fouling in an anaerobic membrane bioreactor: Differences in relative abundance of bacterial species in the membrane foulant layer and in suspension. J. Memb. Sci. 2010, 364, 331–338. [Google Scholar] [CrossRef]
  58. Giménez, J.B.; Martí, N.; Ferrer, J.; Seco, A. Methane recovery efficiency in a submerged anaerobic membrane bioreactor (SAnMBR) treating sulphate-rich urban wastewater: Evaluation of methane losses with the effluent. Bioresour. Technol. 2012, 118, 67–72. [Google Scholar] [CrossRef]
  59. Martinez-Sosa, D.; Helmreich, B.; Horn, H. Anaerobic submerged membrane bioreactor (AnSMBR) treating low-strength wastewater under psychrophilic temperature conditions. Process Biochem. 2012, 47, 792–798. [Google Scholar] [CrossRef]
  60. Ozgun, H.; Tao, Y.; Ersahin, M.E.; Zhou, Z.; Gimenez, J.B.; Spanjers, H.; van Lier, J.B. Impact of temperature on feed-flow characteristics and filtration performance of an upflow anaerobic sludge blanket coupled ultrafiltration membrane treating municipal wastewater. Water Res. 2015, 83, 71–83. [Google Scholar] [CrossRef] [PubMed]
  61. Smith, A.L.; Skerlos, S.J.; Raskin, L. Psychrophilic anaerobic membrane bioreactor treatment of domestic wastewater. Water Res. 2013, 47, 1655–1665. [Google Scholar] [CrossRef] [PubMed]
  62. Bornare, J.; Kalyanraman, V.; Sonde, R.R.; Kalyanraman, V.; Sonde, R.R. Application of Anaerobic Membrane Bioreactor (AnMBR) for Low-Strength Wastewater Treatment and Energy Generation. In Industrial Wastewater Treatment, Recycling and Reuse; Elsevier: Amsterdam, The Netherlands, 2014; pp. 399–434. ISBN 9780080999685. [Google Scholar]
  63. Li, N.; Hu, Y.; Lu, Y.Z.; Zeng, R.J.; Sheng, G.P. In-situ biogas sparging enhances the performance of an anaerobic membrane bioreactor (AnMBR) with mesh filter in low-strength wastewater treatment. Appl. Microbiol. Biotechnol. 2016, 100, 6081–6089. [Google Scholar] [CrossRef] [PubMed]
  64. Strasser, H.; Brunner, H.; Schinner, F. Leaching of iron and toxic heavy metals from anaerobically-digested sewage sludge. J. Ind. Microbiol. 1995, 14, 281–287. [Google Scholar] [CrossRef]
  65. Sotero-Santos, R.B.; Rocha, O.; Povinelli, J. Toxicity of ferric chloride sludge to aquatic organisms. Chemosphere 2007, 68, 628–636. [Google Scholar] [CrossRef]
  66. Wu, J.; Chen, F.; Huang, X.; Geng, W.; Wen, X. Using inorganic coagulants to control membrane fouling in a submerged membrane bioreactor. Desalination 2006, 197, 124–136. [Google Scholar] [CrossRef]
  67. Malamis, S.; Andreadakis, A.; Mamais, D.; Noutsopoulos, C. Comparison of alternative additives used for the mitigation of membrane fouling in membrane bioreactors. Desalin. Water Treat. 2014, 52, 5740–5747. [Google Scholar] [CrossRef]
  68. Smith, A.L.; Stadler, L.B.; Cao, L.; Love, N.G.; Raskin, L.; Skerlos, S.J. Navigating wastewater energy recovery strategies: A life cycle comparison of anaerobic membrane bioreactor and conventional treatment systems with anaerobic digestion. Environ. Sci. Technol. 2014, 48, 5972–5981. [Google Scholar] [CrossRef]
  69. Dong, Q.; Parker, W.; Dagnew, M. Impact of FeCl3 dosing on AnMBR treatment of municipal wastewater. Water Res. 2015, 80, 281–293. [Google Scholar] [CrossRef]
  70. Lim, M.; Patureau, D.; Heran, M.; Lesage, G.; Kim, J. Removal of organic micropollutants in anaerobic membrane bioreactors in wastewater treatment: Critical review. Environ. Sci. Water Res. Technol. 2020, 6, 1230–1243. [Google Scholar] [CrossRef]
  71. Wijekoon, K.C.; Hai, F.I.; Kang, J.; Price, W.E.; Guo, W.; Ngo, H.H.; Nghiem, L.D. The fate of pharmaceuticals, steroid hormones, phytoestrogens, UV-filters and pesticides during MBR treatment. Bioresour. Technol. 2013, 144, 247–254. [Google Scholar] [CrossRef] [PubMed]
  72. Behera, S.K.; Kim, H.W.; Oh, J.E.; Park, H.S. Occurrence and removal of antibiotics, hormones and several other pharmaceuticals in wastewater treatment plants of the largest industrial city of Korea. Sci. Total Environ. 2011, 409, 4351–4360. [Google Scholar] [CrossRef]
  73. Kim, J.Y.; Ryu, K.; Kim, E.J.; Choe, W.S.; Cha, G.C.; Yoo, I.K. Degradation of bisphenol A and nonylphenol by nitrifying activated sludge. Process Biochem. 2007, 42, 1470–1474. [Google Scholar] [CrossRef]
  74. Liu, W.; Song, X.; Huda, N.; Xie, M.; Li, G.; Luo, W. Comparison between aerobic and anaerobic membrane bioreactors for trace organic contaminant removal in wastewater treatment. Environ. Technol. Innov. 2020, 17, 100564. [Google Scholar] [CrossRef]
  75. Plevri, A.; Noutsopoulos, C.; Mamais, D.; Makropoulos, C.; Andreadakis, A.; Lytras, E.; Samios, S. Priority pollutants and other micropollutants removal in an MBR-RO wastewater treatment system. Desalin. Water Treat. 2018, 127, 121–131. [Google Scholar] [CrossRef]
Figure 1. Flow schematic of the laboratory-scale AnMBR.
Energies 16 03069 g001
Figure 2. AnMBR performance at 6 h in terms of COD removal.
Energies 16 03069 g002
Figure 3. Biogas production profile during AnMBR operation at 6 h HRT.
Energies 16 03069 g003
Figure 4. COD effluent profile: (a) concentrations; (b) percent removal.
Energies 16 03069 g004
Figure 5. TMP profile with and without FeCl3 addition during winter period.
Energies 16 03069 g005
Figure 6. Removal efficiencies of 7 micropollutants with and without iron addition.
Energies 16 03069 g006
Figure 7. COD effluent values for four HRTs examined.
Energies 16 03069 g007
Table 1. Characteristics of the inlet screened municipal wastewater.
ParameterWinter Period (T = 18 °C ± 3)Summer Period (T = 23 °C ± 2)
TSSs (mg/L)107 ± 12120 ± 15
VSSs (mg/L)97 ± 899 ± 6
COD (mg/L)439 ± 34453 ± 26
CODs (mg/L)171 ± 25185 ± 30
NH4-N (mg/L)63 ± 967 ± 5
TN (mgP/L)55 ± 1753 ± 13
TP (mg/L)8.5 ± 3.28.3 ± 2.9
Conductivity (μS cm1)1450 ± 1301530 ± 170
Cl (mg/L)170 ± 30167 ± 25
Table 2. Operating characteristics of AnMBR.
ParameterValue
Q (L day−1)160
V (L)40
Hydraulic Retention Time (HRT) (h)6
Organic Loading Rate (OLR) (kg COD/m3/day)1.8 ± 0.12
W (L/day)0.8
Sludge Retention Time (SRT) (days)50
FLUX (LMH)13
Table 3. AnMBR membrane characteristics.
ManufacturerSINAP
Membrane typeFlat sheet
Membrane modelSINAP 10
(5 × 0.1 m2)
Pore size<0.1 μm
Membrane surface0.1 m2
MaterialPVDF
Specific air demand based on membrane area (SADm)0.36 m3 air/m2 membrane area/h
Table 4. Main physicochemical properties and chemical structure of the target compounds.
Target
Compound
CategoryMolecular FormulaChemical
Structure
Water
Solubility (mg/L)
pKaLog Kow
Ibuprofen
(IBU)
NSAIDC13H18O2Energies 16 03069 i00121.0 (25 °C)4.913.97
Naproxen (NPX)NSAIDC14H14O3Energies 16 03069 i00215.9 (25 °C)4.153.18
Diclofenac (DCF)NSAIDC16H14O3Energies 16 03069 i0032.37 (25 °C)4.154.51
Ketoprofen (KFN)NSAIDC16H14O3Energies 16 03069 i00451 (22 °C)4.53.12
Bisphenol A (BPA)EDCC15H16O2Energies 16 03069 i005120 (25 °C)10.33.43
Nonylphenol
(NP)
EDCC15H24OEnergies 16 03069 i0067 (25 °C)10.285.76
Triclosan
(TCS)
EDCC12H7Cl3O2 Energies 16 03069 i00710 (20 °C)7.94.8
Data for Table 4 extracted from [48,50,51,52].
Table 5. Aggregated results (±standard deviation) for AnMBR operation at 6 h HRT with no iron addition.
ParameterWinter Period (T = 18 °C ± 3)Summer Period (T = 23 °C ± 2)
COD in (mg/L)439 ± 34453 ± 26
COD out (mg/L)177 ± 21121 ± 12
COD rem (%)60 ± 473 ± 4
VFAs (mgCOD/L)91 ± 769 ± 6
TN (mgN/L)69 ± 467 ± 5
TP (mgP/L)8.24 ± 28.5 ± 1.7
Biogas production (L/day)11.4 ± 3.118.8 ± 3
L biogas/g COD removed0.39 ± 0.060.42 ± 0.037
Theoretical biogas production (L/day)20.11 ± 2.7927.8 ± 2.94
Dissolved methane at the effluent (LCH4/day)6.274.5
Table 6. Average concentrations (±SD) for influent and effluent quality parameters with and without FeCl3 addition.
Parameter HRT 6 h
Winter Period
Dose = 0
HRT 6 h
Winter Period
Dose = 25 Fe3+/L
HRT 6 h
Winter Period
Dose = 30 Fe3+/L
COD in (mg L−1)490 ± 38501 ± 44485 ± 34
COD out (mg L−1)177 ± 21147 ± 8149 ± 11
COD rem (%)60 ± 469 ± 266 ± 3
Operating temperature18.3 ± 118.7 ± 1.319.1 ± 1.3
VFAs (mgCOD L−1)92 ± 780 ± 685 ± 8
MLSSs (mg L−1)618070507600
Biogas production (L day−1)11.41 ± 3.110.7 ± 2.210.5 ± 2
TN in (mg L−1)69 ± 4671 ± 368 ± 2
TN out (mg L−1)67 ± 572 ± 473 ± 3
TP in (mg L−1)8.24 ± 28.35 ± 2.49.21 ± 3
TP out (mg L−1)8.5 ± 1.72.25 ± 2.30.5 ± 0.7
Disclaimer/Publisher’s Note: The statements, opinions and data contained in all publications are solely those of the individual author(s) and contributor(s) and not of MDPI and/or the editor(s). MDPI and/or the editor(s) disclaim responsibility for any injury to people or property resulting from any ideas, methods, instructions or products referred to in the content.

