Review

A Review on Leading-Edge Erosion Morphology and Performance Degradation of Aero-Engine Fan and Compressor Blades

1
Sino-European Institute of Aviation Engineering, Civil Aviation University of China, Tianjin 300300, China
2
Institut Supérieur de l’Aéronautique et de l’Espace, 4 Avenue Edouard Belin, 31400 Toulouse, France
3
Engineering Techniques Training Center, Civil Aviation University of China, Tianjin 300300, China
*
Author to whom correspondence should be addressed.
Energies 2023, 16(7), 3068; https://doi.org/10.3390/en16073068
Submission received: 8 February 2023 / Revised: 12 March 2023 / Accepted: 25 March 2023 / Published: 28 March 2023

Abstract

:
The leading edges of aero-engine fan and compressor blades suffer from severe erosion due to the inhalation of suspended particulates in the low-altitude atmosphere during long-term transport. A small deformation of the leading edge can significantly change the aerodynamic performance under a strong non-linear effect, leading to increased operation and maintenance costs for engines. This review first focuses on leading-edge erosion morphology during service, and models of these damages. Secondly, the performance degradation caused by eroded leading edges on different classes of engine components, including airfoils, blades, compression systems, and the whole engine, are reviewed. Finally, optimization methods for eroded blade leading edges and their effects on performance recovery are summarized. This paper contributes to an in-depth understanding of the erosion mechanism of blade leading edges in terms of status and its effect, and is a good reference for establishing erosion leading edge repair methods and improving the level of automated repair.

1. Introduction

Under the premise of ensuring the safe operation of aircraft, continuously reducing the cost of a flight is the goal pursued by manufacturers and is also a reflection of their product competitiveness. Among the operating costs of airline companies, fuel costs account for a relatively large portion of the total operating costs of aircraft, sometimes reaching 30%. In the cruise condition, a decrease in fan efficiency caused by the deterioration of components can increase the fuel consumption rate by more than 0.67% [1]. As key components in the military and civil high bypass ratio turbofan engines, the fan and compressor have a decisive impact on their thrust, fuel consumption rate, safety, and other indicators.
Blades that are operated for a long time in high temperatures, high humidity, and multiple salt spray complex environments are inevitably affected by a variety of degradation mechanisms, including fatigue, corrosion, creep, etc. [2]. These are degradation types that influence the structure of the engine blades through chemical processes governing corrosion, fatigue governing wear, and high temperature and centrifugal force governing creep. In addition, particulates inhaled from the external environment can also impact the blades [3,4]. As the first environmental contact parts, erosion is severe for the fan and compressor blades [5,6]. Particles in the environment (gravel, dust, volcanic ash, etc.) and severe weather (raindrops, hail, etc.) are easily sucked into the engine during the take-off and landing phase of the flight, gradually causing a loss of body material and leading to blade deformation and surface quality deterioration, and the prominent position of the leading edge makes it the most seriously affected area by erosion [7]. The blade’s aerodynamic performance is sensitive to the leading edge geometry, and small deviations in the leading edge morphology significantly change the aerodynamic performance of the blade under the effect of strong nonlinearity [8], which can be described as “A miss is as good as a mile”.
The Vietnam War in the 1960s made the U.S. military the first to recognize the serious hazards of blade erosion, and in the 1970s, NASA opened the design and research work on transonic fan rotors [9], with high load, high efficiency, and high-speed blade designs requiring more demanding aerodynamic morphology. For this reason, the NASA Lewis Research Center conducted an experimental investigation in 1973 [10] on the aerodynamic performance of blunt leading edge transonic rotors to evaluate the leading edge bluntness due to machining errors, foreign object damage, erosion, and other factors. Since the 1990s, the Gulf War, Afghanistan War, and Iraq War broke out in the sandy Middle East, where military helicopters, fighter jets, and large transport aircraft have been repeatedly used in low-altitude combat, with very serious engine fan and compressor blade erosion problems [11,12]; therefore, military equipment security requirements have greatly promoted the development of this research area. Historical statistics show that in the Gulf War, the engine fan blades of B-1B bombers were eroded by gravel and the blade shape changed slightly, resulting in a large resonance stress on the blades during the operation, causing the blade to break, triggering the whole stage blade to be thrown off the wheel, and resulting in an engine misfire. F404 and F101 aero-engines’ blade wear deformation caused a non-inclusive engine failure. The change of blade vibration frequency results in blade fracture and engine misfire. During the war in Afghanistan, due to the Mi-17 helicopters mainly working in a sandy and dusty environment, there were many failures of cracked and broken compressor blades. After realizing the hazards of blade erosion, the U.S. Army stipulated that CH-53K aircraft should not operate in dusty environments for more than 21 min to ensure flight safety [13].
On the commercial side, volcanic ash is recognized as a threat to aircraft airworthiness because over 100 commercial aircraft were affected by unforeseen ash clouds in the last four decades [14]. A joint study by the DTO and MDS Coatings companies reported [15] that the engine fuel consumption rate can increase by nearly 1% due to leading-edge erosion when considering the combined effect of losses at different efficiencies throughout the engine cycle in Figure 1. The erosion is more serious at higher speed tip regions, however, and the development of modern aero engines towards larger radius, higher speed, and lighter and thinner blades makes the blade erosion problem particularly prominent.
In fact, there are two types of processes that affect the leading-edge morphology of aero engine blades, the additive processes, which include fouling and icing, and the subtractive processes, which include erosion and foreign object damage (FOD) [16]. In contrast to the additive process, the damage caused by the subtraction process is usually permanent and irrecoverable. Research into the damage caused by FOD [17] and insect contamination [18] has progressed; however, with the increasing speed requirements of aircraft, hydro-meteorological and sand impact remain an unavoidable hazard. In particular, the impact of rain and sand and their synergistic effects may significantly shorten the life of engine blades, as these effects are present for most of the flight. This form of damage is difficult to eliminate and can only be restored by polishing the blade to reinstate part of the aerodynamic performance, thus reducing the huge economic losses brought by the frequent replacement of the blades.
At present, performance degradation caused by the eroded leading edge of fan and compressor blades is gradually attracting attention and has a broad application prospect in the industry. However, there is still a lack of review on blade erosion morphology and the effect of erosion on aerodynamic degradation. Therefore, this review mainly discusses the results of previous research on the leading-edge erosion of aero engine blades, aiming to provide a systematic understanding. This review is divided into three parts, the first part describes the blade leading-edge erosion morphology features, the second discusses the aerodynamic performance degradation caused by the eroded leading-edge blade, and the final part summarizes the eroded leading-edge reshaping optimization design method which aims to provide theoretical support for the development of intelligent repair in the future.

2. Eroded Leading-Edge Morphology

The erosion of sand and other particles absorbed into the engine causes the degradation of blade leading edge geometry and morphological structure [7]. In the blade design process, researchers mainly design the leading edge with regular geometries that can be mathematically expressed such as circular [19], elliptical [20,21,22,23], curvature continuous leading edge [24], etc. However, the erosion process usually generates irregular leading-edge morphological features that affect the performance degradation with more complex mechanisms. According to the method for obtaining blade erosion models, the existing studies can be divided into two categories, one studies a damaged blade that was in the real environment for a long time, and the other obtains an eroded blade by a sand injection wind tunnel experiment and studies it. An accurate extraction of the erosion model is the basis of accurate numerical simulation research. The combination study of the above two methods can obtain the erosion characteristics of the blade and the effect on the degradation of the aerodynamic performance.
The formation of the eroded leading edge shape in the real atmospheric environment is complicated, and the main damage forms include Solid Particle Erosion (SPE), Water droplet Erosion (WDE), coastal salt spray corrosion, and Cavitation Erosion (CE) [25]. The differences in the operating environments lead to different morphological characteristics, with coastal routes subjected to more raindrop erosion and salt spray corrosion, and inland routes subjected to more erosion by gravel, metals, and other solid particles. Compared with the real environment, the sand injection experiment in the laboratory is simpler and generally, the particulate matter (silica, alumina, etc. [26,27,28]) is blown into the engine or cascades at a constant speed for a number of hours. However, this method cannot accurately simulate the complex environmental factors in real operating conditions, resulting in discrepancies with actual eroded blades. Therefore, this section focuses on the blade leading-edge erosion morphology obtained by these two methods [6] and summarizes the simplified model of leading-edge erosion established by existing studies to explore the law of blade leading-edge erosion.

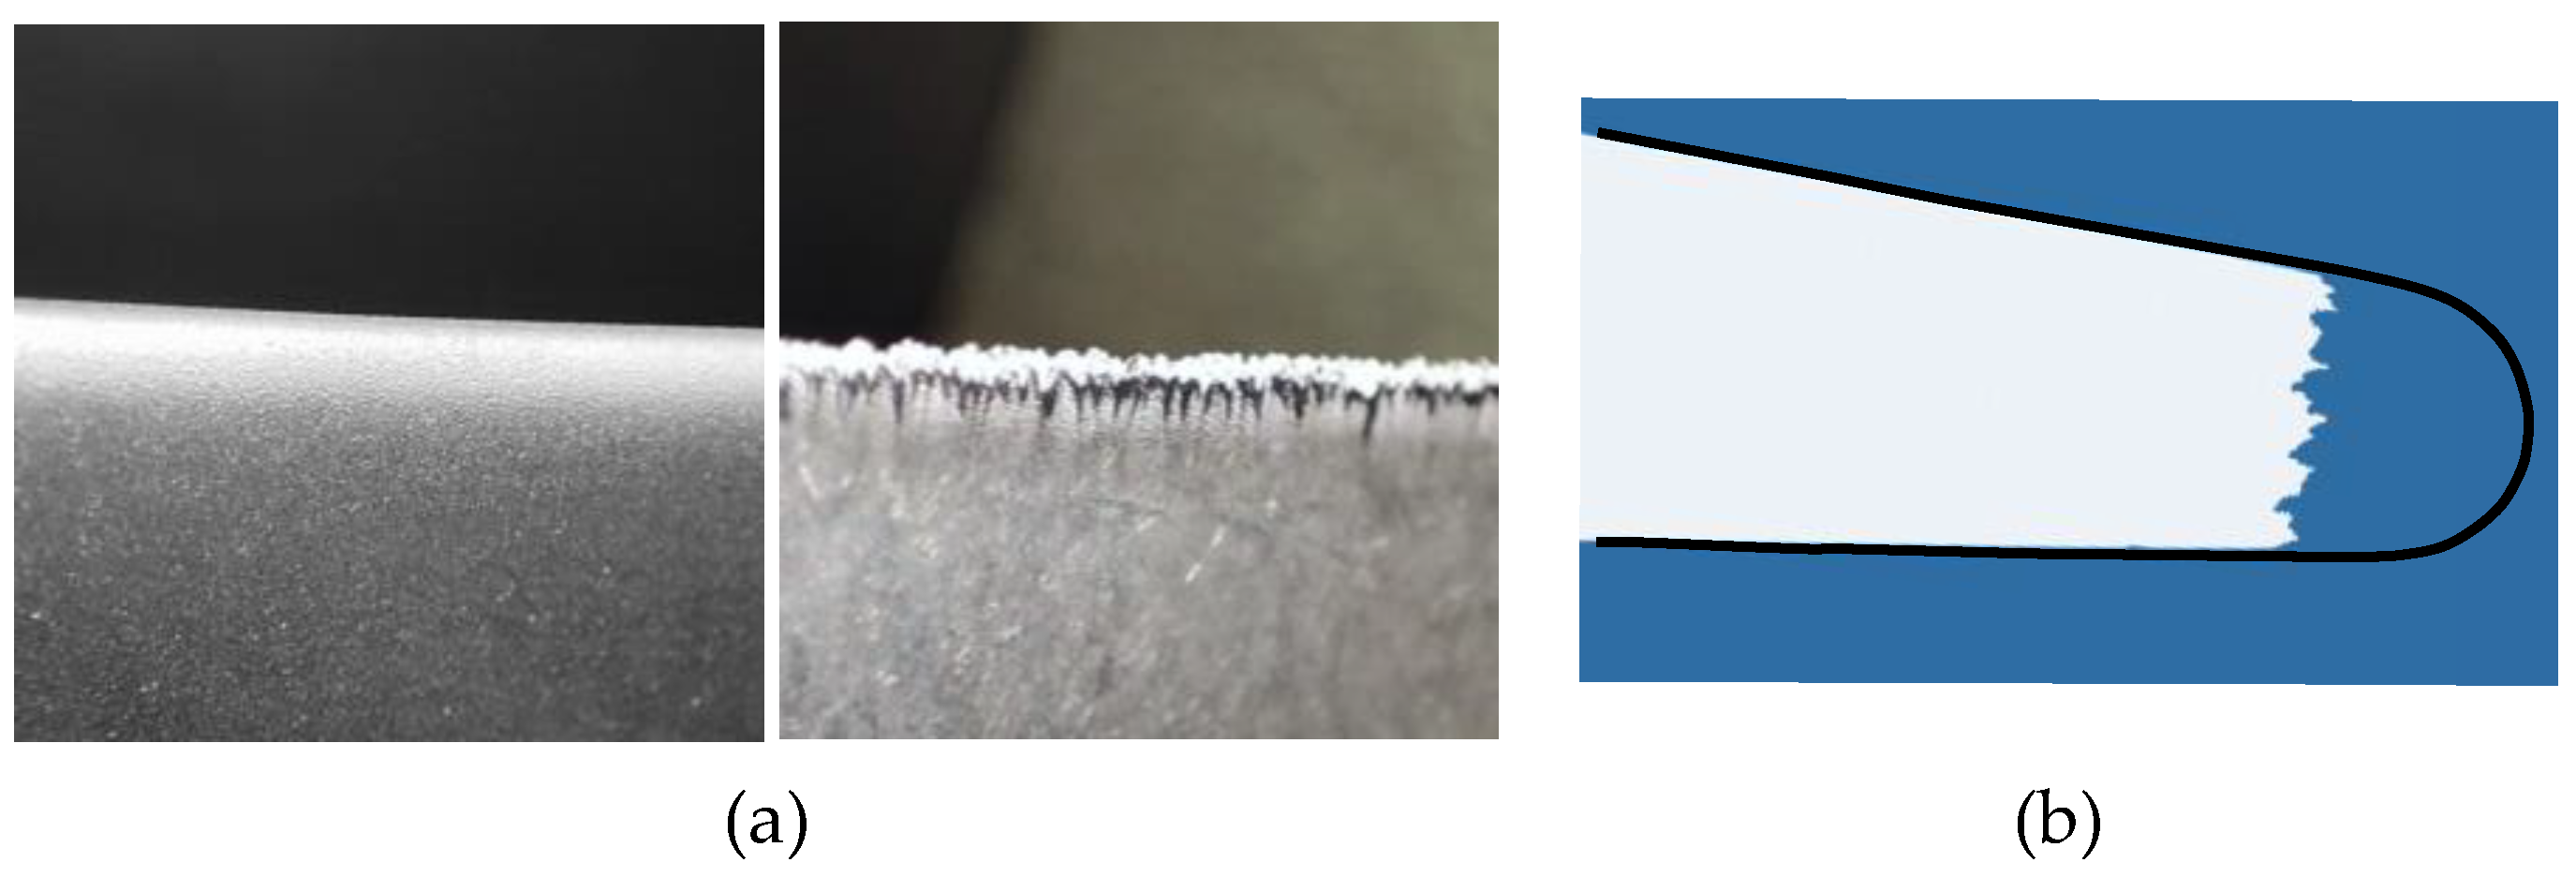
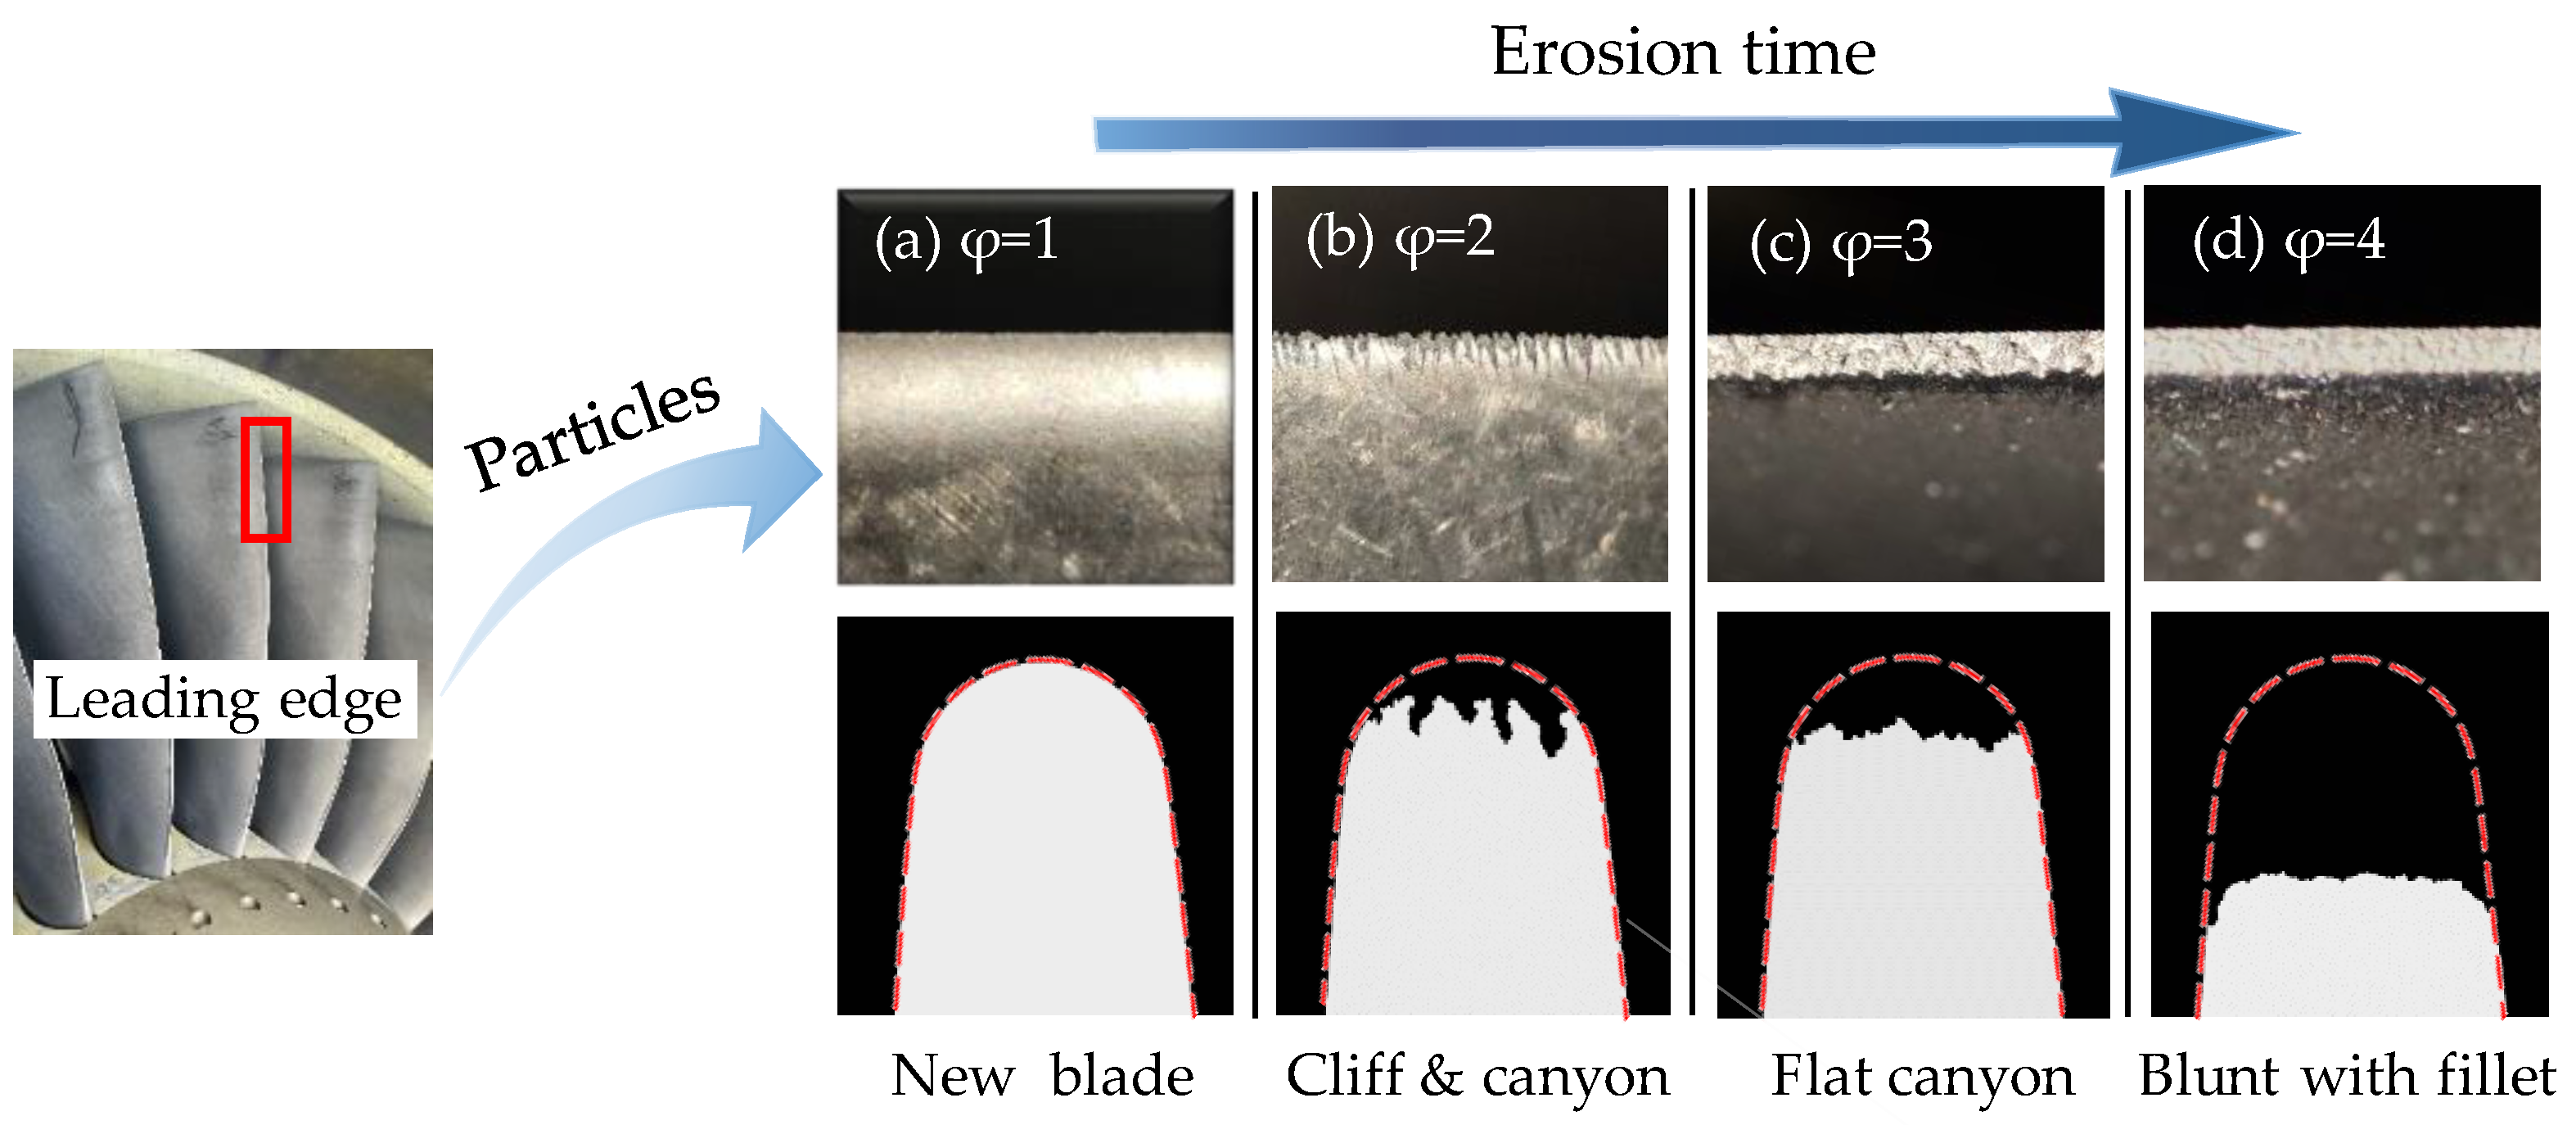
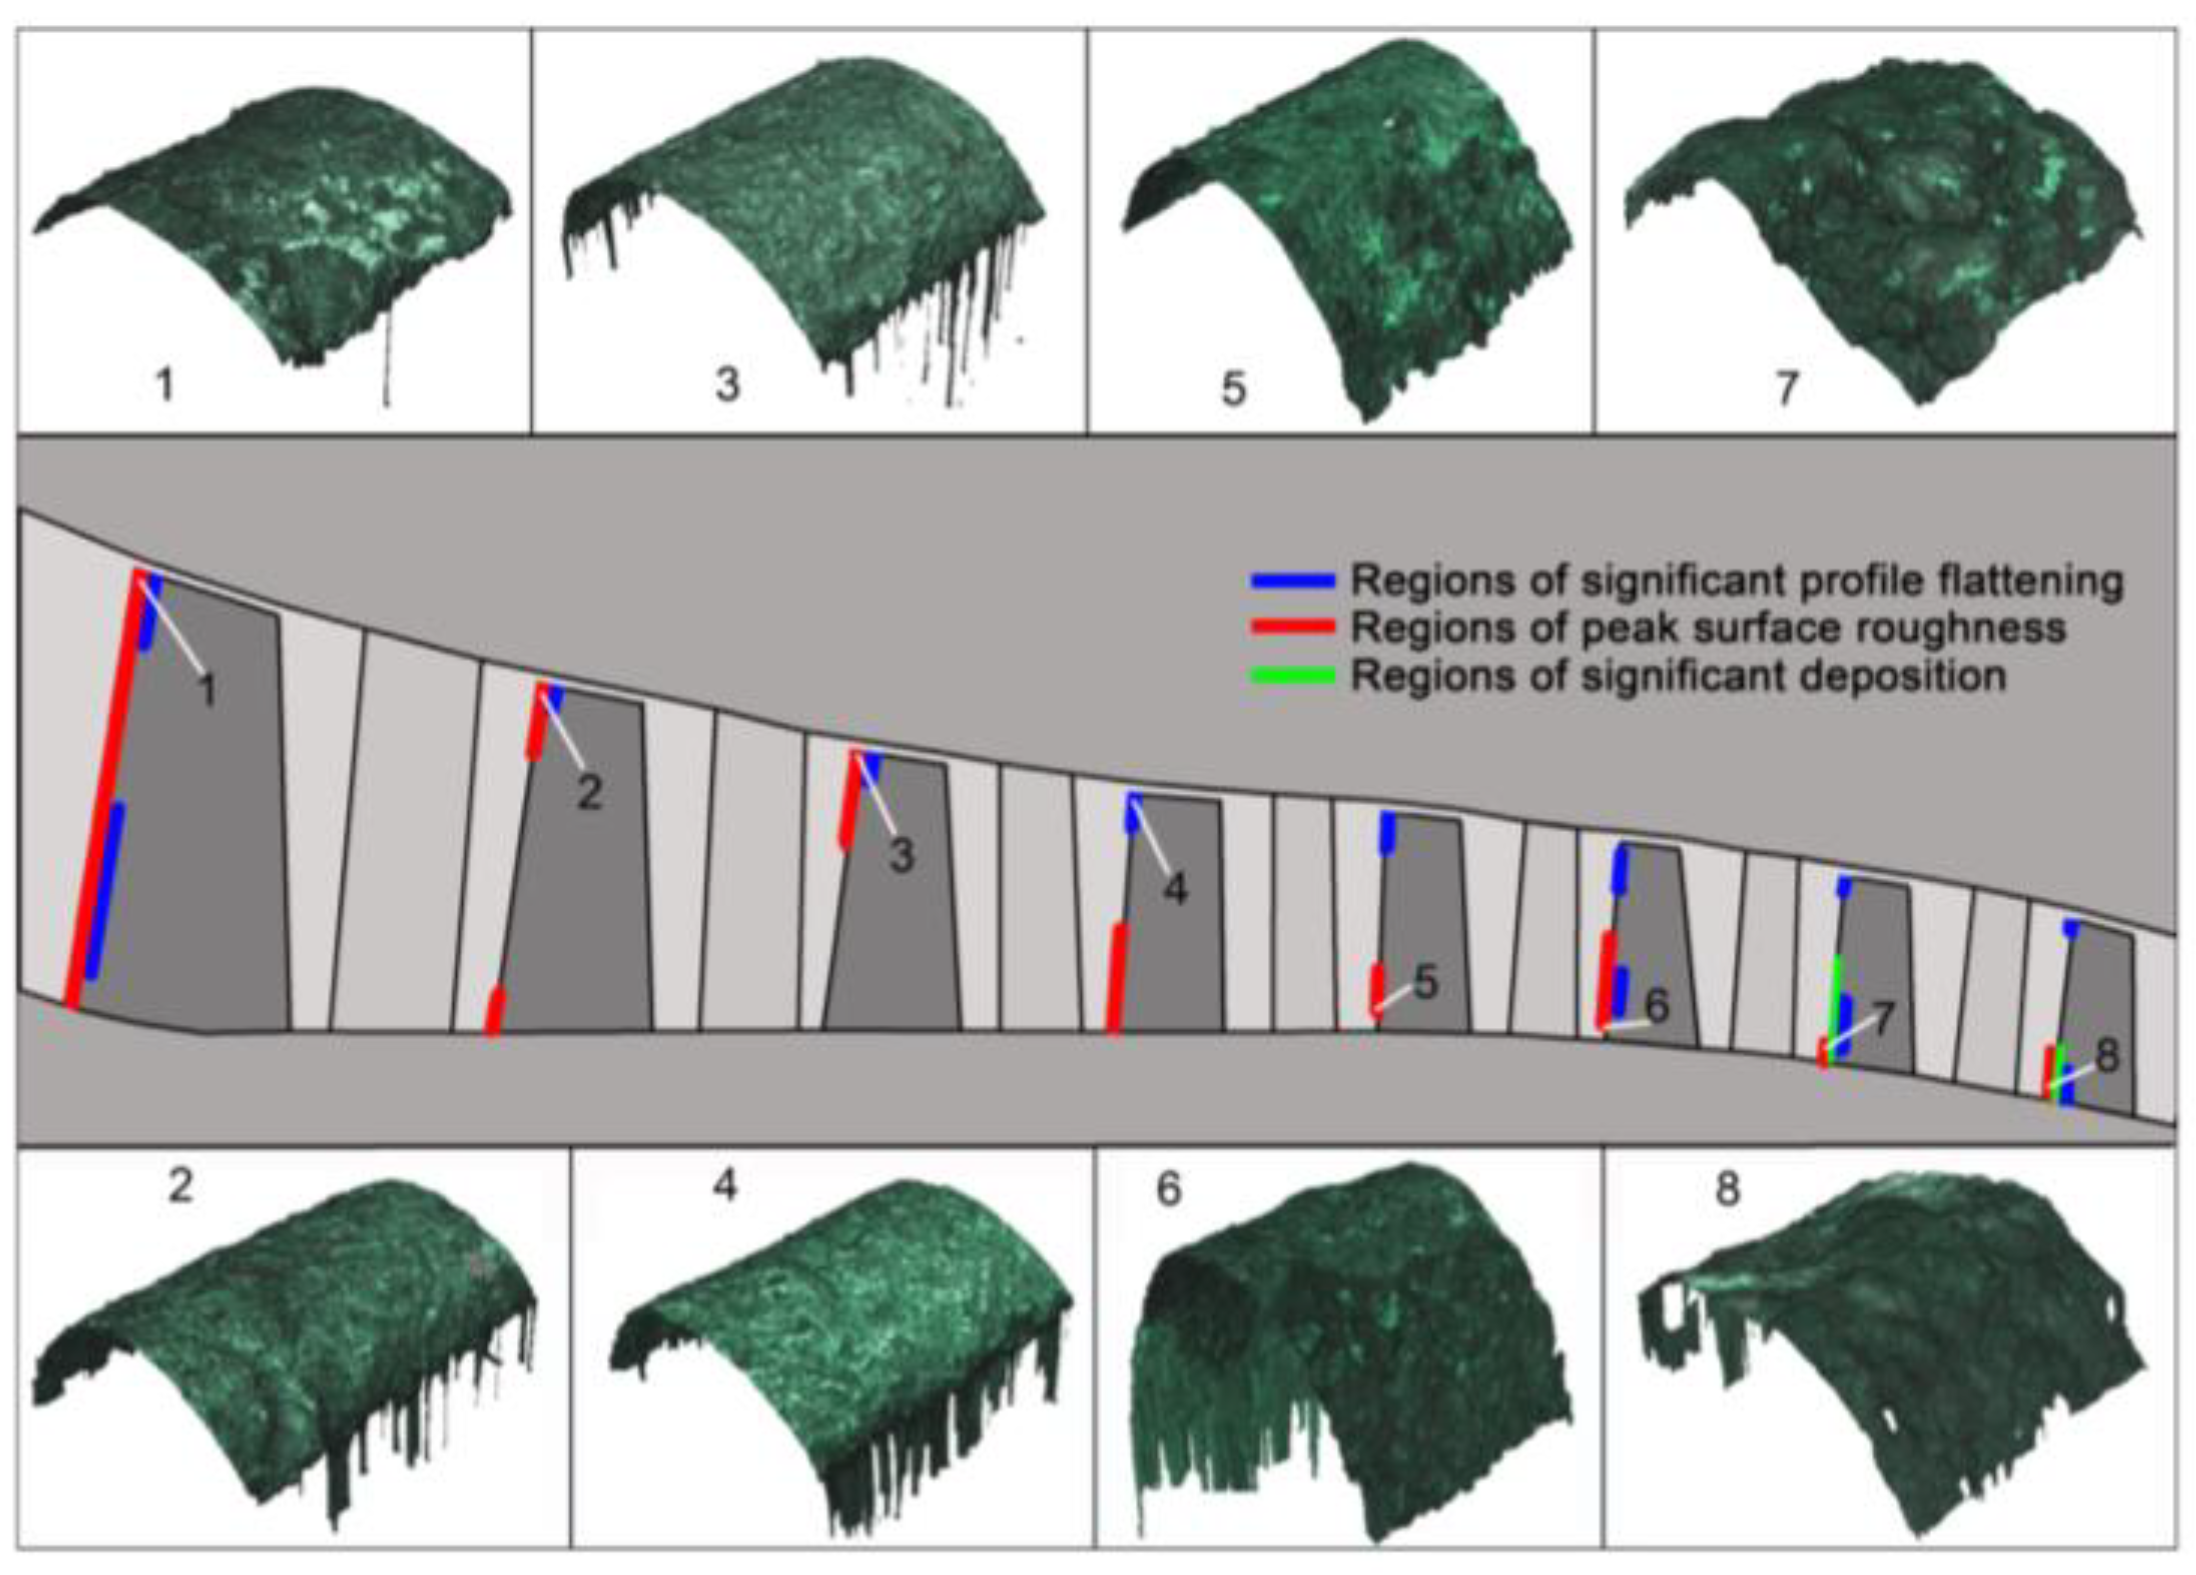
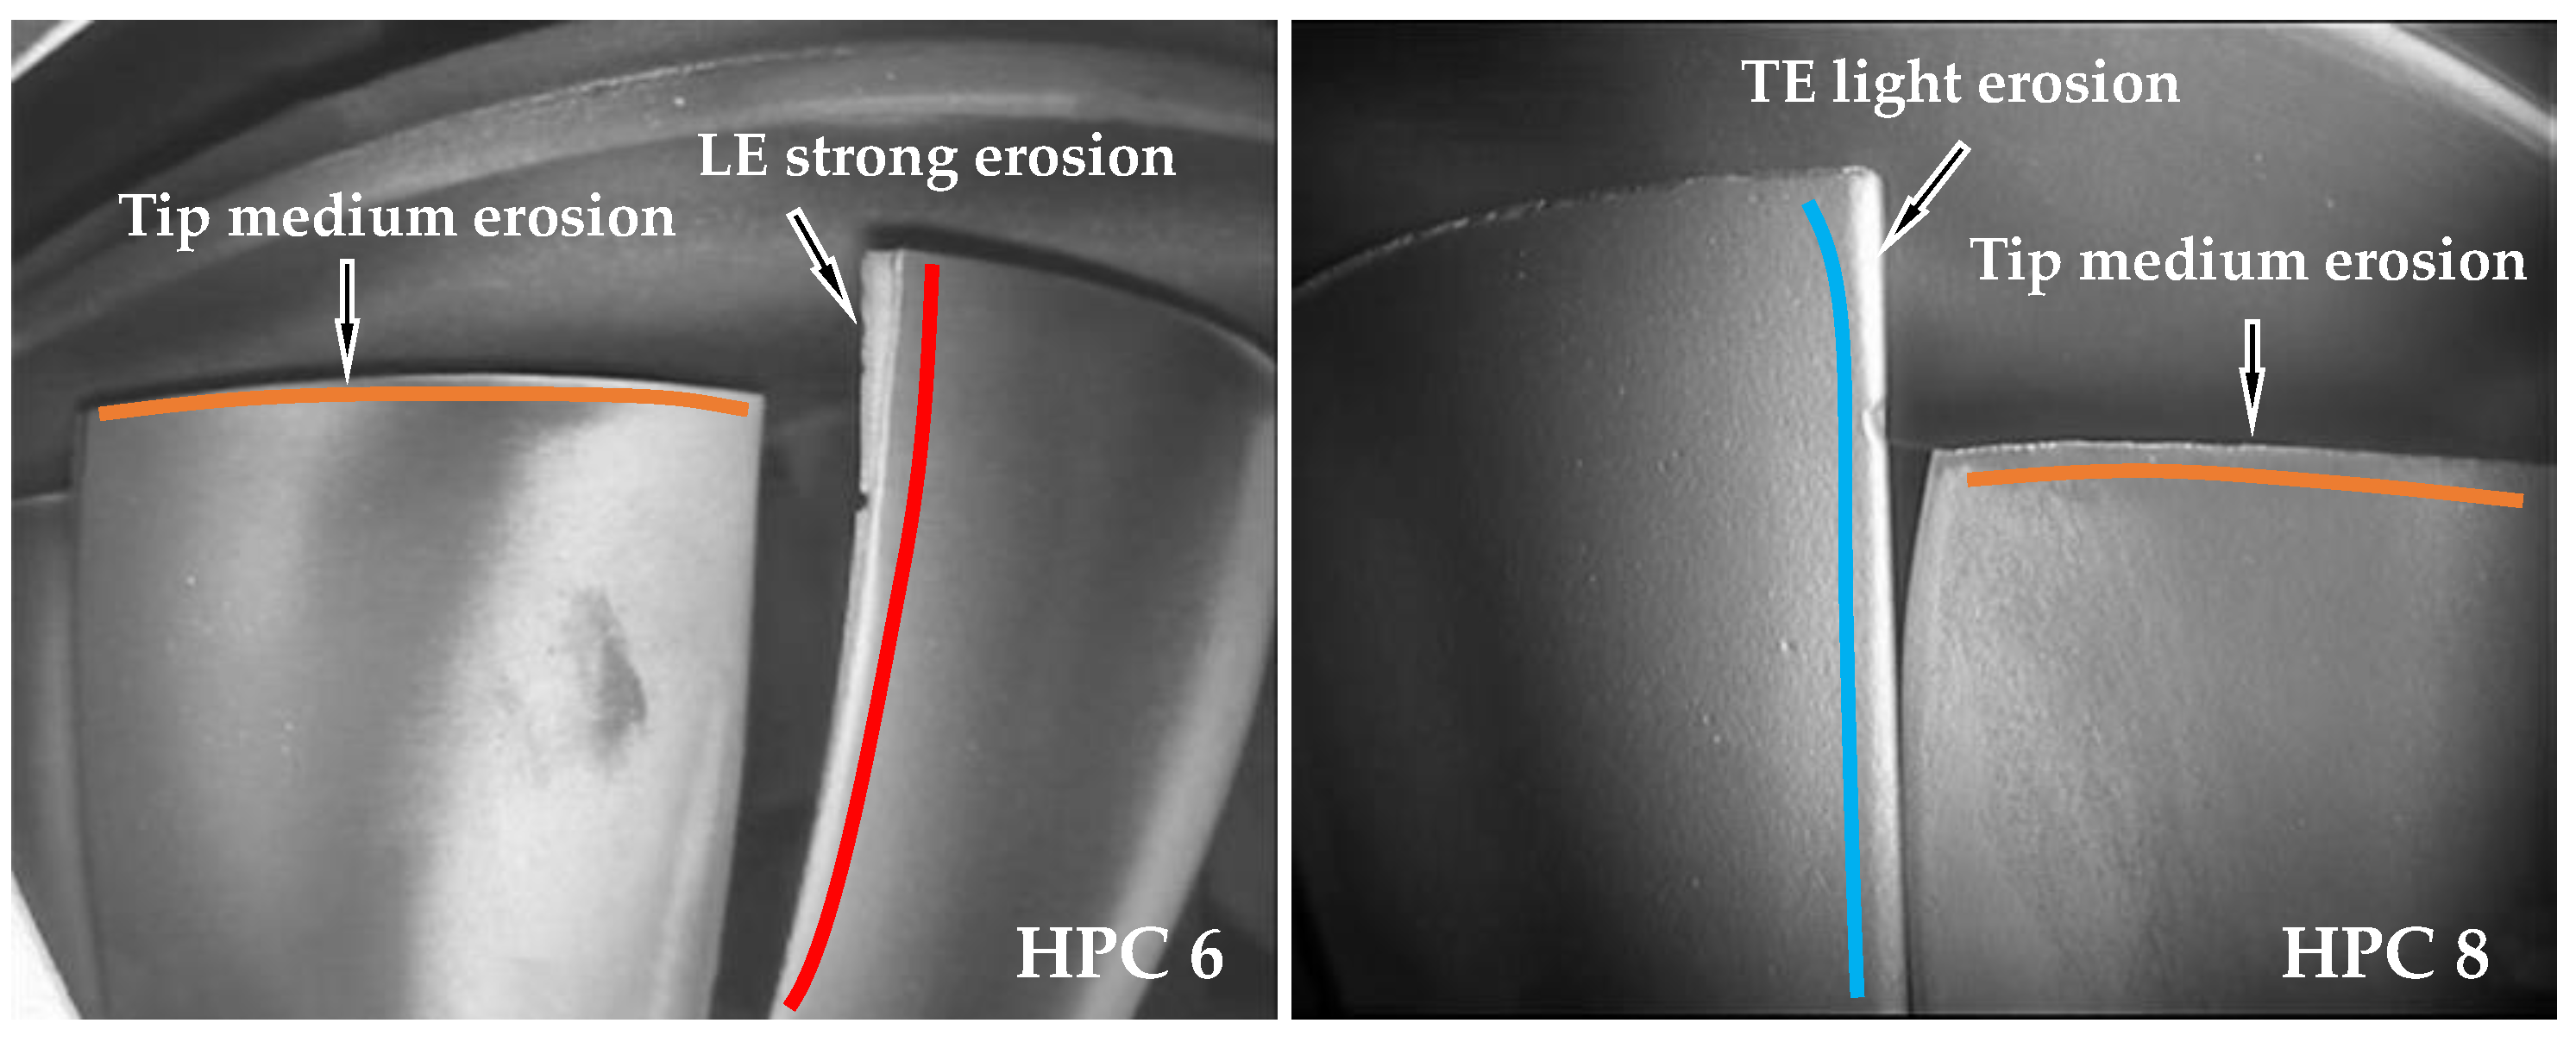
2.1. Real Eroded Leading Edge

The size of the blade is an obstacle to the study of blade leading-edge erosion morphology. Although the fan blade radius of turbofan engines can reach several meters, the radius of its leading edge is only a few millimeters, and the size of compressor blades is even smaller. Ordinary cameras can only capture the blade leading edge shape roughly, thus, non-contact optical 3D scanner equipment [8,29] is necessary to study the leading-edge morphology. Figure 2 shows the worn leading-edge morphology of compressor rotor blades and the comparison with the nominal blade leading-edge profile [30]. Compared with the reference blade, the worn blade geometry is degraded from the original smooth rounded leading edge to a blunt, rough leading edge, and there is an obvious discontinuity at the leading edge and blade body junction, leading to an abrupt change in the curvature of the blade leading edge. Although erosion caused the leading edge to change as a whole to a blunt shape, it does not lose all roundness because there is still a small fillet transition on the connection of the leading-edge platform and the two sides. For the complete blade airfoil, the most severe erosion usually occurs at the leading edge of the pressure side of rotor blades [31], while a small amount of abrasion exists around the front of the suction side, and there are almost no signs of erosion in the area from the middle of the chord length to the trailing edge.
However, the morphological characteristics of leading-edge erosion are not fixed and are closely related to the operating environment, flow conditions, profile quality of the original airfoil, operating time, and installation position of blades. The measurements of Hönen et al. [32,33] on the worn blades of the compressor rotors of a jet engine showed that there is a large variation range regarding the blade geometry. They summarized several typical erosion profiles of the leading edge, which can be seen in Figure 3 numbered from A to I, and show nine typical erosion profiles for compressor rotors blades caused by different operating environments. The profiles of the worn leading edges are almost cut off and show asymmetric deformation; and for all eroded blades, the maximum extension point is shifted backward from their original locations. For the eroded types A, B, and F, the leading edge is blunt and symmetrical with a difference in the roundness of the joint. For types, C, D, E, and H, the leading-edge stagnation point is shifted to the pressure side, while for I type, the maximum extension point is shifted to the suction side. Type D differs from other cases where the leading edge appears as a blunt platform, in this erosion case, the material loss on both sides of the leading edge is beyond the centerline, causing it to degrade into a sharper shape.
The erosion morphology of the leading edge of the fan and compressor blades evolves continuously with operation time. According to the erosion law and mechanism of typical aeronautical blade materials subjected to particles [34,35], the erosion process of the blade material successively goes through the transition period, the stabilization period, and the final erosion zone [36]. In the transition period, a large amount of material falls off the blade surface, and the erosion rate increases sharply and reaches a peak. In the stabilization period, the material wear tends to stabilize, and the amount of erosion is basically linear with time. In the final erosion zone, the mass of the lost material is a large amount. Ma [37] divided the evolution process of blade erosion into five stages by analyzing the material structure and the mechanisms of hydraulic penetration and chose to describe the morphological characteristics of the eroded leading edge using geographic topography terms. With reference to Ma’s approach, the leading-edge morphology of fan and compressor erosion blades over time can be divided into four typical stages in Figure 4:
  • New blade: original blade profile with no erosion at the leading edge;
  • Steep “cliffs” and “canyons” [37]: the leading edge material is sheared off by the impact of particles with a significant increase in roughness, forming large gullies;
  • Flattened “peaks”: the peaked material is flattened by further erosion processes, and the surface roughness is reduced;
  • Blunt platform with rounded connection: long-term erosion causes a reduction of the chord with the roughness decreasing significantly.
The leading-edge radius is an important indicator of the degree of leading-edge erosion in studies. For a nominal blade with a leading-edge radius of 0.0762 mm, the average radius of the blunt leading edge is increased to 0.254 mm by the time of scrapping, a nearly threefold increase in radius. In fact, maintenance tests during operation show that when the radius of the leading edge degrades to less than twice, its aerodynamic performance has deteriorated significantly. Compared to the design value, the high compressor rotor blades of a CF6-50 that was run for 1000 h showed a difference of up to 0.3 mm compared to the new blade thickness [38]. Therefore, the longer the time of erosion, the more severe the effect on the blade geometry. In addition to the blunt leading-edge shape, prolonged erosion also causes a reduction in the blade chord length [30,39].
For engine blades, the degree of leading-edge erosion is characterized by a spatial distribution. The erosion decreases the chord length of the blade from the middle to the tip span, and the underlying reason is that the material erosion rate is exponentially related to the impact velocity of the particles [40]. At the high span, the relative velocity between the leading edge and particles is relatively high, so the impact load of particles increases, resulting in serious plastic deformation around the impact crater. The material of the leading edge is likely to fall off, and it makes the blade erosion rate increase, therefore, the tip region has a much higher erosion degree than other regions. Ma et al. [37] examined the root, middle, and tip cross sections of blades of a set of ex-service turbofan engines to obtain the shapes of the eroded leading edge. As the impact velocity increases, the leading edge shape gradually deteriorates with increasing impact velocity, and the degree of material removal increases significantly when the impact velocity exceeds 246 m/s, as shown in Figure 5. Another study [41] established the relationship between the impact velocity and the erosion rate using Equation (1) and observed that the WDE damage showed a significant increase in the range of impact velocities from 286 m/s to 348 m/s, which explains the increase in the degree of erosion starting from the leading edge in the middle span of the blade. However, when approaching the blade tip, the leading edge is little affected by erosion despite the impact velocity approaching 400 m/s. It is thought that this is mainly attributed to the shielding effect of the nacelle [42]. Regarding this phenomenon, it is also considered that the leading edge at the blade tip is protected because of the boundary layer formed by the airflow at the top clearance of the blade which prevents particles from impacting the blade surface.
v 2 v 1 ( V 2 V 1 ) 8.15
Erosion is also characterized by the spatial distribution of blades at different stages. Walton [8] measured the Intermediate Pressure Compressor (IPC) blades of a retired compressor. Figure 6 shows the spatial arrangement of leading-edge peak roughness and regions of the profile flattened due to erosion for an IPC of 8 stages. The particulates entering the IPC have not yet been subjected to any significant fragmentary or centrifugal action, and hence they are relatively large and uniformly distributed, so the overall leading edge of the first stage blades showed a relatively uniform roughness, with the leading edge showing significant wear below mid-span and at the tip. All IPC blades exhibit profile flattening erosion the same as the surface roughness at the blade tip. The last stage of the compressor is the most critical component, where the effects of any blade degradation are first felt, as it determines the flow margin of the engine and is the first component to stall [11]. For the last two stages of the blades, particulates deposit at the root of the blade, and fouling and erosion phenomena act together at the leading edge. The morphological measurements on compressor rotor blades carried out by Goodhand [43] showed consistent results. In the first stage, the compressor rotor blades suffer the most pronounced erosion between the tip and the middle span, and for the subsequent stages, erosion only has a pronounced effect on the blade tip and root regions.

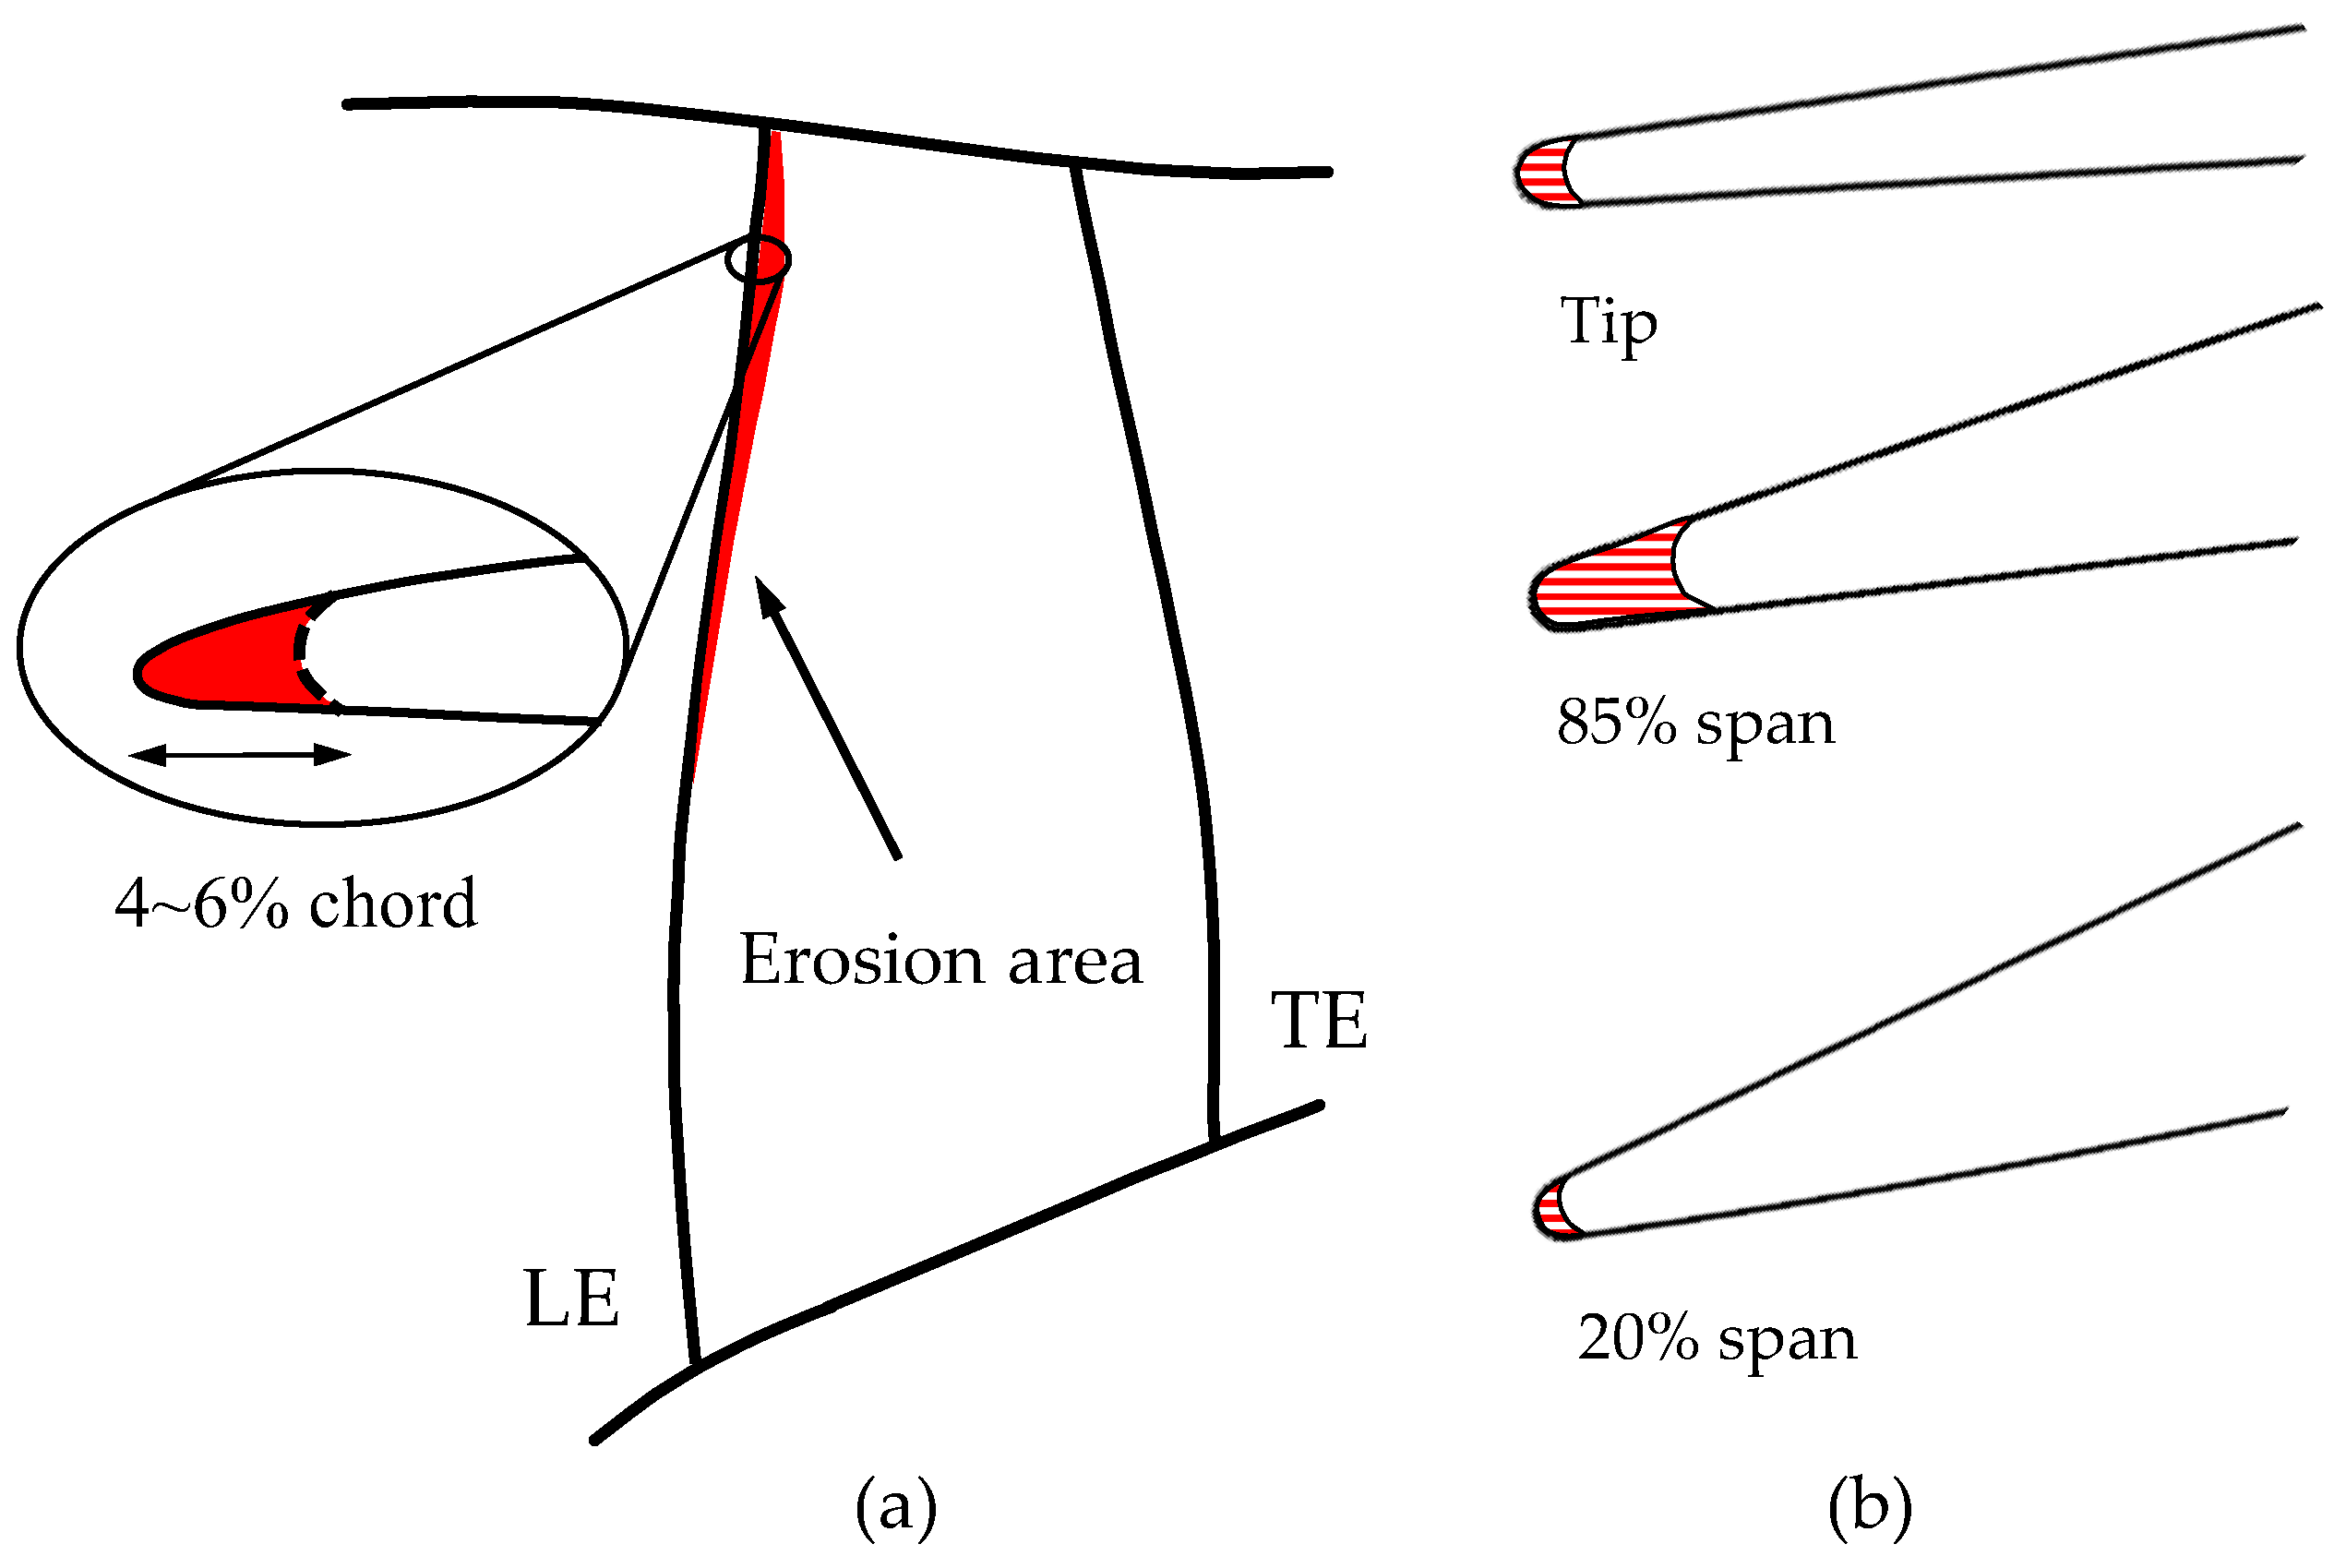
2.2. Laboratory-Eroded Leading Edge

Erosion tests at high altitudes can be a threat to the safety of the crew and environmental factors are uncontrollable and uneconomical. Therefore, erosion tests are often carried out under controlled laboratory environments to better monitor and record the detail of the degradation. The classical experimental methods for obtaining eroded blades include sand injection tests, blade leading edge cutting, and blade coating.
The sand injection experiment is the most commonly used because the erosion characteristics obtained are the closest to the real condition. It mixes particles with airflow into the inlet through a particle injector. Many factors, including the impacting particle size [44,45], impingement angles [34,35], and impact velocities [36,40,46] affect the erosive wear rate of the blade leading edge. Compared to fouling experiments, which generally use particles such as salt spray [47,48] or flour [48,49] and do not affect the blade shape further, erosion experiments generally inject hard materials such as quartzite [45] or volcanic ash [50]. The results of available studies [51,52] have shown that, except for the leading edge deformation and chord length shortening, erosion also results in a uniform removal of both pressure side and suction side materials from the rotor blades, a reduction in overall blade thickness, deformation of stagger angle, and widening of tip clearances. For fans and compressors, the leading edge is the most severely eroded area. Balan and Takeoff [53] conducted experiments on particle erosion and summarized the characteristics of the eroded blade shapes of the tests.
  • An erosion step formation on both sides of the blade, and the leading edge is flattened and rougher;
  • The pressure side of the airfoils is eroded more severely;
  • The surface roughness of a small region immediately following the leading edge is increased.
Regarding fan and compressor blades, the particles mainly impact the pressure side and cause severe effects on the surface, forming rough surfaces at 0° or positive incidence. In fact, the pressure side bears less load and the roughness of the surface influences the aerodynamic performance less than the leading edge.
The first rotor blades are the most eroded and rotors are generally subjected to more severe erosion than stators [4]. The particles inhaled into the real engines will be broken into finer particles after collision with front stage blades, which reduces the severity of impact on the downstream row of blades. Ghenaiet [45,46,51] conducted sand injection experiments on compressor blade rows, including IGV and rotor blades. Due to the high circumferential velocity and relative flow velocity of transonic machinery, a large number of particles hit the rotor blades and result in high wear on the leading edge. On the pressure side, due to imparted centrifugation and infiltration, the erosion tends to be heavy from the root to the tip, as shown in Figure 7. The primary erosion regions are the tip and shroud but there is no damage on the hub. On the suction side, erosion is concentrated near the leading edge of the tip corner. The airflow with particles at the tip of the blade migrated from the pressure side to the suction side through tip clearance, resulting in a significant increase in the tip clearance and the formation of burrs towards the suction side. The IGV blades receive many impacts on the pressure side of the blade tip near the trailing edge. The same erosion distribution characteristics were obtained by Suzuki [10] who noted that the effect on the flow field caused by the erosion of the blade profile dominates compared to the blade tip clearance.
In fact, the sand injection experiment is complex and extremely expensive to perform using a whole engine, and because of the destructive nature of the tests, very few engines are available. Only a few sand injection tests have been performed on a whole engine in the laboratory. Dunn et al. [54] conducted engine dust injection experiments for the turbofan engine TF33 and the turbojet engine J57. Soil mixtures as well as volcanic ash were chosen as the particulates for injection. During these experiments, they photographed the apparent glow on the surface of the fan and compressor blades, called St. Elmo’s glow or fire. This is a phenomenon caused by the accumulation of electrostatic charges on dust particles and running metal surfaces. Similar erosion characteristics to other experiments were observed. The difference was that the blade tips obtained by Ghenaiet’s compressor system experiments [46] had a more round shape in contrast to Dunn’s experiments which showed the formation of sharp points at the blade tips. The formation of the sharp tip is because the pressure side material is heavily worn while only a small amount of material on the suction side is removed. In addition, the rotor blades used in Ghenaiet’s experiments were thicker and less prone to sharpening. The Figure 8 shows erosion damage of compressor blades.
The direct erosion modeling of the blade leading edge greatly simplifies the process of erosion and facilitates the study of erosion’s influence on aerodynamic performance. The reasonable erosion models determine the reliability of the results. Early studies directly cut the leading edge of the blade to simulate the shape of erosion. Reid [10] et al. cut the chord length by 0.128 inches (leading edge radius 0.02 inch) at the shroud, decreasing the chord length loss linearly along the height until 0 inches was cut at the hub. This construction method fundamentally considers the reduction of chord length due to erosion. Robert [12] used the same cutting chord model. They cut the blade leading edge and reduced the chord length of the blade gradually from the mid-span to the tip region, limiting the chord length after erosion to between 94% and 96% of the nominal chord length, as shown in Figure 9. Robert considered more than simply cutting the leading edge of the blade to make it into a blunt blade, optimizing the eroded leading-edge shape as a rounded shape and letting the blade surface become rough and twisted, making it more compatible with the characteristics of a real eroded blade.
Elmstrom [55] suggested that although the blade coating is essentially an additive method, the leading edge shape obtained from this treatment applies to the non-design deformation problems of the leading edge such as manufacturing tolerances and in-service erosion. The application of a liquid coating at the leading edge results in “picture framing” or “fat edge” due to the physical force of surface tension, where the leading edge becomes uniformly blunt by the action of the coating, which is shown in Figure 10. Suder [56] coated both the pressure and suction sides of rotor blades and found that the leading edge-coated configuration suffered a significant performance degradation. The primary performance degradation of the coated blades was caused by the increased roughness and thickness due to the coating of the first 10% chord length.

2.3. Models of Erosion Leading Edge

Since erosion was first considered in the field of turbomachinery, scientists have tried to model the erosion process based on material properties [4,44] and other experimental parameters, including the geometry of flow paths and target blades, particle impact angles [57], and velocities related to rotor tip [58], to predict the behavior of different materials during erosion [7]. Since a large number of studies have been conducted and many classical erosion models have been obtained in the field of erosion mechanisms, it is beyond the scope of this article to convey all the existing models for predicting erosion behavior. Therefore, in order to provide a basis for the important criteria related to erosion, the classical theory of Tabakoff [59] is presented.
Since the trajectories of high inertia particles deviate from the flow direction and affect the blade surface, the erosion model incorporates empirical particle-gas and particle-surface interaction models. The trajectories of the particles are determined by the stepwise integration of their equations of motion in each blade row reference frame:
d u ¯ p d t = F D ( u ¯ u ¯ p ) + g ¯ ( ρ p ρ ) ρ p + F ¯ R
Neglecting interparticle collisions and considering particle rotation drag as the main aerodynamic force on high-inertia particles:
F D = 18 μ ρ p D p 2 C D R e 24
According to this model, the erosion rate (ER) of the blade surface is:
E R = K 1 f ( α ) v i m p 2 cos α ( 1 R T 2 ) + f ( v i m p 2 )
with
R T = 1 0.0061 v i m p sin α
f ( α ) = { 1 + K c [ K 12 sin ( π 2 α α 0 ) ] } 2
f ( v i m p ) = K 2 ( v i m p sin α ) 4
The estimation of the thickness of the eroded material can be calculated by the eroded mass through simulations:
e = E R f u n p m p ρ S
Erosion in practical applications is a long-term process during which erosion is affected by changes in eroded blade geometry, which in turn causes the flow field to change with erosion. In past numerical calculations, erosion predictions were based on erosion rates which do not vary with the evolution of the erosion process. However, erosion rates calculated in this way can only be used to simulate the beginning of the erosion process when the target geometry has not yet been affected by erosion. To improve this problem, Castorrini et al. [60] developed a new model based on adaptive boundaries and erosion scale factors that not only solved the problem but also made the simulation process faster.
Assessing the erosion effects and performance degradation of turbomachinery needs to be combined with experimental methods and numerical simulations, and the prerequisite is to establish a scientifically reasonable leading-edge erosion model. It is not possible to carry out studies on all leading-edge erosion shapes, thus extracting models based on limited eroded blades is an effective research method. Since the early erosion studies, scientists have made a lot of attempts in modeling the erosion leading edge. Based on the previous studies, the models of the eroded leading edges of fans and compressors used in studies of the last 20 years are summarized in Table 1.
It was found that leading-edge erosion would lead to a shortening of the chord length of the airfoil and blunting of the leading edge, but the exact representation of the shape of the eroding leading edge varied. Roberts [12] increased the radius of the round leading edge and shortened the chord length to represent leading edge erosion characteristics, but there were significant differences with the original leading edge. Giebmanns [39,61] and Hergt [62] cut the chord length of the blade at the leading edge by 1% and 1.1%, respectively, and Li [63] and Shi [64,65] reduced the chord length by 0.2% and 0.1%, respectively; they all established simple blunt leading edges as erosion models. However, the blunt model has drawbacks because the sides of the leading-edge platform of the blunt model form sharp angles with great curvature and discontinuity, whereas wear in practical applications does not produce sharp angles. Sayma [42] and Li [66] et al. introduced a rounded fillet at the junction of the leading edge and blade body based on the blunt model, and Höenen [32,33] classified the leading edge of ex-service blades into nine types based on the form of the leading edge extension point and the connection with the blade body, which can basically summarize all the erosion leading edge shapes. The above descriptions of erosion leading edge morphology do not consider the complex rough surface characteristics of the leading edge. Ma [37], Walton [8], and Giebmanns [30] found differences in the roughness of the erosion leading edge for different blade sections of the fan and compressor based on the measurements of the leading edge morphology, Kumar [67] combined the Hicks–Henne function with a cubic polynomial function to construct the leading edge of rough airfoils. In addition, Elmstrom [55] proposed a family of curves to represent the shape of the undesigned shape changes of the leading edge.
Table 1. Leading edge erosion models established in the past 20 years.
TimeAuthorSubjectResearch MethodLeading Edge Erosion Model
2001Hönen [32,33]CF6-50 turbofan HPC rotorsARP procedure with operation dataNine types of eroded LE
2002Robert [12]NASA Rotor35ExperimentsStarting at mid-span and 5% cutbacks of the chord at the tip with recontoured round shape
2003Sayma [42]Modern civil fan bladesCFD
Unsteady RANS
Chordal cutbacks of 0.33 and 0.66%, blunt shape with a rounded junction of the sides
2011Elmstrom [55]NACA 65(12)10 airfoilRVCQ3DA family of curves h(s) represent the possible leading-edge coating profiles
2012Giebmanns [39,61]Aero-engine fan bladesCFD
Steady 3D using DLR’s TRACE code
Blunt LE (eroded blade); blunt LE with a reduced chord (long-term eroded blade); reduced chord length but reshaped LE (long-term eroded but repaired blade)
2014Hergt [62]Transonic fan blade cascade at 85% spanwiseExperiment and CFD DLR’s TRACE codeBlunt LE with a chord length reduced by 1%
2015Giebmanns [30]Compressor rotor bladesCFD
TRACE code
LE profile defined by a shape parameter SPLE on the connection point; 3D LE shape defined by the radially stacked airfoil section
2018Li [63]Compressor bladesExperiment and CFD Q3D using CFX12.0LE removed at 0.2% chord length forming a zero-curvature platform
2019Shi [64,65]DGEN380 fan bladesCFD
Steady 3D
Blunt LE; 120µm and 250 µm loss of chord length at LE
2020Lai [68]NASA Rotor37CFD
Steady 3D
Abrasion of 1 and 2 mm along centerline direction; rounded junction for all blade heights
2022Li [66]Compressor cascadesExperiment and CFD Q3D using CFX12.0Blunt LE with 0.2% of chord length cut; wedge LE with 0.2% of chord length cut
2022Gunn [69]Transonic fan rotor bladesExperiment and CFD Turbostream solverSquared-off and blunt LE; zero damage below 65% span, a maximum truncation at 70–80% span, and slightly reduced truncation at the tip
LE means leading edge.
The scale and appearance of the leading edge degradation are dependent on the engine’s time on-wing, flight ratio, and area of operation [29]. According to the above studies, the chord length shortening of the eroded blade varies in the range of 0.2% to 5%, while the scrapping boundary of blades in maintenance manuals is generally in the 6% to 8% range [12,33]. The current analysis of actual erosion leading-edge morphology characteristics is mostly based on the qualitative description, lacking scientific expression methods and accurate analysis means. Due to the differences in the operating time and flight environment of aero engines, the leading-edge erosion shows a certain degree of randomness, making it difficult to generalize and extend the leading-edge erosion morphology results towards studying a specific blade. The investigation of blade leading edge erosion needs a more scientific representation method to represent the erosion morphology at different stages of the erosion derivation process.

3. Aerodynamic Performance Degradation Caused by Erosion

3.1. Cascades

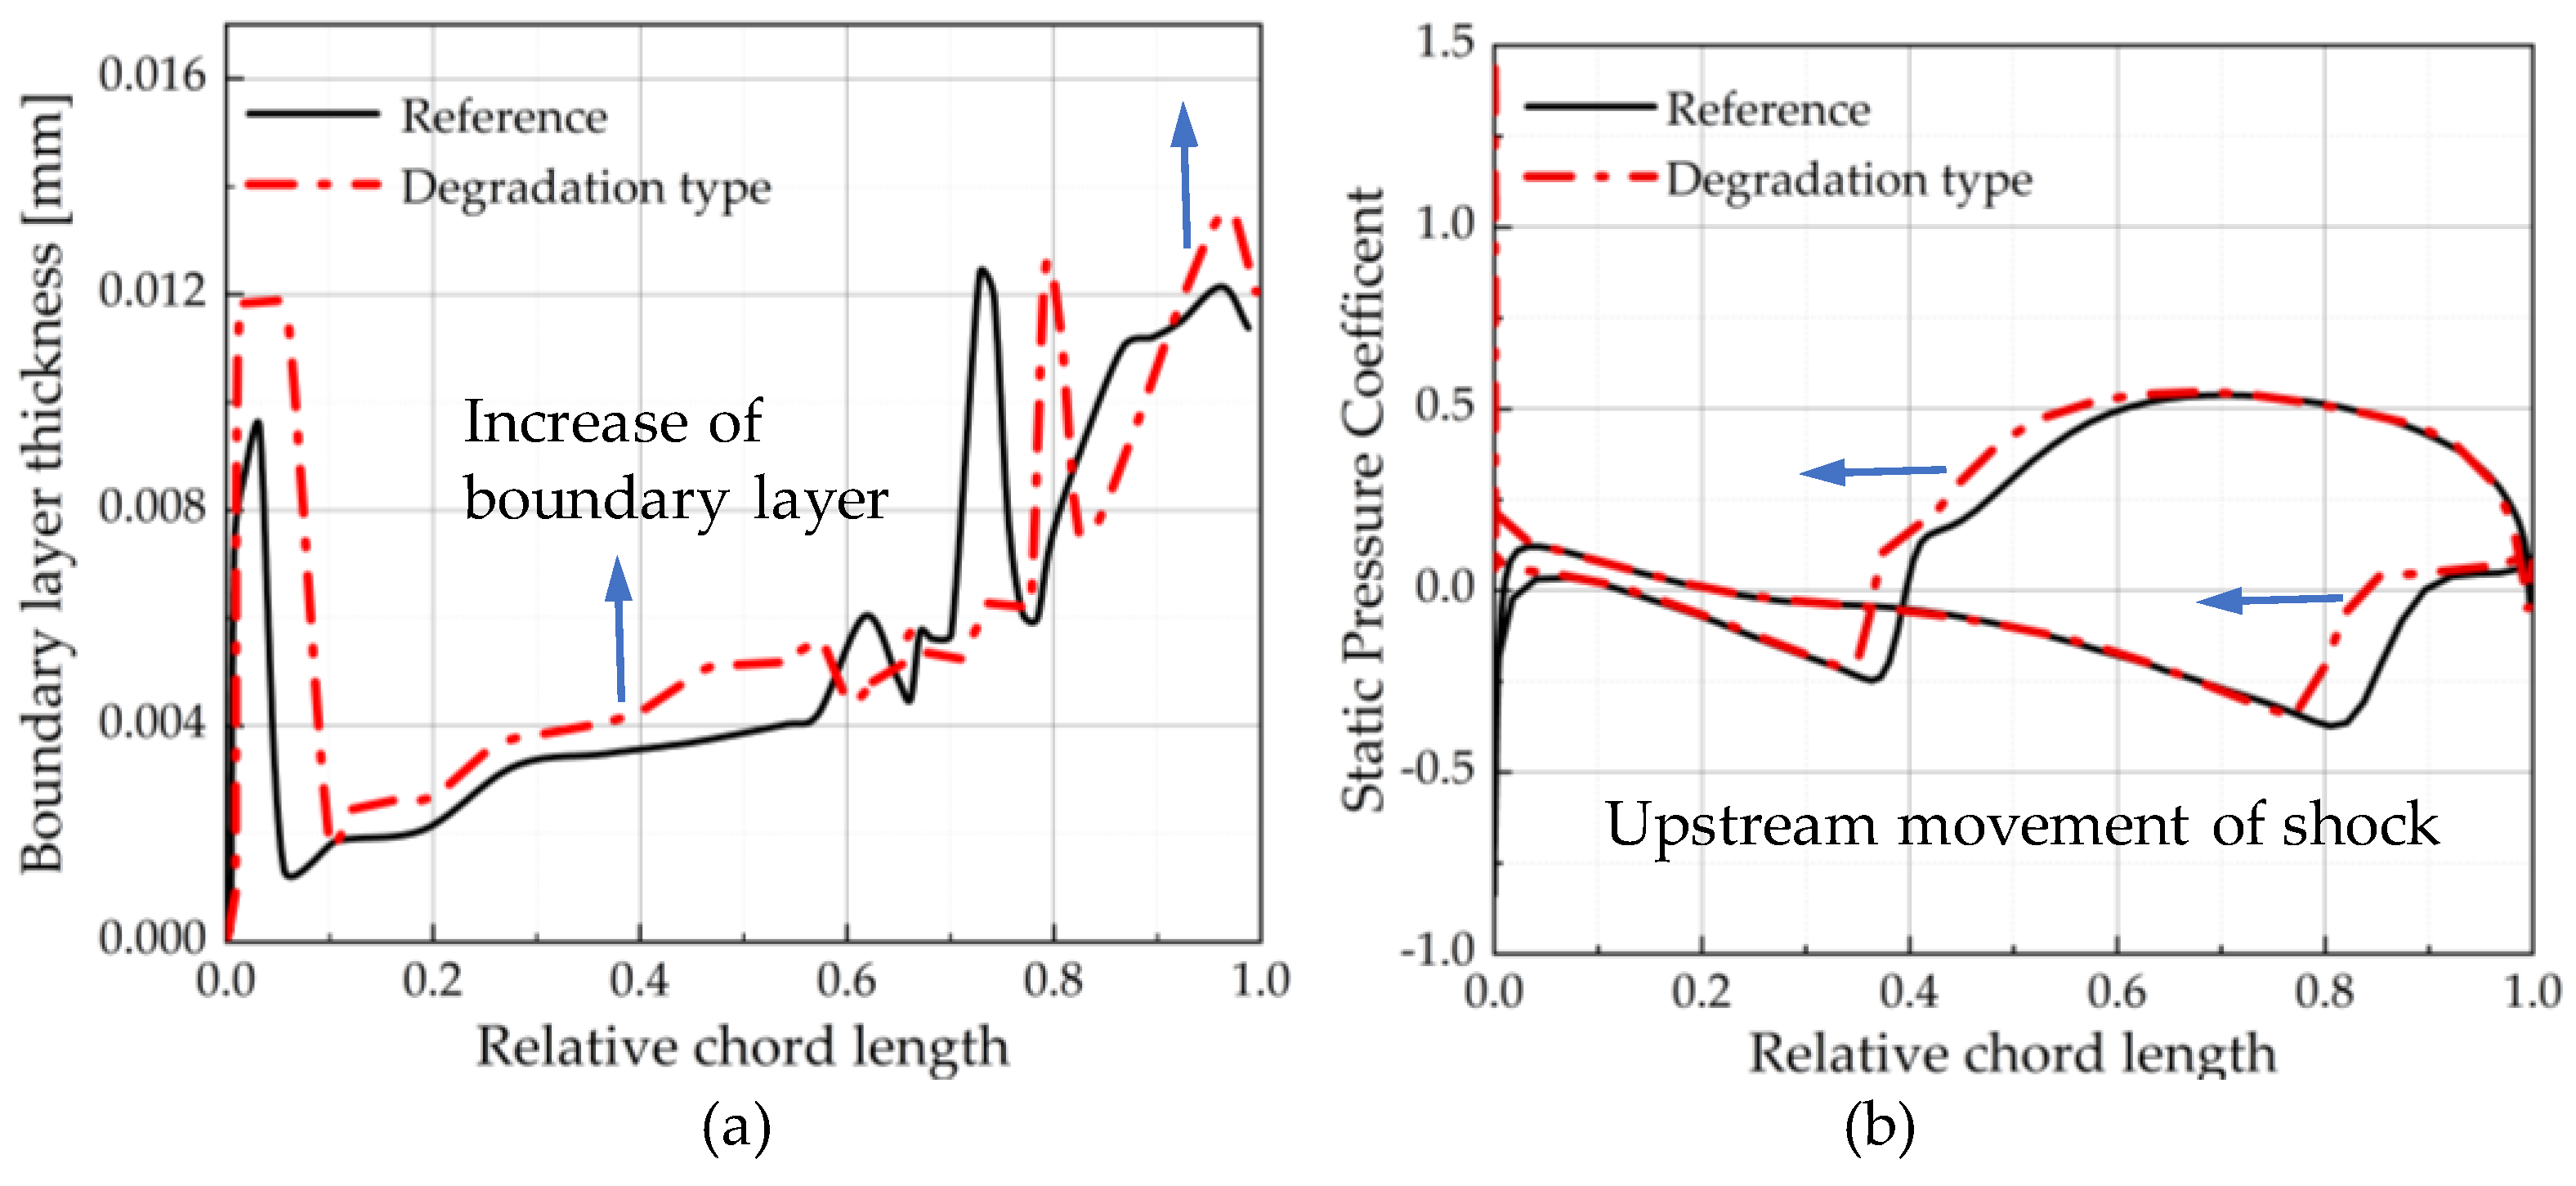
3.1.1. Subsonic Airfoils

The continuous curvature leading edge can effectively suppress the separation of airflow [70,71]; for this reason, the curvature of the continuous leading edge has been widely used as soon as it appeared. Studies have shown that elliptical leading edges have significant advantages over circular shapes [19,20,72,73] because the elliptical shape can optimize the curvature of a leading edge well at the junction, while the discontinuity of the curvature of the circular leading edge induces the airflow separation and the formation of separation bubbles, which causes an increase in profile loss. Erosion leads to the irregular geometry of the leading edge, step changes in curvature as shown in Figure 11, and the consequent deterioration of the flow field around the leading edge.
When the incidence angle is positive, the airflow separation is more drastic for eroded blades than the original blades, and the extreme curvature of the blunt leading edge causes pressure spikes [74] which accelerates the boundary layer separation and transitions. At the design point, the leading edge separation of the original blade may be more severe than that of the blunt leading edge [66]. This is because the presence of the zero curvature platform of the blunt leading edge shortens the distance from the stagnation point to the separation point, and the velocity pattern inside the boundary layer of the platform part can be well maintained, which has a certain delayed effect on the separation [75]. With the interaction of pressure spikes and the blunt platform, the eroded leading edge suppresses airflow separation and the transition of the flow at 0° incidence. The effects of the eroded leading edge on the boundary layer are mainly at the suction side of the blade. When significant separation does not occur at the suction side, the eroded leading edge has little influence on the airflow separation.
The damage to the leading edge changes the static pressure distribution on the surface of the blades [51]. For subsonic airfoils, it is mainly reflected in the front 15% relative chord length regions [63,72], especially in the suction surface, and the difference grows with the increase of the incidence. Figure 12 shows the static pressure coefficient distribution on the suction side with an incidence angle ranging from 0° to 7°. The separation position of the original blade tends to be stable after the incidence increases to a certain degree, but the degraded blade forms severe double suction spikes at large incidences, which cause a strong inverse pressure gradient and poor flow conditions. The separation bubble characteristics are obvious and accelerate the transition of the laminar boundary layer into the turbulent boundary layer, leading to increased friction losses inside the boundary layer.
The geometric variations and significant length scales around the leading edge, including the thickness and radius of the curvature of the leading edge, show a strong nonlinear response to performance. The flow is especially sensitive to the leading edge profile [76]. The geometric variation of blades away from the leading edge is small relative to the chord length scale variation, and their effect on performance is a linear response. For subsonic airfoils in Figure 13, the geometric degradation of the leading edge at a small incidence range has little effect on the total loss because the eroded leading edge has little effect on the boundary layer when the flow does not separate significantly at the suction surface; this little effect is not transmitted downstream. As the incidence angle increases, the effect of the blunt leading edge appears progressively, the boundary layer thickens rapidly and then the effect of leading edge deformation will be transferred to the whole flow field [63]. Goodhand [43] investigated the effect of small geometric changes on the average incidence range in practical operating machines. For subsonic blade profiles, the erosion of the leading edge narrows the available operating range. This is because the range of low loss incidence shrinks despite the minimum total pressure loss coefficient of the eroded blade being similar to that of the original blade [71]. A further reduction in the range of the low loss incidence of the eroded blade occurs with the increase of the incoming Mach number.

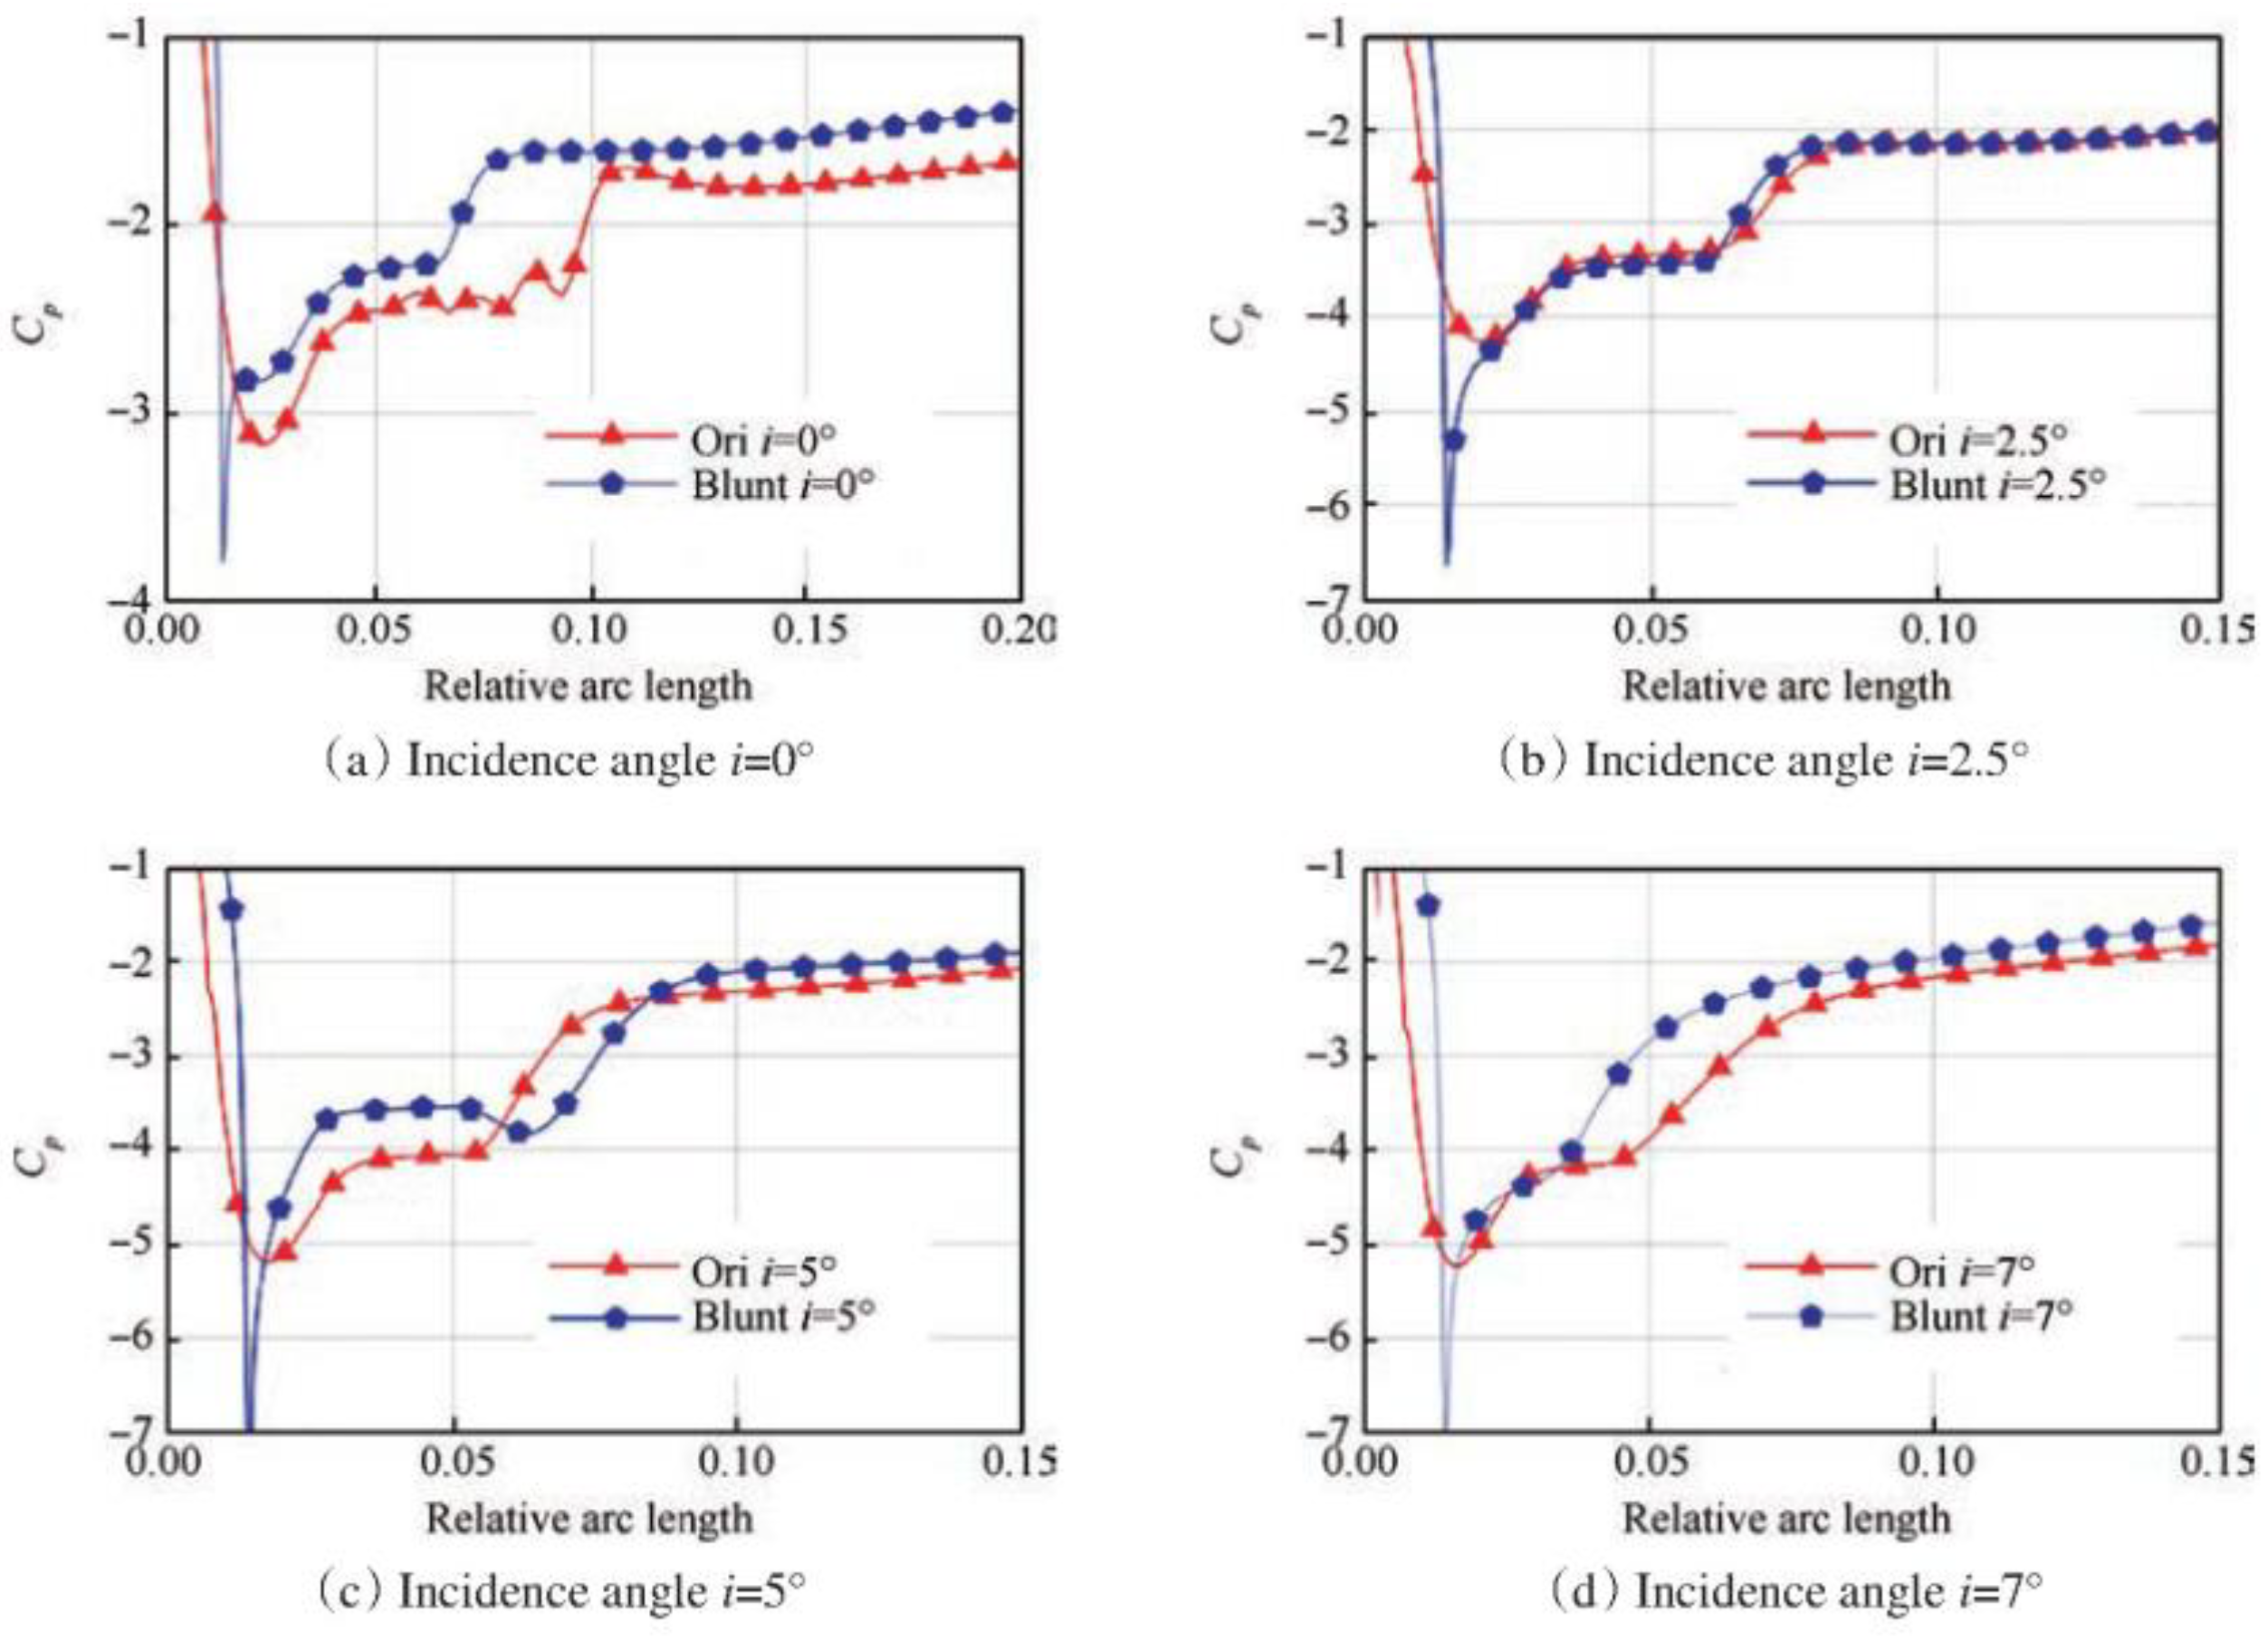
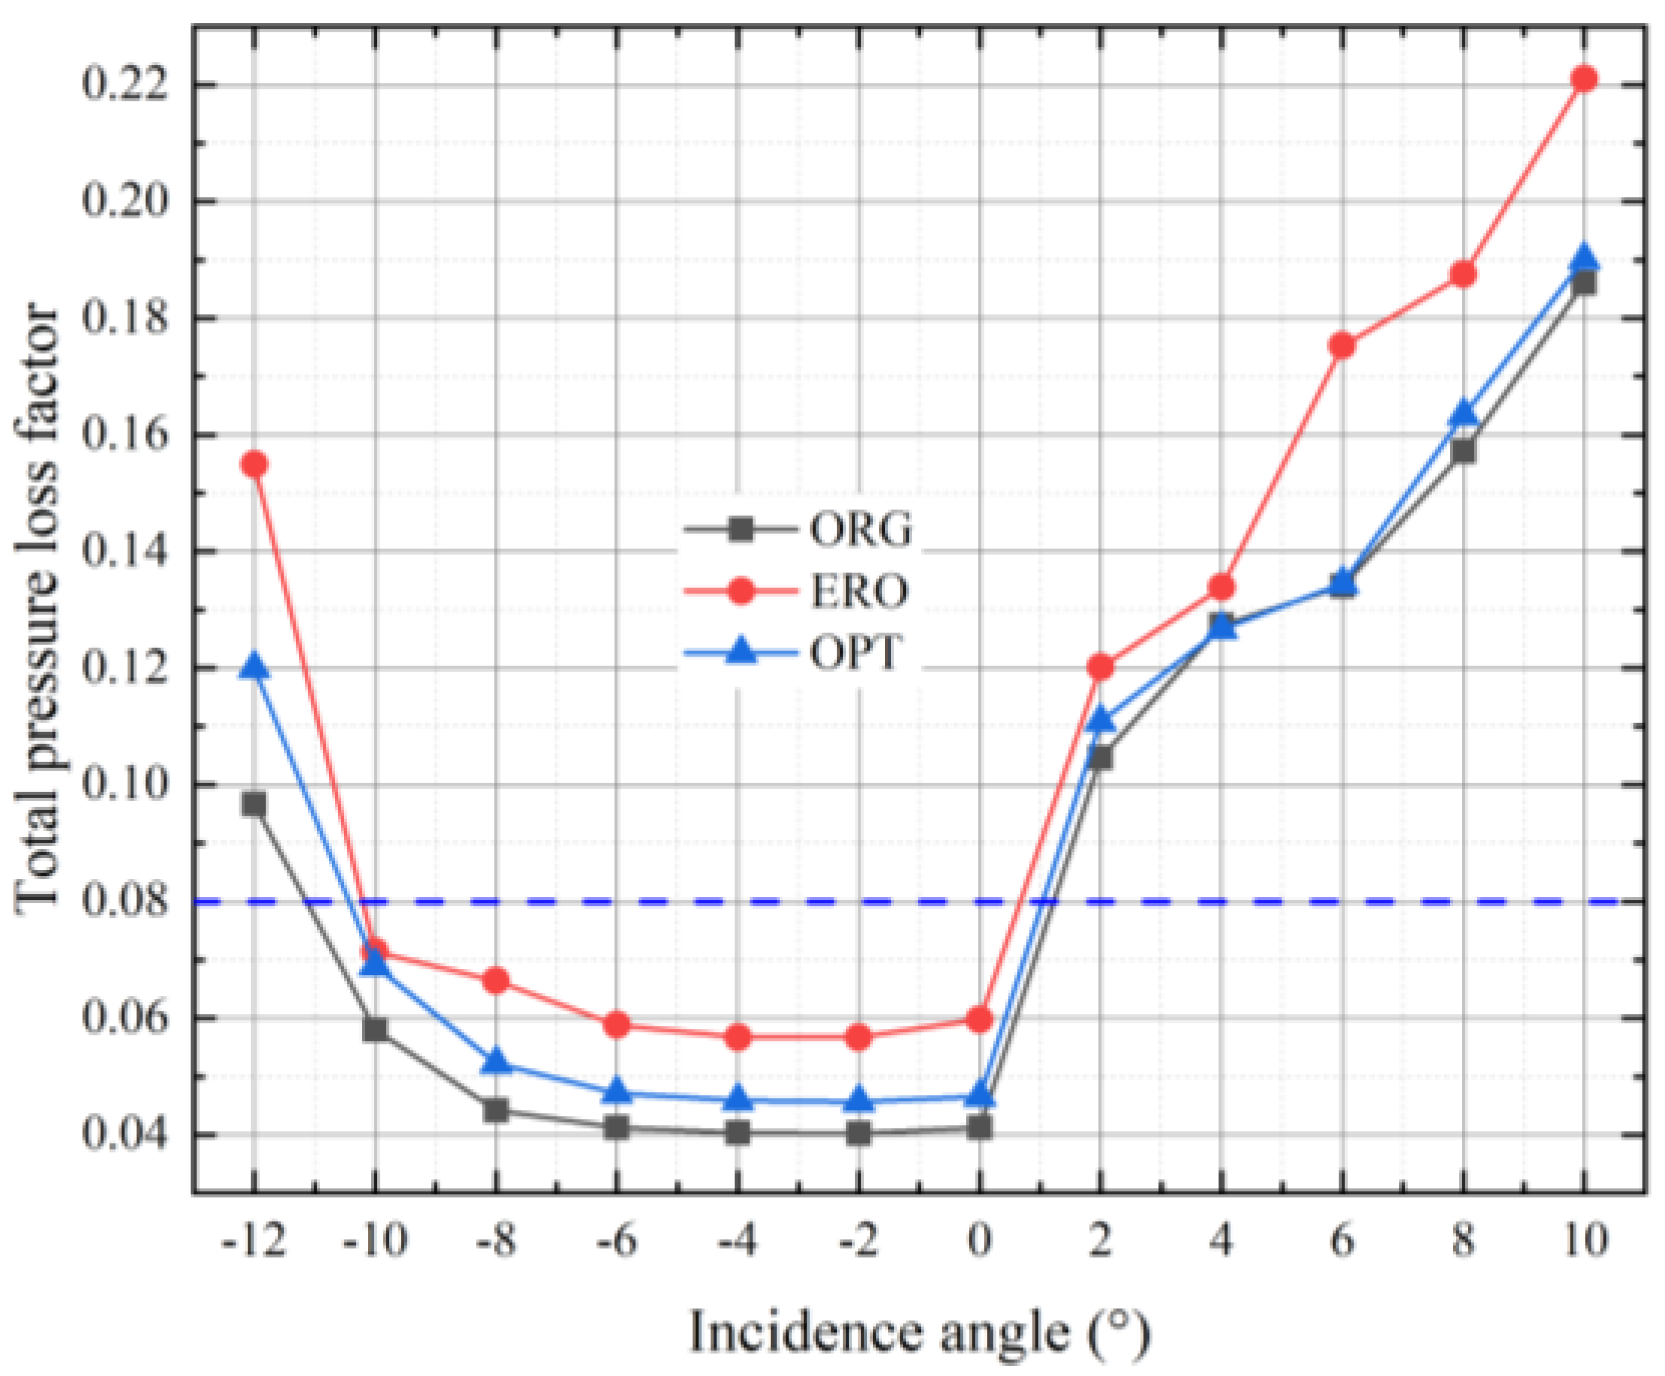
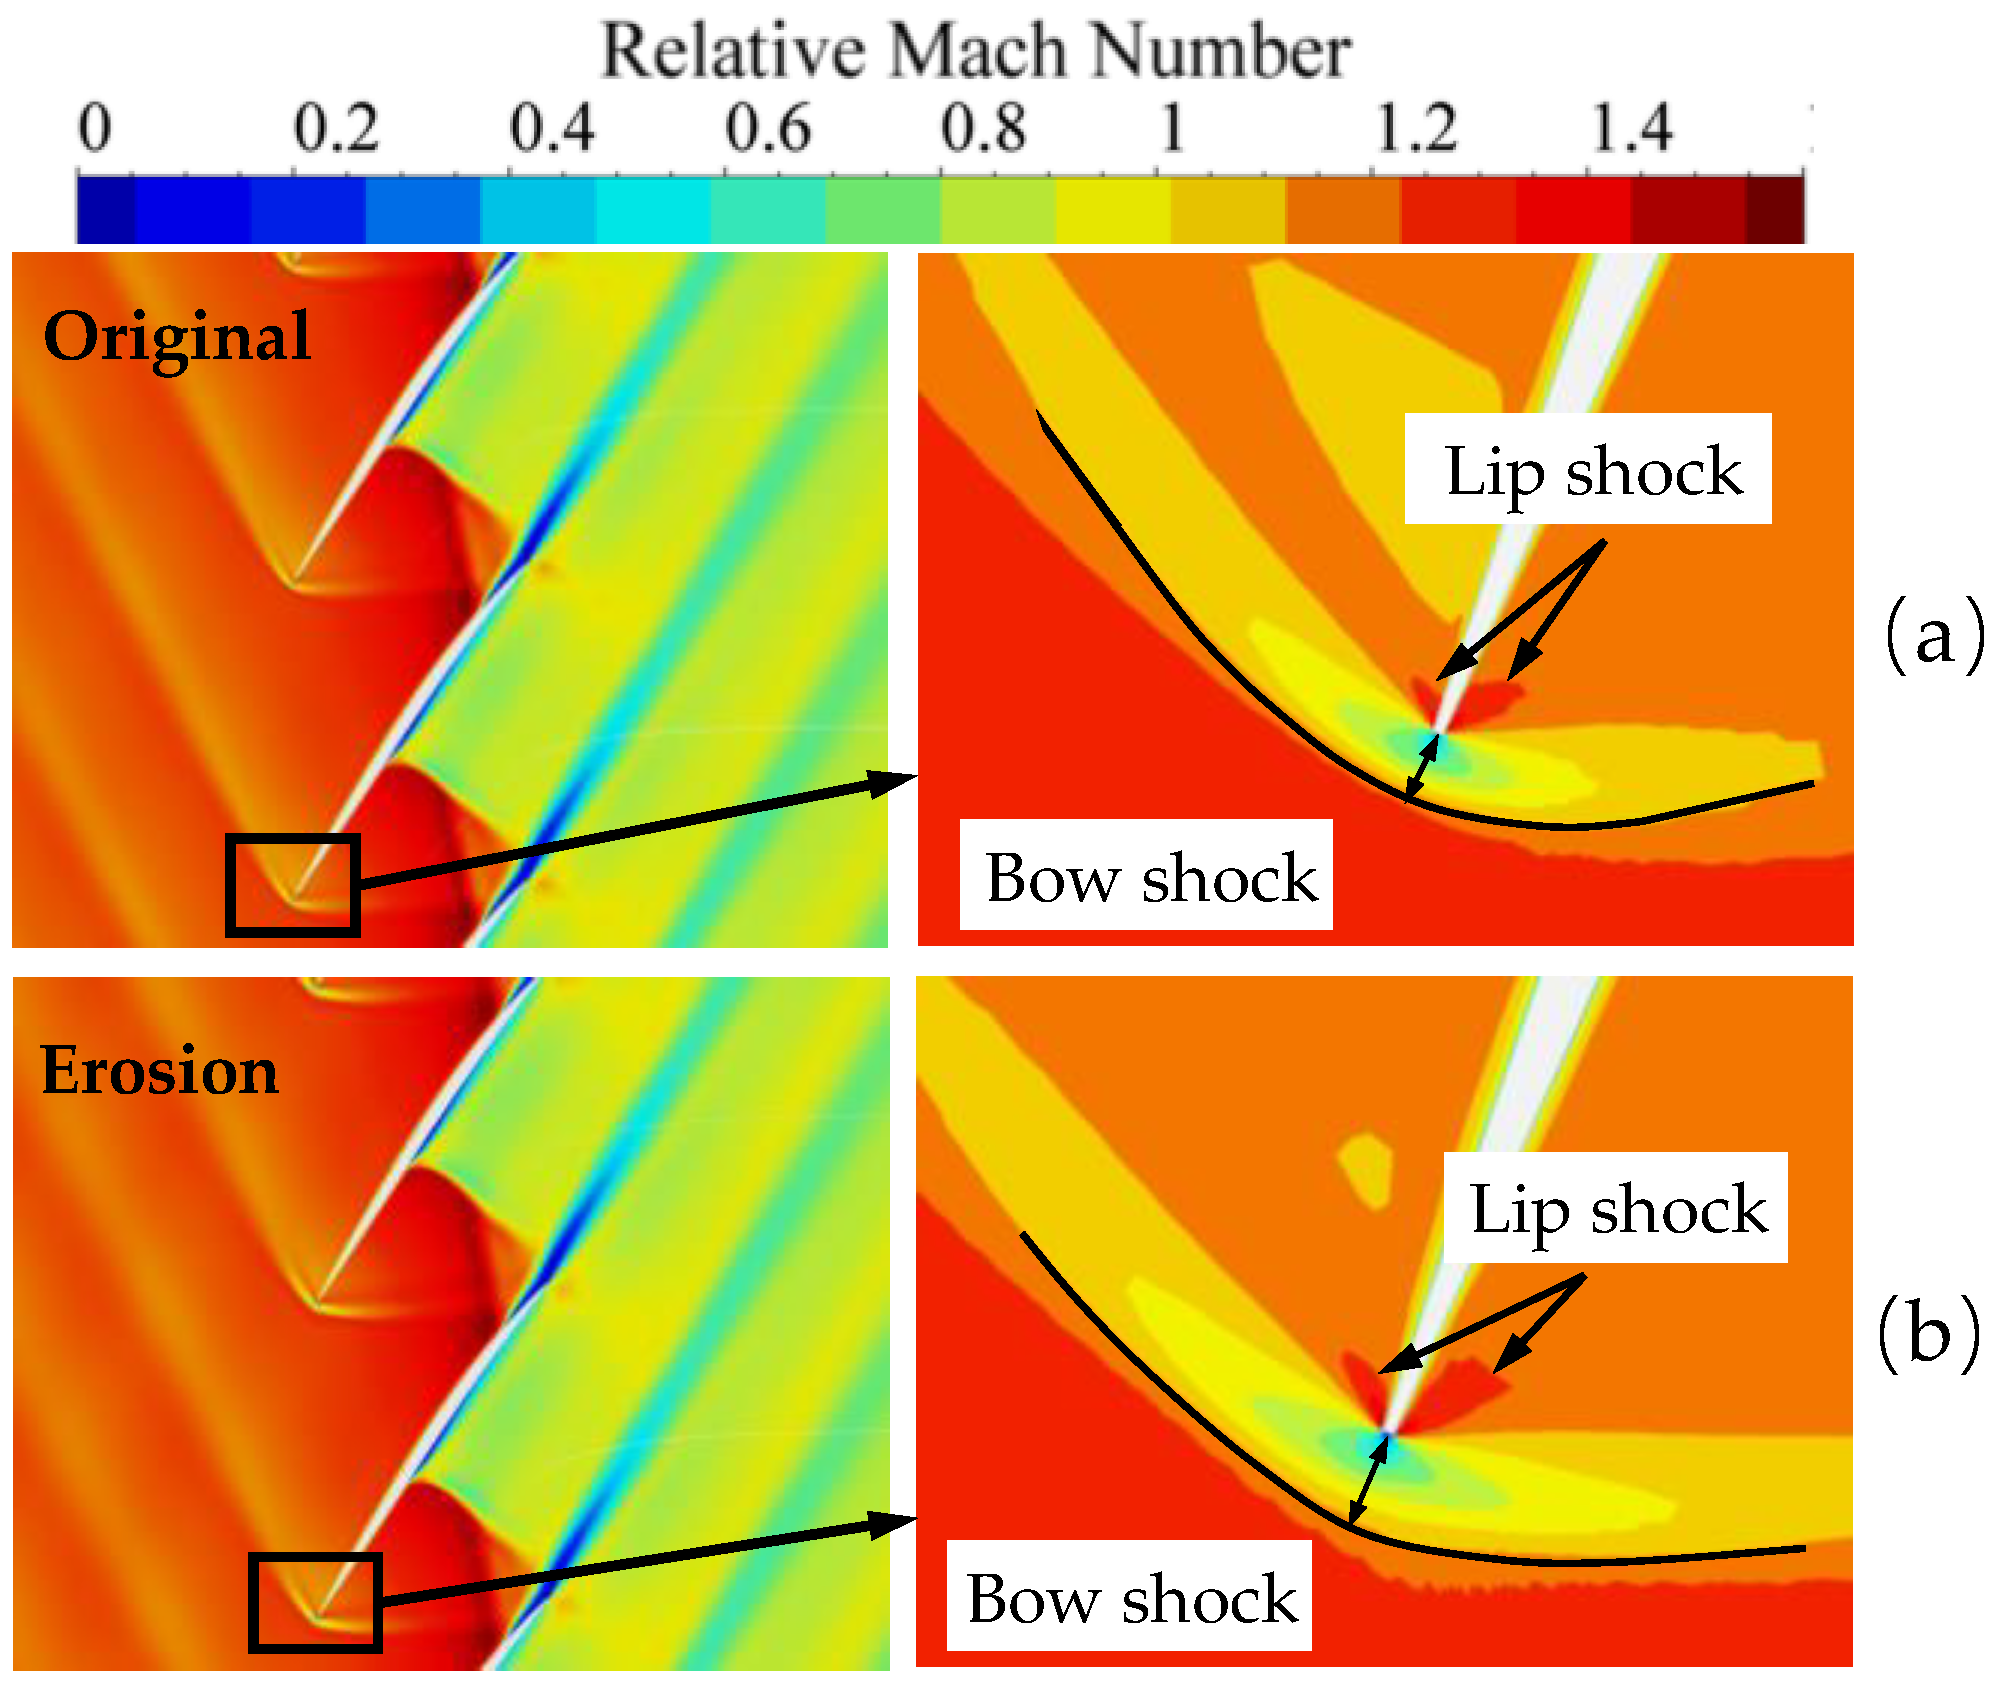
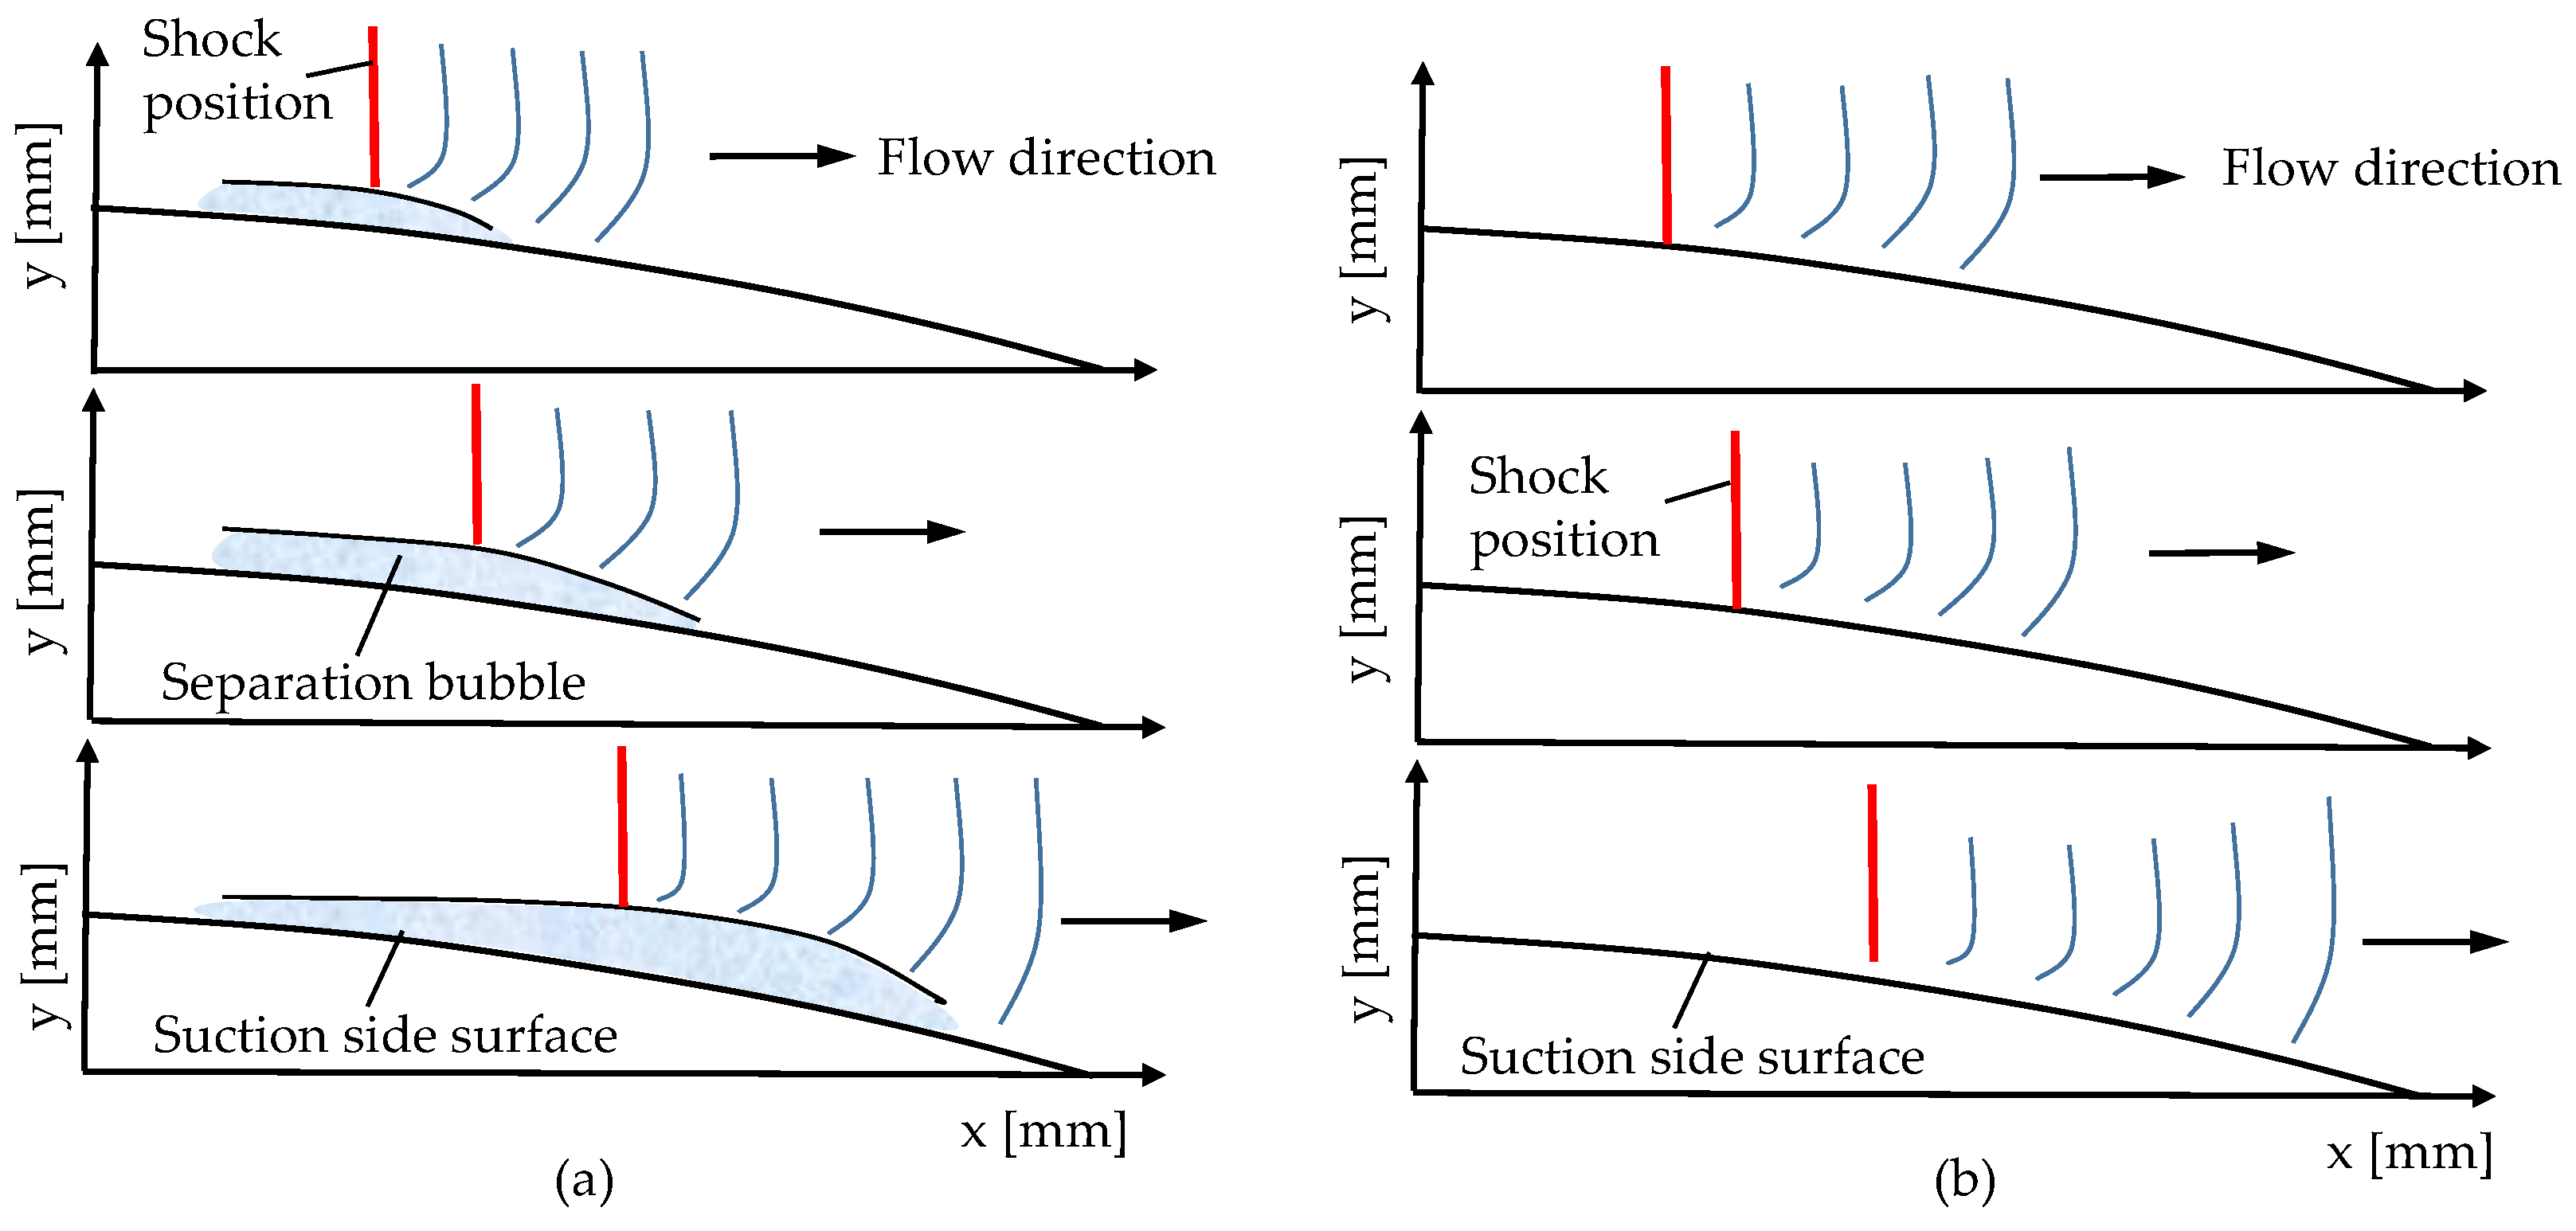
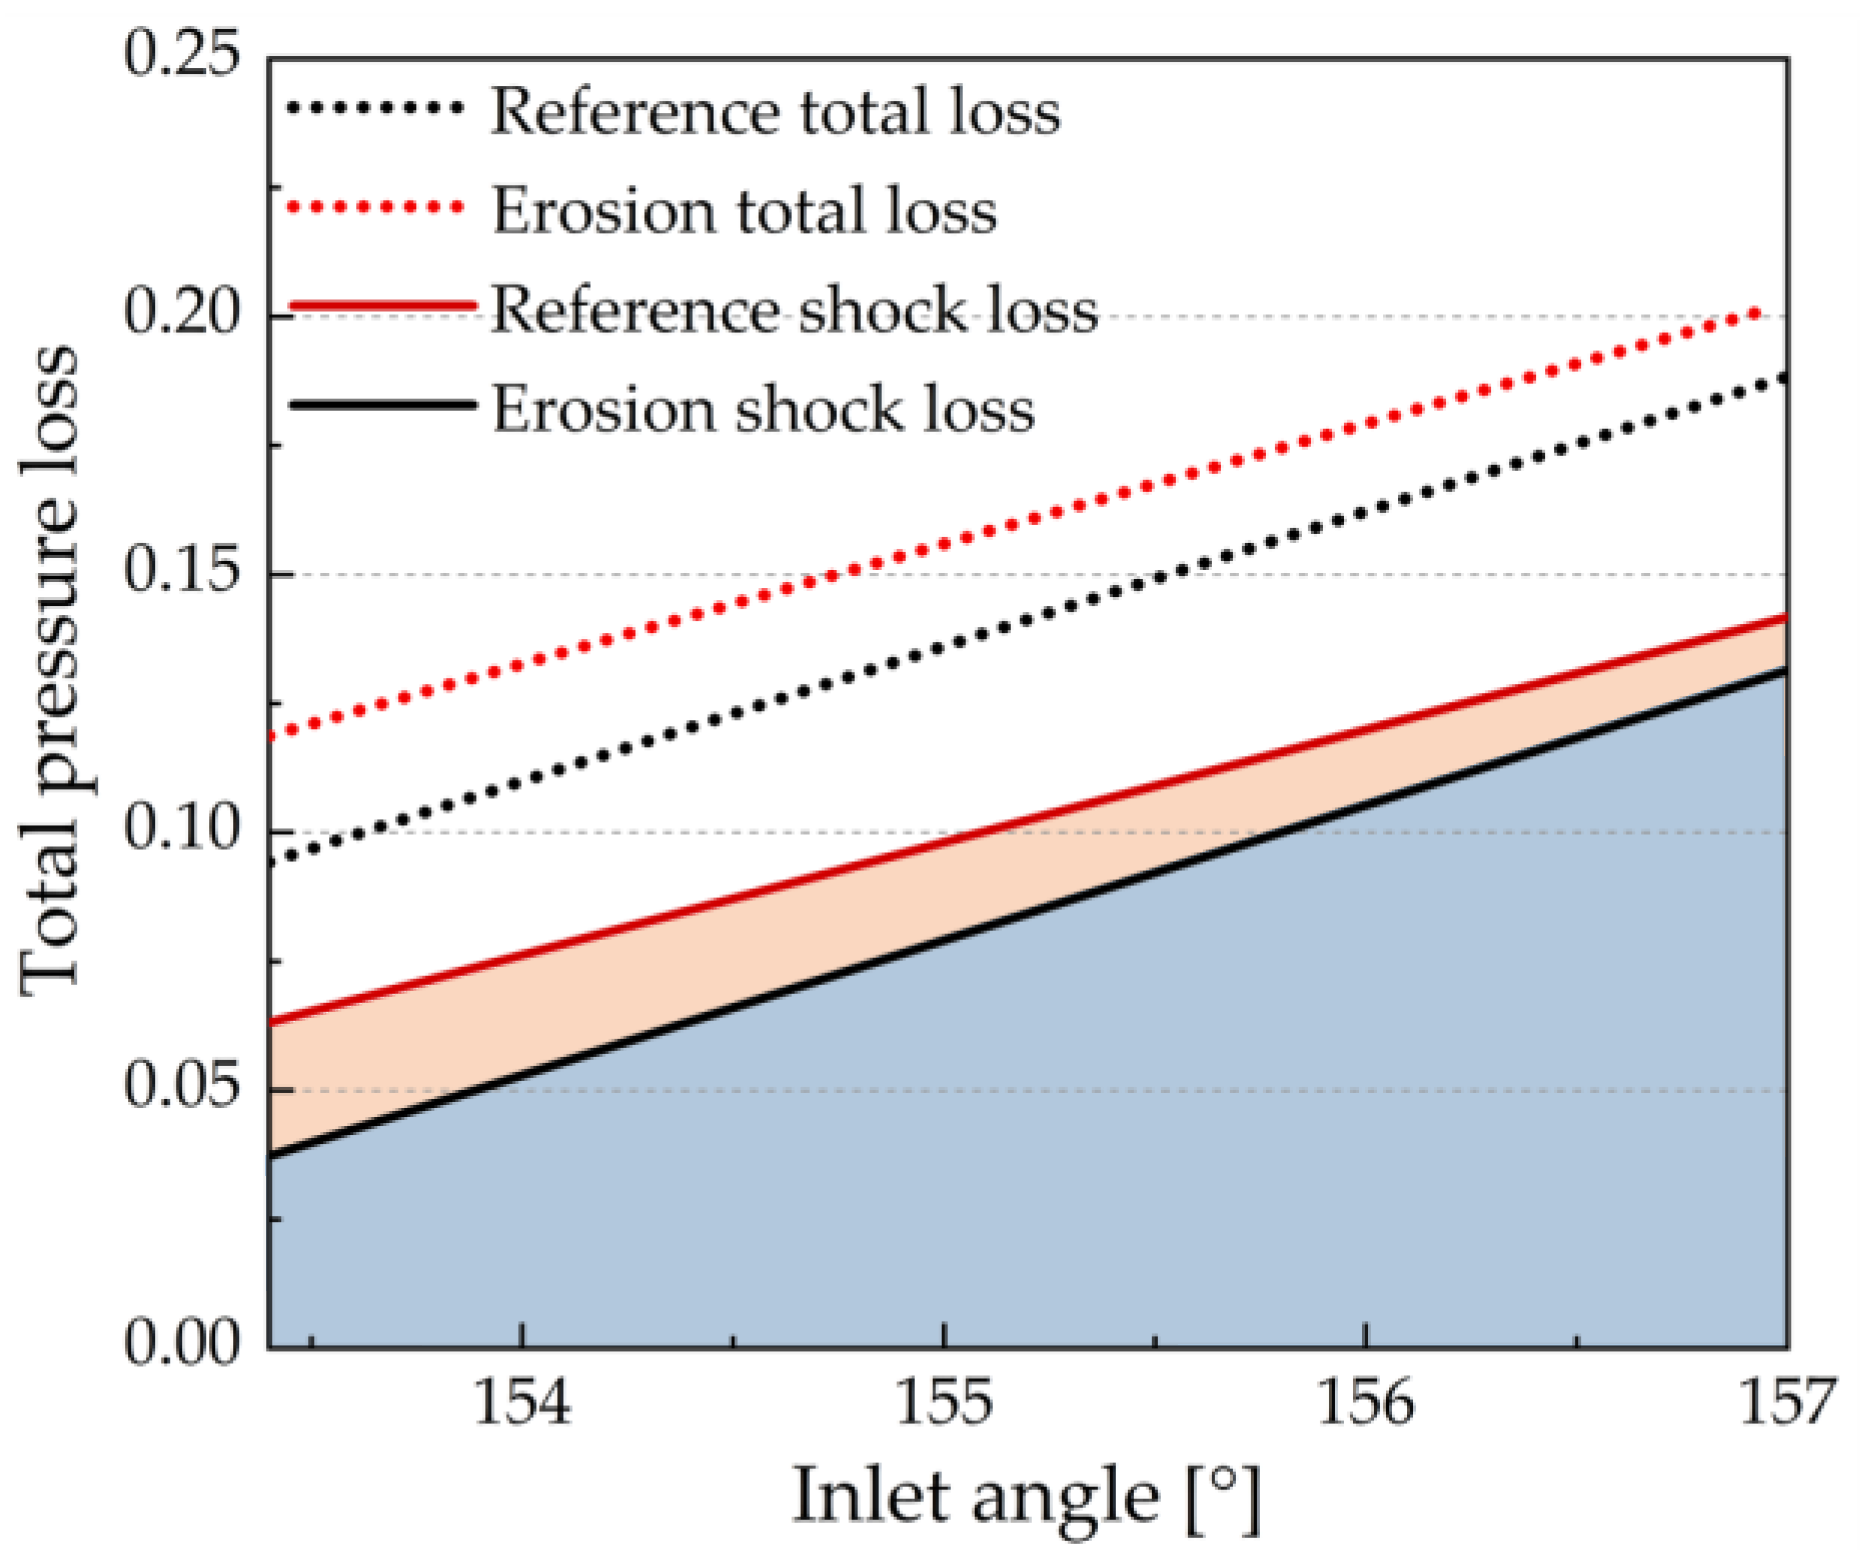
3.1.2. Supersonic Airfoils
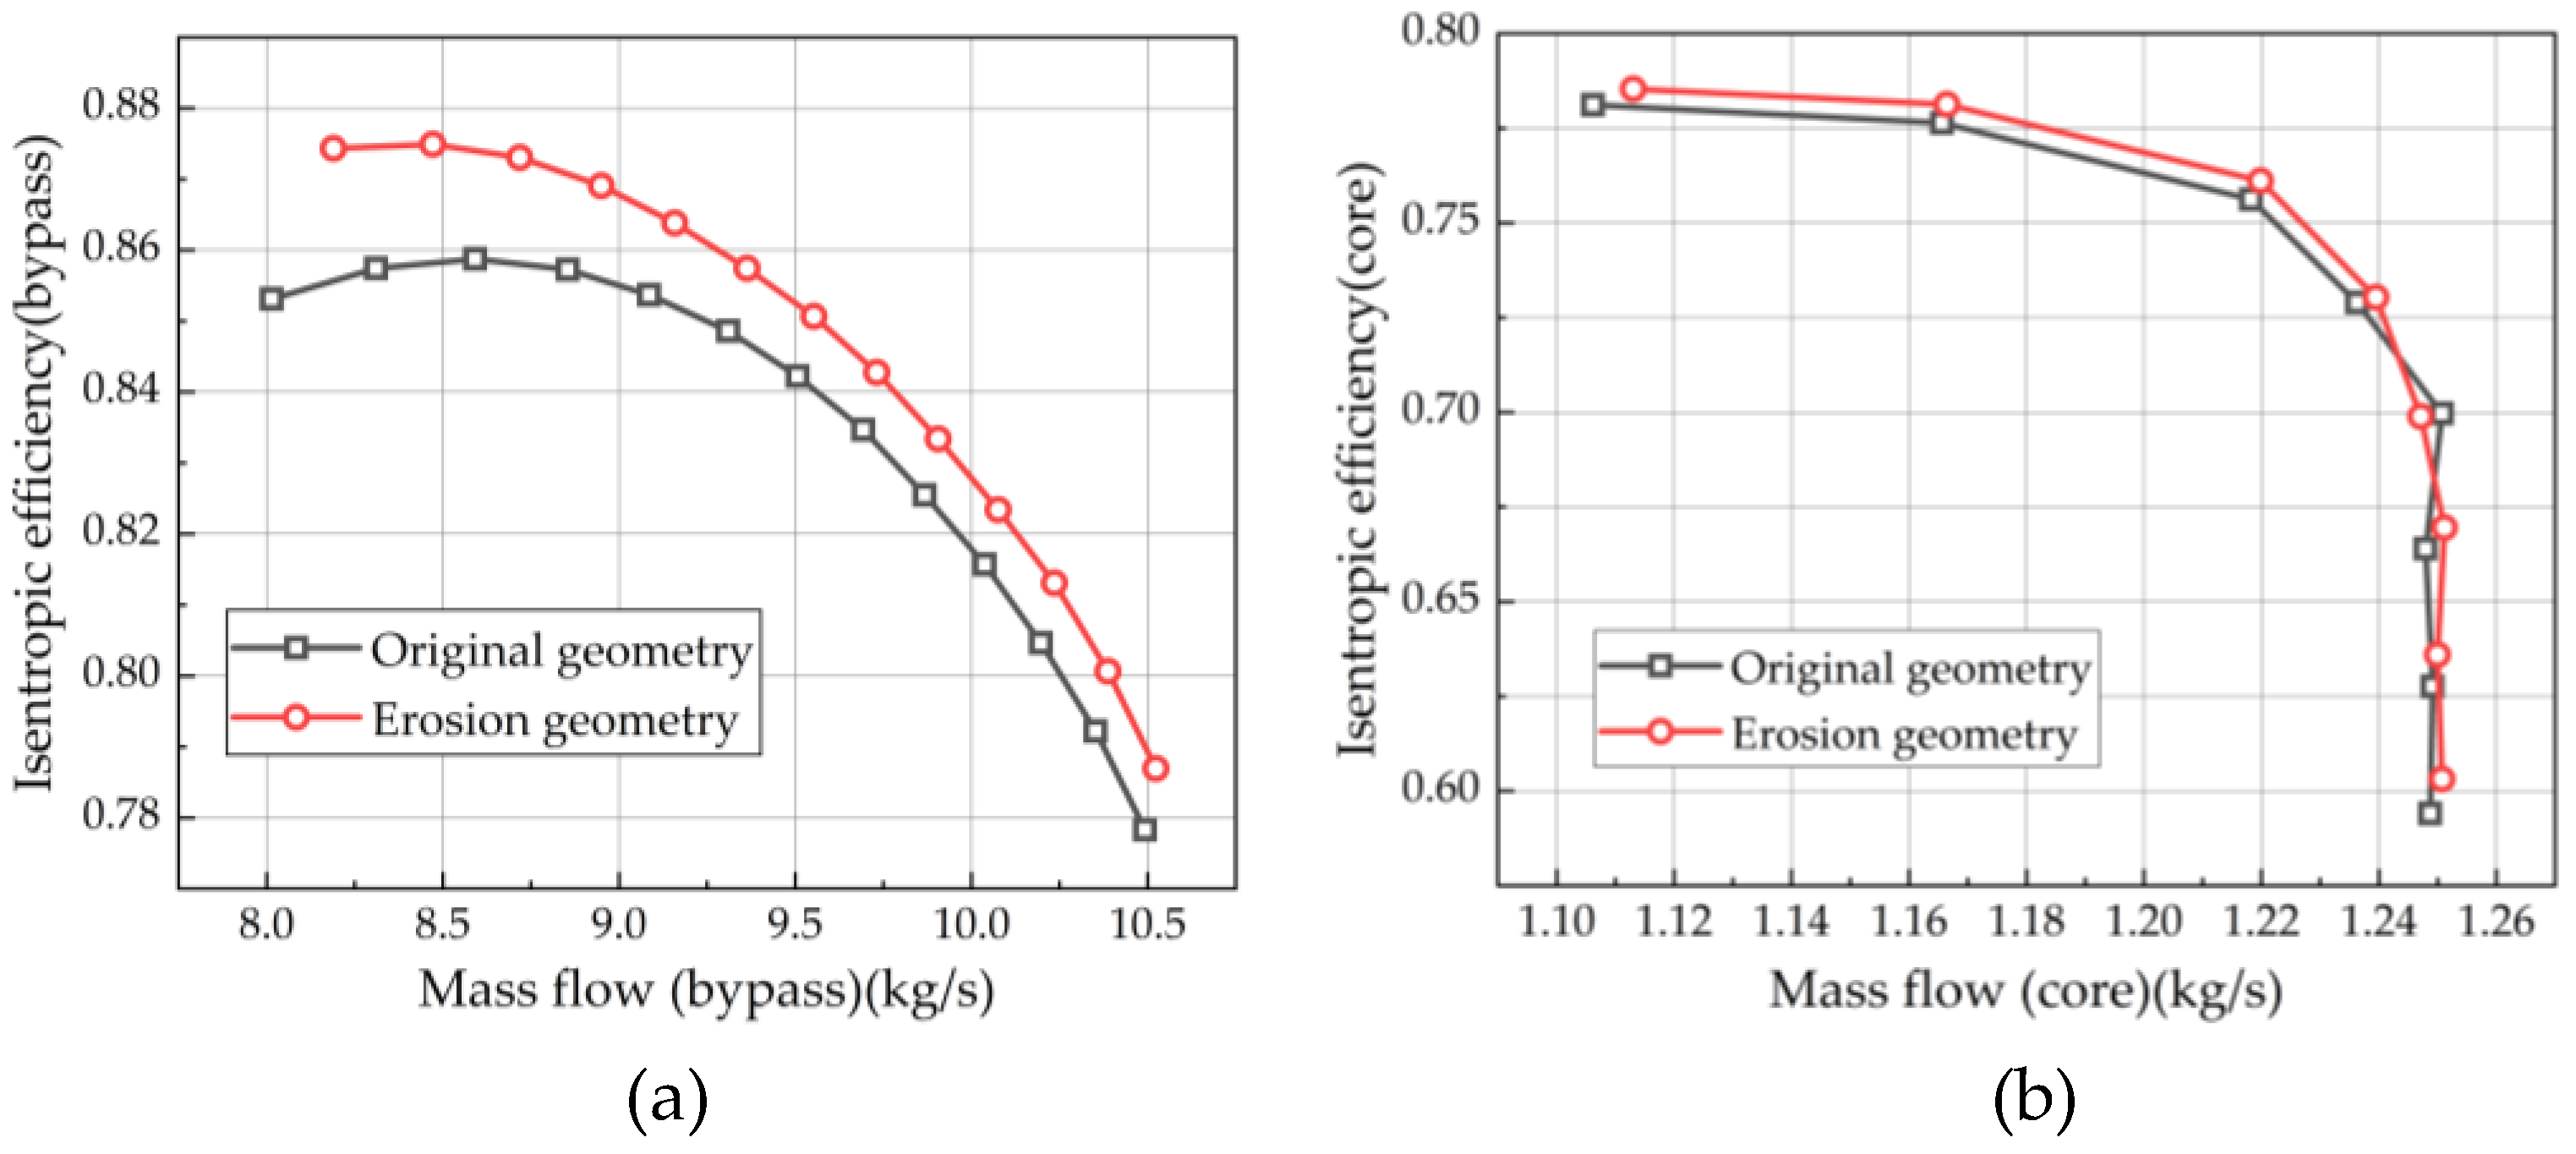
For transonic rotor blades, the leading-edge erosion is greatest in the supersonic regions which are mainly located in the outer 65% height of the blades. The worn blade causes stronger acceleration and deflection of the airflow at the suction side and results in a larger subsonic region and a stronger expansion zone compared to the reference blades. On the suction side of eroded blades, a strong lip shock is induced, and a sudden velocity change appears downstream of the bow shock wave; in contrast, the original leading edge exhibits a uniform expansion on the suction side and a more uniform airflow velocity, as Mach number distribution shown in Figure 14. The additional secondary shock wave and extension of the normal part of the bow shock wave lead to an increase in shock loss and total pressure loss [10]. In addition, the shock wave position fluctuates due to the eroded leading edge. PIV (particle image velocimetry) experiments [62] show that the bow shock wave position is shifted forward by an average of 2.9 mm.
The unique angle of attack characteristics and the operating range of the supersonic airfoils are not significantly affected by the damage of the leading edge [62]. Instead, the leading-edge deformation has a more significant effect on the shock wave structure. The eroded leading edge not only has an effect on the detached bow shock wave at the leading edge but also shifts the position of the passage shock wave upstream. Figure 15 shows the boundary layer thickness and the static pressure coefficient of reference and degraded blades. At the same back pressure condition, the blunt edge leads to the deterioration of the airflow around the leading edge, the thickening of the boundary layer, and the reduction of the effective cross-section of the passage, resulting in the passage shock moving upstream and the choke mass flow becoming lower. Experimental studies [62] found that a 1.1% loss of chord length for the supersonic profiles causes a 1–2 mm forward shift of the shock wave. At the near stall point, the blunting of the leading edge causes the passage shock wave to move upstream and combine with the bow shock to become a “λ” shock. Figure 16 shows the upstream movement of the shock and boundary layer thickening in a degraded blade.
The eroded leading edge influences the shock boundary layer interaction (SBLI). The studies of boundary layer behavior show that boundary layer transitions occur earlier upstream due to leading-edge bluntness, affecting the properties of airflow that interfere with shock. Hergt et al. [77] quantified the unsteady flow behavior due to SBLI and its effect on the performance of supersonic cascades for both laminar and turbulent flow cases. Separation bubbles exist when the SBLI at the suction side is a laminar boundary layer. When the shock is upstream, the length of the separation bubble is 6 mm, and as the shock position moves downstream, the size of the separation bubble increases rapidly, resulting in an increase in the thickness of the boundary layer downstream while the position of the chord length where the airflow is separated remains almost unchanged. When the transition occurs upstream of the shock, almost no separation bubbles appear in the turbulent SBLI. Although the turbulent SBLI boundary layer and the separation bubbles are excellent, the disorder and the instability of the turbulent flow increase the blade profile loss.
The loss of the supersonic airfoils mainly derives from the shock system and viscous friction [62,78,79,80]. Figure 17 shows the total losses versus the shock losses for the reference and eroded blades. It is obvious that the additional total profile loss due to erosion is almost entirely from the shock loss, while, in contrast, the airflow viscous loss is almost unaffected by erosion, which is due to the increase of the detached shock wave intensity, the appearance of the lip shock, and the advancement of passage shock causing more complex SBLI. The additional losses are much greater in the design condition than in the stall condition, but the frictional losses are greater in the stall condition [62].

3.2. Blades

The eroded leading edge geometries of the blade are variable in span with the complex degraded leading edge spanning more than two-thirds of the height of the blade [51]. As shown in Figure 9, the damage to the blade is minor from the hub to the 50% span, with a maximum material loss at about the 50–90% span, and a slightly reduced chord at the tip [69].
The erosion at the leading edge weakens the pressurization and the loading capacities of the blade [68] and causes a significant intensification of the suction pressure spikes in the root, middle, and tip sections [71]. Figure 18a,b shows the static pressure distribution at the mid-span and the tip of the blade airfoils, respectively. At the mid-span, the static pressure of the eroded blade decreases and is significant only in the leading-edge region. At the blade tip, the static pressure of both the suction and pressure sides greatly reduces, and a prominent spike appears at the leading edge of the suction side. The blade loading coefficient is the area enclosed by the pressure and suction sides of static pressure distribution curves of the rotor blades, and the loss of aerodynamic loading capacity is more severe in the tip region than in the middle span.
The range of available incidence angles for blunt airfoils decreases significantly at the root and the difference with the original type decreases with increasing blade height [71]. Reid [10] found that a blunt leading edge was detrimental to aerodynamic performance at speeds of 100% and 90% of the design speed, but had little effect on performance at speeds less than 70% of the design speed. Civil aviation aero engines operate at or near design speed for most flights, thus the erosion of the leading edge will have a continuous effect on performance. At 100% design speed, the erosion has an effect on the entire mass flow range, with reduced stall margins and a decrease in the pressure ratio and efficiency at the stall point and the maximum flow rate.
There are two reasons for the large losses due to erosion of the leading edge:
  • For blade elements with a positive suction surface curvature, the cutting and deformation of the leading edge leads to a smaller suction surface inlet blade angle, and the incidence angle becomes larger for a given inlet relative flow angle;
  • For supersonic inlet speeds, the eroded leading edge leads to a stronger bow shock wave and results in an increase in total losses.
Blade leading edge erosion typically results in chord length reduction, with most civil aviation turbofan engines having a stall chord length limit of 94–96%. To address the problem of shortened blade chord lengths after service or repair, Robert [12] investigated the effect of different blade installation configurations on blade row performance. The “Alternating” configuration always maintains the largest stall margin while the “Halves” configuration has the smallest stall margin. Because of the higher aspect ratio caused by erosion chord length shortening, the operating range becomes unstable and the stall precursive disturbances increase significantly in the “Halves” configuration, thus triggering the stall, while the long chord blades in the “Alternating” configuration can stabilize their adjacent short chord blades well.
Both the leading and trailing edges of the blades can suffer some wear by particle erosion. Lai et al. [68] compared the effect of leading and trailing edge erosion on blade performance and found that these two damage locations do not have the same effect mechanism. The leading-edge damage leads to a lower pressure ratio, lower efficiency, and reduced mass flow at the blockage point, but has no effect on the stall limit. In contrast, the worn trailing edge has a greater impact on performance only at a low mass flow rate. It increases the flow at the stall boundary and reduces the operating margin while having no effect on the flow at the blockage point. The fan and compressor leading edges are more severely eroded, and the performance is more sensitive to the leading edge than the trailing edge. In contrast, the trailing edge of the turbine vanes is more significantly damaged by particle erosion [81] and fouling [47,82].

3.3. Compressor System
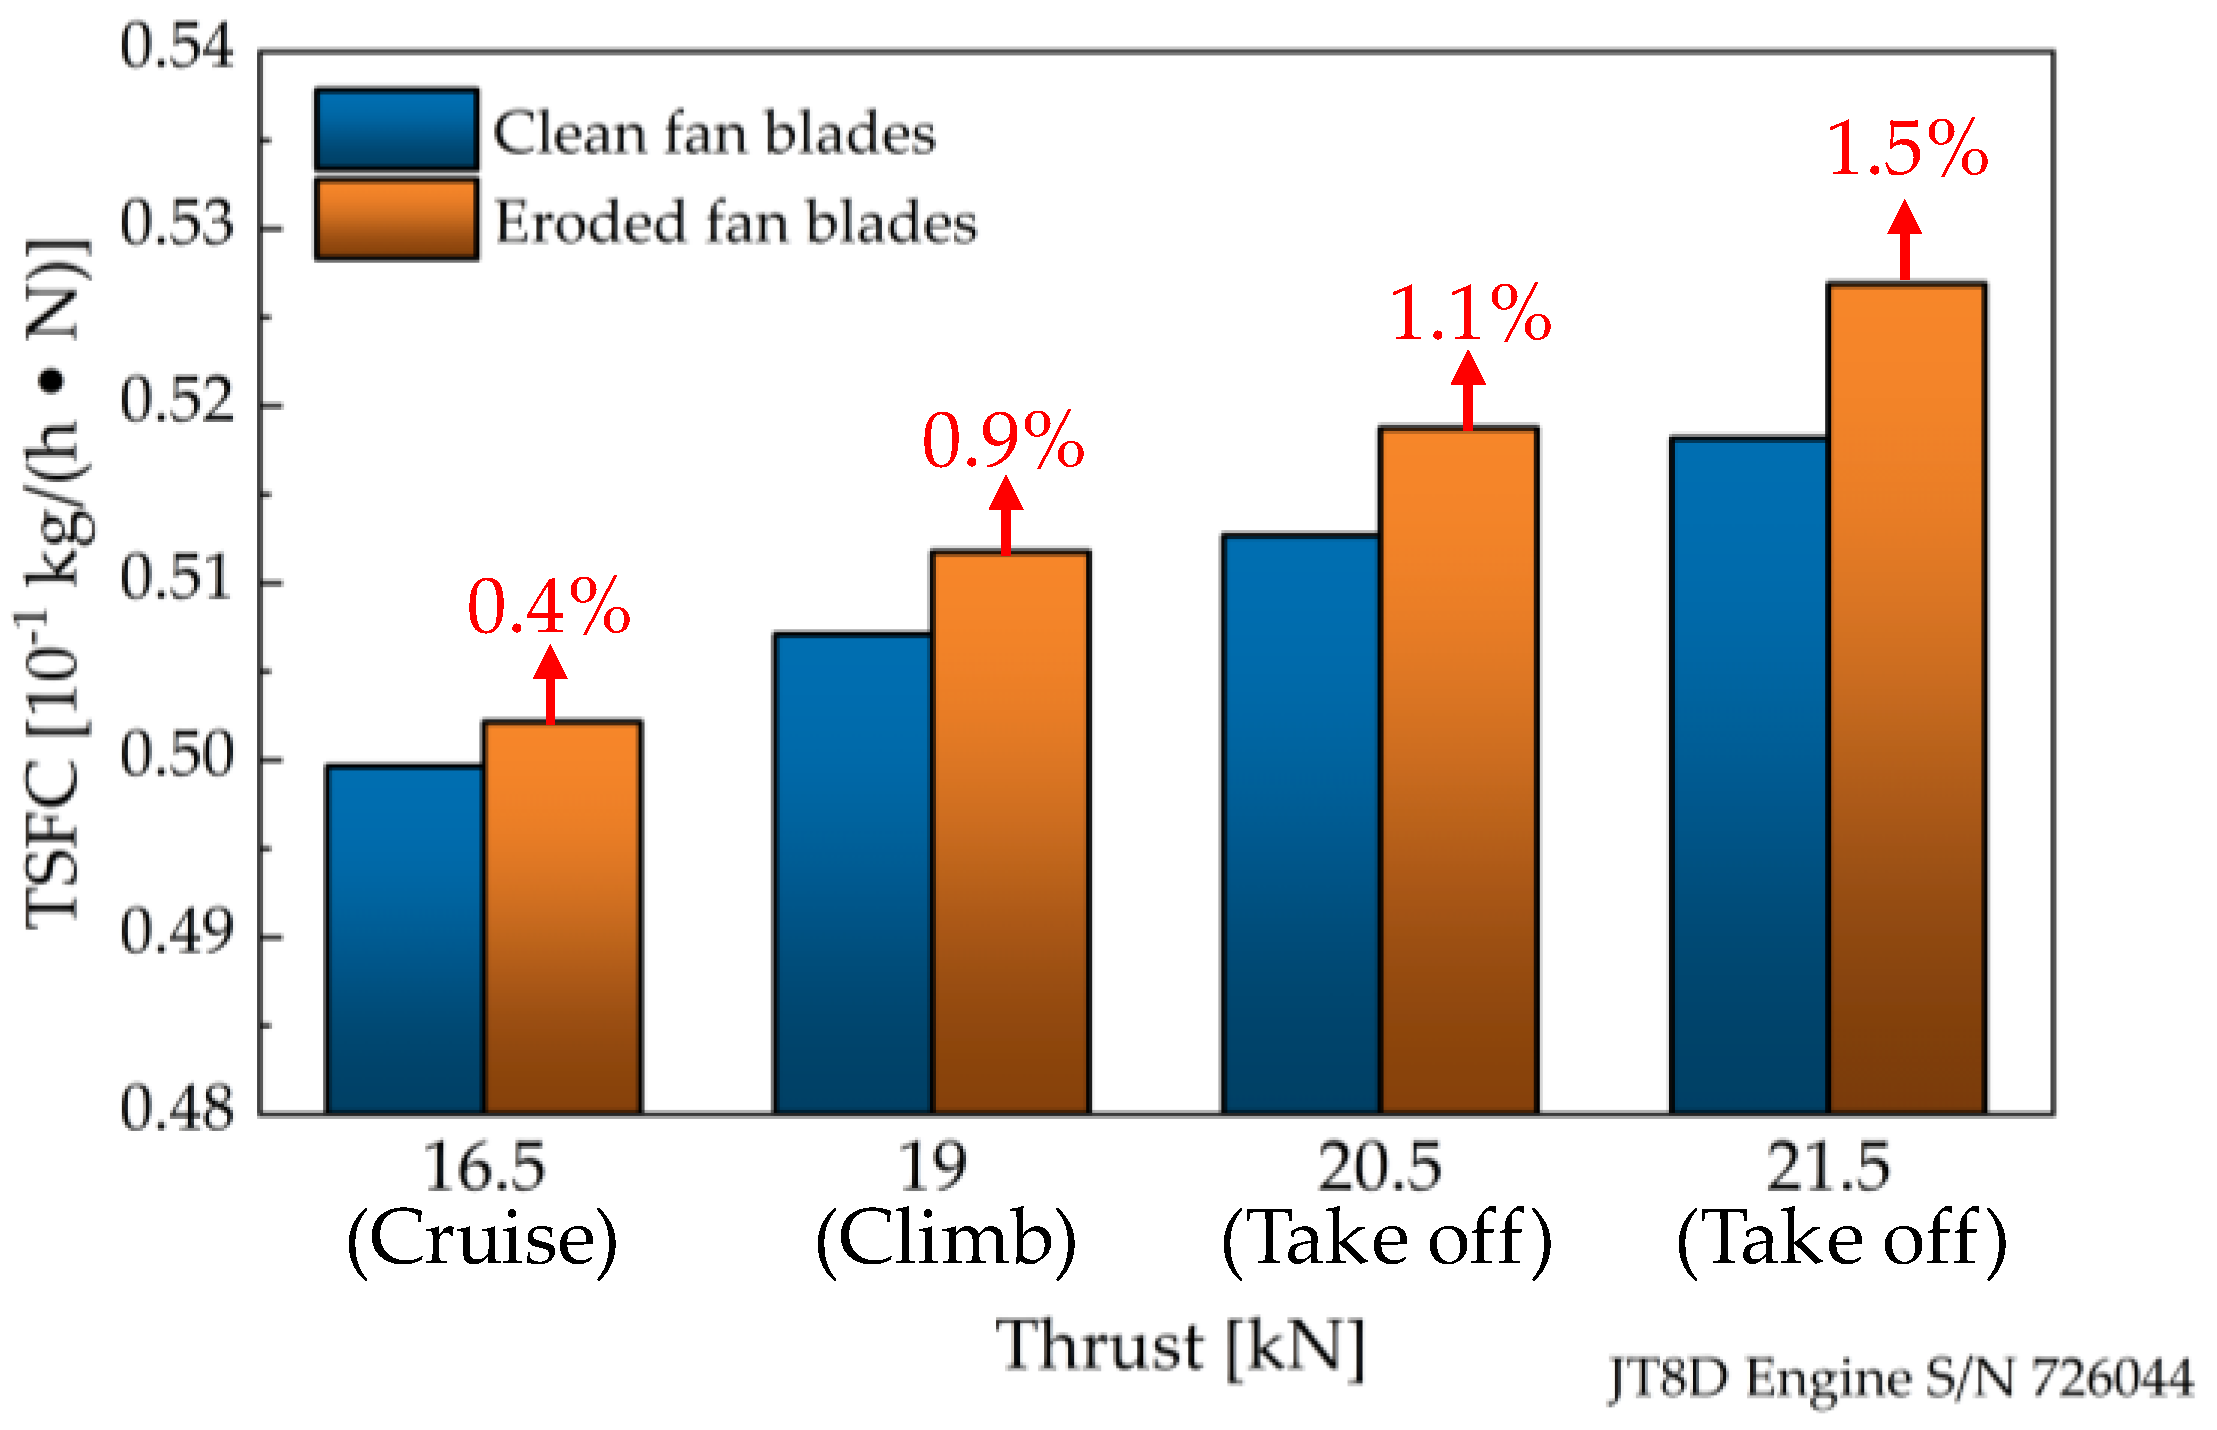
The axial flow compressors commonly used in aero engines consist of multiple blade rows and each row interferes with others, making the study of a single blade and blade rows lack universality in practical applications. Therefore, it is meaningful to study the influence of erosion on the whole compression system. Marx et al. [29] measured ex-service compressor blades to form CAD models and generated aerodynamic design parameters such as leading edge and trailing edge geometries (radius and thickness), maximum profile thickness, and chord length, as shown in Figure 19.
The structure of the whole compression system is extremely complex, and factors such as inlet circumferential distortion, splitting rings, and core and bypass duct coupling [83,84] need to be considered. Robert et al. [11] found that as compressor blade wear increases, the range of available operating angles decreases and the flow separates at lower incidence angles, affecting the operating range of subsequent compressor stages.
Huang et al. [85] simulated the erosion of fan blades given a blunt leading edge and chord length retractions of 120 µm and 250 µm and evaluated the impact of the eroded leading edge on the compression system by core and bypass duct coupled calculations. Figure 20 displays the characteristic lines of original and eroded blades. The full flow field of the compression system showed signs of deterioration after the erosion of the leading edge of the fan rotor blades. The leading-edge erosion mainly affected the bypass duct and the isentropic efficiency and the pressure ratio decreased significantly with increasing erosion with the performance degradation being greatest near the surge point of the bypass duct. In contrast, the leading-edge erosion of the fan blade had a relatively small effect on the core duct. In addition, as the degree of erosion increased, the losses in the corner and the end wall increased, and the leakage at the top clearance of the blade decreased [86]. At the same time, the reduction of axial velocity caused a significant reduction in the absolute airflow angle at the exit, adversely affecting the flow field downstream.
The leading-edge erosion also changed the blade’s vibration characteristics, triggering safety risks. The leading-edge damage causes a decrease in the first 12th-order intrinsic frequency, an increase in the maximum equivalent force value as well as a change of the maximum equivalent force point [75].

3.4. Aero Engines

As the key components of an aircraft engine, the fan and the compressor have a decisive role in the engine’s thrust, fuel consumption, and EGT (exhaust gas temperature). After the leading edge of the blades is eroded, the overall performance of the engine will be affected. Taking a turbofan engine with a bypass ratio of 10 magnitudes as an example, the fan component provides about 75% of the takeoff thrust and 68% of the cruise thrust. At the cruise phase, if the efficiency decreases by 1%, the thrust will decrease by about 0.68%, and the fuel consumption rate will increase by more than 0.67% [1]. The erosion of the leading edge also has unfavorable effects on the matching between engine components. In order to meet the thrust requirements of flight, the rotational speed of the engine increases and requires more fuel in the combustion chamber to compensate for the lack of performance of the compression system due to erosion. This results in higher exhaust temperatures, a shorter service life of high-temperature components, and increased equipment operation and maintenance costs [29].
Blade leading-edge erosion causes different thrust losses to the engine at takeoff, climbing, and cruise conditions, with the greatest thrust loss at takeoff conditions. The thrust loss due to the erosion of the turbofan engine at different operating conditions is calculated according to the thrust loss equation in Table 2. The fan blades’ leading-edge erosion has the most serious effect on the thrust of the bypass duct of the turbofan engines. At the near surge point, the thrust loss of the core dust is almost the same as at the design point, while the thrust loss of the bypass duct is much larger than at the design point.

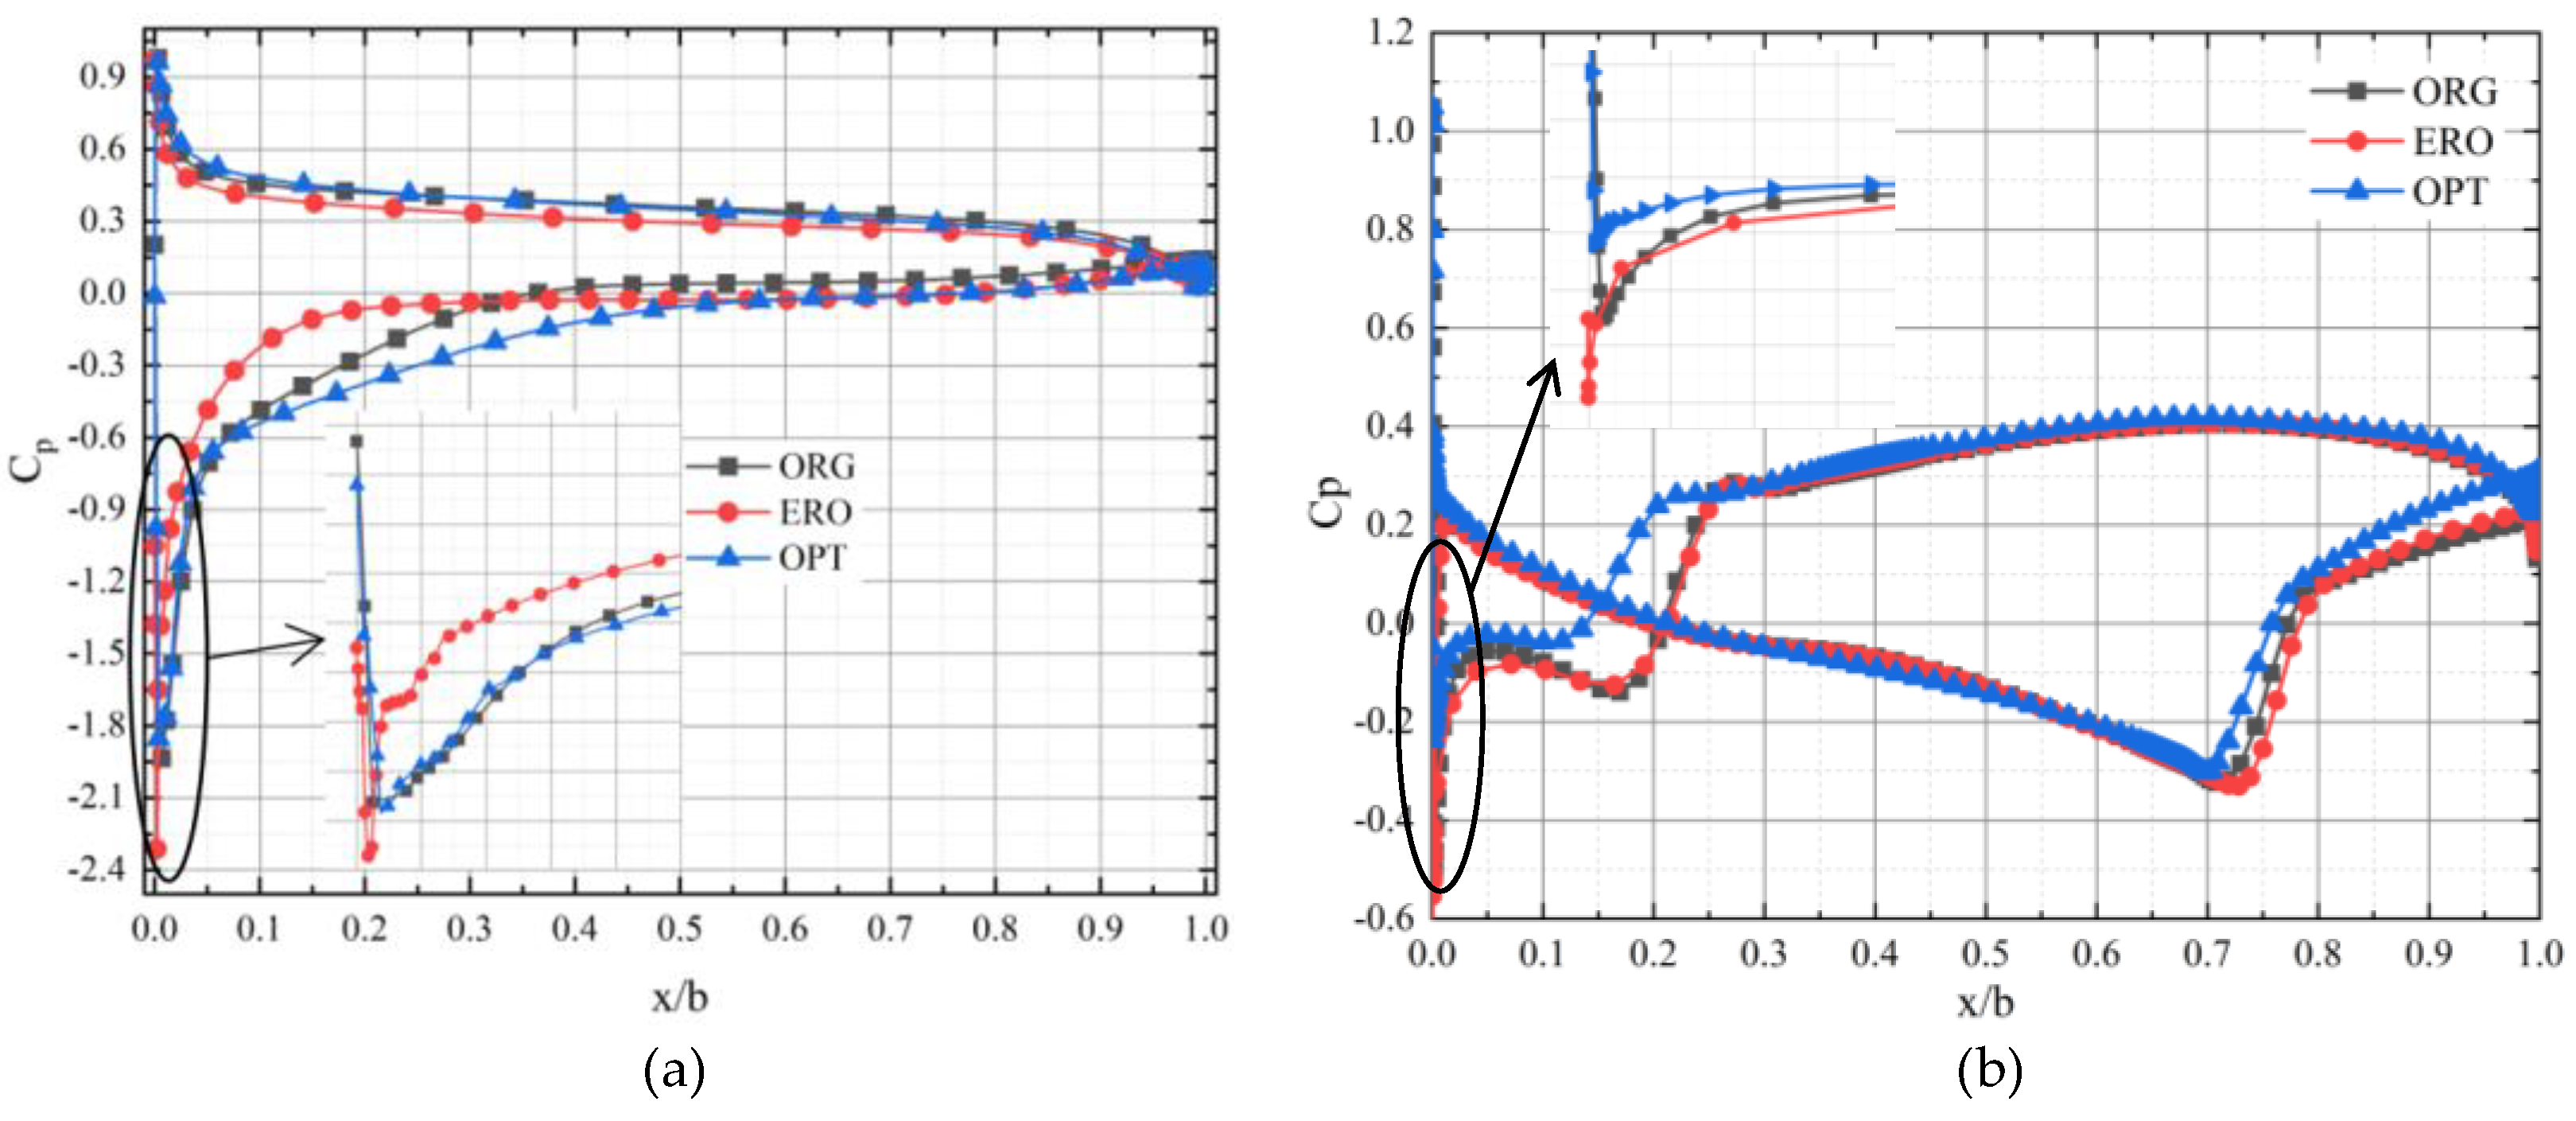
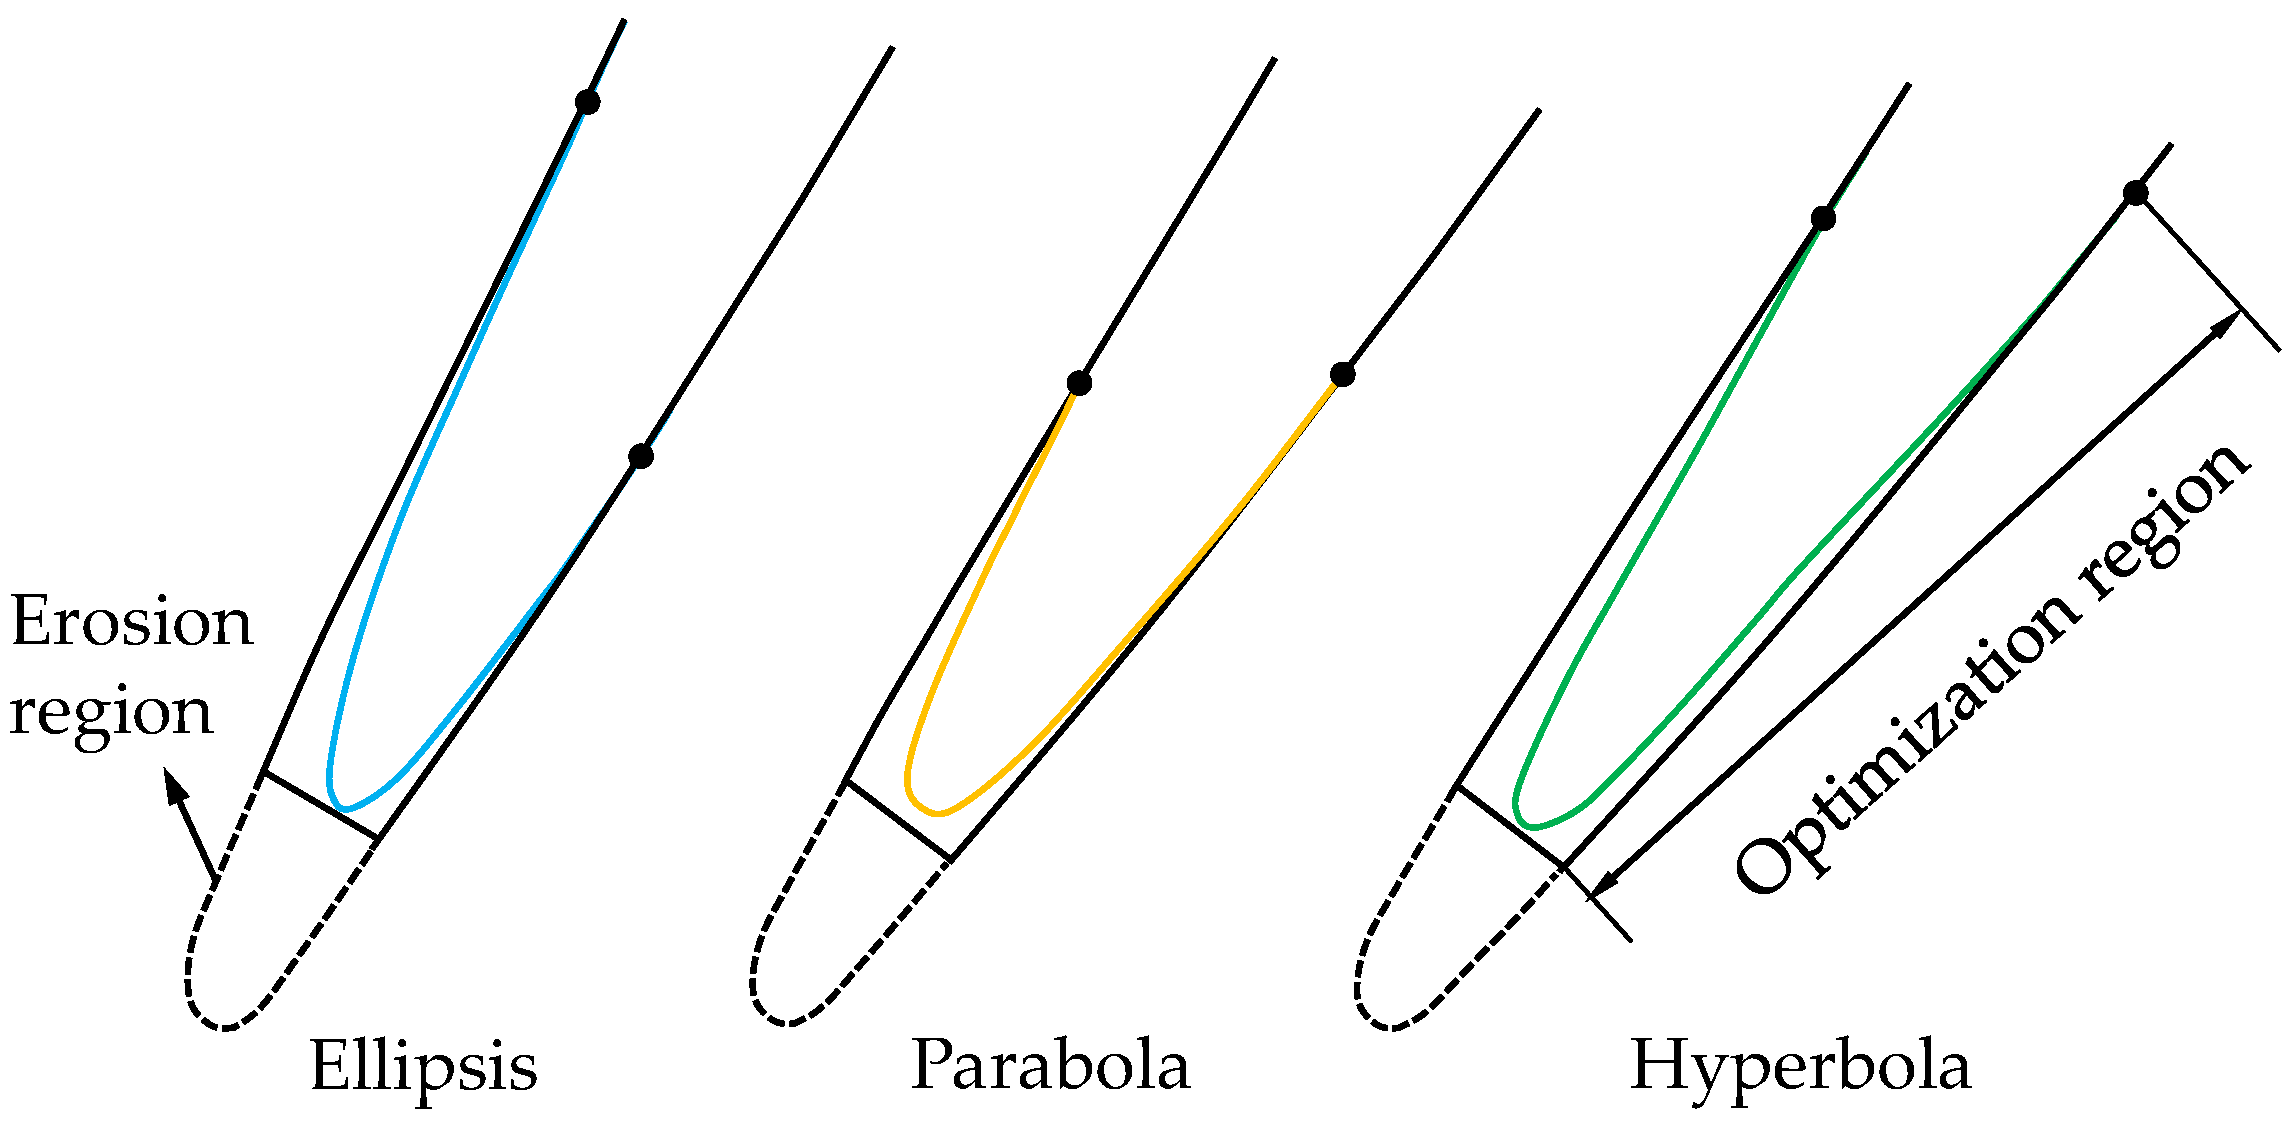
4. Optimization of the Eroded Leading Edge

In practice, leading-edge erosion damage can be compensated by the refurbishment of the blade during scheduled maintenance and overhauls. Although the chord length of the reshaped blade is reduced, reasonable blade optimization methods could expand the scrap boundary of the blade, and it becomes possible to meet or approach the efficiency and performance levels of the initial blade with the redesigned blade [39] or extend the on-wing time of the blade [32,33]. The optimization of the damaged leading edge can be achieved by the parameterization method which is described by specific parameters of angle and radius [39], as shown in Figure 21. By controlling the number of control points and the angle and radius values, the database of all feasible leading-edge profiles using the given parameters [30,87,88] can be generated.
The resharpening of the blunt blade requires a reduction in the leading-edge thickness. To ensure continuous leading-edge curvature and round connection of the leading edge, part of the material beyond the leading-edge region also needs to be removed, which influences a large range of chord lengths of airfoils. However, for economical purposes, the border of the leading edge profile that can be polished is only at the first 10% of the chord length [89]. The greater the blade erosion, the more material needs to be removed to restore the original thickness of the leading edge, and the thinner the blade will become. This not only reduces the structural strength of the blade but also makes it prone to failure during service and maintenance. Therefore, the material removal rate is an important parameter to be controlled to extend the life of blades. The redesigned leading-edge profile needs to meet the following basic conditions:
  • The optimized shape must be within the remaining material of the worn blades;
  • The optimization must be within the end-of-life boundary chord length;
  • The optimized blade must have the lowest possible material removal rate.
The simplest solution to satisfy these conditions is creating a leading edge based on a circular shape, which can be fitted to the remaining contours without support lines. However, the flow patterns around the circular leading edge are not sufficient and this geometry must be further optimized. In order to fit the leading edge perfectly to the remaining contours, the newly designed shape must be a combination of the different geometric parts of hyperbolic, circular, and linear parts [19,21,24]. Figure 22 illustrates different redesigned leading-edge contours based on hyperbolic, elliptical, and parabolic constructions. For the hyperbolic configuration, the hyperbolic curve directly matches the profile of the original airfoil on the pressure side, but a straight line and a circular section are required to provide a smooth transition from the hyperbola to the remaining profile on the suction side [33].
The selection of the objective functions determines the optimal effect that can be achieved by optimizing the blade shape. In fact, the two important parameters in fan and compressor blade studies, the pressure ratio and the isentropic efficiency, are mutually constrained and the optimization of one alone may lead to the reduction of the other parameter. The current optimization studies carried out for fan or compressor blades prefer several overall performance parameters such as total pressure loss coefficient [90,91], mass flow rate [92], total pressure ratio [93], isentropic efficiency [94,95], and surge margin [96] as optimization targets to balance the aerodynamic performance of optimized blades and the economy. The erosion blade leading edge optimization procedure developed by Giebmanns et al. [30] achieved a 3% reduction in total pressure loss at design conditions and a reduction in shock loss of the supersonic portion of the developed blade. The advanced recontouring process (ARP) method developed by the team of Hönen [13,14,19] extended the limit of blade chord length loss from 3% to a value exceeding the OEM (original equipment manufacturer) recommended value of 8% by analyzing the fleet data provided by airlines. The installation of the optimized blades increased the engine’s EGT margin by 3 to 4°C and the blade on-wing time was extended by 25%, which is displayed in Figure 23.

5. Summary

Performance degradation due to the inevitable erosion of the fan and compressor blades, the key thrust components of modern aero engines, is an important emerging issue in service. This review presents a comprehensive analysis of the effects of erosion on the leading edge of a blade, including the changes in leading-edge morphology and the performance degradation on a range of components.
Based on the main studies presented in this paper and a review of previous research, the following main conclusions are drawn:
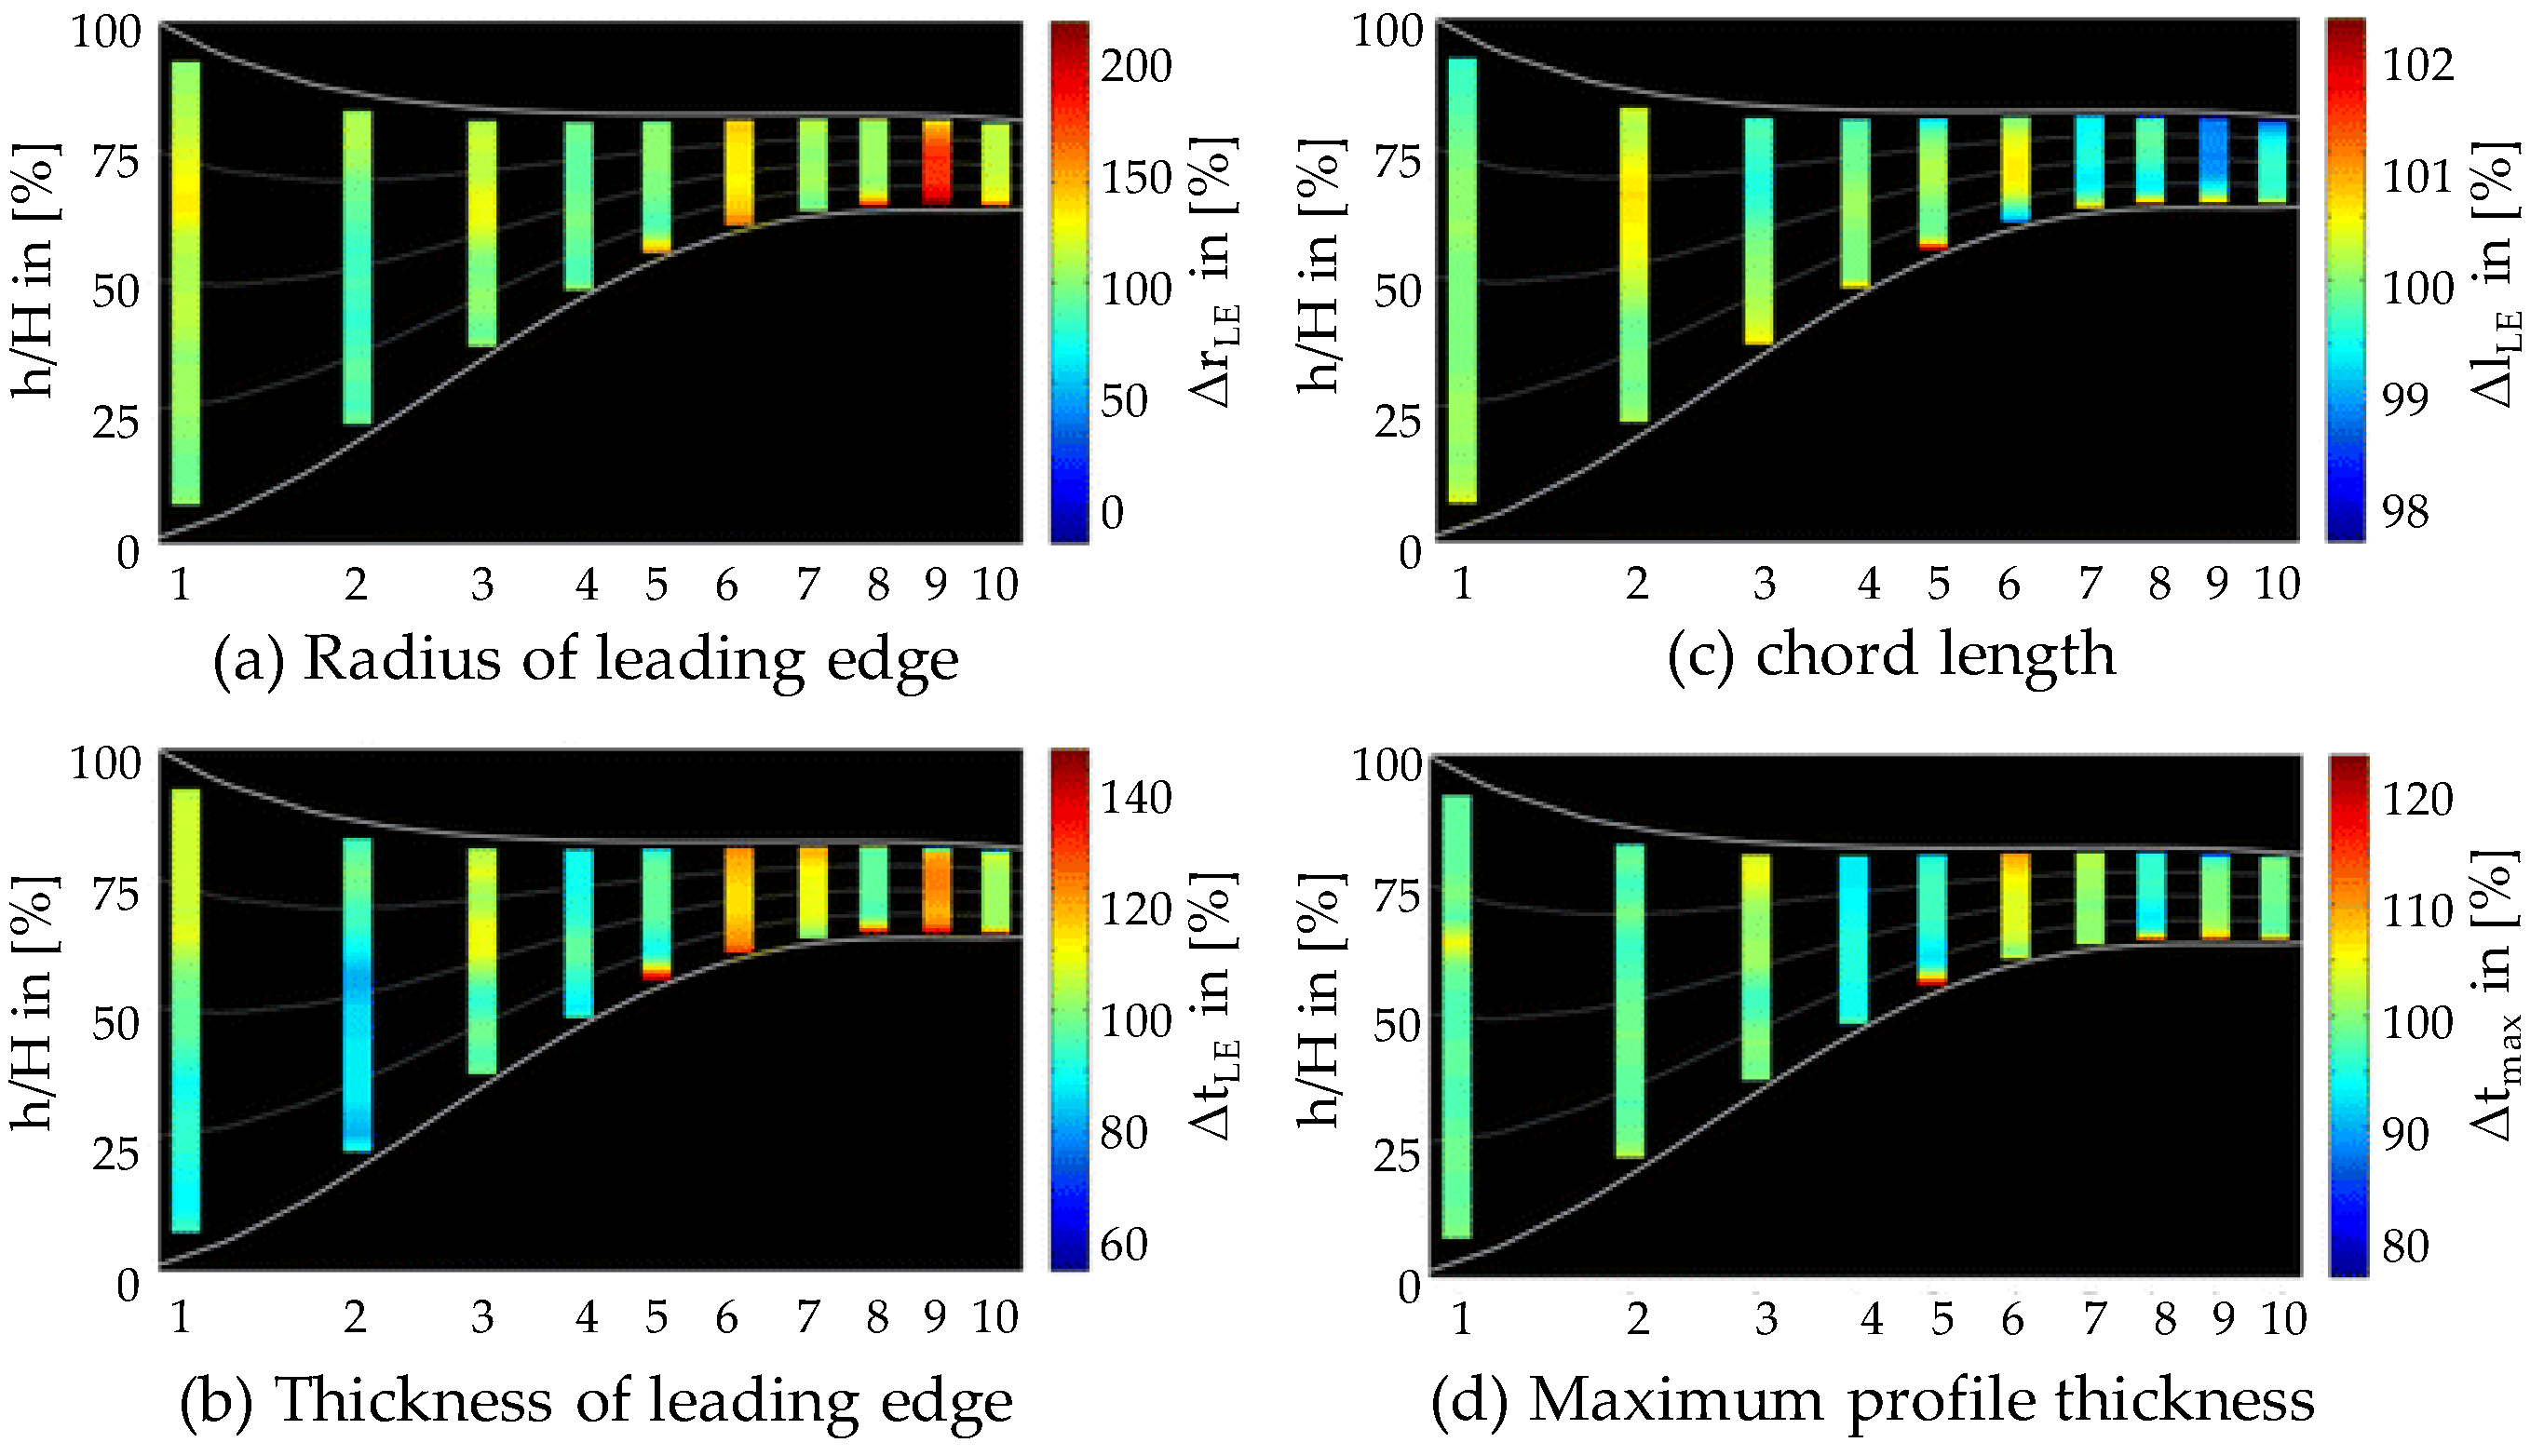
  • The erosion shape of the blade’s leading edge evolves with operating time and is closely related to the operating environment. The chord length shortening, leading edge radius of curvature, and thickness increase are the main features of the erosion model. The current description of the eroded leading-edge morphology is mostly qualitative, for example, the most commonly used single-cut blunt model. Creating statistically characterized and quantitative leading edge erosion models to represent the blade’s erosion derivation process is one of the further research directions.
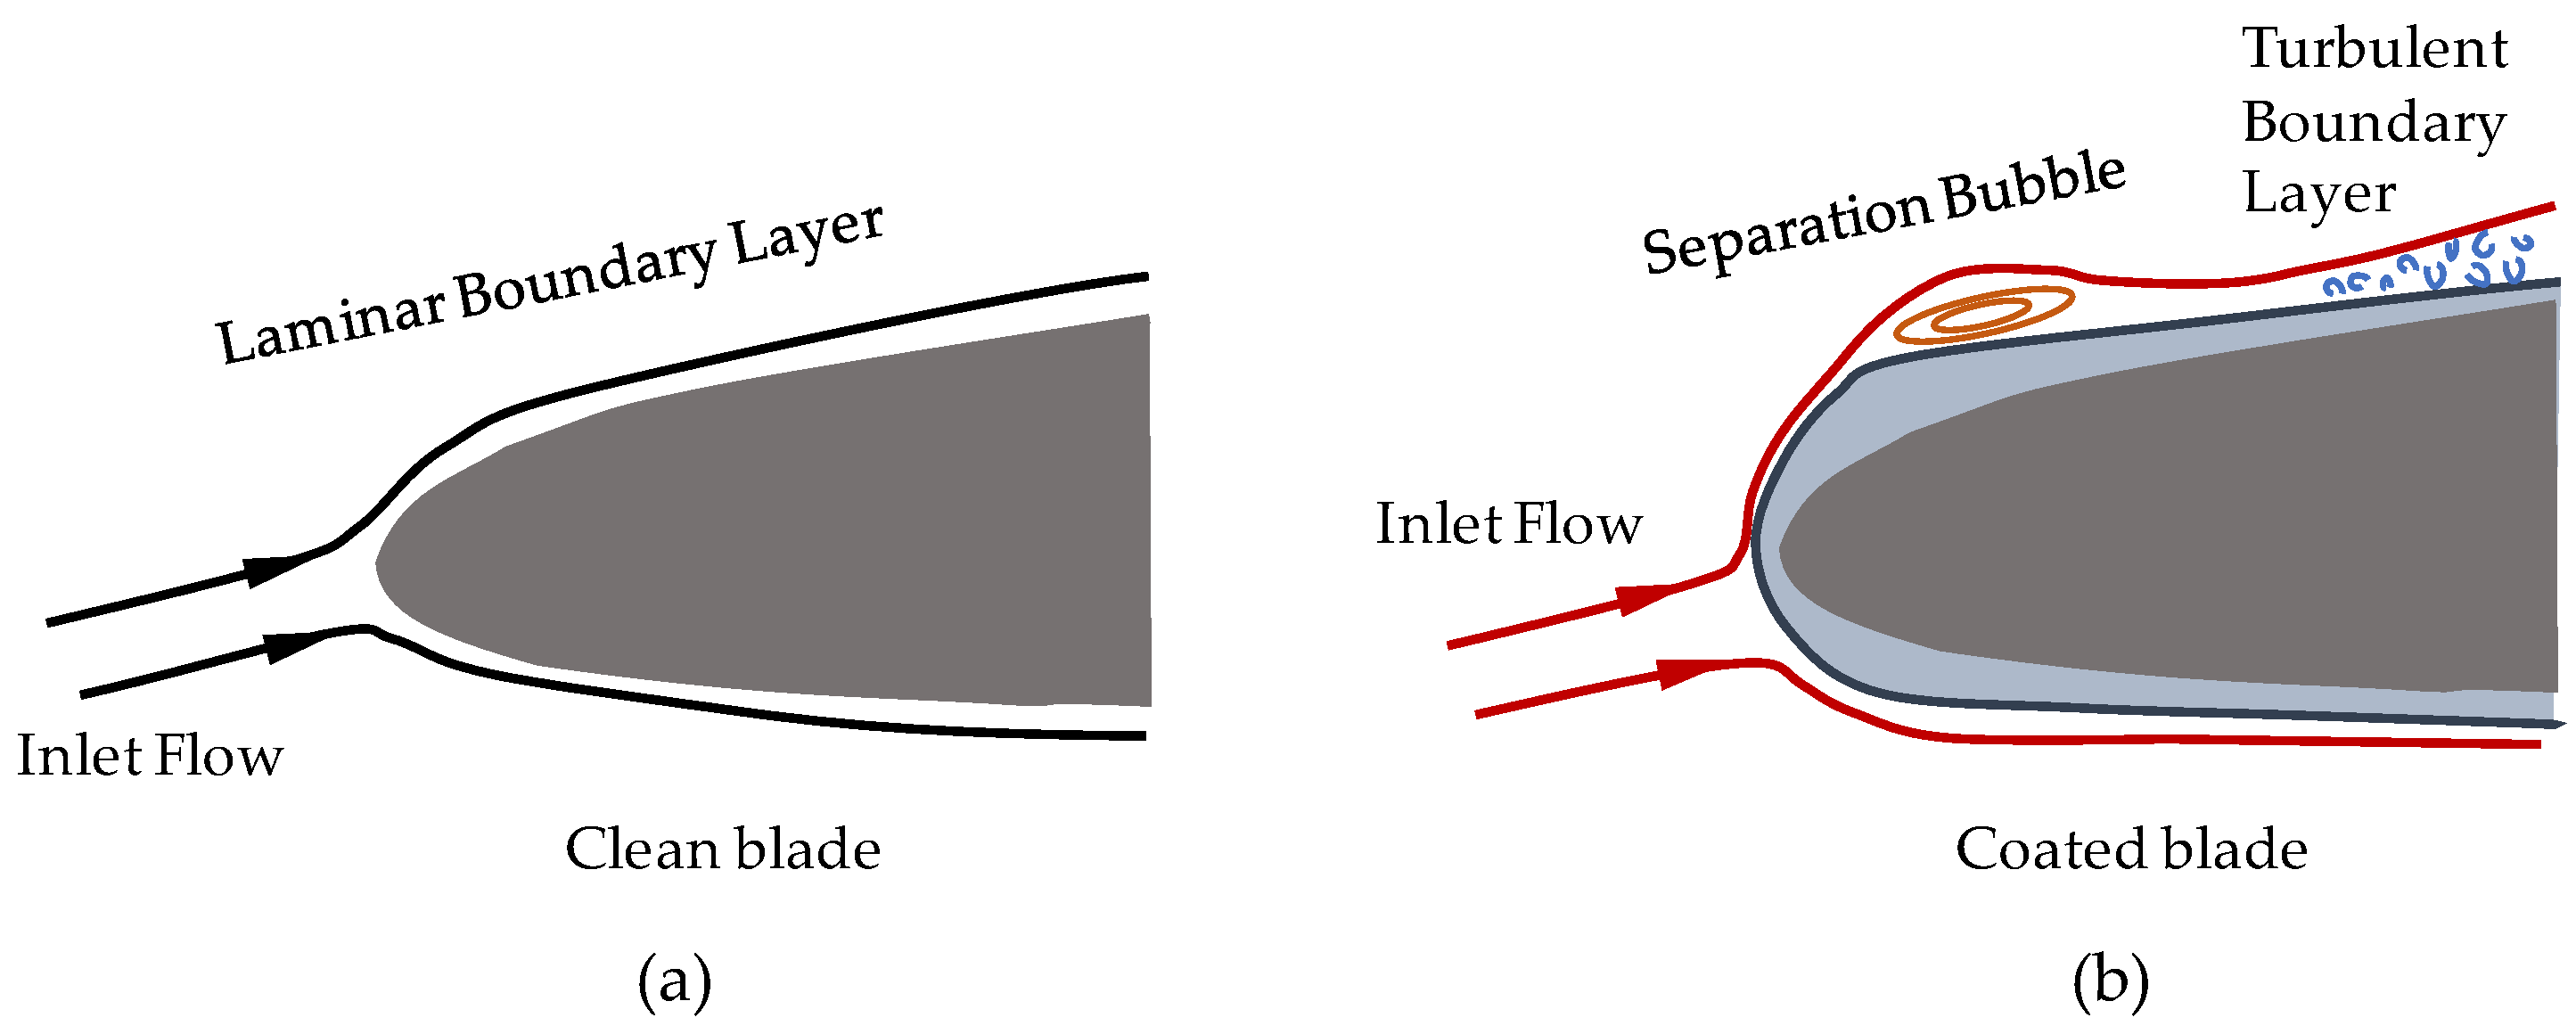
  • The main reason for the increased losses of a subsonic airfoil is that the discontinuous leading-edge curvature induces earlier separation and transition of the airflow, leading to a limited working range, while the influence mechanism of a supersonic airfoil is the increasing intensity of the shock wave and the changing of its position; the losses caused by shock waves are the main reason for the increased profile losses. However, there is a lack of changes in the microscopic flow details, such as the refined turbulence structure induced by eroded leading-edge morphology, and the influence mechanism of the degradation of the aerodynamic performance by blade profiles has not yet been clarified.
  • The transonic portion of the blade (above 65% span) is the most severely eroded and the flow field is the most significantly affected. The effects of erosion can be transmitted to the entire compression system, resulting in lower pressure ratios and efficiencies, reduced stable operating margins, and loss of engine thrust. To compensate for the loss caused by leading edge erosion, the combustion chamber requires more fuel injection, which may lead to a higher EGT, a shorter service life of high-temperature components, and increased equipment operation and maintenance costs.
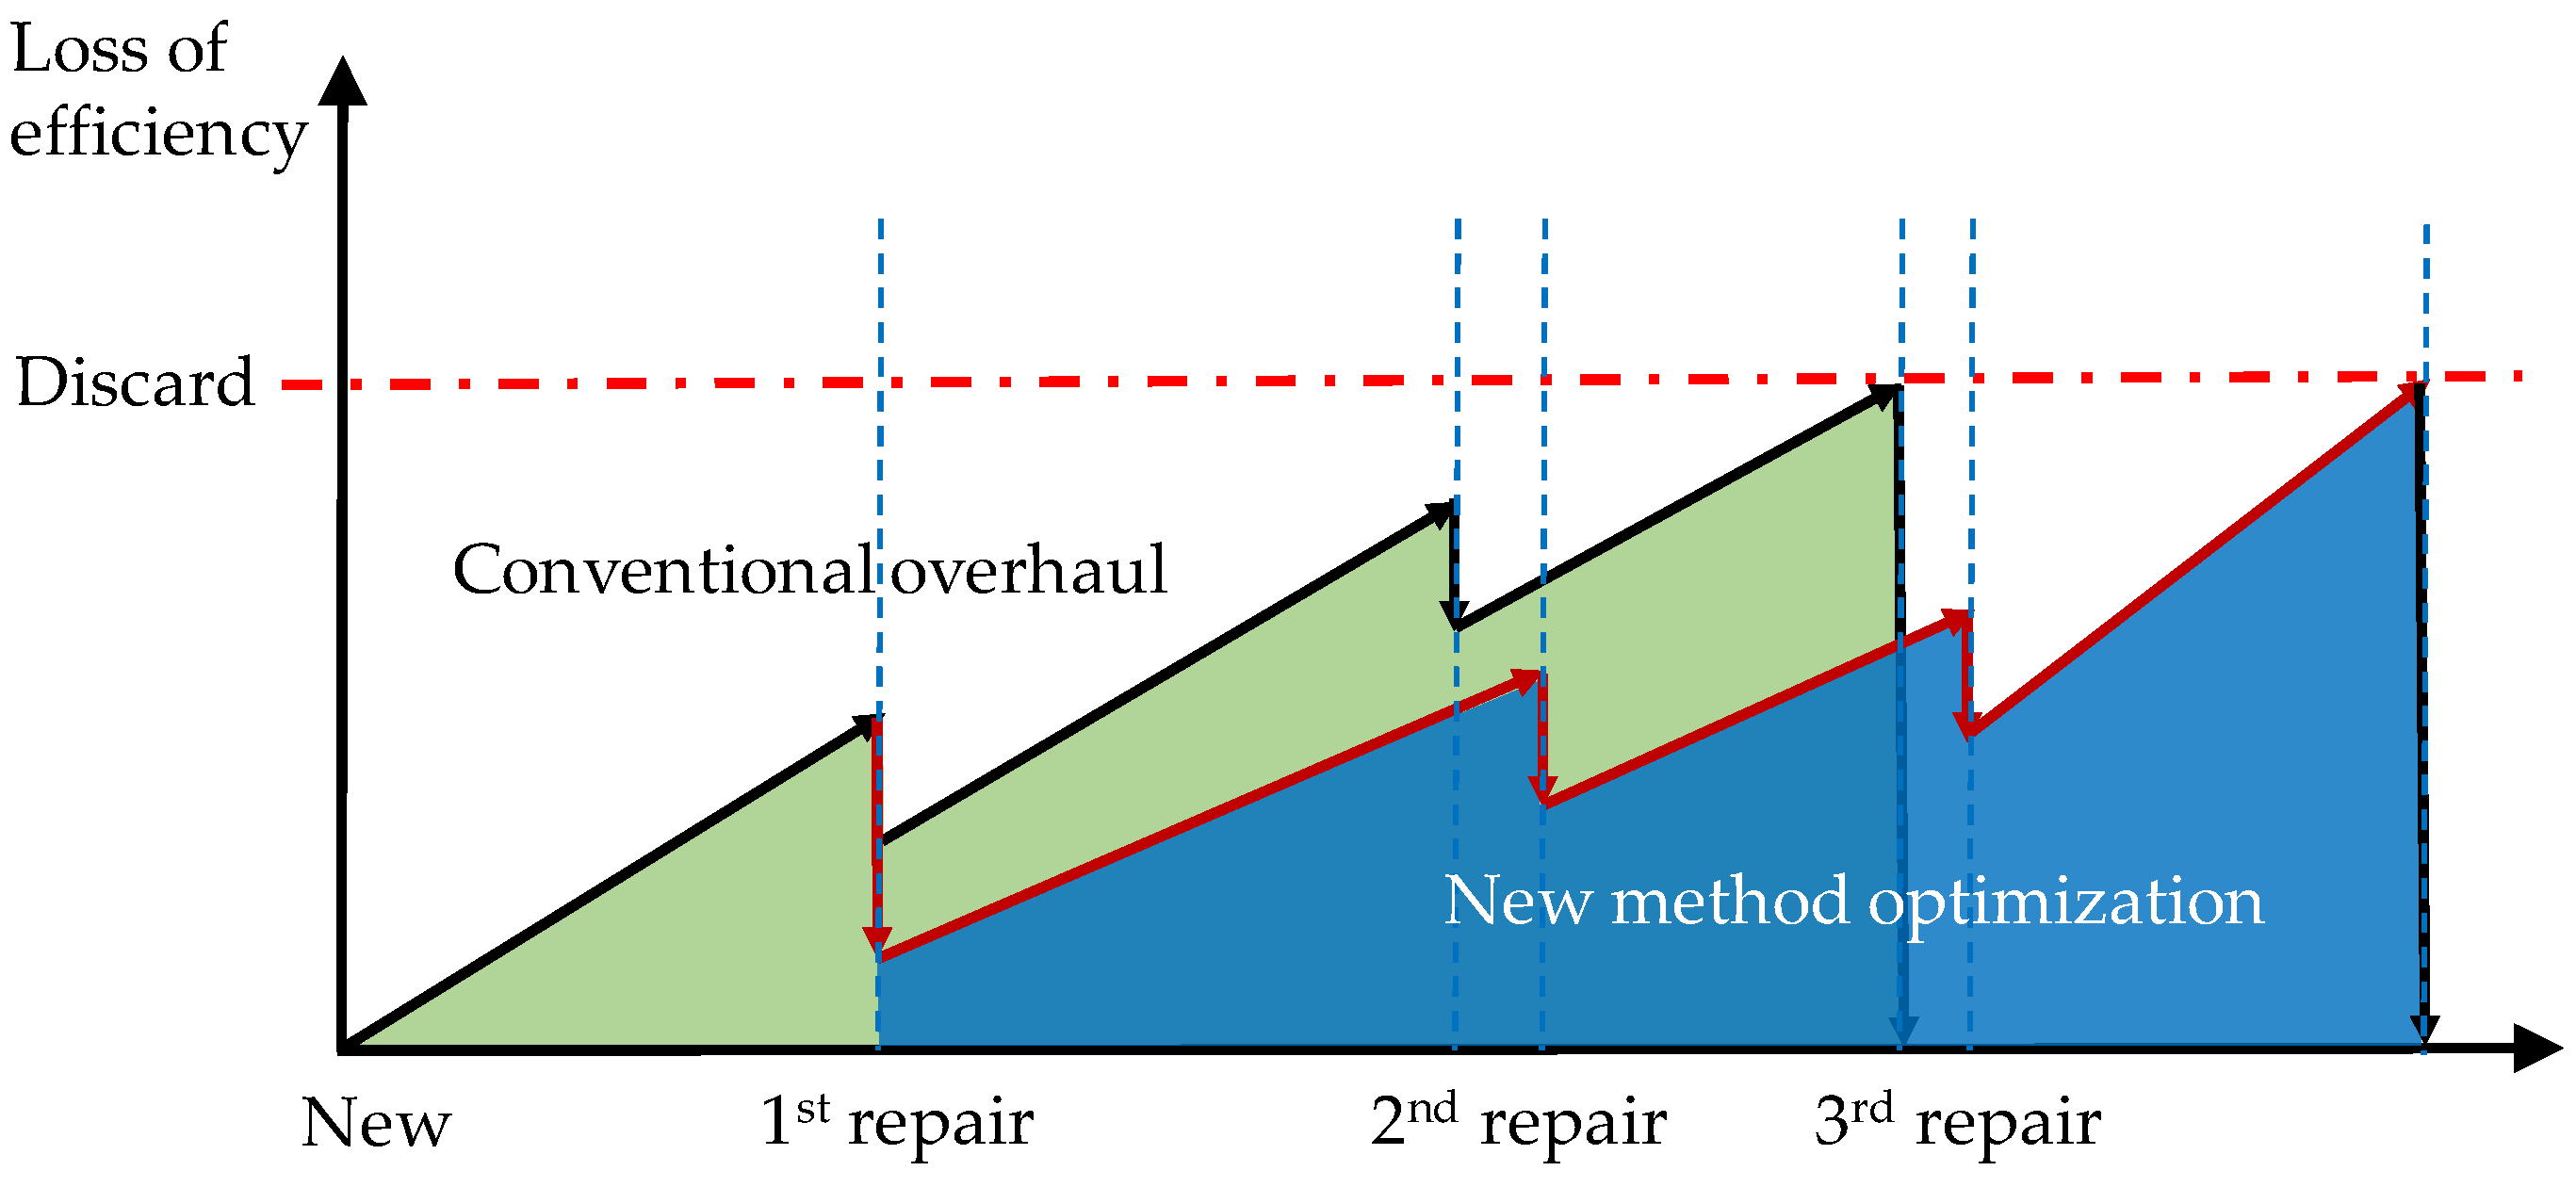
  • The erosion blade optimization process must be limited to the remaining material and the scrap boundary chord length, and the material removal rate needs to be controlled to be as small as possible to extend the blade life. While redesigning the eroded leading-edge blade can result in the partial recovery of performance parameters, it does not address the fact that the aerodynamic performance is declining. In future research, it is advisable to start from the blade design phase to develop blades with erosion-resistant genes.

Author Contributions

Conceptualization, L.S.; writing—original draft preparation, L.S. and S.G.; literature search, L.S., S.G., P.Y. and J.X.; writing—review and editing, L.S., P.Y. and J.X.; organization and editing of the manuscript, S.G. and J.X.; supervision, X.Z.; project administration, L.S. and X.Z.; funding acquisition, L.S. All authors have read and agreed to the published version of the manuscript.

Funding

This research was supported by The National Key Laboratory of Aerodynamic Design and Research Open Fund Projects (No. 6142201200509), and The Key Laboratory of Civil Aircraft Airworthiness Certification Technology Open Fund Projects (No. SH2022070501).

Data Availability Statement

Not applicable.

Conflicts of Interest

The authors declare no conflict of interest.

References

  1. Chen, Y.Y.; Yang, X.H.; Wei, F.F. Development trend of high bypass ratio turbofans design technology. Aeronaut. Astronaut. Sin. 2017, 38, 27–34. [Google Scholar]
  2. Kappis, W.; Guidati, G. Detailed Compressor Degradation Effect Modeling for Single Blade Rows While Assessing Its Local and Overall Consequences. In Proceedings of the ASME Turbo Expo 2012: Turbine Technical Conference and Exposition, Copenhagen, Denmark, 11–15 June 2012; pp. 73–82. [Google Scholar]
  3. Hartmann, J.; Lorenz, M.; Klein, M.; Staudacher, S. The Effect of an Entirely Eroded Airfoil on the Aerodynamic Performance of a Supersonic Compressor Cascade. In Proceedings of the ASME Turbo Expo 2022: Turbomachinery Technical Conference and Exposition, Rotterdam, The Netherlands, 13–17 June 2022. [Google Scholar]
  4. Cai, L.X.; He, Y.; Hou, Y.F.; Li, Y.; Wang, S.S.; Mao, J.R. Research on Particle Motion and Erosion Characteristics in the Blade Passage of Multistage Axial Compressors. In Proceedings of the ASME Turbo Expo 2022: Turbomachinery Technical Conference and Exposition, Rotterdam, The Netherlands, 13–17 June 2022. [Google Scholar]
  5. Alajmi, A.F.; Ramulu, M. Characterization of the Leading-Edge Erosion of Wind Turbine Blades by Sand Particles Impingement. In Proceedings of the ASME 2021 International Mechanical Engineering Congress and Exposition, Virtual, 1–5 November 2021. [Google Scholar]
  6. Sareen, A.; Sapre, C.A.; Selig, M.S. Effects of leading edge erosion on wind turbine blade performance. Wind Energy 2014, 17, 1531–1542. [Google Scholar] [CrossRef]
  7. Tabakoff, W. Review—Turbomachinery Performance Deterioration Exposed to Solid Particulates Environment. J. Fluids Engine 1984, 106, 125–134. [Google Scholar] [CrossRef]
  8. Walton, K.; Blunt, L.; Fleming, L.; Goodhand, M.; Lung, H. Areal parametric characterisation of ex-service compressor blade leading edges. Wear 2014, 321, 79–86. [Google Scholar] [CrossRef] [Green Version]
  9. Reid, L.; Moore, R.D. Design and Overall Performance of Four Highly Loaded, High-Speed Inlet Stages for an Advanced High-Pressure-Ratio Core Compressor; NASA Technical Information Service: Cleveland, OH, USA, 1978. [Google Scholar]
  10. Reid, L.; Urasek, D.C. Experimental Evaluation of the Effects of a Blunt Leading Edge on the Performance of a Transonic Rotor. J. Eng. Power 1973, 95, 199–204. [Google Scholar] [CrossRef]
  11. Roberts, W.B. Axial Compressor Performance Restoration by Blade Profile Control. In Proceedings of the ASME 1984 International Gas Turbine Conference and Exhibit, Amsterdam, The Netherlands, 4–7 June 1984. [Google Scholar]
  12. Roberts, W.B.; Armin, A.; Kassaseya, G.; Suder, K.L.; Thorp, S.A.; Strazisar, A.J. The Effect of Variable Chord Length on Transonic Axial Rotor Performance. J. Turbomach. 2002, 124, 351–357. [Google Scholar] [CrossRef]
  13. Wang, D.; Zhen, Y. Solid Particle Erosion. In Advances of Turbomachinery; Melih, C.K., Isil, Y., Eds.; IntechOpen: Rijeka, Croatia, 2022. [Google Scholar] [CrossRef]
  14. Prata, F.; Rose, B. Chapter 52—Volcanic Ash Hazards to Aviation. In The Encyclopedia of Volcanoes, 2nd ed.; Sigurdsson, H., Ed.; Academic Press: Amsterdam, The Netherlands, 2015; pp. 911–934. [Google Scholar]
  15. Delta TechOps; MDS Coating; America’s Phenix, Inc. Leading Edge Protective Coating Against Fluid and Particulate Erosion for Turbofan Blades[OL]. Presented to FAA Office of Environment and Energy. 2018. Available online: https://www.faa.gov/about/office_org/headquarters_offices/apl/research/aircraft_technology/cleen/2018_may_consortium/media/leading_edge.pdf (accessed on 26 March 2022).
  16. Wood, R.J.K.; Lu, P. Leading edge topography of blades-a critical review. Surf. Topogr.-Metrol. Prop. 2021, 9, 30. [Google Scholar]
  17. FAA. Airport Foreign Object Debris (FOD) Management(AC 150/5210-24); U.S. Department of Transportation: Washington, DC, USA, 2010. [Google Scholar]
  18. Spiro, C.L.; Fric, T.F.; Leon, R.M. Aircraft anti-insect system. U.S. Patent No. 5,683,062, 4 November 1997. [Google Scholar]
  19. Walraevens, R.E.; Cumpsty, N.A. Leading Edge Separation Bubbles on Turbomachine Blades. In Proceedings of the ASME 1993 International Gas Turbine and Aeroengine Congress and Exposition, Cincinnati, OH, USA, 24–27 May 1993. [Google Scholar]
  20. Liu, H.X.; Ling, L.; Jiang, H.K.; Chen, M.Z. Effect of leading edge geometry on separation bubbles on a NACA65 compressor blade. J. Eng. Therm. 2003, 24, 231–233. [Google Scholar]
  21. Lu, H.Z.; Xu, L.P.; Fang, R. Improvement of Compressor Blade Leading Edge Design. J. Aerosp. Power 2000, 15, 129–132. [Google Scholar]
  22. Wheeler, A.P.S.; Sofia, A.; Miller, R.J. The Effect of Leading-Edge Geometry on Wake Interactions in Compressors. In Proceedings of the ASME Turbo Expo 2007: Power for Land, Sea, and Air, Montreal, QC, Canada, 14–17 May 2007; pp. 1769–1779. [Google Scholar]
  23. Wheeler, A.P.S.; Miller, R.J.; Hodson, H.P. The Effect of Wake Induced Structures on Compressor Boundary-Layers. In Proceedings of the ASME Turbo Expo 2006: Power for Land, Sea, and Air, Barcelona, Spain, 8–11 May 2006; pp. 1875–1885. [Google Scholar]
  24. Song, Y.; Gu, C.W. Effect of Leading Edge Shape on the Aerodynamic Performance of Compressor. J. Eng. Therm. 2013, 34, 1051–1054. [Google Scholar]
  25. Diakunchak, I.S. Performance Deterioration in Industrial Gas Turbines. In Proceedings of the ASME 1991 International Gas Turbine and Aeroengine Congress and Exposition, Orlando, FL, USA, 3–6 June 1991. [Google Scholar]
  26. Tabakoff, W.; Hamed, A.; Murugan, D.M. Effect of target materials on the particle restitution characteristics for turbomachinery application. J. Propul. Power 1996, 12, 260–266. [Google Scholar] [CrossRef]
  27. Tabakoff, W.; Kotwal, R.; Hamed, A. Erosion study of different materials affected by coal ash particles. Wear 1979, 52, 161–173. [Google Scholar] [CrossRef]
  28. Grant, G.; Tabakoff, W. Erosion Prediction in Turbomachinery Resulting from Environmental Solid Particles. J. Aircr. 1975, 12, 471–478. [Google Scholar] [CrossRef]
  29. Marx, J.; Städing, J.; Reitz, G.; Friedrichs, J. Investigation and analysis of deterioration in high pressure compressors due to operation. CEAS Aeronaut. J. 2014, 5, 515–525. [Google Scholar] [CrossRef] [Green Version]
  30. Giebmanns, A.; Schnell, R.; Werner-Spatz, C. A Method for Efficient Performance Prediction for Fan and Compressor Stages with Degraded Blades. In Proceedings of the ASME Turbo Expo 2015: Turbine Technical Conference and Exposition, Montreal, QC, Canada, 15–19 June 2015. [Google Scholar]
  31. Suzuki, M.; Inaba, K.; Yamamoto, M. Numerical simulation of sand erosion phenomena in rotor/stator interaction of compressor. J. Therm. Sci. 2008, 17, 125–133. [Google Scholar] [CrossRef]
  32. Hönen, H.; Panten, M. Recontouring of Jet Engine Compressor Blades by Flow Simulation. Int. J. Rotating Mach. 2001, 7, 467219. [Google Scholar] [CrossRef]
  33. Hoenen, H.T.; Ellenberger, K. Jet Engine Compressor Blade Refurbishment by Application of the Advanced Re-Contouring Process. In Proceedings of the ASME Turbo Expo 2003, Collocated with the 2003 International Joint Power Generation Conference, Atlanta, GA, USA, 16–19 June 2003; pp. 619–624. [Google Scholar]
  34. Wang, G.; Li, J.F.; Jia, X.J.; Li, F.Y.; Liu, Z.W. Study on Erosion Behavior and Mechanism of Impeller’s Material FV520B in Centrifugal Compressor. J. Mech. Eng. 2014, 50, 182–190. [Google Scholar] [CrossRef]
  35. Wang, G.; Li, J.F.; Jia, X.J.; Liu, Z.W.; Gong, B.L. Establishment and verification of an erosion model for metal materials FV520B. J. Harbin Eng. Univ. 2015, 36, 714–719. [Google Scholar]
  36. Gohardani, O. Impact of erosion testing aspects on current and future flight conditions. Prog. Aerosp. Sci. 2011, 47, 280–303. [Google Scholar] [CrossRef]
  37. Ma, D.N.; Harvey, T.J.; Wellman, R.G.; Wood, R.J. Characterisation of rain erosion at ex-service turbofan blade leading edges. Wear 2019, 426, 539–551. [Google Scholar] [CrossRef]
  38. Hönen, H.; Ellenberger, K. Performance Enhancement for Overhauled Jet Engines by Application of the Advanced Recontouring Process. In Proceedings of the 9th International Symposium on Transport Phenomena and Dynamic of Rotating Machinery, Honolulu, HI, USA, 10–14 February 2002. [Google Scholar]
  39. Giebmanns, A.; Schnell, R.; Steinert, W.; Hergt, A.; Nicke, E.; Werner-Spatz, C. Analyzing and Optimizing Geometrically Degraded Transonic Fan Blades by Means of 2D and 3D Simulations and Cascade Measurements. In Proceedings of the ASME Turbo Expo 2012: Turbine Technical Conference and Exposition, Copenhagen, Denmark, 11–15 June 2012; pp. 279–288. [Google Scholar]
  40. Lindsley, B.A.; Marder, A.R. The effect of velocity on the solid particle erosion rate of alloys. Wear 1999, 225–229, 510–516. [Google Scholar] [CrossRef]
  41. Mahdipoor, M.S.; Kirols, H.S.; Kevorkov, D.; Jedrzejowski, P.; Medraj, M. Influence of impact speed on water droplet erosion of TiAl compared with Ti6Al4V. Sci. Rep. 2015, 5, 14182. [Google Scholar] [CrossRef] [Green Version]
  42. Sayma, A.I.; Kim, M.; Smith, N.H.S. Leading-Edge Shape and Aeroengine Fan Blade Performance. J. Propul. Power 2003, 19, 517–520. [Google Scholar] [CrossRef]
  43. Goodhand, M.N.; Miller, R.J.; Lung, H.W. The Sensitivity of 2D Compressor Incidence Range to In-Service Geometric Variation. In Proceedings of the ASME Turbo Expo 2012: Turbine Technical Conference and Exposition, Copenhagen, Denmark, 11–15 June 2012; pp. 159–170. [Google Scholar]
  44. Hufnagel, M.; Staudacher, S.; Koch, C. Experimental and Numerical Investigation of the Mechanical and Aerodynamic Particle Size Effect in High-Speed Erosive Flows. J. Eng. Gas Turbines Power 2018, 140, 102604. [Google Scholar] [CrossRef]
  45. Ghenaiet, A.; Tan, S.C.; Elder, R.L. Experimental investigation of axial fan erosion and performance degradation. Proc. Inst. Mech. Eng. Part A-J. Power Energy 2004, 218, 437–450. [Google Scholar] [CrossRef]
  46. Ghenaiet, A. Study of Sand Particle Trajectories and Erosion Into the First Compression Stage of a Turbofan. J. Turbomach. 2012, 134, 051025. [Google Scholar] [CrossRef]
  47. Suman, A.; Casari, N.; Fabbri, E.; Pinelli, M.; di Mare, L.; Montomoli, F. Gas Turbine Fouling Tests: Review, Critical Analysis, and Particle Impact Behavior Map. J. Eng. Gas Turbines Power 2019, 141, 032601. [Google Scholar] [CrossRef]
  48. Syverud, E.; Brekke, O.; Bakken, L.E. Axial Compressor Deterioration Caused by Saltwater Ingestion. J. Turbomach. 2007, 129, 119–126. [Google Scholar] [CrossRef] [Green Version]
  49. Igie, U.; Pilidis, P.; Fouflias, D.; Ramsden, K.; Laskaridis, P. Industrial Gas Turbine Performance: Compressor Fouling and On-Line Washing. J. Turbomach. 2014, 136, 101001. [Google Scholar] [CrossRef]
  50. Dunn, M.G. Operation of Gas Turbine Engines in an Environment Contaminated with Volcanic Ash. J. Turbomach. 2012, 134, 051001. [Google Scholar] [CrossRef]
  51. Ghenaiet, A.; Tan, S.C.; Eder, R.L. Prediction of an axial turbomachine performance degradation due to sand ingestion. Proc. Inst. Mech. Eng. Part A-J. Power Energy 2005, 219, 273–287. [Google Scholar] [CrossRef]
  52. Pi, J.; Huang, L.; Gao, S.W.; Huang, J.B.; Ma, L. Numerical Simulation of Particle Erosion in High Pressure Turbine Blade of Gas Turbine. Lubr. Eng. 2018, 43, 19–23. [Google Scholar]
  53. Balan, C.; Tabakoff, W. Axial flow compressor performance deterioration. In Proceedings of the 20th Joint Propulsion Conference, Cincinnati, OH, USA, 11–13 June 1984. [Google Scholar]
  54. Dunn, M.G.; Padova, C.; Moller, J.E.; Adams, R.M. Performance Deterioration of a Turbofan and a Turbojet Engine Upon Exposure to a Dust Environment. J. Eng. Gas Turbines Power 1987, 109, 336–343. [Google Scholar] [CrossRef]
  55. Elmstrom, M.E.; Millsaps, K.T.; Hobson, G.V.; Patterson, J.S. Impact of Nonuniform Leading Edge Coatings on the Aerodynamic Performance of Compressor Airfoils. J. Turbomach. 2011, 133, 041004. [Google Scholar] [CrossRef]
  56. Suder, K.L.; Chima, R.V.; Strazisar, A.J.; Roberts, W.B. The Effect of Adding Roughness and Thickness to a Transonic Axial Compressor Rotor. J. Turbomach. 1995, 117, 491–505. [Google Scholar] [CrossRef] [Green Version]
  57. Oka, Y.I.; Okamura, K.; Yoshida, T. Practical estimation of erosion damage caused by solid particle impact: Part 1: Effects of impact parameters on a predictive equation. Wear 2005, 259, 95–101. [Google Scholar] [CrossRef]
  58. Tabakoff, W.; Hussein, M.F. Effect of Suspended Solid Particles on the Properties in Cascade Flow. AIAA Journal 1971, 9, 1514–1519. [Google Scholar] [CrossRef]
  59. Hamed, A.A.; Tabakoff, W.; Rivir, R.B.; Das, K.; Arora, P. Turbine Blade Surface Deterioration by Erosion. J. Turbomach. 2004, 127, 445–452. [Google Scholar] [CrossRef]
  60. Castorrini, A.; Venturini, P.; Corsini, A.; Rispoli, F. Numerical Simulation of the Blade Aging Process in an Induced Draft Fan Due to Long Time Exposition to Fly Ash Particles. J. Eng. Gas Turbines Power 2018, 141, 011025. [Google Scholar] [CrossRef]
  61. Werner-Spatz, C.; Brands, M.; Czerner, S.; Kraft, J.; Döbbener, G.; Haslinger, W.; Alberts, M.; Hoffmann, S.; Polley, A.; Giebmanns, A.; et al. Analysis of Geometry Influences on Aircraft Engine Compressor Performance. In Proceedings of the ANSYS Conference & 29th CADFEM Users’ Meeting 2011, Stuttgart, Germany, 19–21 October 2011. [Google Scholar]
  62. Hergt, A.; Klinner, J.; Steinert, W.; Grund, S.; Beversdorff, M.; Giebmanns, A.; Schnell, R. The Effect of an Eroded Leading Edge on the Aerodynamic Performance of a Transonic Fan Blade Cascade. J. Turbomach. 2015, 13, 021006. [Google Scholar] [CrossRef]
  63. Li, L.; Liu, H.X.; Li, P. Aerodynamic Influence of Compressor Blade with Blunt Leading Edge on Boundary Layer Performance. J. Propul. Tech. 2018, 39, 299–307. [Google Scholar]
  64. Shi, L.; Yang, G.; Ding, G.H.; Lin, W.J. Fine maintenance of an eroded fan rotor and related flow characteristics analysis. Acta Aeronaut. Astronaut. Sin. 2020, 41, 311–324. [Google Scholar]
  65. Shi, L.; Yang, G.; Lin, W.J. Influence mechanism of leading-edge erosion on aerodynamic performance of fan rotor blade. Acta Aeronaut. Astronaut. Sin. 2019, 40, 105–115. [Google Scholar]
  66. Li, L.; Liu, H.X. Impact Analysis of Leading Edges on Blade Suction Surface Boundary Layer Three-dimensional Flow. Aeroengine 2022, 48, 40–46. [Google Scholar]
  67. Kumar, A.; Nair, P.B.; Keane, A.J.; Shahpar, S. Probabilistic Performance Analysis of Eroded Compressor Blades. In Proceedings of the ASME 2005 Power Conference, Chicago, IL, USA, 5–7 April 2005; pp. 1175–1183. [Google Scholar]
  68. Lai, A.Q.; Tan, Y.; Li, S.L. Research on Influence of Edge Wear on Transonic Compressor Blade Performance. Comput. Simul. 2020, 37, 20–24. [Google Scholar]
  69. Gunn, E.J.; Brandvik, T.; Wilson, M.J.; Maxwell, R. Fan Stability with Leading Edge Damage: Blind Prediction and Validation. J. Turbomach. 2022, 144, 091015. [Google Scholar] [CrossRef]
  70. Li, Z.; Yu, H.W.; Yin, H.S.; Zhang, S.P. The influence of ellipse leading edge sharpness on the performance of subsonic compressor blade. Gas Turbine Exp. Res. 2018, 31, 14–17. [Google Scholar]
  71. Cao, C.J.; Qiu, Y.; Li, B. Influence of leading edge shape of subsonic airfoil on compressor aerodynamic performance. Gas Turbine Exp. Res. 2018, 31, 1–7. [Google Scholar]
  72. Yu, X.J.; Zhu, H.W.; Liu, B.J. Effects of Leading-Edge Geometry on Boundary Layer Parameters in Subsonic Airfoil. J. Eng. Thermophys. 2017, 38, 2108–2118. [Google Scholar]
  73. Zhang, X.L.; Jiang, B.; Zheng, Q.; Chen, Z.L. Correlation between the leading edge of compressor blade and local los. J. Harbin Eng. Univ. 2015, 36, 484–488, 493. [Google Scholar]
  74. Goodhand, M.N.; Miller, R.J. Compressor Leading Edge Spikes: A New Performance Criterion. J. Turbomach. 2010, 133, 021006. [Google Scholar] [CrossRef]
  75. Singh, P.; Sarkar, S. Excitation of Shear Layer Due to Surface Roughness Near the Leading Edge: An Experiment. J. Fluids Eng. 2021, 143, 051301. [Google Scholar] [CrossRef]
  76. Tucker, P.G. Trends in turbomachinery turbulence treatments. Prog. Aerosp. Sci. 2013, 63, 1–32. [Google Scholar]
  77. Hergt, A.; Klinner, J.; Wellner, J.; Willert, C.; Grund, S.; Steinert, W.; Beversdorff, M. The Present Challenge of Transonic Compressor Blade Design. J. Turbomach. 2018, 141, 091004. [Google Scholar] [CrossRef]
  78. Liu, B.; Shi, H.; Yu, X. A new method for rapid shock loss evaluation and reduction for the optimization design of a supersonic compressor cascade. Proc. Inst. Mech. Eng. Part G J. Aerosp. Eng. 2018, 232, 2458–2476. [Google Scholar] [CrossRef]
  79. Qiu, M.; Chen, T.; Wang, Z.W.; Hao, Y.; Jiang, Z.Y. Process in Supersonic Cascade of Compressor. In Proceedings of the 2017 (3rd) China Aviation Science and Technology Conference, Beijing, China, 19–20 September 2017. [Google Scholar]
  80. Yang, S.H.; Zhao, Q.J.; Sun, X.L.; Xu, J.Z. Research on the Shock Loss Model for Supersonic Cascades. J. Eng. Thermophys. 2015, 36, 292–296. [Google Scholar]
  81. Gostelow, J.P.; Mahallati, A.; Andrews, S.A.; Carscallen, W.E. Measurement and Computation of Flowfield in Transonic Turbine Nozzle Blading with Blunt Trailing Edges. In Proceedings of the ASME Turbo Expo 2009: Power for Land, Sea, and Air, Orlando, FL, USA, 5–7 June 2009; pp. 979–991. [Google Scholar]
  82. Szczepankowski, A.; Szymczak, J.; Przysowa, R. The Effect of a Dusty Environment upon Performance and Operating Parameters of Aircraft Gas Turbine Engines. J. KONBiN 2011, 1, 257–268. [Google Scholar]
  83. Li, X.J.; Jin, H.L.; Gui, X.M. Performance numerical investigation of double-channel fan/compressor. J. Aerosp. Power 2009, 24, 2719–2726. [Google Scholar]
  84. Dawes, W.N. Multi-Blade Row Navier-Stokes Simulations of Fan-Bypass Configurations. In Proceedings of the ASME 1991 International Gas Turbine and Aeroengine Congress and Exposition, Orlando, FL, USA, 3–6 June 1991. [Google Scholar]
  85. Huang, C.; Shi, L.; Wu, W.; Yu, P.; Ma, L.; Jiang, Q.; Air, X. Influence of fan rotor leading edge erosion on the flow characteristics of the compression system. In Proceedings of the Global Power and Propulsion Society, Xi’an, China, 8–20 October 2021. [Google Scholar]
  86. Xue, B.W.; Shi, L.; Li, X.X.; Peng, H.B.; Ma, L.; Jiang, Q. Influence of leading edge erosion on the performance of transonic fan blade. In Proceedings of the Global Power and Propulsion Society, Xi’an, China, 8–20 October 2021. [Google Scholar]
  87. Giebmanns, A.; Backhaus, J.; Frey, C.; Schnell, R. Compressor Leading Edge Sensitivities and Analysis with an Adjoint Flow Solver. In Proceedings of the ASME Turbo Expo 2013: Turbine Technical Conference and Exposition, San Antonio, TX, USA, 3–7 June 2013. [Google Scholar]
  88. Gao, L.M.; Wang, H.H.; Yang, G.; Ma, C.; Huang, P.; Tang, K. Discussion on Machining Defects of Blade Leading Edge and Aerodynamic Qualification. J. Propul. Tech. 2022. accepted. Available online: https://kns.cnki.net/kcms/detail/11.1813.V.20220728.1546.003.html (accessed on 24 March 2023).
  89. Roberts, W.B. Advanced Turbofan Blade Refurbishment Technique. J. Turbomach. 1995, 117, 666–667. [Google Scholar] [CrossRef]
  90. Huang, L.; Yu, H.W. Multi-objective optimization design of single-stage transonic fan rotor blade. Gas Turbine Exp. Res. 2016, 29, 30–34. [Google Scholar]
  91. Sun, X.D.; Han, W.J. The Study on the Multi-objective Optimization Design of the Rotor of Transonic Compressor. Turbine Tech. 2009, 51, 448–450. [Google Scholar]
  92. Liu, Z.X.; Han, B.; Lu, Y.M. Application of the Objective Optimization Algorithm in Parametric Design of Impeller Blade. J. Tianjin Univ. (Sci. Technol.) 2017, 50, 19–27. [Google Scholar]
  93. Zhong, J.J.; Gao, Y.; Li, X.D. Multi-objective optimization of a transonic compressor rotor. J. Dalian Marit. Univ. 2017, 43, 89–96. [Google Scholar]
  94. Lian, Y.; Liou, M.-S. Multi-objective optimization of transonic compressor blade using evolutionary algorithm. J. Propul. Power 2005, 21, 979–987. [Google Scholar] [CrossRef] [Green Version]
  95. Flassig, P.M. Multi-Objective Compressor Blade Optimisation Using a Non-Dimensional Parameterisation Approach. In Proceedings of the CEAS European Air and Space Conference, Berlin, Germany, 10–13 September 2007. [Google Scholar]
  96. Casoni, M.; Magrini, A.; Benini, E. Supersonic Compressor Cascade Shape Optimization under Multiple Inlet Mach Operating Conditions. Aerospace 2019, 6, 64. [Google Scholar] [CrossRef] [Green Version]
Figure 1. Thrust specific fuel consumption (TSFC) comparison of eroded versus clean fan blades. Reproduced from [15].
Energies 16 03068 g001
Figure 2. Fan blade leading-edge morphology: (a) Reference (left) and worn (right) leading edge; (b) leading edge erosion with loss of chord length.
Energies 16 03068 g002
Figure 3. Variety of leading-edge contours of worn airfoils. Adapted with permission from [32], Copyright Hindawi Publishing Corporation, 2001.
Energies 16 03068 g003
Figure 4. The erosion evolution process of the fan blades’ leading edge.
Energies 16 03068 g004
Figure 5. A comparison of the cross-section profiles of the ex-service turbofan leading edge. Reproduced from [37].
Energies 16 03068 g005
Figure 6. The spatial arrangement of three degradation forms of leading edge for IPC blades. Adapted with permission from [8], Copyright Elsevier, 2014.
Energies 16 03068 g006
Figure 7. Particle erosion of fan rotor blades: (a) Trajectory of particles; (b) erosion rate cloud map of the pressure side; and (c) the erosion rate distribution curves at different spans.
Energies 16 03068 g007
Figure 8. Erosion blades of the 6th and 8th high-pressure compressors.
Energies 16 03068 g008
Figure 9. Schematic of erosion blades: (a) Erosion of chord over the outer 50% height; (b) degree of erosion in different blade height sections. Reproduced from [12].
Energies 16 03068 g009
Figure 10. Flow near the leading edge of a (a) clean blade and (b) coated blade. Reproduced from [55].
Energies 16 03068 g010
Figure 11. Erosion blade modeling of the elliptical leading edge. Reproduced from [63].
Energies 16 03068 g011
Figure 12. Pressure coefficient distribution on the suction side with an incidence angle ranging from 0° to 7°. Reproduced from [63].
Energies 16 03068 g012
Figure 13. Comparison of the total pressure loss factors of original, eroded, and optimized blades.
Energies 16 03068 g013
Figure 14. The contour of the Mach number distribution at the leading edge of an (a) original blade and (b) eroded blade.
Energies 16 03068 g014
Figure 15. (a) Boundary layer thicknesses at the suction side and (b) static pressure coefficient of reference and degraded profiles.
Energies 16 03068 g015
Figure 16. Results of PIV at front shock position (top), mid shock position (middle), and rear shock position (bottom): (a) Laminar condition and (b) turbulent condition. Reproduced from [77].
Energies 16 03068 g016
Figure 17. The total and shock loss for reference and eroded blades. Reproduced from [39].
Energies 16 03068 g017
Figure 18. Static pressure of original and eroded blade at design point: (a) Pressure around the rotor blade at mid-span and (b) pressure around the rotor blade near the tip.
Energies 16 03068 g018
Figure 19. Overall HPC deterioration. Adapted with permission from [29], Copyright Springer, 2014.
Energies 16 03068 g019
Figure 20. Characteristic line of the original and eroded blades with the change of back pressure at the (a) duct outlet and (b) core duct. Adapted from [85] of Shi’s group.
Energies 16 03068 g020
Figure 21. The parameterization of the eroded leading edge to be optimized.
Energies 16 03068 g021
Figure 22. Possible optimized leading-edge contours for the eroded leading edge. Reproduced from [33].
Energies 16 03068 g022
Figure 23. Comparison of the efficiency loss and refurbishment costs of conventionally overhauled and optimized blades. Reproduced from [33].
Energies 16 03068 g023
Table 2. Engine thrust loss at different working conditions.
Flight PhasesOperating ConditionsActual Thrust (N)Thrust Loss Rate (%)
Takeoff conditionsDesign points15640.90
Core duct near the surging point0.91
Bypass duct near the surging point2.20
Climbing conditionsDesign points12050.78
Core duct near the surging point0.76
Bypass duct near the surging point2.80
Cruising conditionDesign points9151.02
Core duct near the surging point0.99
Bypass duct near the surging point2.24
Disclaimer/Publisher’s Note: The statements, opinions and data contained in all publications are solely those of the individual author(s) and contributor(s) and not of MDPI and/or the editor(s). MDPI and/or the editor(s) disclaim responsibility for any injury to people or property resulting from any ideas, methods, instructions or products referred to in the content.

