1. Introduction
Every country is gradually anticipating sustainable development as it is glaring in the sustainable development goals and strategies where energy is a significant factor [
1]. To keep track of sustainable development goals (SDGs), several countries have adopted different policy frameworks and plan to build greener economies [
2]. Despite these efforts toward energy savings and transition, the living standard is increasing around the world; this is particularly evident in developing economies and thus drives an increase in energy consumption [
3,
4,
5,
6]. This increasing energy consumption has necessitated an increase in fossil exploration over the years, which has degenerated into environmental challenges and further threatened environmental protection. Consequently, the adoption of alternative or renewable energy use through different techniques, procedures, and sizes in different countries has been considered the best option to increase energy production to meet global demand in a sustainable way [
3]. To this end, the energy transition project attracted an investment of approximately USD 329 billion around the world in 2015 and is said to require a minimum investment of USD 16,500 billion annually to achieve environmental sustainability by 2040.
Although most nations are pursuing these goals through different strategies, the deployment of primary energy resources stands out as the common pathway in most of their strategies [
3,
4,
5,
6]. Furthermore, in recent years, the world has witnessed a series of changes in the social and economic environments and in the political and technological systems, all of which are impacting the global energy market differently [
7]. Therefore, we can expect a future characterized by more technological advances and an energy revolution as countries grow their unique resources to expand their alternative energy options in primary energy consumption.
According to the report of the International Energy Agency (2021) [
8], global energy demand will increase by approximately 30% by 2040, but this rate is slower than in the past thanks to energy efficiency efforts. Meanwhile, developing economies such as India, China, and others in Asia are estimated to drive the major share of demand, with more than two-thirds, while their counterparts in Africa, Latin America, and the Middle East will account for the remaining one-third share. The report further revealed that the world will continue to experience growth in oil demand until 2040, with about a 45% increase in the use of natural gas; however, this will be at a decreasing rate with limited expansion possibilities as compared to the past. In the same timeframe, the use of renewable energy is expected to increase and account for more than two-thirds of energy investments, especially in the energy sector, and enjoy greater utilization as a low-cost source of energy generation in many countries.
However, economic growth, increasing global population, urban development, and migration also constitute critical trends that impact energy systems and drive global energy demand; therefore, triggering supply needs [
7]. In addition, several studies have confirmed the growing network between global energy systems and global food systems, especially in this era of energy transition from fossil to renewables [
9]. Given that energy and food are crucial resources for economic growth and indispensable indicators of sustainable development, current concerns and future uncertainties impact the affordability of food and energy in connection with the respective primary energy sources. According to Zhu (2009) [
10] and Popp et al. (2013) [
11], the rapidly increasing connection between political stability and energy and food security has contributed to social restiveness and economic crises in many countries. Economies that rely on imports for food and energy have been hit by an unprecedented increase in food and energy prices worldwide since 2007. Therefore, the objective of this work is to examine the trends of primary energy sources in relation to energy and food prices by comparing the relative price level of food and energy from various origins and identifying whether the price levels of fossil or clean energy sources are similar or within the same range. A database with two years of data has been analyzed and compared (2017 and 2020), with the year 2020 containing the initial effects of the COVID-19 pandemic. The aim is to provide insight into the interaction between primary energy sources, energy prices, and food prices and their impact on energy security and sustainability before the outbreak of extraordinary situations (i.e., pandemic and other crises). By examining recent trends and the characterization of primary energy sources, this research contributes to a better understanding of the challenges and opportunities associated with the strengthening of the links between food and energy.
2. A Review of Global Energy Trends
Scholarly sources have affirmed that fossil fuels have been dominating energy systems around the world for decades since the industrial revolution [
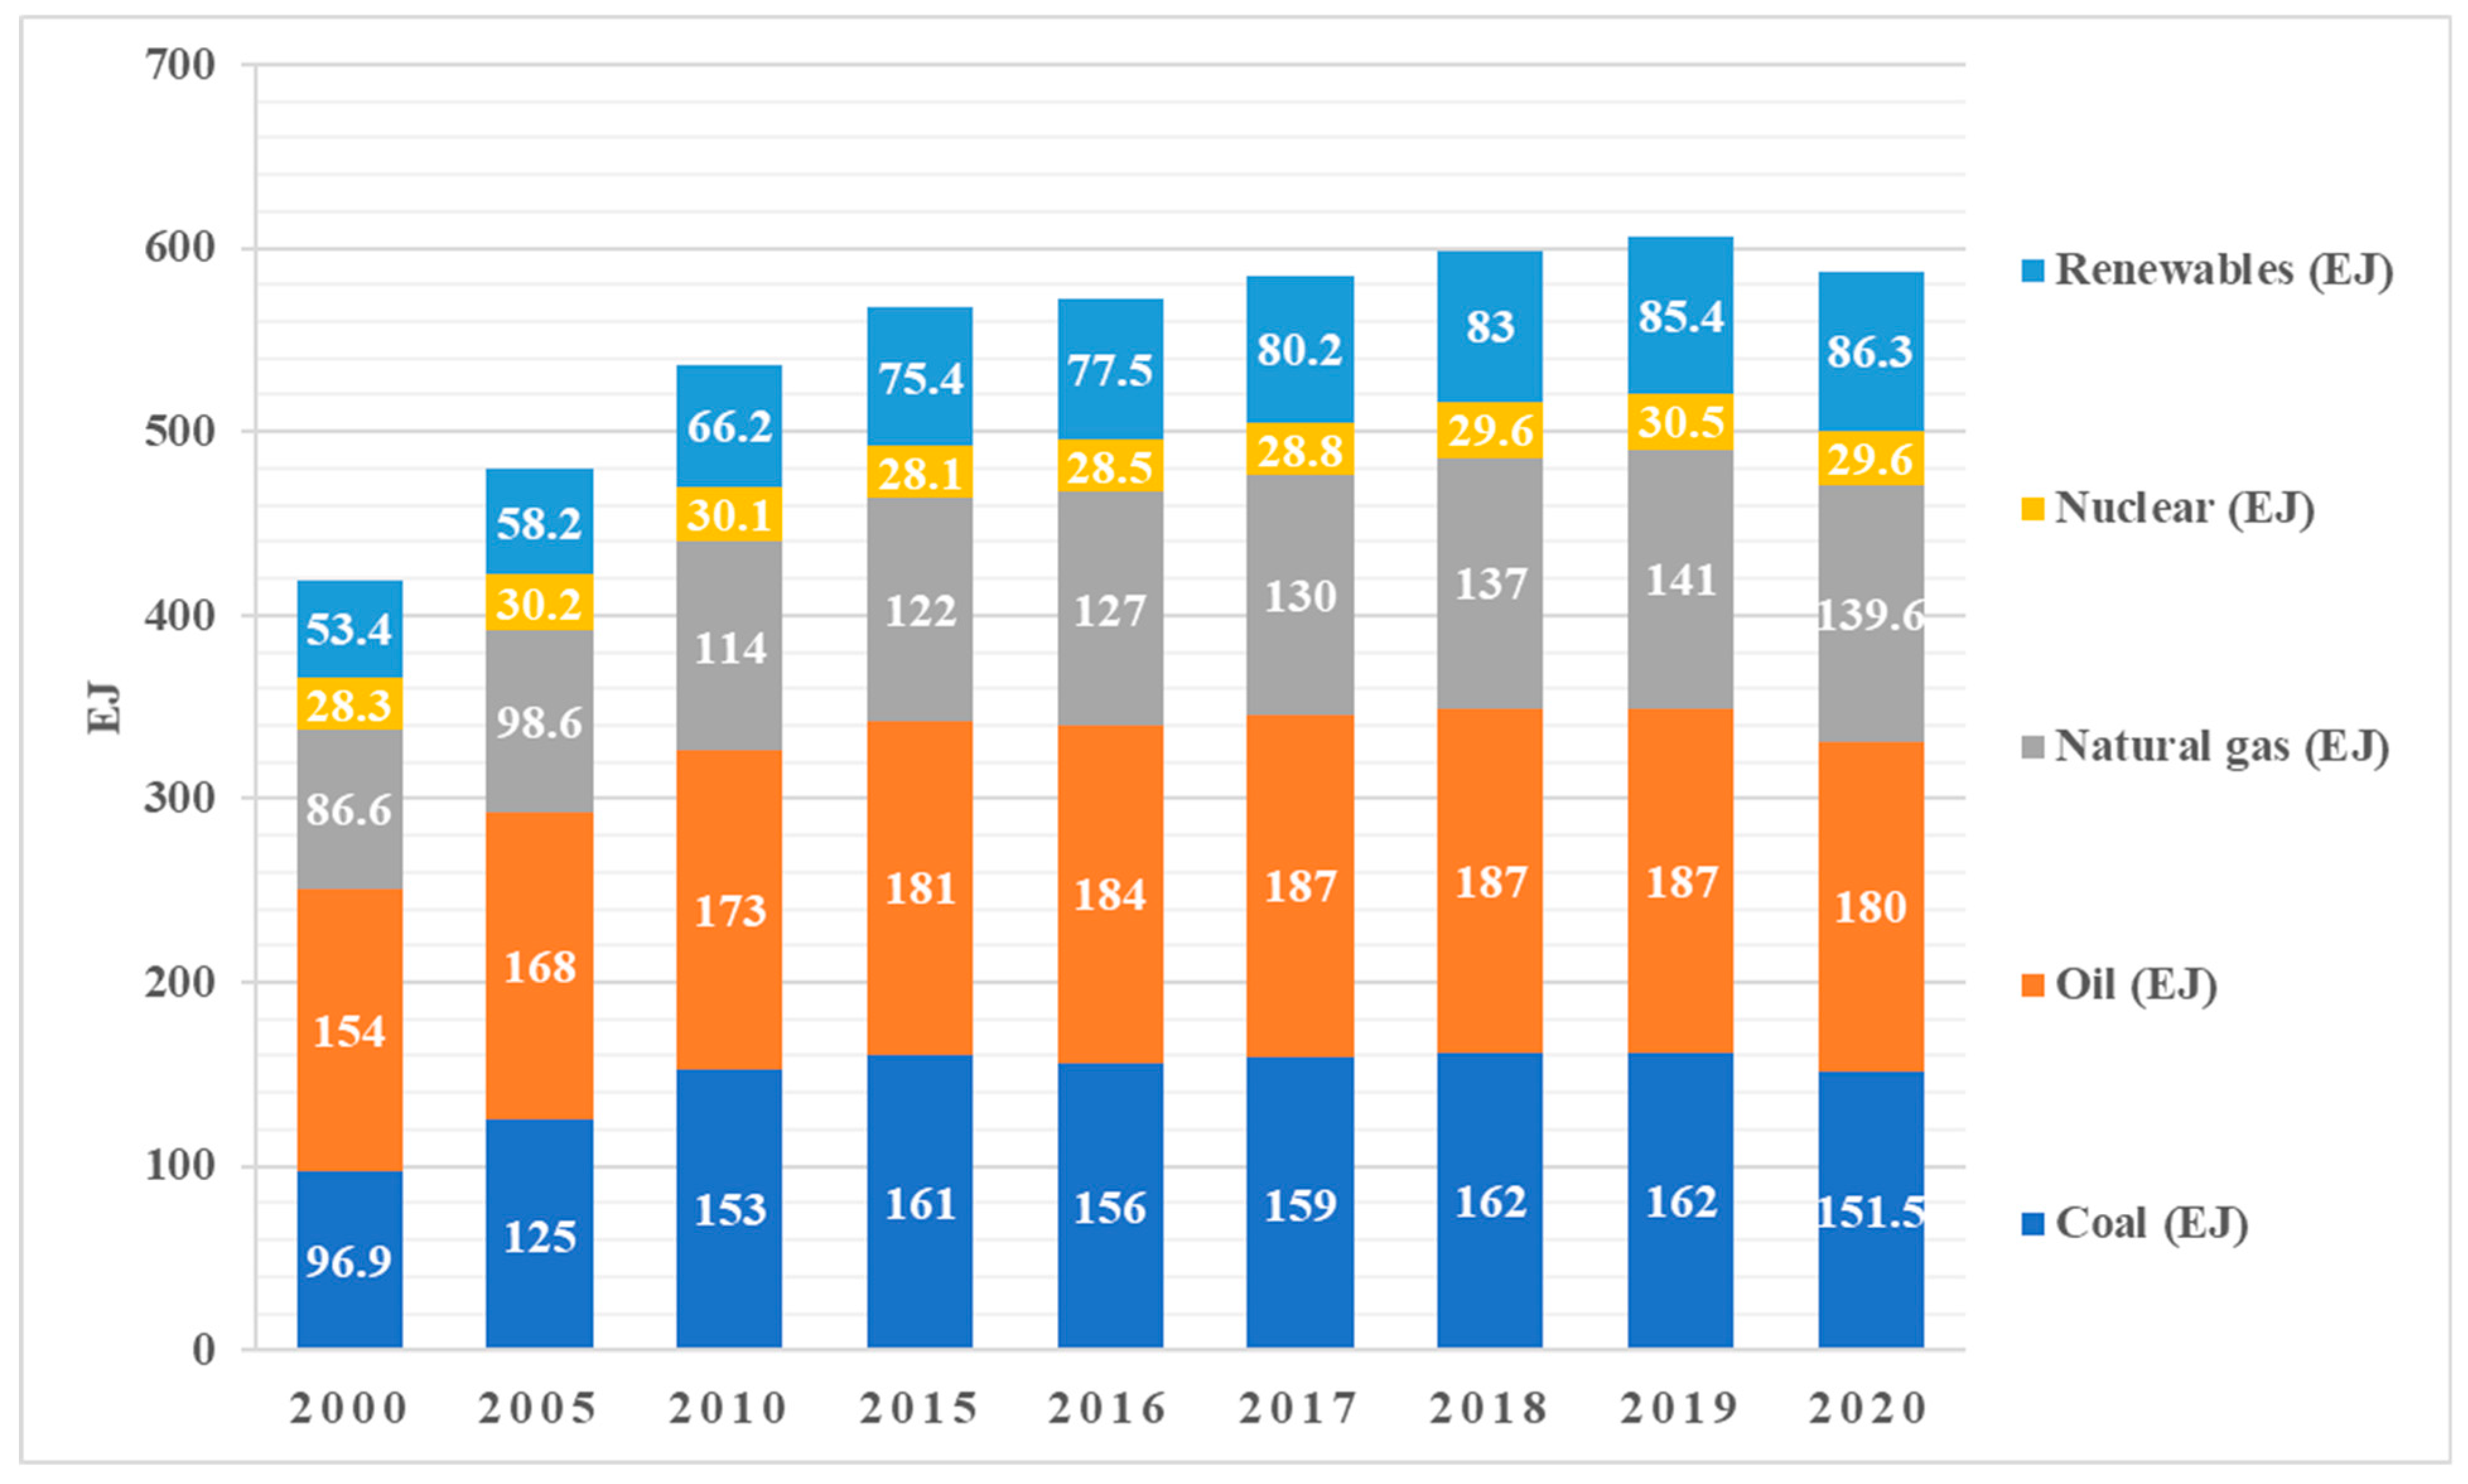
12]. In 2019, oil accounted for 31%, coal 21%, natural gas 23%, nuclear sources 5%, and renewables 14% out of the total 606EJ energy supply [
13]. However, there has been an impressive 48% growth in the use of renewables, a 65% expansion in coal, and a 50% increase in natural gas consumption since 2000 [
13]. In particular, coal is one of the most abundant sources of fossil energy, but there are several regulations that limit and gradually eliminate coal production technology due to its environmental effect [
14,
15]. In our opinion, while it is important to state that global energy is still largely fossil dependent, as seen in
Figure 1, it is also imperative to appreciate the relative stability and growth in the use of renewable energy, as is evident in the advances in the use of solar, hydro, wind, geothermal, and biomass. Therefore, considering the rate of growth in alternative energy use, sustainable and environmentally friendly energy generation is possible [
8].
In general, many transitions have taken place in the energy sector that have shaped the future of energy around the world in recent years. These are triggered by changes in consumption patterns, economic growth, environmental costs, and improvement in innovative technology capable of efficiently generating energy from renewable sources [
16]. It has spanned from the adoption of fuelwood in ancient times to the use of coal and now to oil in recent decades. The transition trend has continued, with the fastest growth being observed in the utilization of gas and renewable energy, which is taking the stage with an even faster growth rate of about 75% in net addition since 2009. Clearly, this transition comes with the challenge of volatility in energy prices, which also relates to food prices due to the involvement of agricultural resources such as biomass in energy generation and therefore consequently compounds the issue of energy security and food security required to achieve sustainability goals [
17]. Energy security has been defined by seven significant elements that include the availability of energy products, the price of energy products, infrastructure, environmental impact, energy efficiency, social aspect, and energy resource management [
18]. These elements serve as crucial indicators of energy sustainability that are characterized by the availability, affordability, and sufficiency of energy in a manner that is in line with both social and environmental conditions.
The decarbonization of energy to mitigate global emissions that have been leading to the catastrophic effects of climate change that the world is currently experiencing requires a sustainable approach with strategic energy solutions to meet the needs of humanity without jeopardizing the future [
19]. Thus, several advances have been made in the renewable sector with solar, wind, biomass, and hydropower specifically contributing up to 27% of the global electric energy mix. However, the global electricity supply is still dominated by fossil energy sources, with coal accounting for 37% of total worldwide, while natural gas is increasing as an emerging source of clean electricity and has generated up to 23% between 2000 and 2019 [
13]. Today, electric energy is very critical to development, as it is required in all nations and sectors [
20,
21]; no nation can achieve development without electricity regardless of geographical conditions, unlike heat energy, which may not be in high demand in temperate regions.
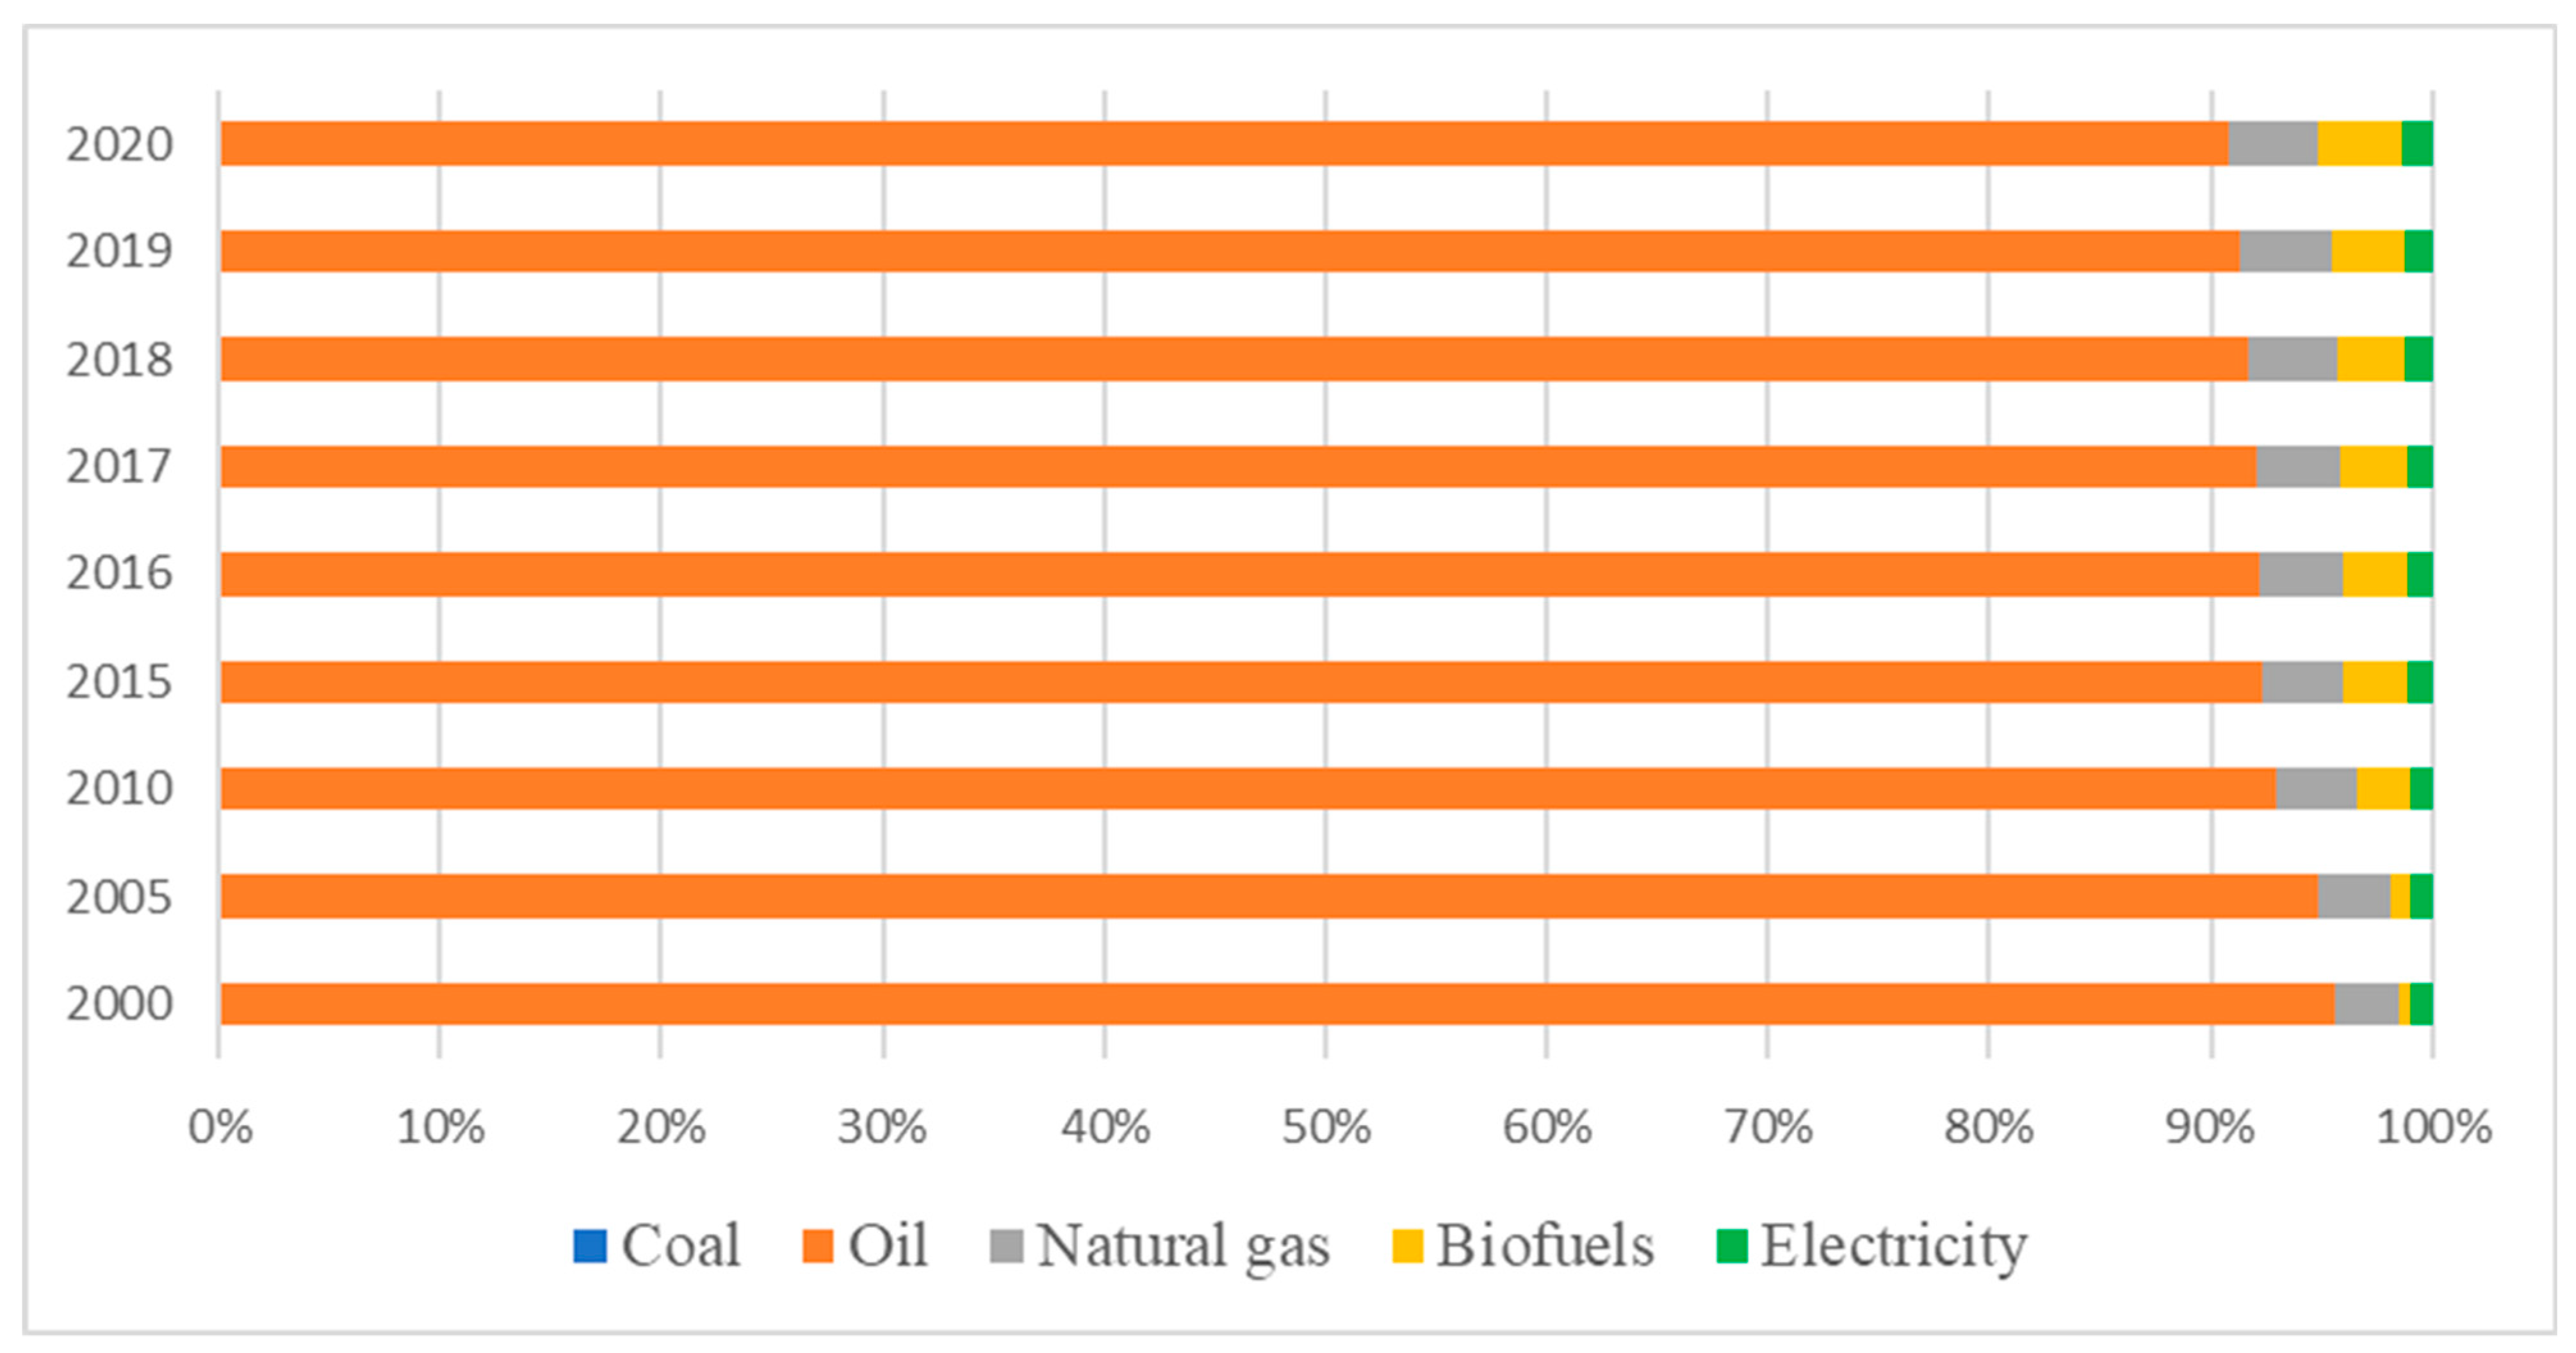
In particular, energy consumption in transportation exceeds the global use of electrical energy, and the transportation sector is simply dominated by oil, which produces 91.3% of the total need for the sector. Therefore, recent investment in electrification of transport systems is aimed at curbing massive carbon emissions from the sector due to the high use of fossil fuels. Furthermore, biofuels have recorded an exponential increase of more than 13% to date and contribute approximately 3.3% to the needs of the transport sector [
13]. However, global heat production is dominated by the combination of natural gas and coal, accounting for 85% as it has been for decades. Meanwhile, geothermal, solar thermal, and biomass production have doubled their capacity with a growth rate of more than 5% per year, currently providing an estimated 11% contribution from renewable energy sources [
22]. Wang et al. (2020) [
23] highlighted that there is a strong correlation between the level of industrialization and the energy consumption of countries. In addition, Kharitonov and Kosterin (2017) [
24] showed that most nuclear-orientated countries rely on oil importation.
According to reports, food consumption around the world is responsible for 26% of greenhouse gas (GHG) emissions, indicating a relationship between food consumption and carbon dioxide emissions [
25].
Pasternak (2001) [
26] opined that the relationship between HDI and the primary energy source is indirect, but the relationship with energy consumption is direct because energy consumption in countries with higher HDI is higher than in those with lower scores. Although there are many factors that could influence energy consumption, HDI is a significant factor that is also related to the food price index and average food consumption. Countries with higher HDI scores tend to have greater food security and stable food prices than those with lower HDI scores [
27].
Meanwhile, several researchers have tried to map the relationship between energy prices and food prices, although not much has been done to track these prices to primary energy sources. Nazlioglu (2011) [
28] posited that the kind of relationship that exists between oil prices and food prices is non-linear and that energy prices can forecast future food prices.
Tilman and Clark (2014) [
29] in their study proposed that healthy diets that consider a sustainable approach to production will result in increased land use by 2050 compared to the benchmark of 16 to 130 million hectares in 2009. Another research study projected a reduction in the scope of land exploration to fall between 8% and 11% measured in million km
2 annually based on dietary sustainability [
30]. There is also a proposition that increased consumption of a plant-based diet will trigger a reduction in land use of approximately 16 million hectares compared to a reference point in 2009 [
29]. In particular, Weinzettel et al. (2013) [
31] and Borges et al. (2021) [
32] in different studies reported that increased use of arable land for energy generation, especially bioenergy, will increase competition for land, increase land use, and drive ecological footprints in an upward direction.
Various countries and regions derive their primary energy from different sources, depending on their dominant resources and geography.
Table 1 shows the optimal dependence on coal sources for electricity in Asia, where about 75% of coal-based electricity originates, while America depends mainly on natural gas, which produces 32% of the electric energy mix. Europe combines 27% of its electricity from natural gas with about 33.7% from renewable sources, making it the highest in the world’s renewable energy mix, followed by America with about 32.5% from renewable sources. Europe and Asia account for about 90% of the total heat production in the world: 82% of the heat production in Asia in 2019 came from coal sources and America obtained 74% of its heat production from natural gas; in contrast, although Europe derived 57% of its heat from natural gas sources, it leads the world in renewable heat production through commercial biomass use in power plants with 89%.
The energy of crude oil dominates the transportation sector worldwide and varies between 85% in Europe and 99% in Africa. Whereas natural gas contributes between 1 and 8%, North and South America (Americas), particularly the United States and Brazil, contributed more than 7% of biofuels in 2019 and dominated the renewable fuel sector with more than 67% of biofuel consumption in transportation. Scholarly sources have shown that the energy transition strengthens the correlation between food prices and energy prices, while population and economic growth demands increase their connection with social stability [
10].
3. Global Food Systems
Energy and food are two very significant components on which all other elements of sustainable development goals are based [
33]. The volatility of food prices has become more frequent in recent times than in previous decades, thus exacerbating the situation of food affordability and nutrition stability even in food-secure countries [
34]. Practically, the World Bank (2022) [
35] estimates that 10 million people are forced into extreme poverty for every percent increase in the price of food. The situation that is most prevalent in developing countries can become even more severe with the drive for the energy transition that culminates in a competition between energy and food resources, especially in bioenergy production, which is the largest share of renewables. The impact of this competition will aggravate the need for efficient utilization of limited natural resources, and if the goal of sustainable development must be achieved across the board, focus must be on the unique characteristics and features of the respective countries and continents, as well as attention to their relevant indicators. A practical scenario is the situation of inorganic fertilizer use that has been shown to be an important factor in the European food markets, as well as ethanol prices in the United States that are reported to be affected by gasoline and crude oil prices [
36].
Today, food consumption is no longer just about satisfaction; the process involved in food production has become much more important not only for health reasons but also for sustainability reasons. The association of conservation of biodiversity, natural resource optimization, cultural acceptability, accessibility, affordability, nutrient content, environmental impact, and climate change now influence consumers’ preferences [
37]. Therefore, food demand is undergoing structural changes due to factors such as population growth, urbanization, religious habits, increasing per capita income, and other trends in consumption; for example, changing dietary patterns, the knowledge of the origin of meat/food, and characteristics of production [
38].
The current food production system contributes significantly to climate change through the emission of approximately 37% of global greenhouse gases. However, the challenge of migration and an increasing urban population is putting pressure on land resources through land exploitation and industrialization, as well as the need for alternative energy from plant sources. Additionally, the high cost and instability in the price of healthy diets correspond to increasing food insecurity and differential forms of malnutrition, such as stunting, lack of basic nutrients, and obesity [
39]. In addition to environmental and health implications, changing dietary patterns can also be associated with an increase in the middle class, which has triggered an increase in demand for animal products and healthy diets. However, Peters et al. (2016) [
40] opined that different types of diet require different land capacities. However, the common factor between food and energy production in the quest for sustainability is the reduction of emissions, since both sectors contribute the highest rate of GHG responsible for climate change.
As the world approaches the 2030 milestone for the SDGs, the discussion of food and energy security is taking precedence due to the increasing importance and noticeable connection between energy, food, and the economy. Although Jobbágy and Bai (2012) [
41] revealed that there is no close relationship between petroleum product consumption and changes in real GDP, several other studies have proposed a connection between energy consumption and food consumption [
42]. These connections have been traced to their impact on food prices but little or no attention has been paid to the respective primary energy sources and their connection to food and energy prices. Therefore, the focus of this research is on the price aspect, which is an element of affordability that is one of the critical factors to sustainability.
Another noticeable concern is the growing imbalance in food consumption that is widening the gap between food-secure and food-insecure countries, changing dietary demand, food consumption patterns, and economic status, especially in developing countries [
43]. Keating et al. (2014) [
44] opined that in the last 5 decades, the global food system has been extremely successful in matching the global population, and there has been a remarkable change in dietary patterns related to economic growth as the global food supply tripled while the population doubled. Paradoxically, up to 2 billion people are overweight in the world today and spend more than USD 100 million on weight loss daily, and over 800 million others are obese and spend more than USD 400 million on obesity-related health challenges daily. Furthermore, approximately 2.37 billion people are without food or cannot afford a healthy diet regularly, and an average of 20,000 others die from hunger daily, reflecting the acute imbalance in the global food system [
43]. The percentage of food insecurity around the world is on the decline, while the situation of food insecurity and hunger in many developing countries, especially in Africa and Asia, is becoming more critical. Furthermore, dietary imbalance or malnutrition even in food-secure countries is worsening due to rising food prices.
Through advances in technology, alternative food and energy production techniques have been used and proposed that are capable of reducing emissions and increasing efficiency in the future [
45]. Although the focus of current energy trends is on reducing emissions through reduced consumption and increased energy efficiency, the focus of current food trends is on reducing emissions through increased food consumption quality, waste reduction [
46], and food efficiency. These trajectories, which are characterized by the common factor of emissions reduction, also share many similarities in terms of the impact of the geographical condition on energy and food production, as well as the economic prowess of a nation in affording efficient technologies. Thus, both industries are constrained by the economics of production. Therefore, innovations in agriculture, by increasing production efficiency and reducing the negative environmental impact, play an important role in solving the conflict between food and energy production [
47].
Importantly, while the goal of sustainable development is to improve the average consumption of a healthy diet and increase the content of the healthy meal basket daily across countries, stabilizing food prices to match the affordability of a healthy diet is crucial [
43]. In the same vein, the affordability of energy is essential to leave no one behind. Price determines the affordability of foods that constitute a healthy diet and, as such, determines food choices. Therefore, food prices can affect nutrition, health, and ultimately food security. While price refers to the amount users have to pay to afford a specific diet, affordability implies the cost of food relative to a user’s income. There are proven indications that link price and affordability to the quality and nutritional benefits of diets that ultimately contribute to food security [
48,
49].
4. Materials and Methods
This study broadly examines the respective primary energy clusters and compares the energy and food prices index, which simply means changes in food prices as an indicator of food affordability. This study specifically seeks to unravel the relationship between food prices and energy prices across the various clusters to reveal if there are similarities or close ranges between prices in clusters of fossil or renewable origin. Importantly, the data used for the study focused mainly on the period before the war, thus excluding the food and energy price hike during the war, since this can be considered an abnormal economic situation that can be temporal; thus, the results may be very useful for continuity after the crises.
The parameters used to examine the energy situation in this study are country-level data on total energy consumption per capita, the price of household electricity, and the unit price of gasoline used to measure the price of energy in transportation, which is consistent with Yuan and Lo (2020) [
30]. The average food consumption per capita is examined along with the food price index on the food price side, while understanding that each of these components or elements can have an independent destabilizing effect on people or the local economy.
Furthermore, the food price index is an important standard economic indicator that gives an overview of the situation of food security in a nation using the rate of changes in food prices over time, which has been very useful in several high-impact studies on related topics [
50]. Therefore, it will help us to evaluate or reveal the situation of food price stability in different clusters. Furthermore, other energy data that were previously highlighted will also provide an explanation for the situation of energy security or stability in the context of affordability, as used by Nazlioglu (2011) [
28] and Mizik et al. (2020) [
36]. On the other hand, the HDI serves as a standard summary socioeconomic indicator that measures quality of life, health status, and education or literacy in nations; it provides information on the functionality of primary institutions and economic stability [
51]. Since it measures both social and human capital, it will provide information on the level of acceptance of changes in energy systems, particularly toward renewables, as agreed by Das (2017) [
52] as well as by Tóth and Magda (2017) [
12] in separate but similar studies. It is essential to note that all indicators used in this study have been confirmed in existing studies to be critical instruments useful in measuring each respective representative dataset examined in [
12,
13,
22,
34,
35,
53].
To fulfill the objective of this research and provide credible information and a better understanding of the research topic, quantitative data were obtained and harmonized from renowned databases such as IEA, FAO, IRENA, and World Bank. This study sampled 18 countries with well-separable and differential characteristics that span different continents and economic levels, as is evident in GDP per capita, and also use different energy sources, as is indicated in
Table 2 below. The countries were purposively selected across six continents using five basic criteria to make choices proven in the literature to meet some of these criteria and strategically support the discussion. Basic criteria were (I) advances in energy transition; (II) naturally occurring resource uniqueness; (III) diversity of primary energy sources; (IV) nature of the primary energy mix; and (V) development status. The goal of this purposive sampling is to reflect the diversity of primary energy supply globally, considering the different primary energy sources and mixes, the natural energy resources, and the income levels of each country [
54]. A cluster analysis was then performed using SPSS to automatically aggregate and allocate the 18 countries into different clusters based on similarity in the dominant primary energy sources that serve some of the most important energy sectors in each country. The rate of food and energy prices was then examined in each cluster and compared with the existing literature to provide in-depth explanations for the result [
12,
55]. Importantly, cluster analysis has been used by Tóth and Magda (2017) [
12] and Rybak et al. (2022) [
54] in related studies; however, in both cases the cluster allocation was predetermined and manually assigned, but in this study the cluster membership is automatically determined by SPSS.
Figure 2 below summarily demonstrates the process of analysis using a flowchart, while
Table 2 shows a basic descriptive data of the respective countries.
5. Results and Discussion
Tóth and Magda (2017) [
12] have used a similar technique in closely related research, and there is consistency in the cluster results. In addition, close consideration of individual countries or clusters on a case-by-case basis reveals that the clustering result reflects the reality on the ground in specific measures.
Table 3 provides the composition of the five clusters in 2017 and 2020. Although the five clusters were the same in 2020, the composition of the clusters changed remarkably from 2017 to 2020. Of the 18 countries analyzed, only 8 remained in the same cluster, while the other 10 were placed in a different cluster.
As for the non-changed cluster members, Nigeria and Malawi are stable RES members. Although Nigeria is an oil producing country and relies on oil revenues to provide government expenditure, the percentage of biomass energy consumption in Nigeria is one of the highest in the world, especially for the energy required to cook or heat [
17,
56]. Meanwhile, Malawi is largely dependent on hydropower for electricity. However, Russia and Egypt are known for their high dependence on natural gas for electricity for domestic consumption and foreign trade. The energy mix of Australia is dominated by fossil resources, of which oil is the most important [
57]. Finland and France rely largely on nuclear sources to meet their need for electric energy, which is also used in transportation, while China still relies on the electricity and heat energy generated from coal [
22].
Although Brazil is one of the leading biofuel producers, its energy use changed sufficiently to be placed in the natural gas cluster. The same happened in Canada (from RES to oil), which has remarkable hydro and wind power generation [
17,
22], and Germany (from RES to nuclear). Germany is one of the leading producers of electricity from wind, biomass, and solar energy in Europe [
17,
22], but it imports a significant amount of nuclear energy from France [
58]. Furthermore, the shutdown of their last three nuclear plants was postponed to 2023.
Qatar has an enormous amount of fossil resources. This is the reason why the share of RE in the country’s energy mix fell to zero by 2020. Due to this and an 8% decrease in total energy consumption, Qatar moved from the natural gas cluster to the oil cluster. On the other hand, some of the Central and Eastern European countries (Hungary, Poland) built large gas storage capacities and rely on natural gas mostly for heating and water heating. Although Hungary relies on fossil energy sources, the country has scarce fossil resources. Due to fixed gas and electricity prices, as well as a large natural gas storage capacity, Hungary switched to the natural gas cluster from the nuclear cluster. This may change significantly in the future if the ongoing nuclear plant project called Paks II will be implemented. Exploration of oil and gas is still an ongoing process in Poland with promising opportunities [
59]. Therefore, it is not a significant change that the country moved from the coal to the natural gas cluster during the analyzed period. Kosovo followed the same path; however, it should be mentioned that the share of RE shows a significantly increasing trend in Kosovo. Its value is the third largest among the analyzed countries, which suggests that Kosovo is expected to move to the RES cluster in the near future. The recent energy crisis and market uncertainties force every country to diversify its energy system and to try to become more independent in energy production.
Kazakhstan is similar to Qatar in terms of its fossil resource-based economy. It has large oil, natural gas, and coal resources and produces more than twice the amount of energy it needs [
53]. Therefore, moving from the coal to oil cluster is not surprising; however, the natural gas cluster could also have been an option. The share of RE is negligible: it is below 1%.
Turkey and the USA rely largely on oil for electricity, heat, and transport energy consumption, although they are also investing in and growing other primary energy sources [
17,
22]. However, due mainly to the high unit price of transportation, which is the main characteristic of the nuclear cluster, as can be seen in
Table 4, Turkey moved from the oil to the nuclear cluster. Relying more on nuclear energy can contribute to higher energy security and climate change mitigation; however, the use of different sources of RE provides a more promising solution for Turkey [
60]. Although coal is a significant energy source in the USA, natural gas and oil (its previous cluster) are the most important energy sources [
61]. However, the coal cluster has the highest average food consumption per capita measured in Kcal and a relatively high CO
2 emission per capita, and these indices are high for the USA. The changes in the primary energy clusters provide an important conclusion. Brazil, Canada, and Germany moved from the RES cluster to one of the fossil energy clusters. RES seem to be not sufficient for large developing and developed countries, since the growth rate of the energy demand in these countries is higher than the expansion of RES.
Table 4 provides the mean values of the variables at the cluster level. Some variables have not changed significantly, such as the average food consumption per capita, the share of renewable energy, the CO
2 emission, and the human development index. However, food, transportation, and electricity prices increased significantly during the analyzed 4 years. This trend has even accelerated in the last three years; however, data for 2021 and 2022 are not available at this time.
Consumption Trends
The average food consumption per capita per day is highest in clusters 4 and 5, which are the nuclear and oil clusters. These clusters have some of the wealthiest countries. For example, the nuclear cluster comprises mainly EU countries; the EU is notable as being on the frontlines of the sustainability goal, with practical policies in place to work toward those goals. It is also a known fact that nuclear technology is capital intensive and can only be afforded by economically vibrant countries, some of which are seen in this cluster.
Secondly, cluster 1 is notable for RES and it has the lowest average food consumption per capita. It is also worth noting that the countries in this cluster have made some great strides and scores toward the sustainable development goals with respect to food supply. However, members of the oil cluster, such as Australia, have an international reputation for sustainable, modern, and safe food production, where the agriculture and food production sectors are intrinsic to their economic prosperity and social stability, accounting for the production of up to 90% of locally consumed meat, vegetables, eggs, fruits, and milk [
62]. According to the Australian Bureau of Statistics [
63], the strategic roadmap that was adopted to achieve this feat include policy reforms in food regulation, agricultural competitiveness, and the food value chain. Additionally, the United States government uses its “Feed the Future initiative” as a vehicle for the transformation of its global food security program. The strategy harmonizes the use of cutting-edge research in agricultural and private sector partnerships to achieve sustainability goals. Turkey, which also belonged to this cluster in 2016 is also noted for suitable natural conditions for food and animal production. According to reports, through their partnership with the FAO, they have been able to achieve exponential increases in the annual yield of most crops, thus meeting a major part of their domestic food consumption through local production.
Furthermore, the natural gas and oil clusters have similar average food consumption per capita despite the differences between the cluster members. In particular, average food consumption per capita represents the amount of food or the food basket of items consumed by one person daily. This is related to the food price index and the human development index, implying that a change in any of these indicators can affect average food consumption per capita per day, which is different from the results of Pasternak (2001) [
26] and similar to the results of Mohee et al. (2015) [
27]. The significant difference in times might be a possible reason.
The average human development index, as compiled by the mean, reflects that the nuclear cluster, as well as the oil cluster, shared the highest average score. They were followed by the coal and natural gas cluster, while the RES cluster had the relatively lowest mean score in this case. The human development index is an indicator that measures the living standards of people in a country. The HDI thus has an impact on the general consumption pattern in a country; this is also the case in energy consumption and food consumption [
27].
Food and Primary Energy Price Indications
The following graph shows the relationship and performance of energy prices between clusters 1 to 5 in relation to the food price index (
Figure 3). There appears to be consistency in the relationship between the price of transportation, electricity, and food price index across the various primary energy clusters; however, some characteristic differences can also be observed.
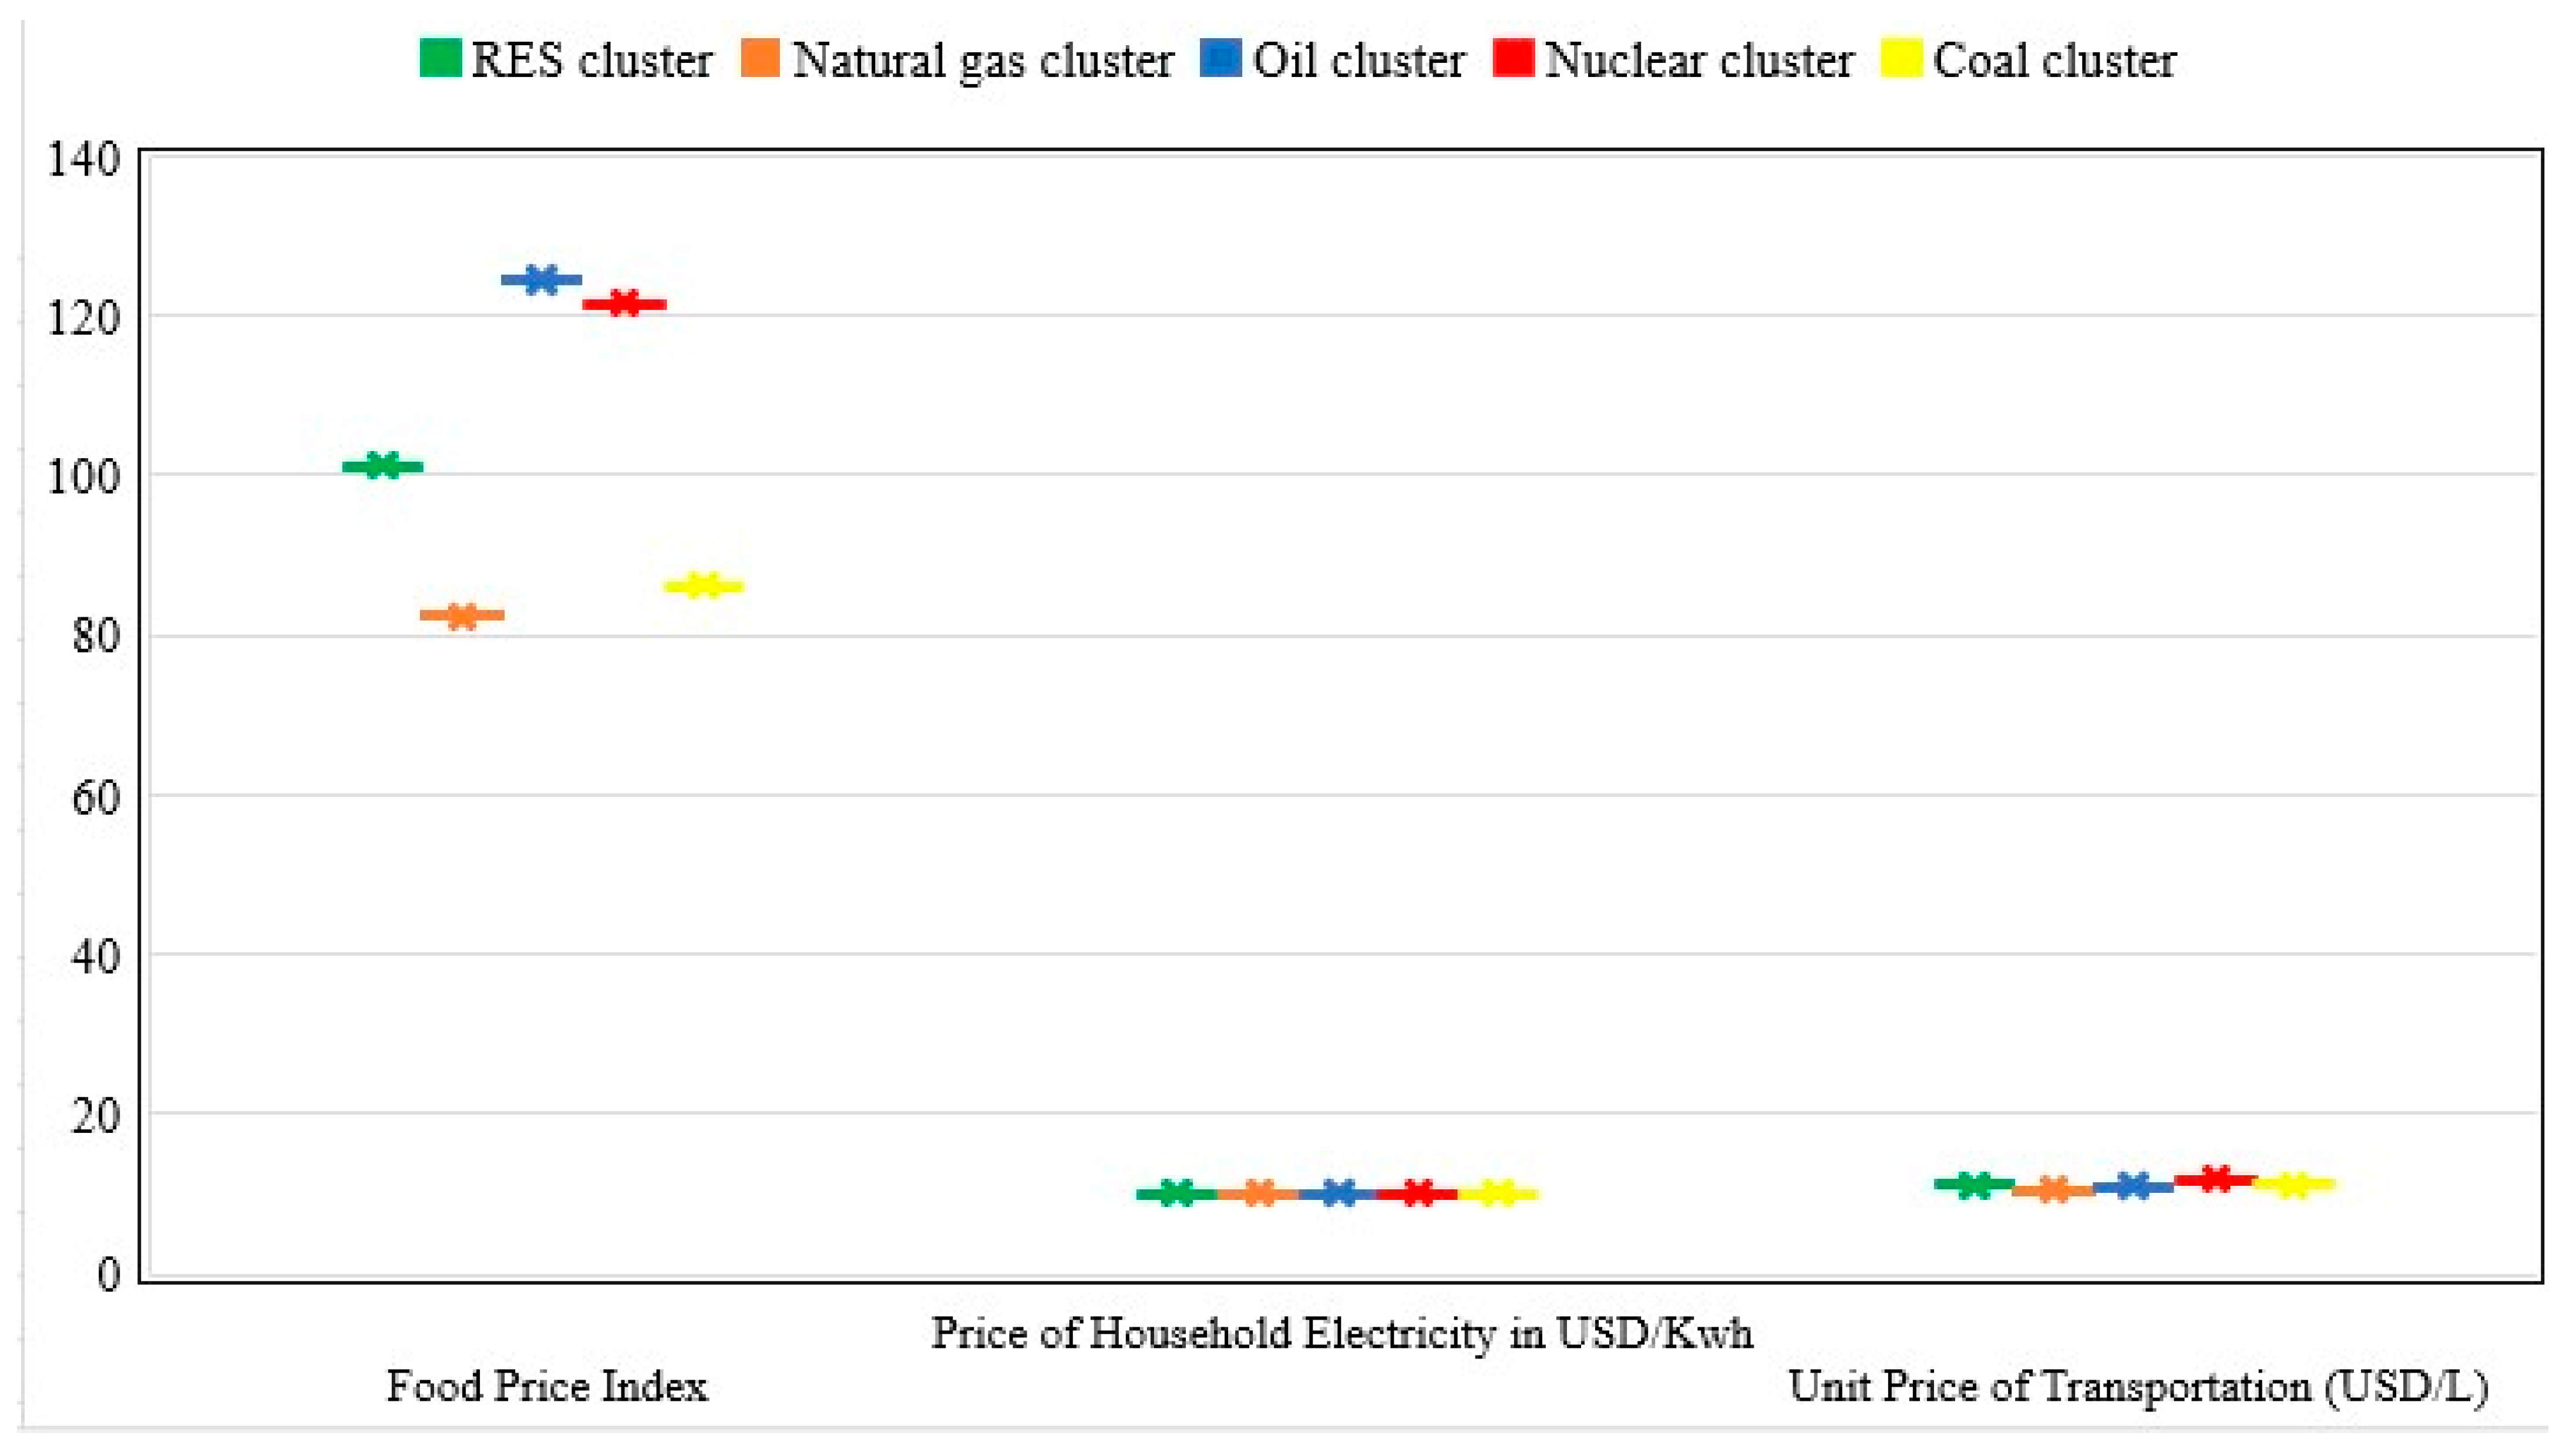
The chart indicates that the unit price of transportation, which was measured with the price of gasoline in USD per liter for the various countries, is obviously the highest in the nuclear cluster, and this is consistent with Kharitonov and Kosterin (2017) [
24]. This further implies that energy importation contributes to higher energy prices, suggesting that energy generation from available natural energy resources could lead to a reduction in prices. It is also important to identify that there are direct and indirect connections between primary energy sources and the three main areas of energy demand. For instance, while gasoline from oil is still useful in transportation in the nuclear cluster, the use of electricity from nuclear sources in transportation can reduce the demand for oil. Similarly, increasing biofuel production and the blending ratio to gasoline can also trigger a reduction in oil demand.
On the other hand, the unit price of transportation in the RES cluster came before the coal cluster as the second highest after the price in the nuclear cluster, suggesting that the energy price from cleaner primary energy clusters is currently higher than that of fossil origin due to environmental regulations; see [
14]. Moreover, the oil cluster comes next with about half the price of the nuclear cluster and two-thirds of the RES cluster. The relationship between primary energy sources and the unit price of transportation, as seen in
Figure 2, shows that abundant energy sources of fossil origin offer the lowest prices, and this can be traced to their dominance in this energy sector, as seen in
Figure 4. This also serves as a warning to the fact that electrification of the transport sector, as well as the advancement of renewable energy use in transportation, has the potential to offer lower prices.
Regarding the price of household electricity consumption in USD per kilowatt hour, which implies the price of one kilowatt hour of electricity, it is also related to the unit price of transportation, implying that a change in the unit price of any of these can affect the price of the other. We can observe that the share of the nuclear and RES clusters is equal and is relatively the highest ratio in the series, implying that electricity prices are higher in cleaner energy sources compared to their fossil counterparts, similarly to Oka-Mizutani and Ichikawa (2019) [
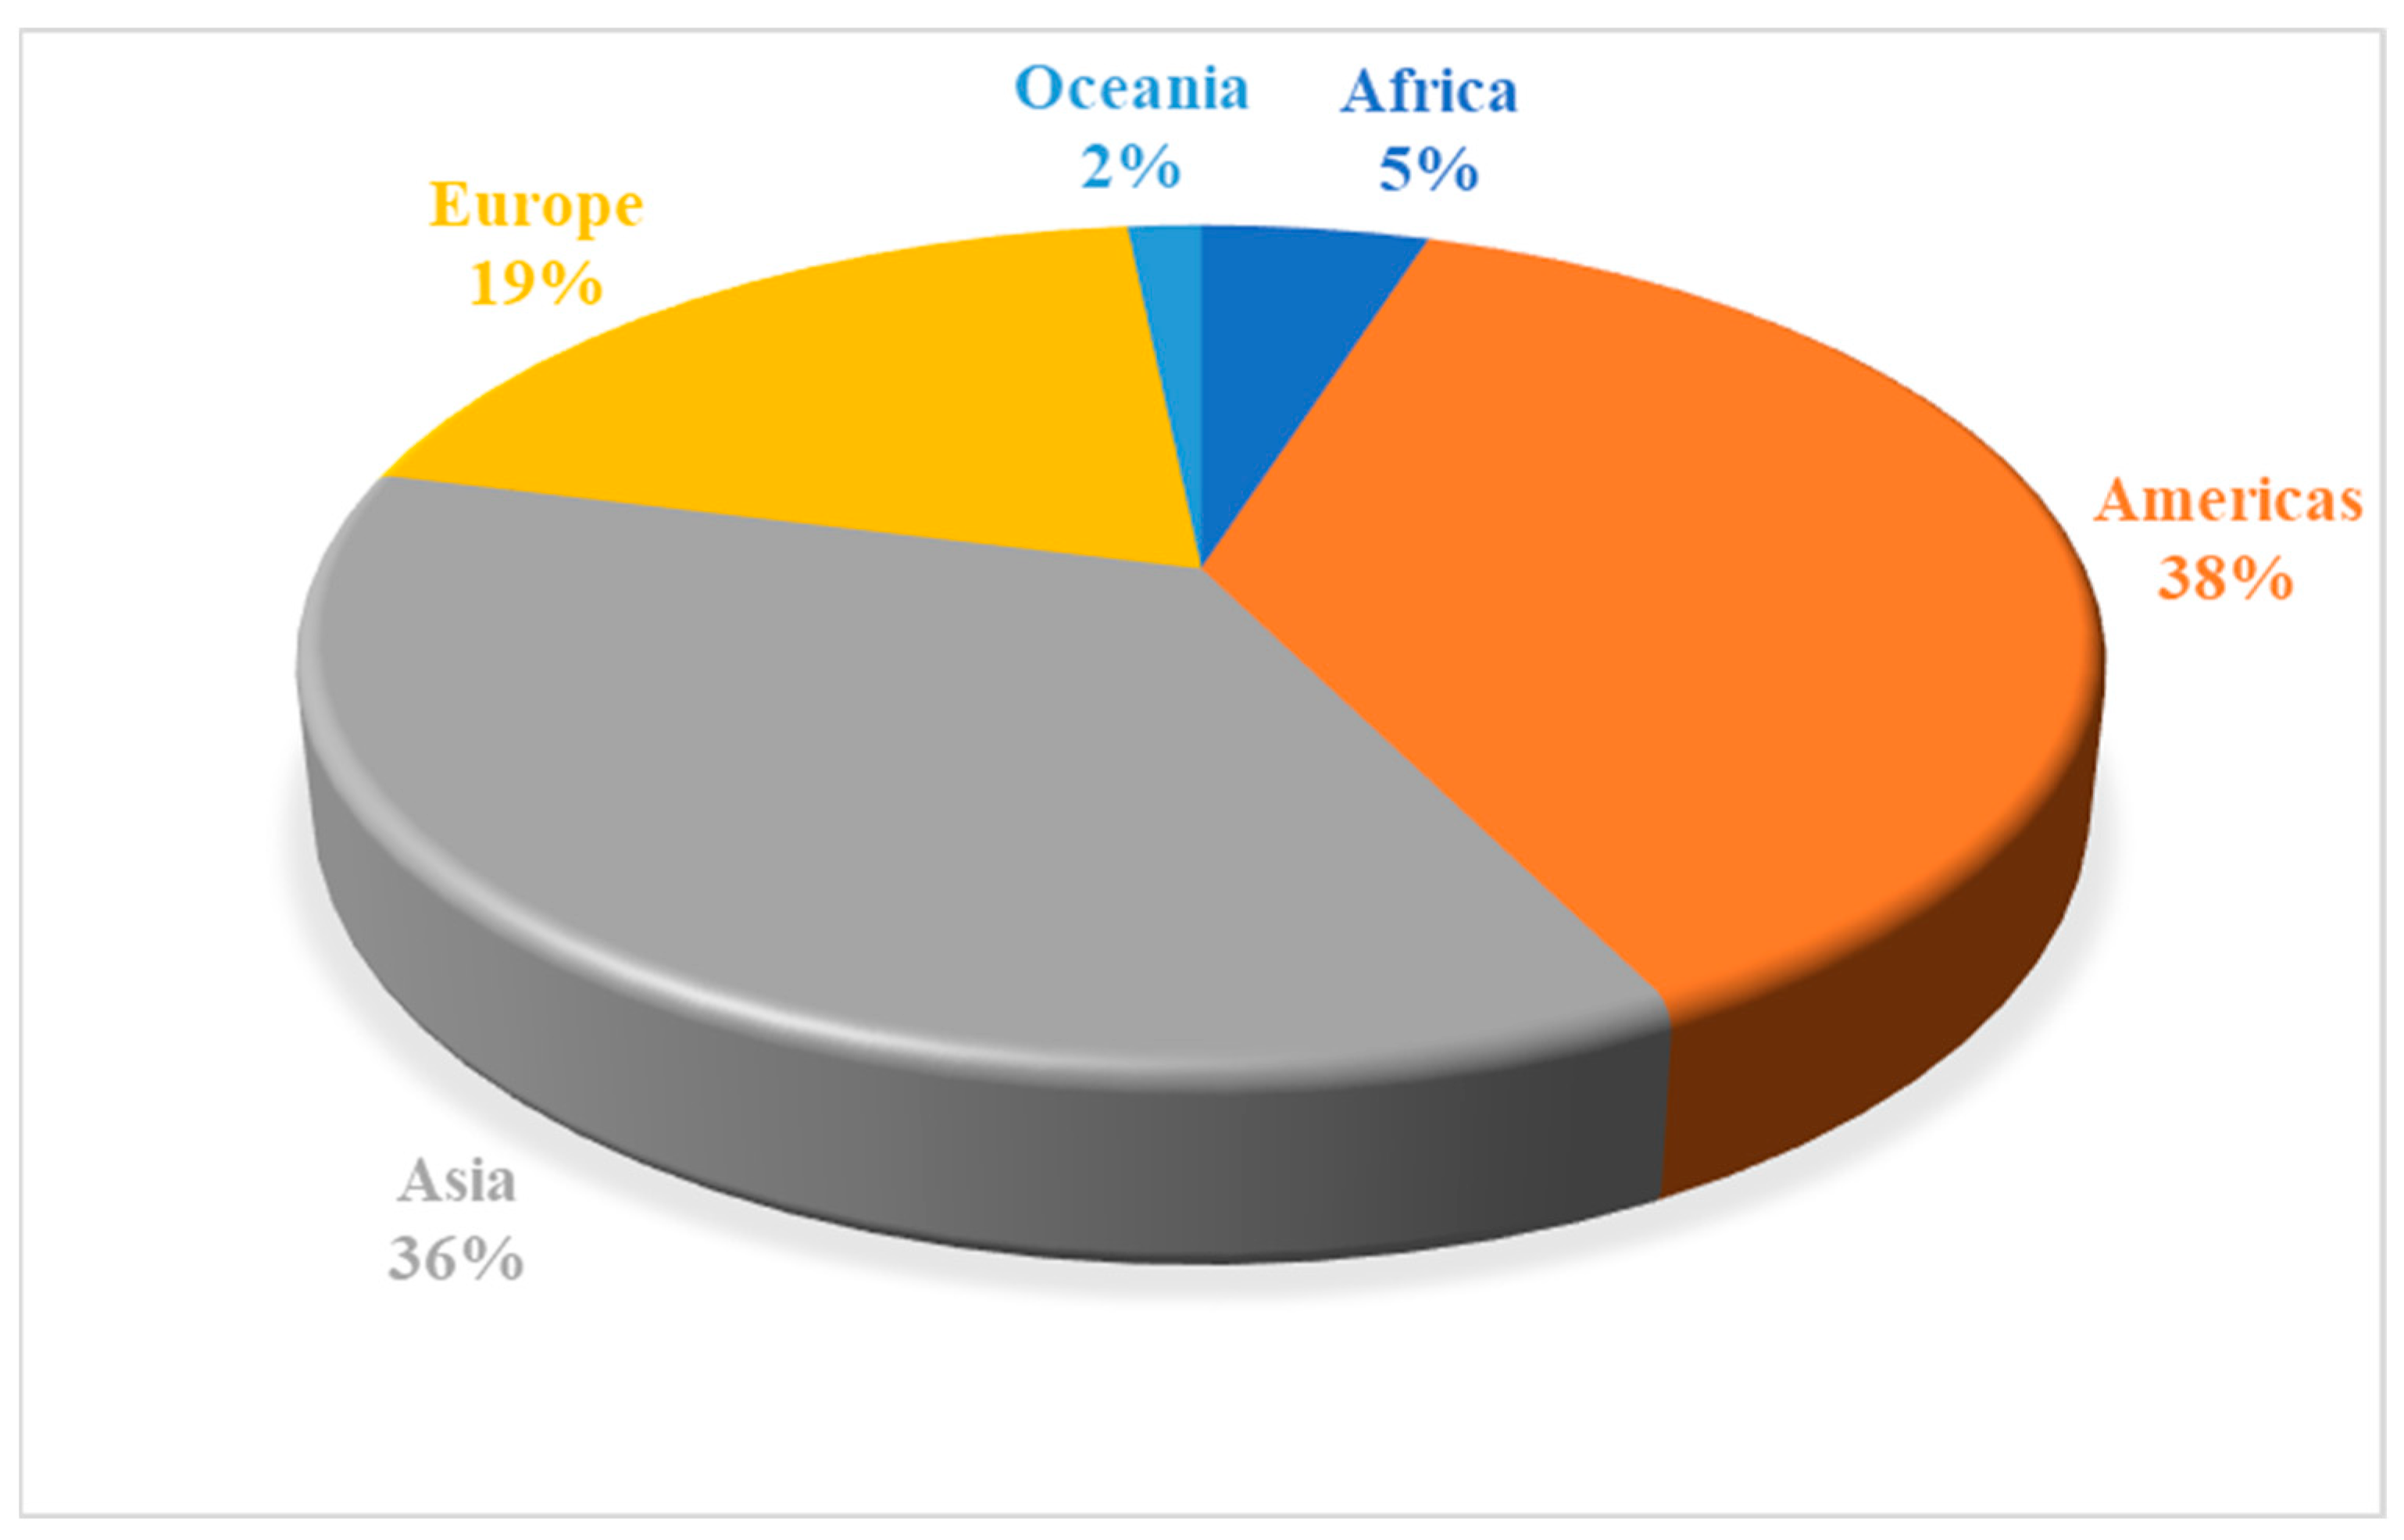
15]. The oil cluster came second with a slightly lower price before coal with a price that is above two-thirds the price in the first two clusters, and the natural gas cluster came last with about half of the price in the coal cluster and one-quarter the price in the nuclear and RES clusters. Practically, the economic status of a nation also impacts its primary energy choices and prices; therefore,
Figure 5 reveals how primary energy is consumed by continents [
15].
With reference to
Figure 3, a comparison of the price of energy in transport and electricity against the food price index entails a relationship between the respective prices. Evidently, the natural gas cluster exhibited the lowest price in electricity and transportation, as well as the food price index, indicating a constant and linear relationship between the three parameters. This implies the sensitivity of these prices to each other. Furthermore, the coal cluster showed the second lowest prices for food and electricity but came third in transportation price. It can therefore be inferred that a positive but non-linear relationship exists between food and electric energy price in this cluster. Furthermore, the oil cluster recorded the highest food price index, which was the second highest electricity price after the nuclear and RES clusters and the second lowest transportation price after natural gas. This cluster indicates an irregular relationship in the respective prices. However, the nuclear cluster showed the highest prices in electricity and transportation and came second in the food price index after the oil cluster. Although the RES cluster showed the highest electricity price, which is equal to that of the nuclear cluster, it came second in the transportation price and third in the food price index. Generally, it can be inferred that there is a relationship between the measured indicators, although it is not constant in all cases; while it is positive in some cases, it appears irregular in some, thus indicating differences in the strength of the connection between primary energy prices and food prices, which is in line with the results of Nazlioglu (2011) [
28].
The aim of
Figure 6 is to connect the consistency of the real and historical situation to our research results and to show a broader view in order to better predict the situation in the future. The most relevant factors now and in the future are the following: (1) a healthy diet and sustainable attitude, (2) a change in land use due to the plant-based diet, or vegetarianism, and (3) an increase in the importance of biomass energy use, according to the findings of Tilman and Clark (2014) [
29], Weinzettel et al. (2013) [
30], and Borges et al. (2021) [
32].
6. Conclusions
Therefore, we can summarize that the unit price of transportation, the unit price of household electricity consumption, and the food price index exhibit different characteristics in different countries and suggest the possibility of a relationship with primary energy sources. Moreover, worthy of note is that food price has been largely associated with energy prices by several studies and, as such, our result corroborated with that reality because two clusters with fossil energy sources, natural gas and coal, demonstrated the relatively lowest food prices compared to other clusters. However, the RES cluster showed moderate prices being at the midpoint between the five clusters, thus insinuating that with the adoption and use of clean energy, we can achieve moderate prices and hence the affordability of food and energy in the long run. Although there is a wide range of speculation and fears that sustainable food and renewable energy systems offer higher prices, with the indication of clusters, there is a possibility that with wider adoption and use of renewable energy, prices in this cluster can reduce further. Consequently, as we approach the goals of sustainable development through energy transition and changes in food demand and consumption, it is important to take into account these important indicators and their respective attributes across clusters. Another important point from the results is that countries can look within and employ their local resources to meet their basic needs using sustainable strategies because today any form of production or consumption that does not adopt a sustainable strategy will not deliver the needed security in food and energy. Specifically, exploring and advancing the areas of strength in clean energy clusters to make food and energy more affordable and accessible to all is essential for sustainable development and social stability, and ultimately we can invest in the adoption of renewable energy and manage the prices of food and energy in the long run. It is also important to note that the study was limited to examining the characteristics or price indications of the respective clusters without deeply evaluating the relationships. Therefore, this can form a basis for further studies to examine the relationship between prices in the various clusters as an approach to achieving food and energy security.
Although the cluster analyses resulted in the same five clusters in 2020, their composition changed considerably from 2017 to 2020. Of the 18 countries analyzed, only 8 remained in the same cluster, while the other 10 were placed in a different cluster. This change has various reasons, and changes in energy use (Brazil, Canada), importation of nuclear energy (Germany), or large gas storage capacities (Hungary) are among them. Some of the analyzed countries have multiple energy sources simultaneously (for example, natural gas, oil, and coal) and moved between those clusters (for example, Qatar or Kazakhstan). The novelty of this research to the literature is the volatile nature of primary energy clusters. Even within a short period of time (4 years), 10 countries experienced remarkable changes in their energy use structure. Climate change mitigation requires significant actions; however, it appears that the COVID-19 pandemic could cause negative impacts. Regrouping took place at the expense of RES use, as only two countries remained in the RES cluster, while three countries moved to one of the fossil energy clusters. One of the practical implications of this research is that the use of RES is not a viable option for large (especially developed) countries, as their economies use a relatively high amount of energy and require stable energy sources. Most renewable energy sources are volatile and cannot provide a constant amount of energy throughout the day. Storing solar or wind energy is one of the key challenges of RES use.
There are many limitations to this research. Although using the latest available four years of the selected variables provided a valuable insight into the main characteristics of primary energy sources, the analysis could be expanded to more years. However, this may result in different classifications of members into different clusters, leading to even greater differences among the mean values of the clusters. Adding other variables, or differentiation between renewable energy sources, may similarly impact the results. Our results may be useful for supporting strategies, especially in the energy and food sectors.


