Article

Production of Biogas from Distillation Residue as a Waste Material from the Distillery Industry in Poland

by
Otton K. Roubinek
1,
Anna Wilinska-Lisowska
2,
Magdalena Jasinska
3,
Andrzej G. Chmielewski
4 and
Krzysztof Czerwionka
2,*
1
Łukasiewicz–Industrial Chemistry Institute, Department of Pharmacy, Cosmetic Chemistry and Biotechnology, 01-793 Warsaw, Poland
2
Faculty of Civil and Environmental Engineering, Gdansk University of Technology, 80-233 Gdansk, Poland
3
Faculty of Chemical and Process Engineering, Warsaw University of Technology, 00-645 Warsaw, Poland
4
Laboratory of Stable Isotope, Institute of Nuclear Chemistry and Technology, 03-195 Warsaw, Poland
*
Author to whom correspondence should be addressed.
Energies 2023, 16(7), 3063; https://doi.org/10.3390/en16073063
Submission received: 27 February 2023 / Revised: 16 March 2023 / Accepted: 19 March 2023 / Published: 28 March 2023

Abstract

:
In this paper, the possibility to obtain an alternative source of energy from methane fermentation, catalysed by biomass, has been discussed in detail. As a main substrate, the distillation residue from the distillery industry was taken in the case of mono-fermentation and its co-fermentation with sewage sludge. The results showed that higher biogas and methane production can be obtained in a mono-fermentation process. Fermentation lasted for 23 days, and during this time, 333.14 and 249.64 L/kg VS of the total biogas for mono- and co-fermentation was subsequently obtained, which gives around 63% and 50% of methane in both types of the process, respectively. Additionally, to interpret the experimental data obtained and to predict the trend of the accumulation curves, a simple Gompertz model has been applied. The application of the Gompertz model has enabled us to estimate some important parameters with a strict physical meaning, namely, the maximum production value of the biogas and its components, the production rate of a given gas, as well as the incubation phase time. Finally, an approximate analysis of the potential volume of biogas production was also carried out, based on the mass of distillation residue produced annually in Poland.

1. Introduction

New technologies need to be developed to obtain raw materials or materials and energy from renewable sources. An alternative to existing and widely used energy carriers is to obtain them using biotechnological methods. In recent years, there has been an increase in the price per barrel of oil, and, despite temporary price reductions for this raw material, the trend in the long term will be upwards. Even the increased production of this commodity will not compensate for its demand on world markets, which is due to the growing demand resulting from the development of economies in countries such as India and China [1,2]. Added to this is climate change, which has been widely noted, regardless as to whether it is caused by human activity or other phenomena occurring on the planet and the sun [3].
These changes will affect societies, economies and the global economy. This also applies to Poland, which is an importer of energy carriers such as oil and natural gas. An additional factor is the international obligations Poland has accepted, which require it to reduce carbon dioxide (greenhouse gas) emissions and increase the amount of energy it obtains through renewable energy sources (RES). RES include wind, hydro, solar, geothermal and biomass. In a few decades, there will be a diversification of energy sources from fossil to renewable and nuclear energy.
The use of renewable energy sources reduces CO2 emissions and the consumption of fossil energy resources. In addition, agricultural biogas plants contribute to the development of rural regions and the utilisation of waste from the food industry. Plant waste is used to produce biogas and then electricity and heat in cogeneration systems. An additional advantage of biogas plants is that they can operate continuously, as they are renewable energy sources that are independent of the degree of sunshine or the frequency of winds.
Agricultural biogas production requires a constant supply of feedstock, with the result that the location of such biogas plants and their ability to process biomass is determined by the demand for the feedstock [4]. The composition, as well as the yield of the biogas produced from the biomass, depends on many factors, including the moisture content, the physical state of the raw material, the temperature and the technology used. Animal and vegetable feedstocks, as well as waste from the agri-food industry, can be used in agricultural biogas plants. To complement the basic feedstock that is used for biogas production, co-fermentation with other feedstocks has begun to be used, resulting in an increase in the amount of biogas produced or an increase in the proportion of methane. In some cases, several co-substrates are used that can be used as feedstock for biogas production. In addition, such solutions enable waste from the food industry and agriculture to be managed. An example is the co-fermentation of pig and cattle slurry with sludge from sewage treatment plants and waste from agriculture and the food industry [5], cattle waste with corn silage [6], pig waste with grass silage [7], solid waste with biomass [8], sewage sludge with pig manure [9], and food waste with sewage sludge [10].
An example of a waste product from agri-food plants is distillery residue. It is the main by-product obtained during ethanol production [11,12]. This waste contains, in addition to organic carbon compounds, a high amount of mineral nutrients. The disadvantage of distillery residue is that the phosphorus content is too low in relation to nitrogen and potassium, with a relatively high organic carbon content [13]. Based on tests carried out in Poland, distillery residue has been shown to have a pH range of up to 4.0 to 4.5, 9.0–82.0 gTS/L, 8–66 gVS/L, 100–150 gCOD/L, 35–50 gBOD5/L and a dark brown colour [14]. The use of distillery residue as a feedstock during the fermentation process is one method of its utilisation [15]. Promising results from tests on the management of waste from whiskey production in Ireland have been reported by Kang et al. [16]. Another source of biomass for biogas production, and simultaneously, another example of a basic (single, mono) substrate for biogas production is sewage sludge generated in municipal wastewater treatment plants (WWTPs). In Poland, approximately 1 million Mg of sludge from municipal WWTPs was produced in 2019 [17].
Agricultural biogas plants are facilities with enormous potential. They have a positive impact on the economic development of an area, as well as on the environment. The ecological benefits of agricultural biogas production are very often highlighted in the research literature [18,19,20,21].
There are currently 128 biogas plants operating in Poland at the end of 2021 [22]. The biogas produced can be used in various ways. Among others, it can be burned, for example, in heating installations. It can also be burned in cogeneration, resulting in heat and electricity [23]. These are partly used for the proper operation of the biogas plant, and the excess electricity can be used to feed into the power grid, while the heat is used to heat residential and public buildings. The production of agricultural biogas increases independence and energy security, both for farms and also for the country as a whole [23,24].
The aim of this study was to investigate the biogas production potential of distillation residue by mono-fermentation (e.g., in dedicated biogas plants on the distillery site) and by co-fermentation with sewage sludge (which can be carried out in existing digesters at the wastewater treatment plans. Distillation residue selected for testing is a waste product of the agri-food industry and available in large quantities in Poland. The correctness of the fermentation process trend was verified by determining the biogas production volume, as well as its composition (including methane and hydrogen).
Traditional tests measure only methane content without giving any information on the total biogas composition; however, the potential for methane combustion and its energetic efficiency (or yield) depends on the biogas composition itself, and thus the total fraction in the produced biogas. This issue was particularly illustrated and discussed in our paper by showing a comparison between processes of mono- and co-fermentation. For qualitative comparison between both processes as well as for the interpretation of the measured data, a simple mathematical model, proposed initially by Gompertz, was used in this work. The Gompertz model enabled us to generate a bunch of accumulation curves for the production of each gas type, including methane and hydrogen as well as the total biogas in the system under consideration. Finally, an approximate analysis of the potential volume of biogas production was also carried out, based on the mass of distillery residue produced annually in Poland.

2. Materials and Methods

2.1. Research Material

Distillation residue from one of the distilleries producing raw alcohol located in southern Poland was used in the tests. Sewage sludge and inoculum were taken from a closed digester chamber of a municipal wastewater treatment plant in Warsaw (Poland). Two tests were performed, involving mono-fermentation of distillation residue and its co-fermentation with sewage sludge. The feedstock input to the bioreactors was adjusted so that the initial conditions in both tests were similar. For this, a dry matter content of approximately 5% (w/w) was assumed, with an inoculum contribution of 20% (w/w) to the total mass in the bioreactors. In the co-fermentation test, a mass ratio of distillery residue to sewage sludge of approximately 1:4 was assumed. The initial averaged mass values in the reactors were 30.7 kg and 31.0 kg, at pH: 7.0 and 7.33 (for mono-fermentation and co-fermentation, respectively). The ratio of elemental carbon to elemental nitrogen on a dry weight basis (C/N) was measured in the feedstock after the addition of all feedstocks, including inoculum and water. Initial feedstock characteristics are shown in Table 1. The fermentation process was carried out at 38 °C.

2.2. Laboratory Bioreactors

Laboratory digesters with a total volume of 44 L were used in the tests, comprising a maximum active volume of 32 L, with the remainder being the gas zone. The bioreactor has the shape of an oblong cylinder, which is founded horizontally on a frame, with the geometrical dimensions of the vessel being length 0.600 m and diameter 0.305 m. The bioreactor uses hydrodynamic mixing. The bioreactor is equipped with a heating system with an external Huber thermostat, as well as gas and suspension sampling ports.
The bioreactors were developed and manufactured at the Institute of Nuclear Chemistry and Technology in Warsaw, with the assumption that they would be used for testing methane fermentation issues on a laboratory scale to optimise mono-fermentation and co-fermentation processes and for its mathematical modelling. During the tests presented here, the reactors were operated in a batch fashion. Mono and co-fermentation tests were carried out at the same time in two identical bioreactors in the same way. Two experiments each were performed for mono and co-fermentation. The samples for the tests were taken in an identical way, as were the measurements of the amount of biogas produced and its analysis. An important issue is to ensure adequate mixing in the reactors at laboratory scale. To this end, the velocity distribution of the suspension inside the bioreactor during hydromixing was performed for an inflow and outflow hole diameter of 2 cm and a liquid flow rate of 30 L/min [25]. The results showed the presence of circulating loops, which indicates that hydromixing with the liquid stream results in good mixing of the bioreactor contents. Computational Fluid Dynamics (CFD) computational methods, using the Fluent package, were used for validation calculations.

2.3. Analitycal Methods

In the course of conducting the tests, measurements were taken of pH, TS, VS, C/N ratio and daily production: biogas and biogas composition in terms of CH4, CO2 and H2. TS and VS were measured in line with the methodology presented in the Standard Methods for Examination of Water and Wastewater [26]. Biogas composition was determined using a GA5000 biogas analyser from GeoTech, and the amount of biogas produced was measured with a dedicated MCG01 m from Ritter. The C/N ratio of the TS was measured on a Flash EA 1112NC Elemental Analyser from ThermoFinnigan. The pH was measured with a CX-401 pH meter from Elmetron, equipped with an IJ44A pH electrode from Ionode. Gas and suspension samples from the bioreactors were taken at a frequency of 3 to 5 times per week.

2.4. Mathematical Modeling

A simplified Gompertz model was used to model the trend of the accumulation curves. A multi-parameter estimation procedure was used to estimate the parameters in the mathematical model, which was written in the SCILAB programming language. SCILAB is a high-level programming language and was developed at the École nationale des ponts et chaussées (ENPC) in France in 1990. The simplified Gompertz model is used to describe biogas, methane or hydrogen accumulation curves with respect to the initial TS or VS values in the bioreactor. The tests used a simplified Gompertz model in the form of Equation (1).
ym(t) = am exp [−exp ((br e/am) (ct − t) + 1)]
where
ym(t)—gas i accumulation (L/kg VS)
am—maximum biogas production value (L/kg VS)
br—biogas production rate (L/kg VS d)
ct—time of the incubation phase (d)
t—test time (d)
e—basis of the natural logarithm [2.718]
for i = biogas, methane, hydrogen
The maximum production value for biogas, methane and hydrogen presents the amount of a given gas that can be produced from 1 kg VS. The production rate of a given gas refers to the incremental production per day. The incubation phase time, on the other hand, corresponds to the time of adaptation by the microorganisms to the feedstock in question, after which the effective production rate of the gas in question is obtained.

3. Results and Discussion

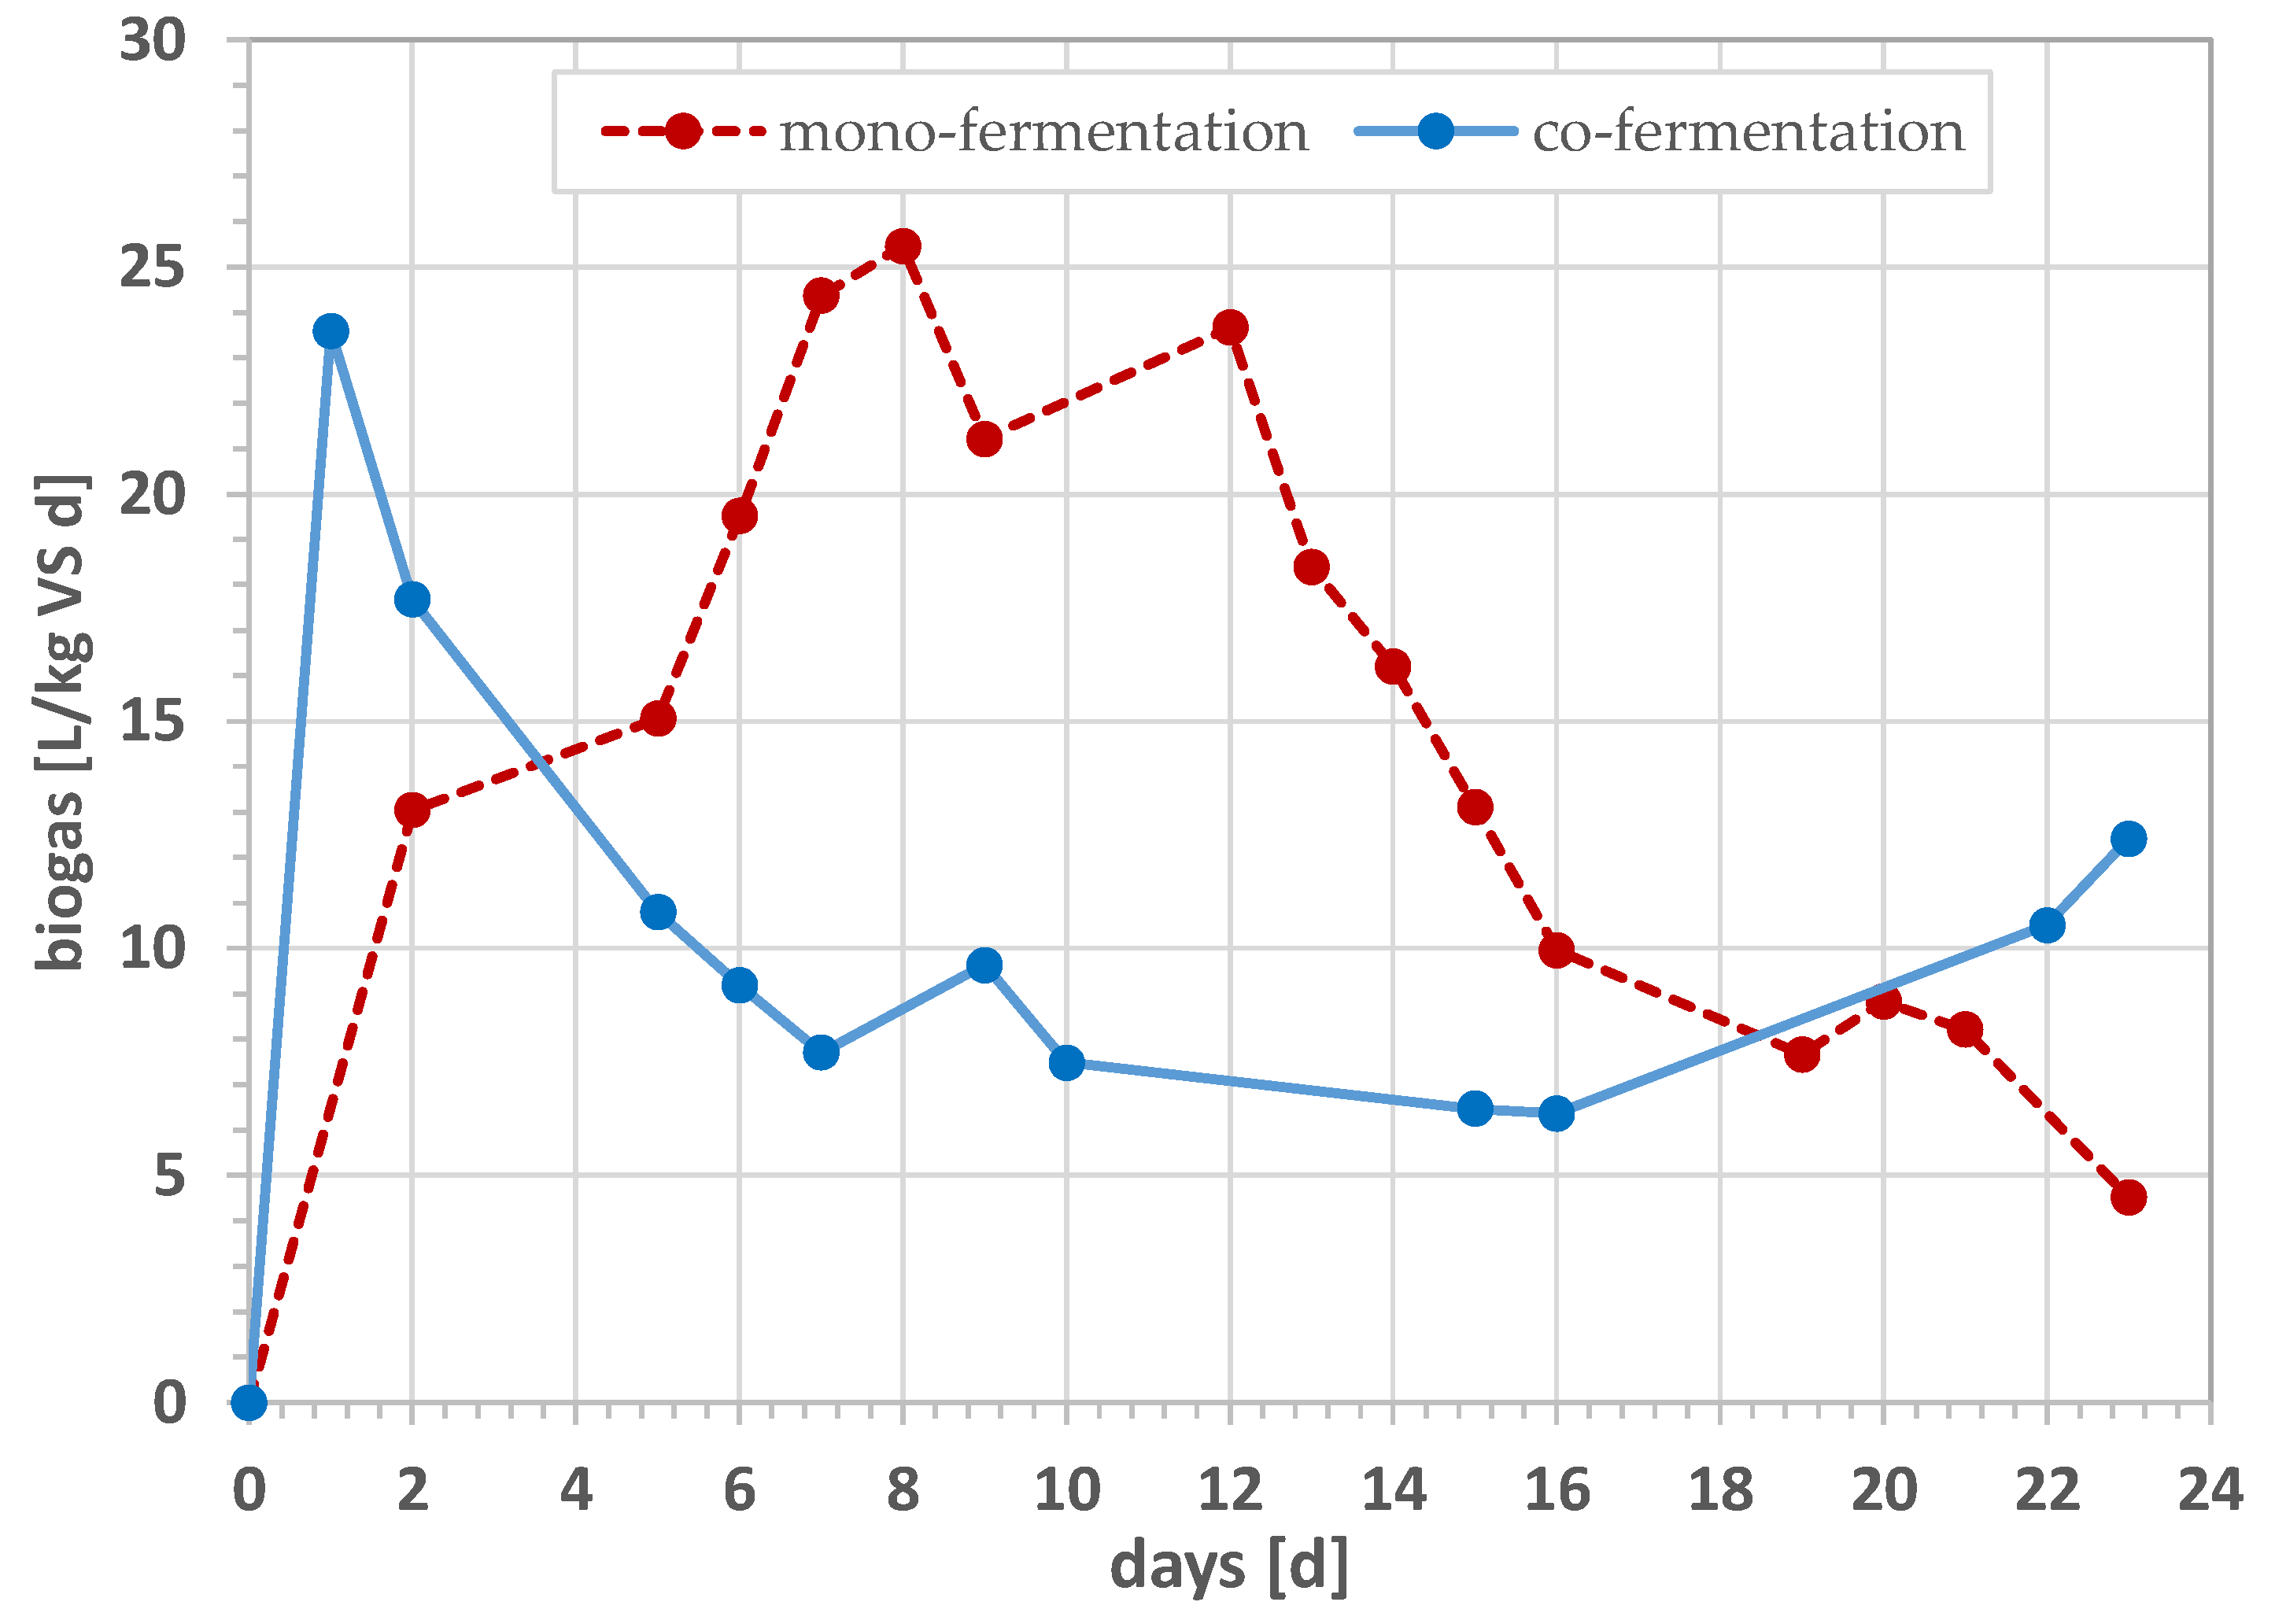
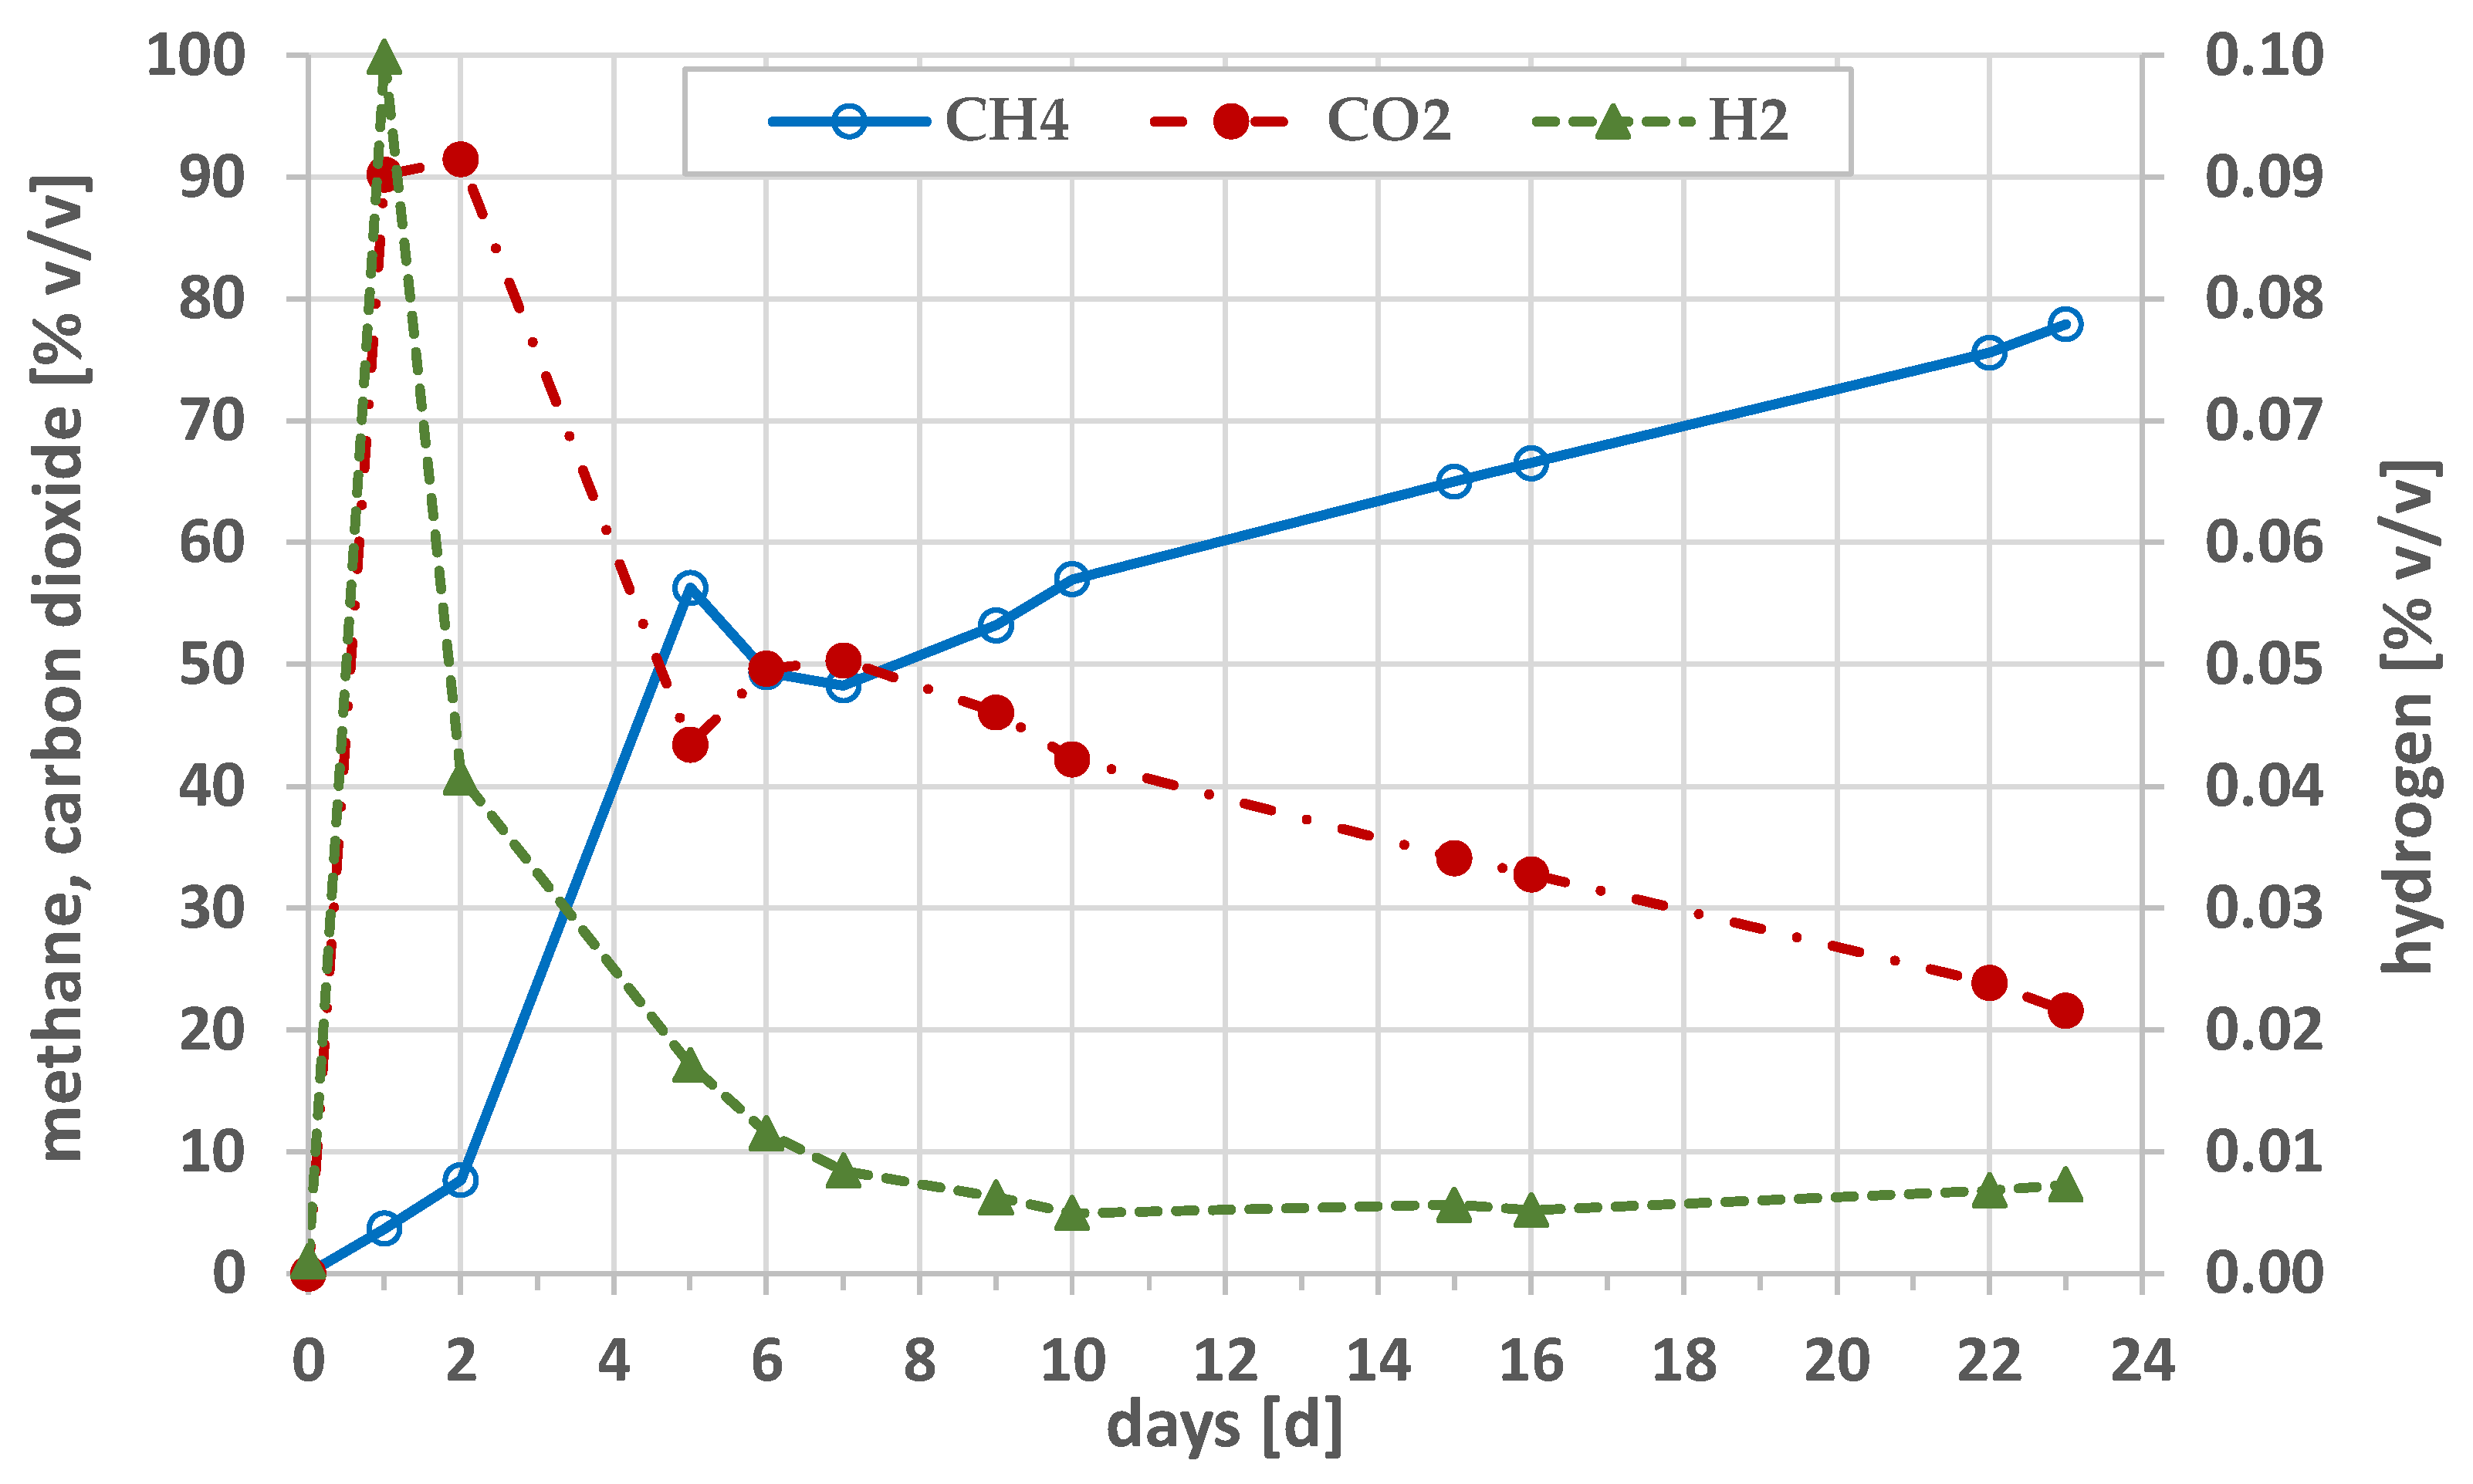
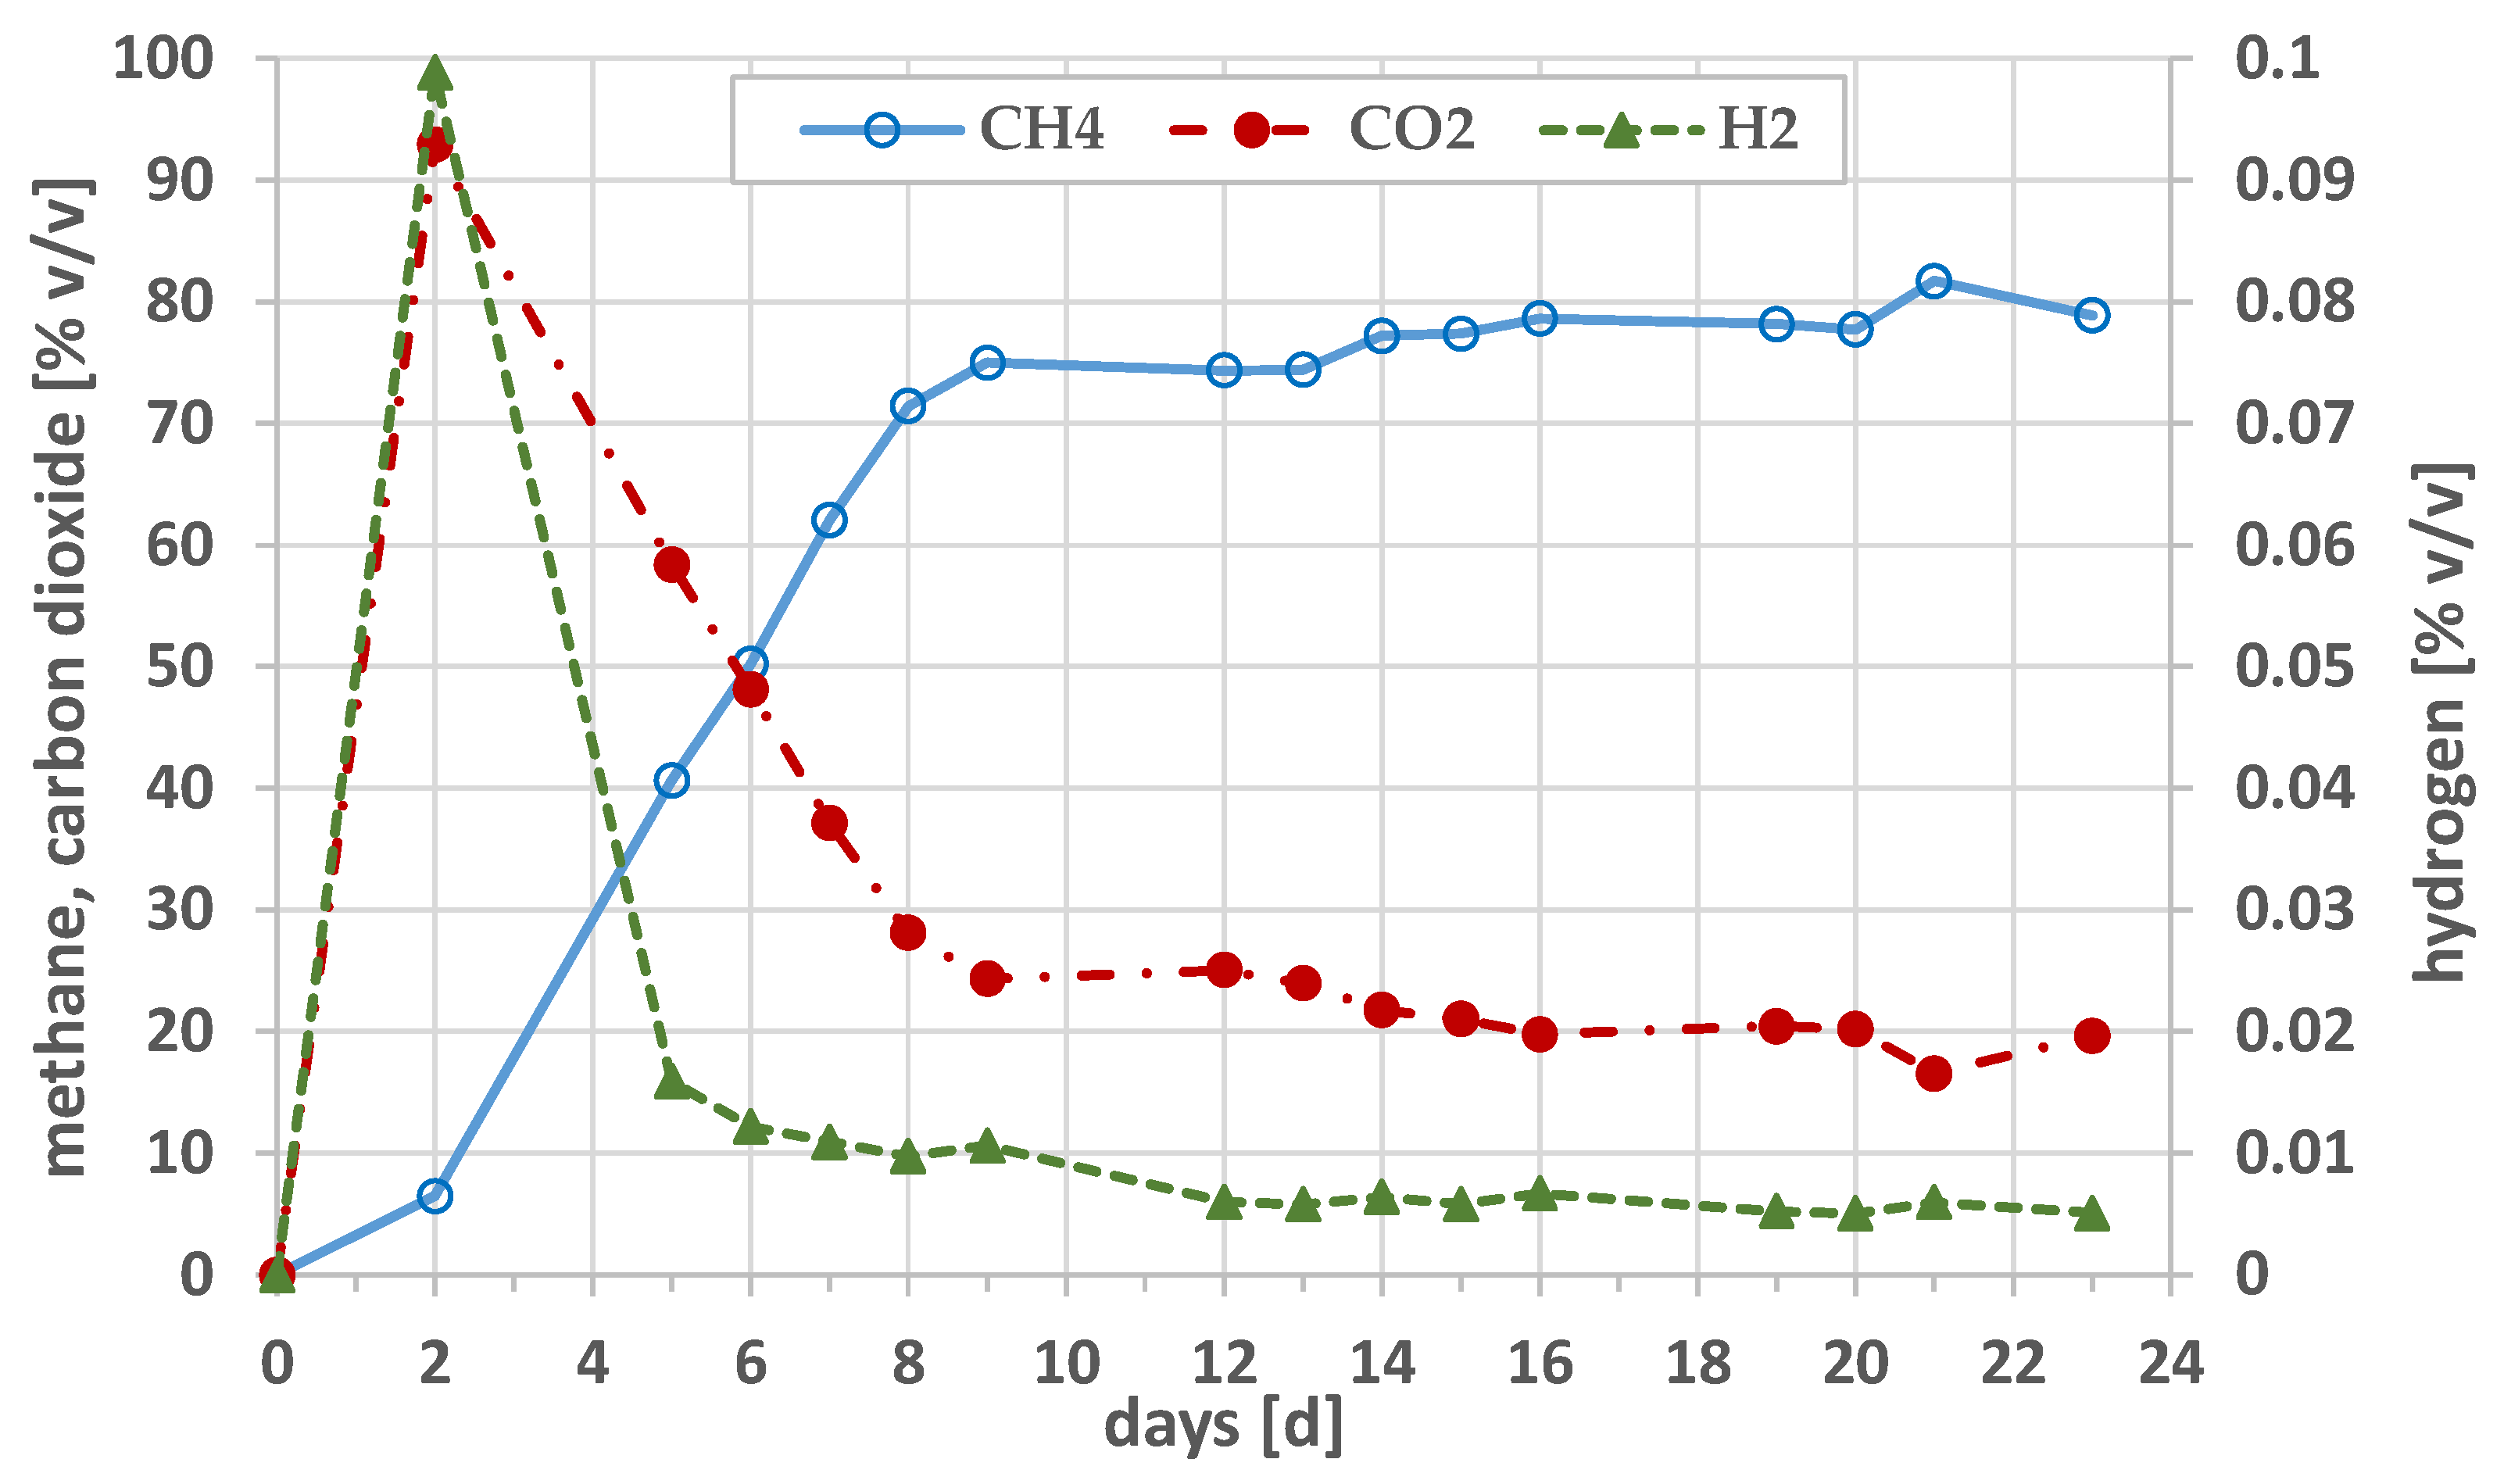
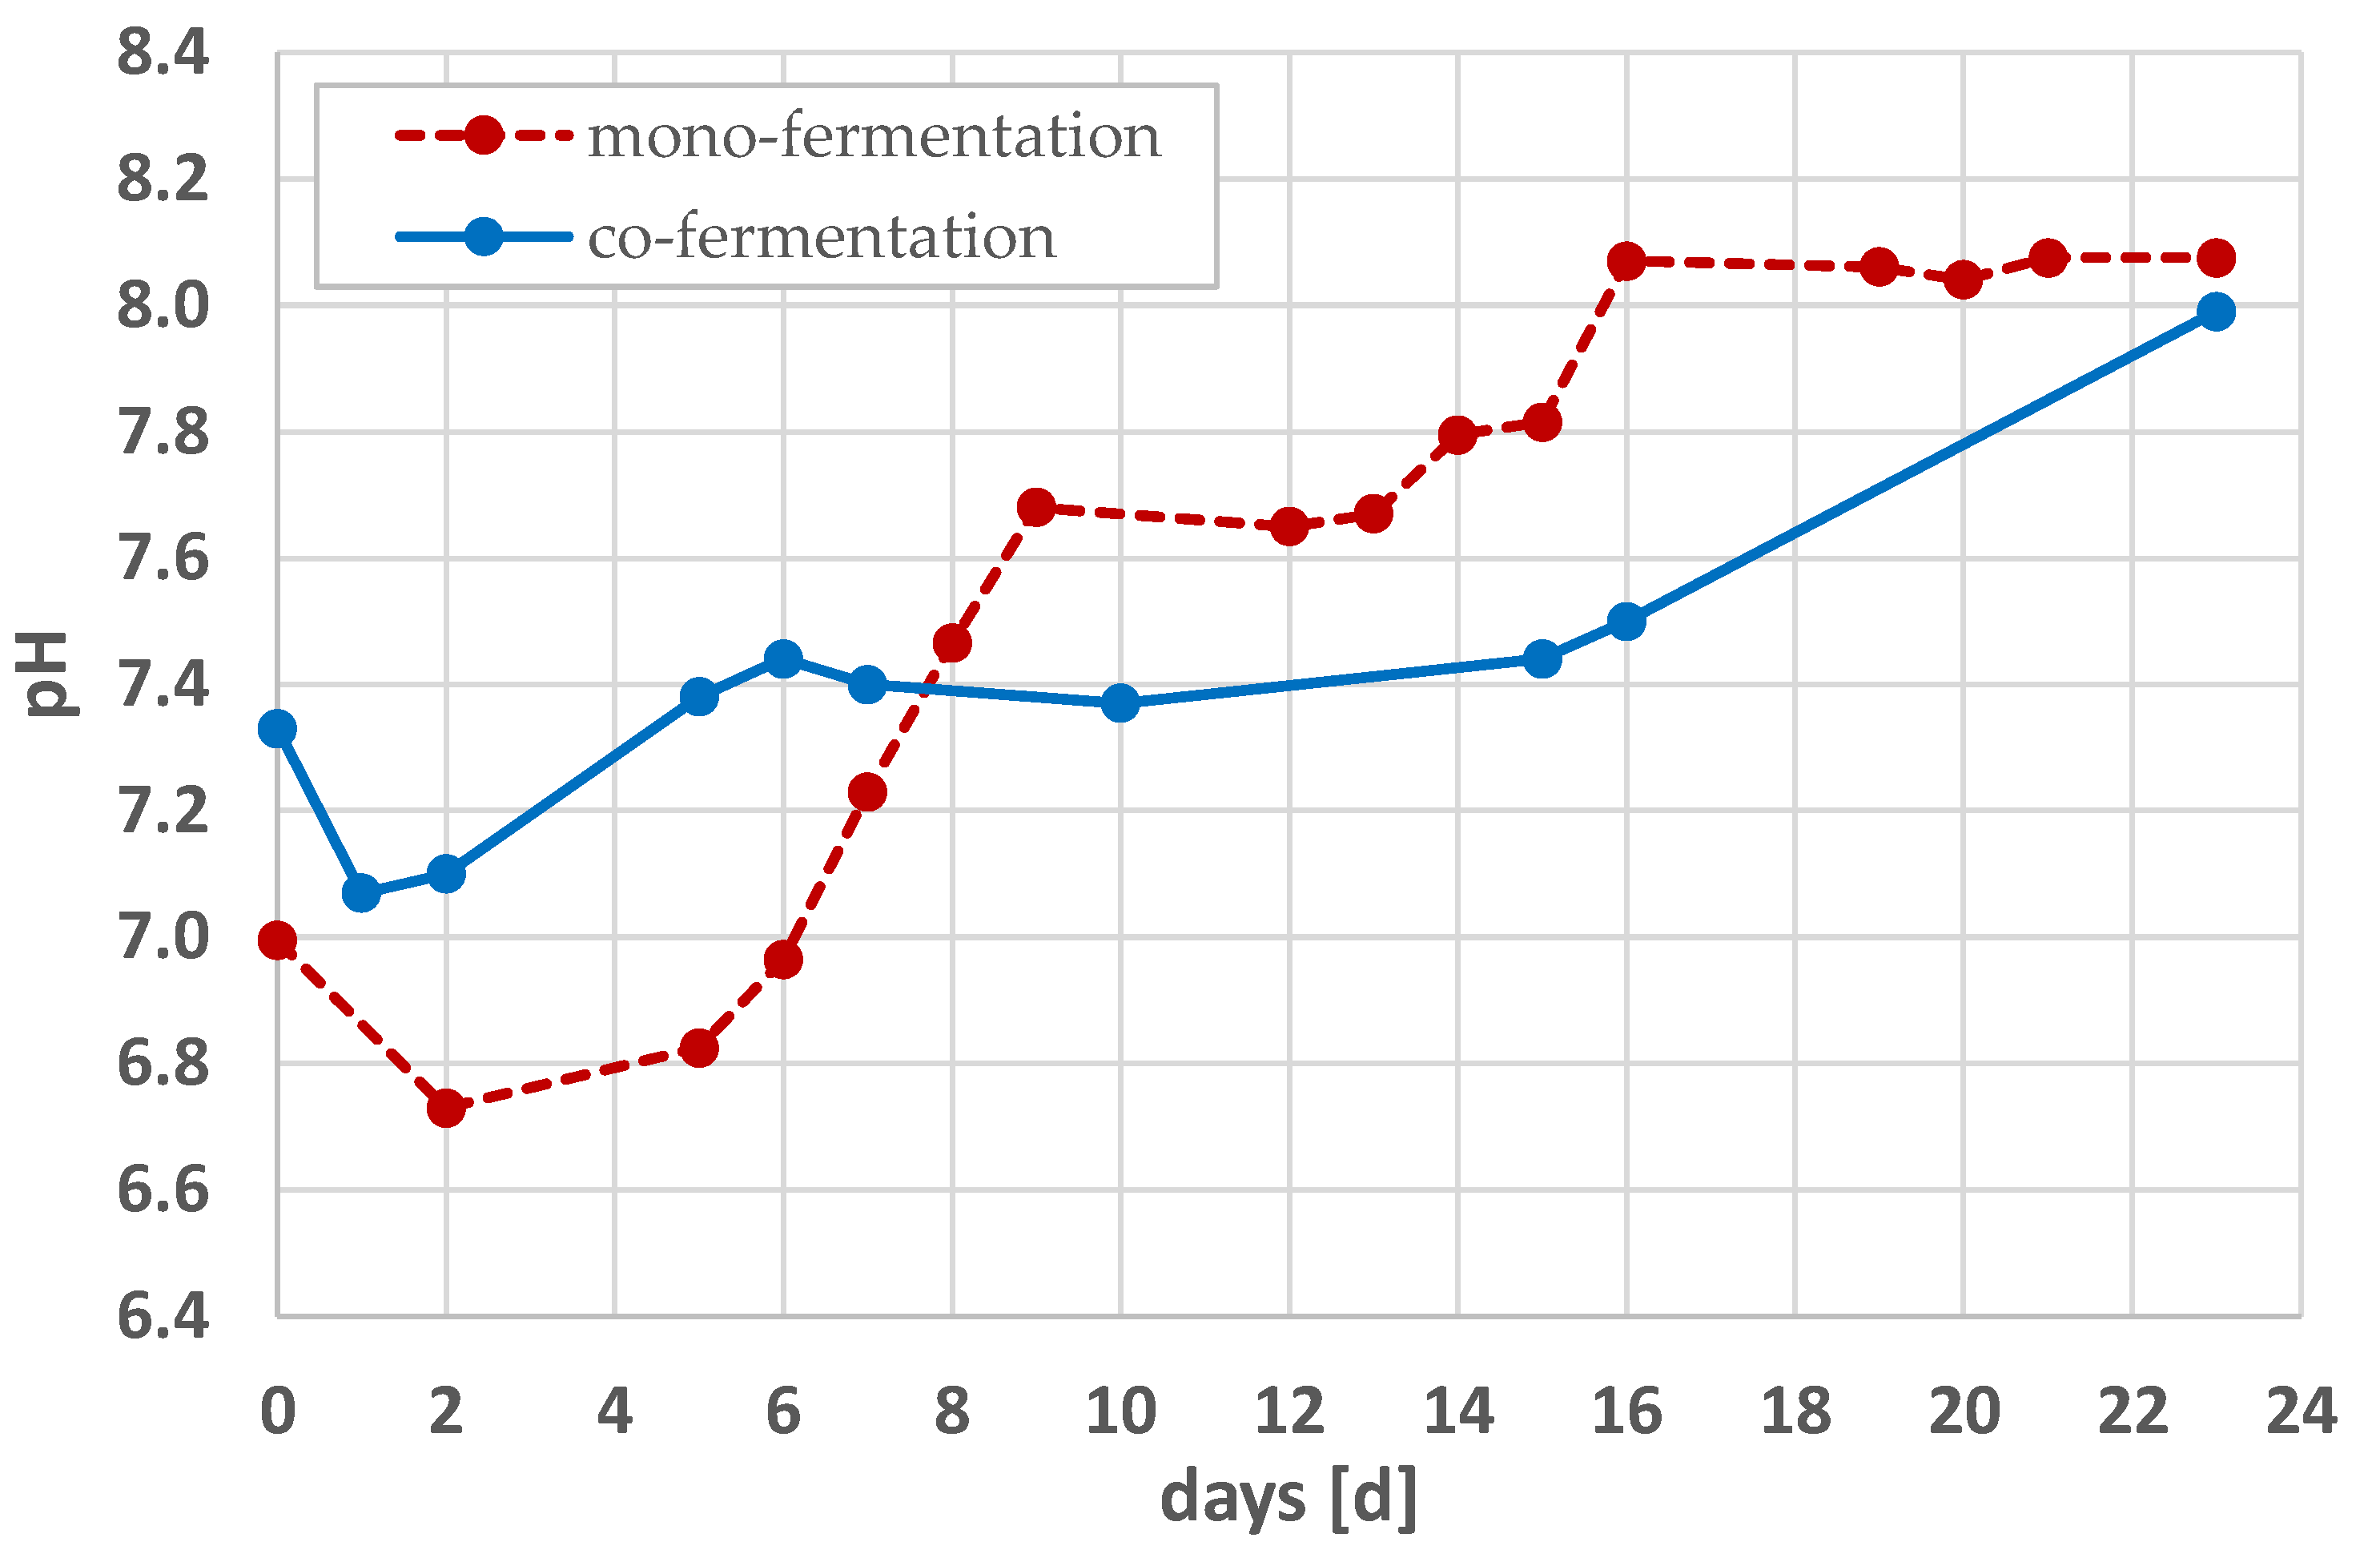
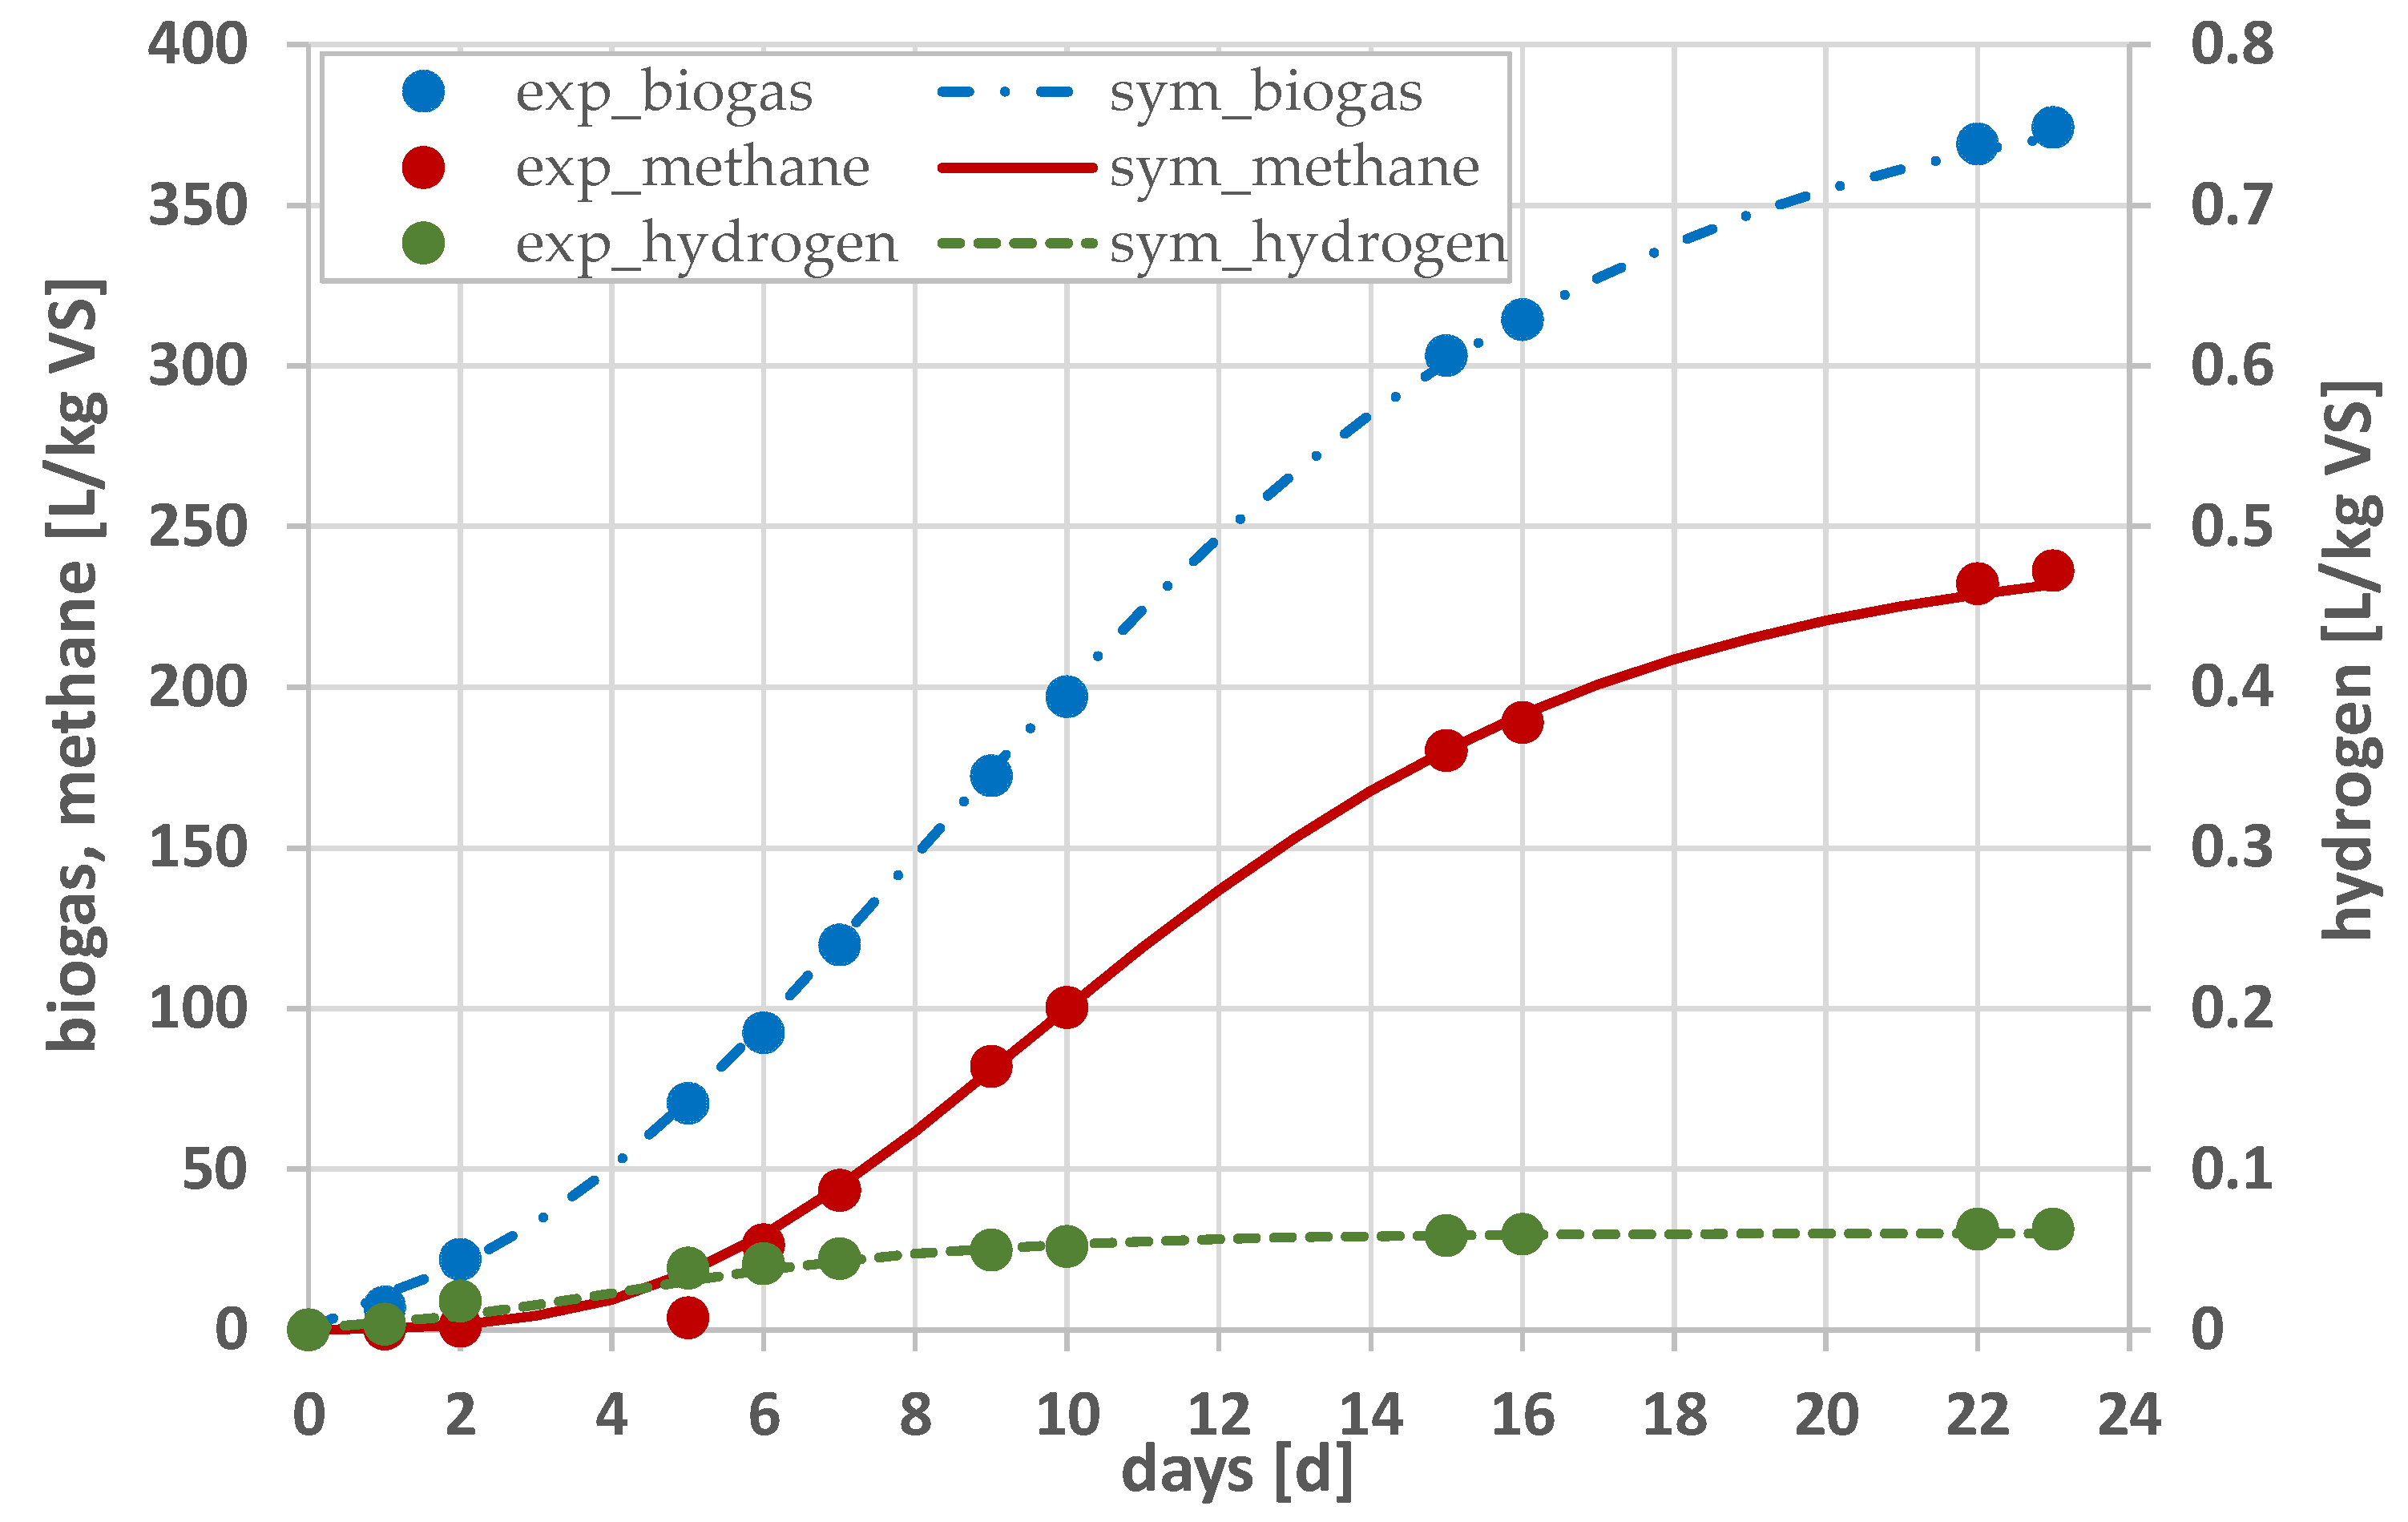
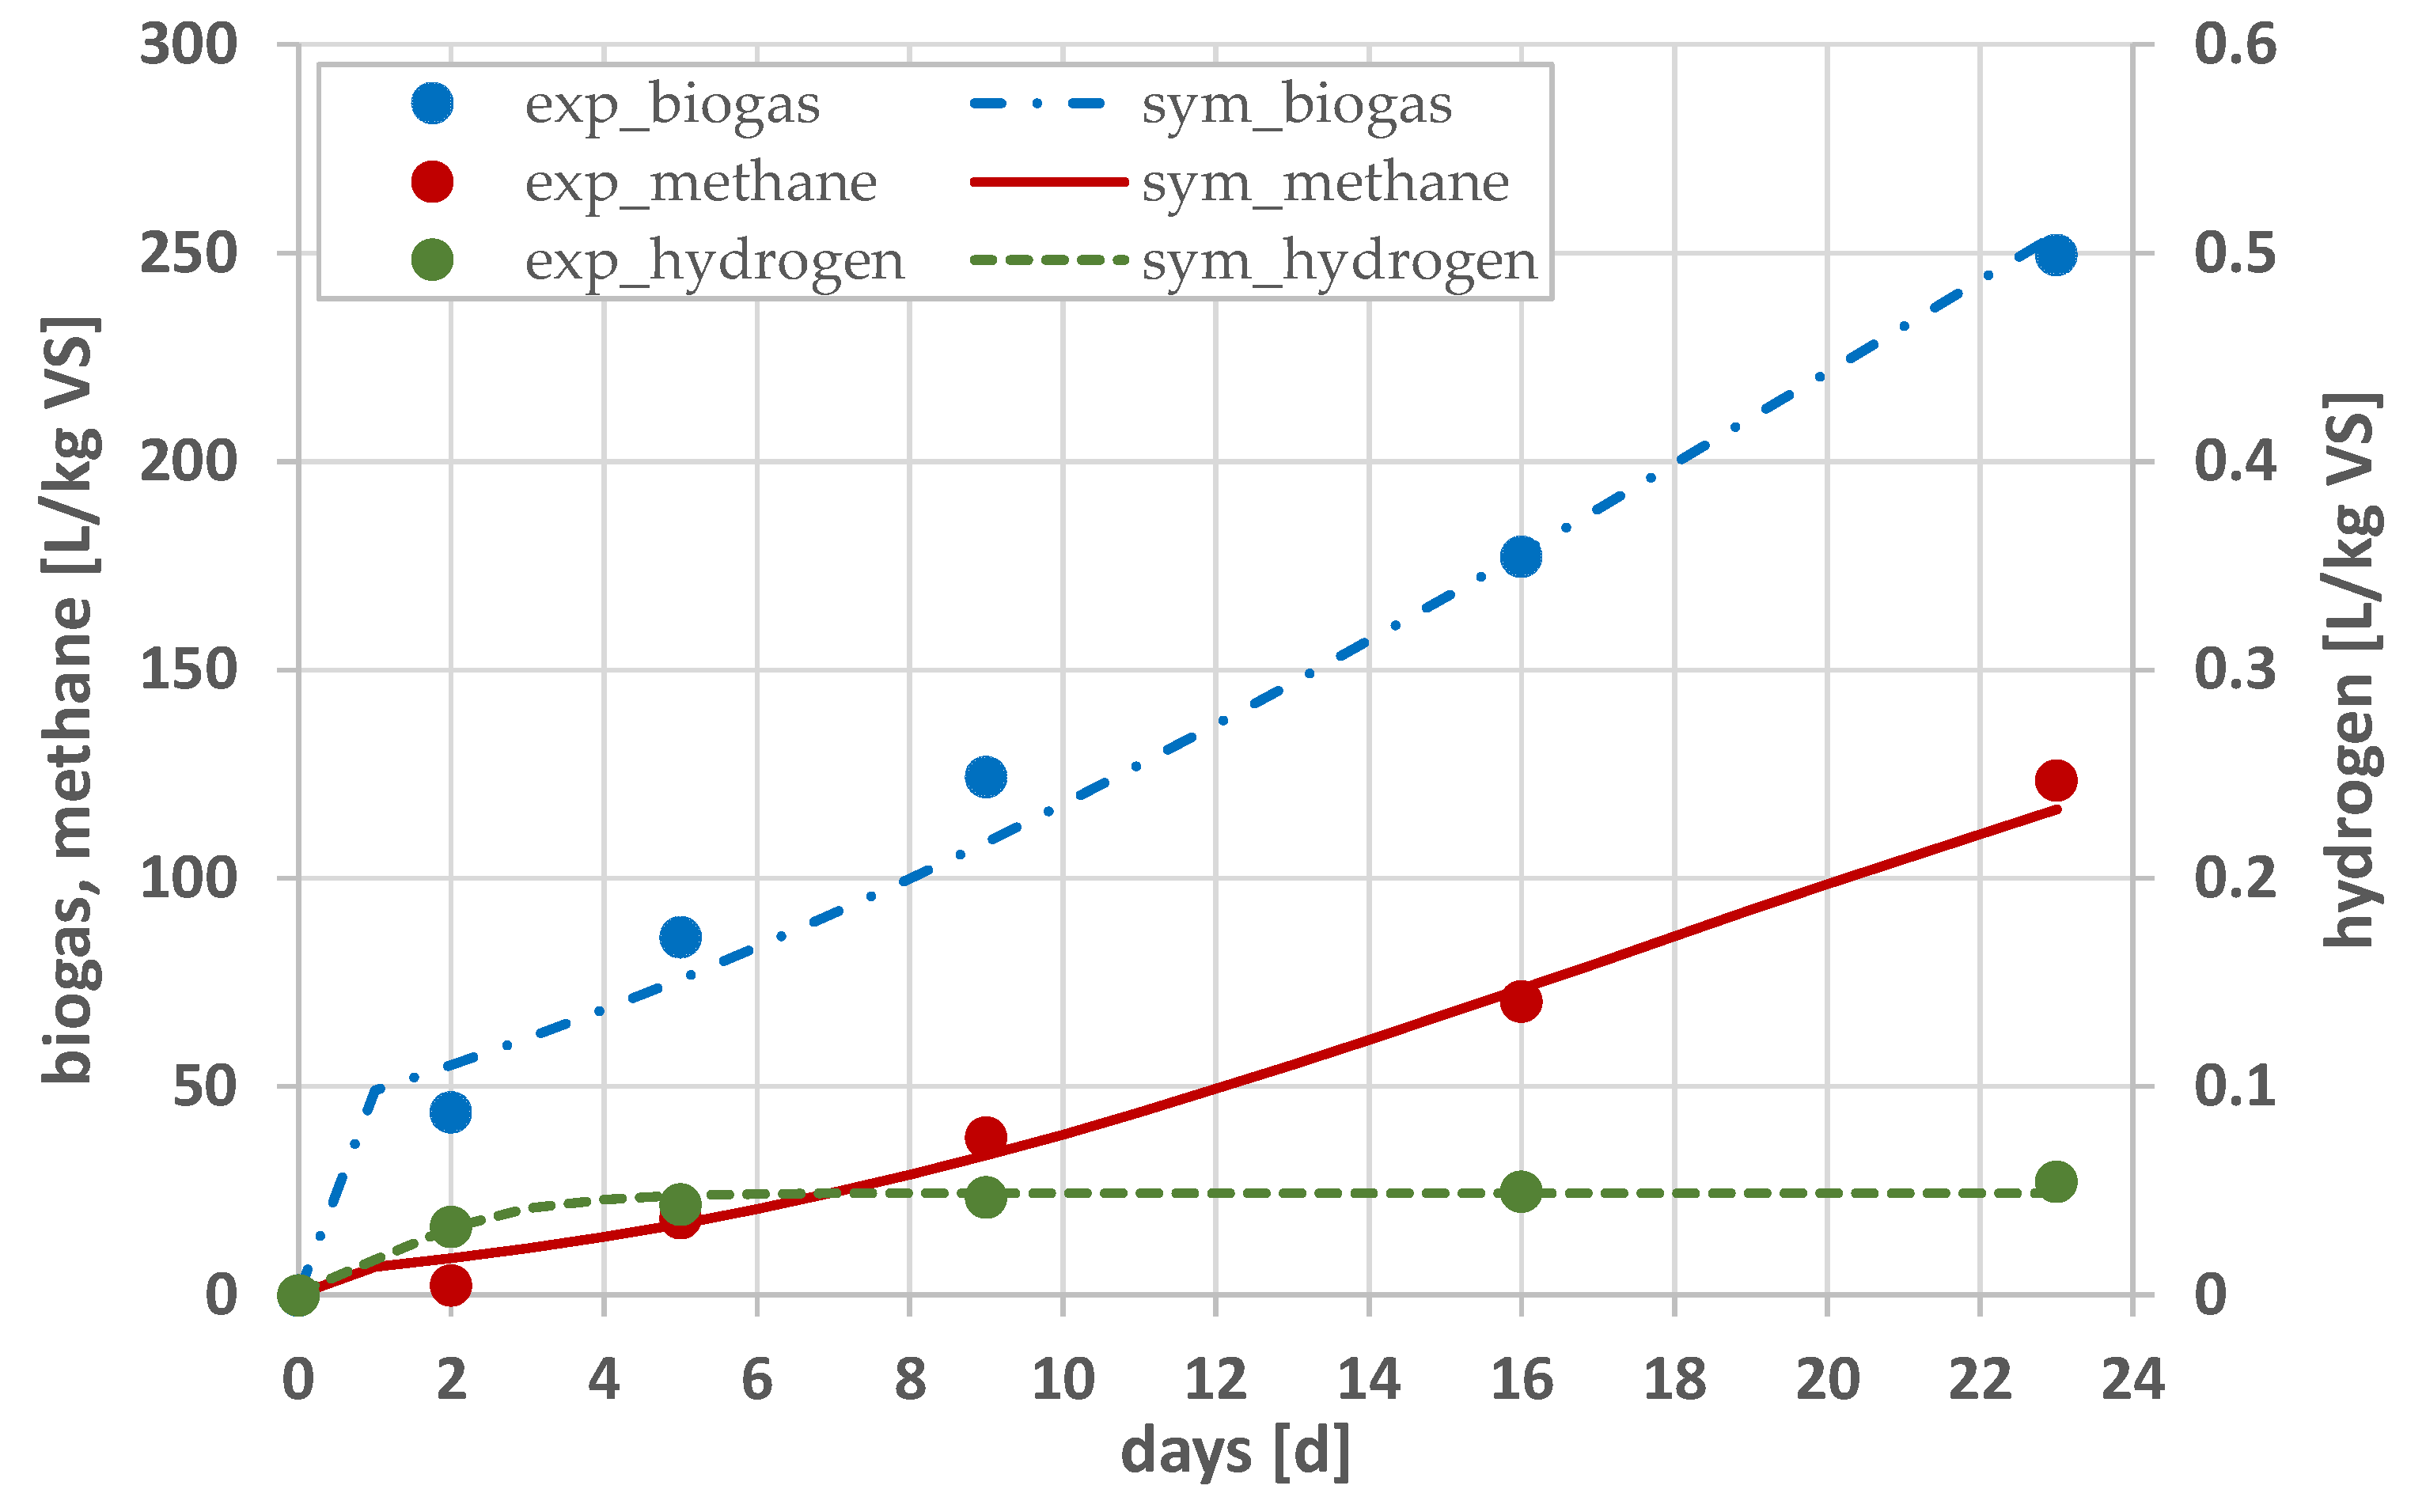
3.1. Biogas Production Volume and Composition

Tests on the mono-fermentation of distillation residue and the co-fermentation of distillation residue with sewage sludge were conducted over a period of 23 days. The process times correspond approximately to the average residence time of the feedstock in Polish agricultural biogas plants, e.g., in Miedzyrzecz Podlaski and Koczeregy-Parczew. These biogas plants were built according to Polish Patent PL 197595, in which the pre-hydrolysis stage was separated from fermentation.
The test results obtained for the accumulation and unit productivity of biogas, methane and hydrogen are summarised in Table 2. The data in Table 2 show that the production of biogas, methane and hydrogen is higher for mono-fermentation than for co-fermentation. The volume of biogas produced after 23 days of the test was almost 15% higher for mono-fermentation, while the unit production volume (in terms of kg VS) was as much as 33% higher. The differences are even greater to regarding the amount of methane produced. The mono-fermentation process resulted in its increased total production, higher by almost 50%, with a unit yield increase of 70%. This resulted in a significantly higher average proportion of methane in the biogas produced, increasing from about 50% for co-fermentation to 63% for mono-fermentation. In contrast to hydrogen, where the differences were small, at 4%.
In the literature reviewed, the specific methane production rate from sewage sludge varies between 300 and 400 L/kg VS [27,28,29]. These values are much higher than those obtained in the sewage sludge broth co-fermentation test, which may be due to the fact that, in these tests, the production rate was related to the total feedstock mass. A similar relationship was indicated in their test by Willińska-Lisowska et al. [30], where the specific methane production rate for sewage sludge was 165 L/kg VS (considering the total feedstock mass), and this is similar to the rates obtained for co-fermentation. At the same time, it was shown that regarding the mass of sewage sludge input only, this corresponded to a productivity of as much as 460 L/kg VS, which, in turn, is close to the values presented in the review papers. Furthermore, the unit biogas production per total input mass (306 L/kg VS), presented by Wilińska-Lisowska et al. [30], is close to the values obtained in the present study. Tests conducted in a similar research setting with corn silage fermentation showed that the production rates of biogas (270.452 L/kg VS), methane (144.429 L/kg VS) and hydrogen (0.030 L/kg VS) [25] were similar to the values obtained in the present study for co-fermentation of distillation residue and sewage sludge. Furthermore, similar values were obtained in the mono-fermentation of distillation residue (264.0 L/kg TS) and in the co-fermentation of distillery residues with corn silage (341.0 L/kg TS) [31]. In contrast, significantly higher unit methane production rates were shown in tests on co-fermentation of pig slurry with food waste—278.8 L/ kg VS [32], and kitchen waste—328.39 L/kg VS [33].
The major difference between mono- and co-fermentation is due to the C/N ratio, which was a result of the composition of the raw materials used in the tests. The C/N ratio is a value resulting from the assumptions made regarding the initial TS value and the proportion of inoculum in the tests. At the same time, it has an impact on the amount of biogas produced. For mono-fermentation, the C/N ratio was 21.6:1, while for co-fermentation, it was almost three times lower (7.8:1). In practice, this means that, for co-fermentation, the availability of organic carbon is lower than for mono-fermentation. Higher C/N ratios translate into higher biogas production, which was also observed in tests on the co-fermentation process of chicken manure, dairy waste and wheat straw. Tests were conducted for a wide range of C/N ratios (15:1, 20:1, 25:1, 30:1 and 35:1), which was achieved by varying the feedstock ratio. In these tests, the optimum C/N ratio was determined for a range from 25:1 to 30:1 [34]. Gunes et al. [35], analysing the impact of pre-treatment methods for brewery waste and distillation residue from whiskey production on biogas production rates, indicated that the C/N ratio should be in the range of 15:1 to 35:1. Therefore, the magnitude of the C/N ratio for mono-fermentation is within the range of optimal values, while for co-fermentation, it is well below this range. Such a low value for this ratio translated into lower biogas production volumes in the co-digestion test.
Figure 1 shows the daily biogas production rates for mono- and co-fermentation. In these tests, the trend differs in a major way. In the case of co-fermentation, the maximum daily biogas production of 23.60 L/kg VS d is already present after one day. There is then a rapid decline in daily production, which stabilises at 7–10 L/kg VS d after 5 days. From day 16, however, there is a steady increase in daily biogas production, which rises from a value of 6.40 to 12.41 L/kg VS d on day 23 of the test. For the mono-fermentation, there is a gradual increase in daily biogas production, which reaches a maximum value (25.46 L/kg VS d) on day 8 of the test. There is then a systematic decline in the volume of daily biogas production to around 10 L/kg VS d until day 16. In the final period, production stabilises at 5 L/kg VS d. The difference in daily biogas production can be attributed not only to the availability of organic carbon by the microorganisms, but also to its origin. The inoculum that was used for inoculation was taken from a municipal wastewater treatment plant in Warsaw, which uses sewage sludge as a feedstock for methane fermentation. This sludge is one of the feedstocks in the co-fermentation process, which means there is no need for the microorganisms present in the inoculum to adapt to this carbon source. In contrast, distillation residue is a feedstock that probably requires adaptation of the microorganisms, which manifests itself in an extended period of reaching the maximum daily biogas production value in the distillation residue mono-fermentation tests.
The trend of the methane, carbon dioxide and hydrogen content changes in the biogas during the tests is shown in Figure 2 (for distillation residue mono-fermentation process) and Figure 3 (for distillation residue and sewage sludge co-fermentation process). On the other hand, Figure 4 shows the changes in pH values during these tests.
The carbon dioxide content reached its highest value after 2 days of the experiment, and was equal to 91.44% v/v and 92.90% v/v, in the mono- and co-fermentation tests, respectively. Regarding hydrogen, its maximum content was observed even after the first day of the process in the case of mon-fermentation and after 2 days of experiment in co-fermentation and was equal to 0.100% v/v and 0.098% v/v (in the mono- and co-fermentation tests, respectively).
The trend of changes in the methane content of the biogas in the co-fermentation test shows that a plateau was reached after 9 days of experiments, and the highest methane concentration was measured after 21 days, giving a concentration equal to 81.69% v/v. In the case of mono-fermentation the increasing trend was observed with the highest concentration being attained after 23 days with a value of 77.91% v/v methane concentration. As can be observed in this case, a plateau was not reached in the test; instead, there is evidence of a continuous slow increase in the daily methane content. Differences in the trends of daily biogas production curves and methane and carbon dioxide concentrations are due to the availability of microorganisms to organic carbon contained in feedstocks, and also to the adaptation of the microorganisms contained in the inoculum to a given organic carbon source. The inoculum contains a consortium of microorganisms that are adapted to the environmental conditions from which they were taken and are then transferred to a new environment, which may have a different feedstock composition to the existing one. Tests on the adaptation of microorganisms that were isolated from different environments and then added to the same feedstock, which was corn silage, were conducted by Wojcieszak et al. [36]. The tests were carried out in a similar manner in three bioreactors in parallel, which allowed the results of the adaptation of different inoculums to be compared. Inoculum came from an agricultural biogas plant in Międzyrzec (MP), from a cattle slurry tank of a rural farm in Niemogłowy (GB) and from a municipal wastewater treatment plant in Warsaw (WA). In these experiments, corn silage was used as feedstock. The tests were conducted in a quasi-continuous feed reactor, with separation of the initial hydrolysis phase from the major methane fermentation. The process in these systems was run for 55 days and was divided into three stages. Stage I lasted from day 1 to 15, stage II from day 16 to 30 and stage III from day 31 to 55, with Stages I and II comprising plant start-up and Stage III biogas production. It was shown that the maximum methane content values were obtained for Stage II (72% v/v, 74% v/v and 64% v/v, for MP, GB and WA, respectively). In stage III, on the other hand, the average methane content was similar for all inoculums used and was around 63% v/v. These results support the thesis that time is needed for the microorganisms contained in the inoculum to adapt to the current composition of the feedstock in the digesters. During the tests presented in this work, the maximum methane content was 81.69% v/v for mono-fermentation and 77.91% v/v for co-fermentation), with average values of 63% v/v and 49% v/v. Taking into account the fact that running the process in a batch reactor (present study), compared with a quasi-continuous feedstock reactor (as in the tests presented by Wojcieszak et al. [36]), is characterised by a higher conversion rate of the organic feedstock; for mono-fermentation, the mean methane contents can be considered comparable to the mean values presented in the tests of Wojcieszak et al. [36].
If the pH value is reduced below six, acidic fermentation starts to dominate, the trend of which results in an increase in hydrogen and carbon dioxide content with less methane content in the biogas. This type of fermentation is used to obtain hydrogen. The use of sludge acid digestion to produce hydrogen from sludge from a municipal wastewater treatment plant was presented by Gioannis et al. [37]. In this work, it was shown that the optimum pH for this type of process was between 4.5 and 6.0. During acidogenesis, organic acids such as butyric or propionic acid are formed, which are converted in methane fermentation to acetic acid and then to methane [38,39]. Methanogenic bacteria are particularly sensitive to the magnitude of the pH, with an optimum value of 6.5 to 7.2 [40]. For this reason, laboratory tests use NaOH, NaHCO3 or CaCO3 to correct the pH in methane fermentation. In the presented study, an initial pH adjustment was carried out with NaHCO3 to a value of 7.0 (for mono-fermentation) and 7.3 (for co-fermentation). In this way, conditions were created under which the fermentation process trended towards methane fermentation. The lowest pH values were recorded after 2 days and 1 day of the mono- and co-fermentation test and were equal to 6.73 and 7.07 (for mono- and co-fermentation, respectively), confirming that the applied conditions favourable for the trend towards methane fermentation were present.

3.2. Modelling of Biogas Production Volumes and Composition

Methane is produced by the conversion of acetic acid by microorganisms (bacteria). The decomposition of one mole of acetic acid yields one mole of methane and carbon dioxide. During methanogenesis, an additional synthesis of 1 mole of carbon dioxide with 4 moles of hydrogen takes place, where 1 mole of methane and 2 moles of water are produced. A detailed scheme for methane fermentation is presented in the work of Batstone et al. [38]. In this paper, a complex model of methane fermentation is presented with its mathematical description in the form of the ADM1 model. It requires a large amount of initial data on kinetic constants and yield coefficients for a given feedstock composition and individual sub-reactions. For this reason, it cannot be used to describe the fermentation process on the basis of biogas and methane production volumes and TS and VS values alone. If one wants to make a simple analysis of the process, then it is reasonable to use the simplified Gompertz model. This is a simple mathematical model that uses accumulation versus dry matter or dry organic matter curves to describe the process. In this way, the results obtained can be standardised and compared with each other. This model has been used, among others, to describe accumulation curves per unit VS obtained during the co-fermentation of pig slurry and rice straw [41], or co-fermentation of municipal sludge with biological sludge [42].
Accumulation curves for biogas components are useful for process evaluation but should be considered in relation to changes in the percentage concentrations of the individual components and the amount of biogas produced per day. Figure 5 and Figure 6 show the trend of the cumulative biogas, methane and hydrogen production curves per unit VS obtained from simulations with the Gompertz model in mono-fermentation and co-fermentation tests. The biogas and methane production curves for mono-fermentation approach a trend towards constant (plateau) values. For co-fermentation, on the other hand, they have a constant upward trend, indicating that the plateau for them will be reached after a longer retention time in the digester (more than 23 days). In the case of hydrogen, the accumulation reached a maximum value after about 4 to 10 days for mono-fermentation with a subsequent downward trend whereas for co-fermentation, the maximum is reached after only 4 days and stabilizes on this level till the end of a test process. This indicates that hydrogen is being used to generate methane. The parameter values of the Gompertz models, calculated using SCILAB, are summarised in Table 3.
The calculated correlation coefficients R2 indicate a very good match between the experimental results and the simulation results (above 0.97). The maximum production value (‘am’) is one of the model parameters and refers to the maximum volume of a given gas that can be produced per unit VS. The simulation results showed that the maximum biogas production volume is higher for co-fermentation, compared with mono-fermentation, by 166.5%. However, for methane production, the values are similar. The correlations obtained from the model are opposite to the experimental results, where higher values were obtained for mono-fermentation. It should be noted, however, that the calculated values of the ‘am’ parameter refer to the situation where a plateau would have been obtained in both tests. The experimental results, on the other hand, indicate that such a situation would occur for different process running times. In the tests presented here, the process was run for 23 days. The simulation results indicate that the maximum biogas and methane production values would have been obtained over a longer period of time than the tests lasted. At the same time, the values obtained indicate that, in such a situation, the productivity would be higher for co-fermentation compared to mono-fermentation. For hydrogen, where a plateau was obtained, the maximum production value is 60% higher for mono-fermentation.
The daily production rates (‘br’ parameter of the model) of biogas and methane are higher for mono-fermentation, by 242% and 308.5%, respectively. In contrast, they are 47.1% lower for hydrogen, with hydrogen being converted to methane during fermentation with carbon dioxide. The parameter ‘ct’ corresponds to the time of adaptation by the microorganisms, which, for the results presented here, is equivalent to the time of adaptation of the contained microorganisms to efficiently produce biogas, the methane-producing microorganisms and the hydrogen-producing bacteria. In the case of biogas, the consortium adapts for 2.486 days (mono-fermentation), and for co-fermentation, this time is 0 days. This confirms the thesis formulated earlier, whereby the bacteria contained in the inoculum from the municipal wastewater treatment plant are already adapted to utilise the sewage sludge used at this facility as an input to the digesters. For methane, the adaptation times are very similar, at 4.335 and 4.385 d (mono-fermentation and co-fermentation). The differences between the two tests are negligible due to the fact that methane production is the last stage of the fermentation process. For hydrogen, the adaptation time is 0 d in both cases, which is related to the production of hydrogen already in the first stage of the process.
Kang et al. [16] presented the results of their work on the fermentation of whiskey production waste subjected to chemical and thermal pre-treatment. The experimental results allowed the determination of methane accumulation curves by simulation using a modified Gompertz model. The maximum production rate for methane was 394.9 L/kg VS, with a production rate of 30.4 L/kg VS d and an adaptation fermentation time of 1.49 d (R2 = 0.997). These values differ from those obtained for the mono- and co-fermentation tests. Maximum production rates for methane are lower by more than 70% and daily methane production rates are lower by 50% (mono-fermentation) or even 400% (for co-fermentation). Such large differences may be the result of the pre-treatment of alcohol production waste used in the test by Kang et al. [16]. On the other hand, the adaptation time is longer, indicating a longer period required for the inoculum to adapt to the distillation residue, which may be an additional reason for the lower values of maximum production and production rate of methane generation.
The simplified Gompertz model can be used to describe biogas, methane or hydrogen accumulation curves. Its use enables predictions to be made that can save time in methane fermentation tests. The data from the model determined for experimental tests of 23 days can be used for simulations without the need to run the process further.

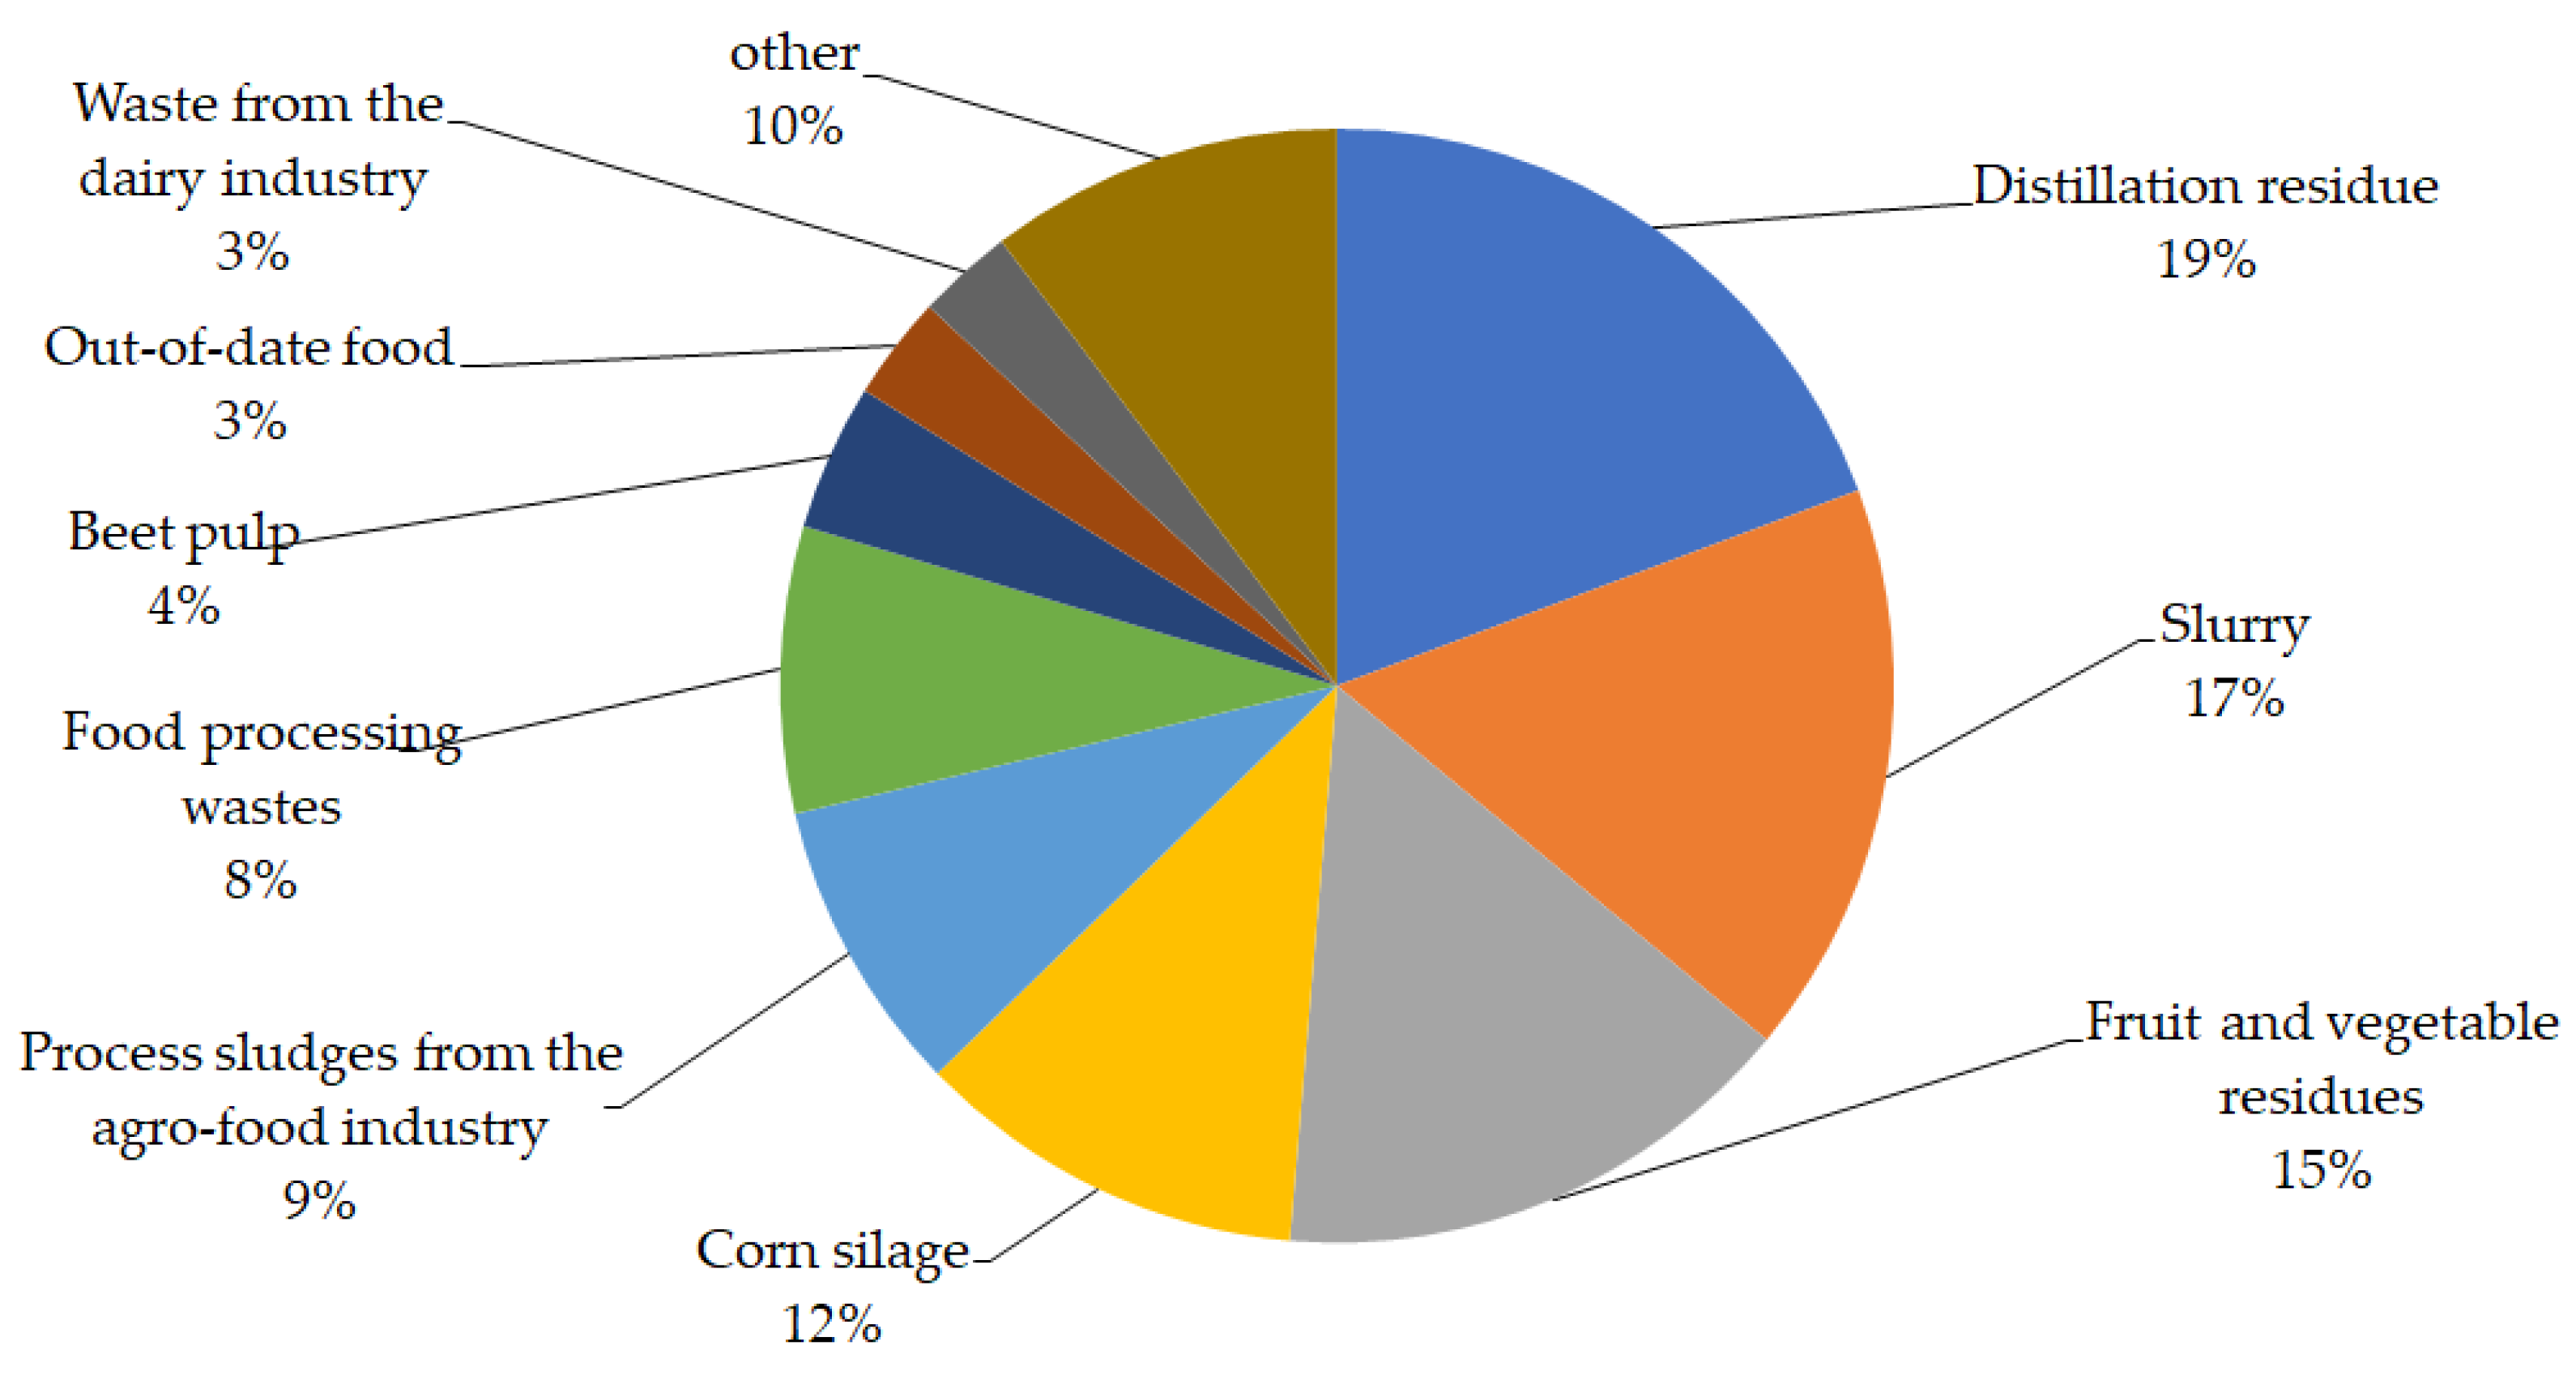
3.3. Potential for Using Distillery Stock in Poland

Poland is the largest producer of spirits in the European Union and the fourth largest in the world. Around 320 million litres of spirits are produced annually. The quantities of distillation residue produced as waste, therefore, amount to millions of tonnes per year. According to the Polish Statistical Office, each kilogram of spirit produced yields between 4 and 10 kg of distillery by-product, namely, distillation residue.
There are almost 130 agricultural distilleries producing ethanol in Poland [22]. Some of them have implemented systems to dehydrate decoctions and produce feed from them, but this only applies to distilleries working with cereals and corn, while it is not possible to produce feed from decoctions based on industrial waste such as molasses. For economic reasons, producers are increasingly switching from cereal-based decoction to molasses-based decoction, which is most often used as fertiliser exported to agricultural fields. However, fertilisers cannot be applied all year round. In Poland, during the winter period (from December to February), it is prohibited to take any substance to the field for fertiliser purposes. During this period, spirit producers are obliged to store distillation residue or to allocate them to other uses, e.g., use for biogas production. Figure 7 shows the raw materials used for biogas production in agricultural biogas plants in 2021. Distillation residue is ranked first in the raw materials used for biogas production (19%), followed by slurry and fruit and vegetable residues (approximately 17% and 15% each, respectively).
Considering the annual alcohol production, the mass of distillation residue produced can be estimated at 1–2.5 million tonnes per year. There is information available in publications on the characteristics of distillation residue generated during alcohol production, based on different starting feedstocks. Kang et al. [16] reported that the TS of the alcohol production stock they used was 7.87 ± 0.38%, with a VS of 94%. Higher values were presented in their publication by Luna-del Risco et al. [43]. The distillation residue used in their test had a TS of 9.5%, with a VS of 93%. The parameters of stillage from a distillery located in Poland were presented in their study by Remiszewska-Skwarek et al. [44]. Depending on the batch of waste used, the TS content ranged from 6 to 8%, with a VS proportion in the range 81–95%.
Based on this information, the annual mass of dry waste in the form of distillation residue produced in Poland can be determined in the range of 60.6 to 240 t TS, and 54.5 to 227.8 t VS. Assuming that the entire mass of this waste would be utilised for biogas production in industrial biogas plants operating a mono-fermentation process of this feedstock, then, at the unit production rates determined in the present tests (333.14 L biogas/kg VS, 210.43 L methane/kg VS), the annual biogas yield would be between 18,170 and 75,910 million m3. In Poland, there were 128 agricultural biogas plants at the end of 2021, which are able to produce over 513 million m3 of agricultural biogas annually [22]. Therefore, fully exploiting the potential contained in distillation residue would enable at least a 35-fold increase in the volume of biogas produced. This volume of biogas from renewable sources would significantly reduce the use of fossil fuels such as coal or natural gas.

4. Conclusions

Tests were carried out to determine the specific production values of biogas, methane and hydrogen for the distillation residue mono-fermentation process, using inoculum not adapted for such a source of organic feedstock (taken from the digesters of municipal WWTP). For comparison, tests were also carried out on the co-digestion process of distillation residue with sewage sludge for the same source as an inoculum, i.e., previously used in the methane fermentation of sewage sludge. It was shown that, during the 23 days of the process, the productivity with regard to biogas and methane is clearly higher for mono-fermentation (by up to almost 50%), while, at the same time, the proportion of methane in the biogas produced is higher. With regard to hydrogen, on the contrary, the values obtained are similar and in line with those available in the research literature.
Based on the test results, it can be concluded that distillery residues could be a good feedstock for biogas production. It seems that a better way of using this feedstock would be mono-fermentation, which could be carried out in industrial biogas plants located on the premises of distilleries producing ethyl alcohol (raw spirit) or in municipal biogas plants ensuring the utilisation of this type of industrial waste. It has been estimated that in Poland, which is one of the largest producers of alcohol in the European Union, full utilisation would cause at least a 35-fold increase in the volume of biogas produced in 2021.
The results of the laboratory-scale tests were used to model the fermentation process using a simplified Gompertz model. From the multi-parameter estimation, process parameters (am, br and ct) were obtained that describe the trend of distillation residue mono-fermentation and its co-fermentation with sewage sludge. On this basis, it is possible to simulate the trend of the processes and their prediction for longer time periods than were obtained in the experiments presented. The obtained model parameters confirmed the thesis that the bacteria contained in the inoculum are already adapted to the use of sewage sludge, but need to be adapted in relation to distillation residue. At the same time, it was shown that it would be possible to achieve a theoretical unit volume of biogas productivity in the co-fermentation process, but this would require longer retention times for this input in the digesters. With regard to methane, on the other hand, the adaptation time is similar, which is due to the fact that the methane production phase is the last stage of the methane fermentation process. It was also shown that it is possible to achieve a theoretically higher unit volume of biogas productivity in the co-fermentation process, but this would require longer retention times for this input in the digesters. Modelling results indicate that distillation residues can also be a promising feedstock for digesters located in municipal WWTPs, which very often use extended retention times in the reactors to achieve energy self-sufficiency.
This paper emphasises how important, from the industrial point of view, the system scale is. In most of the papers already published, investigations were carried out in very small laboratory batch vessels. However, mixing and mass transfer in such vessels are usually assumed to be perfect, and this assumption is correct as long as the scale is relatively small (laboratory bioreactors of a few litres in volume at maximum. In the present work, however, the scale of the bioreactor increased remarkably (1:10 scale-up), which consequently showed that some additional issues regarding mixing (and possibly mass transfer) start to play a role. It is planned to continue work on the optimization of system geometry and hydro-mixing in the increased-scale tanks (another 1:10 scale-up is possible) by application of the methods based on CFD, linked to the experimental data.

Author Contributions

Conceptualization, A.G.C. and K.C.; methodology, O.K.R.; software, O.K.R.; validation, M.J.; formal analysis, A.G.C. and K.C.; investigation, O.K.R.; data curation, A.G.C. and K.C.; writing—original draft preparation, O.K.R. and A.W.-L.; writing—review and editing, A.G.C. and K.C.; visualization, M.J. All authors have read and agreed to the published version of the manuscript.

Funding

This study was financially supported by European Regional Development Fund within the framework of the Smart Growth Operational Programme 2014–2020 under project no. POIR.04.01.02-00-0022/17.

Data Availability Statement

Data sharing not applicable.

Conflicts of Interest

The authors declare no conflict of interest.

References

  1. Sherman, P.; Song, S.; Chen, X.; McElroy, M. Projected Changes in Wind Power Potential over China and India in High Resolution Climate Models. Environ. Res. Lett. 2021, 16, 034057. [Google Scholar] [CrossRef]
  2. Liming, H. Financing Rural Renewable Energy: A Comparison between China and India. Renew. Sustain. Energy Rev. 2009, 13, 1096–1103. [Google Scholar] [CrossRef]
  3. Pal, D.B.; Jha, J.M. (Eds.) Sustainable and Clean Energy Production Technologies; Clean Energy Production Technologies; Springer Nature: Singapore, 2022; ISBN 978-981-16-9134-8. [Google Scholar]
  4. Czekała, W. Agricultural Biogas Plants as a Chance for the Development of the Agri-Food Sector. J. Ecol. Eng. 2018, 19, 179–183. [Google Scholar] [CrossRef]
  5. Weiland, P. Anaerobic Waste Digestion in Germany-Status and Recent Developments. Biodegradation 2000, 11, 415–421. [Google Scholar] [CrossRef]
  6. Amon, T.; Amon, B.; Kryvoruchko, V.; Zollitsch, W.; Mayer, K.; Gruber, L. Biogas Production from Maize and Dairy Cattle Manure—Influence of Biomass Composition on the Methane Yield. Agric. Ecosyst. Environ. 2007, 118, 173–182. [Google Scholar] [CrossRef]
  7. Xie, S.; Lawlor, P.G.; Frost, J.P.; Hu, Z.; Zhan, X. Effect of Pig Manure to Grass Silage Ratio on Methane Production in Batch Anaerobic Co-Digestion of Concentrated Pig Manure and Grass Silage. Bioresour. Technol. 2011, 102, 5728–5733. [Google Scholar] [CrossRef]
  8. Busch, G.; Großmann, J.; Sieber, M.; Burkhardt, M. A New and Sound Technology for Biogas from Solid Waste and Biomass. Water Air Soil Pollut. Focus 2009, 9, 89–97. [Google Scholar] [CrossRef]
  9. Murto, M.; Björnsson, L.; Mattiasson, B. Impact of Food Industrial Waste on Anaerobic Co-Digestion of Sewage Sludge and Pig Manure. J. Environ. Manag. 2004, 70, 101–107. [Google Scholar] [CrossRef]
  10. Mehariya, S.; Patel, A.K.; Obulisamy, P.K.; Punniyakotti, E.; Wong, J.W.C. Co-Digestion of Food Waste and Sewage Sludge for Methane Production: Current Status and Perspective. Bioresour. Technol. 2018, 265, 519–531. [Google Scholar] [CrossRef] [PubMed]
  11. Fuess, L.T.; Garcia, M.L. Anaerobic Digestion of Stillage to Produce Bioenergy in the Sugarcane-to-Ethanol Industry. Environ. Technol. 2014, 35, 333–339. [Google Scholar] [CrossRef]
  12. Dubrovskis, V.; Plume, I. Methane Production from Stillage. Eng. Rural Dev. 2017, 16, 431–436. [Google Scholar] [CrossRef]
  13. Koryś, K.A.; Latawiec, A.E.; Grotkiewicz, K.; Kuboń, M. The Review of Biomass Potential for Agricultural Biogas Production in Poland. Sustainability 2019, 11, 6515. [Google Scholar] [CrossRef] [Green Version]
  14. Mikucka, W.; Zielińska, M. Distillery Stillage: Characteristics, Treatment, and Valorization. Appl. Biochem. Biotechnol. 2020, 192, 770–793. [Google Scholar] [CrossRef] [PubMed]
  15. Daniel, Z.; Juliszewski, T.; Kowalczyk, Z.; Malinowski, M.; Sobol, Z.; Wrona, P. The Method of Solid Waste Classification from the Agriculture and Food Industry. Infrastruct. Ecol. Rural Areas 2012, 2, 141–152. [Google Scholar]
  16. Kang, X.; Lin, R.; Wu, B.; Li, L.; Deng, C.; Rajendran, K.; Sun, Y.; O’Shea, R.; Murphy, J.D. Towards Green Whiskey Production: Anaerobic Digestion of Distillery by-Products and the Effects of Pretreatment. J. Clean. Prod. 2022, 357, 131844. [Google Scholar] [CrossRef]
  17. Jankowski, K.J.; Dubis, B.; Kozak, M. Sewage Sludge and the Energy Balance of Jerusalem Artichoke Production—A Case Study in North-Eastern Poland. Energy 2021, 236, 121545. [Google Scholar] [CrossRef]
  18. Obrycka, E. Korzyści Społeczne i Ekonomiczne Budowy Biogazowni Rolniczych. Zesz. Nauk. SGGW Ekon. Organ. Gospod. Żywnościowej 2019, 107, 163–176. [Google Scholar] [CrossRef]
  19. Rzeznik, W.; Mielcarek, P. Agricultural Biogas Plants in Poland. Eng. Rural Dev. 2018, 17, 1760–1765. [Google Scholar] [CrossRef]
  20. Michel, J.; Weiske, A.; Möller, K. The Effect of Biogas Digestion on the Environmental Impact and Energy Balances in Organic Cropping Systems Using the Life-Cycle Assessment Methodology. Renew. Agric. Food Syst. 2010, 25, 204–218. [Google Scholar] [CrossRef]
  21. Kucher, O.; Hutsol, T.; Glowacki, S.; Andreitseva, I.; Dibrova, A.; Muzychenko, A.; Szeląg-Sikora, A.; Szparaga, A.; Kocira, S. Energy Potential of Biogas Production in Ukraine. Energies 2022, 15, 1710. [Google Scholar] [CrossRef]
  22. KOWR Rejestru Wytwórców Biogazu Rolniczego 2021. Available online: https://www.kowr.gov.pl/odnawialne-zrodla-energii/biogaz-rolniczy/wytworcy-biogazu-rolniczego/rejestr-wytworcow-biogazu-rolniczego (accessed on 10 February 2023).
  23. Wąs, A.; Sulewski, P.; Krupin, V.; Popadynets, N.; Malak-Rawlikowska, A.; Szymańska, M.; Skorokhod, I.; Wysokiński, M. The Potential of Agricultural Biogas Production in Ukraine—Impact on Ghg Emissions and Energy Production. Energies 2020, 13, 5755. [Google Scholar] [CrossRef]
  24. Biogas Opportunities Roadmap; U.S. Department of Agriculture, U.S. Environmental Protection Agency, U.S. Department of Energy: Washington, DC, USA, 2014.
  25. Palige, J.; Roubinek, O.; Ciężkowska, M.; Pyzik, A.; Dobrowolski, A. Badania Wytwarzania Biogazu z Kiszonki Kukurydzy w Reaktorze Okresowym z Hydromieszaniem. Inżynieria I Apar. Chem. 2016, 55, 32–33. [Google Scholar]
  26. American Public Health Association. APHA Standard Methods for the Examination of Water and Wastewater; Federation; Water Environmental American Public Health Association (APHA): Washington, DC, USA, 2017. [Google Scholar]
  27. Kasinath, A.; Fudala-Ksiazek, S.; Szopinska, M.; Bylinski, H.; Artichowicz, W.; Remiszewska-Skwarek, A.; Luczkiewicz, A. Biomass in Biogas Production: Pretreatment and Codigestion. Renew. Sustain. Energy Rev. 2021, 150, 111509. [Google Scholar] [CrossRef]
  28. Bond, T.; Templeton, M.R. History and Future of Domestic Biogas Plants in the Developing World. Energy Sustain. Dev. 2011, 15, 347–354. [Google Scholar] [CrossRef]
  29. Scarlat, N.; Dallemand, J.F.; Fahl, F. Biogas: Developments and Perspectives in Europe. Renew. Energy 2018, 129, 457–472. [Google Scholar] [CrossRef]
  30. Wilinska-Lisowska, A.; Ossowska, M.; Czerwionka, K. The Influence of Co-Fermentation of Agri-Food Waste with Primary Sludge on Biogas Production and Composition of the Liquid Fraction of Digestate. Energies 2021, 14, 1907. [Google Scholar] [CrossRef]
  31. Wilinska-Lisowska, A.; Chmielwski, A.; Roubinek, O.; Czerwionka, K. Nitrogen Transformation during Fermentation in Agricultural Biogas Plants. Biomass Convers. Biorefin. 2023. [Google Scholar] [CrossRef]
  32. Wang, Z.; Jiang, Y.; Wang, S.; Zhang, Y.; Hu, Y.; Hu, Z.-H.; Wu, G.; Zhan, X. Impact of Total Solids Content on Anaerobic Co-Digestion of Pig Manure and Food Waste: Insights into Shifting of the Methanogenic Pathway. Waste Manag. 2020, 114, 96–106. [Google Scholar] [CrossRef]
  33. Yasim, N.S.E.M.; Buyong, F. Comparative of Experimental and Theoretical Biochemical Methane Potential Generated by Municipal Solid Waste. Environ. Adv. 2023, 11, 100345. [Google Scholar] [CrossRef]
  34. Wang, X.; Yang, G.; Feng, Y.; Ren, G.; Han, X. Optimizing Feeding Composition and Carbon–Nitrogen Ratios for Improved Methane Yield during Anaerobic Co-Digestion of Dairy, Chicken Manure and Wheat Straw. Bioresour. Technol. 2012, 120, 78–83. [Google Scholar] [CrossRef]
  35. Gunes, B.; Stokes, J.; Davis, P.; Connolly, C.; Lawler, J. Pre-Treatments to Enhance Biogas Yield and Quality from Anaerobic Digestion of Whiskey Distillery and Brewery Wastes: A Review. Renew. Sustain. Energy Rev. 2019, 113, 109281. [Google Scholar] [CrossRef]
  36. Wojcieszak, M.; Pyzik, A.; Poszytek, K.; Krawczyk, P.S.; Sobczak, A.; Lipinski, L.; Roubinek, O.; Palige, J.; Sklodowska, A.; Drewniak, L. Adaptation of Methanogenic Inocula to Anaerobic Digestion of Maize Silage. Front. Microbiol. 2017, 8, 1881. [Google Scholar] [CrossRef] [PubMed]
  37. De Gioannis, G.; Muntoni, A.; Polettini, A.; Pomi, R. A Review of Dark Fermentative Hydrogen Production from Biodegradable Municipal Waste Fractions. Waste Manag. 2013, 33, 1345–1361. [Google Scholar] [CrossRef] [PubMed]
  38. Batstone, D.J.; Keller, J.; Angelidaki, I.; Kalyuzhnyi, S.V.; Pavlostathis, S.G.; Rozzi, A.; Sanders, W.T.M.; Siegrist, H.; Vavilin, V.A. The IWA Anaerobic Digestion Model No 1 (ADM1). Water Sci. Technol. 2002, 45, 65–73. [Google Scholar] [CrossRef]
  39. Lee, W.S.; Chua, A.S.M.; Yeoh, H.K.; Ngoh, G.C. A Review of the Production and Applications of Waste-Derived Volatile Fatty Acids. Chem. Eng. J. 2014, 235, 83–99. [Google Scholar] [CrossRef]
  40. Appels, L.; Baeyens, J.; Degrève, J.; Dewil, R. Principles and Potential of the Anaerobic Digestion of Waste-Activated Sludge. Prog. Energy Combust. Sci. 2008, 34, 755–781. [Google Scholar] [CrossRef]
  41. Tian, P.; Gong, B.; Bi, K.; Liu, Y.; Ma, J.; Wang, X.; Ouyang, Z.; Cui, X. Anaerobic Co-Digestion of Pig Manure and Rice Straw: Optimization of Process Parameters for Enhancing Biogas Production and System Stability. Int. J. Environ. Res. Public Health 2023, 20, 804. [Google Scholar] [CrossRef]
  42. Nielfa, A.; Cano, R.; Fdz-Polanco, M. Theoretical Methane Production Generated by the Co-Digestion of Organic Fraction Municipal Solid Waste and Biological Sludge. Biotechnol. Rep. 2015, 5, 14–21. [Google Scholar] [CrossRef] [Green Version]
  43. Luna-delRisco, M.; Normak, A.; Orupõld, K. Biochemical Methane Potential of Different Organic Wastes and Energy Crops from Estonia. Agron. Res. 2011, 9, 331–342. [Google Scholar]
  44. Remiszewska-Skwarek, A.; Wierzchnicki, R.; Roubinek, O.K.; Kasinath, A.; Jeżewska, A.; Jasinska, M.; Byliński, H.; Chmielewski, A.G.; Czerwionka, K. The Influence of Low-Temperature Disintegration on the Co-Fermentation Process of Distillation Residue and Waste-Activated Sludge. Energies 2022, 15, 482. [Google Scholar] [CrossRef]
Figure 5. Trends of accumulation curves obtained with the Gompertz model for the experimental points in the mono-fermentation test.
Energies 16 03063 g005
Figure 6. Trends of accumulation curves obtained with the Gompertz model for the experimental points in the co-fermentation test.
Energies 16 03063 g006
Figure 7. List of raw materials used for the production of agricultural biogas in 2021 (own study on the basis of National Agricultural Support Centre’s [22]).
Energies 16 03063 g007
Figure 1. Daily biogas production for mono-fermentation and co-fermentation.
Energies 16 03063 g001
Figure 2. Changes in methane, carbon dioxide and hydrogen in biogas for the distillation residue mono-fermentation process.
Energies 16 03063 g002
Figure 3. Changes in methane, carbon dioxide and hydrogen in biogas for the distillation residue co-fermentation process.
Energies 16 03063 g003
Figure 4. Changes in the pH value during the fermentation tests.
Energies 16 03063 g004
Table 1. Characteristics of the feedstock used in the mono-fermentation and co-fermentation tests.
TestInoculum (kg)Distillation Residue (kg)Sewage Sludge (kg)Water (kg)TS (%)VS (%)C/N
mono-fermentation6.14 ± 0.0415.00 ± 0.11-9.56 ± 0.064.41 ± 0.0365.82 ± 0.5121.64 ± 2.38
co-fermentation6.20 ± 0.044.69 ± 0.0319.78 ± 0.140.33 ± 0.015.35 ± 0.0463.65 ± 0.497.77 ± 0.80
TS—total solids, VS—volatile solids.
Table 2. Overview of biogas, methane and hydrogen production after 23 days of distillation residue mono-fermentation test and distillation residue co-fermentation test with sewage sludge.
TestBiogasMethaneHydrogenMethane
/Biogas
(%) v/v
Hydrogen
/Biogas
(%) v/v
(L)(L/kg VS)(L)(L/kg VS)(L)(L/kg VS)
mono-fermentation296.49 ± 29.65333.14 ± 39.98187.29 ± 20.60210.43 ± 25.250.049 ± 0.0050.056 ± 0.00663.16 ± 0.570.017 ± 0.003
co-fermentation259.12 ± 23.32249.64 ± 27.46128.13 ± 14.09123.50 ± 13.590.056 ± 0.0060.054 ± 0.00649.47 ± 5.440.022 ± 0.003
Table 3. Gompertz model parameter values for the fermentation experiments conducted.
Testam
(L/kg VS)
br
(L/kg VS d)
ct
(d)
R2
Biogas
mono-fermentation395.34026.7822.4860.9998
co-fermentation658.36311.0670.0000.9884
Methane
mono-fermentation244.94019.3784.3350.9992
co-fermentation244.3196.2814.3850.9924
Hydrogen
mono-fermentation0.0600.0080.0000.9842
co-fermentation0.0490.0170.0000.9744
Disclaimer/Publisher’s Note: The statements, opinions and data contained in all publications are solely those of the individual author(s) and contributor(s) and not of MDPI and/or the editor(s). MDPI and/or the editor(s) disclaim responsibility for any injury to people or property resulting from any ideas, methods, instructions or products referred to in the content.

