
Viable Fully Integrated Energy Community Based on the Holistic LINK Approach


Abstract
:1. Introduction
1.1. Literature Review on Organisation Forms
1.2. Literature Review in Technical Challenges
1.3. Literature Review on Economic Challenges
2. Methodology
2.1. LINK-Holistic Approach
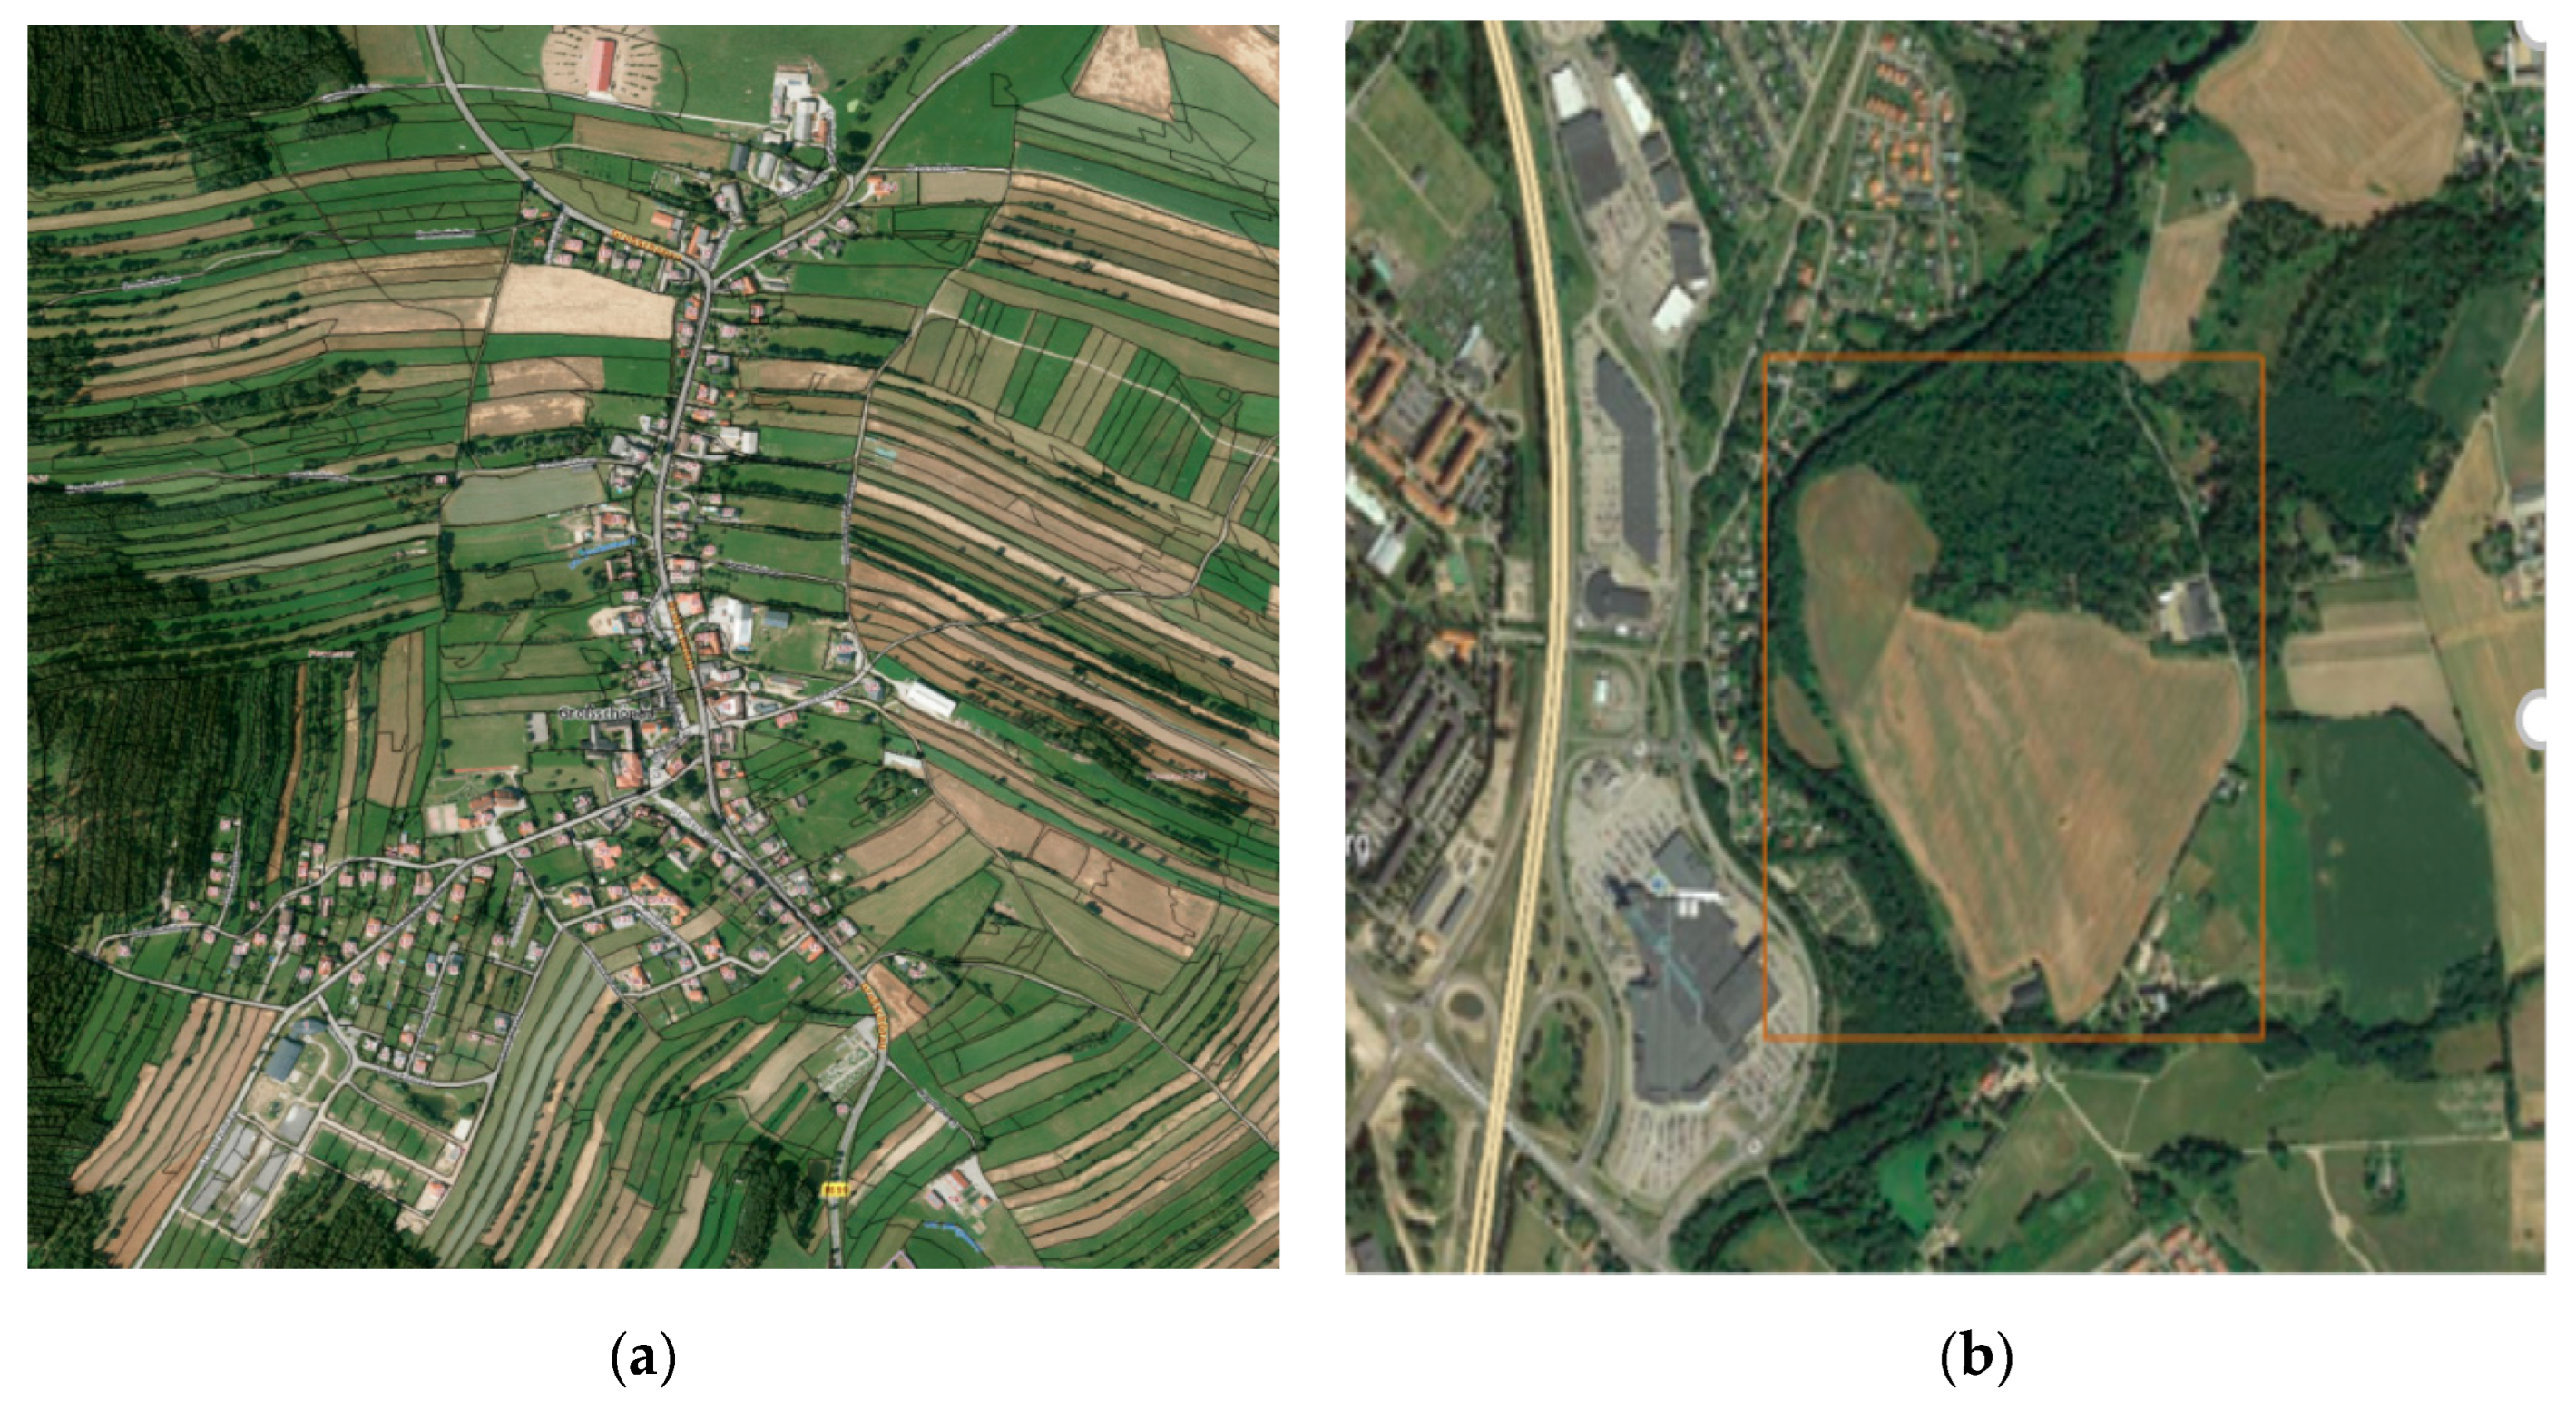
2.2. Pilot Sites
2.2.1. Brownfield Area: Großschönau, Austria
2.2.2. Greenfield Area: Fyllinge, Sweden
3. Challenges to Establishing Energy Communities
4. Business Organisation
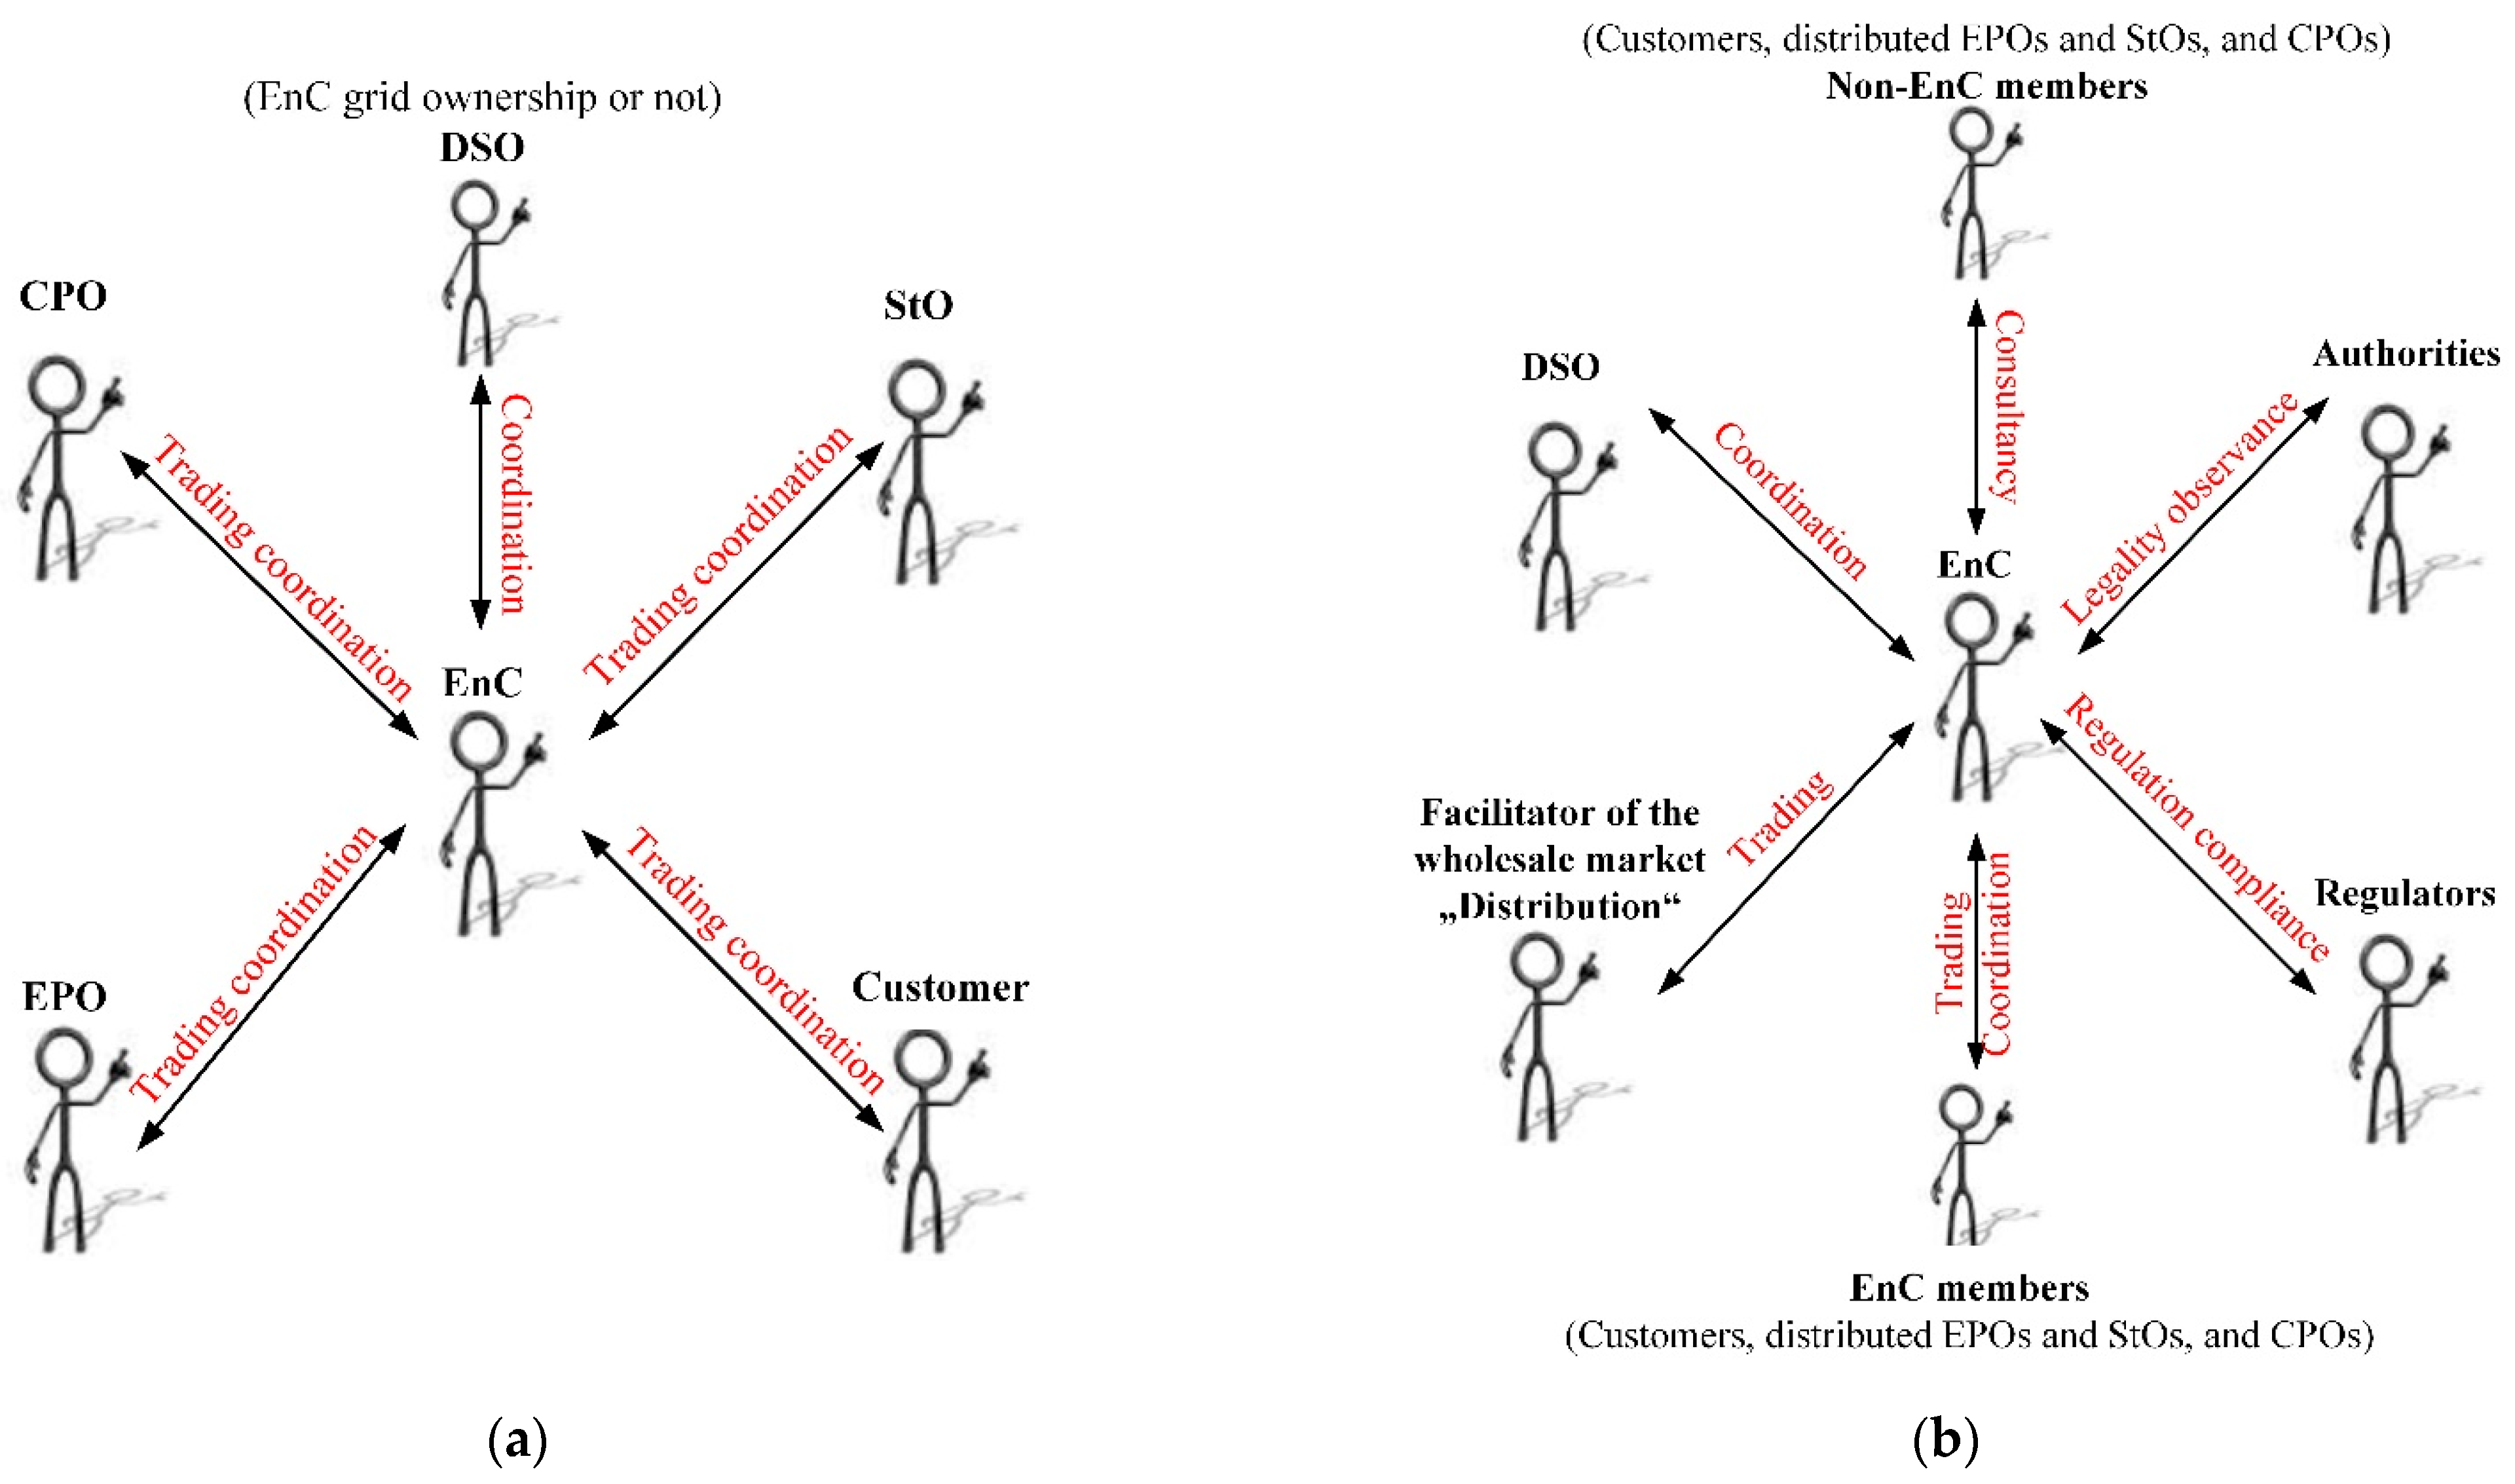
4.1. Actors and Roles
4.2. Structure and Organisation
- Each member receives more than they would receive after opting out of the EnC.
- Each subgroup of members receives more than it would receive after creating an EnC on its own.
5. Rise of the Fully Integrated Renewable Energy Communities
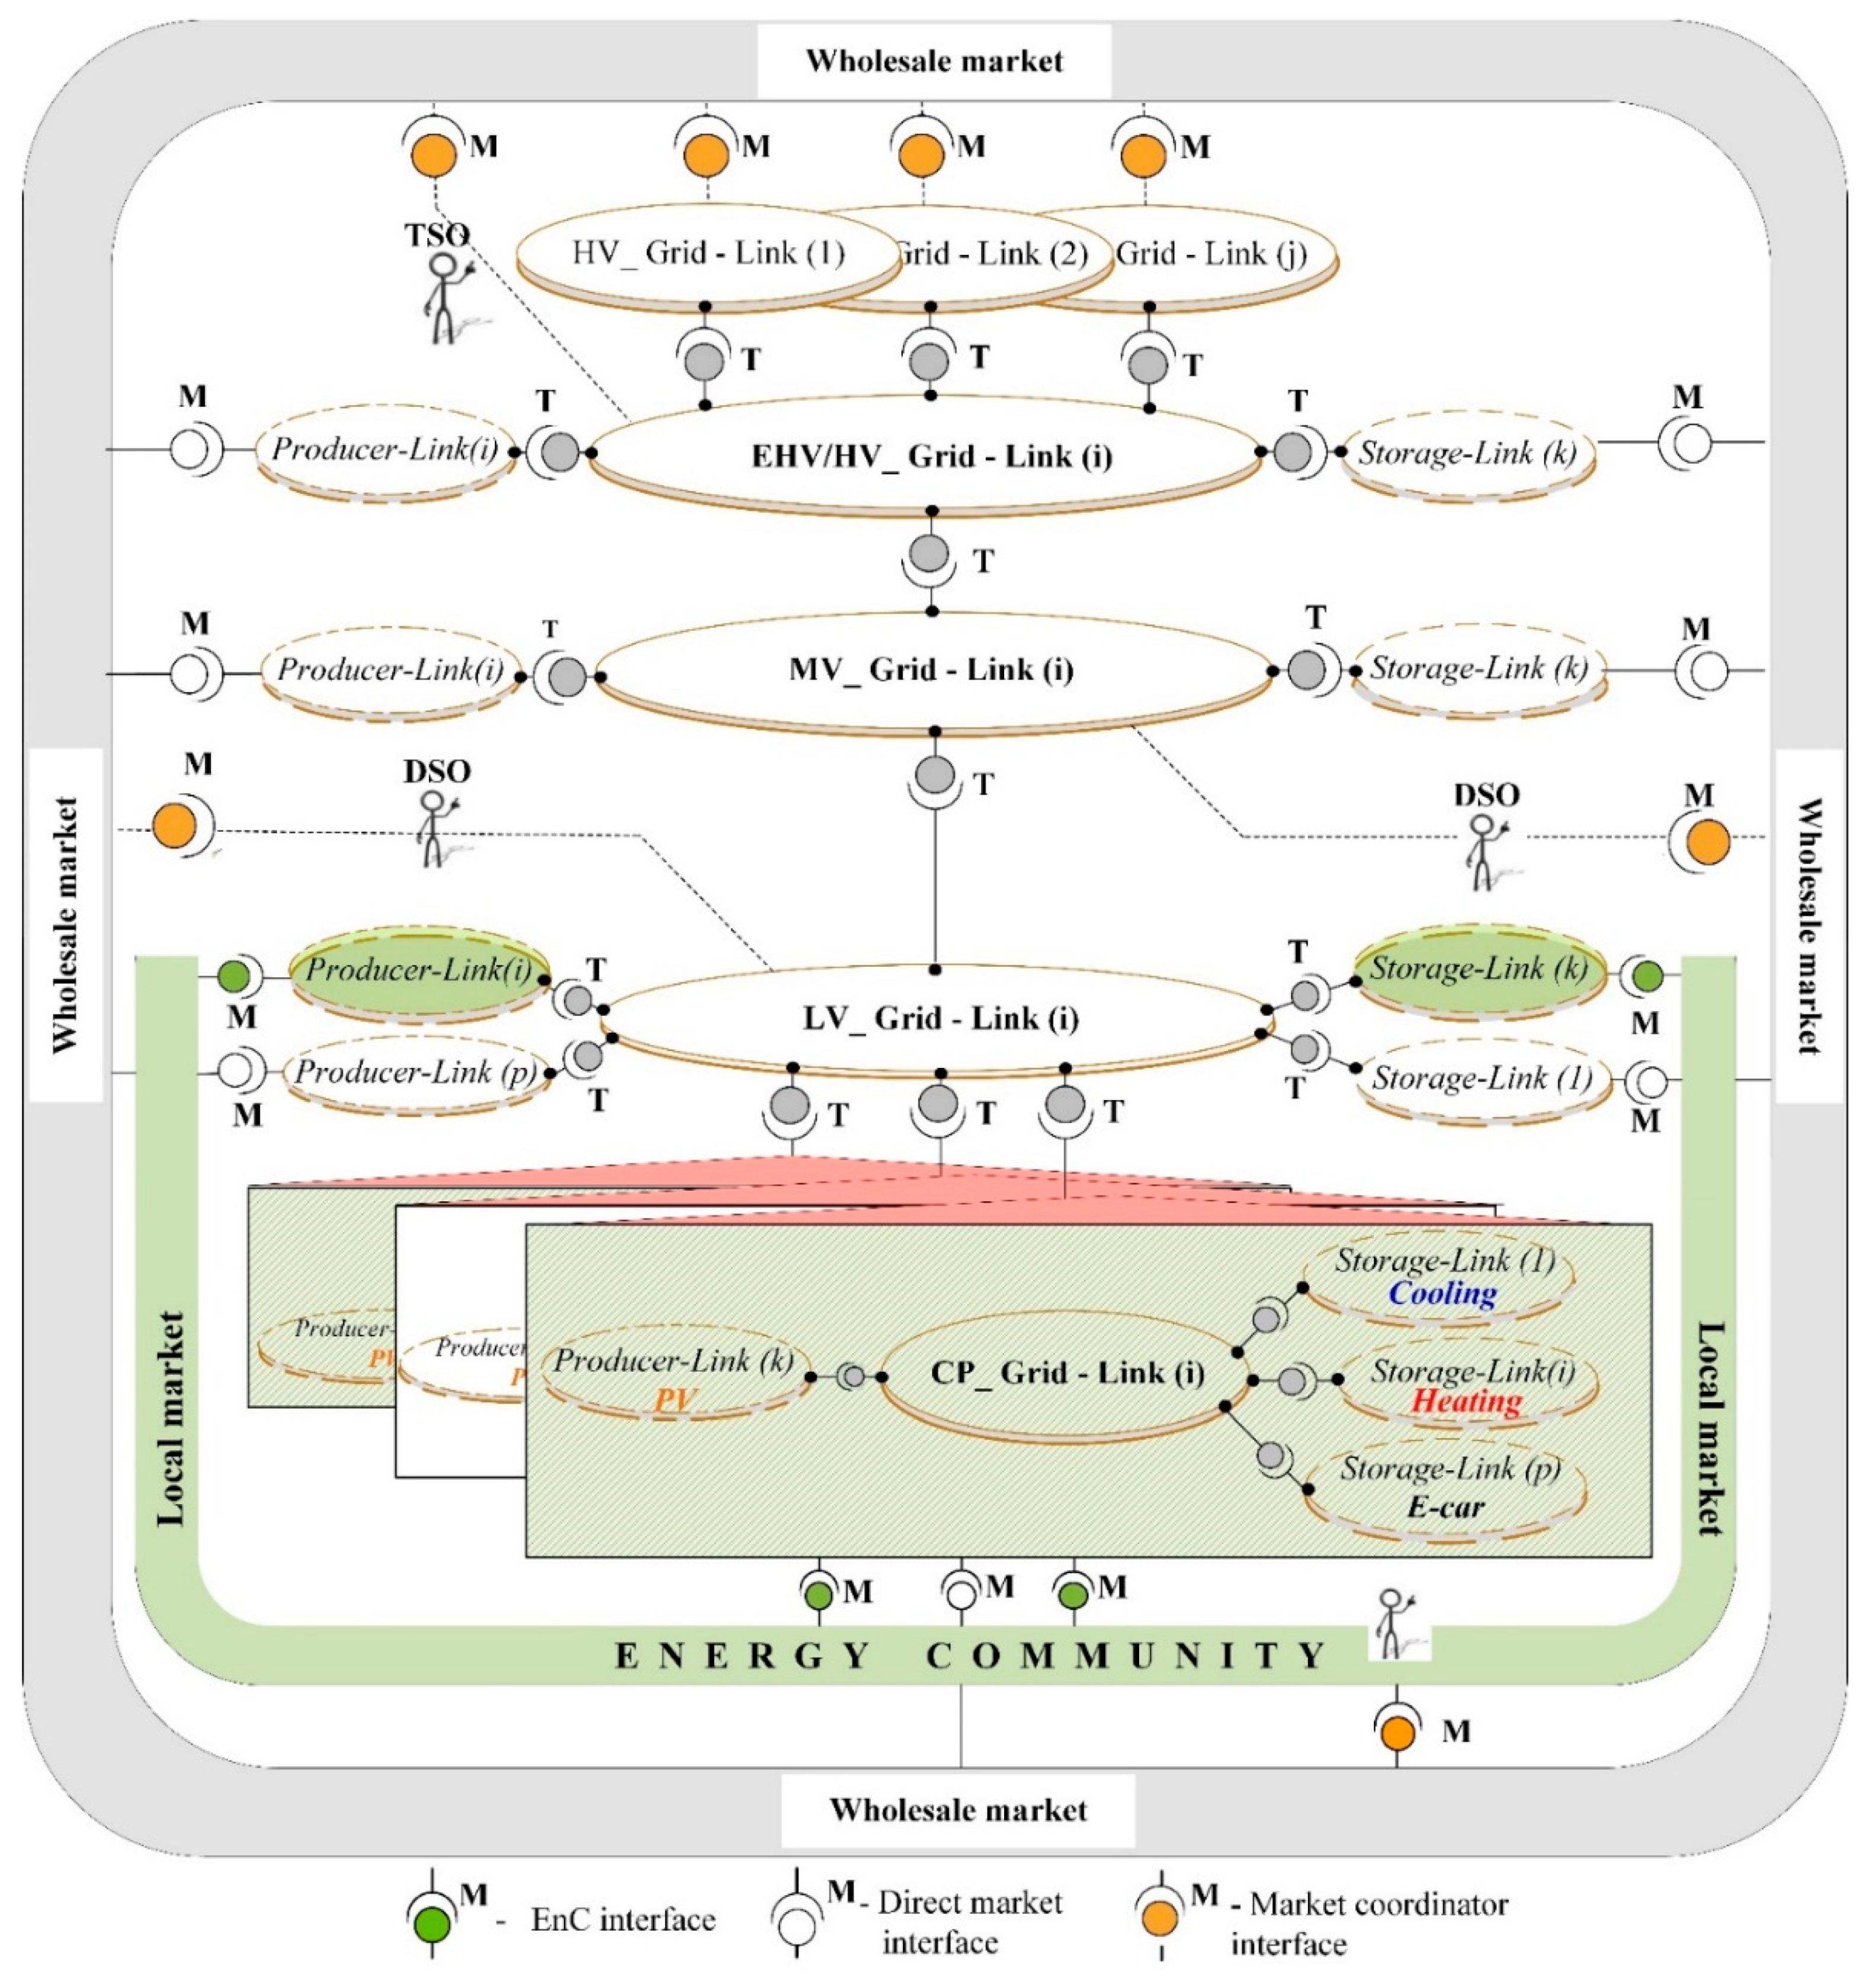
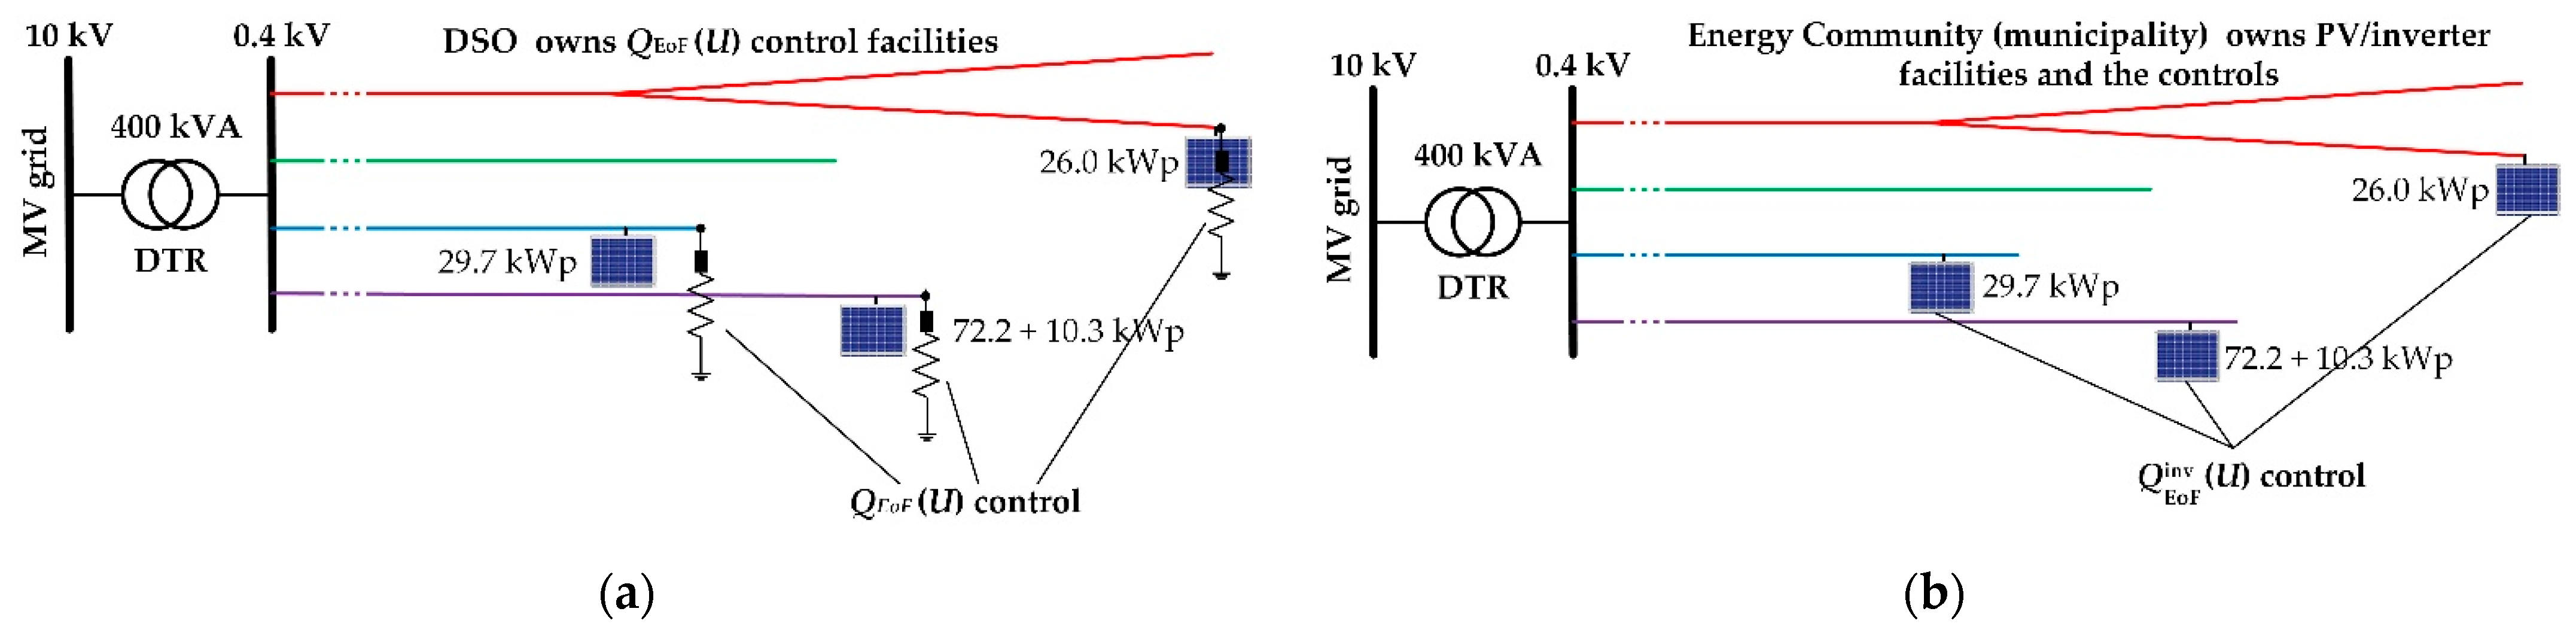
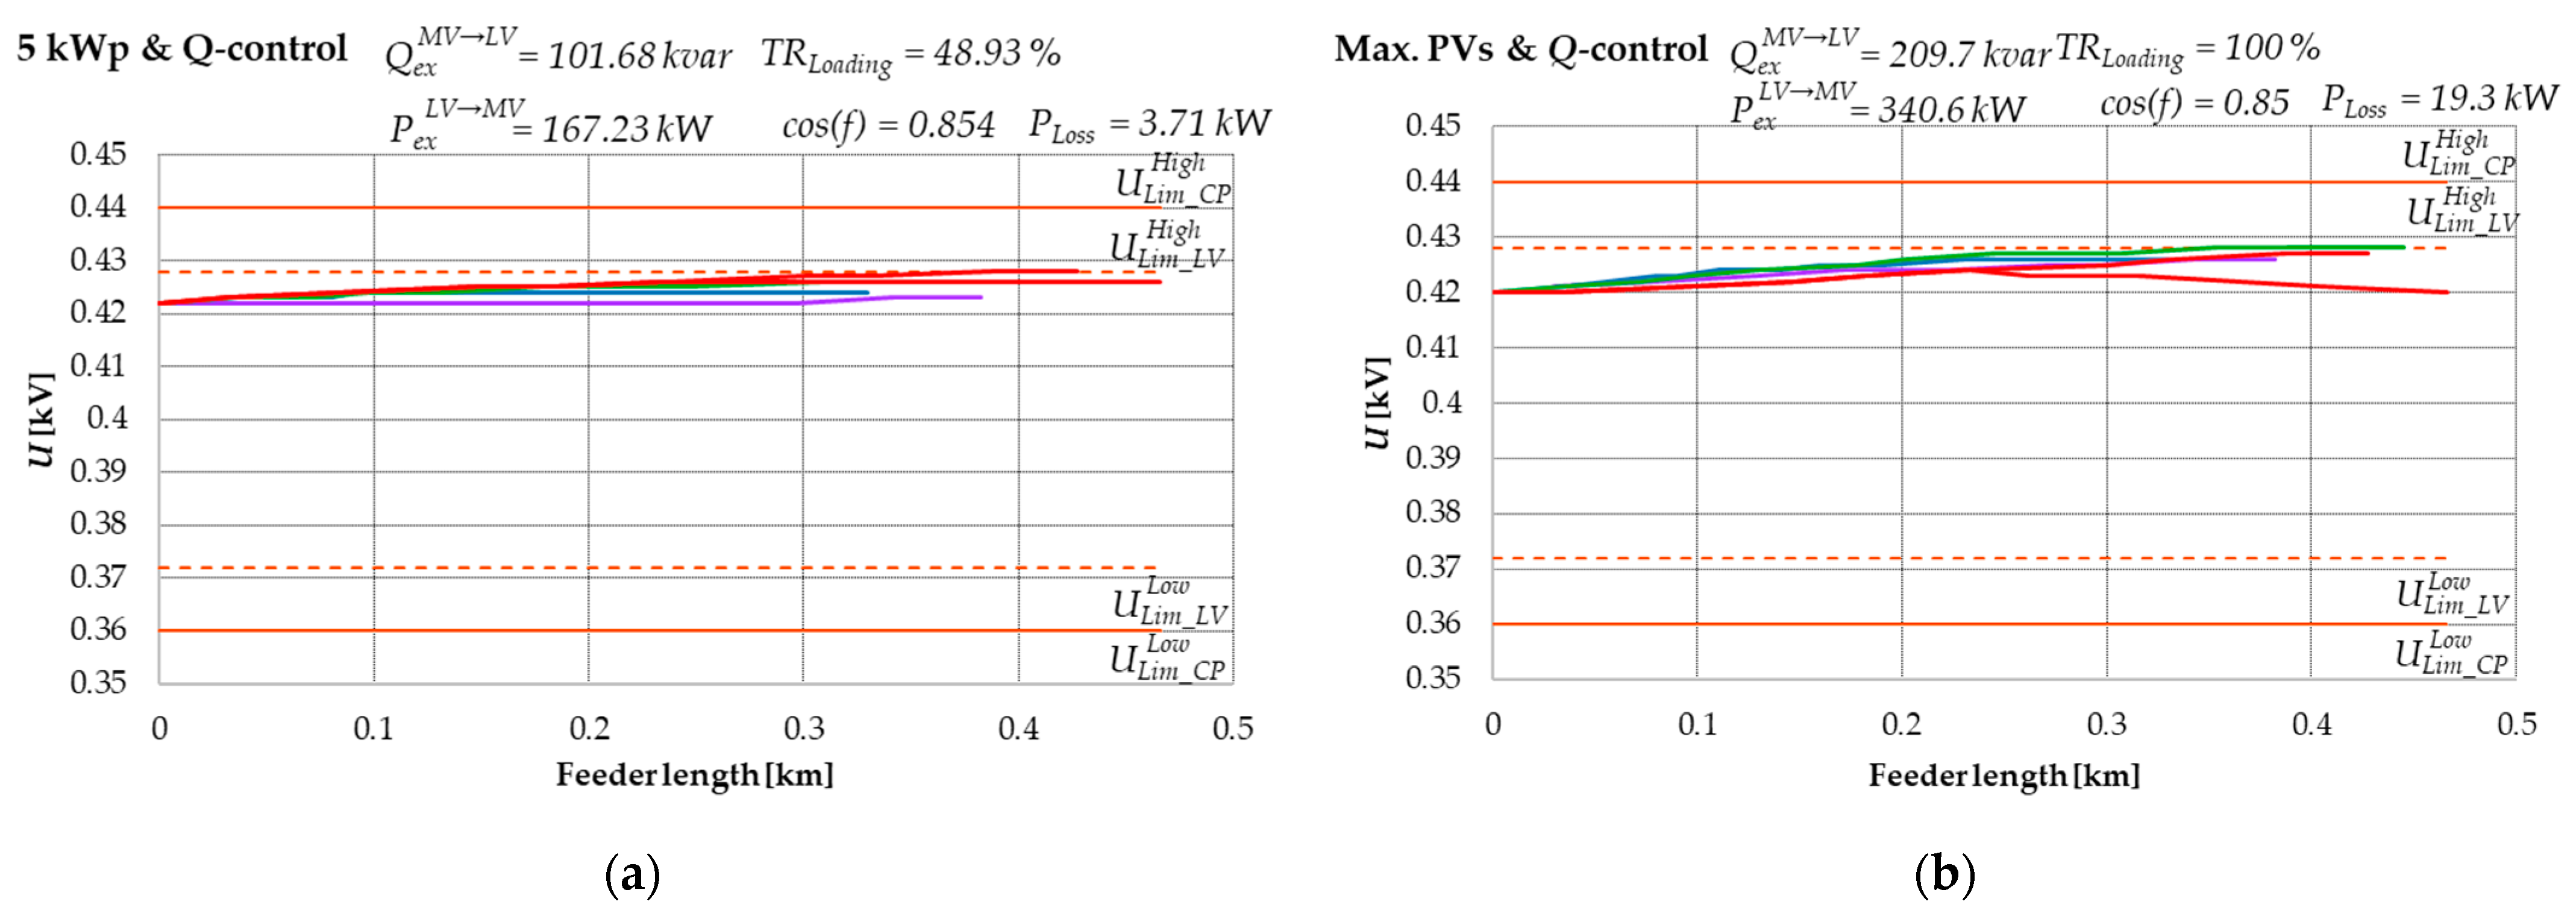
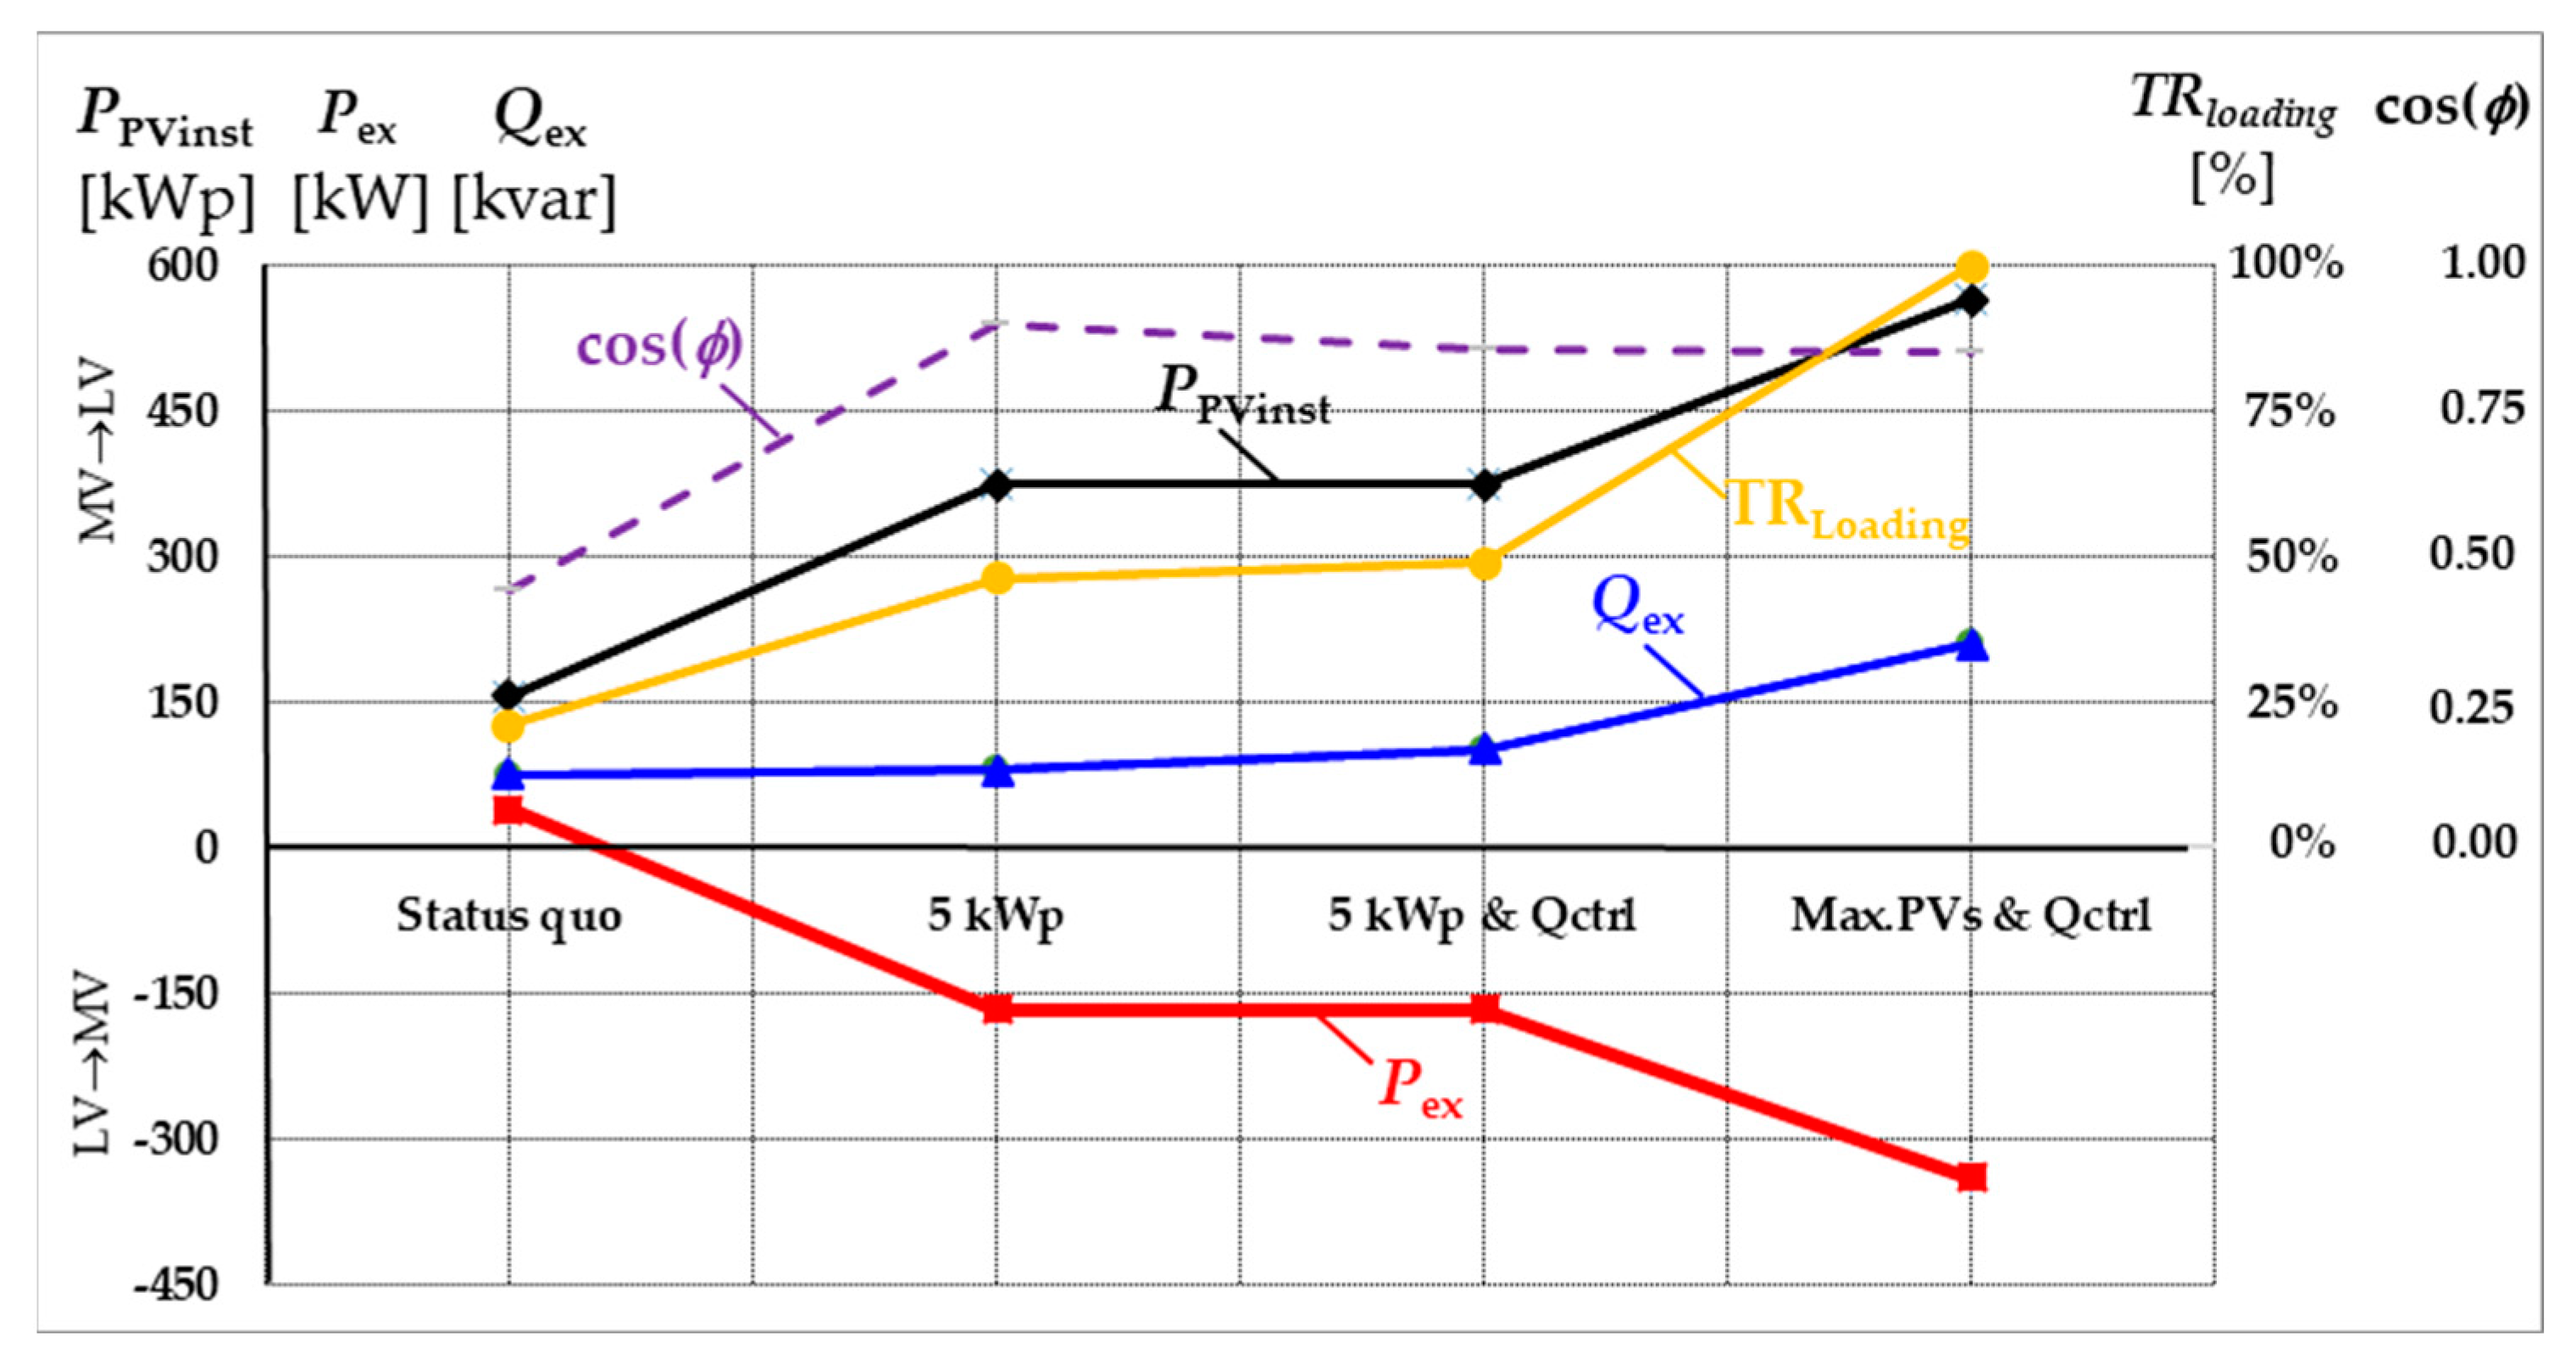
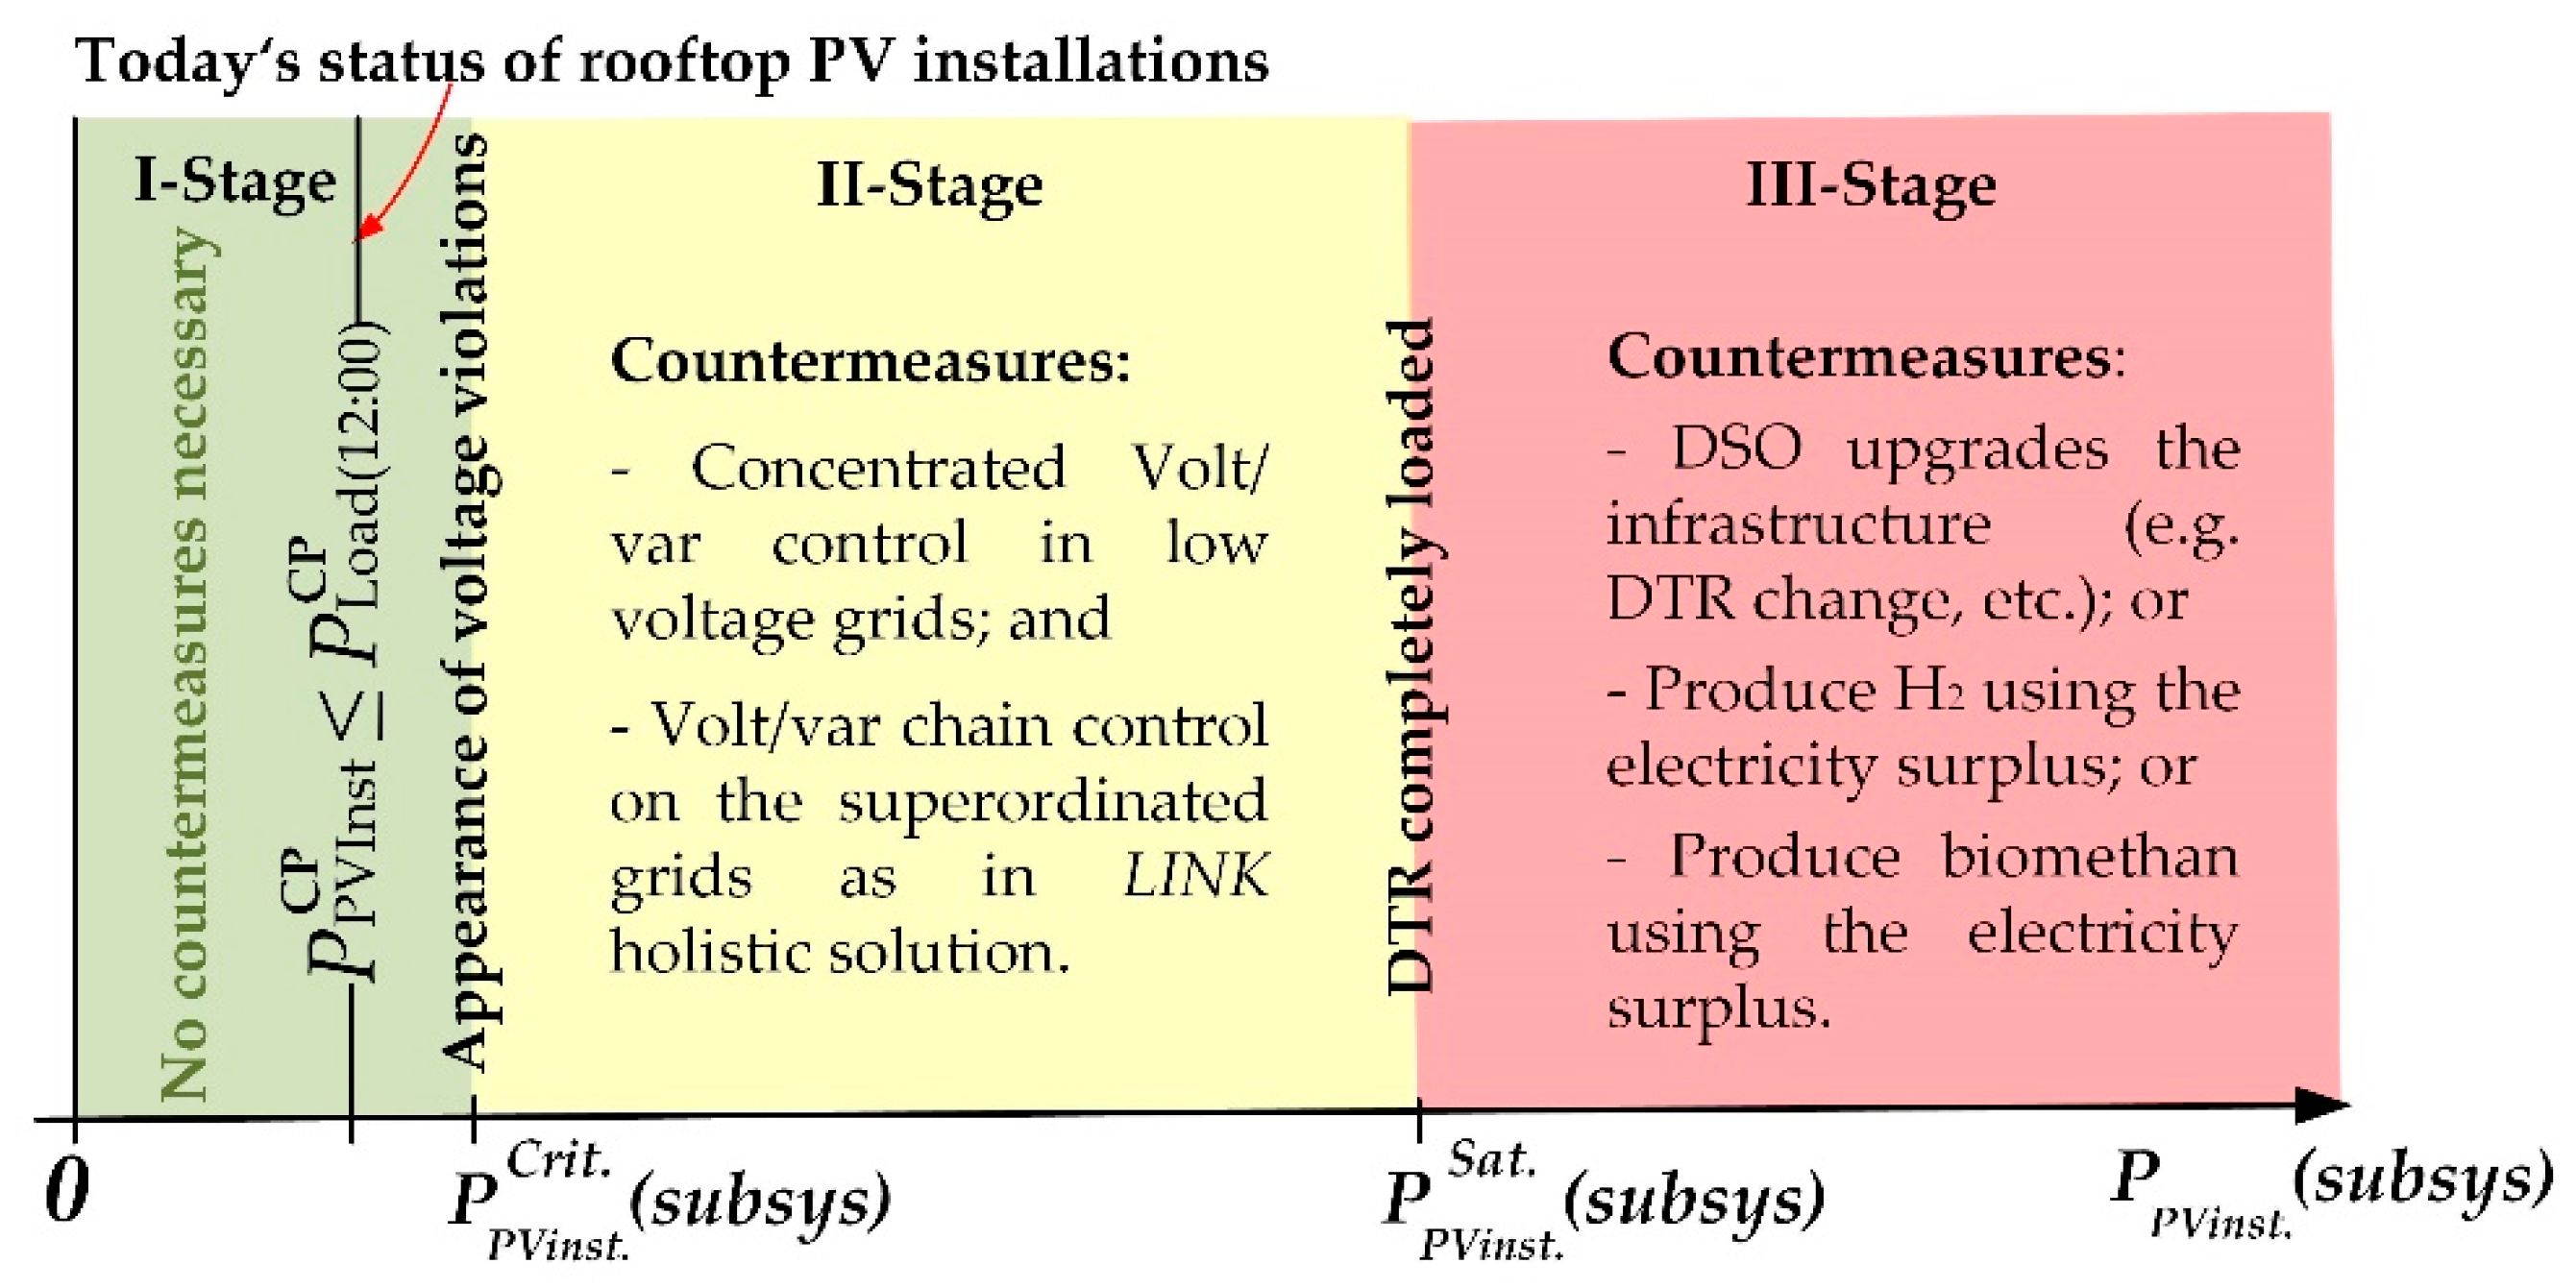
5.1. Technical Holistic Solution
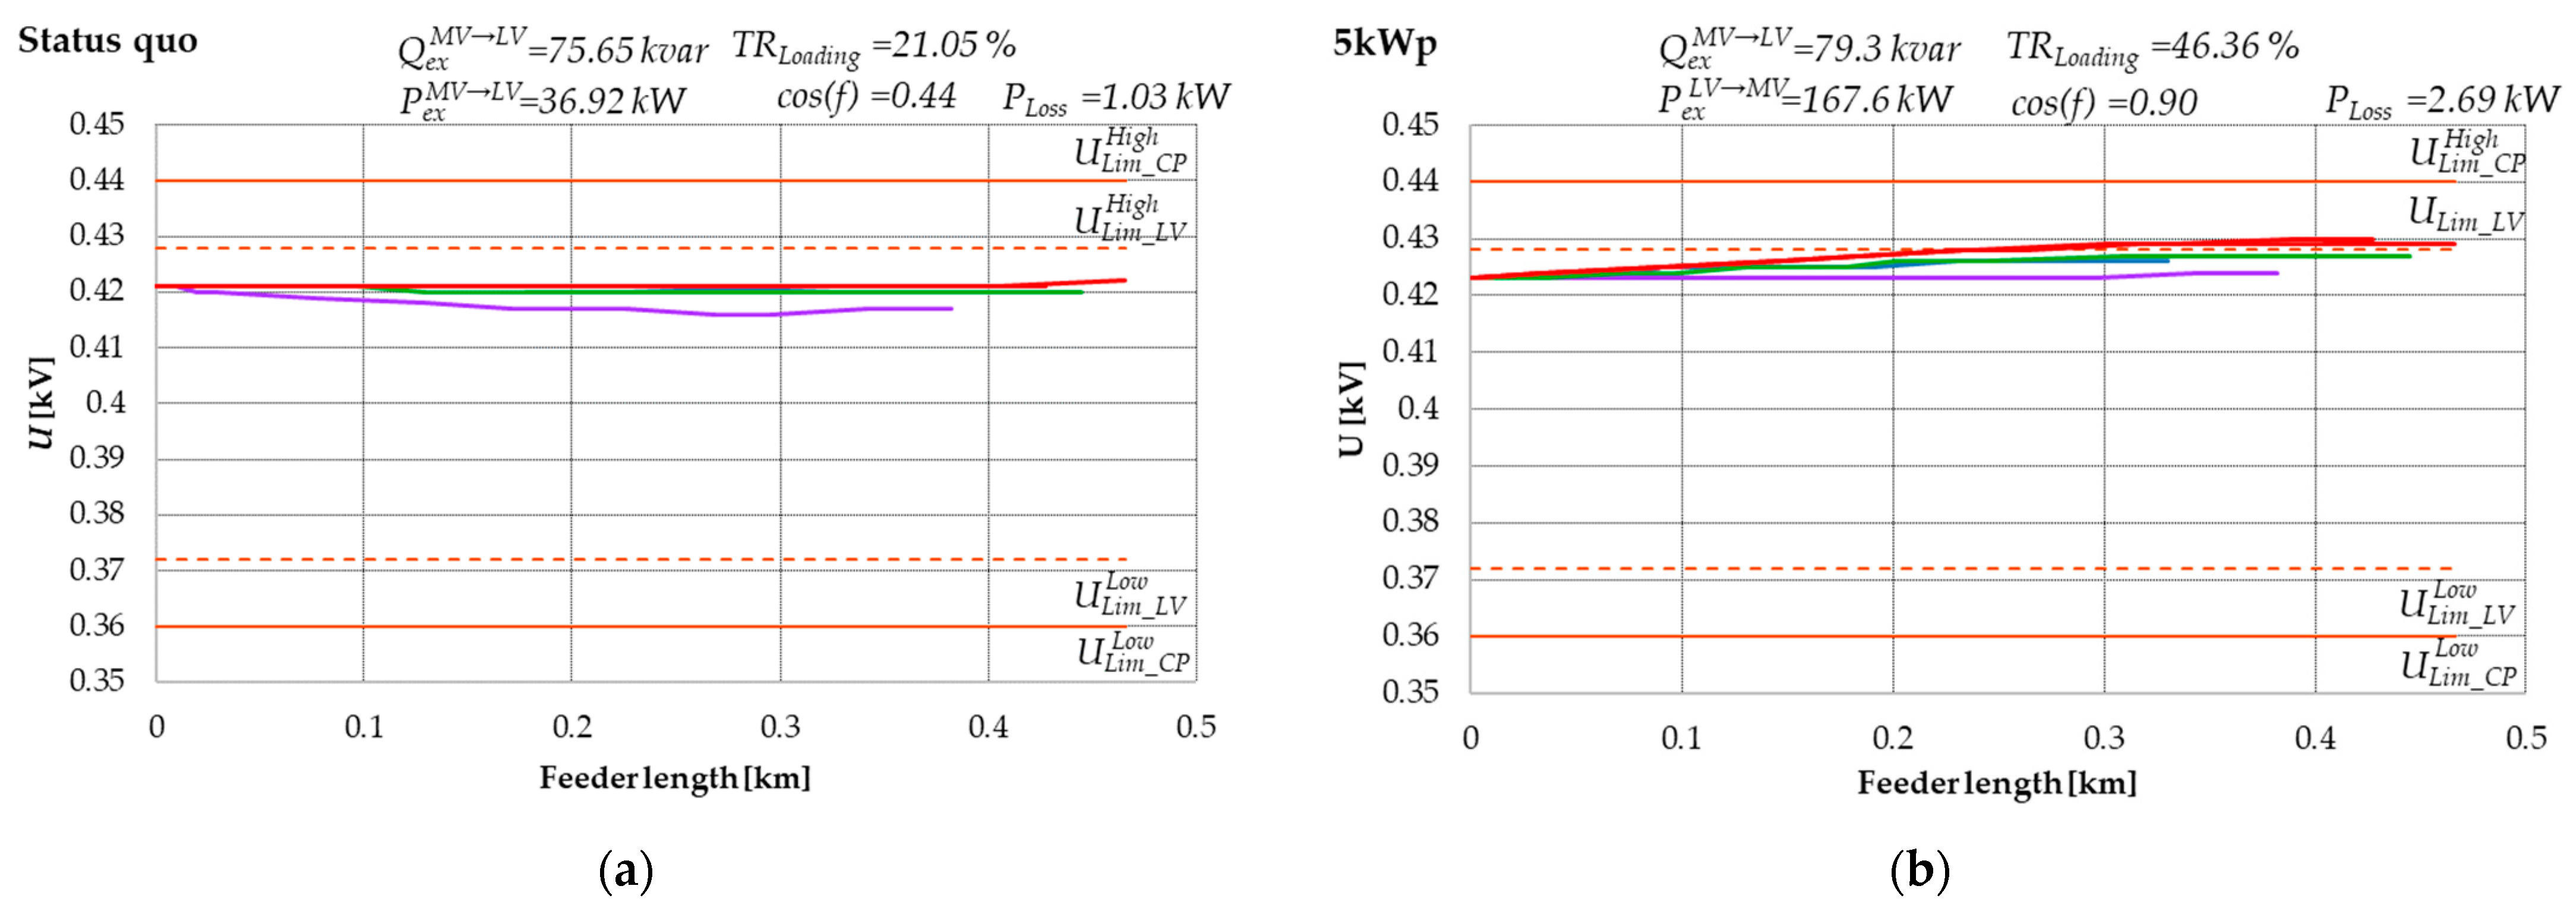
5.1.1. Status Quo
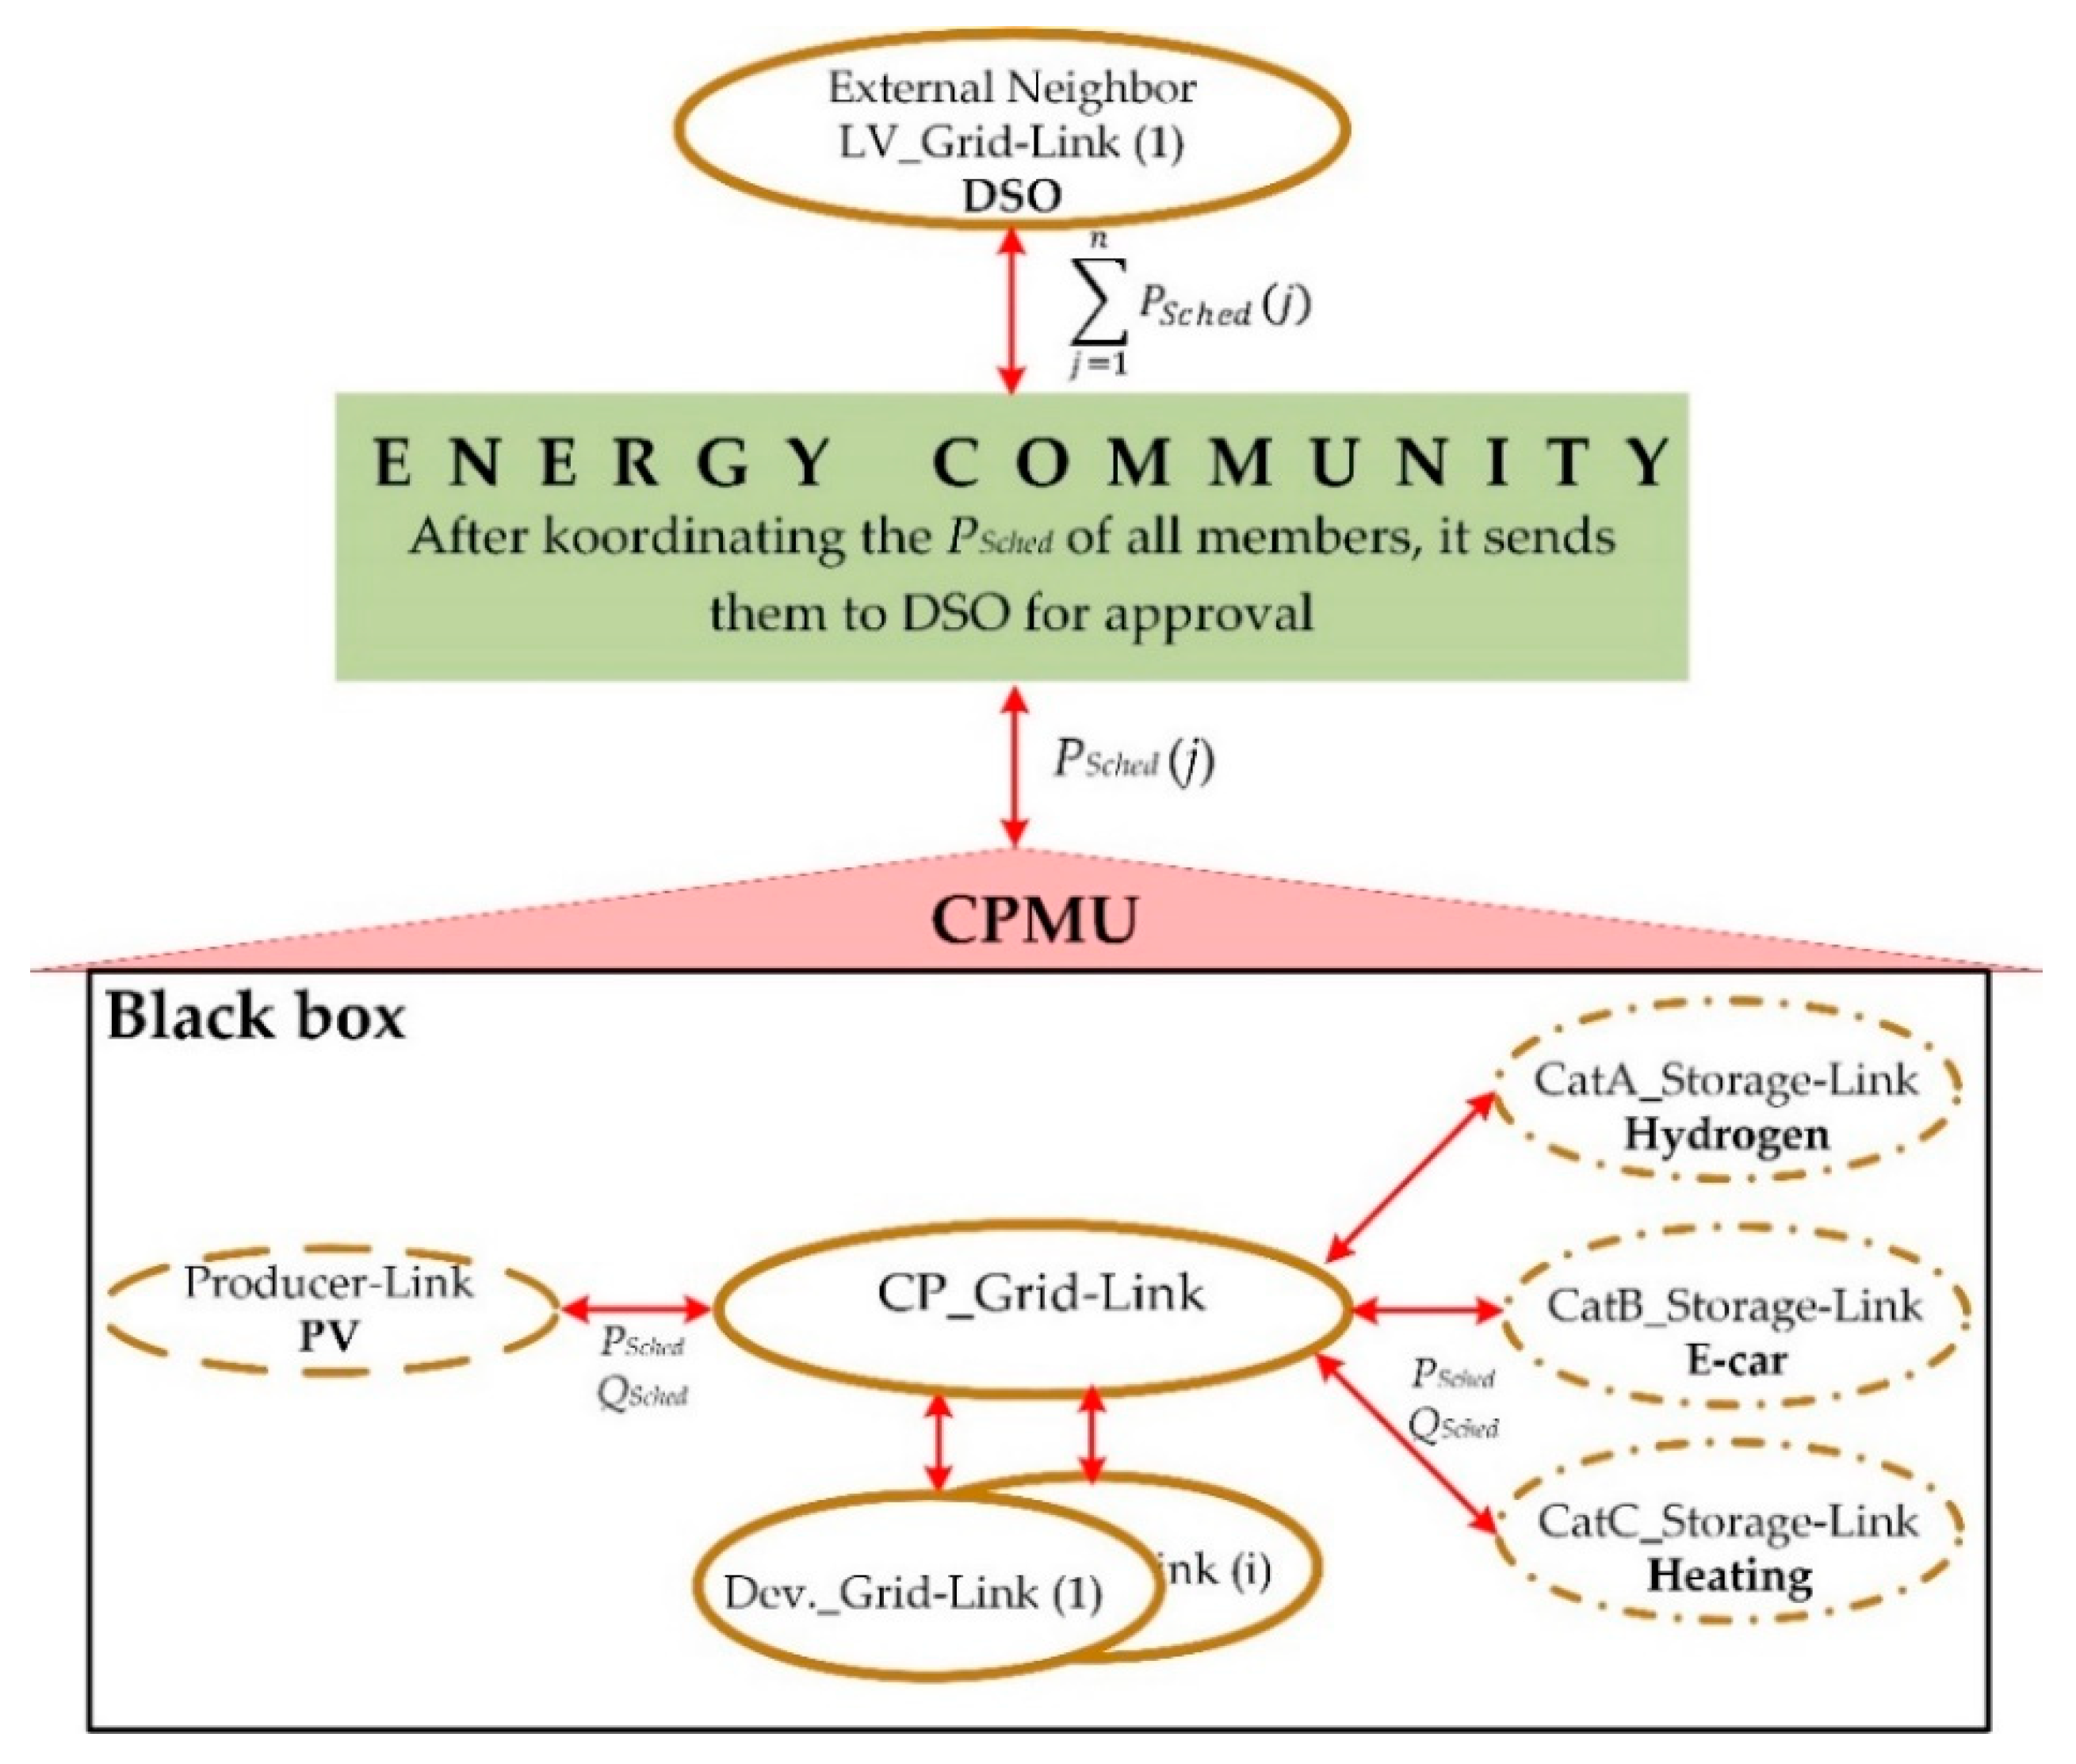
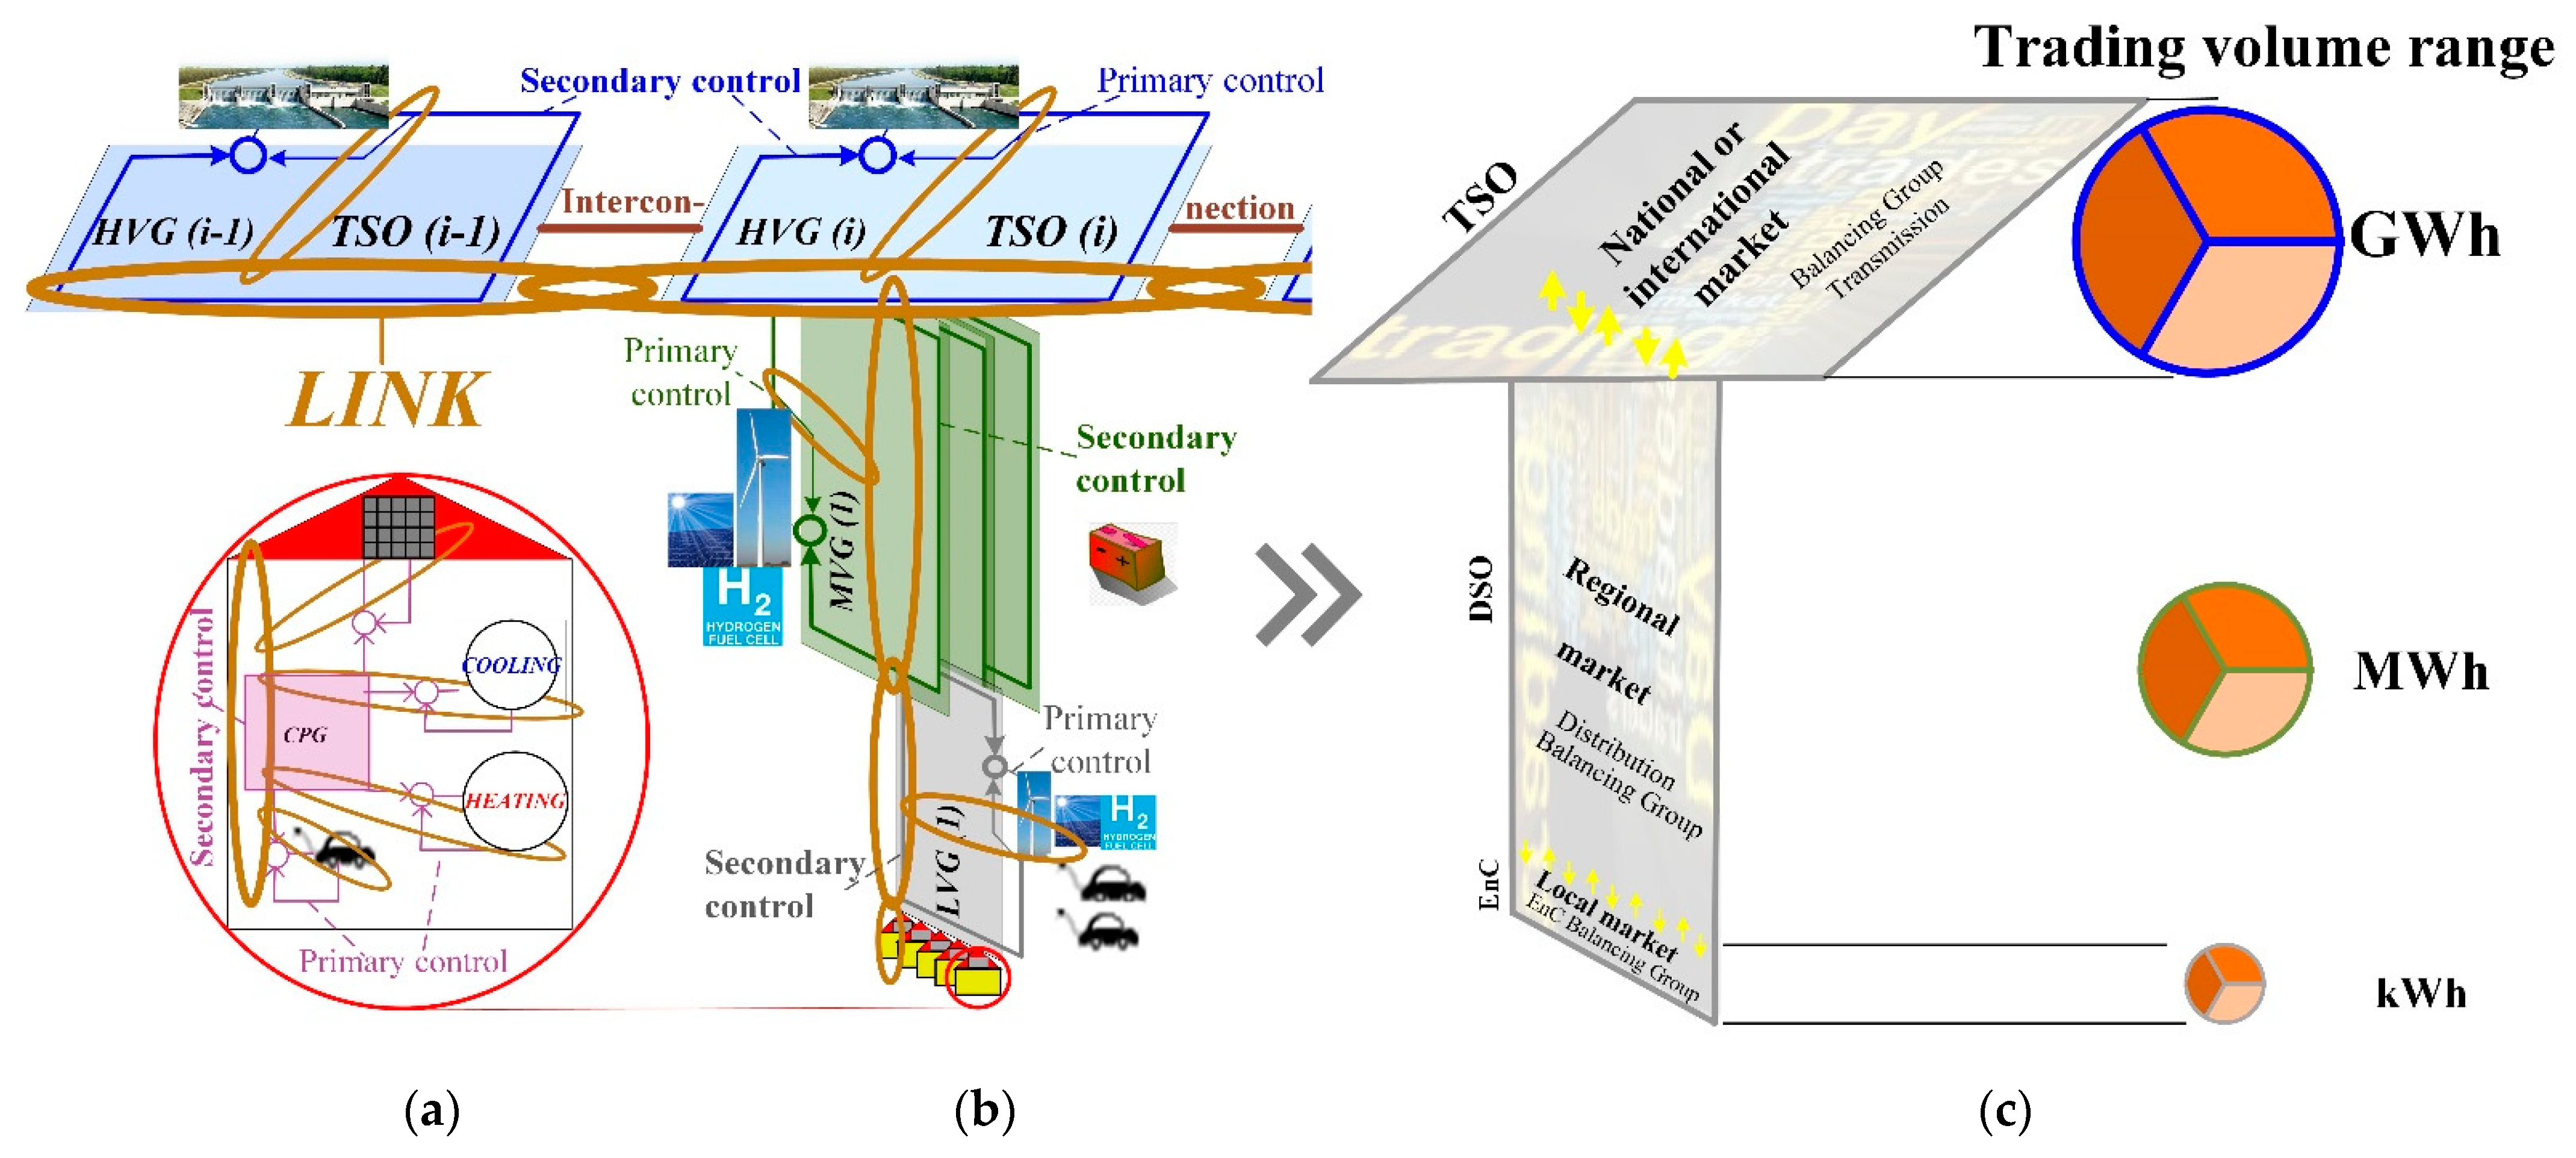
5.1.2. LINK Technical Solution
5.2. Fractal Market Solution
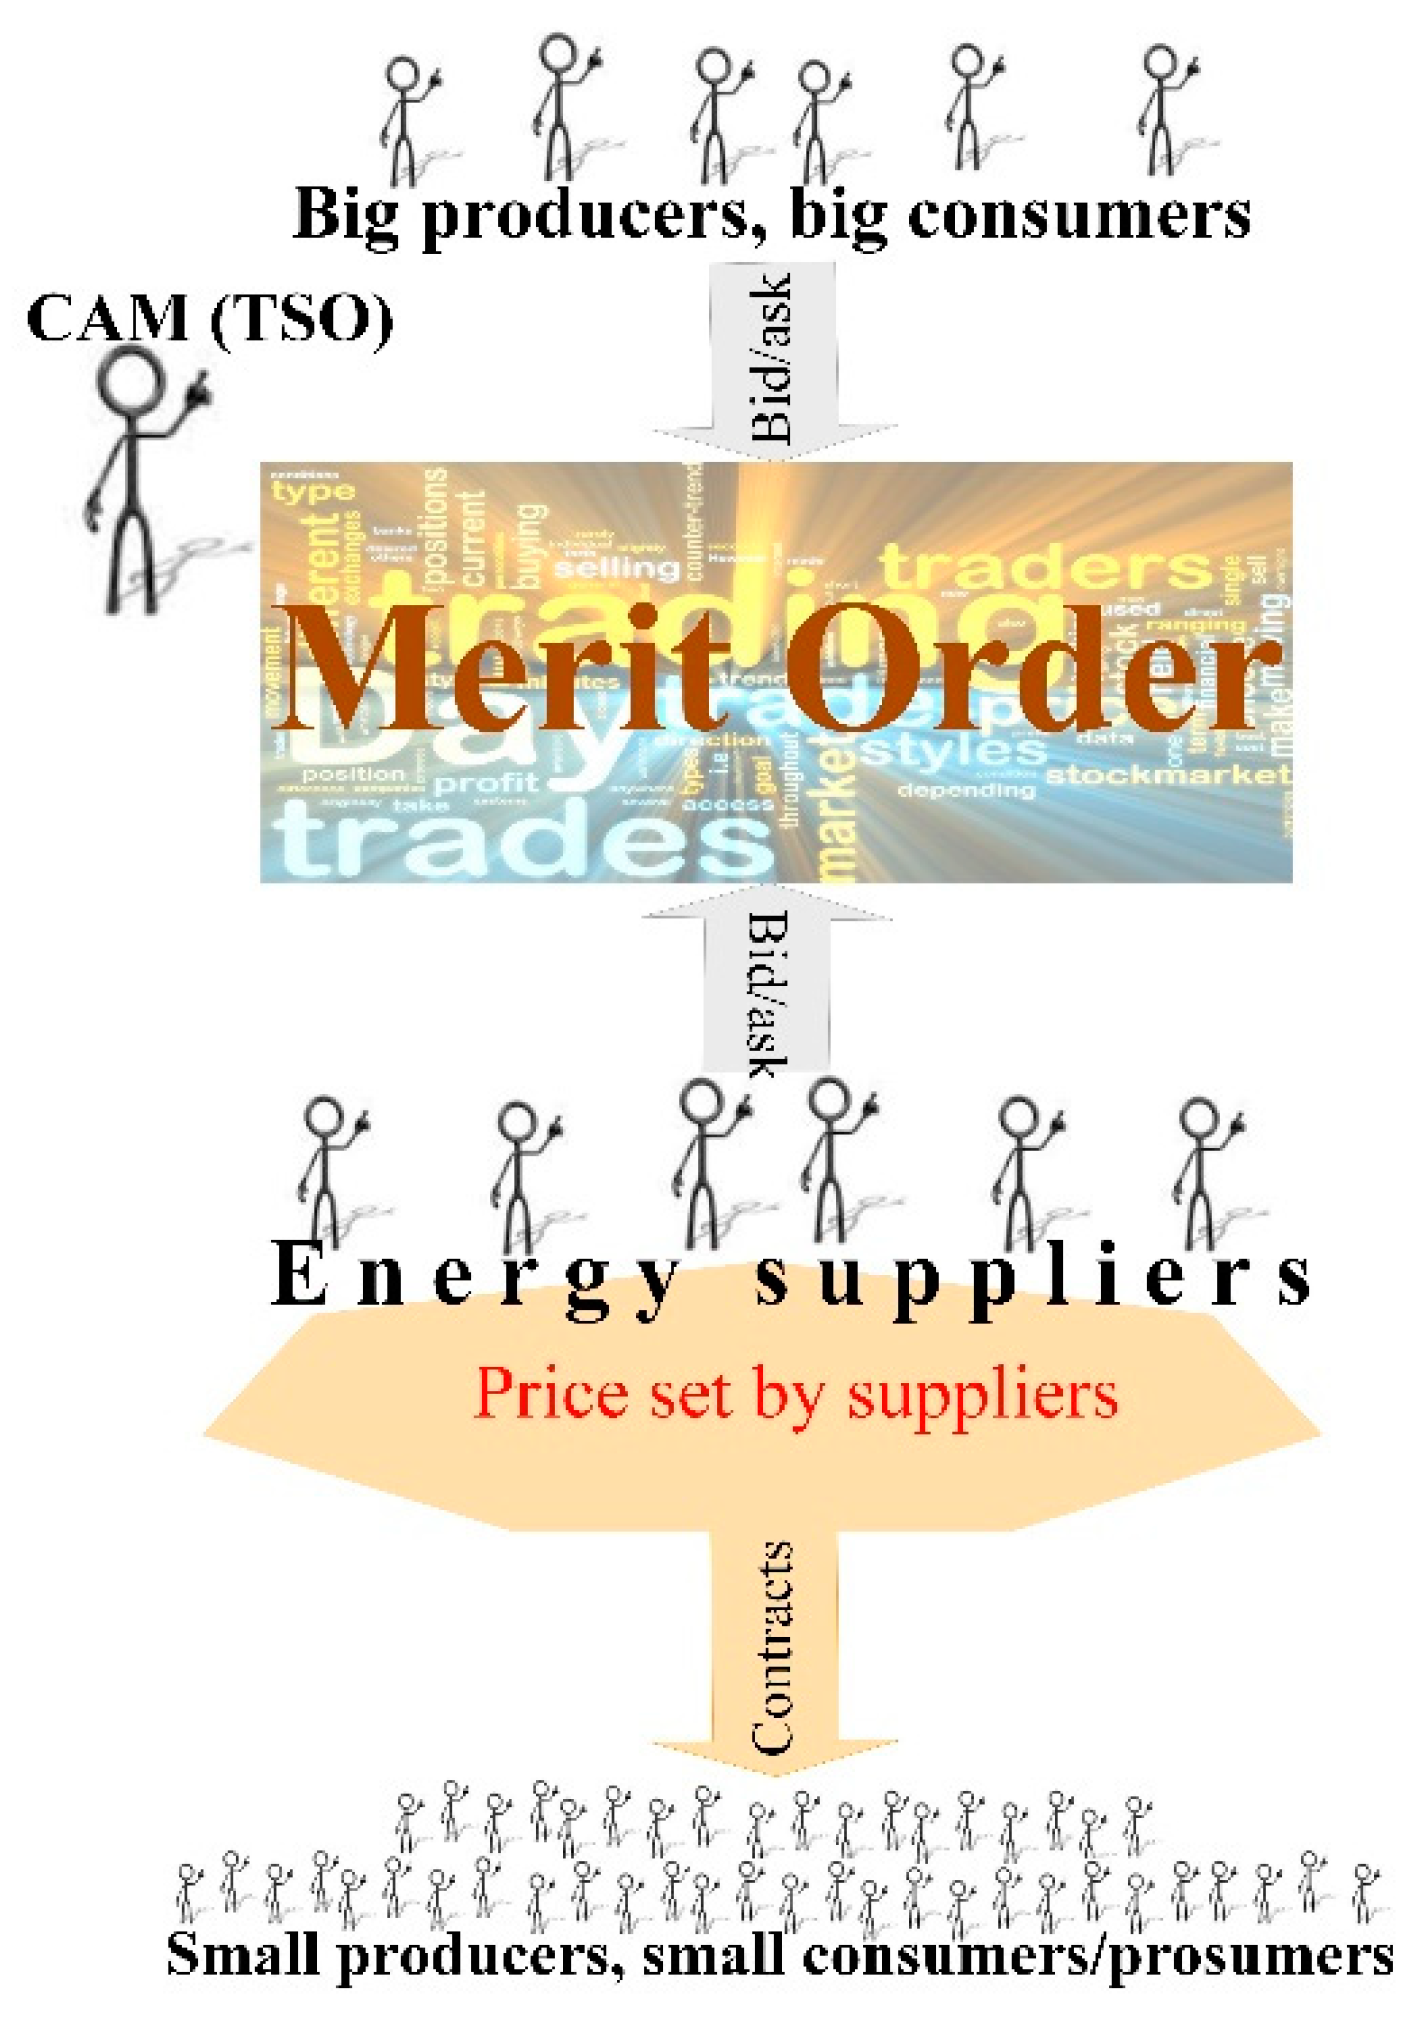
5.2.1. Status Quo of the Economical Processing in the Power Industry
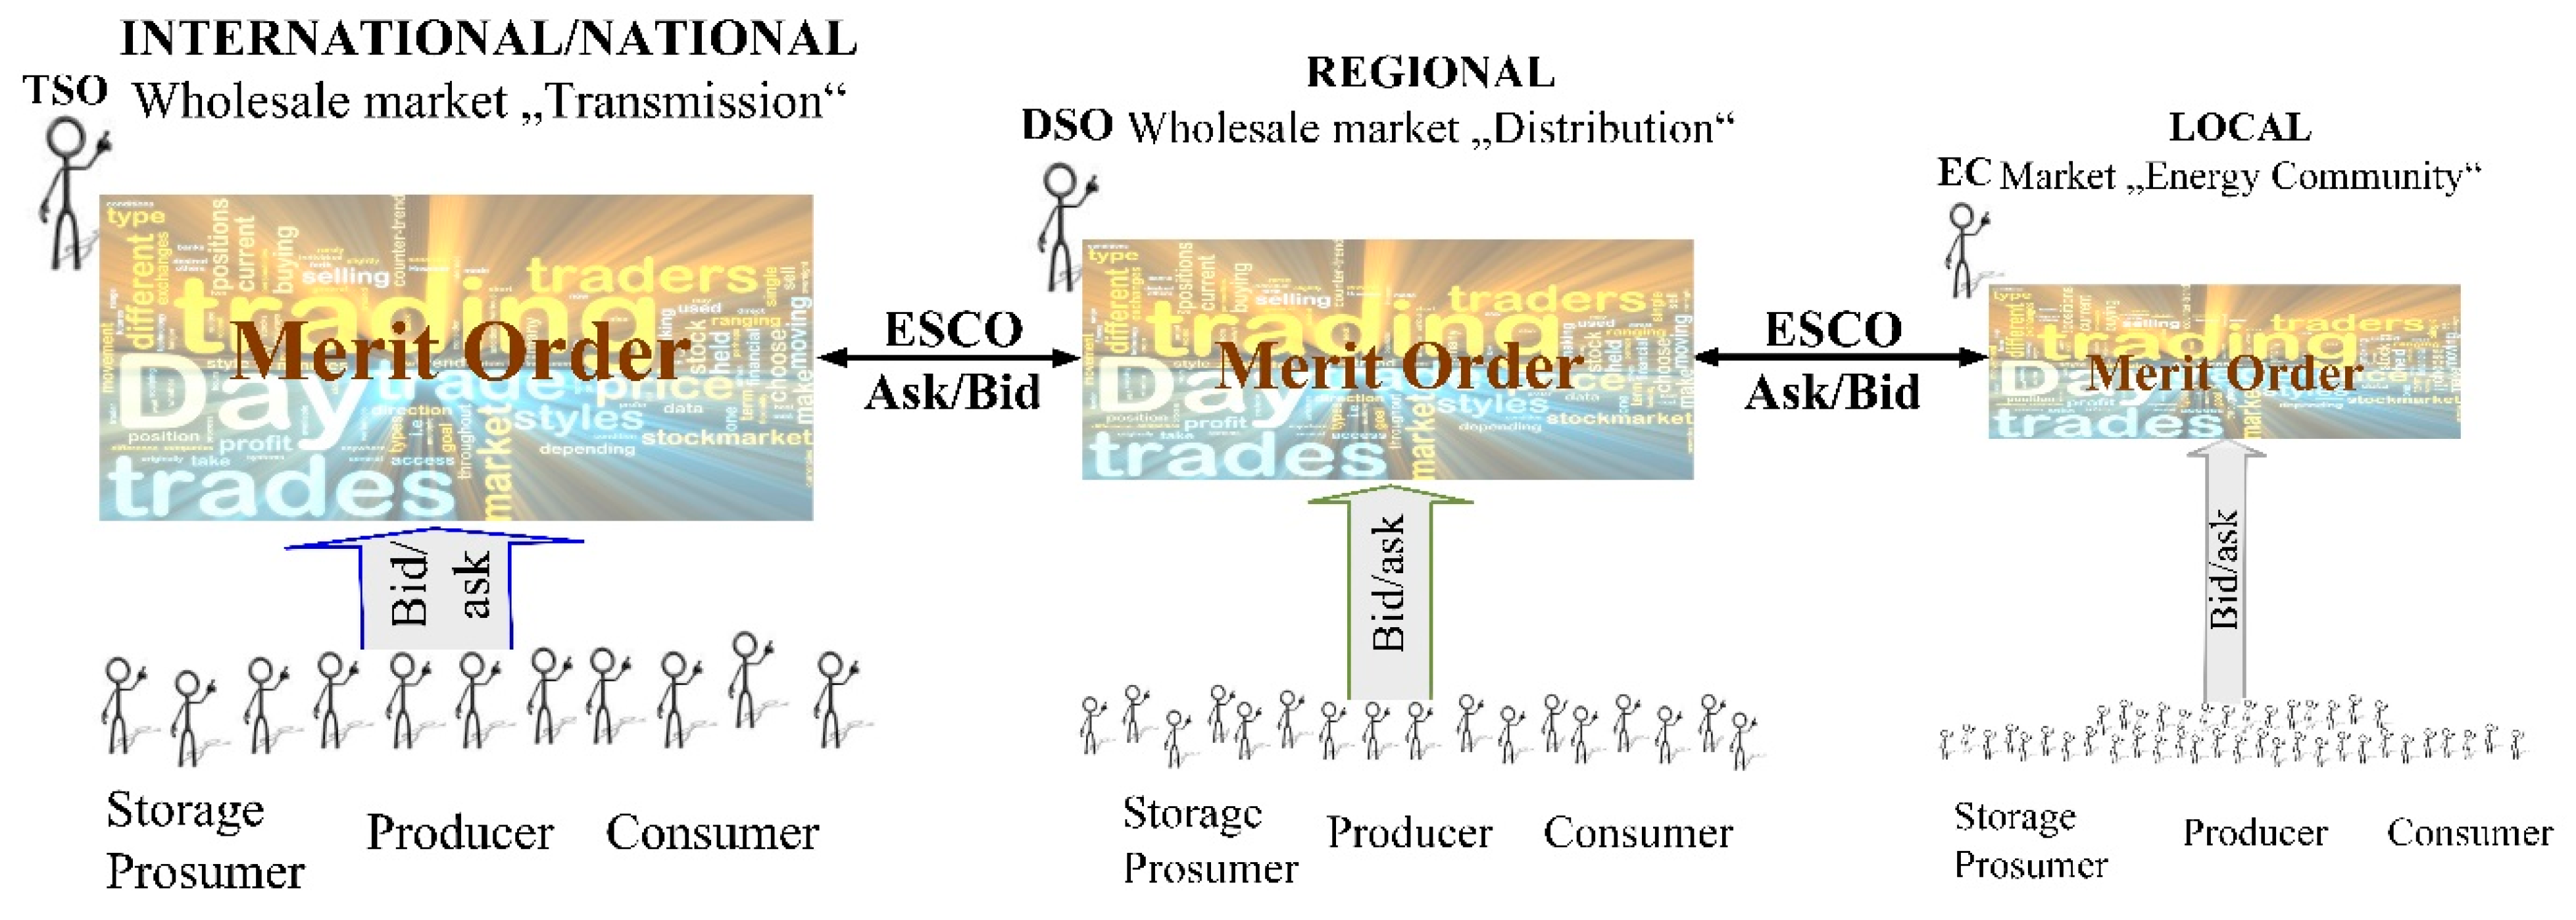
5.2.2. Market’s Fractal Structure
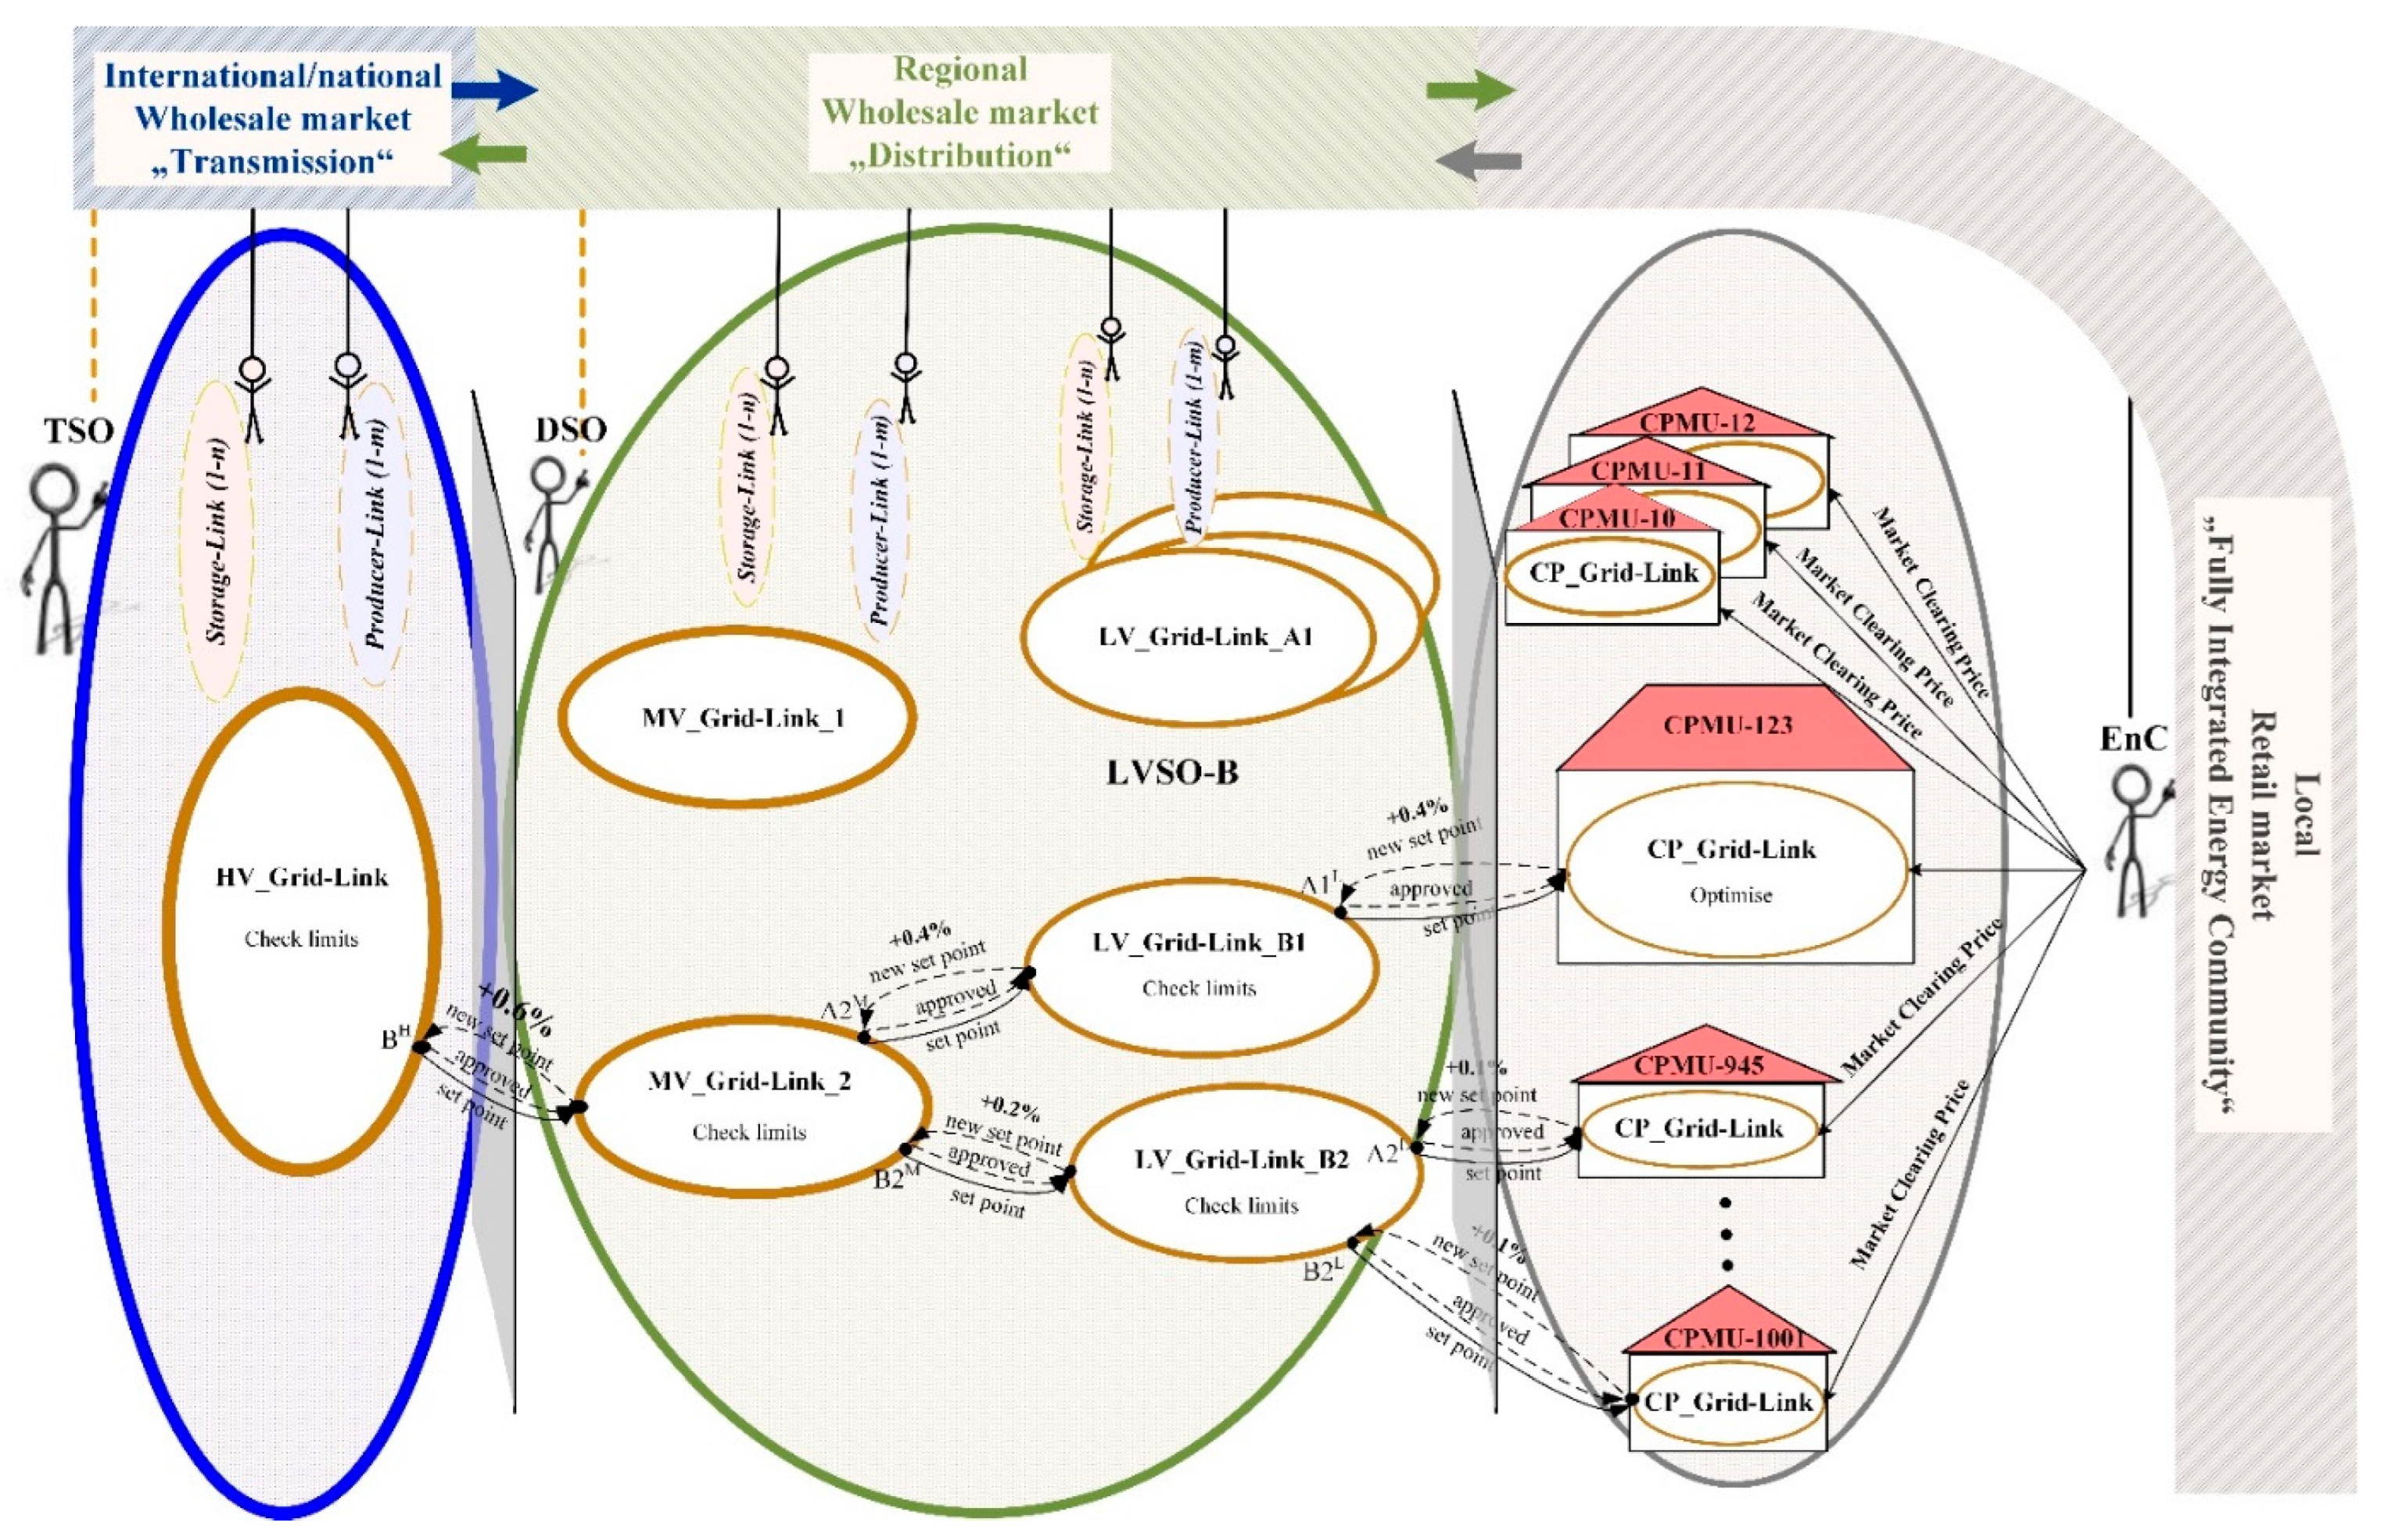
5.2.3. Harmonised Market Structure
5.2.4. Market’s Mechanism
Local Retail Market: Merit Order Based on Arbitrary Price Offers
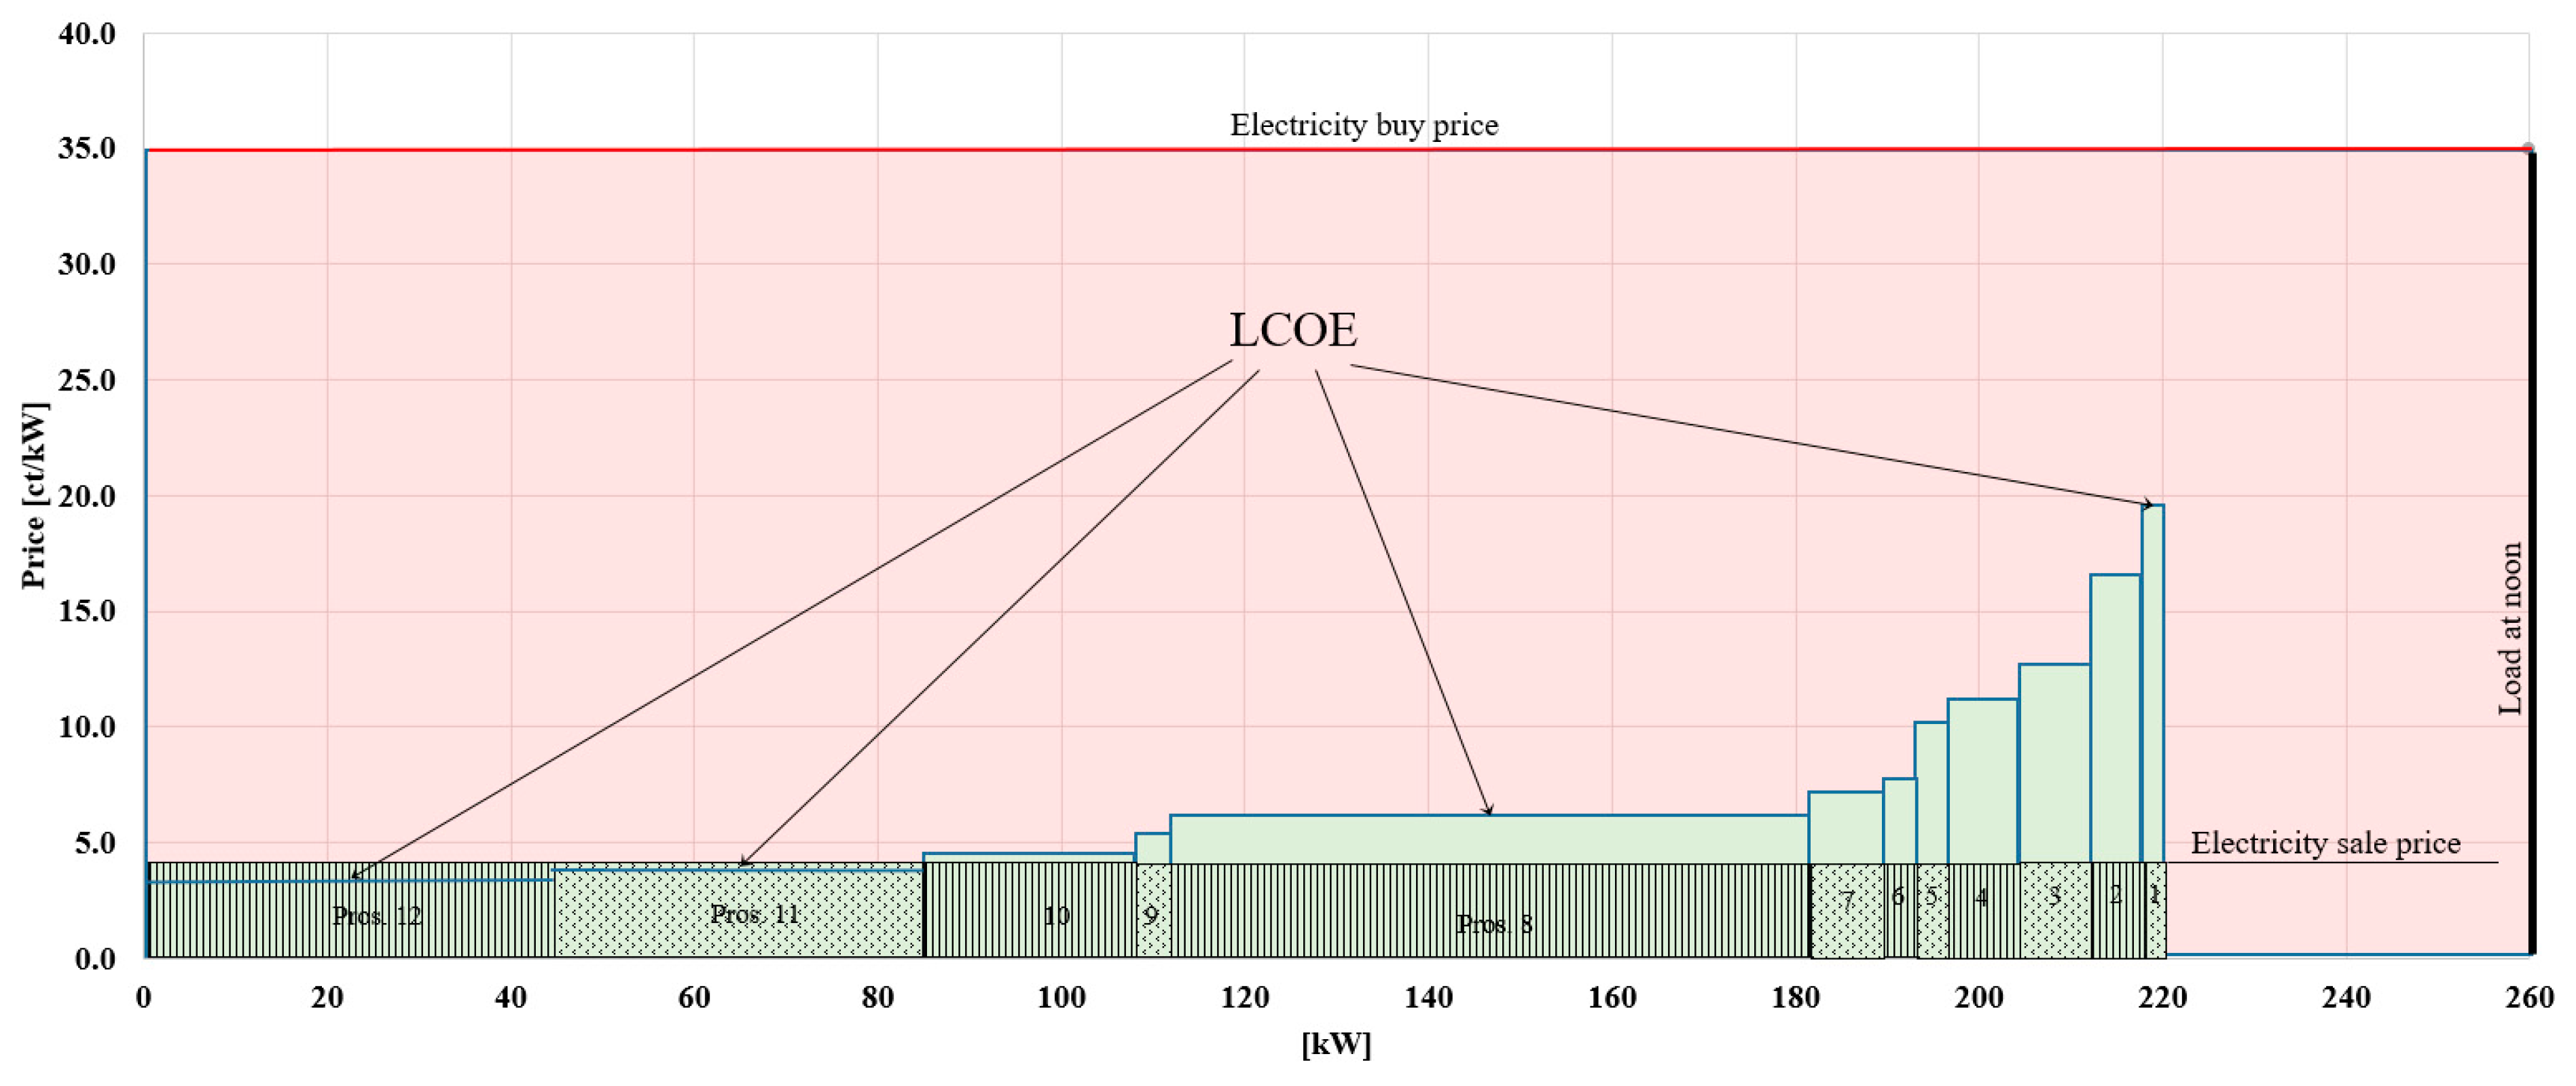
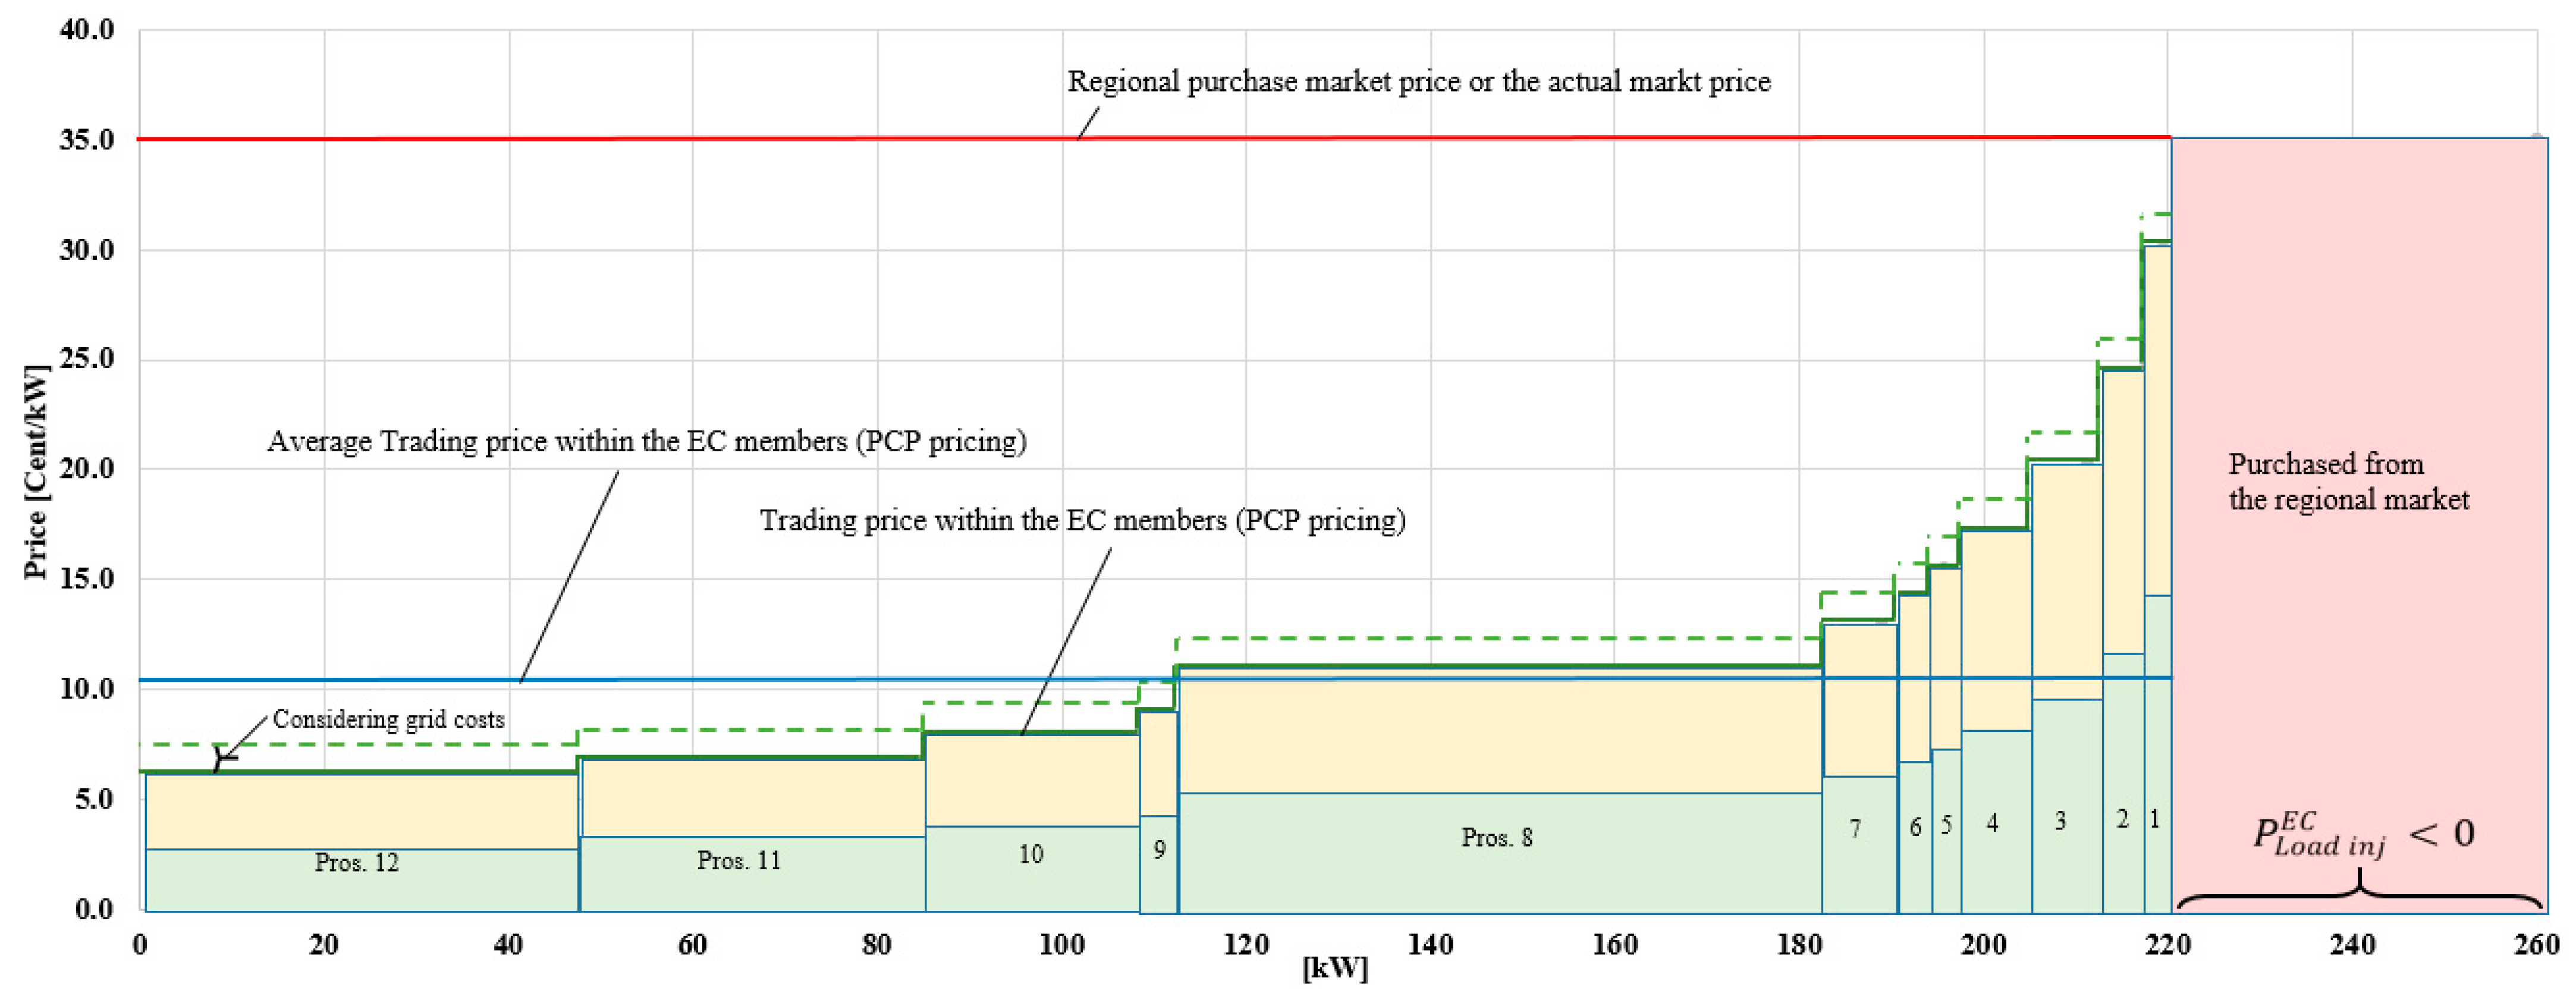
Local Retail Market: Staggered Price Mechanism Using Merit Order Built on LCOE
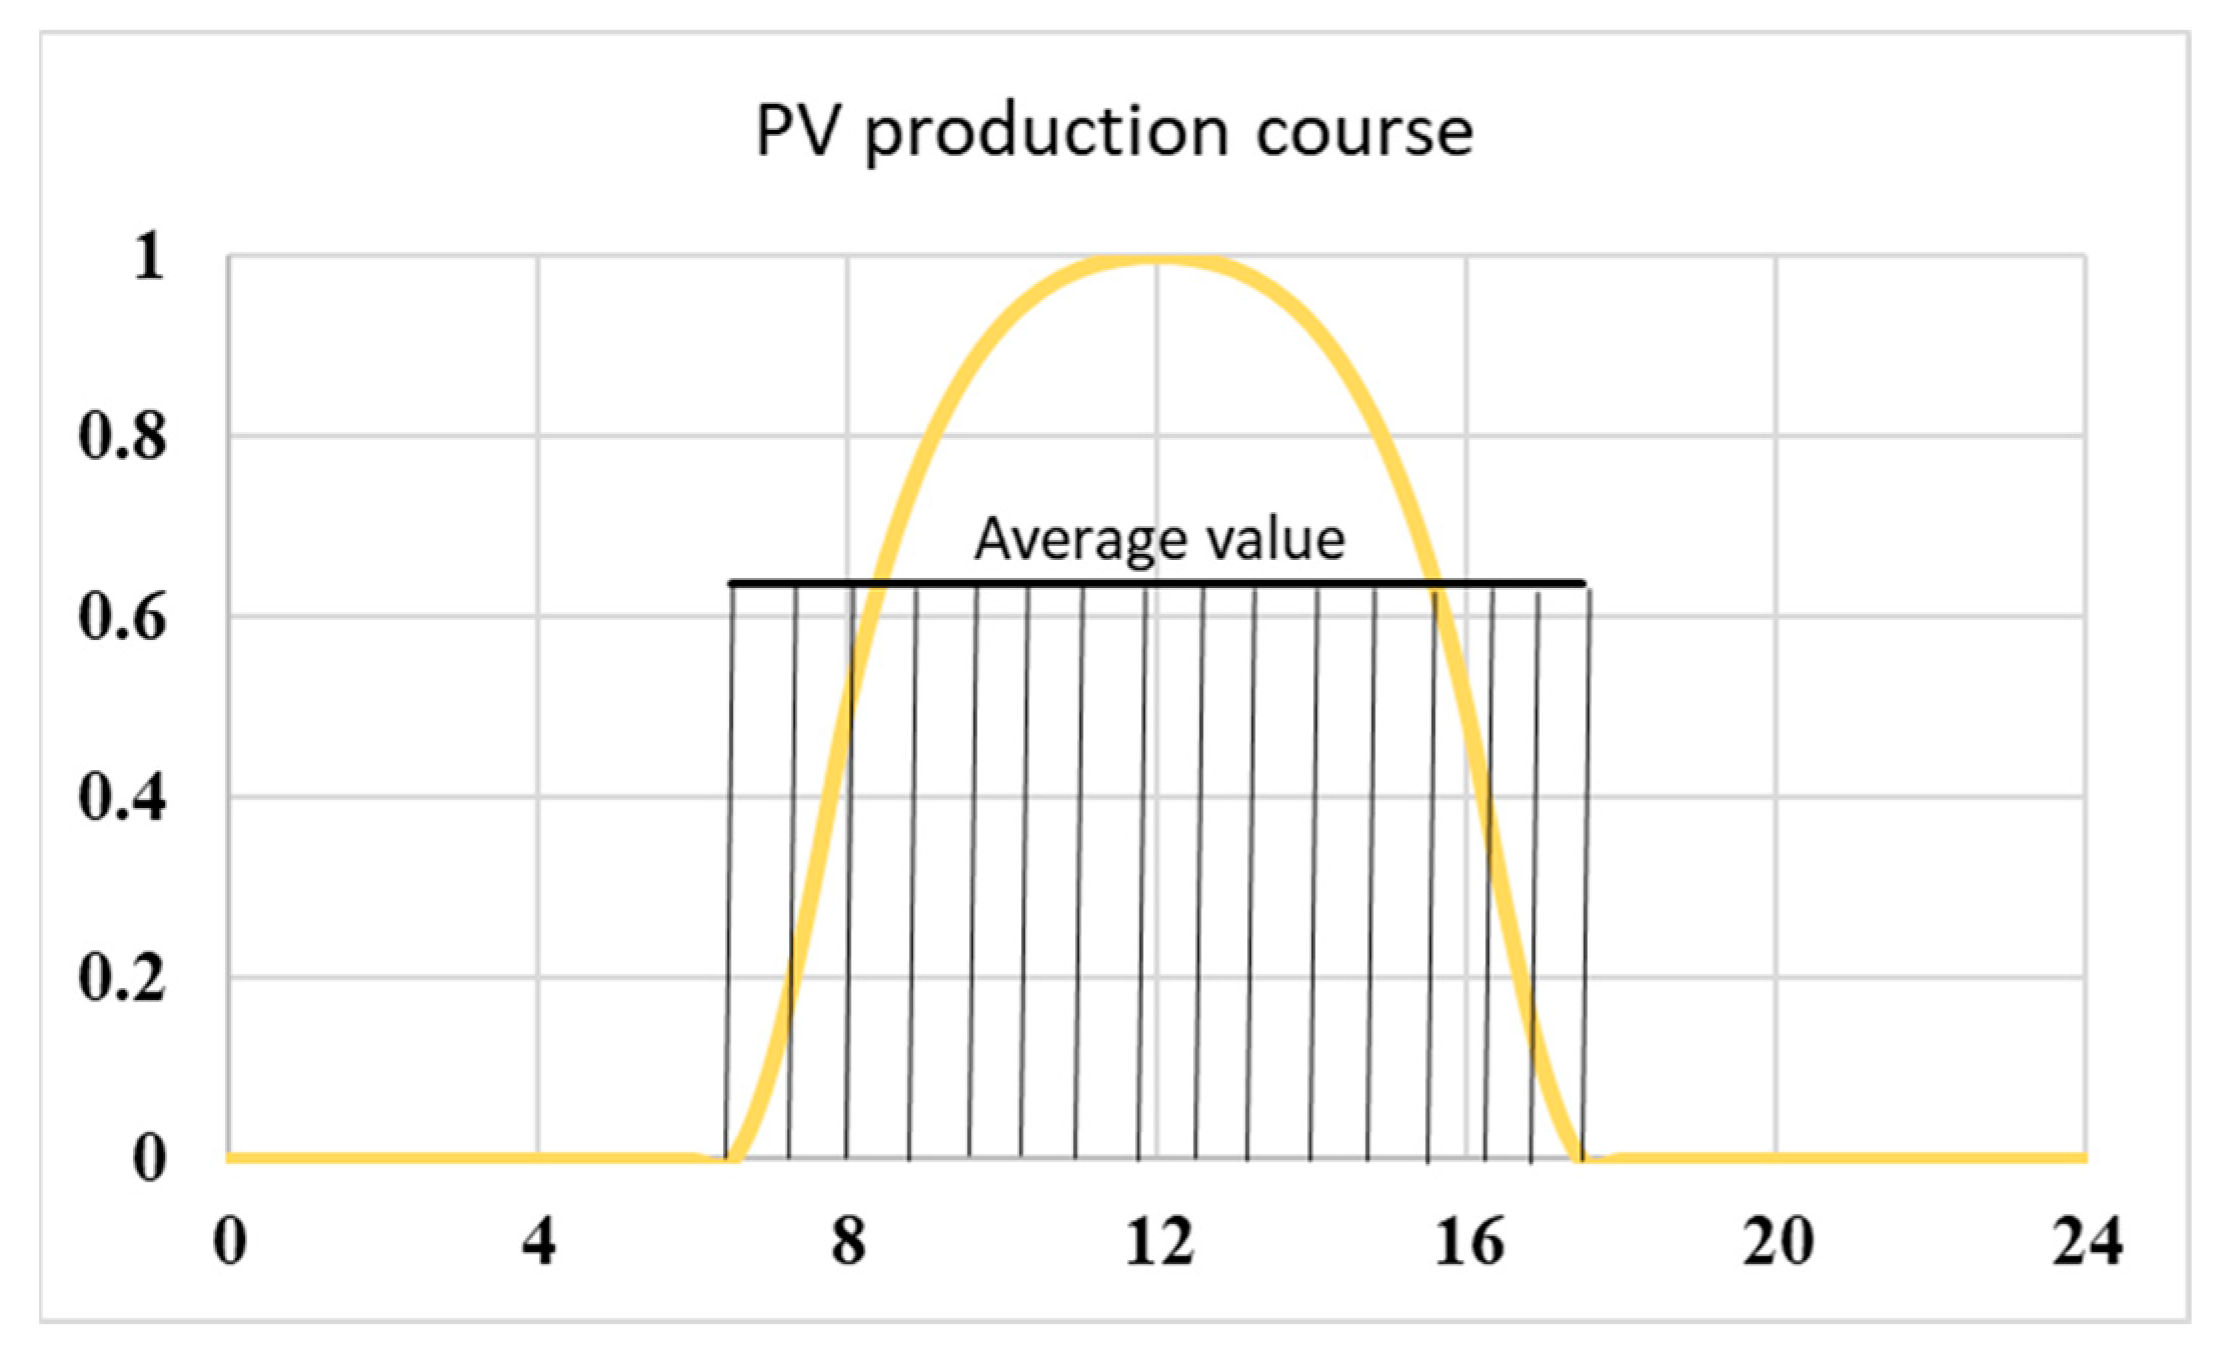
- Total Energy Supplied
- Current scheme for purchasing and selling electricity
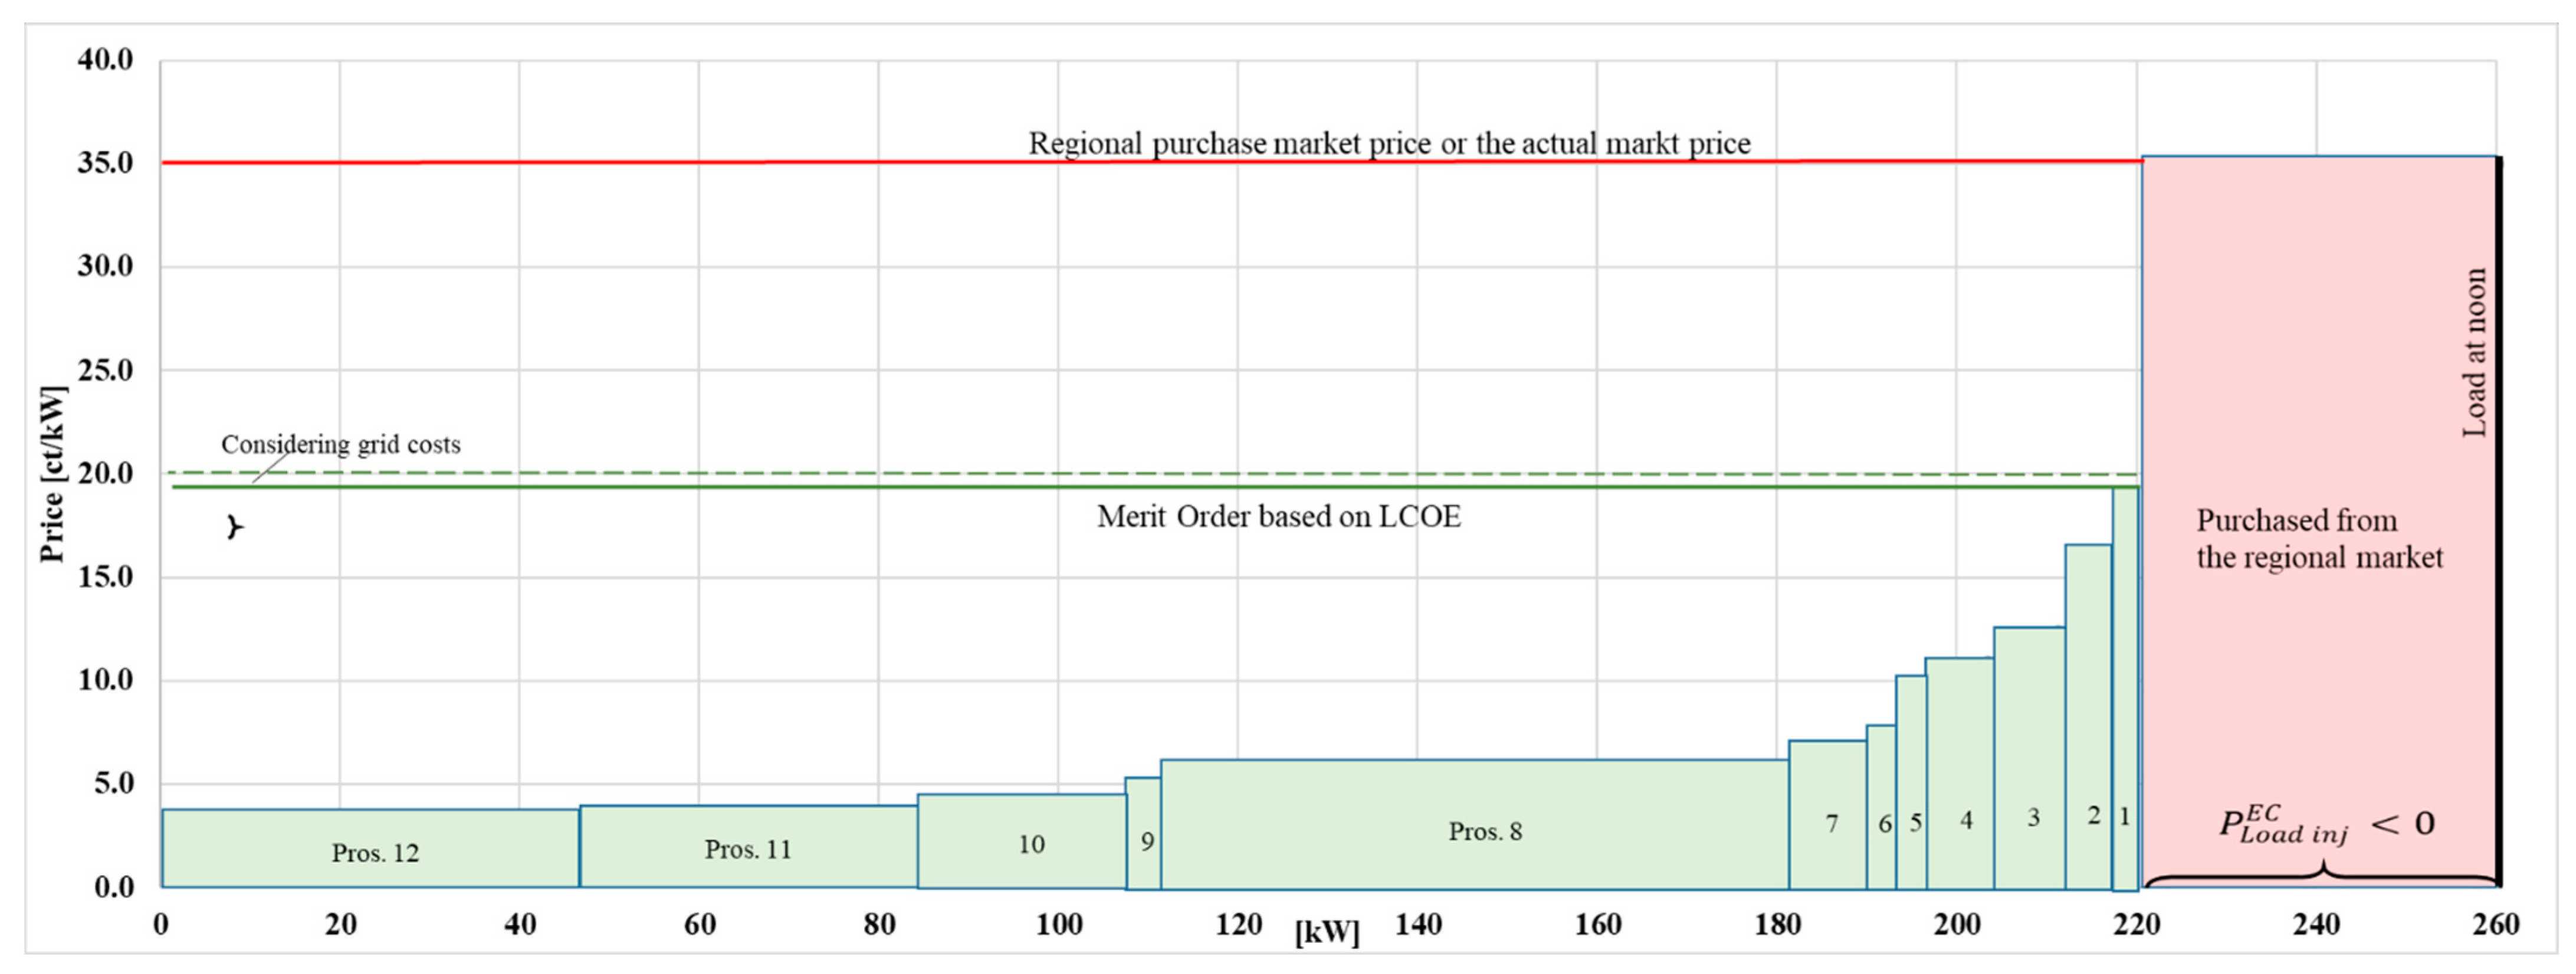
- Merit-Order based on LCOE
Local Retail Market: Power Purchase Agreement
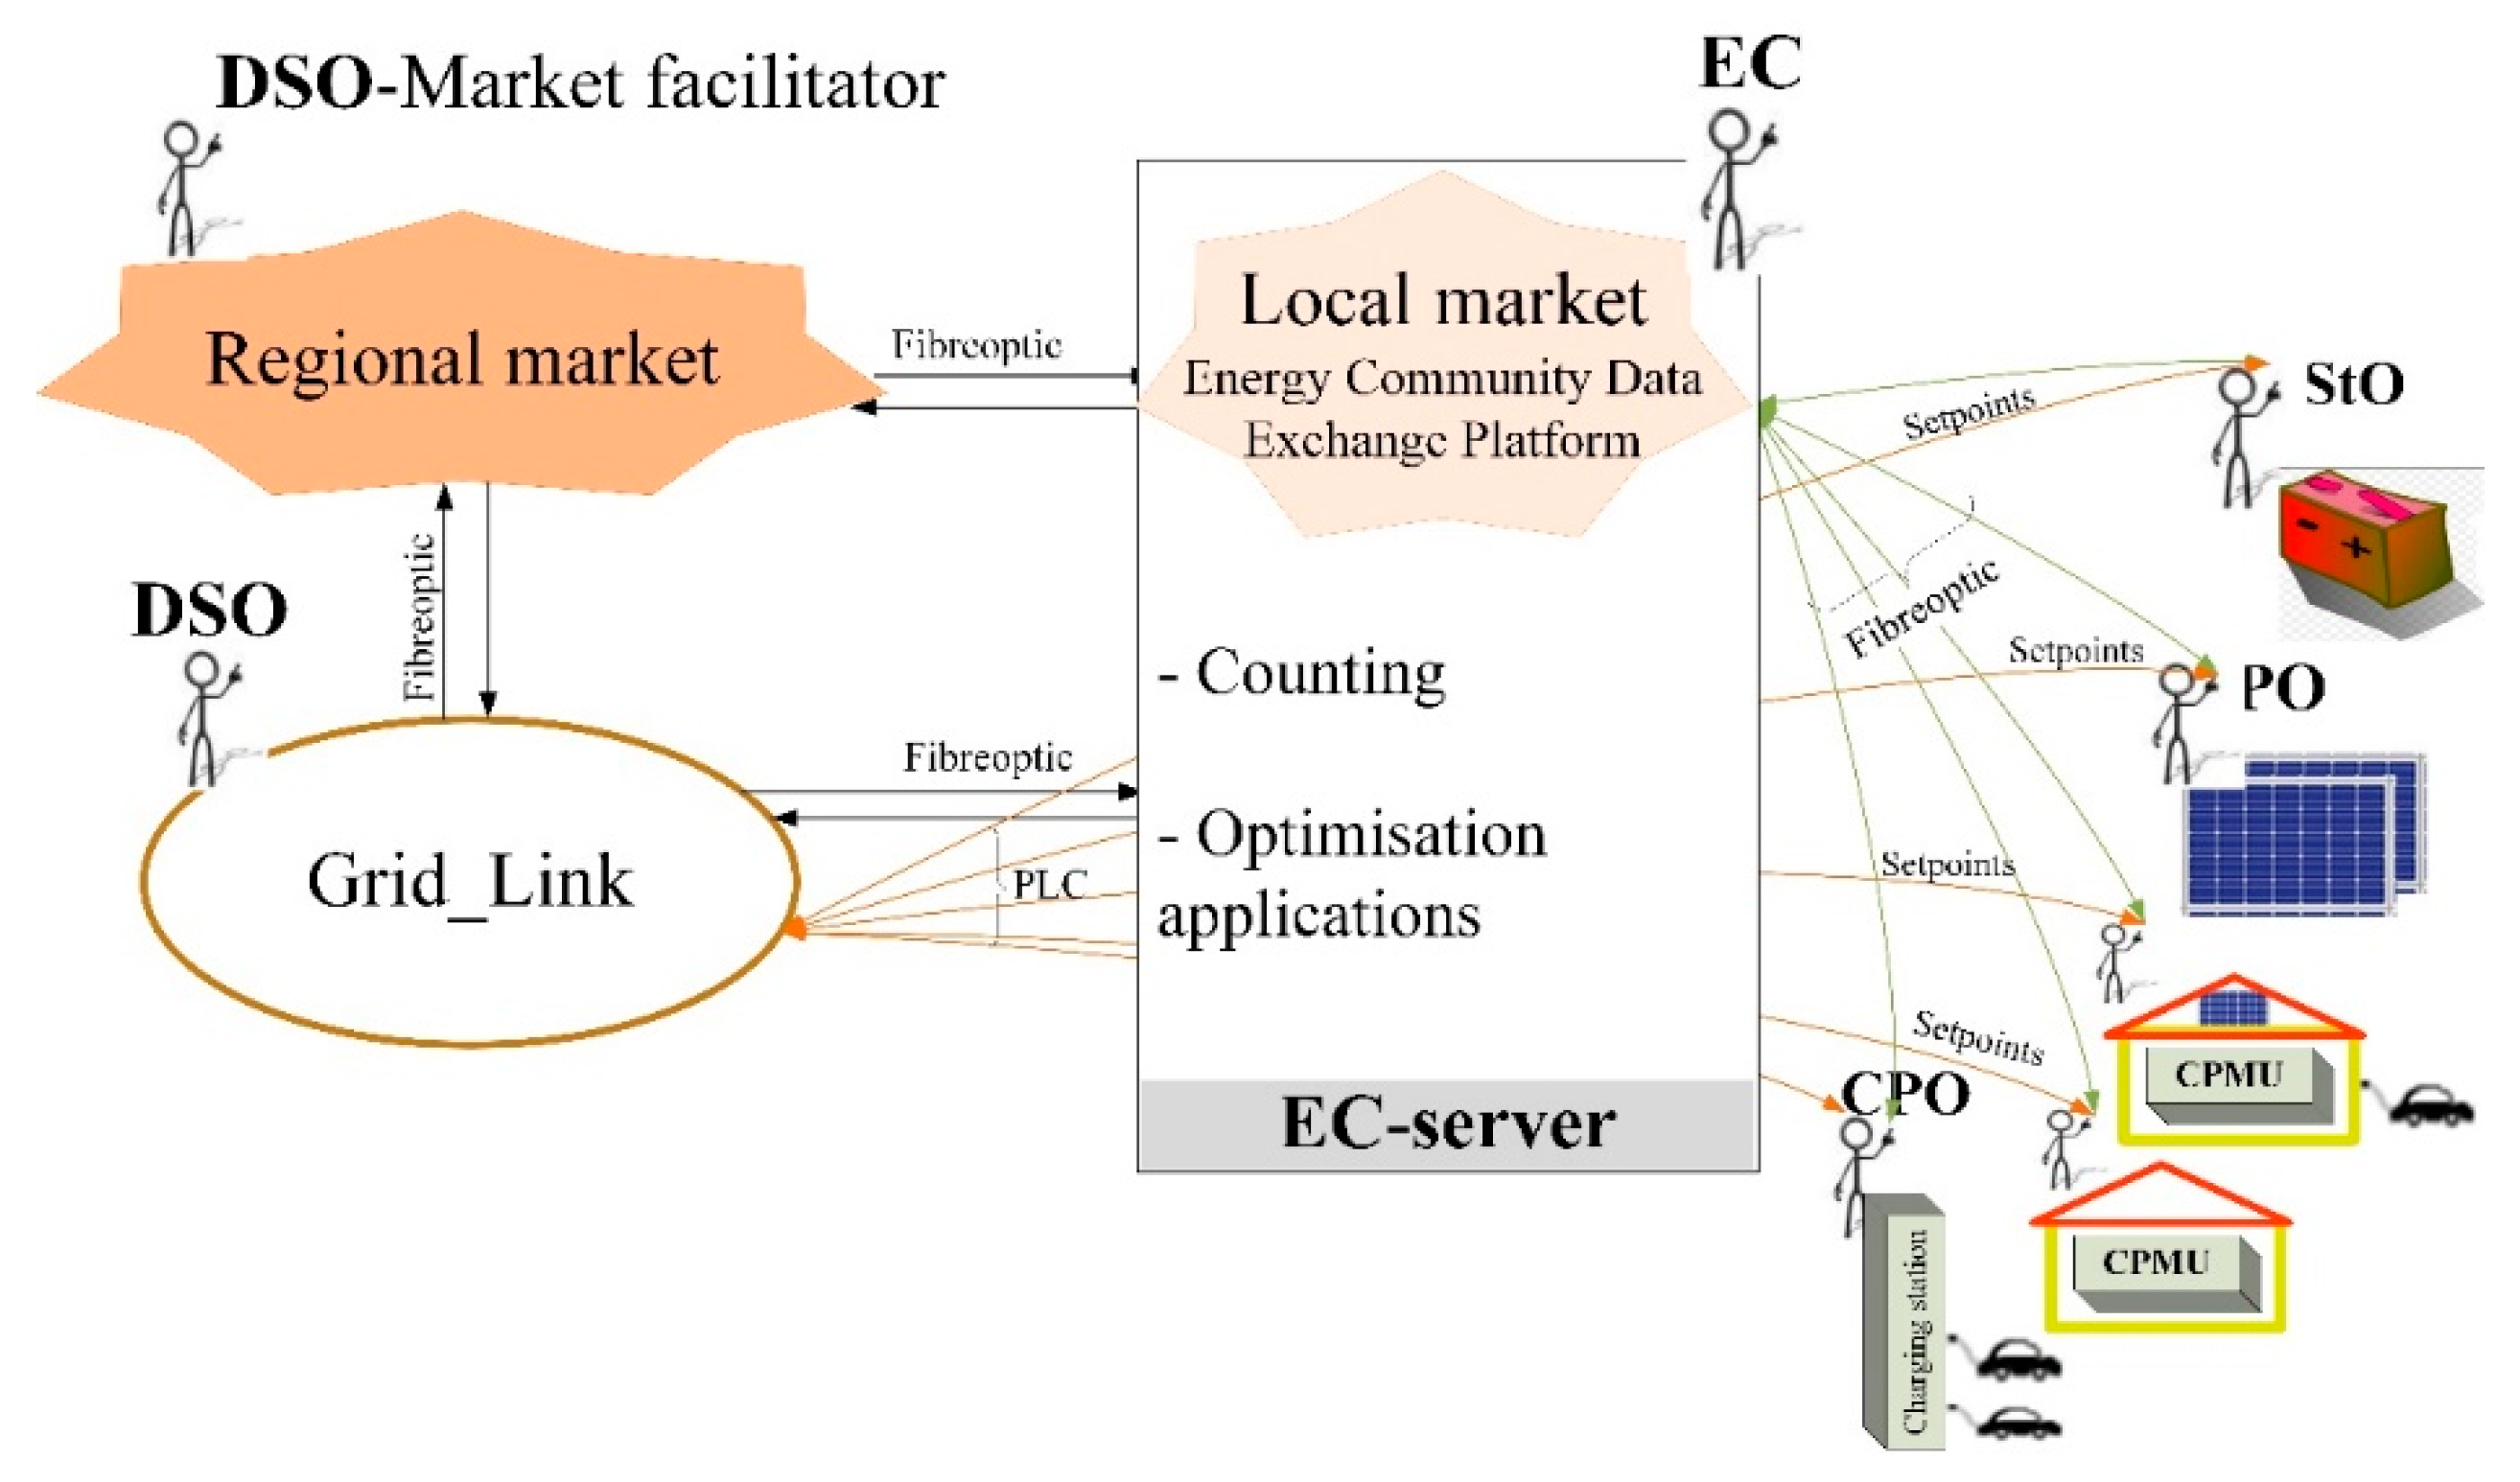
5.3. Communication Technology Architecture
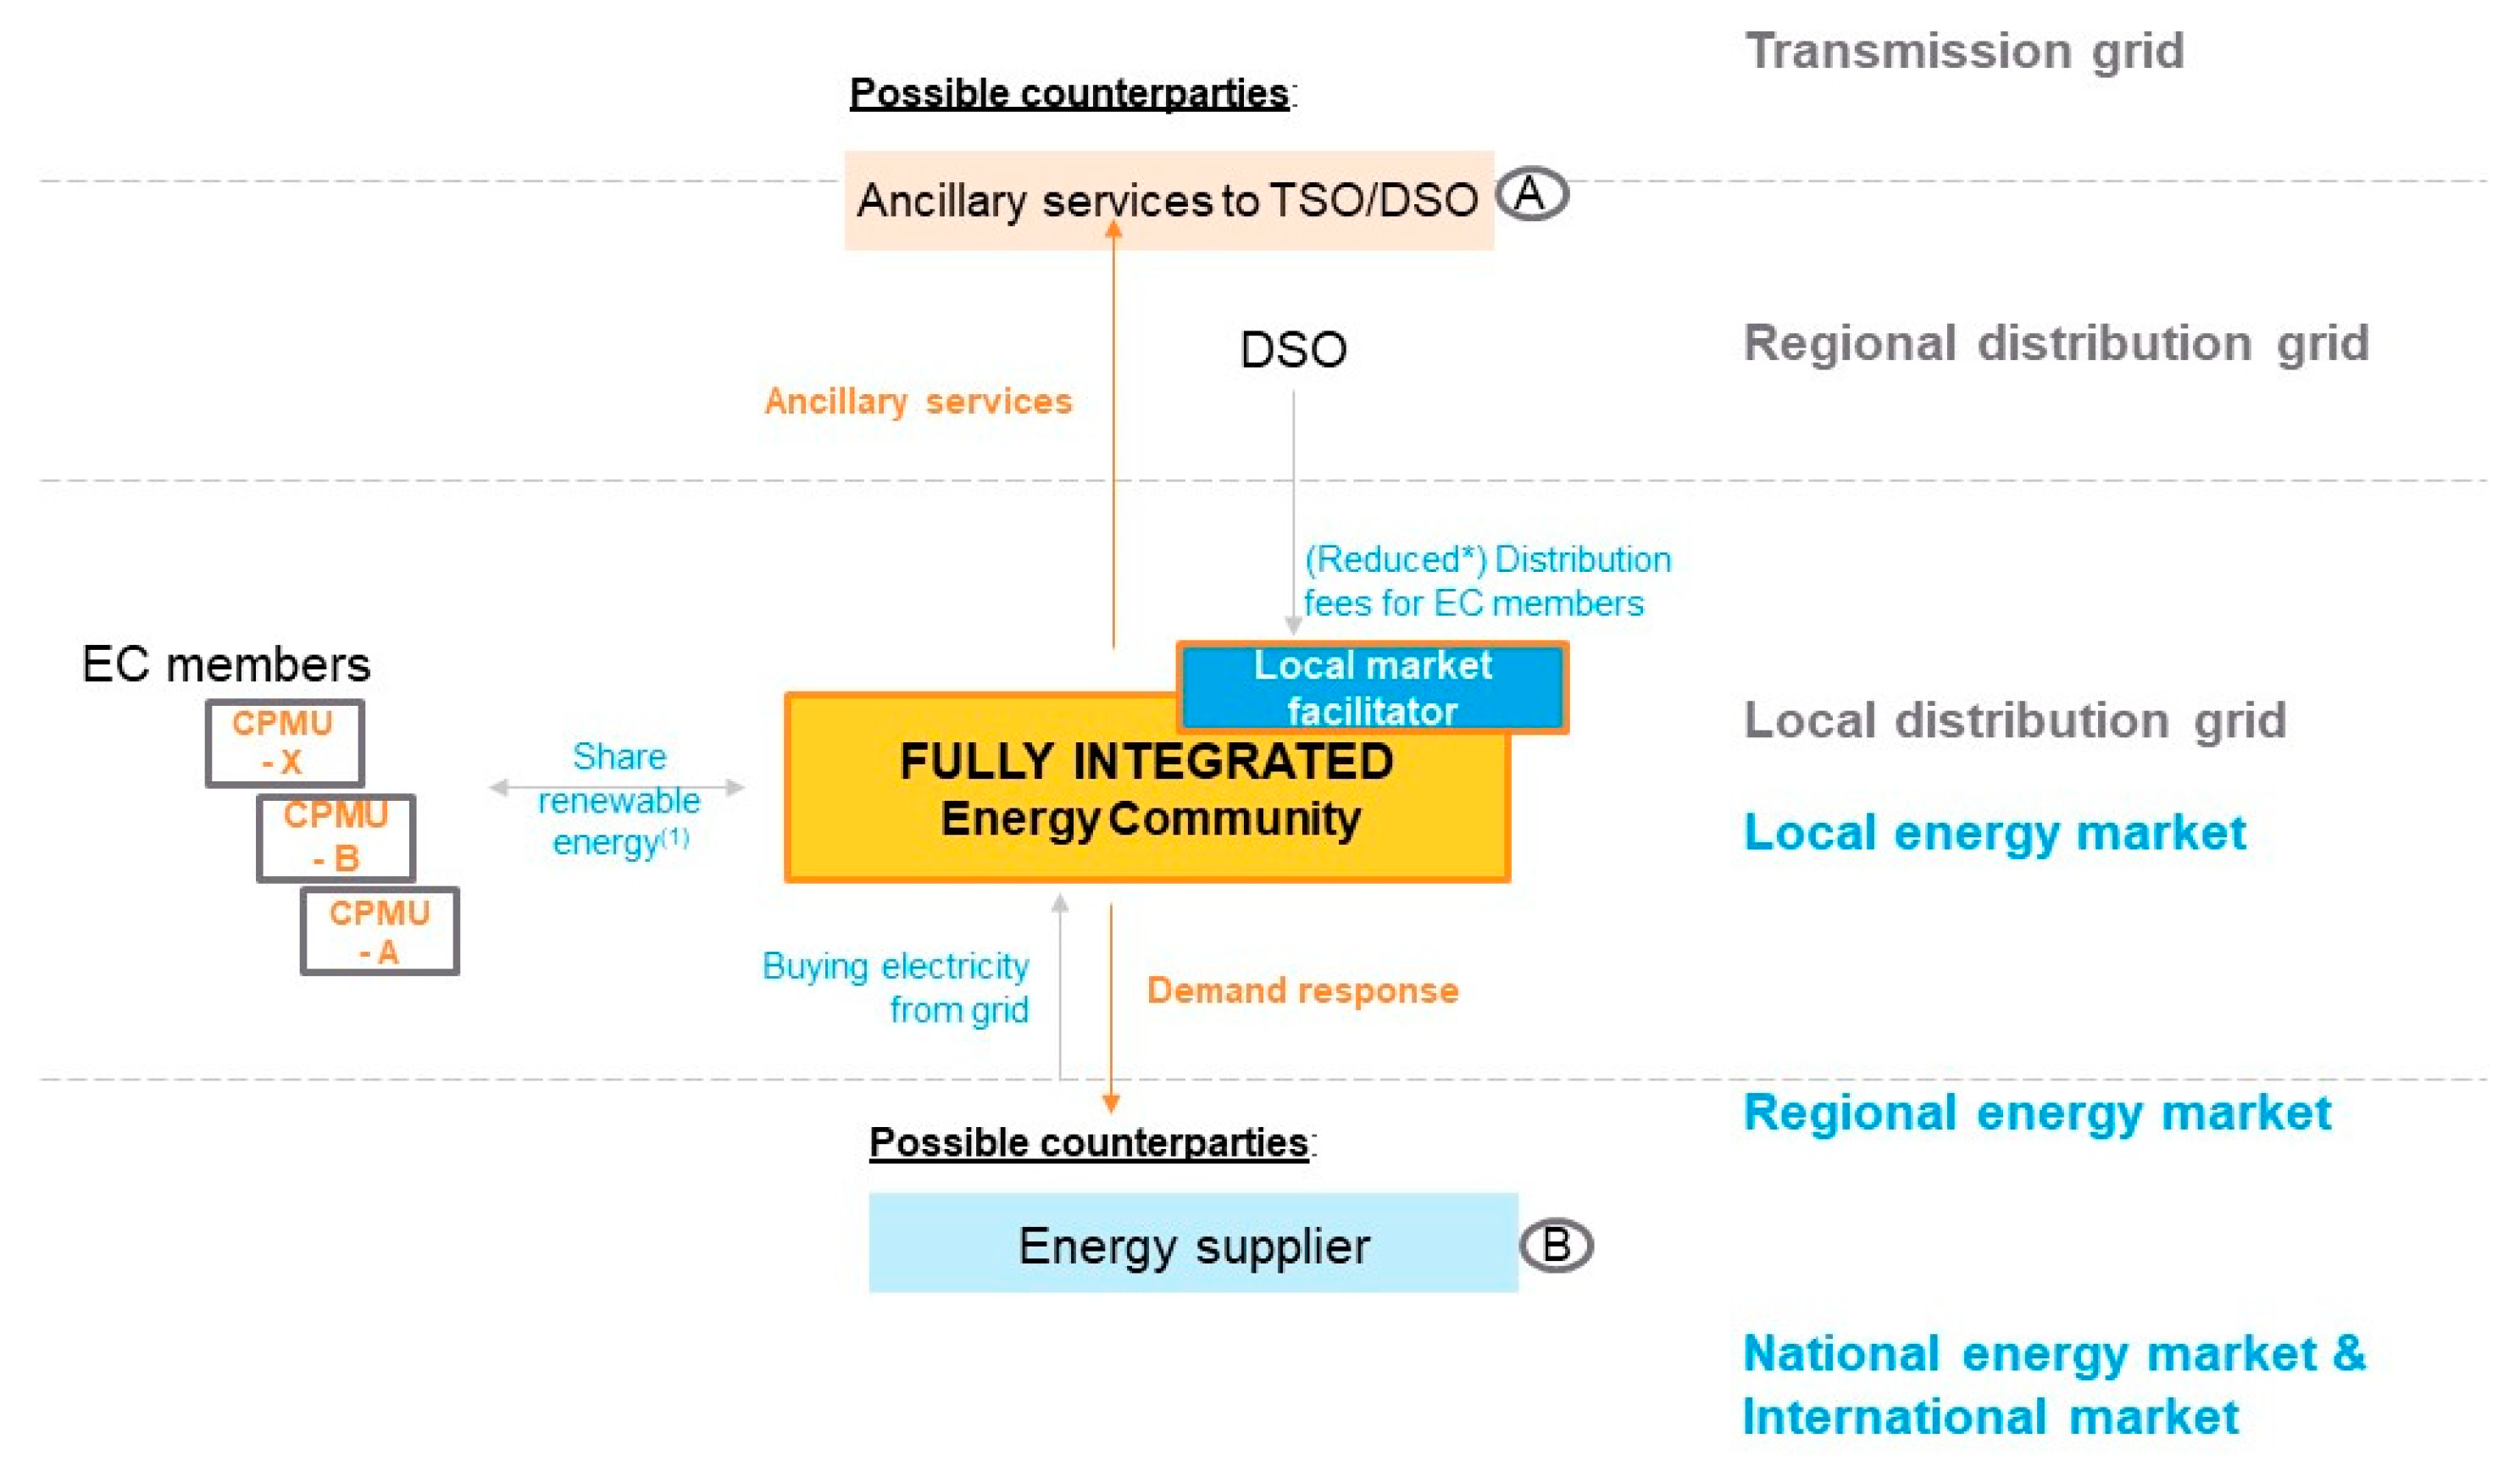
5.4. Use Cases
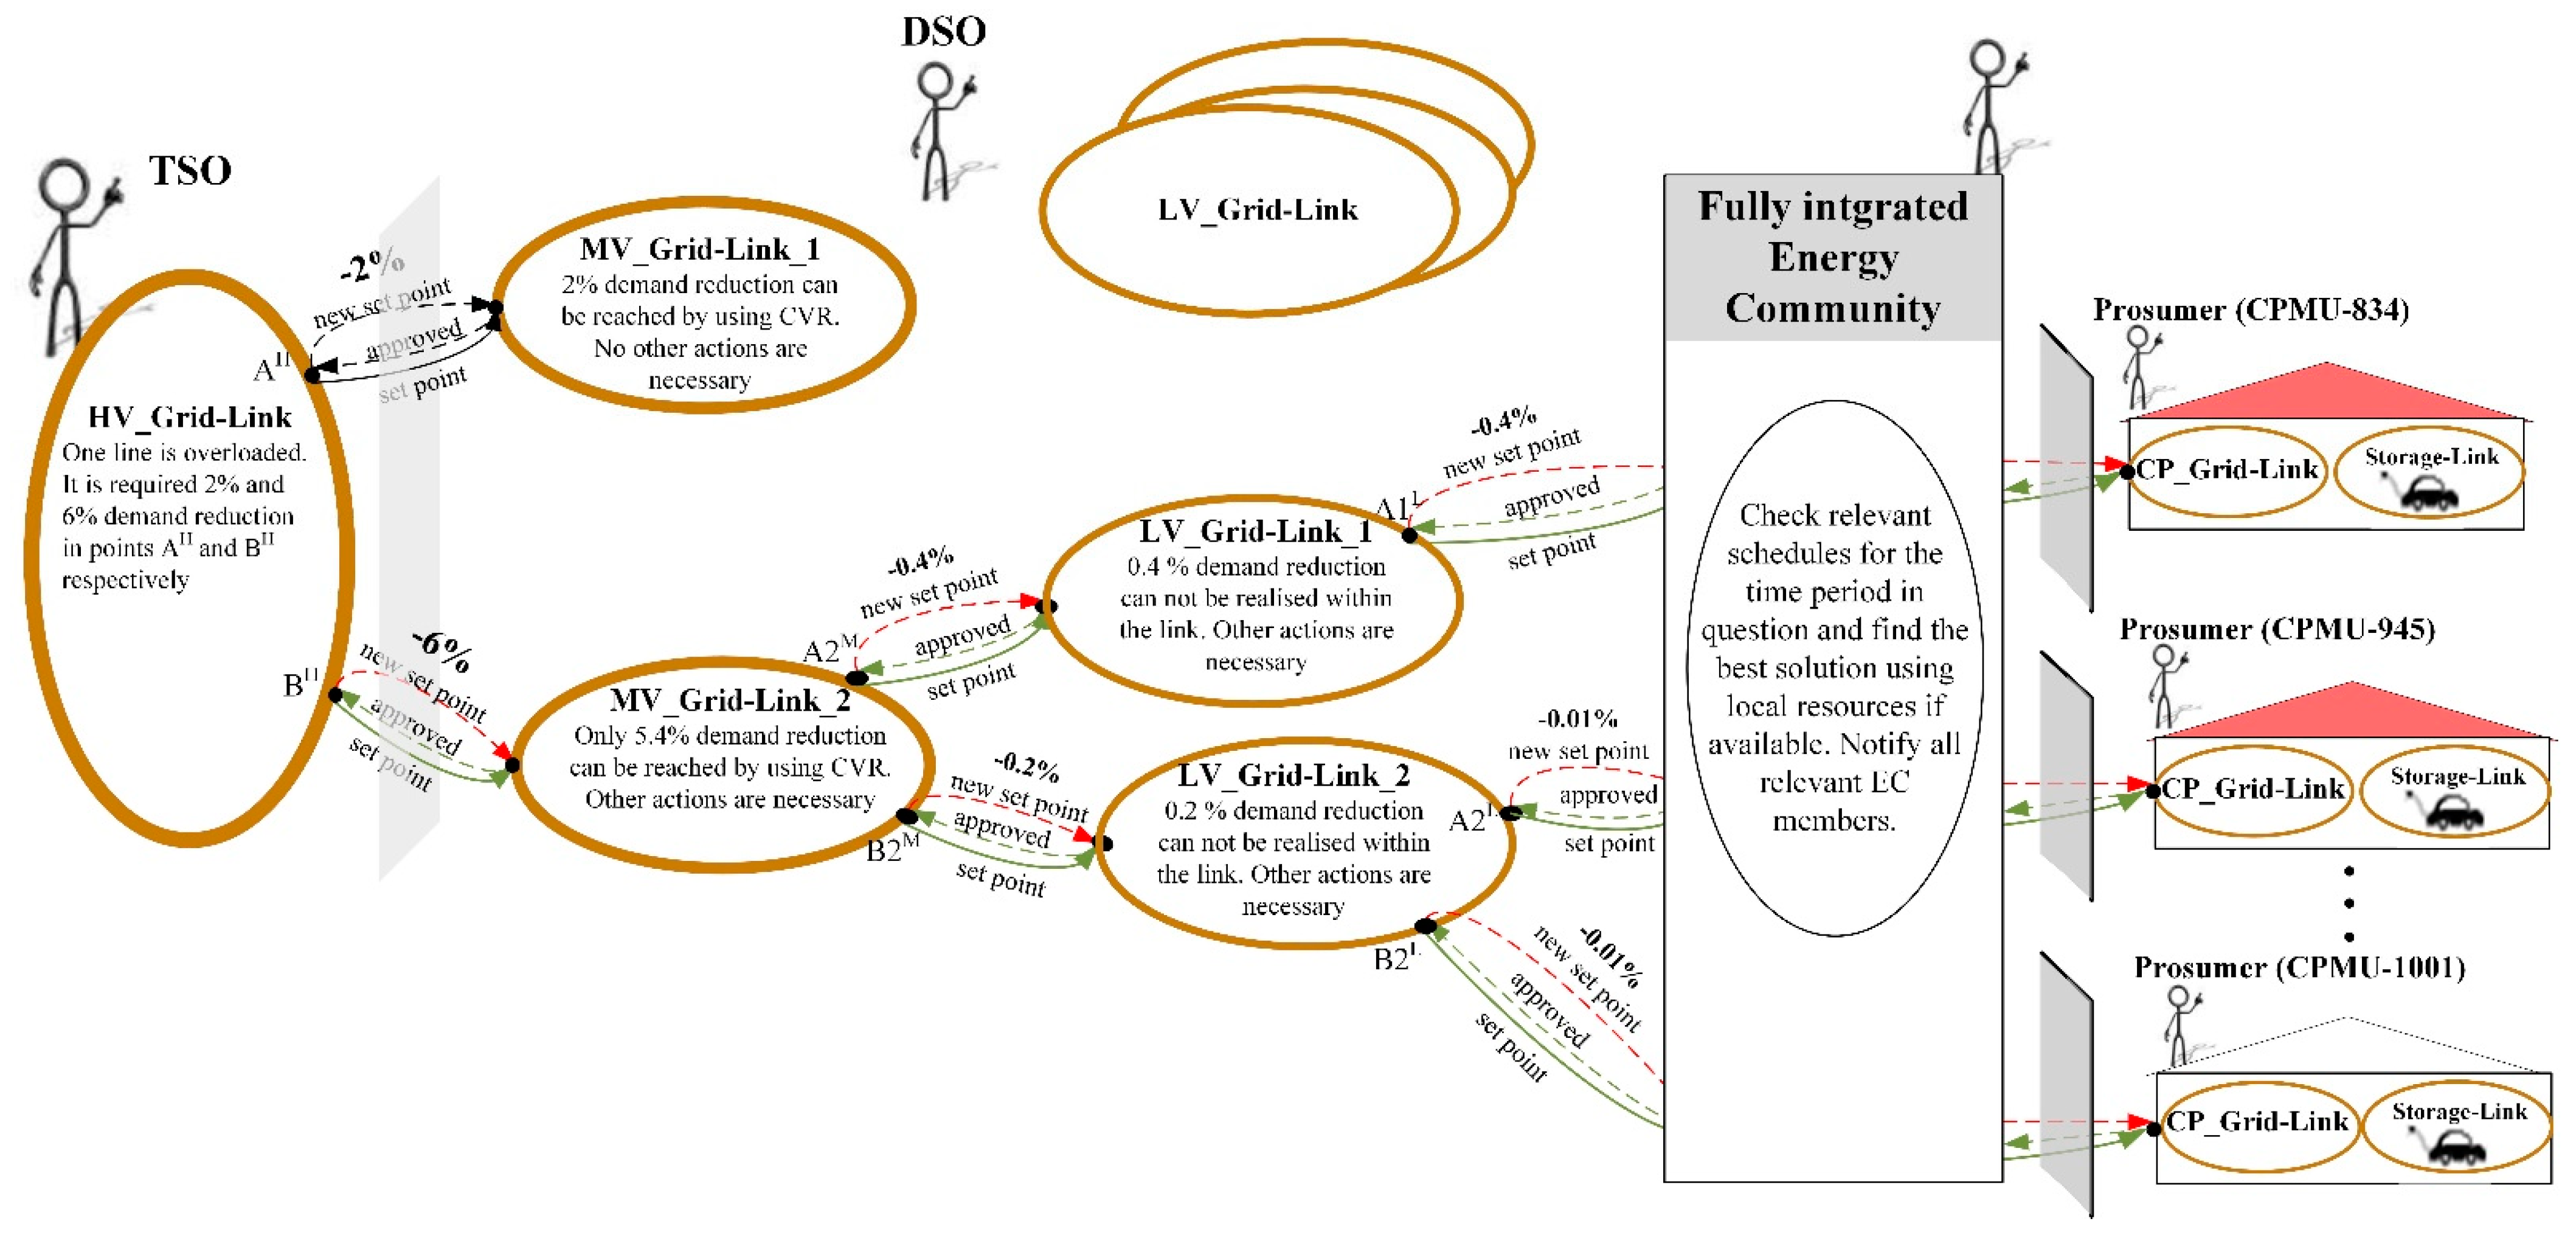
5.4.1. Demand Response
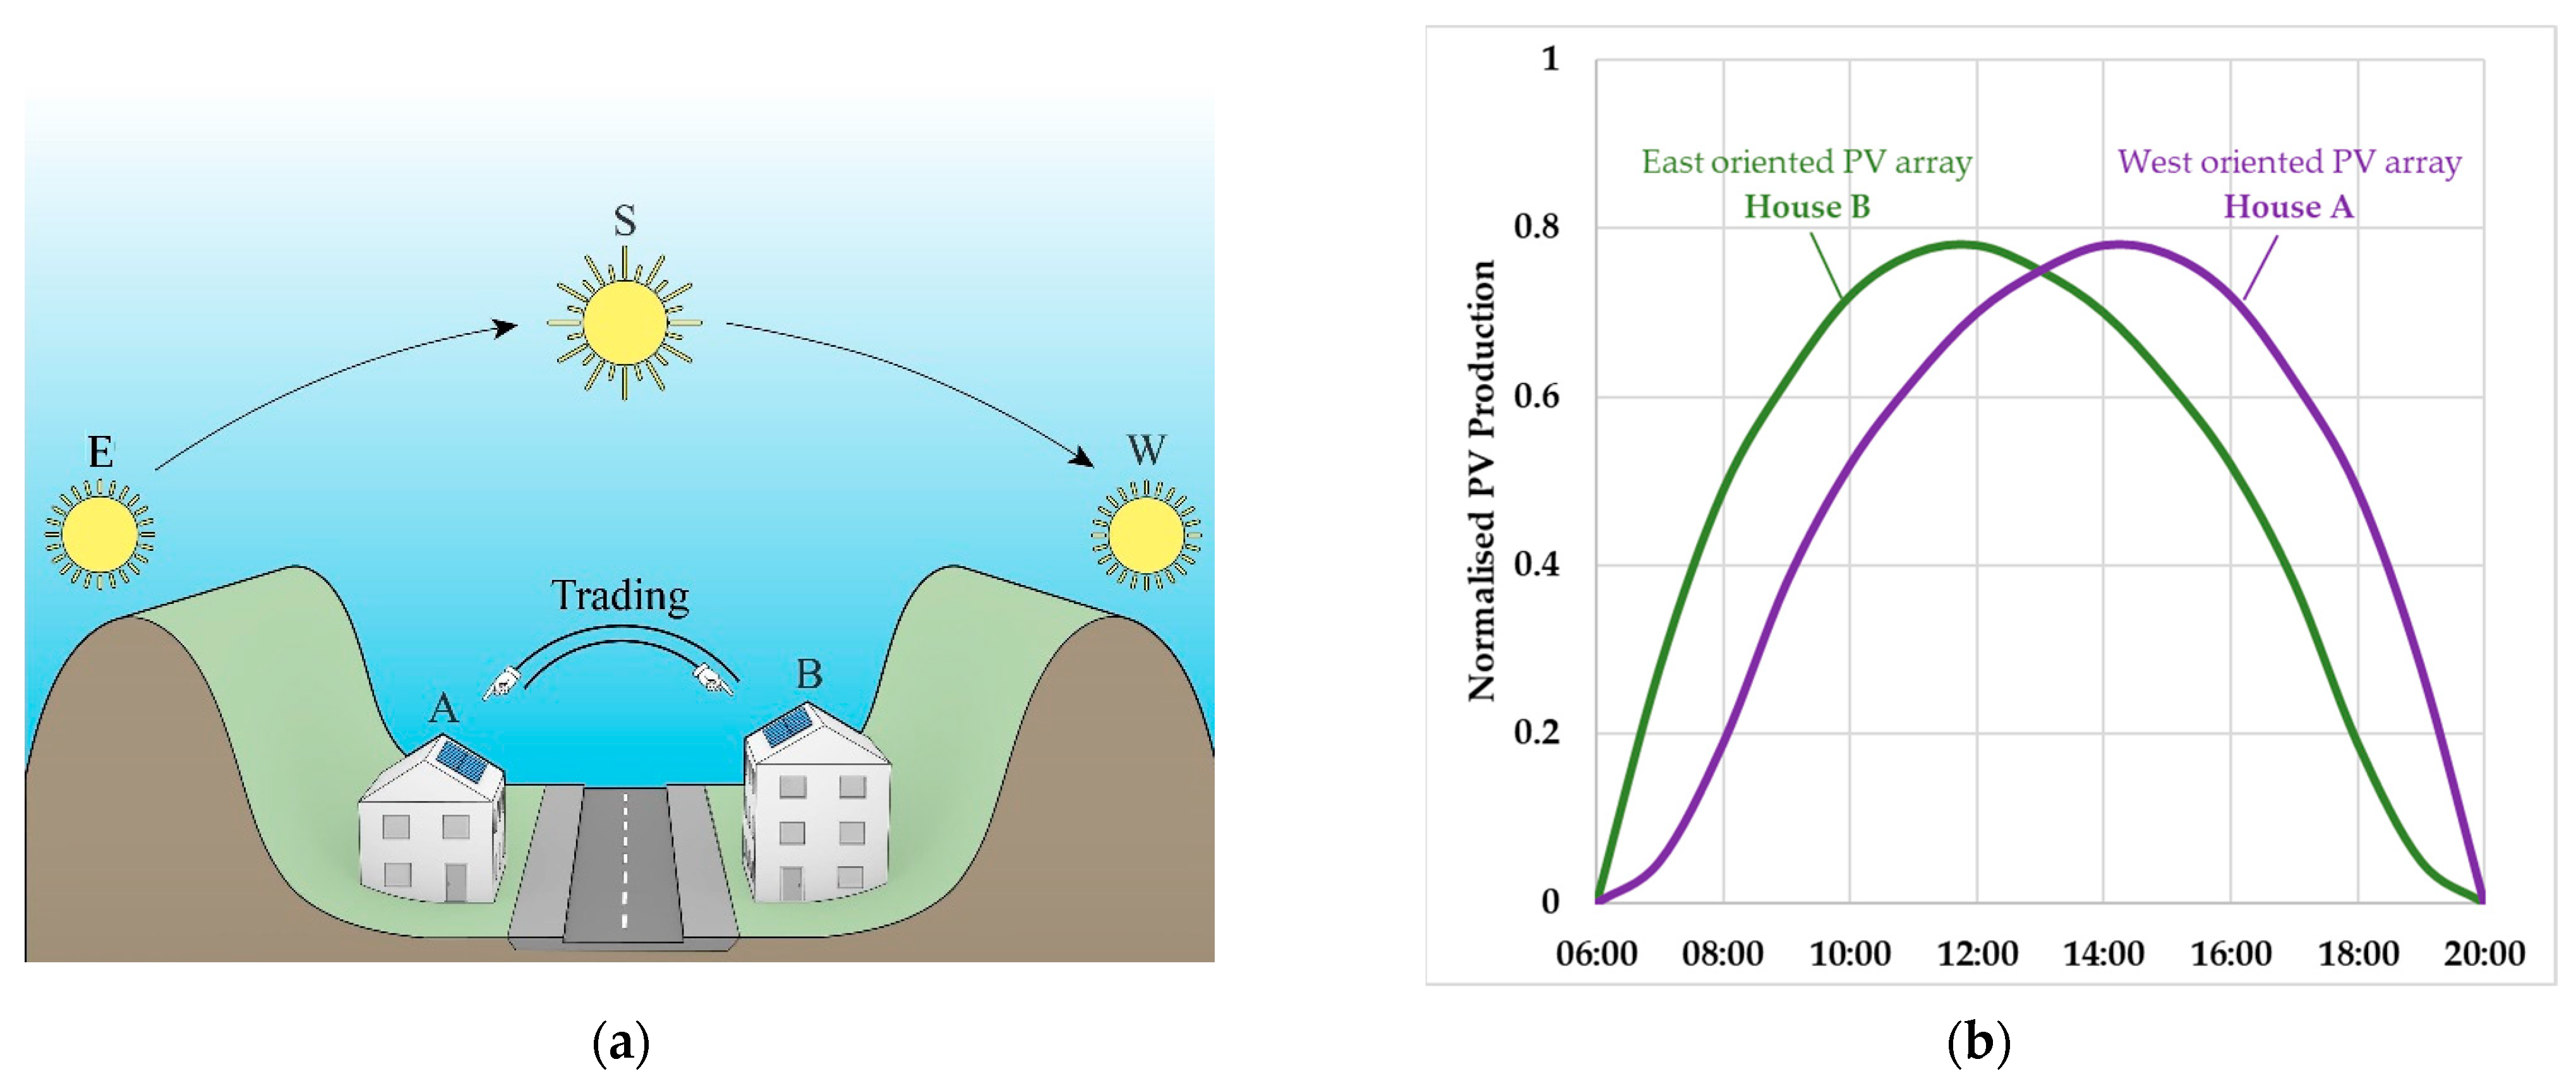
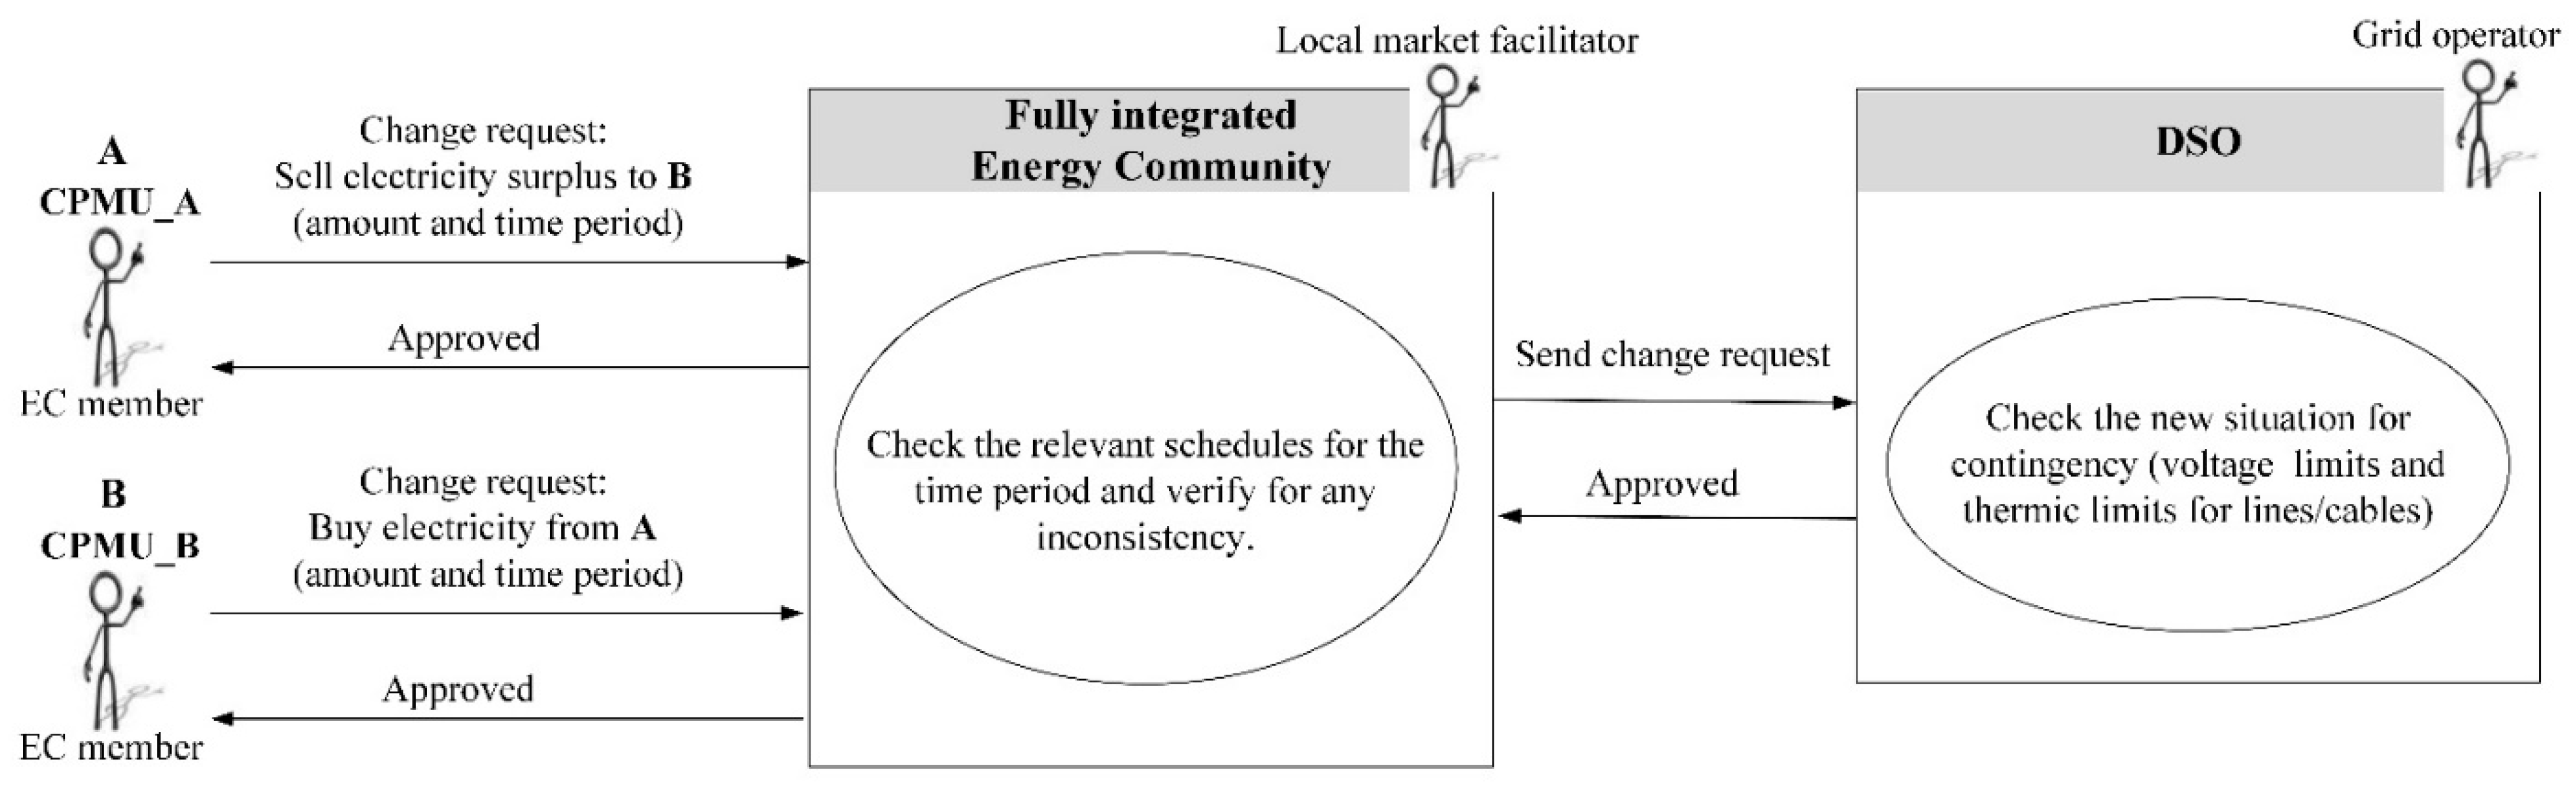
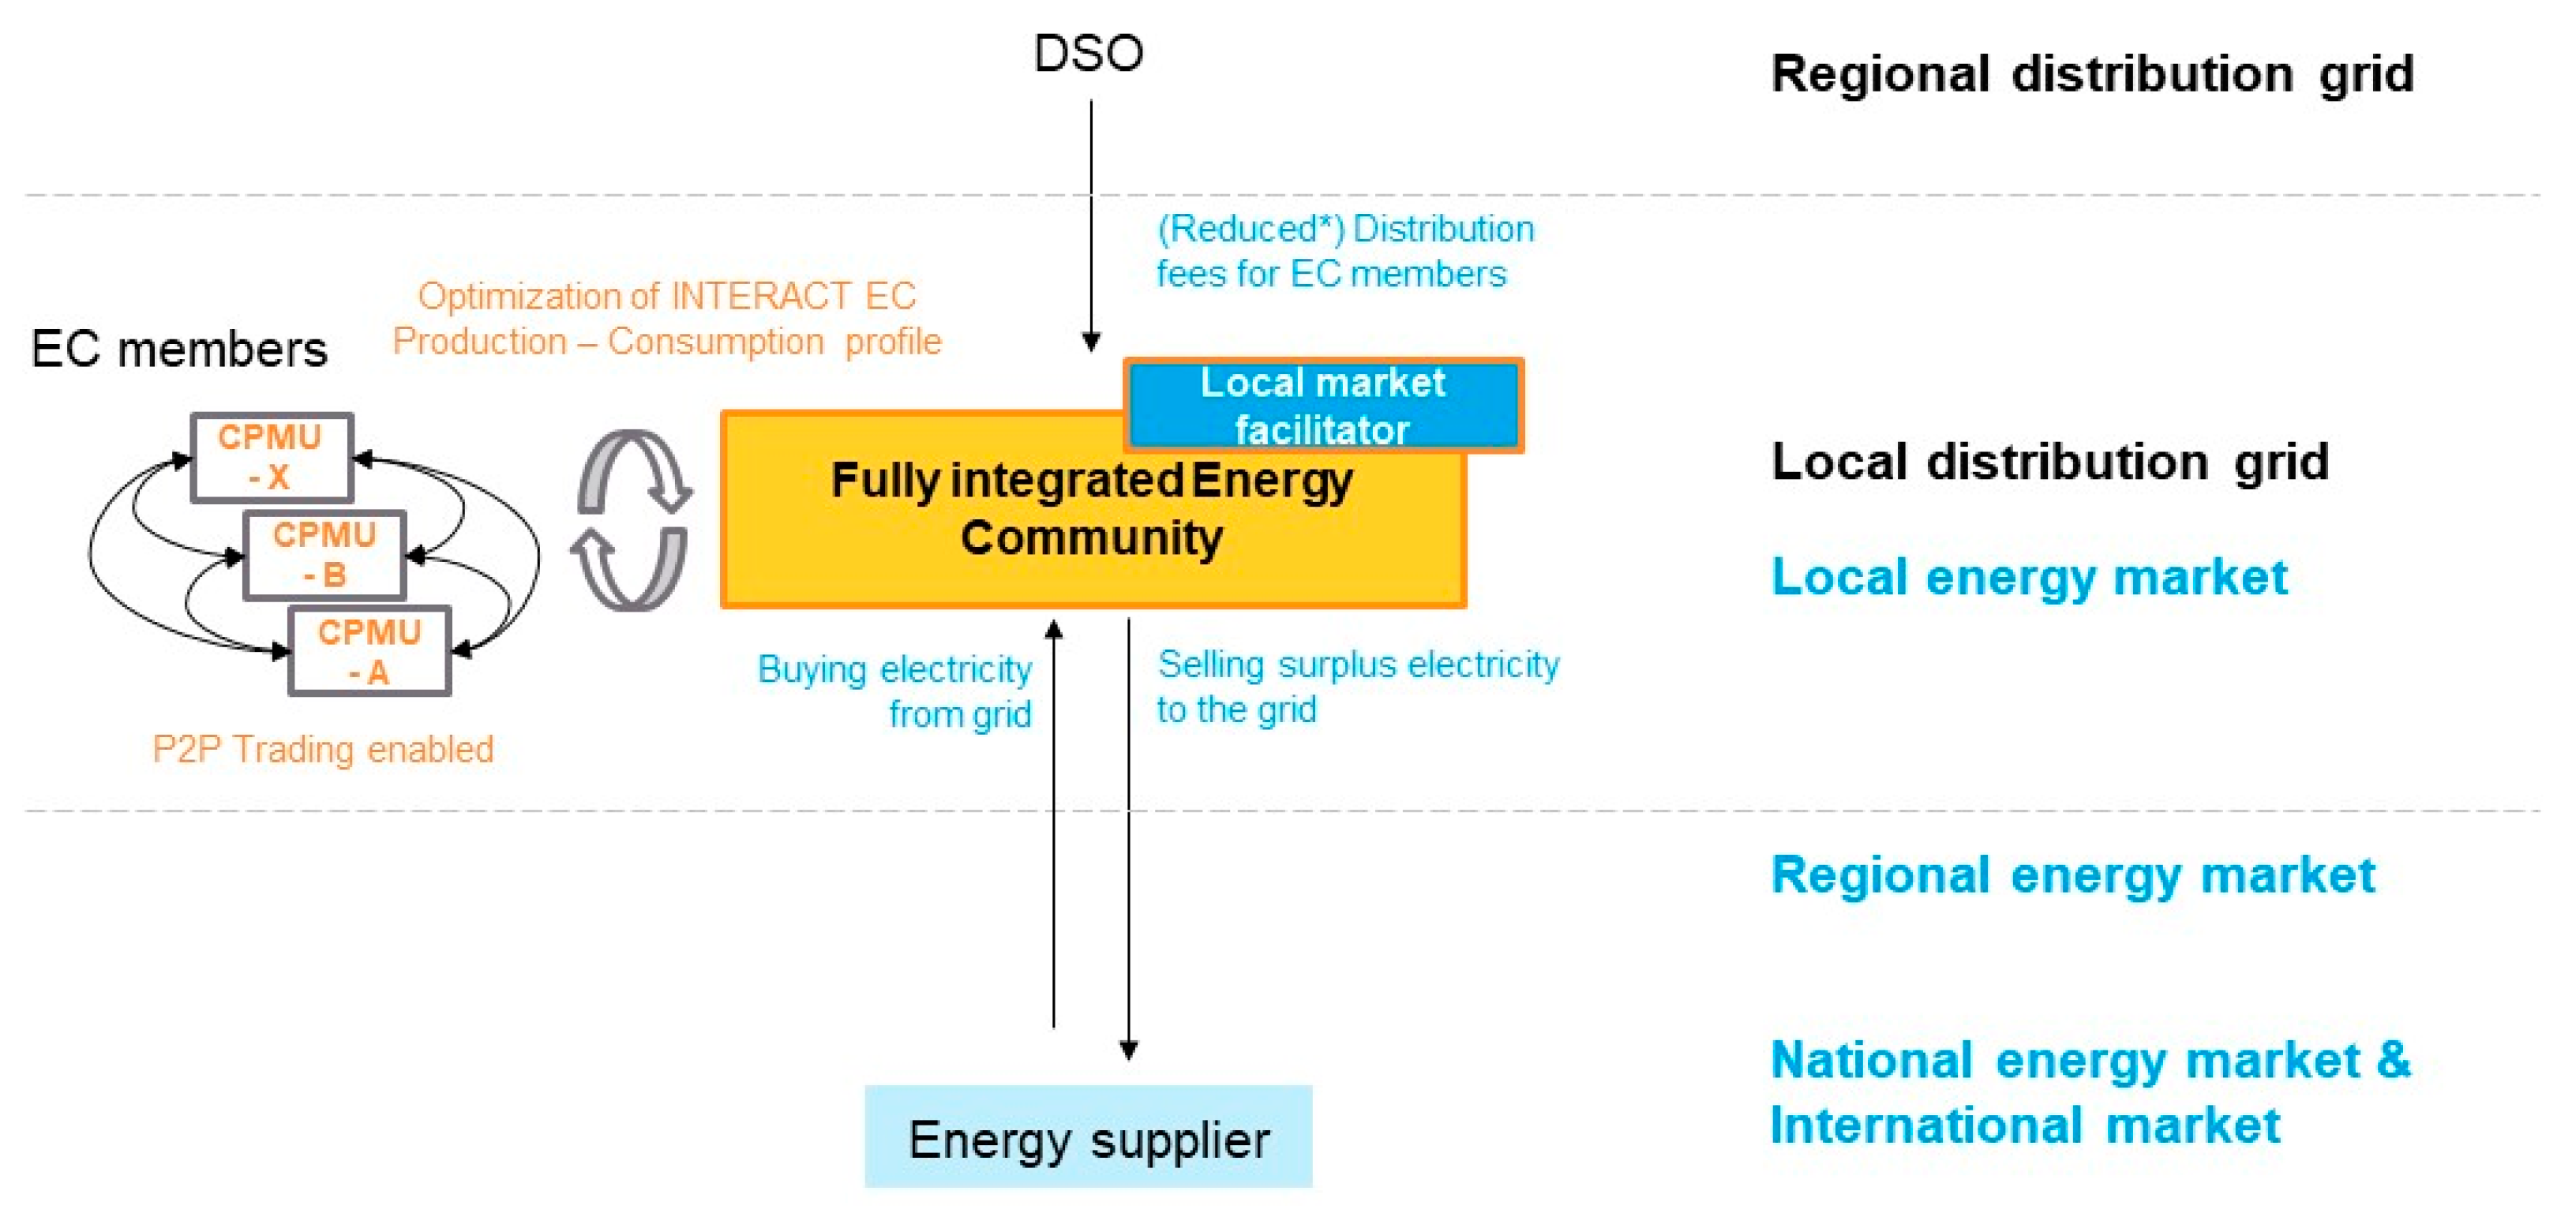
5.4.2. Peer-to-Peer Trading
5.5. Business Cases
5.5.1. Providing Flexibility: Demand Response
- Bilateral agreement between TSO or DSO and EnC; and
- Flexibility market.
5.5.2. Peer-to-Peer Trading
- Full P2P market, where the peers negotiate directly with each other.
- Community-based market, where the EnC manages trading activities in the community.
- Hybrid P2P, which is a combination of 1 and 2.
6. Discussion
Author Contributions
Funding
Data Availability Statement
Conflicts of Interest
Abbreviations
| ATV | Average Trading Volume |
| BGA | Balancing Group Areas |
| BEP | Break Even Price |
| BliN | Boundary Links Node |
| CAM | Control Area Manager |
| CAPEX | Capital Expenditures |
| CP | Customer Plants |
| CPMU | Customer Plant Management Unit |
| CPO | Charging Point Operator |
| CT | Communication Technology |
| CVR | Conservation Voltage Reduction |
| DER | Distributed Energy Resources |
| DR | Demand Response |
| DSO | Distribution System Operators |
| DTR | Distribution Transformer |
| EHV | Extra High Voltage |
| EnC | Energy Communities |
| EPO | Electricity Producer Operator |
| ESCO | Energy Service Companies |
| HVG | High Voltage Grid |
| LCOE | Levelized Cost of Energy |
| LV | Low-Voltage |
| LVG | Low Voltage Grid |
| MV | Medium-Voltage |
| MVG | Medium Voltage Grid |
| NPV | Net Present Value |
| OPEX | Operating Expenditures |
| P2P | Peer-to-Peer |
| PPA | Power Purchase Agreement |
| REnC | Renewable Energy Communities |
| StO | Storage Operator |
| TSO | Transmission System Operators |
Appendix A. REnC Definition
Appendix B. Interview Guideline for Stakeholder Analysis

| Theme | Topics | Type of Questions | |
|---|---|---|---|
| 1 | Interviewee characteristics | Personal and professional background (educational background, years of experience in organization, field of expertise, position in organization, role in represented stakeholder group). | Open-ended |
| 2 | Interviewee energy literacy | Knowledge level, educational or professional experience with energy related topics generally, and technologies specifically, knowledge of EnC. | Open-ended |
| 3 | Interviewee EnC involvement | Involvement in EnC Planning or Vision. | Single choice (Yes; No, Maybe) |
| 4 | EnC Planning, if 3 Yes | Status of EnC. Which stage of planning, what is the Vision for the EnC, who are participating organisations/groups; Planned number of members; Minimal number of participating members needed; Organisational structure; Goals for EnC; Ownership structures; Organizational form; Planned business cases; current agreements; Recent organizational and administrative questions. | A mixture of multiple-choice and open-ended questions |
| 5 | Motives | Interests and motivation to participate in EnC. | Open-ended |
| 6 | Role | Which function and role to assume in EnC. | Multiple choice |
| 7 | Challenges | Challenges in participating, assuming a role, and recent barriers. | Open-ended |
| 8 | Trust | Evaluation of trust and preference of other organisations and stakeholder groups to organize EnC. | Single choice |
| 9 | Other stakeholders roles | Interviewees’ perspective on expectations towards other stakeholders’ roles, their expertise, potential role, motivations, and benefits through EnC, and expectations on those stakeholder groups’ performance in this role in an EnC. | Open-ended, matrix |
| 10 | Conflicting interests | Interviewees’ perspectives on shared, neutral, or opposed interests between stakeholder groups. | Rating (+; 0; −) |
| 11 | Others’ interest and knowledge | Interviewees’ perspective on the level of interest and knowledge of other stakeholder groups. | Rating (high, low, medium) |
Appendix C. Identified Barriers
- Operation costs are unclear, as they depend on various exceptional situations.
- Lack of institutional support: There are fears of burdens from traditional actors, interferences through the excessive complication of the process, high administration fees, and lengthening of the process.
- Lack of resources: High personal and unpaid effort for few people, bureaucratic and technical efforts, external consultation costs, lack of expertise and experience.
- Community indifference: Willingness to participate could be low, lack of members.
- Community hesitation: If the goals of EnC are not reached, a lack of participation is expected.
- Dependence on voluntary work: With operation costs unclear and the EnC rather small from the beginning, the EnC organisation will most likely depend on volunteer work from community members. There is the worry that individual members might become overburdened with work, endangering the sustainability of the EnC if dependent on a few members.
- Dependence on grid acceptance: The EnC organisations depend on external information and collaboration from grid owners, e.g., at which grid level, prosumer and consumer are connected. Wrong assumptions might result in unexpected costs (e.g., due to different grid fee reductions).
- Lack of economic incentives: The monetary value is not foreseeable due to unclear costs for investment and operation. This fact leads to fears of unexpected costs, e.g., high fees for infrastructure providers or additional costs for external consultation. Stakeholders are afraid that there will be zero or very low economic incentives for consumers and prosumers to participate.
- Lack of framing conditions: Information processes, clear role definitions and functions, and framework settings are missing, creating uncertainty.
- Lack of leadership: Various functions are expected to be taken over by a leader, who motivates and engages members and structures the process for others.
- Bad reputation: Fear that personal conflicts and animosities could trigger word of mouth, mal information, and informal gossip could burden the expansion of EC.
- Uncertainty: Further burdens and obstacles are being expected by stakeholders due to the approach’s novelty and the lack of practical experience.
Appendix D. Technical Data
| A [mm2] | IA [A] | R [Ω/km] | X [Ω/km] | C [μF/km] | |
|---|---|---|---|---|---|
| C-AL | 50 | 145 | 0.641 | 0.085 | 0.72 |
| 150 | 275 | 0.206 | 0.080 | 1.040 |

| Load Type | cos (φ) | [kW] |
|---|---|---|
| Residential | 0.95 | 1.10 |
| Commercial | 0.90 | 6.00 |
| Industrial | 0.90 | 37.00 |
| Agriculture | 0.90 | 10.00 |
| Hotel | 0.95 | 3.68 |
| Kindergarten | 0.95 | 3.24 |
- Load dependency from the voltage
| Load Type | CP,P | CI,P | CZ,P | CP,Q | CI,Q | CZ,Q |
|---|---|---|---|---|---|---|
| Residential | 0.96 | −1.17 | 1.21 | 6.28 | −10.16 | 4.88 |
| Commercial | 0.69 | 0.04 | 0.27 | 1.82 | −2.24 | 1.43 |
| Industrial | 1.21 | −1.61 | 1.41 | 4.35 | −7.08 | 3.72 |
| Agriculture | 1.21 | −1.61 | 1.41 | 4.35 | −7.08 | 3.72 |
| Hotel | 0.96 | −1.17 | 1.21 | 6.28 | −10.16 | 4.88 |
| Kindergarten | 0.69 | 0.04 | 0.27 | 1.82 | −2.24 | 1.43 |
- Customer plant modelling


Appendix E. Market-Related Data
| EC Memb. | PV Prod. Year | Inst. Cost [EUR/kW] | Size [kW] | Net Cost [EUR] | Total Ener. Supply [kWh] | Price [Cent/kWh] |
|---|---|---|---|---|---|---|
| 1 | 2010 | 3634.00 | 4.23 | 15,373.37 | 107,102.73 | 18.99 |
| 2 | 2011 | 2952.00 | 8.00 | 23,612.77 | 202,558.36 | 16.21 |
| 3 | 2012 | 2433.00 | 9.90 | 24,089.51 | 250,665.97 | 12.34 |
| 4 | 2013 | 2065.00 | 9.60 | 19,826.63 | 243,070.03 | 10.83 |
| 5 | 2014 | 1868.00 | 5.40 | 10,088.09 | 136,726.89 | 9.79 |
| 6 | 2015 | 1702.00 | 5.39 | 9173.16 | 136,473.69 | 7.45 |
| 7 | 2016 | 1552.00 | 10.30 | 15,985.56 | 260,793.88 | 6.78 |
| 8 | 2017 | 1315.00 | 72.03 | 94,749.77 | 1,823,784.80 | 5.86 |
| 9 | 2018 | 1074.00 | 6.00 | 6443.46 | 151,918.77 | 5.00 |
| 10 | 2019 | 934.00 | 25.00 | 23,362.41 | 632,994.86 | 4.13 |
| 11 | 2020 | 803.00 | 39.90 | 32,045.64 | 1,010,259.80 | 3.62 |
| 12 | 2021 | 725.00 | 47.79 | 34,648.80 | 1,210,032.98 | 3.38 |
| EnC Memb. | Inst. Cost [EUR/kW] | Size [kW] | Net Cost [EUR] | 5% Profit Margin [EUR] | Yearly Production [kWh] | PPA Price [Cent/kWh] |
|---|---|---|---|---|---|---|
| 1 | 3634.00 | 4.23 | 15,373.37 | 768.67 | 4868 | 30.14 |
| 2 | 2952.00 | 8.00 | 23,612.77 | 1180.64 | 9207 | 24.48 |
| 3 | 2433.00 | 9.90 | 24,089.51 | 1204.48 | 11,394 | 20.18 |
| 4 | 2065.00 | 9.60 | 19,826.63 | 991.33 | 11,049 | 17.13 |
| 5 | 1868.00 | 5.40 | 10,088.09 | 504.40 | 6215 | 15.49 |
| 6 | 1702.00 | 5.39 | 9173.16 | 458.66 | 6203 | 14.12 |
| 7 | 1552.00 | 10.30 | 15,985.56 | 799.28 | 11,854 | 12.87 |
| 8 | 1315.00 | 72.03 | 94,749.77 | 4737.49 | 82,899 | 10.91 |
| 9 | 1074.00 | 6.00 | 6443.46 | 322.17 | 6905 | 8.91 |
| 10 | 934.00 | 25.00 | 23,362.41 | 1168.12 | 28,772 | 7.75 |
| 11 | 803.00 | 39.90 | 32,045.64 | 1602.28 | 45,921 | 6.66 |
| 12 | 725.00 | 47.79 | 34,648.80 | 1732.44 | 55,001 | 6.01 |
References
- Hamari, J.; Sjoklint, M.; Ukkonen, A. The sharing economy: Why people participate in collaborative consumption. J. Assoc. Inform. Sci. Technol. 2016, 67, 2047–2059. [Google Scholar] [CrossRef]
- Hall, S.; Roelich, K.E. Local Electricity Supply: Opportunities, Archetypes and Outcomes. Report. Infrastructure Business Models, Valuation and Innovation for Local Delivery. 2015. Available online: https://researchportal.bath.ac.uk/en/publications/local-electricity-supply-opportunities-archetypes-and-outcomes-ib (accessed on 22 November 2021).
- Directive (EU) 2018/2001 of the European Parliament and of the Council, On the Promotion of the Use of Energy from Renewable Sources. 11 December 2018. OJ L. 2018. Available online: http://data.europa.eu/eli/dir/2018/2001/oj/eng (accessed on 15 November 2021).
- Directive (EU) 2019/944 of the European Parliament and of the Council, On Common Rules for the Internal Market for Electricity. 5 June 2019. OJ L. 2019. Available online: http://data.europa.eu/eli/dir/2019/944/oj/eng (accessed on 27 July 2021).
- European Commission, Joint Research Centre. Energy Communities: An Overview of Energy and Social Innovation. 2020. Available online: https://op.europa.eu/en/publication-detail/-/publication/a2df89ea-545a-11ea-aece-01aa75ed71a1/language-en (accessed on 5 November 2021).
- European Committee of the Regions and Milieu Ltd. Models of Local Energy Ownership and the Role of Local Energy Communities in Energy Transition in Europe. 2018. Available online: https://op.europa.eu/en/publication-detail/-/publication/667d5014-c2ce-11e8-9424-01aa75ed71a1/language-en (accessed on 4 November 2021).
- JuraForum. Gesellschaft Mit Beschränkter Haftung/GmbH Gründen–Alles zur Haftung, Geschäftsführer und Auflösung. Available online: https://www.juraforum.de/lexikon/gesellschaft-mit-beschraenkter-haftung (accessed on 13 December 2021).
- Investopedia. What Is AG (Aktiengesellschaft)? Available online: https://www.investopedia.com/terms/a/ag-aktiengesellschaft.asp (accessed on 13 December 2021).
- Dictionary.com. Definition of Association. Available online: https://www.dictionary.com/browse/association (accessed on 13 December 2021).
- Flor, A.; Rick, B.; Niki, F.; Sanne, A.; Philip, B.; Jesse, H.; Geerte, P.; Bonno, P.; Daniel, S.; Julia, W. The (Self-)Governance of Community Energy: Challenges & Prospects; Drift Practice Brief, Dutch Research Institute for Transitions: Rotterdam, The Netherlands, 2014; pp. 1–34. Available online: https://www.researchgate.net/publication/265694629_The_Self-Governance_of_Community_Energy_Challenges_Prospects (accessed on 21 November 2022).
- Mendes, G.; Nylund, J.; Annala, S.; Honkapuro, S.; Kilkki, O.; Segerstam, J. Local energy markets: Opportunities, benefits, and barriers. In Proceedings of the CIRED Workshop Ljubljana, Ljubljana, Slovenien, 7–8 June 2018; pp. 1–5. Available online: http://www.cired.net/publications/workshop2018/pdfs/Submission%200272%20-%20Paper%20(ID-21042).pdf (accessed on 16 November 2022).
- Annala, S.; Honkapuro, S.; Repo, S.; Kilkki, O.; Terras, J.M.; Neto, A. Intesraction between local and open energy markets—Guidelines for local market design. In Proceedings of the CIRED Workshop 2020, Online Conference, 2–23 September 2020; pp. 151–153. Available online: https://ieeexplore.ieee.org/document/9583088 (accessed on 10 April 2022).
- Ding, Y.; Hansen, L.H.; Cajar, P.D.; Brath, P.; Bindner, H.W.; Zhang, C.; Nordentoft, N.C. Development of a Dso-Market on Flexibility Services. 2013, pp. 1–78. Available online: https://backend.orbit.dtu.dk/ws/files/176493622/WP_3_8_report.pdf (accessed on 22 November 2022).
- Zhang, C.; Wu, J.; Cheng, M.; Zhou, Y.; Long, C. A Bidding System for Peer-to-Peer Energy Trading in a Grid-connected Microgrid. Energy Procedia 2016, 103, 147–152. [Google Scholar] [CrossRef]
- Zhang, C.; Wu, J.; Zhou, Y.; Cheng, M.; Long, C. Peer-to-Peer energy trading in a Microgrid. Appl. Energy 2018, 220, 1–12. Available online: https://www.sciencedirect.com/science/article/pii/S0306261918303398 (accessed on 22 November 2020). [CrossRef]
- Martins, J.F.; Neves, I.; Mar, A.; Pereira, P.; Pires, V.; Lopes, R.A. Fault Resilience in Energy Community Microgrids. In Proceedings of the 3rd International Conference on Smart Grid and Renewable Energy (SGRE), Doha, Qatar, 20–22 March 2022; pp. 1–6. Available online: https://ieeexplore.ieee.org/abstract/document/9774093 (accessed on 7 June 2021).
- Hong, Y.; Goel, S.; Lu, H.; Wang, S. Discovering energy communities for microgrids on the power grid. In Proceedings of the IEEE International Conference on Smart Grid Communications, Dresden, Germany, 23–27 October 2017; pp. 64–70. Available online: https://ieeexplore.ieee.org/abstract/document/8340661 (accessed on 3 March 2021).
- Myrda, P. Smart Grid Enabled Asset Management. EPRI Technical Results, 2009, Product ID 1017828. pp. 1–40. Available online: https://www.epri.com/search#q=Smart%20Grid%20Enabled%20Asset%20Management&t=research&sort=relevancy&numberOfResults=25 (accessed on 3 October 2019).
- Ilo, A. Design of the Smart Grid Architecture According to Fractal Principles and the Basics of Corresponding Market Structure. Energies 2019, 12, 4153–4177. [Google Scholar] [CrossRef] [Green Version]
- IEEE Task Force on Microgrid Control, Trends in Microgrid Control. IEEE Trans. Smart Grid 2014, 5, 1905–1919. Available online: https://ieeexplore.ieee.org/document/6818494 (accessed on 15 January 2019). [CrossRef]
- Papathanassiou, S.; Hatziargyriou, N.; Strunz, K. A Benchmark Low Voltage Microgrid Network. CIGRE Symposium. 2005. Available online: https://www.researchgate.net/publication/237305036_A_Benchmark_Low_Voltage_Microgrid_Network (accessed on 30 November 2022).
- Yuen, C.; Oudalov, A.; Timbus, A. The provision of frequency control reserves from multiple microgrids. IEEE Trans. Ind. Electron. 2011, 58, 173–183. [Google Scholar] [CrossRef]
- Soshinskaya, M.; Crijns-Graus, W.H.; Guerrero, J.M.; Vasquez, J.C. Microgrids: Experiences, barriers and success factors. Renew. Sustain. Energy Rev. 2014, 40, 659–672. [Google Scholar] [CrossRef] [Green Version]
- Long, C.; Wu, J.; Zhang, C.; Cheng, M.; Al-Wakeel, A. Feasibility of Peer-to-Peer Energy Trading in Low Voltage Electrical Distribution Networks. Energy Procedia 2017, 105, 2227–2232. Available online: https://www.sciencedirect.com/science/article/pii/S1876610217306860 (accessed on 22 November 2021). [CrossRef]
- Baran, M.; El-Markabi, I. A multiagent-based dispatching scheme for distributed generators for voltage support on distribution feeders. IEEE Trans. Power Syst. 2007, 22, 52–59. [Google Scholar] [CrossRef]
- Dimeas, A.L.; Hatziargyriou, N.D. Operation of a Multiagent System for Microgrid Control. IEEE Trans. Power Syst. 2005, 20, 1447–1455. Available online: https://ieeexplore.ieee.org/document/1490598 (accessed on 5 August 2019). [CrossRef]
- Greunsven, J.A.; Veldman, E.; Nguyen, P.H.; Slootweg, J.G.; Kamphuis, I.G. Capacity Management within a Multiagent Market-Based Active Distribution Network. In Proceedings of the 3rd IEEE PES Innovative Smart Grid Technologies Europe, Berlin Germany, 14–17 October 2012; pp. 1–8. Available online: https://ieeexplore.ieee.org/document/6465678 (accessed on 9 June 2020).
- Hollinger, R.; Erge, T. Integrative Energy Market as System Integrator of Decentralized Generators. In Proceedings of the 9th International Conference on European Energy Market, Florence, Italy, 10–12 May 2012; pp. 1–6. Available online: https://ieeexplore.ieee.org/document/6254718 (accessed on 9 March 2022).
- Cox, W.; Considine, T. Structured energy: Microgrids and autonomous transactive operation. In Proceedings of the 2013 IEEE PES Innovative Smart Grid Technologies Conference (ISGT), Washington, DC, USA, 24–27 February 2013; pp. 1–6. Available online: https://ieeexplore.ieee.org/document/6497919 (accessed on 13 October 2020).
- Ampatzis, M.; Nguyen, P.H.; Kling, W. Local electricity market design for the coordination of distributed energy resources at district level. In Proceedings of the IEEE PES Innovative Smart Grid Technologies, Europe, Istanbul, Turkey, 12–15 October 2014; pp. 1–6. Available online: https://ieeexplore.ieee.org/document/7028888 (accessed on 16 October 2021).
- Teotia, F.; Bhakar, R. Local energy markets: Concept, design and operation. In Proceedings of the National Power Systems Conference, Bhubaneswar, India, 19–21 December 2016; Available online: https://ieeexplore.ieee.org/document/7858975 (accessed on 5 August 2019).
- Rocha, R.; Collado, J.V.; Soares, T.; Retorta, F. Local Energy Markets for Energy Communities with Grid Constraints. In Proceedings of the 17th International Conference on the European Energy Market, Stockholm, Sweden, 16–18 September 2020; pp. 1–6. Available online: https://ieeexplore.ieee.org/document/9221878 (accessed on 5 August 2019).
- Shen, B.; Ghatikar, G.; Lei, Z.; Li, J.; Wikler, G.; Martin, P. The role of regulatory reforms, market changes, and technology development to make demand response a viable resource in meeting energy challenges. Appl. Energy 2014, 130, 814–823. [Google Scholar] [CrossRef]
- Mengelkamp, E.; Staudt, P.; Garttner, J.; Weinhardt, C. Trading on local energy markets: A comparison of market designs and bidding strategies. In Proceedings of the 14th International Conference on the European Energy Market, Dresden, Germany, 6–9 June 2017; pp. 1–6. Available online: https://ieeexplore.ieee.org/document/7981938 (accessed on 9 June 2021).
- Schleicher-Tappeser, R. How renewables will change electricity markets in the next five years. Energy Policy 2012, 48, 64–75. [Google Scholar] [CrossRef]
- ETIP SNET. Holistic Architectures for Future Power Systems. White Paper 2019. Available online: https://smart-networks-energy-transition.ec.europa.eu/news/holistic-architectures-future-power-systems (accessed on 16 November 2022).
- Ilo, A.; Prata, R.; Iliceto, A.; Strbac, G. Embedding of Energy Communities in the Unified LINK-Based Holistic Architecture. In Proceedings of the CIRED 2019, Madrid, Spain, 3–6 June 2019; pp. 1–5. Available online: https://www.cired-repository.org/handle/20.500.12455/652 (accessed on 20 June 2022).
- Huijts, N.M.; Molin, E.J.; Steg, L. Psychological factors influencing sustainable energy technology acceptance: A review-based comprehensive framework. Renew. Sustain. Energy Rev. 2012, 16, 525–531. [Google Scholar] [CrossRef]
- European Commission; Directorate-General for Energy; Tounquet, F.; Devos, L.; Abada, I.; Kielichowska, I.; Klessmann, C. Asset Study on Energy Communities in the European Union; Publications Office of the European Union: Luxembourg, 2020; pp. 1–69. [Google Scholar] [CrossRef]
- Ilo, A.; Schultis, D.L.; Schirmer, C. Effectiveness of Distributed vs. Concentrated Volt/var Local Control Strategies in Low-Voltage Grids. Appl. Sci. 2018, 8, 1382. Available online: https://www.mdpi.com/2076-3417/8/8/1382 (accessed on 1 July 2019). [CrossRef] [Green Version]
- Ademollo, A.; Ilo, A.; Carcasci, C. End-use sector coupling to turn customer plants into prosumers of electricity and gas. CIRED 2023. accepted. [Google Scholar]
- European Commission; Directorate-General for Energy; Bernstrauch, O.; Herce, C.; Nowak, T.; Jansohn, P.; Pastor, R.; Rutz, D.; Iliceto, A.; Ionel, I.; et al. Coupling of Heating/Cooling and Electricity Sectors in a Renewable Energy-Driven Europe; Wiedermann, A., Calderoni, M., Eds.; Publications Office of the European Union: Luxembourg, Luxembourg, 2022; pp. 1–50. Available online: https://op.europa.eu/en/publication-detail/-/publication/919a8405-6ed7-11ed-9887-01aa75ed71a1/language-en (accessed on 3 October 2022).
- Ilo, A.; Schultis, D.L. A Holistic Solution for Smart Grids based on LINK–Paradigm; Springer: Cham, Switzerland, 2022; p. 340. ISBN 978-3-030-81529-5. [Google Scholar]
- Ilo, A.; Bruckner, H.; Olofsgard, M.; Adamcova, M. Deploying e-mobility in the interact energy community to promote additional and valuable flexibility resources for secure and efficient grid operation. In Proceedings of the CIRED Workshop on E-Mobility and Power Distribution Systems, Porto, Portugal, 2–3 June 2022; pp. 162–164. Available online: https://ieeexplore.ieee.org/document/9841848 (accessed on 3 October 2022).
- Vytelingum, P.; Cliff, D.; Jennings, N. Strategicbidding in continuous double auctions. Artif. Intell. 2008, 172, 1700–1729. Available online: https://www.sciencedirect.com/science/article/pii/S0004370208000787 (accessed on 1 July 2019). [CrossRef] [Green Version]
- Corporate Finance Institute Team. Types of Assets, Structure and Definitions. 2022. Available online: https://corporatefinanceinstitute.com/resources/knowledge/accounting/types-of-assets/ (accessed on 1 December 2022).
- Energiegemeinschaften. E-Control. Vienna, Austria. 2022. Available online: https://www.e-control.at/energiegemeinschaften (accessed on 12 November 2022).
- Ministère de la Transition Écologique. Décrets, Arrêtés, Circulaires; Ministère de la Transition Écologique: Paris, France, 2020. [Google Scholar]
- INTERACT, D 4.2, Use Cases for the Integration of the Existing Innovative Technologies with the LINK-Solution. Available online: https://www.ped-interact.eu/wp-content/uploads/2022/07/D-4.2-Use-Cases-for-the-integration-of-the-existing-innovative-technologies-with-the-LINK-solution_vFinal.pdf (accessed on 15 July 2022).
- Ilo, A.; Schaffer, W.; Rieder, T.; Dzafic, I. Dynamic Optimization of Distribution Network—Closed loop operation results. In Proceedings of the VDE Kongress, Stuttgart, Germany, 5–6 November 2012; pp. 1–6. Available online: https://www.vde-verlag.de/proceedings-de/453446029.html (accessed on 3 October 2020).
- Yurtseven, K.; Karatepe, E.; Deniz, E. Sensorless fault detection method for photovoltaic systems through mapping the inherent characteristics of PV plant site: Simple and practical. Sol. Energy 2021, 216, 96–110. Available online: https://www.sciencedirect.com/science/article/abs/pii/S0038092X21000207 (accessed on 3 February 2023). [CrossRef]
- Sousa, T.; Soares, T.; Pinson, P.; Moret, F.; Baroche, T.; Sorin, E. Peer-to-peer and community-based markets: A comprehensive review. Renew. Sustain. Energy Rev. 2019, 104, 367–378. [Google Scholar] [CrossRef] [Green Version]
- Bokhari, A.; Alkan, A.; Dogan, R.; Diaz-Aguiló, M.; De Leon, F.; Czarkowski, D.; Zabar, Z.; Birenbaum, L.; Noel, A.; Uosef, R.E. Experimental Determination of the ZIP Coefficients for Modern Residential, Commercial, and Industrial Loads. IEEE Trans. Power Deliv. 2014, 29, 1372–1381. [Google Scholar] [CrossRef]


| Pros. BEP [EUR/kWh] | Prosumers’ Revenue [EUR/kWh] | Consumers’ Expense [EUR/kWh] | |
|---|---|---|---|
| EnC in Total | 10.56 | 8.80 | 91.00 |
| Pros. BEP [EUR/kWh] | Prosumers’ Revenue [EUR/kWh] | EnC’ Purchasing [EUR/kWh] | Consumers’ Expense [EUR/kWh] | |
|---|---|---|---|---|
| EnC in Total | 10.56 | 31.51 | 14.00 | 45.51 |
| Cost structure | Investment |
|
| Operation |
| |
| Revenue streams | Operation |
|
Disclaimer/Publisher’s Note: The statements, opinions and data contained in all publications are solely those of the individual author(s) and contributor(s) and not of MDPI and/or the editor(s). MDPI and/or the editor(s) disclaim responsibility for any injury to people or property resulting from any ideas, methods, instructions or products referred to in the content. |
© 2023 by the authors. Licensee MDPI, Basel, Switzerland. This article is an open access article distributed under the terms and conditions of the Creative Commons Attribution (CC BY) license (https://creativecommons.org/licenses/by/4.0/).
Share and Cite
Ilo, A.; Bruckner, H.; Olofsgard, M.; Adamcova, M.; Werner, A. Viable Fully Integrated Energy Community Based on the Holistic LINK Approach. Energies 2023, 16, 2935. https://doi.org/10.3390/en16062935
Ilo A, Bruckner H, Olofsgard M, Adamcova M, Werner A. Viable Fully Integrated Energy Community Based on the Holistic LINK Approach. Energies. 2023; 16(6):2935. https://doi.org/10.3390/en16062935
Chicago/Turabian StyleIlo, Albana, Helmut Bruckner, Markus Olofsgard, Marketa Adamcova, and Andrea Werner. 2023. "Viable Fully Integrated Energy Community Based on the Holistic LINK Approach" Energies 16, no. 6: 2935. https://doi.org/10.3390/en16062935